restoring lipid metabolism in lupus CD4 T cells...such as systemic lupus erythematosus (SLE), by...
15
Defective BTLA functionality is rescued by restoring lipid metabolism in lupus CD4 + T cells Matthieu Sawaf, … , Hélène Dumortier, Fanny Monneaux JCI Insight. 2018; 3(13):e99711. https://doi.org/10.1172/jci.insight.99711. Coinhibitory receptors play an important role in the prevention of autoimmune diseases, such as systemic lupus erythematosus (SLE), by limiting T cell activation. B and T lymphocyte attenuator (BTLA) is an inhibitory receptor, similar to cytotoxic T lymphocyte– associated protein 4 (CTLA-4) and programmed death 1 (PD1), that negatively regulates the immune response. The role of BTLA in the pathogenesis of autoimmune diseases in humans and, more specifically, in SLE is largely unknown. We investigated BTLA expression on various T cell subsets, and we did not observe significant variations of BTLA expression between lupus patients and healthy controls. However, the enhancement of BTLA expression after activation was significantly lower in SLE patients compared with that in healthy controls. Furthermore, we found an impaired capacity of BTLA to inhibit T cell activation in SLE due to a poor BTLA recruitment to the immunological synapse following T cell stimulation. Finally, we demonstrated that defective BTLA function can be corrected by restoring intracellular trafficking and by normalizing the lipid metabolism in lupus CD4 + T cells. Collectively, our results evidence that the BTLA signaling pathway is altered in SLE T cells and highlight the potential of targeting this pathway for the development of new therapeutic strategies in lupus. Research Article Immunology Find the latest version: http://jci.me/99711/pdf
Transcript of restoring lipid metabolism in lupus CD4 T cells...such as systemic lupus erythematosus (SLE), by...
Defective BTLA functionality is rescued byrestoring lipid metabolism in lupus CD4+ T cells
Matthieu Sawaf, … , Hélène Dumortier, Fanny Monneaux
JCI Insight. 2018;3(13):e99711. https://doi.org/10.1172/jci.insight.99711.
Coinhibitory receptors play an important role in the prevention of autoimmune diseases,such as systemic lupus erythematosus (SLE), by limiting T cell activation. B and Tlymphocyte attenuator (BTLA) is an inhibitory receptor, similar to cytotoxic T lymphocyte–associated protein 4 (CTLA-4) and programmed death 1 (PD1), that negatively regulates theimmune response. The role of BTLA in the pathogenesis of autoimmune diseases inhumans and, more specifically, in SLE is largely unknown. We investigated BTLAexpression on various T cell subsets, and we did not observe significant variations of BTLAexpression between lupus patients and healthy controls. However, the enhancement ofBTLA expression after activation was significantly lower in SLE patients compared with thatin healthy controls. Furthermore, we found an impaired capacity of BTLA to inhibit T cellactivation in SLE due to a poor BTLA recruitment to the immunological synapse following Tcell stimulation. Finally, we demonstrated that defective BTLA function can be corrected byrestoring intracellular trafficking and by normalizing the lipid metabolism in lupus CD4+ Tcells. Collectively, our results evidence that the BTLA signaling pathway is altered in SLE Tcells and highlight the potential of targeting this pathway for the development of newtherapeutic strategies in lupus.
Research Article Immunology
Find the latest version:
http://jci.me/99711/pdf
1insight.jci.org https://doi.org/10.1172/jci.insight.99711
R E S E A R C H A R T I C L E
Conflict of interest: The authors have declared that no conflict of interest exists.
Submitted: January 9, 2018 Accepted: May 29, 2018 Published: July 12, 2018
Reference information: JCI Insight. 2018;3(13):e99711. https://doi.org/10.1172/jci.insight.99711.
Defective BTLA functionality is rescued by restoring lipid metabolism in lupus CD4+ T cellsMatthieu Sawaf,1 Jean-Daniel Fauny,1 Renaud Felten,1,2 Flora Sagez,1,2 Jacques-Eric Gottenberg,1,2 Hélène Dumortier,1 and Fanny Monneaux1
1CNRS, Institut de Biologie Moléculaire et Cellulaire, Immunologie, Immunopathologie et Chimie Thérapeutique,
Strasbourg, France. 2Rheumatology Department, Strasbourg University Hospital, National Reference Center for
Autoimmune Diseases, Hôpitaux Universitaires de Strasbourg, Strasbourg, France.
IntroductionSystemic lupus erythematosus (SLE) is a severe systemic autoimmune disease characterized by the produc-tion of high-affinity autoantibodies (autoAbs) directed against self-structures (especially nuclear antigens). The deposition of subsequent immune complexes in target organs leads to tissue inflammation, contributing to the development of multiorgan damage, such as glomerulonephritis, which remains the most common severe manifestation in lupus (1). In that context, it was demonstrated in our laboratory, that pathogenic autoAb can be locally produced by plasma cells, which have homed to inflamed kidneys of lupus mice (2, 3). Moreover, we recently described an altered phenotype of circulating follicular helper T (Tfh) cells character-ized by the enhanced frequency of B cell helpers, CXCR3–CCR6– Tfh2-like cells, and decreased frequency of CXCR3+CCR6– Tfh1-like cells (which are unable to provide B cell help) in lupus patients (4). Altogether, these findings suggest that a dysfunction in plasma cell differentiation mechanism may occur in SLE, leading to an increase of autoAb production. B cell differentiation into Ab-producing cells is mediated by CD4+ helper T cells, highlighting the importance of the T-B crosstalk in secondary lymphoid organs. Several mechanisms are involved in the regulation of this crosstalk, one of these being the balance between costimulatory and coinhibitory molecules expressed on the T and B cell surface (5). There are growing numbers of inhibitory receptors described, including cytotoxic T lymphocyte–associated protein 4 (CTLA-4) and programmed cell death 1 (PD-1), that have been most extensively studied. In the oncology field, encouraging clinical findings have been reported for mAbs specific to CTLA-4 and PD-1, and promising results were obtained with the use of abatacept, a CTLA4-Ig fusion protein, in various autoimmune diseases (6, 7).
B and T lymphocyte attenuator (BTLA) is another inhibitory receptor of the Ig superfamily that neg-atively regulates the immune response in synergy with the CTLA-4/B7 and PD-1/PDL1 inhibitory path-ways (8). BTLA is expressed on T cells (both CD4+ and CD8+ T cells) and B cells but also a wide range
Coinhibitory receptors play an important role in the prevention of autoimmune diseases, such as systemic lupus erythematosus (SLE), by limiting T cell activation. B and T lymphocyte attenuator (BTLA) is an inhibitory receptor, similar to cytotoxic T lymphocyte–associated protein 4 (CTLA-4) and programmed death 1 (PD1), that negatively regulates the immune response. The role of BTLA in the pathogenesis of autoimmune diseases in humans and, more specifically, in SLE is largely unknown. We investigated BTLA expression on various T cell subsets, and we did not observe significant variations of BTLA expression between lupus patients and healthy controls. However, the enhancement of BTLA expression after activation was significantly lower in SLE patients compared with that in healthy controls. Furthermore, we found an impaired capacity of BTLA to inhibit T cell activation in SLE due to a poor BTLA recruitment to the immunological synapse following T cell stimulation. Finally, we demonstrated that defective BTLA function can be corrected by restoring intracellular trafficking and by normalizing the lipid metabolism in lupus CD4+ T cells. Collectively, our results evidence that the BTLA signaling pathway is altered in SLE T cells and highlight the potential of targeting this pathway for the development of new therapeutic strategies in lupus.
2insight.jci.org https://doi.org/10.1172/jci.insight.99711
R E S E A R C H A R T I C L E
of other hematopoietic cells, including NK cells, NKT cells, macrophages, and DCs (9). The ligand for BTLA is herpesvirus-entry mediator (HVEM; TNFR14) (10), a TNF receptor family protein found on DC, T, B and NK cells. The ligation of BTLA by HVEM attenuates T cell activation, leading to decreased cell proliferation, cytokine production, and cell cycle progression. Consistent with an inhibitory role for BTLA, BTLA-deficient mice exhibit enhanced specific antibody responses and sensitivity to the induction of experimental autoimmune encephalomyelitis (8). BTLA deficiency also causes the breakdown of self-toler-ance, resulting in the development of an autoimmune hepatitis-like disease and lymphocytic infiltration in multiple organs (11). Interestingly, BTLA is expressed by Tfh cells, and it was recently demonstrated that BTLA suppresses germinal center B cell development and subsequent IgG responses by inhibiting IL-21 production by Tfh cells (12). Moreover, the lupus disease is exacerbated in MRL/lpr lupus mice deficient for BTLA (13), suggesting a protective role of BTLA in lupus.
Data regarding BTLA function on human cells are more limited. BTLA signaling inhibits both prolifer-ation and cytokine secretion of CD4+ T cells (14, 15), and HVEM interaction with BTLA negatively regu-lates the proliferation of γδ T cells (16). Regarding B cells, BTLA reduces the phosphorylation of the B cell receptor–associated (BCR-associated) molecules, leading to BCR signaling inhibition (17). Furthermore, BTLA is upregulated and recruited to the BCR in CpG-activated B cells, and, as in T cells, its triggering by HVEM leads to the inhibition of human B cell proliferation and upregulation of costimulatory molecules and cytokine production (18). As a newly described immune checkpoint, BTLA was also investigated in pathological situations. It has been demonstrated that type I IFN produced by plasmacytoid DCs is respon-sible for BTLA downregulation on CD4+ T cells during chronic HIV-1 infection, which further results in impaired BTLA-mediated inhibition (19). On the contrary, BTLA expression is enhanced on CMV-specific T cells during the acute phase of CMV infection (15). In cancer, several studies have highlighted an upreg-ulation of BTLA in tumors. Indeed, BTLA is highly expressed on B cells from chronic lymphocytic leuke-mia (CLL) (20); however, the function of BTLA on CLL cells remains to be elucidated. Moreover, whereas BTLA expression is normally downregulated during human CD8+ T cell differentiation to effector cytotox-ic T cells, melanoma tumor antigen-specific effector CD8+ T cells appear to persistently express BTLA (21) and are thus still susceptible to inhibition though HVEM ligation. Finally, BTLA gene polymorphisms may be linked to the development of malignant breast cancer (22).
The role of BTLA in the pathogenesis of autoimmune diseases in humans is still largely unknown and, to date, there is no available data on BTLA in lupus patients. This observation, associated with the few data regarding BTLA in lupus mice, led us to investigate in detail BTLA expression and function on CD4+ T cells isolated from SLE patients. Indeed, altered BTLA expression and/or functionality could result in defective regulation of the immune response, leading to the emergence of autoimmunity.
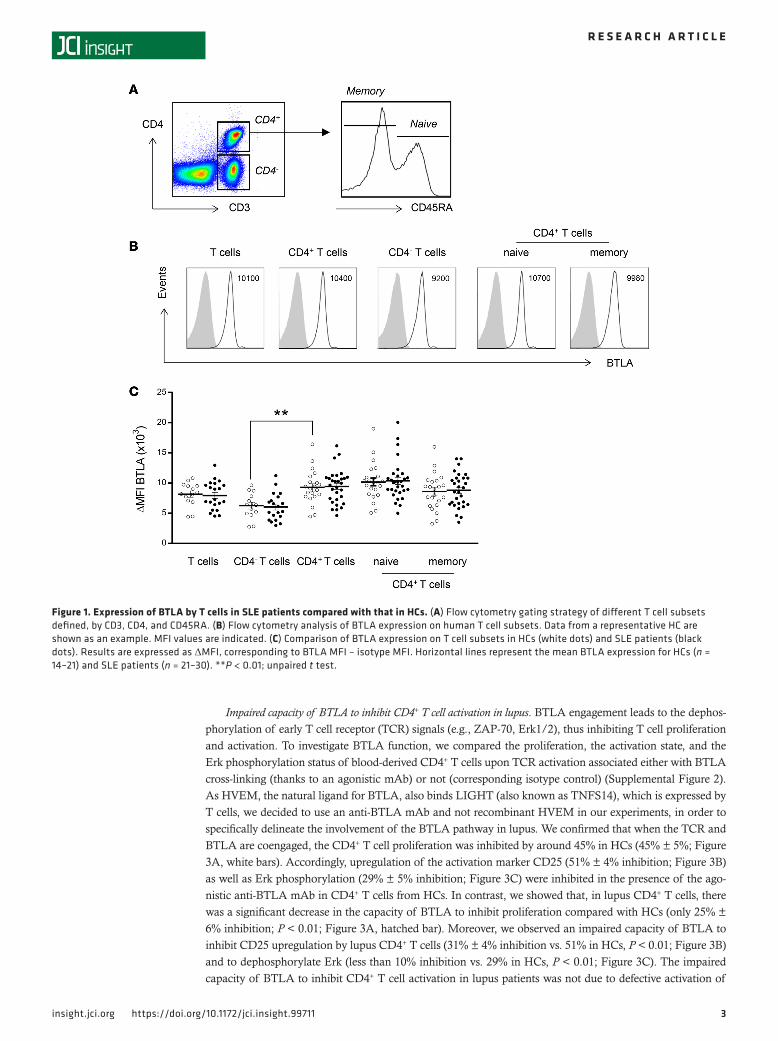
ResultsDefective upregulation of BTLA expression upon activation on lupus T cells. We monitored the expression of BTLA on total CD3+ T cells, CD4– T cells (corresponding mainly to CD8+ T cells), and naive (CD45RA+) and memory (CD45RA–) CD4+ T cells (Figure 1A). As previously described, BTLA is constitutively expressed on CD3+ T cells of freshly isolated peripheral blood mononuclear cells (PBMCs) (14). In healthy controls (HCs), BTLA was more highly expressed on CD3+CD4+ T cells than on CD3+CD4– T cells (mean fluorescence intensity [MFI], 9,300 ± 610 vs. 6,300 ± 560, P < 0.01; Figure 1, B and C), and there was no significant difference in BTLA expression among naive and memory CD4+ T cells. We next compared BTLA expression between lupus patients and HCs and did not observe significant variations of BTLA expression in any T cell subset. The heterogeneous expression level of BTLA was not due to variability among SLE patients, as we did not observe any correlation between BTLA expression in T cell subsets and disease activity (Supplemental Figure 1; supple-mental material available online with this article; https://doi.org/10.1172/jci.insight.99711DS1).
It has been reported that the membrane level of BTLA is increased upon activation of T cells in HCs (23, 24), thus allowing this coinhibitory receptor to further regulate lymphocyte activation. Indeed, stimu-lation of purified CD4+ T cells for 2 days with agonistic anti-CD3 and anti-CD28 mAbs induced a 2-fold enhancement of BTLA expression on CD4+ T cells from HCs, on average (Figure 2, A and B). Interest-ingly, the enhancement of BTLA expression after activation was significantly lower in CD4+ T cells SLE patients compared with those in HCs (mean 1.7; P < 0.01; Figure 2, A and B). The lower BTLA fold enhancement was not due to a defective activation of lupus CD4+ T cells (Figure 2C) and did not correlate with disease activity (Figure 2D).
3insight.jci.org https://doi.org/10.1172/jci.insight.99711
R E S E A R C H A R T I C L E
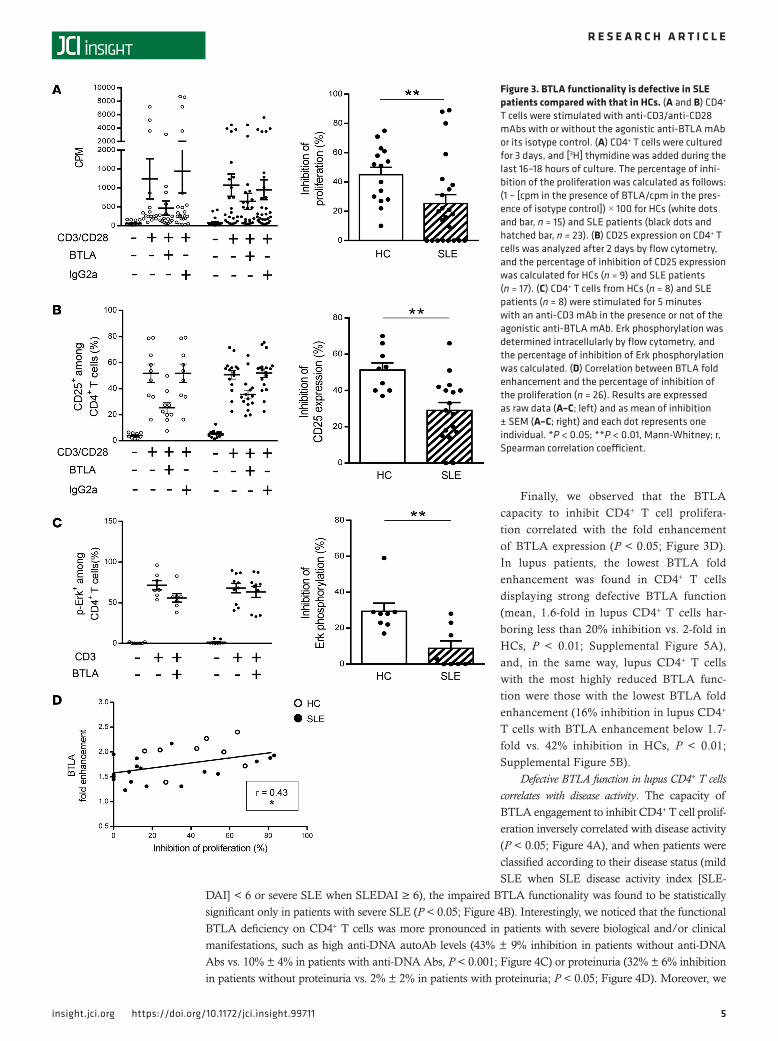
Impaired capacity of BTLA to inhibit CD4+ T cell activation in lupus. BTLA engagement leads to the dephos-phorylation of early T cell receptor (TCR) signals (e.g., ZAP-70, Erk1/2), thus inhibiting T cell proliferation and activation. To investigate BTLA function, we compared the proliferation, the activation state, and the Erk phosphorylation status of blood-derived CD4+ T cells upon TCR activation associated either with BTLA cross-linking (thanks to an agonistic mAb) or not (corresponding isotype control) (Supplemental Figure 2). As HVEM, the natural ligand for BTLA, also binds LIGHT (also known as TNFS14), which is expressed by T cells, we decided to use an anti-BTLA mAb and not recombinant HVEM in our experiments, in order to specifically delineate the involvement of the BTLA pathway in lupus. We confirmed that when the TCR and BTLA are coengaged, the CD4+ T cell proliferation was inhibited by around 45% in HCs (45% ± 5%; Figure 3A, white bars). Accordingly, upregulation of the activation marker CD25 (51% ± 4% inhibition; Figure 3B) as well as Erk phosphorylation (29% ± 5% inhibition; Figure 3C) were inhibited in the presence of the ago-nistic anti-BTLA mAb in CD4+ T cells from HCs. In contrast, we showed that, in lupus CD4+ T cells, there was a significant decrease in the capacity of BTLA to inhibit proliferation compared with HCs (only 25% ± 6% inhibition; P < 0.01; Figure 3A, hatched bar). Moreover, we observed an impaired capacity of BTLA to inhibit CD25 upregulation by lupus CD4+ T cells (31% ± 4% inhibition vs. 51% in HCs, P < 0.01; Figure 3B) and to dephosphorylate Erk (less than 10% inhibition vs. 29% in HCs, P < 0.01; Figure 3C). The impaired capacity of BTLA to inhibit CD4+ T cell activation in lupus patients was not due to defective activation of
Figure 1. Expression of BTLA by T cells in SLE patients compared with that in HCs. (A) Flow cytometry gating strategy of different T cell subsets defined, by CD3, CD4, and CD45RA. (B) Flow cytometry analysis of BTLA expression on human T cell subsets. Data from a representative HC are shown as an example. MFI values are indicated. (C) Comparison of BTLA expression on T cell subsets in HCs (white dots) and SLE patients (black dots). Results are expressed as ΔMFI, corresponding to BTLA MFI – isotype MFI. Horizontal lines represent the mean BTLA expression for HCs (n = 14–21) and SLE patients (n = 21–30). **P < 0.01; unpaired t test.

4insight.jci.org https://doi.org/10.1172/jci.insight.99711
R E S E A R C H A R T I C L E
CD4+ T cells (induction of activation was quantitatively similar in CD4+ T cells from HCs and SLE patients; Figure 2C) nor to an altered representation of particular CD4+ subsets in lupus settings (Supplemental Figure 3A). Indeed, even if the frequency of Tregs (defined as CD4+CD45RA–CD25hi T cells; Supplemental Figure 3A; ref. 25) tended to be diminished in lupus patients, there was no correlation between Treg frequency and the inhibition of the proliferation (Supplemental Figure 3B). Moreover, when we depleted Tregs (CD25hi cells; Supplemental Figure 4A), BTLA signaling was similarly able to inhibit CD4+ T cell activation (20% inhibition for CD25 expression and 16% inhibition for CD69 expression in the presence or in the absence of Tregs; Supplemental Figure 4, B and C), indicating that Tregs are not involved in the BTLA-dependent T cell inhibition we measured in our experimental conditions.
Figure 2. The upregulation of BTLA expression upon activation is defective in lupus CD4+ T cells in SLE patients compared with that in HCs. (A) Flow cytometry analysis of BTLA expression on CD4+ T cells with (black lines) or without stimulation (gray peaks) in a representative HC and SLE patient. (B) Comparison of BTLA MFI and BTLA fold enhancement (expressed as a ratio of BTLA MFI following activation/BTLA MFI in the absence of activation) on CD4+ T cells from HCs (n = 14; white bars) and SLE patients (n = 22 hatched bars). (C) Comparison of CD25 expression following T cell activation (with anti-CD3 and anti-CD28 mAbs) in CD4+ T cells from HCs (white bars, n = 15) and SLE patients (hatched bars, n = 24). (D) Correlation between BTLA fold enhancement and the disease activity defined by SLEDAI (n = 22). Results are expressed as mean ± SEM, and each dot represents one individual. **P < 0.01, Mann-Whitney; r, Spearman correlation coefficient.
5insight.jci.org https://doi.org/10.1172/jci.insight.99711
R E S E A R C H A R T I C L E
Finally, we observed that the BTLA capacity to inhibit CD4+ T cell prolifera-tion correlated with the fold enhancement of BTLA expression (P < 0.05; Figure 3D). In lupus patients, the lowest BTLA fold enhancement was found in CD4+ T cells displaying strong defective BTLA function (mean, 1.6-fold in lupus CD4+ T cells har-boring less than 20% inhibition vs. 2-fold in HCs, P < 0.01; Supplemental Figure 5A), and, in the same way, lupus CD4+ T cells with the most highly reduced BTLA func-tion were those with the lowest BTLA fold enhancement (16% inhibition in lupus CD4+ T cells with BTLA enhancement below 1.7-fold vs. 42% inhibition in HCs, P < 0.01; Supplemental Figure 5B).
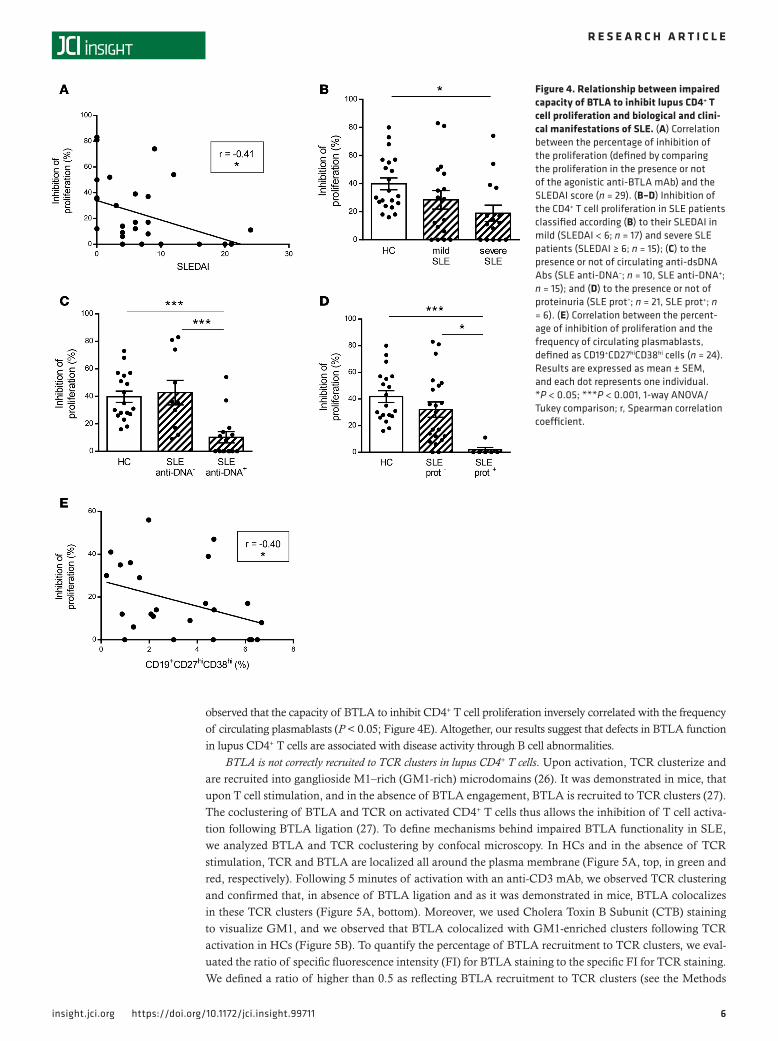
Defective BTLA function in lupus CD4+ T cells correlates with disease activity. The capacity of BTLA engagement to inhibit CD4+ T cell prolif-eration inversely correlated with disease activity (P < 0.05; Figure 4A), and when patients were classified according to their disease status (mild SLE when SLE disease activity index [SLE-
DAI] < 6 or severe SLE when SLEDAI ≥ 6), the impaired BTLA functionality was found to be statistically significant only in patients with severe SLE (P < 0.05; Figure 4B). Interestingly, we noticed that the functional BTLA deficiency on CD4+ T cells was more pronounced in patients with severe biological and/or clinical manifestations, such as high anti-DNA autoAb levels (43% ± 9% inhibition in patients without anti-DNA Abs vs. 10% ± 4% in patients with anti-DNA Abs, P < 0.001; Figure 4C) or proteinuria (32% ± 6% inhibition in patients without proteinuria vs. 2% ± 2% in patients with proteinuria; P < 0.05; Figure 4D). Moreover, we
Figure 3. BTLA functionality is defective in SLE patients compared with that in HCs. (A and B) CD4+ T cells were stimulated with anti-CD3/anti-CD28 mAbs with or without the agonistic anti-BTLA mAb or its isotype control. (A) CD4+ T cells were cultured for 3 days, and [3H] thymidine was added during the last 16–18 hours of culture. The percentage of inhi-bition of the proliferation was calculated as follows: (1 – [cpm in the presence of BTLA/cpm in the pres-ence of isotype control]) × 100 for HCs (white dots and bar, n = 15) and SLE patients (black dots and hatched bar, n = 23). (B) CD25 expression on CD4+ T cells was analyzed after 2 days by flow cytometry, and the percentage of inhibition of CD25 expression was calculated for HCs (n = 9) and SLE patients (n = 17). (C) CD4+ T cells from HCs (n = 8) and SLE patients (n = 8) were stimulated for 5 minutes with an anti-CD3 mAb in the presence or not of the agonistic anti-BTLA mAb. Erk phosphorylation was determined intracellularly by flow cytometry, and the percentage of inhibition of Erk phosphorylation was calculated. (D) Correlation between BTLA fold enhancement and the percentage of inhibition of the proliferation (n = 26). Results are expressed as raw data (A–C; left) and as mean of inhibition ± SEM (A–C; right) and each dot represents one individual. *P < 0.05; **P < 0.01, Mann-Whitney; r, Spearman correlation coefficient.
6insight.jci.org https://doi.org/10.1172/jci.insight.99711
R E S E A R C H A R T I C L E
observed that the capacity of BTLA to inhibit CD4+ T cell proliferation inversely correlated with the frequency of circulating plasmablasts (P < 0.05; Figure 4E). Altogether, our results suggest that defects in BTLA function in lupus CD4+ T cells are associated with disease activity through B cell abnormalities.
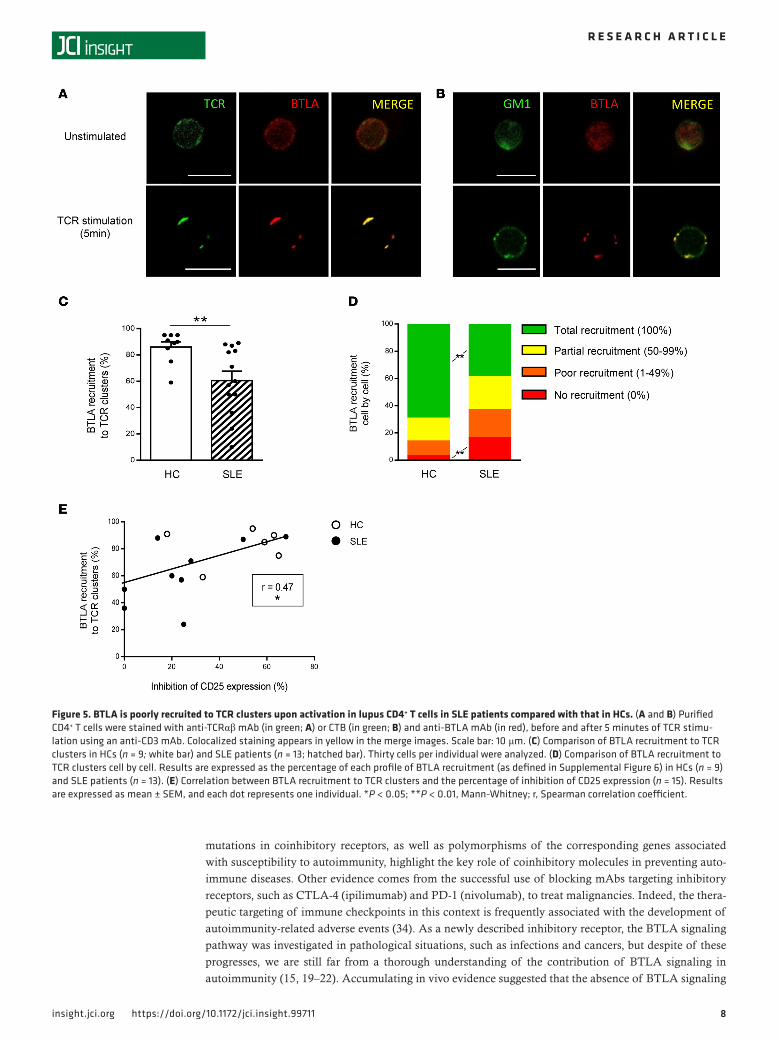
BTLA is not correctly recruited to TCR clusters in lupus CD4+ T cells. Upon activation, TCR clusterize and are recruited into ganglioside M1–rich (GM1-rich) microdomains (26). It was demonstrated in mice, that upon T cell stimulation, and in the absence of BTLA engagement, BTLA is recruited to TCR clusters (27). The coclustering of BTLA and TCR on activated CD4+ T cells thus allows the inhibition of T cell activa-tion following BTLA ligation (27). To define mechanisms behind impaired BTLA functionality in SLE, we analyzed BTLA and TCR coclustering by confocal microscopy. In HCs and in the absence of TCR stimulation, TCR and BTLA are localized all around the plasma membrane (Figure 5A, top, in green and red, respectively). Following 5 minutes of activation with an anti-CD3 mAb, we observed TCR clustering and confirmed that, in absence of BTLA ligation and as it was demonstrated in mice, BTLA colocalizes in these TCR clusters (Figure 5A, bottom). Moreover, we used Cholera Toxin B Subunit (CTB) staining to visualize GM1, and we observed that BTLA colocalized with GM1-enriched clusters following TCR activation in HCs (Figure 5B). To quantify the percentage of BTLA recruitment to TCR clusters, we eval-uated the ratio of specific fluorescence intensity (FI) for BTLA staining to the specific FI for TCR staining. We defined a ratio of higher than 0.5 as reflecting BTLA recruitment to TCR clusters (see the Methods
Figure 4. Relationship between impaired capacity of BTLA to inhibit lupus CD4+ T cell proliferation and biological and clini-cal manifestations of SLE. (A) Correlation between the percentage of inhibition of the proliferation (defined by comparing the proliferation in the presence or not of the agonistic anti-BTLA mAb) and the SLEDAI score (n = 29). (B–D) Inhibition of the CD4+ T cell proliferation in SLE patients classified according (B) to their SLEDAI in mild (SLEDAI < 6; n = 17) and severe SLE patients (SLEDAI ≥ 6; n = 15); (C) to the presence or not of circulating anti-dsDNA Abs (SLE anti-DNA–; n = 10, SLE anti-DNA+; n = 15); and (D) to the presence or not of proteinuria (SLE prot–; n = 21, SLE prot+; n = 6). (E) Correlation between the percent-age of inhibition of proliferation and the frequency of circulating plasmablasts, defined as CD19+CD27hiCD38hi cells (n = 24). Results are expressed as mean ± SEM, and each dot represents one individual. *P < 0.05; ***P < 0.001, 1-way ANOVA/Tukey comparison; r, Spearman correlation coefficient.

7insight.jci.org https://doi.org/10.1172/jci.insight.99711
R E S E A R C H A R T I C L E
for details). By analyzing 30 cells per individual, we found that this recruitment was significantly lower in SLE patients compared with that in HCs (61% ± 7% in SLE vs. 87% ± 4% in HCs, P < 0.01; Figure 5C). To go further, we used another approach consisting of measuring the percentage of colocalized BTLA-TCR clusters over the total number of clusters for each cell and defined 4 types of BTLA recruitment (Supplemental Figure 6). Thanks to this method, we observed that, whereas the total BTLA recruitment to the TCR synapse occurs in about 70% of the CD4+ T cells analyzed in HCs, only 38% of BTLA was totally recruited to TCR clusters in lupus patients (P < 0.01; Figure 5D). Altogether, these results indicate that following T cell activation, BTLA is not efficiently recruited to TCR clusters in lupus CD4+ T cells. We next wondered whether defective BTLA recruitment to TCR clusters could underlie impaired BTLA functionality in CD4+ T cells. Interestingly, we found a positive correlation between BTLA recruitment to TCR clusters and BTLA capacity to inhibit CD4+ T cell activation (P < 0.05; Figure 5E).
BTLA is excluded from preclustered TCR in lupus CD4+ T cells. Lupus T cells have been described as dis-playing increased expression of GM1 (28, 29), and the high GM1 expression in unstimulated SLE T cells was proposed to affect localization and movement of signaling molecules at the plasma membrane (29). Moreover, GM1-rich microdomains containing the TCR/CD3 complex and associated signaling mole-cules appeared to be abnormally preclustered in freshly isolated lupus T cells (28). In the present study, we also observed the existence of preclustered TCR in the absence of any extra stimulation in CD4+ T cells from SLE patients (Figure 6A). It should be noted that BTLA was only rarely associated with this pre-clustered TCR (less than 10% of BTLA staining colocalized with TCR staining; Figure 6A). Coinhibitory receptors, such as CTLA-4, are not only able to negatively regulate TCR signaling, but also to inhibit GM1 expression following activation (30). Interestingly, CTLA-4 was shown to be excluded from membrane microdomains and thus unable to inhibit their clustering in lupus T cells (31). We thus wondered wheth-er, similarly to CTLA-4, BTLA could regulate GM1-rich microdomains. In CD4+ T cells from HCs, we observed by flow cytometry that the enhancement of GM1 expression following CD3/CD28 stimulation was inhibited by BTLA cross-linking (8% ± 1% of CD4+GM1+ cells with CD3/CD28 stimulation vs. 3% ± 1% in the presence of anti-BTLA mAb; P < 0.05; Figure 6, B and C). More importantly, we showed that BTLA engagement failed to efficiently inhibit GM1 expression in lupus CD4+ T cells (59% ± 7% inhibition in HCs vs. 31% ± 8% in SLE patients; P < 0.05; Figure 6, B and D).
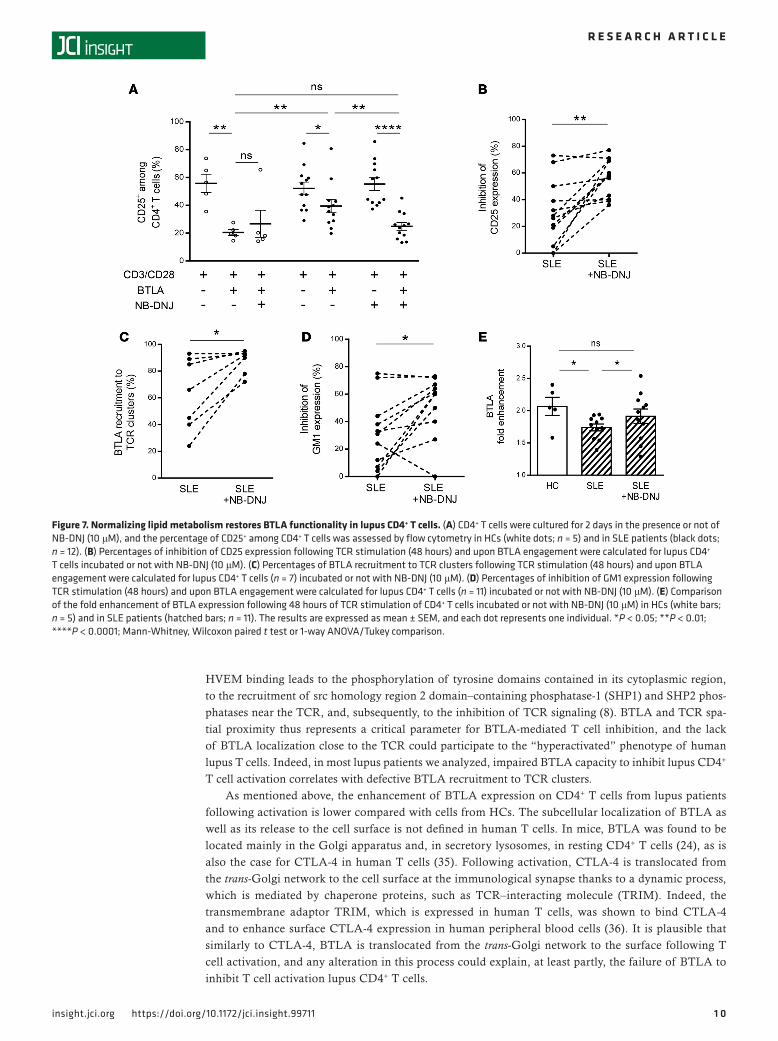
Defective BTLA function can be corrected by restoring lipid metabolism in lupus T cells. Targeting membrane lipids by using statins (which reduce cholesterol biosynthesis) was shown to reverse signaling defects in lupus T cells, including normalization of membrane GM1 expression (32). N-butyldeoxynojirimycin (NB-DNJ), a glucosylceramide synthase inhibitor, was also recently demonstrated to restore intracellular trafficking and to normalize lipid metabolism in CD4+ T cells from SLE patients (33). We wondered wheth-er this pharmacological drug could have a positive effect on the defective BTLA function in lupus CD4+ T cells. As shown above, BTLA signaling inhibits the expression of CD25 in CD4+ T cells from HCs (63% ± 6% inhibition; Figure 7A) but not as effectively in CD4+ T cells from SLE patients (24% ± 6% inhibition). NB-DNJ treatment did not increase the BTLA capacity to inhibit CD25 expression in HCs. However, very interestingly, the incubation of CD4+ T cells isolated from SLE patients with NB-DNJ significantly improved the inhibition of CD25 expression induced by BTLA engagement (55% ± 4% vs. 24% ± 6% in the absence of NB-DNJ; P < 0.01; Figure 7A). Taken as a whole, we observed that BTLA capacity to inhib-it the expression of CD25 on lupus CD4+ T cells was restored with NB-DNJ treatment (Figure 7B), with a percentage of inhibition reaching that obtained with CD4+ T cells from HCs. Interestingly, the BTLA recruitment to TCR clusters was also enhanced in CD4+ T cells from SLE patients following NB-DNJ treatment (88% ± 3% vs. 63% ± 10% in the absence of NB-DNJ; P < 0.05; Figure 7C). Moreover, in presence of this drug, BTLA-mediated inhibition of GM1 expression was also recovered in lupus CD4+ T cells (52% ± 7% vs. 31% ± 8% in the absence of NB-DNJ; P < 0.05; Figure 7D). Accordingly, we observed that the enhancement of BTLA expression on activated lupus CD4+ T cells was slightly but significantly increased following NB-DNJ treatment (P < 0.05; Figure 7E). These results show that NB-DNJ treatment restores BTLA functionality in lupus CD4+ T cells.
DiscussionThe balance between costimulatory and coinhibitory receptors determines the fate of immune responses. These immune checkpoints are thus likely to play important roles in pathological situations, such as autoimmunity, infectious diseases, and malignancies as well as in homeostasis. Data showing functional
8insight.jci.org https://doi.org/10.1172/jci.insight.99711
R E S E A R C H A R T I C L E
mutations in coinhibitory receptors, as well as polymorphisms of the corresponding genes associated with susceptibility to autoimmunity, highlight the key role of coinhibitory molecules in preventing auto-immune diseases. Other evidence comes from the successful use of blocking mAbs targeting inhibitory receptors, such as CTLA-4 (ipilimumab) and PD-1 (nivolumab), to treat malignancies. Indeed, the thera-peutic targeting of immune checkpoints in this context is frequently associated with the development of autoimmunity-related adverse events (34). As a newly described inhibitory receptor, the BTLA signaling pathway was investigated in pathological situations, such as infections and cancers, but despite of these progresses, we are still far from a thorough understanding of the contribution of BTLA signaling in autoimmunity (15, 19–22). Accumulating in vivo evidence suggested that the absence of BTLA signaling
Figure 5. BTLA is poorly recruited to TCR clusters upon activation in lupus CD4+ T cells in SLE patients compared with that in HCs. (A and B) Purified CD4+ T cells were stained with anti-TCRαβ mAb (in green; A) or CTB (in green; B) and anti-BTLA mAb (in red), before and after 5 minutes of TCR stimu-lation using an anti-CD3 mAb. Colocalized staining appears in yellow in the merge images. Scale bar: 10 μm. (C) Comparison of BTLA recruitment to TCR clusters in HCs (n = 9; white bar) and SLE patients (n = 13; hatched bar). Thirty cells per individual were analyzed. (D) Comparison of BTLA recruitment to TCR clusters cell by cell. Results are expressed as the percentage of each profile of BTLA recruitment (as defined in Supplemental Figure 6) in HCs (n = 9) and SLE patients (n = 13). (E) Correlation between BTLA recruitment to TCR clusters and the percentage of inhibition of CD25 expression (n = 15). Results are expressed as mean ± SEM, and each dot represents one individual. *P < 0.05; **P < 0.01, Mann-Whitney; r, Spearman correlation coefficient.

9insight.jci.org https://doi.org/10.1172/jci.insight.99711
R E S E A R C H A R T I C L E
leads to inflammatory responses and autoimmune diseases. Several coinhibitory pathways are suspected to participate in lupus pathogenesis. Indeed, polymorphisms in the PD-1 gene or in the CTLA-4 promot-er have been reported to be associated with lupus susceptibility, and CTLA-4 was shown to be unable to regulate the proliferation of effector lupus T cells (5, 31). However, whether the altered BTLA signaling pathway plays a role in the lupus disease is still unknown. The aim of our study was thus to delineate the involvement of the BTLA coinhibitory receptor in lupus pathogenesis.
We first demonstrated a decreased BTLA expression in activated effector T cells from lupus patients. In addition, we identified a functional defect of BTLA in lupus CD4+ T cells that correlates with dis-ease activity. Moreover, it is associated with proteinuria, with the presence of anti-dsDNA Abs (having a clearly pathogenic validated role in SLE) and with plasmablast frequency. B cells are considered key cellular players in SLE; however, numerous studies have highlighted the major contribution of CD4+ T cells to Ab production and tissue inflammation in lupus. The impaired BTLA functionality we describe in the present study could be responsible for uncontrolled proliferation and activation of lupus CD4+ T cells, which in turn will likely drive autoAb production. We propose that this defective BTLA function is due to a poor recruitment of BTLA to the TCR clusters upon activation. BTLA engagement through
Figure 6. BTLA regulates GM1 expression in activated T cells. (A) Unstimulated lupus CD4+ T cells were stained for TCR (in green) and BTLA (in red) and analyzed by confocal microscopy. Preclustered TCRs are denoted by white arrows. Scale bar: 10 μm. (B) Purified CD4+ T cells were cultured for 48 hours with or without TCR stimulation (anti-CD3/anti-CD28 mAbs) in the presence of the agonistic anti-BTLA mAb or its isotype control (IgG2a). GM1 expression was measured by flow cytometry thanks to CTB staining. Data obtained with CD4+ T cells from one representative HC and one representative SLE patient are shown. (C) Percentage of GM1+ cells among CD4+ T cells from HCs (n = 6). (D) Comparison of the percentage of inhibition of GM1 expression in HCs (n = 6; white bar) and SLE patients (n = 11; hatched bar). Results are expressed as mean ± SEM, and each dot represents one individual. *P < 0.05; ANOVA/Tukey comparison (C) and Mann-Whitney (D).
1 0insight.jci.org https://doi.org/10.1172/jci.insight.99711
R E S E A R C H A R T I C L E
HVEM binding leads to the phosphorylation of tyrosine domains contained in its cytoplasmic region, to the recruitment of src homology region 2 domain–containing phosphatase-1 (SHP1) and SHP2 phos-phatases near the TCR, and, subsequently, to the inhibition of TCR signaling (8). BTLA and TCR spa-tial proximity thus represents a critical parameter for BTLA-mediated T cell inhibition, and the lack of BTLA localization close to the TCR could participate to the “hyperactivated” phenotype of human lupus T cells. Indeed, in most lupus patients we analyzed, impaired BTLA capacity to inhibit lupus CD4+ T cell activation correlates with defective BTLA recruitment to TCR clusters.
As mentioned above, the enhancement of BTLA expression on CD4+ T cells from lupus patients following activation is lower compared with cells from HCs. The subcellular localization of BTLA as well as its release to the cell surface is not defined in human T cells. In mice, BTLA was found to be located mainly in the Golgi apparatus and, in secretory lysosomes, in resting CD4+ T cells (24), as is also the case for CTLA-4 in human T cells (35). Following activation, CTLA-4 is translocated from the trans-Golgi network to the cell surface at the immunological synapse thanks to a dynamic process, which is mediated by chaperone proteins, such as TCR–interacting molecule (TRIM). Indeed, the transmembrane adaptor TRIM, which is expressed in human T cells, was shown to bind CTLA-4 and to enhance surface CTLA-4 expression in human peripheral blood cells (36). It is plausible that similarly to CTLA-4, BTLA is translocated from the trans-Golgi network to the surface following T cell activation, and any alteration in this process could explain, at least partly, the failure of BTLA to inhibit T cell activation lupus CD4+ T cells.
Figure 7. Normalizing lipid metabolism restores BTLA functionality in lupus CD4+ T cells. (A) CD4+ T cells were cultured for 2 days in the presence or not of NB-DNJ (10 μM), and the percentage of CD25+ among CD4+ T cells was assessed by flow cytometry in HCs (white dots; n = 5) and in SLE patients (black dots; n = 12). (B) Percentages of inhibition of CD25 expression following TCR stimulation (48 hours) and upon BTLA engagement were calculated for lupus CD4+ T cells incubated or not with NB-DNJ (10 μM). (C) Percentages of BTLA recruitment to TCR clusters following TCR stimulation (48 hours) and upon BTLA engagement were calculated for lupus CD4+ T cells (n = 7) incubated or not with NB-DNJ (10 μM). (D) Percentages of inhibition of GM1 expression following TCR stimulation (48 hours) and upon BTLA engagement were calculated for lupus CD4+ T cells (n = 11) incubated or not with NB-DNJ (10 μM). (E) Comparison of the fold enhancement of BTLA expression following 48 hours of TCR stimulation of CD4+ T cells incubated or not with NB-DNJ (10 μM) in HCs (white bars; n = 5) and in SLE patients (hatched bars; n = 11). The results are expressed as mean ± SEM, and each dot represents one individual. *P < 0.05; **P < 0.01; ****P < 0.0001; Mann-Whitney, Wilcoxon paired t test or 1-way ANOVA/Tukey comparison.
1 1insight.jci.org https://doi.org/10.1172/jci.insight.99711
R E S E A R C H A R T I C L E
What are the consequences of defective BTLA localization to TCR clusters? The most obvious answer, confirmed by our data, is its inability to efficiently regulate TCR signaling. However, interestingly, we also demonstrated that BTLA is able to inhibit GM1 expression following CD4+ T cell activation, as it was shown for CTLA-4 (30, 37). This result highlights a previously unknown described role for BTLA, as a neg-ative regulator of GM1-enriched microdomain formation and reveals a vicious pathogenic circle: the exis-tence of preclustered TCRs in lupus CD4+ T cells limits the recruitment of BTLA to TCR microdomains. In turn, the absence of BTLA in TCR clusters prevents their dissociation. The next question we then should answer is how can we explain BTLA exclusion of preclustered TCRs? GM1-positive plasma membranes from CD4+ T cells of elderly people are characterized by higher levels of GM1 and cholesterol (38) and by an altered recruitment of signaling molecules (39). Moreover, overloading cholesterol in T cells from HCs reduces membrane fluidity (40). The high GM1 (33) and cholesterol levels (41) in lupus CD4+ T cells sug-gest a reduced lateral mobility of receptors and signaling molecules, such as CTLA-4 and BTLA. Accord-ingly, we demonstrated that the use of the NB-DNJ inhibitor, known to normalize lipid metabolism, is sufficient to restore BTLA function in lupus CD4+ T cells. Interestingly, it was also previously shown that in vitro treatment with atorvastatin, which inhibits cholesterol biosynthesis, restores the lipid raft–associat-ed signaling abnormalities in lupus T cells (32). Taken as a whole, our results suggest that dissociation of preclustered TCR using NB-DNJ allows BTLA recruitment to TCR clusters. As a consequence, BTLA’s location near the TCR and in the GM1-rich domain results in both the inhibition of TCR clustering and of TCR signaling and finally leads to reduced T cell activation.
Unlike CTLA-4 and PD-1, BTLA is not only expressed by T cells, but also by B cells. In B cells, the role and function of BTLA are still poorly understood, but recent data suggest that the BTLA and HVEM inter-action results in the inhibition of B cell function (17). We are currently investigating BTLA expression and function in lupus B cells, and our preliminary results reveal an altered expression of BTLA on lupus B cells ex vivo compared with B cells from HCs (our unpublished data). Interestingly, abnormal expression of lipid rafts in lupus B cells was recently described (42), and one can speculate that, as we described for CD4+ T cells, these lipid raft abnormalities in lupus B cells could contribute to defective BTLA recruitment to BCR clusters and to impaired BTLA functionality.
Enhancing BTLA function may represent an alternative therapeutic strategy for overcoming the unwanted activation of T cells in autoimmunity or transplantation. Indeed, Uchiyama et al. showed that the administration of an agonistic anti-BTLA mAb in a model of murine cardiac allograft, induces the suppression of alloreactive T cells; this suppression is associated with a decreased IL-2 and IFN-γ produc-tion but an increase in IL-10, leading to the generation of CD4+ Tregs and long-term survival (43). In the present study, we evidenced a defective BTLA functionality in lupus CD4+ T cells, thus limiting its direct therapeutic targeting. However, we demonstrated that restoring membrane trafficking is sufficient to correct BTLA function, allowing us to envisage the concomitant use of molecules, such as NB-DNJ and agonistic anti-BTLA mAb, for the development of new therapeutic strategies.
In summary, this study deepens our knowledge regarding the expression and function of BTLA in CD4+ T cells, not only in SLE but also in healthy conditions. Indeed, we provide evidence that BTLA engagement could potently block the induction of GM1-enriched microdomains following TCR activa-tion, a finding that we believe has never been described in humans before. More importantly, we demon-strate that BTLA signaling is deeply altered in lupus effector CD4+ T cells. Additional future work is now required to precisely delineate BTLA involvement in lupus pathogenesis. With the better understanding of immune abnormalities, targeted therapies will hopefully emerge and allow the development of “personal-ized medicine.”
MethodsPatients and controls. A total of 48 SLE patients (43 women and 5 men, aged from 17 to 82 years), who were seen at Strasbourg University Hospital and Pasteur Hospital (Colmar, France) and 26 age- and sex-matched HCs were enrolled in this study. All patients met the American College of Rheumatology criteria for classi-fication of SLE (44), and disease activity was assessed by SLEDAI. To avoid the effect of immunosuppres-sive agents on BTLA expression and function, all patients who received prolonged and heavy suppressive treatment or biologics were excluded from the study. Patients included in the study were untreated or treat-ed with methotrexate, hydroxychloroquine, and/or low doses of steroids (<20 mg/d). All samples were collected from SLE patients undergoing routine evaluation of their disease and from volunteers during
1 2insight.jci.org https://doi.org/10.1172/jci.insight.99711
R E S E A R C H A R T I C L E
routine clinical (diagnosis/prognostic/therapeutic) procedures. Characteristics of SLE patients are listed in Supplemental Table 1.
PBMC isolation and CD4+ T cell purification and cell culture. PBMCs were isolated by Ficoll density gradient centrifugation (Histopaque-1077, MilliporeSigma). CD4+ T cells were negatively selected using the Roset-teSep Human T CD4+ cell Enrichment Cocktail (StemCell Technologies Inc.) according to the manufactur-er’s instructions. The purity of the CD4+ population was typically ≥90%. For Treg depletion, CD4+ T cells were incubated with CD25 microbeads and isolated by negative selection following separation over a MACS column (Miltenyi Biotec). Purified CD4+ T cells were cultured in complete medium (RPMI 1640 containing 10% FCS, 10 μg/ml gentamicin, and 10 mM HEPES) at 1 × 10⁶ cells/ml in 96-well plates at 37°C.
Flow cytometry analysis. PBMCs or CD4+ T cells were stained for 20 minutes at 4°C in staining buffer (2% FCS in PBS) with the following conjugated mAbs or isotype-matched controls: anti-CD3–Alexa Fluor 700 (clone UCHT-1, mouse IgG1κ, BD Pharmingen); anti-CD4–allophycocyanin (anti-CD4–APC) Vio-let-770 (clone M-T466, Miltenyi Biotec); anti-CD25-APC (clone 4E3, Miltenyi Biotec); anti-CD45RA-phy-coerythrin (PE) Violet-615 (clone REA562, Miltenyi Biotec); and anti-BTLA-PE (clone MIH26, Bioleg-end). To assess GM1 expression, FITC-conjugated CTB (MilliporeSigma) staining was performed. For phosphorylated–Erk 1/2 detection, cells were fixed in IntraCellular (IC) Fixation Buffer (eBioscience) for 30 minutes and permeabilized in cold methanol (90%) for 20 minutes on ice. Permeabilized cells were washed in staining buffer before being stained with Alexa Fluor 488–conjugated anti-phospho–Erk 1/2 (pT202/pY204) (clone 20A, BD Pharmingen). Cell acquisition was performed using 10-color Flow Cytom-eter Gallios-Navios (Beckman Coulter). Data were analyzed using FlowJo 7.6.5 software (TreeStar).
BTLA functional analysis. Ab-coated beads (Dynabeads M-450 Epoxy, Invitrogen; 200 μg total Abs for 4 × 10⁸ beads) were used to stimulate purified CD4+ T cells. The cells were stimulated with beads coat-ed with anti-CD3 (10% OKT3, eBioscience)/anti-CD28 (5% clone CD28.2, BD Pharmingen), anti-CD3 (10%)/anti-CD28 (5%)/anti-BTLA (85% MIH26, Biolegend), or anti-CD3 (10%)/anti-CD28 (5%)/mouse IgG2a,κ (85% clone MG2a-53, Biolegend) (ratio bead/cell = 1:2). Flow cytometric analysis of CD25, BTLA, and GM1 expression was performed after 48 hours of culture. To measure cell proliferation, 3H-thy-midine (1 μCi per well; specific activity, 6.7 Ci/mmole; Perkin Elmer) was added after 48 hours of culture, cells were harvested 16–18 hours later on a filter with an automatic cell-harvesting device (Packard), and thymidine incorporation was assessed by using a Matrix 9600 direct beta counter (Packard).
To normalize intracellular lipid metabolism, cells were cultured for 48 hours in complete medium sup-plemented with 10 μM NB-DNJ (MilliporeSigma) and analyzed for CD25, BTLA, and GM1 expression by flow cytometry.
Analysis of Erk phosphorylation. Freshly isolated or NB-DNT–treated CD4+ T cells (1 × 10⁶ cells/ml in PBS) were incubated with anti-CD3 mAb (OKT3, 5 μg/ml) in the presence or not of the agonistic anti-BT-LA mAb (MIH26, 10 μg/ml) for 20 minutes on ice. Abs were then crosslinked with a secondary polyclonal Ab (AffiniPure Goat anti-Mouse IgG + IgM [H+L], Jackson ImmunoResearch, 20 μg/ml) for 15 minutes on ice. Cells were then incubated in a 37°C water bath for 5 minutes. The reaction was stopped by trans-ferring the cells in IC Fixation Buffer (v/v) for 30 minutes at room temperature and intracellularly stained with relevant mAb as mentioned previously.
Immunofluorescence and quantification of BTLA recruitment to TCR clusters. Freshly isolated CD4+ T cells were incubated on ice with anti-CD3 mAb (OKT3, 5 μg/ml) for 5 minutes and activated as mentioned previously. The reaction was stopped by transferring cells in IC Fixation Buffer (v/v) for 30 minutes at room temperature in poly-L-lysine–coated (MilliporeSigma) Chambered Cell Culture Slides (Falcon). After a blocking step in Tris Buffer Saline (TBS)–2% Bovine Serum Albumin (BSA) (MilliporeSigma), cells were incubated with primary Ab (anti-TCRαβ Alexa Fluor 488, clone IP26 and anti-BTLA Alexa Fluor 647, clone MIH26) in TBS-0.5% BSA overnight at 4°C in the dark. For GM1 staining, cells were intensively washed in cold PBS to remove residual BSA and then incubated with FITC-CTB (MilliporeSigma) for 30 minutes on ice. After washing in cold PBS, cells were stained with anti-BTLA Alexa Fluor 647 (clone MIH26) in TBS-0.5% BSA overnight at 4°C in the dark. Cells were washed in TBS and stained with 500 ng/ml DAPI. Stained CD4+ T cells were mounted in Mounting Fluorescence Medium (Dako), observed on an LSM 780 Carl Zeiss confocal micro-scope Axio Observer Z1 with a ×63 Plan-Apochromat objective, and acquired using an electronic zoom of ×7. For each individual, 30 CD4+ T cells were imaged individually. Analysis of the colocalization was carried out with ImageJ software (NIH). We set up the imaging parameters in order to avoid saturation of the signals and kept these settings for all our analyses. To quantify BTLA recruitment to TCR clusters, an approach was

1 3insight.jci.org https://doi.org/10.1172/jci.insight.99711
R E S E A R C H A R T I C L E
developed in our laboratory using ImageJ software. In TCR (green) and BTLA (red) corresponding channels, 2 different ROIs were manually determined: a “membrane” region and a “cluster” region corresponding to each cluster of TCR. The mean FI in both green and red colors were measured with the ImageJ software in each of these ROIs. To observe specific BTLA recruitment to TCR clusters, the FI of BTLA was divided by the TCR intensity, allowing us to calculate an intensity ratio according to this equation: (FI “cluster” BTLA – FI “membrane” BTLA)/(FI “cluster” TCR – FI “membrane” TCR). According to our imaging settings, a ratio of 0.5 was determined, for which we considered that BTLA was recruited to TCR clusters if the ratio was over 0.5 and not recruited if the ratio was less than 0.5. The ratio was calculated for each TCR spot in 30 cells per individual, allowing us to determine the percentage of TCR clusters colocalized with BTLA for each cell. Four different cell profiles of BTLA recruitment were identified: total recruitment (100% of TCR clusters colocal-ized with BTLA), partial recruitment (50%–99%), poor recruitment (<1%–49%), and no recruitment (0%).
Statistics. Data were analyzed using Graph Prism version 5 (Graphpad Software Inc). Differences between SLE patients and healthy individuals were determined with a 2-tailed unpaired Student’s t test or Mann-Whitney test as appropriate. Differences following NB-DNJ treatment were analyzed with a non-parametric 2-tailed Wilcoxon’s paired t test. The significance of differences between groups was determined using a 1-way ANOVA test with Tukey multiple comparisons. Relationships between two variables were evaluated using the Spearman’s correlation coefficient. Data are expressed as mean ± SEM, and differences were considered to be statistically significant at P < 0.05 or less.
Study approval. Ethical approval is not required for these types of studies under French legislation. An approval is needed and delivered by the French committee CCP for research defined as “recherches biomédicales.” This approval is not required if no additional procedures are performed, as it is the case in our study, as all samples were obtained from volunteers attending the Rheumatology Clinic of Strasbourg University Hospitals and were collected during routine clinical (diagnostic/prognostic/therapeutic) proce-dures prescribed. All patients provided written informed consent prior to their participation in the study.
Author contributionsFM designed the study. MS performed the experiments and analyzed the data. JDF assisted with microsco-py and reviewed the article. MS and FM wrote the manuscript. RF, FS, and JEG participated in sample col-lection and clinical analysis and reviewed the article. HD participated in discussions and reviewed the article.
AcknowledgmentsWe thank the Department of Rheumatology, Hautepierre Hospital (Strasbourg); the Department of Clini-cal Immunology and Internal Medicine, Strasbourg University Hospital; G. Blaison from the Pasteur Hos-pital, and the patients for participating in the study. We thank D. Olive for carefully reading the manuscript. This work was supported by the French CNRS, a grant from the Fondation Arthritis-Courtin (to FM), the French Ministère de l’Enseignement et de la Recherche, and a fellowship from ELIA Medical (to MS).
Address correspondence to: Fanny Monneaux, Institut de Biologie Moléculaire et Cellulaire, CNRS UPR3572/Laboratory of excellence MEDALIS, 15 rue René Descartes, 67000 Strasbourg, France. Phone: 33.388.41.70.27; Email: [email protected].
1. Cameron JS. Lupus nephritis. J Am Soc Nephrol. 1999;10(2):413–424. 2. Lacotte S, Dumortier H, Décossas M, Briand JP, Muller S. Identification of new pathogenic players in lupus: autoantibody-se-
creting cells are present in nephritic kidneys of (NZBxNZW)F1 mice. J Immunol. 2010;184(7):3937–3945. 3. Lacotte S, Decossas M, Le Coz C, Brun S, Muller S, Dumortier H. Early differentiated CD138(high) MHCII+ IgG+ plasma
cells express CXCR3 and localize into inflamed kidneys of lupus mice. PLoS One. 2013;8(3):e58140. 4. Le Coz C, Joublin A, Pasquali JL, Korganow AS, Dumortier H, Monneaux F. Circulating TFH subset distribution is strongly
affected in lupus patients with an active disease. PLoS ONE. 2013;8(9):e75319. 5. Zhang Q, Vignali DA. Co-stimulatory and Co-inhibitory pathways in autoimmunity. Immunity. 2016;44(5):1034–1051. 6. Watanabe N, Nakajima H. Coinhibitory molecules in autoimmune diseases. Clin Dev Immunol. 2012;2012:269756. 7. Furie R, et al. Efficacy and safety of abatacept in lupus nephritis: a twelve-month, randomized, double-blind study. Arthritis
Rheum. 2014;66(2):379–389. 8. Watanabe N, et al. BTLA is a lymphocyte inhibitory receptor with similarities to CTLA-4 and PD-1. Nat Immunol.
2003;4(7):670–679. 9. Han P, Goularte OD, Rufner K, Wilkinson B, Kaye J. An inhibitory Ig superfamily protein expressed by lymphocytes and APCs
is also an early marker of thymocyte positive selection. J Immunol. 2004;172(10):5931–5939.
1 4insight.jci.org https://doi.org/10.1172/jci.insight.99711
R E S E A R C H A R T I C L E
10. Sedy JR, et al. B and T lymphocyte attenuator regulates T cell activation through interaction with herpesvirus entry mediator. Nat Immunol. 2005;6(1):90–98.
11. Oya Y, et al. Development of autoimmune hepatitis-like disease and production of autoantibodies to nuclear antigens in mice lacking B and T lymphocyte attenuator. Arthritis Rheum. 2008;58(8):2498–2510.
12. Kashiwakuma D, et al. B and T lymphocyte attenuator suppresses IL-21 production from follicular Th cells and subsequent humoral immune responses. J Immunol. 2010;185(5):2730–2736.
13. Oya Y, et al. Lack of B and T lymphocyte attenuator exacerbates autoimmune disorders and induces Fas-independent liver inju-ry in MRL-lpr/lpr mice. Int Immunol. 2011;23(5):335–344.
14. Otsuki N, Kamimura Y, Hashiguchi M, Azuma M. Expression and function of the B and T lymphocyte attenuator (BTLA/CD272) on human T cells. Biochem Biophys Res Commun. 2006;344(4):1121–1127.
15. Serriari NE, et al. B and T lymphocyte attenuator is highly expressed on CMV-specific T cells during infection and regulates their function. J Immunol. 2010;185(6):3140–3148.
16. Gertner-Dardenne J, et al. The co-receptor BTLA negatively regulates human Vγ9Vδ2 T-cell proliferation: a potential way of immune escape for lymphoma cells. Blood. 2013;122(6):922–931.
17. Vendel AC, Calemine-Fenaux J, Izrael-Tomasevic A, Chauhan V, Arnott D, Eaton DL. B and T lymphocyte attenuator regu-lates B cell receptor signaling by targeting Syk and BLNK. J Immunol. 2009;182(3):1509–1517.
18. Thibult ML, et al. CpG-ODN-induced sustained expression of BTLA mediating selective inhibition of human B cells. J Mol Med. 2013;91(2):195–205.
19. Zhang Z, et al. B and T lymphocyte attenuator down-regulation by HIV-1 depends on type I interferon and contributes to T-cell hyperactivation. J Infect Dis. 2011;203(11):1668–1678.
20. M’Hidi H, et al. High expression of the inhibitory receptor BTLA in T-follicular helper cells and in B-cell small lymphocytic lymphoma/chronic lymphocytic leukemia. Am J Clin Pathol. 2009;132(4):589–596.
21. Derré L, et al. BTLA mediates inhibition of human tumor-specific CD8+ T cells that can be partially reversed by vaccination. J Clin Invest. 2010;120(1):157–167.
22. Fu Z, et al. Association of BTLA gene polymorphisms with the risk of malignant breast cancer in Chinese women of Heilongji-ang Province. Breast Cancer Res Treat. 2010;120(1):195–202.
23. Wang XF, et al. Distinct expression and inhibitory function of B and T lymphocyte attenuator on human T cells. Tissue Antigens. 2007;69(2):145–153.
24. Owada T, et al. Activation-induced accumulation of B and T lymphocyte attenuator at the immunological synapse in CD4+ T cells. J Leukoc Biol. 2010;87(3):425–432.
25. Miyara M, et al. Functional delineation and differentiation dynamics of human CD4+ T cells expressing the FoxP3 transcrip-tion factor. Immunity. 2009;30(6):899–911.
26. Xavier R, Brennan T, Li Q, McCormack C, Seed B. Membrane compartmentation is required for efficient T cell activation. Immunity. 1998;8(6):723–732.
27. Wu TH, Zhen Y, Zeng C, Yi HF, Zhao Y. B and T lymphocyte attenuator interacts with CD3zeta and inhibits tyrosine phos-phorylation of TCRzeta complex during T-cell activation. Immunol Cell Biol. 2007;85(8):590–595.
28. Krishnan S, et al. Alterations in lipid raft composition and dynamics contribute to abnormal T cell responses in systemic lupus erythematosus. J Immunol. 2004;172(12):7821–7831.
29. Jury EC, Kabouridis PS, Flores-Borja F, Mageed RA, Isenberg DA. Altered lipid raft-associated signaling and ganglioside expression in T lymphocytes from patients with systemic lupus erythematosus. J Clin Invest. 2004;113(8):1176–1187.
30. Martin M, Schneider H, Azouz A, Rudd CE. Cytotoxic T lymphocyte antigen 4 and CD28 modulate cell surface raft expression in their regulation of T cell function. J Exp Med. 2001;194(11):1675–1681.
31. Jury EC, et al. Abnormal CTLA-4 function in T cells from patients with systemic lupus erythematosus. Eur J Immunol. 2010;40(2):569–578.
32. Jury EC, Isenberg DA, Mauri C, Ehrenstein MR. Atorvastatin restores Lck expression and lipid raft-associated signaling in T cells from patients with systemic lupus erythematosus. J Immunol. 2006;177(10):7416–7422.
33. McDonald G, et al. Normalizing glycosphingolipids restores function in CD4+ T cells from lupus patients. J Clin Invest. 2014;124(2):712–724.
34. Postow MA, Sidlow R, Hellmann MD. Immune-related adverse events associated with immune checkpoint blockade. N Engl J Med. 2018;378(2):158–168.
35. Valk E, Rudd CE, Schneider H. CTLA-4 trafficking and surface expression. Trends Immunol. 2008;29(6):272–279. 36. Valk E, Leung R, Kang H, Kaneko K, Rudd CE, Schneider H. T cell receptor-interacting molecule acts as a chaperone to mod-
ulate surface expression of the CTLA-4 coreceptor. Immunity. 2006;25(5):807–821. 37. Chikuma S, Imboden JB, Bluestone JA. Negative regulation of T cell receptor-lipid raft interaction by cytotoxic T lympho-
cyte-associated antigen 4. J Exp Med. 2003;197(1):129–135. 38. Larbi A, Dupuis G, Khalil A, Douziech N, Fortin C, Fülöp T. Differential role of lipid rafts in the functions of CD4+ and
CD8+ human T lymphocytes with aging. Cell Signal. 2006;18(7):1017–1030. 39. Larbi A, et al. Age-associated alterations in the recruitment of signal-transduction proteins to lipid rafts in human T lympho-
cytes. J Leukoc Biol. 2004;75(2):373–381. 40. Nguyen DH, Espinoza JC, Taub DD. Cellular cholesterol enrichment impairs T cell activation and chemotaxis. Mech Ageing
Dev. 2004;125(9):641–650. 41. Jury EC, Flores-Borja F, Kabouridis PS. Lipid rafts in T cell signalling and disease. Semin Cell Dev Biol. 2007;18(5):608–615. 42. Dong GF, Zhang X, He DN, Li L, Zhang GF. Effect of leflunomide on the abnormal expression of lipid rafts and F-actin in B
lymphocytes from patients with systemic lupus erythematosus. J Immunol Res. 2015;2015:832916. 43. Uchiyama M, et al. An agonistic anti-BTLA mAb (3C10) induced generation of IL-10-dependent regulatory CD4+ T cells and
prolongation of murine cardiac allograft. Transplantation. 2014;97(3):301–309. 44. Hochberg MC. Updating the American College of Rheumatology revised criteria for the classification of systemic lupus erythe-
matosus. Arthritis Rheum. 1997;40(9):1725.