Response of a steel column-footing connection …shb.skku.edu/_res/hibs/etc/98.pdfdesigned to resist...
12
Structural Engineering and Mechanics, Vol. 63, No. 1 (2017) 125-136 DOI: https://doi.org/10.12989/sem.2017.63.1.125 125 Copyright © 2017 Techno-Press, Ltd. http://www.techno-press.com/journals/sem&subpage=7 ISSN: 1225-4568 (Print), 1598-6217 (Online) 1. Introduction The frost line, also known as frost depth or freezing depth, is the depth to which the groundwater in soil is expected to freeze during winter season. Building codes generally take frost depth into account to prevent frost heaving which can damage buildings by moving their foundations. For this reason, foundations are normally built below the frost line in cold region. In a steel structure without basements the first story column is generally placed on a reinforced concrete (RC) pedestal or pier which is extended to the foundation located below the frost line. In columns with rigid column-footing connection, the column base plate is connected to the RC pedestal by anchor bolts designed to resist both the design gravity and lateral loads. When a vehicle collides with the first story steel column, the column-pedestal joint tends to be the weakest link in the whole structure. Collision of a vehicle with a column has been investigated by El-Tawil et al. (2005) who carried out impact analysis of a bridge pier and investigated standard provisions set by the AASHTO-LRFD method for impact crash scenarios and concluded that current standards are under-conservative for bridge piers crash incidents. Itoh et al. (2007) simulated the progressive impact of a heavy truck on a concrete barrier, and compared the accuracy of the Corresponding author, Professor E-mail: [email protected] a Ph.D. E-mail: [email protected] FEM models with full scale on-site testing results. Comparison of the results generated from computer simulations and on-site full-scale experiments demonstrated that the developed models could be applied to simulate the collision of heavy trucks with concrete barriers to provide the data to design new road safety barriers and analyze existing ones. Tsang and Lam (2008) investigated the collapse of RC columns by vehicle impact based on energy based approach. In this study the ultimate energy absorption capacity of a column is compared to the kinetic energy embodied in the moving vehicle, and the results obtained from the nonlinear static analysis were evaluated by computer simulations of the dynamic behavior of the column following the impact. The effects of strain rate were discussed and the sensitivity of the result to changes in the velocity function and stiffness of the impacting vehicle was also studied. Types of vehicle-borne threat were categorized and various considerations for mitigating vehicle-borne threats were reported in Cormie et al. (2009). Ferrer et al. (2010) carried out real size low velocity car crash experiments against a reinforced concrete building column with a rectangular section. In this paper the device, procedures and instrumentation used in these experiments were described, and it was shown that the car suffered significant plastic deformations and therefore, the use of real car in the study of low velocity impact was necessary. Joshi and Gupta (2012) investigated the plasticity induced in bridge piers with varying geometries due to a colliding vehicle by finite element analysis. They proposed a method to quantify damage in bridge piers to crash incidents, and recommendations were suggested for speed restrictions and concrete strength. Sharma et al. (2012) carried out performance-based response evaluation of reinforced Response of a steel column-footing connection subjected to vehicle impact Hyungoo Kang a and Jinkoo Kim Department of Civil and Architectural Engineering, Sungkyunkwan University, 2066 Seobu-ro, Jangan-gu, Suwon, 440-746, Republic of Korea (Received December 2, 2016, Revised April 24, 2017, Accepted May 10, 2017) Abstract. This study investigated the performance of a steel column standing on a reinforced concrete footing when it was subjected to collision of an eight-ton single unit truck. Finite element analyses of the structure with different connection schemes were performed using the finite element model of the truck, and the results showed that the behavior of the column subjected to the automobile impact depended largely on the column-footing connection detail. Various reinforcement schemes were investigated to mitigate the damage caused by the car impact. The probability of the model reinforced with a certain scheme to reach a given limit state was obtained by fragility analysis, and the effects of the combined reinforcement methods were investigated based on the equivalent fragility scheme. The analysis results showed that the reinforcement schemes such as increase of the pedestal area, decrease of the pedestal height, and the steel plate jacketing of the pedestal were effective in reducing the damage. As the speed of the automobile increased the contribution of the increase in the number of the anchor bolts and the dowel bars became more important to prevent crushing of the pedestal. Keywords: vehicle impact; FE analysis; sensitivity analysis; fragility analysis
Transcript of Response of a steel column-footing connection …shb.skku.edu/_res/hibs/etc/98.pdfdesigned to resist...

Structural Engineering and Mechanics, Vol. 63, No. 1 (2017) 125-136
DOI: https://doi.org/10.12989/sem.2017.63.1.125 125
Copyright © 2017 Techno-Press, Ltd. http://www.techno-press.com/journals/sem&subpage=7 ISSN: 1225-4568 (Print), 1598-6217 (Online)
1. Introduction
The frost line, also known as frost depth or freezing
depth, is the depth to which the groundwater in soil is
expected to freeze during winter season. Building codes
generally take frost depth into account to prevent frost
heaving which can damage buildings by moving their
foundations. For this reason, foundations are normally built
below the frost line in cold region. In a steel structure
without basements the first story column is generally placed
on a reinforced concrete (RC) pedestal or pier which is
extended to the foundation located below the frost line. In
columns with rigid column-footing connection, the column
base plate is connected to the RC pedestal by anchor bolts
designed to resist both the design gravity and lateral loads.
When a vehicle collides with the first story steel column,
the column-pedestal joint tends to be the weakest link in the
whole structure.
Collision of a vehicle with a column has been
investigated by El-Tawil et al. (2005) who carried out
impact analysis of a bridge pier and investigated standard
provisions set by the AASHTO-LRFD method for impact
crash scenarios and concluded that current standards are
under-conservative for bridge piers crash incidents. Itoh et
al. (2007) simulated the progressive impact of a heavy truck
on a concrete barrier, and compared the accuracy of the
Corresponding author, Professor
E-mail: [email protected] aPh.D.
E-mail: [email protected]
FEM models with full scale on-site testing results.
Comparison of the results generated from computer
simulations and on-site full-scale experiments demonstrated
that the developed models could be applied to simulate the
collision of heavy trucks with concrete barriers to provide
the data to design new road safety barriers and analyze
existing ones. Tsang and Lam (2008) investigated the
collapse of RC columns by vehicle impact based on energy
based approach. In this study the ultimate energy absorption
capacity of a column is compared to the kinetic energy
embodied in the moving vehicle, and the results obtained
from the nonlinear static analysis were evaluated by
computer simulations of the dynamic behavior of the
column following the impact. The effects of strain rate were
discussed and the sensitivity of the result to changes in the
velocity function and stiffness of the impacting vehicle was
also studied. Types of vehicle-borne threat were categorized
and various considerations for mitigating vehicle-borne
threats were reported in Cormie et al. (2009). Ferrer et al.
(2010) carried out real size low velocity car crash
experiments against a reinforced concrete building column
with a rectangular section. In this paper the device,
procedures and instrumentation used in these experiments
were described, and it was shown that the car suffered
significant plastic deformations and therefore, the use of
real car in the study of low velocity impact was necessary.
Joshi and Gupta (2012) investigated the plasticity induced
in bridge piers with varying geometries due to a colliding
vehicle by finite element analysis. They proposed a method
to quantify damage in bridge piers to crash incidents, and
recommendations were suggested for speed restrictions and
concrete strength. Sharma et al. (2012) carried out
performance-based response evaluation of reinforced
Response of a steel column-footing connection subjected to vehicle impact
Hyungoo Kanga and Jinkoo Kim
Department of Civil and Architectural Engineering, Sungkyunkwan University,
2066 Seobu-ro, Jangan-gu, Suwon, 440-746, Republic of Korea
(Received December 2, 2016, Revised April 24, 2017, Accepted May 10, 2017)
Abstract. This study investigated the performance of a steel column standing on a reinforced concrete footing when it was
subjected to collision of an eight-ton single unit truck. Finite element analyses of the structure with different connection schemes
were performed using the finite element model of the truck, and the results showed that the behavior of the column subjected to
the automobile impact depended largely on the column-footing connection detail. Various reinforcement schemes were
investigated to mitigate the damage caused by the car impact. The probability of the model reinforced with a certain scheme to
reach a given limit state was obtained by fragility analysis, and the effects of the combined reinforcement methods were
investigated based on the equivalent fragility scheme. The analysis results showed that the reinforcement schemes such as
increase of the pedestal area, decrease of the pedestal height, and the steel plate jacketing of the pedestal were effective in
reducing the damage. As the speed of the automobile increased the contribution of the increase in the number of the anchor bolts
and the dowel bars became more important to prevent crushing of the pedestal.
Keywords: vehicle impact; FE analysis; sensitivity analysis; fragility analysis
Hyungoo Kang and Jinkoo Kim
concrete columns subject to vehicle impact to minimize
damage and meet a set of performance objectives during
different vehicle impact scenarios. It was found that the
estimation of the dynamic shear force capacity and demand
at different performance levels becomes key factor for
design and protection of the structure. Tay et al. (2012)
carried out vehicular crash test of a security bollard, and
compared the results with those of numerical simulations
using a finite element model for the vehicle and a force
pulse generated from the impact tests. They found that the
results of the two different models show good agreement.
Oakes (2014) cataloged the types, costs, and performance
metrics of the bollards, and recommended relevant codes
and standards. Sharma et al. (2014, 2015) developed
performance-based probabilistic models for the dynamic
shear force capacity of RC columns in bridges and
buildings. A framework is also developed to estimate the
fragility of the RC columns subject to vehicle collision.
Kang and Kim (2015) investigated the performance of
three-story steel moment frames subjected to vehicle
collision and compared the results with those based on the
alternate path approach specified in the guidelines. The
vehicle impact analysis showed that the overall damages
obtained from collision analysis could be significantly
larger than those obtained from the alternate path approach
which was carried out by arbitrary removing of a column.
Driemeier et al. (2016) studied the energy absorption
capacity of a W-beam guardrail subjected to automobile
impact. Chen et al. (2016) investigated progressive collapse
potential of steel moment framed structures due to abrupt
removal of a column based on the energy principle. Based
on the changes of component’s internal energy, this paper
analyzed structural member’s sensitivity to abrupt removal
of a column.
According to the literature review, most of the previous
studies on vehicle-column impact analysis were carried out
based on the assumption that columns were rigidly fixed to
the ground. This assumption may be valid in the structure
with basement, where the first story columns are continuous
at the joints. However, in a steel structure with its first story
columns supported on reinforced concrete pedestals, the
fixed bottom assumption may not be true. In this regard,
this study investigates the performance of a first story steel
column mounted on a RC footing subjected to vehicle
collision. Special attention is paid on the effectiveness of
various reinforcement schemes for reinforced concrete
column pedestal supporting the steel column. The finite
element model of an eight-ton single unit truck, provided by
the National Transportation Research Center, is used for
numerical analysis. In section 2, numerical modeling of the
steel column is described. In section 3 numerical
simulations of the column with different column-footing
connection details subjected to vehicle collision are
presented. Tornado diagram sensitivity analysis and fragility
analysis are conducted to find out the relative importance of
each reinforcement parameter on the response in section 4.
In section 5, the performance of the structure with multiple
reinforcement schemes was investigated.
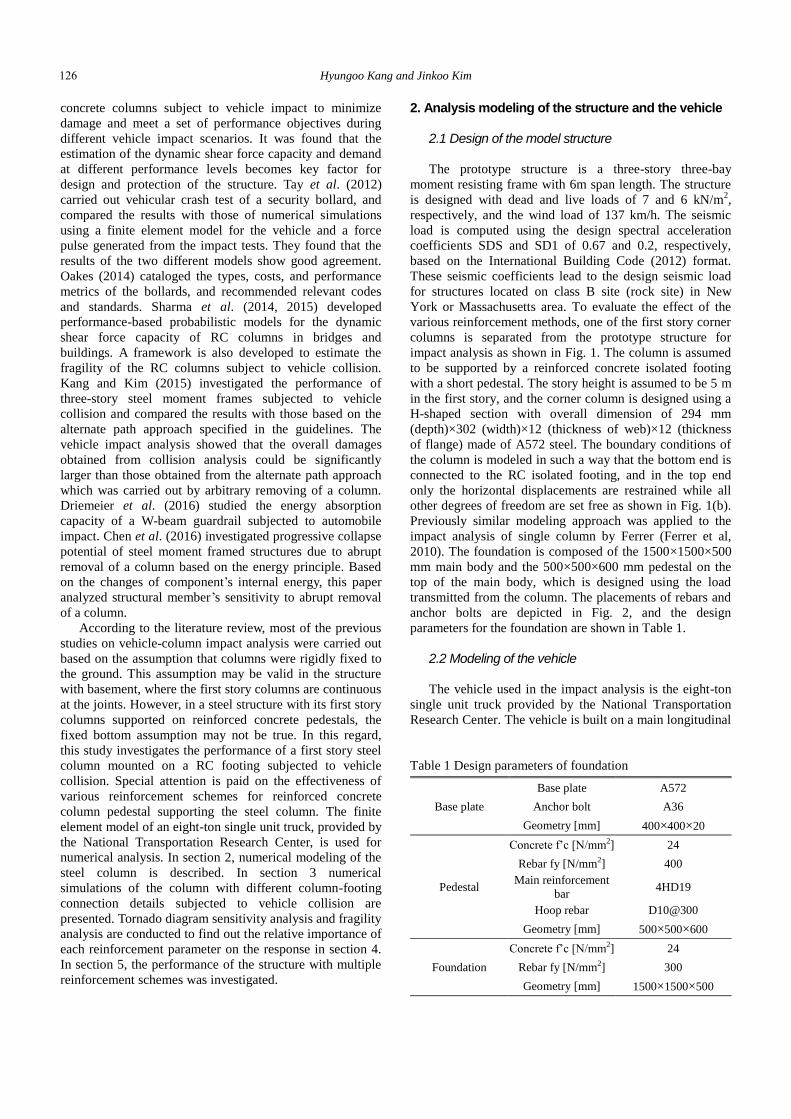
2. Analysis modeling of the structure and the vehicle
2.1 Design of the model structure
The prototype structure is a three-story three-bay
moment resisting frame with 6m span length. The structure
is designed with dead and live loads of 7 and 6 kN/m2,
respectively, and the wind load of 137 km/h. The seismic
load is computed using the design spectral acceleration
coefficients SDS and SD1 of 0.67 and 0.2, respectively,
based on the International Building Code (2012) format.
These seismic coefficients lead to the design seismic load
for structures located on class B site (rock site) in New
York or Massachusetts area. To evaluate the effect of the
various reinforcement methods, one of the first story corner
columns is separated from the prototype structure for
impact analysis as shown in Fig. 1. The column is assumed
to be supported by a reinforced concrete isolated footing
with a short pedestal. The story height is assumed to be 5 m
in the first story, and the corner column is designed using a
H-shaped section with overall dimension of 294 mm
(depth)×302 (width)×12 (thickness of web)×12 (thickness
of flange) made of A572 steel. The boundary conditions of
the column is modeled in such a way that the bottom end is
connected to the RC isolated footing, and in the top end
only the horizontal displacements are restrained while all
other degrees of freedom are set free as shown in Fig. 1(b).
Previously similar modeling approach was applied to the
impact analysis of single column by Ferrer (Ferrer et al,
2010). The foundation is composed of the 1500×1500×500
mm main body and the 500×500×600 mm pedestal on the
top of the main body, which is designed using the load
transmitted from the column. The placements of rebars and
anchor bolts are depicted in Fig. 2, and the design
parameters for the foundation are shown in Table 1.
2.2 Modeling of the vehicle
The vehicle used in the impact analysis is the eight-ton
single unit truck provided by the National Transportation
Research Center. The vehicle is built on a main longitudinal
Table 1 Design parameters of foundation
Base plate
Base plate A572
Anchor bolt A36
Geometry [mm] 400×400×20
Pedestal
Concrete f’c [N/mm2] 24
Rebar fy [N/mm2] 400
Main reinforcement
bar 4HD19
Hoop rebar D10@300
Geometry [mm] 500×500×600
Foundation
Concrete f’c [N/mm2] 24
Rebar fy [N/mm2] 300
Geometry [mm] 1500×1500×500
126

Response of a steel column-footing connection subjected to vehicle impact
(a) Finite element models
(b) Boundary condition
Fig. 1 Finite element models for single column impact
simulation
(a) 3 dimensional view
(b) Plan and elevation
Fig. 2 Rebar and anchor bolt placements in the footing-
pedestal system
Table 2 Finite element model of the truck used in the
impact analysis
Number of element
Shell 19,479
Solid 1,248
Beam 124
Weight of vehicle [kgf] 8,035
Elastic modulus [MPa] 205,000
Vehicle geometry [B×H×L, mm] 2,400×3,200×8,500
Table 3 Keywords for FE modeling
Material
Steel *MAT_PIECEWISE_LINEAR_PLASTICITY (024)
Concrete *MAT_CSCM_CONCRETE (159)
Soil *MAT_SOIL_AND_FOAM (005)
Ground
surface *MAT_RIGID (020)
Constrained Rebar in concrete
*CONSTRAINED_LAGRANGE_IN_SOLID
Contact
Vehicle
- Structure
*CONTACT_AUTOMATIC_SURFACE_TO_SURFACE
Other *CONTACT_TIED_NODES_TO_SURFACE
Negative
volume *CONTACT_INTERIOR
rail structure that acts as its backbone. The material of the
rails is specified in the Service Manual as the High Strength
Low Alloy (HSLA) steel of yield point 350 MPa. The yield
stress of the steel forming the surface of the truck is 155
MPa, and that of the other components is 270 MPa. The
mass density and elastic modulus of steel used in the model
are 7.85 kN/m2/g and 205 GPa, respectively. It is assumed
that 2.8 ton of mass is loaded on the truck, which leads to
total mass of 8 ton. Table 2 shows the general information
of the finite element modeling of the truck.
2.3 Modeling for finite element analysis
In this study impact analysis of a steel column is
conducted using the general-purpose finite element
simulation software package LS-DYNA (2006), which
performs nonlinear transient dynamic analysis using explicit
time integration. The steel column is modeled using the 8-
node hexahedron solid elements with the elasto-plastic
material named *MAT PIECEWISE LINEAR
PLASTICITY, and the reinforced concrete footing and the
pedestal are modeled with *MAT CSCM CONCRETE. The
rebars inside of the concrete are modeled using the
*CONSTRAINED LAGRANGE IN SOLID, and the soil
surrounding the footing is modeled with *MAT SOIL AND
FOAM. The contact condition between the structure and the
vehicle is defined by the *CONTACT AUTOMATIC
SURFACE TO SURFACE keyword. The friction
coefficient between the ground and the wheels is assumed
to be 0.01, and the ground surface is modeled by shell
elements with the *MAT RIGID keyword to prevent energy
dissipation due to deformation of the ground. In materials
that undergo extremely large deformations, an element may
become so distorted that the volume of the element may be
127

Hyungoo Kang and Jinkoo Kim
calculated as negative. In this study, the *CONTACT
INTERIOR keyword is used to prevent the occurrence of
negative volume due to large deformation in the vehicle.
The keywords used in the FE modeling of the structure are
summarized in Table 3. Each analysis is carried out in the
interval of 3.440×10⁻⁶
second for 0.5 sec after which the
response becomes stable.
Materials can behave differently at high-speed dynamic
events such as vehicle impact. In this study high strain rate
effect is accounted for using the Cowper-Symonds model
(Cowper et al. 1958) which scales the yield stress by the
strain rate dependent factor as follows
0
1
1 σC
σ
p.
yε
(1)
where 𝜀 ̇ is the strain rate during dynamic crushing, C and
P are the Cowper-Symonds strain rate parameters. In this
study the values of 40 and 5 were used for C and P,
respectively, based on Liu (2011) who showed that using
those values the effect of the impact velocity on the mean
crushing force due to the strain rate sensitivity can be well
considered in the numerical impact analysis using LS Dyna.
In the impact analysis, the original yield strength σ0 of all
structural elements was replaced by the dynamic flow stress
σy considering the strain rate effects.
2.4 Accuracy of numerical analysis
Hour glass effect is a spurious deformation mode of a
Finite Element Mesh, resulting from the excitation of zero-
energy degrees of freedom. Hourglass modes occur only in
under-integrated (single integration point) solid, shell, and
thick shell elements. LS-DYNA has various algorithms for
inhibiting hourglass modes. In this study IHQ type 4
(Flanagan-Belytschko stiffness form) is used to reduce the
hourglass effect. Fig. 3 shows the time history of various
energy quantities of the system subjected to the vehicle
collision with impact speed of 30 km/h. It is observed that
the maximum ratio of the hourglass energy and the total
energy is 11%, which is small enough to ensure the
accuracy of the impact analysis (Zaouk et al. 1997).
Fig. 3 Evolution of various energy quantities in
the column subjected to the vehicle collision with
impact speed of 30 km/h
Fig. 4 Deformation of column-footing system
subjected to vehicle collision
(a) Lateral displacement time history
(b) Velocity time history
(c) Deformed configuration
Fig. 5 Response of the column pedestal subjected to
the vehicle collision with impact speed of 30 km/h
128

Response of a steel column-footing connection subjected to vehicle impact
(a) Ground push out
(b) Von-Mises stress distribution of ground
Fig. 6 Deformation and stress distribution of the
column-pedestal and surrounding soil
3. Response of the column subjected to a vehicle impact
3.1 Damage criteria
To evaluate the damage state of a structural member,
UFC (Unified Facilities Criteria, 2008) and ASCE
(American Society of Civil Engineers, 2011) recommend
damage limit states in terms of member rotation. In the
guidelines, the limit states for the low, medium, and the
high damage states are given as member rotations of 2%,
4%, and 7% radian, respectively. Fig. 4 depicts the
deformation of the column-footing system when the truck
collides with the column. It is estimated that the lateral
displacements at the top of the pedestal corresponding to
the low, medium, and the high damage states are 10.5 mm,
21.0 mm, and 41.9 mm, respectively.
3.2 Lateral displacement of the pedestal
Fig. 5 depicts the time history of the lateral
displacement and velocity at the top of the pedestal and the
(a) Case f’c (b) Case T (c) Case Pa
(d) Case Ph (e) Case An (f) Case Ad
(g) Case Dn (h) Case Dd (i) Case Jt
Fig. 7 Time history of horizontal displacement (Impact velocity=30km/h)
129

Hyungoo Kang and Jinkoo Kim
deformed configuration of the pedestal subjected to the
vehicle collision with impact speed of 30 km/h. It can be
observed that the maximum displacement reaches as high as
59.9 mm, which exceeds the high damage state specified in
the guidelines. It also can be noticed that a permanent
displacement of 47.6 mm remains due to the vehicle impact.
Both the displacement and velocity at the top of the pedestal
become stable about 0.3 second after the impact. Fig. 6
shows the deformation and stress distribution of the
column-pedestal and the surrounding soil. It can be
observed that due to the vehicle impact the steel column is
significantly deformed and the soil surrounding the pedestal
is pushed out to the direction of the impact.
3.3 Reinforcement schemes for the column-footing
joint
The steel column-RC pedestal joint tends to be the
weakest link of the whole system in the case of vehicle
impact due to the relatively small shear strength of the
anchor bolts and the pedestal. When such a system is
subjected to an automobile collision the connection can be
severely damaged while the column itself remains only
lightly damaged. In this study various schemes are applied
to reinforce the column-pedestal joint against vehicle
impact, such as increase of compressive strength of
concrete (Case f’c), decrease of shear rebar spacing of
pedestal (Case Bd), increase of the pedestal cross sectional
area (Case Pa), decrease of height of pedestal (Case Ph),
increase of number (Case An) or diameter (Case Ad) of
anchor bolts, increase of number (Case Dn) or diameter
(Case Dd) of dowel bars for the pedestal, and jacketing of
pedestal with steel plates (Case Jt).
3.4 Response of the RC pedestal reinforced with various schemes
Fig. 7 shows the time history analysis results of the
column pedestal applied with nine reinforcement schemes,
which are compared with the result of the original structure
presented in gray dotted curve. The impact speed is set to be
30 km/h at which complete separation of the column from
(a) Case f’c (b) Case T (c) Case Pa
(d) Case Ph (e) Case An (f) Case Ad
(g) Case Dn (h) Case Dd (i) Case Jt
Fig. 8 Maximum deflection ratio of the pedestal with various reinforcement schemes at impact velocity of 30 km/h
130

Response of a steel column-footing connection subjected to vehicle impact
the pedestal does not happen. The reinforcement of the
pedestal is made in practically reasonable range of design
parameters. For each reinforcement scheme two different
levels of reinforcement are applied while the other design
variables remain unchanged from the original design. It can
be observed that the effectiveness of the reinforcement
schemes increases in the order of Case f’c, Case Dd, Case
Ad, Case Bd, Case Dn, Case An, Case Jt, Case Pa, and Case
Ph.
Fig. 8 shows the maximum deflection ratio of the
pedestal with various design parameters due to the impact.
For example, the deflection ratio of 1% corresponds to the
support rotations of 1.14°. It can be observed that the
response of the pedestal is reduced below the Medium
damage state only in the design parameter cases Pa, Ph, and
Jt.
4. Probabilistic evaluation of the column pedestal under impact load
Fig. 10 Tornado diagram of displacement for
various reinforcement methods
4.1 Sensitivity analysis
A sensitivity analysis is a technique used to determine
how different values of an input variable will impact a
(a) Case f’c (b) Case T (c) Case Pa
(d) Case Ph (e) Case An (f) Case Ad
(g) Case Dn (h) Case Dd (i) Case Jt
Fig. 9 Statistical distribution of retrofit parameters
131

Hyungoo Kang and Jinkoo Kim
particular output value under a given set of assumptions.
Miyamoto and Isoda (2012) carried out a sensitivity
analysis for rational health monitoring of bridges. In this
study Tornado diagram analysis (TDA), which is one of the
sensitivity analysis tools commonly used in decision
analysis, is carried out to find out the relative sensitivity of
each design variable of a column pedestal when the column
is subjected to an automobile impact. In TDA, the upper
and lower bounds of the parameters are selected as ±1/2σ,
where σ is the standard deviation, and the corresponding
structural responses are obtained. The difference between
such structural responses, referred to as swing, is considered
as a measure of sensitivity. Porter et al. (2002) applied it to
the seismic sensitivity analysis of structures, and Kim et al.
(2011) carried out sensitivity analysis of steel buildings
subjected to column loss using three different methods
including TDA.
To carry out statistical analysis of the column-pedestal
system reinforced with various schemes, the statistical
distribution of each design variable is constructed using the
beta distribution function based on the data available in
practice as shown in Fig. 9. As there are definite upper and
low bounds in the possible range of variation of the
variables considered in the reinforcement, the beta
distribution is suitable for probabilistic distribution of the
design variables for the pedestal. Fig. 10 shows the tornado
diagrams of the displacement plotted for each of the
reinforcement method in the order of swing size. The
vertical line denotes the mean displacement. It can be
observed that the swing is largest when the horizontal
dimension of the pedestal is varied (Case Pa), followed by
the variation of the number of anchor bolts (Case An) and
the thickness of the steel plate jackets (Case Jt). The effects
of variations in the compressive strength of concrete (Case
f’c) and the diameter of anchor bolts (Case Ad) and dowel
bars (Case Dd) turn out to be insignificant. The
reinforcement schemes Case Jt and Case Ph result in small
displacement compared with the other schemes.
(a) Case f’c (b) Case T (c) Case Pa
(d) Case Ph (e) Case An (f) Case Ad
(g) Case Dn (h) Case Dd (i) Case Jt
Fig. 11 Probability of satisfaction curve for various reinforcement methods at impact velocity of 30km/h
132

Response of a steel column-footing connection subjected to vehicle impact
4.2 Fragility analysis Fragility analysis is generally carried out to estimate the
probability of reaching a limit state at a given design
parameter value (Shinozuka et al. 2000). Even though such
technique is generally applied in seismic engineering, it is
also used for other engineering fields. For example,
Jurewicz et al. (2016) carried out fragility analysis of a
safety system to investigate the relationship between the
automobile speed and injury of pedestrians. Sharma et al.
(2014, 2015) developed performance-based probabilistic
models and fragility curves for the dynamic shear force
capacity of RC columns. Lee et al. (2016) applied fragility
analysis procedure to study the reliability of bridges against
flood.
In this study, it is assumed that the probability
distribution of the reinforcement parameters is expressed in
the form of beta distribution functions, and the estimations
of the median and the standard deviation are performed
with the aid of the maximum likelihood method. The
likelihood function for the present purpose is expressed as
ii x
i
xN
i i aFaFθ|xP
1
1)]([1)]([)( (2)
where F(•) represents the fragility curve for a specific
state of damage; ai is the ith value of a reinforcement
parameter, N is the total number of parameter values, xi is 1
or 0 depending on whether or not the damage state is over.
The function F(a) has a form as follows
ς
c
aln
ΦaF )( (3)
where Ф[•] is the probability distribution function, c is the
median value of the parameters which satisfy the given
damage criterion, and ζ is the standard deviation of the
parameter values. The parameters c and ζ which maximize
the likelihood function (L) can be obtained using the
following equation
ii x
i
xN
i i aFaFL
1
1)]([1)]([ (4)
dς
dlnL
dc
dlnL (5)
The probability density functions depicted in Fig. 9 is
substituted to Eq. (3) to construct fragility curves.
To evaluate the probability of reaching a given damage
limit state of the column when it is subjected to vehicle
collision, fragility curves are drawn in Fig. 11. In the figure,
the probability of satisfaction, which is the inverse of the
probability of reaching the limit sate, is plotted as a function
of the design variables (capacities). Reaching the value of
1.0 in the vertical axis implies that the probability of
reaching the given limit state is zero. It can be observed that
Case Pa, Case Ph, and Case Jt satisfy 50% of the probability
of satisfying all of the three low, medium, and high damage
states. It also can be observed that Case An, Case Dn, and
Case Bd reach the 50% satisfaction probability only for the
high damage state. In the reinforcement Cases f’c and Dd,
the variation of a design variable has only a small
possibility to satisfy the given limit state when it is varied
within a given range. In these cases the reinforcement
methods have only a minute effect in decreasing the
displacement of the column capital subjected to an
automobile impact.
5. Performance of the structure with multiple reinforcement schemes
In this section, five reinforcement schemes which turn
out to be relatively effective in the fragility analysis are
selected and are combined to effectively reinforce the
pedestal. The parameter values having 10, 30, and 50%
probabilities of satisfying each limit state are shown in
Table 4. For example, the thickness of the steel jacket plates
needs to be 13 mm and 25 mm, respectively, for 50%
satisfaction probability of the high and the low damage
states. In the case of the number of dowel bars, there is no
design value within the given range of variation which
satisfies the low damage state with 30 and 50% of
satisfaction.
Fig. 12 shows the impact analysis results of the model
structure reinforced with combined schemes subjected to
the automobile impact with 30 km/h speed. The
reinforcement parameters are determined as the values
which have 10% probability of satisfying the high damage
state obtained from the fragility analysis, and impact
analysis is carried out with various combinations of
Table 4 Design parameter values for given probability of satisfaction
Retrofit
cases Unit Unreinforced value
Design parameter values for X% satisfaction probability
50% 30% 10%
Low Medium High Low Medium High Low Medium High
Case Pa cm2 500 943 866 754 877 806 700 787 721 624
Case Ph Mm 600 45 170 325 60 215 410 85 300 575
Case An - 4 * 29 20 31 25 17 25 20 14
Case Dn - 4 * * 23 * 28 19 28 23 16
Case Jt mm 0 25 20 13 21 16 10 15 12 8
* No value for satisfying the damage limit state within the given range
133

Hyungoo Kang and Jinkoo Kim
Fig. 12 Deflection ratio of the pedestal with combined
reinforcement schemes at 30km/h impact speed
reinforcement methods. It is observed that a single
reinforcement method results in a response above the high
damage state. In the figure, it can be observed that the
simultaneous application of two reinforcement methods
generally leads to responses between the high and the
medium damage states. About half of the responses of the
structure with combinations of three reinforcement methods
are between the high and the medium damage states, and
half of the responses with combinations of four
reinforcement methods are between the medium and the
low damage states. Generally, the combination of
parameters including the jacketing of pedestal (Case Jt)
results in relatively smaller response.
In case the velocity of the automobile is increased to
40m/h, the column is completely severed from the pedestal
when the increase of the number of anchor bolts is not
included in the reinforcement scheme. It is observed that the
reinforcement methods associated with the reduction of
pedestal height (case Ph), increase of the parameters such as
pedestal area (Pa)/ dowel bars (Dn)/ anchor bolts (An), and
the addition of steel plate jackets (Jt) result in relatively low
responses. The damaged configuration of the pedestal and
the footing shows that significant damage occurs in the
pedestal in case jacketing is not provided. Figure 13 depicts
the deflection ratio of the pedestal retrofitted with combined
reinforcement schemes at 50km/h impact speed. In this
case, at least four reinforcement schemes need to be
combined to prevent the total failure of the pedestal due to
the impact. Even though most retrofit cases resulted in
response above the medium or even high damage limit
state, the column still has redundant capacity against
collapse. It is also observed that the reinforcement of anchor
bolts (Case An) and dowel bars (Case Dn) need to be
included in the reinforcement schemes to prevent complete
failure. The inclusion of steel plate jacketing (Case Jt)
results in significant reduction of the response. However,
even with application of four or five reinforcement
schemes, the response still exceeds the high damage state.
Fig. 14 shows the recommended detail of the reinforced
footing pedestal, and Fig. 15 depicts the damaged
configuration of the system subjected to the automobile
collision with impact speed of 50 km/h, where it is found
that with the four reinforcement schemes (Case Ph + An +
Fig. 13 Deflection ratio of pedestal with combined
reinforcement schemes at 50 km/h impact speed
Fig. 14 Recommended detail of the reinforced footing
pedestal (Case Ph + An + Dn + Jt)
(a) Case Ph + An + Dn + Jt
(b) Case Pa + Ph + An + Dn + Jt
Fig. 15 Damaged configuration of the footing-pedestal
system with various retrofit schemes subjected to
vehicle collision with 50 km/h impact speed
134

Response of a steel column-footing connection subjected to vehicle impact
Dn + Jt) slight damage is observed in the pedestal. It also
can be observed that after including one more reinforcement
scheme (Case Pa) the damage in the pedestal disappears.
6. Conclusions In this study the performance of a steel column standing
on a reinforced concrete footing subjected to a vehicle
collision was investigated. According to the sensitivity
analysis, the reinforcement schemes involved with the
height and cross sectional area of the pedestal, the number
of anchor bolts and dowel bars, and the steel plate jacketing
turned out to affect the response most significantly. The
analysis of the structure subjected to the low speed impact
of the vehicle showed that the reinforcement schemes such
as increase of the pedestal area, decrease of the pedestal
height, and the steel plate jacketing of the pedestal are
effective in reducing the response below the medium
damage state. When the impact speed increased to 40~50
km/h, the contribution of the increase in the number of the
anchor bolts and the dowel bars became more important to
prevent shearing of anchor bolts and crushing of pedestal. It
was also observed that the safety of the column-footing
system could be greatly enhanced by applying appropriately
combined multiple reinforcement schemes for the pedestal.
Based on the analysis results the design details and response
of some recommended retrofit cases were presented such as
retrofit with additional anchor bolts, dowel bars, plate
jacketing and changing the cross-sectional area and height
of the pedestal.
As huge amount of computation was required for
statistical analysis in this study, only the most basic
elements such as the column, footing, and the soil were
included in the finite element modeling. The results of this
study may have been different if more realistic three-
dimensional analysis model with accurate boundary
conditions was used instead of the single column on a
footing model used in this study. It also needs to be
mentioned that the column of the model structure is rigidly
connected to the RC pedestal, and the pin connection may
behave differently.
Acknowledgments
This research was supported by Basic Science Research
Program through the National Research Foundation of
Korea (NRF) funded by the Ministry of Education (NRF-
2016R1D1A1B03932880).
References
ASCE/SEI 59-11 (2011), Blast protection of buildings, American
Society of Civil Engineers.
Chen, C.H., Zhu, Y.F., Yao, Y. and Huang, Y. (2016),
“Progressive collapse analysis of steel frame structure based on
the energy principle”, Steel Compos. Struct., 21(3), 553-571.
Cormie, D., Mays, G. and Smith, P. (2009), Blast effects on
buildings (2nd edition), Thomas Telford Limited, UK.
Cowper, G.R. and Symonds, P.S. (1957), Strain-hardening and
strain-rate effects in the impact loading of cantilever beams
(No. TR-C11-28), Brown Univ Providence Ri.
Driemeier, L., Yoneda, A., Moura, R.T. and Alves, M. (2016),
“Performance of metallic defences submitted to vehicle
impact”, Int. J. Crashworthiness, 21(3), 252-277.
El-Tawil, S., Severino, E. and Fonseca, P. (2005), “Vehicle
collision with bridge piers”, J. Bridge Eng., 10(3), 345-353.
Ferrer, B., Ivorra, S., Irles, R. and Mas, D. (2010), “Real size
experiments of car crash against building column”, Structures
Under Shock and Impact XI, Wessex Institute of Technology,
UK, 231-241.
International Building Code (IBC) (2012), International Code
Council.
Itoh, Y., Liu, C. and Kusama, R. (2007), “Dynamic simulation of
collisions of heavy high-speed trucks with concrete barriers”,
Chaos, Soliton. Fract., 34(4), 1239-1244.
Joshi, A.S. and Gupta, L.M. (2012), “A simulation study on
quantifying damage in bridge piers subjected to vehicle
collisions”, Int. J. Adv. Struct. Eng. (IJASE), 4(1), 1-13.
Jurewicz, C., Sobhani, A., Woolley, J., Dutschke, J. and Corben,
B. (2016), “Exploration of vehicle impact speed-injury severity
relationships for application in safer road design”, Transport.
Res. Procedia, 14, 4247-4256.
Kang, H. and Kim, J. (2015), “Progressive collapse of steel
moment frames subjected to vehicle impact”, J. Perform.
Constr. Facil., 29(6), 1-11.
Kim, J., Park, J. and Lee, T. (2011), “Sensitivity analysis of steel
buildings subjected to column loss”, Eng. Struct., 33(2), 421-
432.
Lee, J., Lee, Y.J., Kim, H., Sim, S.H. and Kim, J.M. (2016), “A
new methodology development for flood fragility curve
derivation considering structural deterioration for bridges”,
Smart Struct. Syst., 17(1), 149-165.
Liu, Y. (2011), “Study of thin-walled box beams crushing
behavior using LS-DYNA”, 11th International LS-DYNA®
Users Conference, 13, 31-40.
LS-DYNA (2006), Theory manual version 971, © Livemore
Software Technology Corporation.
Miyamoto, A. and Isoda, S. (2012), “Sensitivity analysis of
mechanical behaviors for bridge damage assessment”, Struct.
Eng. Mech., 41(4), 539-558.
NTRCI (2017), National Transportation Research Center,
http://thyme.ornl.gov/fhwa/f800webpage/.
Oakes, C.G (2014), The Bollard: Crash- and Attack-Resistant
Models, Whole Building Design Guide, The National Institute
of Building Sciences.
Porter, K.A., Beck, J.L. and Shaikhutdinov, R.V. (2002),
“Sensitivity of building loss estimates to major uncertain
variables”, Earthq. Spectra, 18(4), 719-743.
Sharma, H., Gardoni, P. and Hurlebaus, S. (2014), “Probabilistic
demand model and performance-based fragility estimates for
RC column subject to vehicle collision”, Eng. Struct., 74, 86-95.
Sharma, H., Gardoni, P. and Hurlebaus, S. (2015), “Performance‐based probabilistic capacity models and fragility estimates for
RC columns subject to vehicle collision”, Comput.‐Aid. Civ.
Infrastruct. Eng., 30(7), 555-569.
Sharma, H., Hurlebaus, S. and Gardoni, P. (2012), “Performance-
based response evaluation of reinforced concrete columns
subject to vehicle impact”, Int. J. Impact Eng., 43(5), 52-62.
Shinozuka, M., Feng, M. Q., Lee, J. and Naganuma, T. (2000),
“Statistical analysis of fragility curves”, J. Eng. Mech., 126(12),
1224-1231.
Tay, S.K., Lim, B. and Ng, S.H. (2012), “Crash impact modeling
of security bollard”, 12th International LS-DYNA® Users
Conference, 13, 1-10.
Tsang, H.H. and Lam, N.T.K. (2008), “Collapse of reinforced
135

Hyungoo Kang and Jinkoo Kim
concrete column by vehicle impact”, Comput.‐Aid. Civ.
Infrastruct. Eng., 23(6), 427-436.
Unified facilities criteria (UFC) 3-340-02 (2008), Structures to
resist the effects of accidental explosions, U.S. Department of
Defense.
Zaouk, A.K., Bedewi, N.E., Kan, C.D. and Marzougui, D. (1997),
Development and evaluation of a C-1500 pick-up truck model
for roadside hardware impact simulation, FHWA/NHTSA
National Crash Analysis Center, The George Washington
University, July.
PL
136


![Seismic loss assessment of a structure retrofitted with slit …shb.skku.edu/_res/hibs/etc/94.pdf · 2016-12-21 · ... buckling restrained braces [2], ... located within shear walls](https://static.fdocuments.us/doc/165x107/5b24c2ae7f8b9ab16f8b49de/seismic-loss-assessment-of-a-structure-retrofitted-with-slit-shbskkuedureshibsetc94pdf.jpg)