Responding to changes in attraction, retention and ...
48
AUDITOR GENERAL ʼ S REPORT PERFORMANCE EXAMINATION Responding to changes in attraction, retention and achievement in Vocational Education and Training Report 7 November 2008
Transcript of Responding to changes in attraction, retention and ...

AUDITOR GENERALʼS REPORT
PERFORMANCE EXAMINATION
Responding to changes in attraction, retention and achievement in Vocational Education and Training
Report 7November 2008
2 Auditor General for Western Australia
THE PRESIDENT THE SPEAKER
LEGISLATIVE COUNCIL LEGISLATIVE ASSEMBLY
PERFORMANCE EXAMINATION – RESPONDING TO CHANGES IN ATTRACTION,
RETENTION AND ACHIEVEMENT IN VOCATIONAL EDUCATION AND TRAINING
This report has been prepared for submission to Parliament under the provisions of section 25 of the Auditor General Act 2006.
Performance Examinations are an integral part of the overall Performance Auditing program and seek to provide Parliament with assessments of the effectiveness and effi ciency of public sector programs and activities thereby identifying opportunities for improved performance.
The information provided through this approach will, I am sure, assist Parliament in better evaluating agency performance and enhance parliamentary decision-making to the benefi t of all Western Australians.
COLIN MURPHYAUDITOR GENERAL12 November 2008

Auditor General for Western Australia 3
Auditor Generalʼs Overview 4
Executive Summary 5Key Findings 5
Key Recommendations 6
Responses from Agencies to the Report 8Department of Education and Training 8
TAFE Colleges and Curtin University of Technology 8
The State Training Board 9
Vocational Education and Training is intended to be responsive and fl exible in meeting the needs of employers and students 10VET seeks to respond to the demands of industry, students and the community 10
Economic conditions affect the demand for VET 11
Roles and responsibilities in VET 11
The cost of VET 12
Attraction, retention and achievement in VET 13
Examination focus and approach 14
Apprentice and Trainee enrolments are going up but Institutional Based Training enrolments are falling 16Key Findings 16
Recommendations 16
DET and training providers have responded to increased demand for Apprentices and Trainees by increasing enrolments 72 per cent and 27 per cent respectively since 2003 17
Enrolments in publicly funded IBT have dropped by over 10 per cent (10 000 enrolments) since 2003 20
Objectives to increase enrolments overall, within certain occupations and amongst higher level courses are not being met 20
DET and Collegesʼ planning limits their ability to improve IBT enrolments 23
Student retention and achievement can improve but the Department of Education and Training and Colleges would need better systems and strategies 26Key Findings 26
Key Recommendations 27
There is scope for DET and Colleges to improve IBT retention and achievement which would improve outcomes 27
DETʼs funding of Colleges provides no direct incentive for student retention and achievement 30
DET and Colleges lack adequate information about student progress and outcomes which reduces their capacity to devise successful strategies to improve retention and achievement 32
DET and Colleges are not consistent or systematic in identifying students at risk of withdrawing or failing and while most have support strategies they focus on equity groups rather than risk factors across the wider student community 34
Appendix 1 – Glossary of Terms 36
Appendix 2 – Trends in Vocational Education and Training – Results of Data Analysis 38
Contents
RESPONDING TO CHANGES IN ATTRACTION, RETENTION AND ACHIEVEMENT IN VOCATIONAL EDUCATION AND TRAINING
4 Auditor General for Western Australia
Vocational Education and Training (VET) plays a crucial role in improving skills in the workforce, and providing the skilled labour that industry and the State need to be productive and competitive. Economic conditions in recent years have presented challenges for the Department of Education and Training (DET), the TAFE Colleges and other public institutions delivering training and for the State Training Board (the Board). In the high profi le area of Apprenticeships and Traineeships, they have responded. However, in Institutional Based Training, which makes up 75 per cent of VET enrolments, student numbers have been falling and fewer of those students complete their training.
Economic conditions have not been the only driver for change and development in VET. The Council of Australian Governments (COAG) has signalled consideration of potentially signifi cant changes to VET. In December 2007 it set up a Productivity Agenda Working Group with an objective to pursue substantial reform in the areas of education and skills. In July 2008 COAG ‘further endorsed the need for a new wave of national reform focused more squarely on the users of the vocational education and training system, including in relation to competition, contestability, regulation, quality assurance and consumer information’.
These challenges and opportunities have shown that to be effective, the organisations involved in VET have to meet multiple and often changing needs of both students and industry and adapt to broader sector wide change. To do this, they must focus on outcomes and have good information on which to base decisions. They must be fl exible in how they plan, fund and deliver training. They also must operate with transparency and accountability. Having better information, and making more of it publicly available, helps students make better informed choices about their training. It helps DET, Colleges and the Board to make better informed decisions and to identify where things are working well and where they can be improved.
Auditor Generalʼs Overview
Auditor General for Western Australia 5
Vocational education and training aims to provide enough skilled workers to meet the labour needs of the economy and to improve the overall skill levels of the workforce. It provides people with practical training and skills to enter or re-enter the workforce, to retrain, or upgrade existing skills.
In 2007 around 100 000 students accounted for 125 000 enrolments in publicly funded Vocational Education and Training (VET) mainly at 10 Technical and Further Education (TAFE) Colleges. Over $500 million of public funds were spent on VET in 2007. The Department of Education and Training (DET) used approximately $335 million to purchase training from TAFE Colleges, Curtin Vocational Training and Education Centre (Colleges), the Western Australian Academy of Performing Arts (WAAPA) and private Registered Training Organisations (RTOs).
Apprenticeships and Traineeships make up about 25 per cent of VET enrolments with Institutional Based Training (IBT) making up the other 75 per cent. Apprenticeships lead to mainly trade based qualifi cations and occupations – mechanics, plumbers, welders, bricklayers and hairdressers. Traineeships are usually in non-trade areas such as hospitality and business and lead to roles including catering and fi nancial services. Both Apprenticeships and Traineeships require direct employer involvement and an employment contract with the student. IBT is all non-Apprenticeship and Traineeship training. IBT covers a much broader range of courses, qualifi cations and occupations. These are largely in service occupations, such as aged and child care, computing, retail, offi ce administration, hospitality, food processing, real estate and tug boat driving.
The demand for all types of VET is affected by economic conditions. Western Australia’s recent economic growth has increased industry demand for Apprentices and Trainees, while low unemployment is a factor in reducing student demand for IBT. Delivering VET to meet industry and community needs presents challenges for DET and Colleges.
We focused on how DET and Colleges manage attraction, retention and achievement in VET. We examined trends in publicly funded VET delivered by Colleges and other RTOs over the last fi ve years. The examination then focused on how DET and Colleges were responding to these trends.
Key Findings VET, through its funding and planning, is enrolment driven. While this approach is delivering
more Apprentices and Trainees, it is not addressing a decline in IBT enrolments. The lack of focus on student retention and achievement means that DET and Colleges are not using all the available strategies to deliver skilled people to meet industry and community needs.
DET and training providers have responded to increased demand for Apprentices and Trainees by increasing enrolments 72 per cent and 27 per cent respectively since 2003.
Enrolments in publicly funded IBT have dropped by over 10 per cent (10 000 enrolments) since 2003.
Executive Summary

RESPONDING TO CHANGES IN ATTRACTION, RETENTION AND ACHIEVEMENT IN VOCATIONAL EDUCATION AND TRAINING
6 Auditor General for Western Australia
Objectives to increase enrolments overall, within certain occupations and amongst higher level courses are not being met:
the proportion of the population engaged in publicly funded VET has fallen since 2003 by around 6 000 students each year to 2007
enrolments in some IBT areas of high industry need are down by between 23 and 60 per cent
IBT enrolments by older people (30+) looking to up-skill or re-skill are down by about 12 per cent since 2003
enrolments in higher level IBT qualifi cations (Certifi cate III and above) were 18 per cent lower (11 000) in 2007 than 2003, with Advanced Diploma enrolments down by more than half.
DET and Colleges’ planning limits their ability to improve IBT enrolments:
by planning on a yearly basis DET and Colleges limit their ability to align student enrolments with industry demand
some Colleges are starting to implement initiatives aimed at increasing enrolments in IBT but it is too early to know if they have been effective.
There is scope for DET and Colleges to improve IBT retention and achievement which would improve outcomes:
students withdraw from or fail 28 per cent of IBT modules
DET and Colleges do not know how many students complete their IBT courses. Estimates made in 2002 were that only 16 per cent complete their course
there are signifi cant variations in module withdrawal and failure rates across Colleges and courses, indicating potential for improvement.
DET’s funding of Colleges provides no direct incentive for student retention and achievement:
DET contracts and funds Colleges to deliver specifi ed hours of training not numbers of skilled or qualifi ed students
Colleges retain funding whether or not a student stays and completes a module or course
if Colleges had to pay a refund for IBT module withdrawals we estimate this would have cost them almost $20 million in 2007.
EXECUTIVE SUMMARY (CONTINUED)

Auditor General for Western Australia 7
DET and Colleges lack adequate information about student progress and outcomes which reduces their capacity to devise successful strategies to improve retention and achievement.
DET and Colleges are not consistent or systematic in identifying students at risk of withdrawing or failing and while most have support strategies they focus on equity groups rather than risk factors across the wider student community.
Key Recommendations DET should:
Know how many students complete their IBT courses.
Adjust planning timeframes so that Colleges can better align student enrolments with industry demand, and consider ways for delivery agreements to best fi t with the new planning timeframes.
Provide incentives to Colleges to improve retention and achievement and focus delivery agreements more on outcomes than inputs.
DET and Colleges should:
Implement strategies, such as increased workplace based delivery, to attract more IBT students.
Improve and report information on the way students engage with VET, and the range of outcomes achieved including skill sets, specifi cally through the introduction of a unique student identifi er.
Colleges should:
Implement strategies to improve retention and achievement to improve productivity and deliver better outcomes within funding constraints.
Provide the public with performance information including withdrawal, failure and completion rate information to improve transparency and accountability for performance.

RESPONDING TO CHANGES IN ATTRACTION, RETENTION AND ACHIEVEMENT IN VOCATIONAL EDUCATION AND TRAINING
8 Auditor General for Western Australia
Department of Education and Training The Department of Education and Training notes the Auditor General’s fi ndings that the Department
and TAFE Colleges have achieved signifi cant outcomes in relation to government priorities to increase Apprenticeship and Traineeship training (EBT) over the last fi ve years. The Department acknowledges the Auditor General’s fi ndings that there has been a decline in Institutional Based Training (IBT) over this period. The Department also notes that this is consistent with a national decline in higher level (IBT) qualifi cations in Vocational Education and Training over the same period, however, the Department accepts that there needs to be an increased focus in this area.
The Department’s Strategic Plan 2007-2009 identifi es higher level skills as a critical progress measure. The COAG Productivity Agenda on Skills and Workforce Development has also identifi ed higher level skills as a national priority. The Department is currently progressing a number of strategies to address this issue, including the establishment of higher level traineeships in priority skills areas.
The Department accepts the fi nding that the planning cycle needs to be extended beyond a single year. The State Training Board has already initiated a three year planning cycle for the State Training Plan and the Department and TAFE Colleges are currently developing a three year planning framework to align with the State Training Plan. It should also be noted that the proposed amendments to the Vocational Education and Training Act includes a requirement for TAFE Colleges to develop a three year Strategic Plan.
The Department accepts the fi ndings that there needs to be a better understanding of student retention and achievement. The reasons students withdraw or fail are complex and varied and the Department supports the fi ndings that the Department and Colleges should increase the capacity for Colleges to devise successful strategies to improve retention and achievement.
TAFE Colleges and Curtin University of Technology TAFE Colleges and Curtin University of Technology (on behalf of Curtin Vocational Training and
Education Centre) broadly support the fi ndings and recommendations contained in the report and note the positive views expressed concerning the way the TAFE system has responded to the skills shortage in Western Australia.
The current economic environment, including the tight labour market as well as other infl uencing factors, has affected the capacity of the TAFE system to increase the delivery of Institutional Based Training (IBT) and these circumstances are acknowledged in the report. TAFE Colleges and Curtin University of Technology are of the view that there is scope to improve IBT enrolments and welcomes the report’s fi ndings that initiatives are being implemented to achieve this.
Responses from Agencies to the Report

Auditor General for Western Australia 9
A student’s decision to withdraw from or continue in a course of study is a complex one and while TAFE Colleges and Curtin University of Technology agree that scope exists to improve the support provided to students to improve their chances of training success, Colleges do understand and respond to the needs of those students requiring extra support.
TAFE Colleges and Curtin University of Technology support the report’s call for improved systems for data capture and reporting, but are concerned about the implications of funding based on completions.
Finally, TAFE Colleges and Curtin University of Technology agree that improvements can be made to the reporting of student outcomes and are of the view that a range of measures need to be available which accurately refl ect the different reasons why students commence a course of study.
The State Training Board The State Training Board (the Board) supports the general thrust of the fi ndings concerning the
scope for improving attraction, retention and achievement in Institutional Based Training. As the report acknowledges, the Board’s move to a three year State planning process is designed to enhance Colleges’ ability to align student attraction strategies with forecasted industry needs.
The report is also correct in noting the signifi cant challenges to the VET system presented by the unprecedented nature of Western Australia’s rapid, resources driven economic growth. This context needs to be clearly recognised. WA’s population growth, low unemployment, rising workforce participation rates, international immigration and employment growth, all point to a labour and skills shortage.
Recognising the importance of the VET system in supporting industry’s response, the Board was instrumental in commissioning the Beyond the Resources Boom project and drafting of a 10 year strategic plan. The plan builds on current reforms with strategies to improve skills and participation of all Western Australians in the workforce and in the community, driven by a fl exible, responsive and innovative training system.
Undoubtedly, the high demand for labour, strong employment growth and low unemployment have been key factors in the downturn in institutional based delivery and the focus in the report on performance in institutional based delivery is appropriate. The enormous achievements of the State’s VET system since 2003 in growing Apprenticeships and Traineeships, however, should not be diminished.
The Board is committed to providing leadership as the primary interface between industry and the WA training sector. The Auditor General’s report is welcomed for the support it provides in highlighting key policy directions for VET, which the Board has identifi ed.

RESPONDING TO CHANGES IN ATTRACTION, RETENTION AND ACHIEVEMENT IN VOCATIONAL EDUCATION AND TRAINING
10 Auditor General for Western Australia
Vocational education and training is practical training that equips people with skills to help them enter or re-enter the workforce, to retrain or to upgrade existing skills. Key outcomes from vocational education and training are to provide skilled workers to meet the labour needs of the economy and to improve the overall skill levels of the workforce.
Each year around 100 000 students make about 125 000 enrolments in publicly funded Vocational Education and Training (VET) mainly at 10 Technical and Further Education (TAFE) Colleges. These students enrol in over 800 courses made up of almost 11 500 modules leading to a range of qualifi cations from a Certifi cate Level I to an Advanced Diploma.
VET is delivered either through Apprenticeships and Traineeships or Institutional Based Training (IBT). Apprenticeships and Traineeships make up about 25 per cent of VET enrolments and IBT the other 75 per cent.
Apprenticeships and Traineeships require the student to have an employment contract and the majority of time is spent in the workplace. Apprenticeships lead to mainly trade based qualifi cations and occupations – mechanics, plumbers, welders, bricklayers and hairdressers. Traineeships are usually in non-trade areas such as hospitality and business and lead to roles including catering, and fi nancial services.
IBT is all non-Apprenticeship and Traineeship training, does not require an employment contract and traditionally is largely taught in a classroom setting. IBT covers a much broader range of courses, qualifi cations and occupations. These are largely in the service industries, such as aged and child care, computing, retail, offi ce administration, hospitality, food processing, real estate and tug boat driving.
VET seeks to respond to the demands of industry, students and the community VET has a number of stakeholders with differing needs and priorities and has to be fl exible and
responsive to meet these multiple priorities. VET has a key role in skilling the workforce to meet the needs of industry and the community in the short and long term. Industry and the community need the right number of appropriately trained people for employment. Students enrol for employment related and other reasons. At times, student choices may either not match industry and community needs or there may be a lag in VET delivering enough skilled people to meet demand.
VET is not the only source of skilled people in the Western Australian labour market. Universities and interstate and international migration are also important sources of skilled people.
Vocational Education and Training is intended to be responsive and fl exible in meeting the needs of employers and students
Auditor General for Western Australia 11
Economic conditions affect the demand for VET The recent growth in the State’s economy, mainly driven by the construction and mining industries,
has led to increased demand for skilled workers and to shortages of trade qualifi ed workers. In turn, this has focused attention on the VET sector and its capacity to provide skilled workers, particularly in Apprenticeships and Traineeships. This has signifi cantly increased demand for VET in these areas. Industry has also highlighted a potential need to increase the number of people training for occupations which support and service a growing population.
At the same time, Western Australia’s economic growth has resulted in low unemployment. Demand for VET is sensitive to employment trends – enrolments, particularly in IBT, tend to fall when the job market is good and increase when unemployment is high. Buoyant economic conditions make attracting and retaining students in IBT a challenge.
When unemployment is low, having a VET qualifi cation remains attractive in occupations where it is a prerequisite to be licensed to do a job. This is the case for many Apprenticeships and Traineeships. This tends not to be the case in IBT, where low unemployment means students can get jobs without VET skills and qualifi cations.
In addition, the State Training Board believes that some industries (such as community services and hospitality) will struggle to compete for workers against strongly performing industries (such as mining and construction) which are able to offer higher wages and/or more attractive employment conditions.
This ‘crowding out’ effect is impacting student course choices and tends to have the biggest effect in IBT, which focuses on service industry occupations. If high employment, wage growth and demand for labour are sustained, VET will have to adapt to attracting students in times of low unemployment.
Roles and responsibilities in VET DET is responsible for the planning, funding, monitoring and strategic development of VET
(Figure 1). The State Training Board (STB), using information from Industry Training Advisory Bodies, advises the Minister for Education and Training on the supply and demand for skills. This is achieved mainly through the State’s annual training plan, the State Training Profi le (STP). DET uses the STP as the basis for the delivery and performance agreements with training providers. The delivery and performance agreements are contracts between the Minister and Colleges. DET operates and administers the agreements under delegated authority from the Minister.

RESPONDING TO CHANGES IN ATTRACTION, RETENTION AND ACHIEVEMENT IN VOCATIONAL EDUCATION AND TRAINING
12 Auditor General for Western Australia
A network of 10 TAFE Colleges, Curtin Vocational Training and Education Centre (Curtin VTEC), Western Australian Academy of Performing Arts (WAAPA) and over 150 private providers deliver training to students.
The Training Accreditation Council (TAC) is responsible for the registration of training providers, the accreditation of courses and the recognition of skills and qualifi cations.
Figure 1: Roles and responsibilities within VET VET involves multiple stakeholders including industry, DET, TAFE Colleges, private Registered
Training Organisations (RTOs), and the TAC.Source: DET OAG
The cost of VET In 2006-07 $525 million of public funds was spent on VET. Approximately 20 per cent was
Commonwealth funding and 80 per cent State funding.
DET used $335 million to purchase training (Figure 2). The majority (93 per cent) of this went to TAFE Colleges and Curtin Vocational Training and Education Centre (Colleges) and Western Australian Academy of Performing Arts (WAAPA). The rest was competitively allocated to private Registered Training Organisations (RTOs).
Minister
Training Accreditation
Council
State Training Board
Department of Education and
Training
Publicly funded Registered Training Organisations consisting of 10 TAFE Colleges, Curtin VTEC,
WAAPA and over 150 publicly funded private RTOs
10 Industry Training Advisory Bodies
VOCATIONAL EDUCATION AND TRAINING IS INTENDED TO BE RESPONSIVE AND FLEXIBLE IN MEETING THE NEEDS OF EMPLOYERS AND STUDENTS (CONTINUED)

Auditor General for Western Australia 13
Around $60 million of the $525 million was used to fund DET’s administration of VET. A further $60 million was used to support training planning and delivery, and $70 million for Colleges’ staff superannuation, capital grants and capital user charge costs.
The $525 million expenditure on VET in 2006-07 was $59 million (11 per cent) less than the budget of $584 million. In the Financial Statements for each of the last fi ve years DET has reported a surplus of, on average, $46 million (8.4 per cent).
Total DET VET Expenditure2006-2007
$525m
DET Administration and Corporate
Services$60m
Support Costs$130m
Total Training Purchases$335m
Support for Training Planning
and Delivery$60m
Colleges and WAAPA
superannuation, capital user charge and capital grants
$70m
Training purchased from Colleges and WAAPA
$312m
Training purchased
from private providers
$23m
Figure 2: Breakdown of VET Expenditure by DET in 2006-07 DET purchased over $300 million of training from Colleges and WAAPA, and $23 million from private
RTOs in 2006-07.
Source: DET OAG
Attraction, retention and achievement in VET To deliver training outcomes (skilled or qualifi ed people) students need to be attracted to VET and
enrol, stay and participate through the duration of their modules and/or course and successfully complete their module(s) and course (Figure 3).
Figure 3: Basic student pathway through VET Students enrol in modules and may withdraw, fail or complete them. Completing modules may lead to
completing a course. Students may be seeking to acquire specifi c skills, or to complete a course and a qualifi cation, to improve their employment outcomes.
Source: DET OAG
Student enrols
Student engages in module/s
Student passes module
Student passes all
modules and completes
course
Student fails
module
Student withdraws
from module
Qualifi cation
Attraction RetentionModule
AchievementCourse
Achievement
RESPONDING TO CHANGES IN ATTRACTION, RETENTION AND ACHIEVEMENT IN VOCATIONAL EDUCATION AND TRAINING
14 Auditor General for Western Australia
We have used the terms attraction, retention and achievement as follows:
‘Attraction’ refl ects the need to attract students to enrol in VET and the trends and issues in enrolments (measured by course enrolments – the number of people who enrol and engage in a course).
‘Retention’ is defi ned as the extent to which students, once enrolled, stay in training to progress through a module and course (measured by the number of modules that students withdraw from or fail).
‘Achievement’ varies between student groups and includes module completion, skills acquisition and course completion (measured by module load completion rate and course completion rate).
Examination focus and approach This examination focused on how DET and Colleges manage attraction, retention and achievement
in VET (throughout this report VET refers only to publicly funded training). We addressed two key questions:
What are the trends in attraction, retention and achievement in VET?
How are DET and Colleges responding to these trends and to what effect?
We examined trends in publicly funded VET over the last fi ve years. We analysed Australian Vocational Education and Training Management Information Statistical Standard (AVETMISS) data. The results of this data analysis are presented in Appendix 2. The analysis used cross tabulations of student, course and College variables by Apprenticeships and Traineeships, and IBT. This analysis is not routinely conducted by DET or Colleges.
The examination then focused on how DET and Colleges were responding to these trends. Training purchased from the Colleges accounts for over 90 per cent of DET’s total training purchases.
We reviewed DET’s management, monitoring and planning and reviewed information from Colleges. We interviewed key staff and reviewed performance documentation at both DET and Colleges. We also met with a range of stakeholders.
The AVETMISS data includes the VET in Schools program offered to students of school age at the TAFE Colleges. While this has increased over the last fi ve years, it remains a small proportion of VET course enrolments (six per cent in 2007).
VOCATIONAL EDUCATION AND TRAINING IS INTENDED TO BE RESPONSIVE AND FLEXIBLE IN MEETING THE NEEDS OF EMPLOYERS AND STUDENTS (CONTINUED)

Auditor General for Western Australia 15
We excluded WAAPA from our examination of how Colleges are responding to trends because it is both highly specialised in the small number of courses it offers (only 0.3 per cent of courses) and it has a very small number of students accounting for just over one per cent of all training delivered. The AVETMISS data we analysed includes WAAPA, but the impact of that on overall trends is none or immaterial.
We excluded privately funded training and Adult Community Education – courses paid for by students, mainly undertaken for self interest and not linked to a qualifi cation.

RESPONDING TO CHANGES IN ATTRACTION, RETENTION AND ACHIEVEMENT IN VOCATIONAL EDUCATION AND TRAINING
16 Auditor General for Western Australia
Key Findings DET and training providers have responded to increased demand for Apprentices and
Trainees by increasing enrolments 72 per cent and 27 per cent respectively since 2003.
Enrolments in publicly funded IBT have dropped by over 10 per cent (10 000 enrolments) since 2003.
Objectives to increase enrolments overall, within certain occupations and amongst higher level courses are not being met:
the proportion of the population engaged in publicly funded VET has fallen since 2003 by around 6 000 students each year to 2007
enrolments in some IBT areas of high industry need are down by between 23 and 60 per cent
IBT enrolments by older people (30+) looking to up-skill or re-skill are down by about 12 per cent since 2003
enrolments in higher level IBT qualifi cations (Certifi cate III and above) were 18 per cent lower (11 000) in 2007 than 2003, with Advanced Diploma enrolments down by more than half.
DET and Colleges’ planning limits their ability to improve IBT enrolments:
by planning on a yearly basis DET and Colleges limit their ability to align student enrolments with industry demand
some Colleges are starting to implement initiatives aimed at increasing enrolments in IBT but it is too early to know if they have been effective.
Recommendations DET should:
Adjust planning timeframes so that Colleges can better align student enrolments with industry demand, and consider ways for delivery agreements to best fi t with the new planning timeframes.
DET and Colleges should:
Implement strategies, such as workplace based delivery, to attract more IBT students.
Apprentice and Trainee enrolments are going up but Institutional Based Training enrolments are falling
Auditor General for Western Australia 17
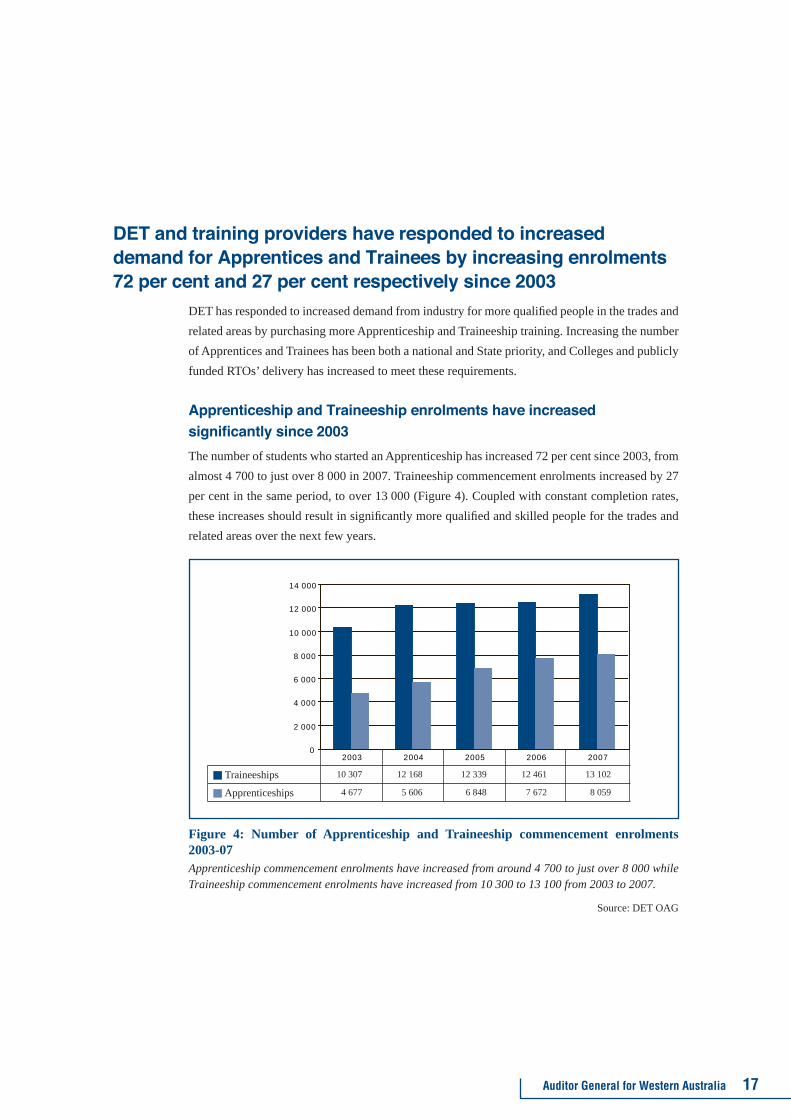
DET and training providers have responded to increased demand for Apprentices and Trainees by increasing enrolments 72 per cent and 27 per cent respectively since 2003 DET has responded to increased demand from industry for more qualifi ed people in the trades and
related areas by purchasing more Apprenticeship and Traineeship training. Increasing the number of Apprentices and Trainees has been both a national and State priority, and Colleges and publicly funded RTOs’ delivery has increased to meet these requirements.
Apprenticeship and Traineeship enrolments have increased signifi cantly since 2003
The number of students who started an Apprenticeship has increased 72 per cent since 2003, from almost 4 700 to just over 8 000 in 2007. Traineeship commencement enrolments increased by 27 per cent in the same period, to over 13 000 (Figure 4). Coupled with constant completion rates, these increases should result in signifi cantly more qualifi ed and skilled people for the trades and related areas over the next few years.
Figure 4: Number of Apprenticeship and Traineeship commencement enrolments 2003-07
Apprenticeship commencement enrolments have increased from around 4 700 to just over 8 000 while Traineeship commencement enrolments have increased from 10 300 to 13 100 from 2003 to 2007.
Source: DET OAG
Traineeships 10 307 12 168 12 339 12 461 13 102
Apprenticeships 4 677 5 606 6 848 7 672 8 059
0
2 000
4 000
6 000
8 000
10 000
12 000
14 000
2003 2004 2005 2006 2007
RESPONDING TO CHANGES IN ATTRACTION, RETENTION AND ACHIEVEMENT IN VOCATIONAL EDUCATION AND TRAINING
18 Auditor General for Western Australia
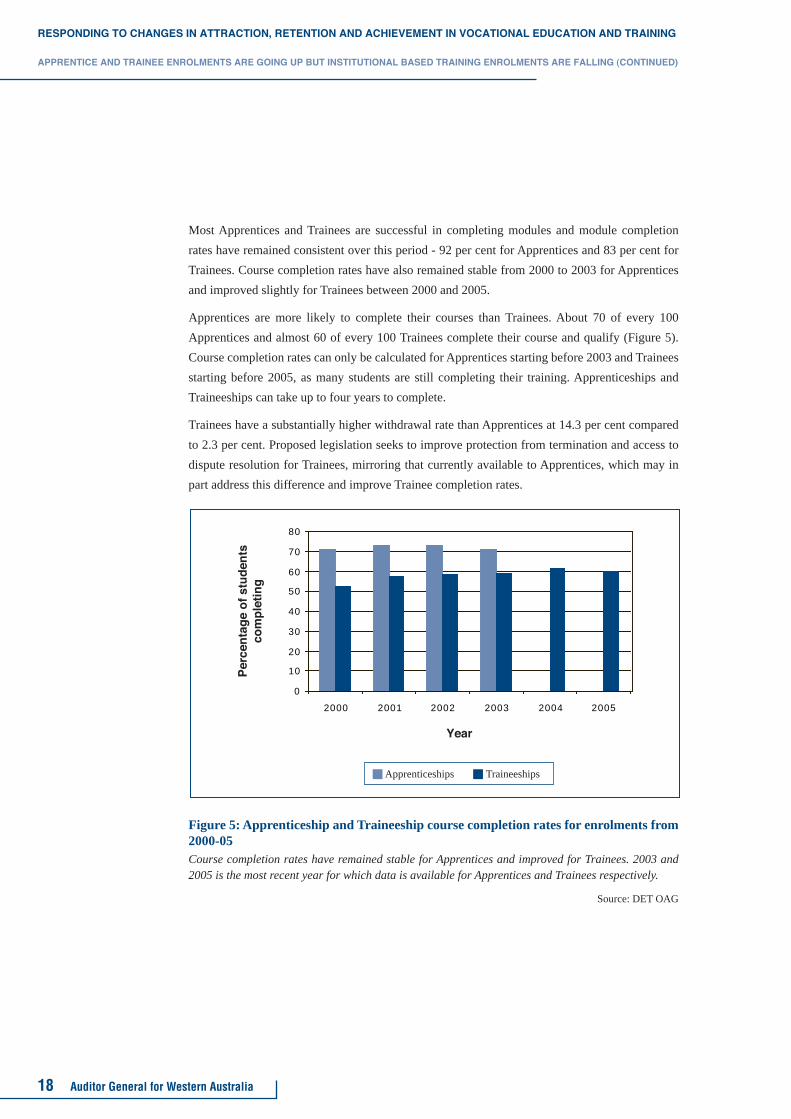
Most Apprentices and Trainees are successful in completing modules and module completion rates have remained consistent over this period - 92 per cent for Apprentices and 83 per cent for Trainees. Course completion rates have also remained stable from 2000 to 2003 for Apprentices and improved slightly for Trainees between 2000 and 2005.
Apprentices are more likely to complete their courses than Trainees. About 70 of every 100 Apprentices and almost 60 of every 100 Trainees complete their course and qualify (Figure 5). Course completion rates can only be calculated for Apprentices starting before 2003 and Trainees starting before 2005, as many students are still completing their training. Apprenticeships and Traineeships can take up to four years to complete.
Trainees have a substantially higher withdrawal rate than Apprentices at 14.3 per cent compared to 2.3 per cent. Proposed legislation seeks to improve protection from termination and access to dispute resolution for Trainees, mirroring that currently available to Apprentices, which may in part address this difference and improve Trainee completion rates.
Figure 5: Apprenticeship and Traineeship course completion rates for enrolments from 2000-05
Course completion rates have remained stable for Apprentices and improved for Trainees. 2003 and 2005 is the most recent year for which data is available for Apprentices and Trainees respectively.
Source: DET OAG
APPRENTICE AND TRAINEE ENROLMENTS ARE GOING UP BUT INSTITUTIONAL BASED TRAINING ENROLMENTS ARE FALLING (CONTINUED)
Apprenticeships Traineeships
Per
cen
tag
e o
f st
ud
ents
co
mp
leti
ng
Year
0
10
20
30
40
50
60
70
80
2000 2001 2002 2003 2004 2005
Auditor General for Western Australia 19
DET and Colleges have been implementing strategies to improve attraction, retention and achievement in Apprenticeships and Traineeships
DET and Colleges are implementing attraction, retention and achievement strategies in Apprenticeships and Traineeships. Many of these strategies are based on the recommendations of the Skills Formation Taskforce. The Taskforce was a consultative initiative undertaken with industry to develop strategies to reform the Apprenticeship and Traineeship system. In 2006, the Taskforce identifi ed strategies including shortening courses, engaging industry more closely, providing fi nancial incentives for students and heavy promotion to the target 15 to 24 year old group.
Since the implementation of the recommendations, enrolments have continued to improve while retention has remained stable. The improvement in enrolments is partly due to increased employer support and engagement.
In addition to the Taskforce recommendations, DET and Colleges have introduced a national program to improve the literacy and numeracy of students. A course in applied vocational study skills has been introduced into all but one of the TAFE Colleges. This program is mainly available to Apprentices and Trainees who lack the basic literacy and numeracy skills to successfully participate in the training.
The program is intended to improve student retention and completion. This is also in line with good practice, which suggests identifying and addressing gaps in basic literacy and numeracy skills enables students to effectively engage with the content of their training.
RESPONDING TO CHANGES IN ATTRACTION, RETENTION AND ACHIEVEMENT IN VOCATIONAL EDUCATION AND TRAINING
20 Auditor General for Western Australia
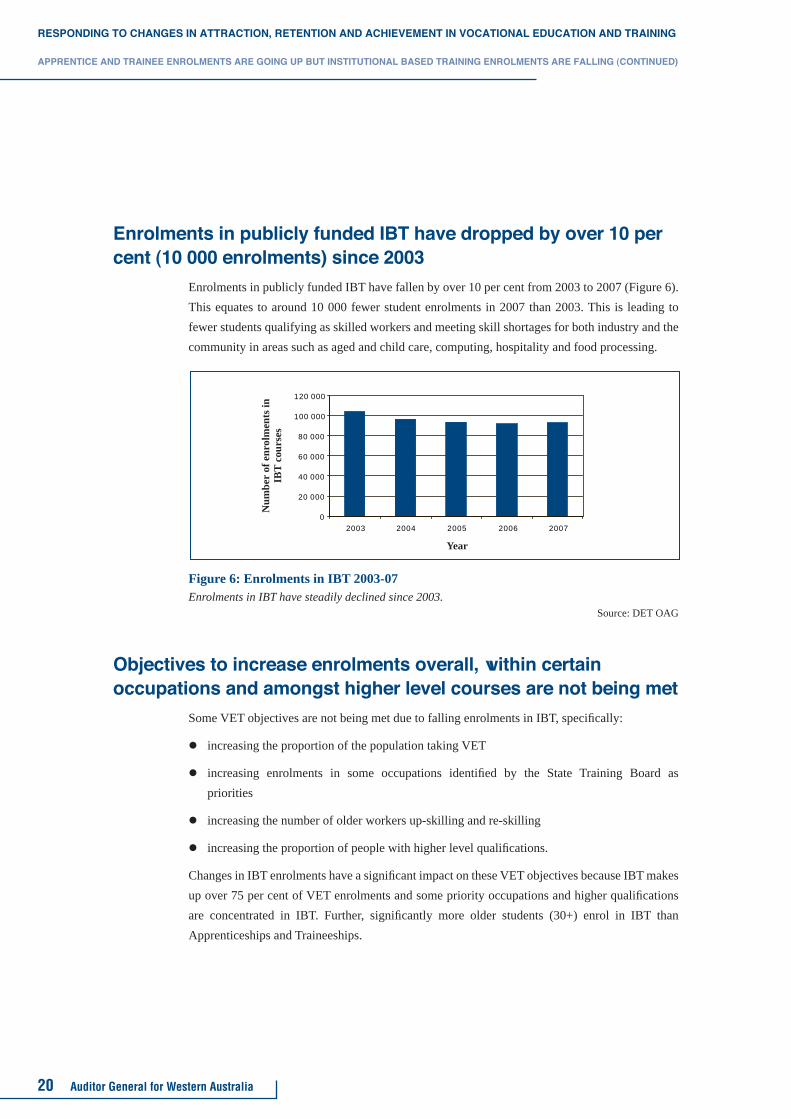
Enrolments in publicly funded IBT have dropped by over 10 per cent (10 000 enrolments) since 2003 Enrolments in publicly funded IBT have fallen by over 10 per cent from 2003 to 2007 (Figure 6).
This equates to around 10 000 fewer student enrolments in 2007 than 2003. This is leading to fewer students qualifying as skilled workers and meeting skill shortages for both industry and the community in areas such as aged and child care, computing, hospitality and food processing.
Figure 6: Enrolments in IBT 2003-07 Enrolments in IBT have steadily declined since 2003.
Source: DET OAG
Objectives to increase enrolments overall, within certain occupations and amongst higher level courses are not being met Some VET objectives are not being met due to falling enrolments in IBT, specifi cally:
increasing the proportion of the population taking VET
increasing enrolments in some occupations identifi ed by the State Training Board as priorities
increasing the number of older workers up-skilling and re-skilling
increasing the proportion of people with higher level qualifi cations.
Changes in IBT enrolments have a signifi cant impact on these VET objectives because IBT makes up over 75 per cent of VET enrolments and some priority occupations and higher qualifi cations are concentrated in IBT. Further, signifi cantly more older students (30+) enrol in IBT than Apprenticeships and Traineeships.
Num
ber
of e
nrol
men
ts in
IB
T co
urse
s
Year
APPRENTICE AND TRAINEE ENROLMENTS ARE GOING UP BUT INSTITUTIONAL BASED TRAINING ENROLMENTS ARE FALLING (CONTINUED)
0
20 000
40 000
60 000
80 000
100 000
120 000
2003 2004 2005 2006 2007

Auditor General for Western Australia 21
The proportion of the population engaged in publicly funded VET has fallen since 2003 – by around 6 000 students each year to 2007
The proportion of 15 to 64 year olds enrolled in VET (the participation rate) at publicly funded Colleges and RTOs has fallen slightly from 7.5 per cent in 2003 to seven per cent in 2007, with student numbers staying stable at around 100 000. Over the same period the Western Australian population of 15 to 64 olds has increased by 110 000 people to 1.44 million. If the participation rate had remained at 7.5 per cent of the population, we estimate that a further 26 000 students (around 6 000 to 7 000 students per year) would have enrolled to 2007.
Enrolments in some IBT areas of high industry need are down by between 23 and 60 per cent since 2003
Enrolments in publicly funded IBT are falling in a number of occupational groups identifi ed by industry, DET and TAFE as essential in supporting economic growth and a growing population. The State Training Board has identifi ed the need to improve rates of training in the non–trade sector to ensure services to the community are sustained. The Board identifi ed emerging or existing skill shortages in a number of IBT areas including community services, computing, and electrical and electronic engineering.
IBT enrolment levels are not improving in these priority areas. For example, community service course enrolments (such as aged and child care) have fallen 23 per cent over the last fi ve years. Traineeships in community services may offset this fall to some extent. Enrolments in computing and electrical and electronic engineering have declined even more, down by 60 and 40 per cent respectively since 2003. If this trend continues, there will be a signifi cant shortfall of skilled workers entering these key industries.
Colleges often cannot deliver what they contracted to in the performance agreements because student choices rarely match closely the planned mix of delivery. Colleges, with the agreement of the Department, can make changes to their agreements at two points in the year. Colleges are moving training from courses with fewer enrolments, to ones with higher enrolments.
This enables Colleges to meet their overall targets for training delivery but the mix of courses delivered can be very different to those identifi ed in State Training Board and DET plans.
RESPONDING TO CHANGES IN ATTRACTION, RETENTION AND ACHIEVEMENT IN VOCATIONAL EDUCATION AND TRAINING
22 Auditor General for Western Australia
CASE EXAMPLE Community Services at West Coast TAFE
In 2007, West Coast TAFE agreed to deliver over 180 000 Student Curriculum Hours (SCH) of training in community service courses. In consultation with DET, West Coast TAFE reduced this by 69 000 SCH. This was due to a lack of enrolments. Hours were increased in science and technology (45 000 SCH), sport and recreation (13 000 SCH), and entertainment and personal services (12 000 SCH).
Reductions in community service training hours also occurred at Central, Swan and Challenger TAFE.
IBT enrolments by older people (30+) looking to up-skill or re-skill are down by 12 per cent since 2003
Our analysis of DET and college data found that over half of the decline in IBT enrolments since 2003 has been amongst older (30+) people. Older people tend to enrol in IBT courses, while Apprentices and Trainees tend to be young people.
Since 2003, enrolments by older people have fallen by 12 per cent (5 400). Reversing this decline in the rates of re-skilling and up-skilling older workers is now a signifi cant challenge for VET.
Enrolments in higher level IBT qualifi cations (Certifi cate III and above) were 18 per cent (11 000) lower in 2007 than 2003, with Advanced Diploma enrolments down by more than half
DET’s strategic objective, introduced at the start of 2007, to increase the number of enrolments in a Certifi cate III and above qualifi cation will be diffi cult to meet. Enrolments for these qualifi cations in IBT have dropped by 18 per cent over the fi ve years from 2003 to 2007. Reversing this trend will be a signifi cant challenge requiring highly effective strategies.
DET considers increasing the number of people in the workforce with higher level qualifi cations to be key to maintaining and improving competitiveness and productivity. A higher level qualifi cation is defi ned as Certifi cate III or above. A Certifi cate III in IBT can lead to junior or intermediate levels in clerical, sales and service work. Higher qualifi cations such as Certifi cate IV, Diplomas and Advanced Diplomas require greater knowledge and higher skill levels.
Although Apprenticeships and some Traineeships are Certifi cate III level qualifi cations, most of the higher level (Certifi cate IV and above) qualifi cations are in IBT, so IBT enrolments are critical in meeting this objective. Fewer students are enrolling in these IBT higher level qualifi cations.
APPRENTICE AND TRAINEE ENROLMENTS ARE GOING UP BUT INSTITUTIONAL BASED TRAINING ENROLMENTS ARE FALLING (CONTINUED)
Auditor General for Western Australia 23
The fall in enrolments among older people also has an impact in this area. Older students tend to enrol in higher level qualifi cations whereas younger students enrol in the lower Certifi cate level courses (Certifi cate I and II). Although full time young students (15 to 24) are still enrolling in IBT in stable numbers, this will not help meet the objective to increase higher level skills in the workforce.
CASE EXAMPLE Advanced Diplomas in IBT
An Advanced Diploma is the highest qualifi cation that can be achieved through VET. Enrolments have dropped signifi cantly since 2003, falling from nearly 4 000 to just over 1 800 in 2007. This is a decline of over 50 per cent in fi ve years. Although retention has improved by 7.6 per cent the number of students gaining an Advanced Diploma will fall.
DET and Collegesʼ planning limits their ability to improve IBT enrolments
DET and Colleges have limited or no infl uence over some key elements in attracting students, such as wider economic and industrial factors
The ability to attract students to VET, and specifi cally to IBT, is affected by a range of factors, some of which can be managed by DET and Colleges and some of which are outside their control.
Factors that may affect demand for training and to which DET and Colleges need to respond but cannot directly control include:
the industrial environment; such as wages and conditions and the level of casual and contract employment
the economic environment; such as levels of competition and business activity
student choices; which are infl uenced by industrial and economic conditions.
Recent research by the State Training Board indicates that the recent strong labour market in Western Australia reduces the attractiveness of VET, as potential students can readily gain full time employment. In addition, when experiencing labour shortages, employers may be reluctant to allow employees ‘time off’ to participate in training. This issue has impacts beyond VET, Western Australian Universities have also been experiencing a decline in student intake.
RESPONDING TO CHANGES IN ATTRACTION, RETENTION AND ACHIEVEMENT IN VOCATIONAL EDUCATION AND TRAINING
24 Auditor General for Western Australia
There is also increased competition for the fewer potential students choosing training or education. Colleges believe that a signifi cant number of their former school leaver intake are being attracted into universities when, in the past, they would not have met the entrance requirements.
There are a number of factors which DET and Colleges can directly control in responding to enrolment trends, including:
the supply of training to meet current industry and community needs
the anticipation of, and provision for, future training needs
the degree of fl exibility in delivering training.
Existing processes and approaches, however, limit DET and Colleges’ ability to change the factors they can control.
By planning on a yearly basis DET and Colleges limit their ability to align student enrolments with industry demand
To meet industry demand, Colleges need to develop and have the time to implement long term strategies for aligning student enrolments with industry demand. This is because it can take three years or more to match student attraction to industry’s needs identifi ed in the State’s annual training plan and DET’s requirements in performance agreements.
The State Training Board has previously developed the plan based on a one year planning cycle and performance agreements are for single years. This limits the extent to which Colleges can develop and implement long term strategies to manage the effect of the lag in changing student enrolments. Instead, Colleges change the mix of courses they provide in a given year to match the pattern of enrolments in that year. Although this allows Colleges to meet their annual aggregate targets for training delivery it does not encourage them to match student enrolments with industry needs. Over time, this can result in the mix of skilled people leaving VET being different to that required by industry.
The Board has reviewed its planning process and is moving to a training plan that defi nes requirements over three years. The Board intends for this to be fully implemented by 2010. The change should allow time for DET and Colleges to adjust training delivery in meaningful ways and for student choices to adjust to industry needs. If the plan moves to a three year timeframe, then the performance agreements should refl ect this.
APPRENTICE AND TRAINEE ENROLMENTS ARE GOING UP BUT INSTITUTIONAL BASED TRAINING ENROLMENTS ARE FALLING (CONTINUED)

Auditor General for Western Australia 25
Some Colleges are starting to implement initiatives aimed at increasing enrolments in IBT but it is too early to know if they have been effective
Colleges are starting to change the way they deliver training to boost enrolments. For example, DET and Colleges believe that increasing workplace based training and making delivery more fl exible will attract more students because it removes the apparent ‘either/or’ choice of work or VET. These changes are to delivery content, time and place. They involve:
providing more training in the workplace. This includes matching training to specifi c enterprise needs (‘just in time training’, skill sets and enterprise specifi c staff development)
increasing skills recognition (prior learning including assessment in the workplace)
increasing use of technology (online learning, self paced learning, video conferencing).
These are relatively recent initiatives which are not yet fully implemented. Consequently it is too early to assess whether they will have the intended effect of increasing enrolments in IBT.
CASE EXAMPLE Challenger TAFE
Challenger TAFE is implementing a delivery model in close partnership with industry and community agencies. The model moves delivery from the classroom to the workplace. It also provides workforce planning and development services benefi ting industry, regions and communities.
Challenger’s target is to deliver 65 per cent of training in the workplace and/or as part of workforce planning initiatives by 2011.
An example of this training is in Children’s Services. Local child care centre employees enrol at any time throughout the year and gather evidence to show competency. Evidence includes training record books, workplace journals and skill set tasks. Students have access to a TAFE facilitator to assist with their evidence gathering. Online material has been developed to directly link to units of competency. Lecturers assess students in the workplace.

RESPONDING TO CHANGES IN ATTRACTION, RETENTION AND ACHIEVEMENT IN VOCATIONAL EDUCATION AND TRAINING
26 Auditor General for Western Australia
Key Findings There is scope for DET and Colleges to improve IBT retention and achievement which
would improve outcomes:
students withdraw from or fail 28 per cent of IBT modules
DET and Colleges do not know how many students complete their IBT courses. Estimates made in 2002 were that only 16 per cent complete their course
there are signifi cant variations in module withdrawal and failure rates across Colleges and courses, indicating potential for improvement.
DET’s funding of Colleges provides no direct incentive for student retention and achievement:
DET contracts and funds Colleges to deliver specifi ed hours of training not numbers of skilled or qualifi ed students
Colleges retain funding whether or not a student stays and completes a module or course
if Colleges had to pay a refund for IBT module withdrawals we estimate this would have cost them almost $20 million in 2007.
DET and Colleges lack adequate information about student progress and outcomes which reduces their capacity to devise successful strategies to improve retention and achievement.
DET and Colleges are not consistent or systematic in identifying students at risk of withdrawing or failing and while most have support strategies they focus on equity groups rather than risk factors across the wider student community.
Student retention and achievement can improve but DET and Colleges would need better systems and strategies

Auditor General for Western Australia 27
Recommendations DET should:
Know how many students complete their IBT courses.
Provide incentives to Colleges to improve retention and achievement and focus delivery agreements more on outcomes than inputs.
DET and Colleges should:
Improve and report information on the way students engage with VET, and the range of outcomes achieved including skill sets, specifi cally through the introduction of a unique student identifi er.
Colleges should:
Implement strategies to improve retention and achievement to improve productivity and deliver better outcomes within funding constraints.
Provide the public with performance information including withdrawal, failure and completion rate information to improve transparency and accountability for performance.
There is scope for DET and Colleges to improve IBT retention and achievement which would improve outcomes Historically, DET and Colleges have used increases in enrolments as their key strategy for
increasing the number of skilled workers. One way for DET and Colleges to address the impact on outcomes of declining enrolments in IBT is to focus on lifting retention and achievement. Current rates of withdrawal and non-completion in publicly funded IBT, and the signifi cant variations in these rates between Colleges and across courses, show that scope for improvement exists. This would improve outcomes and productivity.
Students withdraw from or fail 28 per cent of IBT modules
Having enrolled in a module, students in IBT complete around 72 of every 100 modules. Of the 28 per cent of modules not completed, half are not completed because the student withdraws and half because students do not meet the skill levels required to be assessed as competent. In comparison, module completion rates are over 90 per cent for Apprentices and over 80 per cent for Trainees.

RESPONDING TO CHANGES IN ATTRACTION, RETENTION AND ACHIEVEMENT IN VOCATIONAL EDUCATION AND TRAINING
28 Auditor General for Western Australia
DET and Colleges do not know how many students complete their IBT courses. Estimates made in 2002 were that only 16 per cent complete their course
DET and Colleges do not measure how many IBT students have completed their courses and qualifi ed. The most recent estimate was done in 2002 based on 2000 data and showed that less than one in fi ve students (16 per cent) completed an IBT course (Figure 7). As with module completion, this is signifi cantly less than Apprenticeship and Traineeship course completion rates which are around 70 per cent for Apprentices and 60 per cent for Trainees.
Apprentices and Trainees have an incentive to complete their modules and courses as successful completion is linked to their contract with their employer. IBT students do not have this incentive to stay and complete modules and courses. While course completion may not be the sole meaningful outcome for all students, different approaches are required from DET and Colleges to retain IBT students.
Figure 7: Estimated IBT course completion rates It is estimated that fewer than one in fi ve IBT students complete a course.
Source: DET OAG
There are signifi cant variations in module withdrawal and failure rates across Colleges and courses, indicating potential for improvement
Variations in IBT retention and achievement exist between Colleges and across courses. Better outcomes could be achieved if the poorer performers moved closer to the best performer. In 2007, overall IBT withdrawal rates across Colleges varied from nine per cent to 19 per cent. Within this range, rates at the metropolitan Colleges varied from 11 per cent to 18 per cent (Figure 8).
STUDENT RETENTION AND ACHIEVEMENT CAN IMPROVE BUT DET AND COLLEGES WOULD NEED BETTER SYSTEMS AND STRATEGIES (CONTINUED)
Completed
Did not complete

Auditor General for Western Australia 29
Figure 8: Differences in IBT module withdrawal rates across Colleges in 2007 There are signifi cant differences in withdrawal rates between Colleges from the lowest at nine per cent
to the highest of 19 per cent.Source: DET OAG
Withdrawal rates between Colleges for the same IBT occupational groupings showed similarly wide variation. As an example, withdrawals in the Community Services grouping ranged from a low of less than fi ve per cent, to almost 20 per cent.
IBT module failure rates also varied signifi cantly between Colleges, ranging from four per cent to 22 per cent, again indicating potential for improvement (Figure 9).
Figure 9: Differences in IBT module failure rates across Colleges in 2007 There are signifi cant variations in IBT module failure rates across the Colleges.
Source: DET OAG
Failure Rate 4% 9% 9% 11% 12% 12% 13% 14% 16% 17% 22%
0
5%
10%
15%
20%
25%
Curtin CY Great Swan Pilbara Central West South Challenger Central Kimberley
VTEC OʼConnor Southern West Coast West West
Withdrawal Rate 9% 11% 11% 12% 12% 12% 15% 16% 16% 18% 19%
Kimberley Challenger South Great Pilbara Curtin Central Central West Swan CY West Southern VTEC West Coast OʼConnor
0%
5%
10%
15%
20%

RESPONDING TO CHANGES IN ATTRACTION, RETENTION AND ACHIEVEMENT IN VOCATIONAL EDUCATION AND TRAINING
30 Auditor General for Western Australia
Colleges believe there will be differences in retention and achievement across Colleges because of the different make-up of student intakes. Research shows that while there are a number of factors which relate to the make-up of a student intake that are indicators of student retention, there are also program based indicators. The size and nature of current variations indicate that multiple student and program factors may be involved. The variations also indicate that there are some areas of better performance from which other Colleges could learn.
DET and Colleges’ understanding of which factors are infl uencing performance is limited. Unless DET and Colleges understand which factors are driving retention their capacity to design strategies to improve is limited.
Colleges have Minimum Entry Requirements (MERs) for some courses. These are intended to ensure that students who enter a course have the skills and experience to have reasonable prospects of staying and completing the course. MERs should therefore mitigate the part that differences in student cohorts play in causing differences between Colleges in withdrawal and failure rates. Research has identifi ed that MERs help to ensure that students are not accepted into courses that they will struggle to cope with, and those who are accepted who either do not or only just meet MERs tend to be those who withdraw or fail. Given that funding currently incentivises Colleges to maximise enrolments it is important that MERs are set following careful consideration of all interests and that they are applied consistently. MERs have not been set for new courses.
DETʼs funding of Colleges provides no direct incentive for student retention and achievement
DET contracts and funds Colleges to deliver specifi ed hours of training not numbers of skilled or qualifi ed students
DET agree with Colleges how much training should be delivered each year in the Delivery and Performance Agreements. These agreements are a contract between DET, operating under a delegation from the Minister, and each College. These specify the amount of training required in hours (inputs) rather than the numbers and mix of skilled or qualifi ed students (outcomes). The performance agreements do not require Colleges to achieve specifi ed retention or completion rates.
STUDENT RETENTION AND ACHIEVEMENT CAN IMPROVE BUT DET AND COLLEGES WOULD NEED BETTER SYSTEMS AND STRATEGIES (CONTINUED)

Auditor General for Western Australia 31
Colleges retain funding whether or not a student stays and completes a module or course
Colleges have few fi nancial incentives to improve retention or achievement. The current funding model focuses on enrolments with little emphasis on student achievement. Although Colleges must repay funds to DET if they do not achieve target enrolment numbers, they retain their funding whether or not a student stays and completes.
Colleges are funded when a student enrols and engages in training at the start of a module. Typically this is a fairly basic level of participation such as attendance in the fi rst two weeks, completing the fi rst piece of coursework or logging into an online module. The College receives and retains funding for the enrolment irrespective of whether the student completes that module or goes on to complete a course or qualifi cation. There is no funding incentive or penalty for Colleges attached to student retention or module and/or course completion.
Research and practice elsewhere has identifi ed that adopting an outcome focused funding model with appropriate incentives can be a key element in improving retention and achievement.
If Colleges had to pay a refund for IBT module withdrawals we estimate this would have cost them almost $20 million in 2007
We estimate that if Colleges had to pay a refund to DET for student withdrawals on the same basis as for missed target enrolment numbers, in 2007 IBT module withdrawals would have cost Colleges $19.4 million, and Apprenticeship and Traineeship withdrawals just over $2 million. The majority of withdrawals occurred in IBT, where DET paid for training that was either not fully delivered or not delivered at all because students withdrew.
Withdrawals result in students not receiving the training and skills for which they enrolled and which Colleges were funded to provide. This means some of the funding provided to the Colleges is not productive in delivering skills to students. There is also an opportunity cost to the student who could be in other training or employment.
Reductions in the withdrawal rate would assist in achieving VET objectives without an increase in funding. More students would acquire the skills they set out to get when they enrolled, which would reduce opportunity cost. For industry and the community it would improve outcomes by providing a more skilled workforce.

RESPONDING TO CHANGES IN ATTRACTION, RETENTION AND ACHIEVEMENT IN VOCATIONAL EDUCATION AND TRAINING
32 Auditor General for Western Australia
DET and Colleges lack adequate information about student progress and outcomes which reduces their capacity to devise successful strategies to improve retention and achievement DET and Colleges lack information systems and outcome measures to track and analyse student
progress and achievement. This limits DET and Colleges’ understanding of how students, in practical ways, use the system. It reduces their ability to adapt training to changing patterns of student use and to improve retention.
The training outcomes that DET and Colleges measure do not capture the full range of student outcomes including skill sets
DET and Colleges have observed that more students are enrolling to gain specifi c skills for their current job. Since the mid 1990s, approximately half of student enrolments in VET have resulted in completion of one or more modules rather than a qualifi cation. This suggests students are looking for selected skills rather than a qualifi cation. VET has responded by developing nationally recognised statements of attainment acknowledging students have acquired a skill set.
Current measures of completion do not include statements of attainment or students who have gained nationally recognised skill sets. Colleges provide statements of attainment (modules completed) but they do not always equate to any recognised skill set, course or qualifi cation and there is no consistent approach to issuing them. DET recognise this gap in their information on student progress and outcomes. Completion rates could be more meaningful if they captured students seeking skill sets as well as qualifi cations. For some students and occupation groups the number of completed modules, representing the units of skill or competency achieved, may better refl ect student progress and outcomes. Qualifi cations would remain a key measure for other courses and student groups.
DET systems cannot provide adequate information about student progress
The current information on IBT student achievement is limited to module completion rates. This is a signifi cant weakness for IBT as courses can be made up of multiple combinations of modules, creating numerous possible routes for students. DET and College information systems have not been designed to effectively track these multiple routes.
STUDENT RETENTION AND ACHIEVEMENT CAN IMPROVE BUT DET AND COLLEGES WOULD NEED BETTER SYSTEMS AND STRATEGIES (CONTINUED)

Auditor General for Western Australia 33
One reason that information is limited is that there is no unique student identifi er that allows Colleges and DET to track student progress and achievement. A unique student identifi er would result in DET and Colleges being able to identify and count:
if students are gaining skill sets and not completing qualifi cations, and/or
the number of students who complete qualifi cations.
Without a unique student identifi er, course completion is only recognised when a student applies to the College to graduate and receive a qualifi cation. The award of a qualifi cation currently relies on a student applying, rather than reliable data on when a student has met the requirements of course completion and qualifi cation award.
DET are not using the variations between Colleges to help identify good practice and areas for improvement
DET does very little monitoring of variations in performance between Colleges. Although DET collects detailed information from the Colleges, they assess this information at a State level. By not analysing and comparing performance variations between Colleges, DET cannot identify the Colleges and specifi c courses that are performing well or poorly. If this information was known, DET could establish the reasons behind good performance and inform other Colleges and recommend they implement similar practices. This would result in improvements to overall performance.
There is little information available to students about College achievement rates
While Colleges report an overall student satisfaction rate and employment rate, there is very little publicly available information to enable students to compare retention and achievement rates of Colleges and courses when making enrolment decisions. For instance, in their annual reports, no College reported their latest retention rates or course completion rates, and only two Colleges reported module completion rates.
Providing this information could result in students enrolling at those Colleges with higher course retention and achievement rates. Improved retention and achievement rates would attract more students and provide a funding related incentive for Colleges. Colleges believe that word of mouth from existing to prospective students is a powerful marketing tool. This provides some incentive to try to ensure students have a good training experience, and stay and get the skills for which they enrolled.
RESPONDING TO CHANGES IN ATTRACTION, RETENTION AND ACHIEVEMENT IN VOCATIONAL EDUCATION AND TRAINING
34 Auditor General for Western Australia
DET and Colleges are not consistent or systematic in identifying students at risk of withdrawing or failing and while most have support strategies, they focus on equity groups rather than risk factors across the wider student community Colleges do not have a consistent or systematic approach to assessing their students for risk
factors to identify students whose chances of achievement could be improved through additional support.
DET and Colleges have implemented some strategies aimed at improving retention and achievement. The majority of these strategies are targeted at specifi c student groups or risk factors in specifi c courses, for example, literacy and numeracy in Apprenticeships and Traineeships. Identifying students who need support relies on the students identifying themselves on their enrolment forms as being part of a target group. However, there is no systematic way to identify and support students who fall outside the target groups or have different retention and achievement risk factors, and DET and Colleges do not have a consistent set of strategies aimed at improving retention and achievement for all students and courses.
There is insuffi cient focus on addressing risk factors that are not limited to a particular student group or course, for instance students who are getting behind with their work or on track not to complete. While providing support to disadvantaged students is important, it is also necessary to address the causes of poor achievement and withdrawal across the wider student community.
State, national and international research has identifi ed a consistent set of factors that infl uence whether a student will be at risk of poor achievement. This could provide the basis for strategies to improve retention and achievement.
The key factors which indicate that a student may be at risk of not completing include:
being on track to not complete any of the modules enrolled in (and getting behind with assessments)
undertaking VET for the fi rst time
the type of study – part-time students are more likely to withdraw and Apprentices more likely to complete
low prior education levels
STUDENT RETENTION AND ACHIEVEMENT CAN IMPROVE BUT DET AND COLLEGES WOULD NEED BETTER SYSTEMS AND STRATEGIES (CONTINUED)
Auditor General for Western Australia 35
disadvantaged and lower socio-economic backgrounds
indigenous students
non-English speaking backgrounds
undertaking adult literacy, English as a second language and access and equity program courses.
Enrolment data collected by Colleges would allow them to identify students with one or more of these risk factors. None of the Colleges routinely assess their students on this basis and do not identify those students whose achievement could be improved through additional support.
The annual Western Australian Student Outcomes Survey, conducted by DET, asks those students who had completed at least one module but not their course, to identify their reasons for not continuing (this survey does not cover students who did not complete any modules). In the 2007 survey 30 per cent identifi ed that training did not meet their needs, or that they stopped for other training related reasons. Reasons included that the training was not what the student expected, it was no longer relevant to their plans, the timetable was not fl exible enough or they had opted to start other training.
Colleges could better understand why training did not meet students’ needs and identify where to make changes in delivery or enrolment processes to improve the likelihood of students completing.
RESPONDING TO CHANGES IN ATTRACTION, RETENTION AND ACHIEVEMENT IN VOCATIONAL EDUCATION AND TRAINING
36 Auditor General for Western Australia
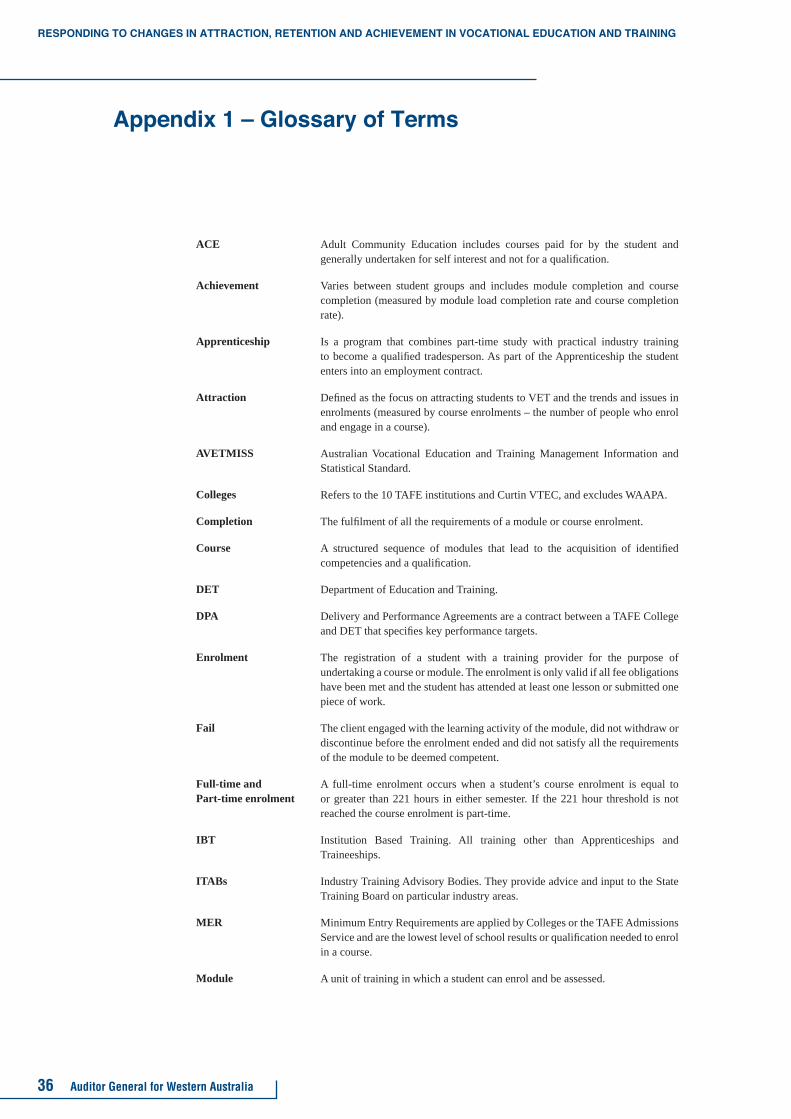
ACE Adult Community Education includes courses paid for by the student and generally undertaken for self interest and not for a qualifi cation.
Achievement Varies between student groups and includes module completion and course completion (measured by module load completion rate and course completion rate).
Apprenticeship Is a program that combines part-time study with practical industry training to become a qualifi ed tradesperson. As part of the Apprenticeship the student enters into an employment contract.
Attraction Defi ned as the focus on attracting students to VET and the trends and issues in enrolments (measured by course enrolments – the number of people who enrol and engage in a course).
AVETMISS Australian Vocational Education and Training Management Information and Statistical Standard.
Colleges Refers to the 10 TAFE institutions and Curtin VTEC, and excludes WAAPA.
Completion The fulfi lment of all the requirements of a module or course enrolment.
Course A structured sequence of modules that lead to the acquisition of identifi ed competencies and a qualifi cation.
DET Department of Education and Training.
DPA Delivery and Performance Agreements are a contract between a TAFE College and DET that specifi es key performance targets.
Enrolment The registration of a student with a training provider for the purpose of undertaking a course or module. The enrolment is only valid if all fee obligations have been met and the student has attended at least one lesson or submitted one piece of work.
Fail The client engaged with the learning activity of the module, did not withdraw or discontinue before the enrolment ended and did not satisfy all the requirements of the module to be deemed competent.
Full-time and Part-time enrolment
A full-time enrolment occurs when a student’s course enrolment is equal to or greater than 221 hours in either semester. If the 221 hour threshold is not reached the course enrolment is part-time.
IBT Institution Based Training. All training other than Apprenticeships and Traineeships.
ITABs Industry Training Advisory Bodies. They provide advice and input to the State Training Board on particular industry areas.
MER Minimum Entry Requirements are applied by Colleges or the TAFE Admissions Service and are the lowest level of school results or qualifi cation needed to enrol in a course.
Module A unit of training in which a student can enrol and be assessed.
Appendix 1 – Glossary of Terms

Auditor General for Western Australia 37
MLCR Module Load Completion Rate measures the SCH for enrolments with successful outcomes expressed as a proportion of SCH for total enrolments.
NCVER National Centre for Vocational Education Research
Pre-Apprenticeships Are foundation qualifi cations that prepare students wanting to undertake Apprenticeships and are undertaken in IBT.
Publicly funded clients
All VET activity funded jointly or separately by the Commonwealth or State Government. SAW funded delivery forms the bulk of publicly funded activity.
Retention Is the extent to which students, once enrolled, stay in training to progress through a module and course (measured by the number of modules students withdraw from or fail).
RTOs Registered Training Organisations are providers and assessors of nationally recognised training. Only RTOs can issue nationally recognised qualifi cations. RTOs can be privately or publicly funded.
SAW Skilling Australia Workforce agreement.
SCH A Student Curriculum Hour is a nominal fi xed curriculum hour value for a module specifi ed by DET and refl ects the volume of training activity occurring.
STB The State Training Board is the main industry training advisory body to the Minister for Education and Training in Western Australia. Its role is to provide advice to the Minister on the supply and demand for skills, particularly those industries that are experiencing skills shortages.
STP The State Training Profi le is prepared by the State Training Board for the Minister of Education and Training. The Profi le provides a planning framework for VET to respond to the current and future skills requirements of industry and business. The Profi le sets out training priorities and targets identifi ed by the STB which are used to inform the planning and purchasing of publicly funded training in Western Australia.
TAC The Training Accreditation Council is WA’s State registering and accrediting course body. It is responsible for quality assurance and recognition of VET services in Western Australia.
TAFE Technical And Further Education Colleges are the primary providers of Government funded VET.
Traineeship This is a program of training and practical industry experience that is generally in a non-trade area. As part of the Traineeship the student enters into an employment contract.
VET Vocational Education and Training, in this report VET refers to the publicly funded components.
Withdraw The client engaged in the learning activity in the module, then withdrew or discontinued (with or without formal notifi cation) before the expected end of the enrolment without undertaking all assessment.

RESPONDING TO CHANGES IN ATTRACTION, RETENTION AND ACHIEVEMENT IN VOCATIONAL EDUCATION AND TRAINING
38 Auditor General for Western Australia
As part of our examination we analysed the Australian Vocational Education and Training Management Information Statistical Standard (AVETMISS) data within the Department of Education and Training (DET). We analysed the data for trends in participation, withdrawal, failure and achievement rates across publicly funded VET from 2003 to 2007. We identifi ed these trends for Apprenticeships and Traineeships, and Institution Based Training.
We analysed key indicators including course enrolments, module enrolments, Student Curriculum Hours (SCH), withdrawal rates, failure rates and Module Load Completion Rates (MLCR). We analysed the data using cross tabulations of the key indicators by Apprenticeships and Traineeships, and Institution Based Training (IBT).
The results of this analysis are in this Appendix and are grouped into:
Overall VET trends (Group 1)
Apprenticeship and Traineeship trends (Group 2)
Individual College trends in IBT (Group 3)
Trends in qualifi cations in IBT (Group 4)
Trends in age groups (Group 5)
Trends in IBT by occupational groups (Group 6).
This analysis and presentation is not routinely conducted or publicly reported by DET. Some elements are included in DET and College annual reports, but are not drawn together, as they are in this Appendix, to provide a consolidated picture of trends in attraction, retention and achievement in VET.
Appendix 2 – Trends in VET - Results of Data Analysis
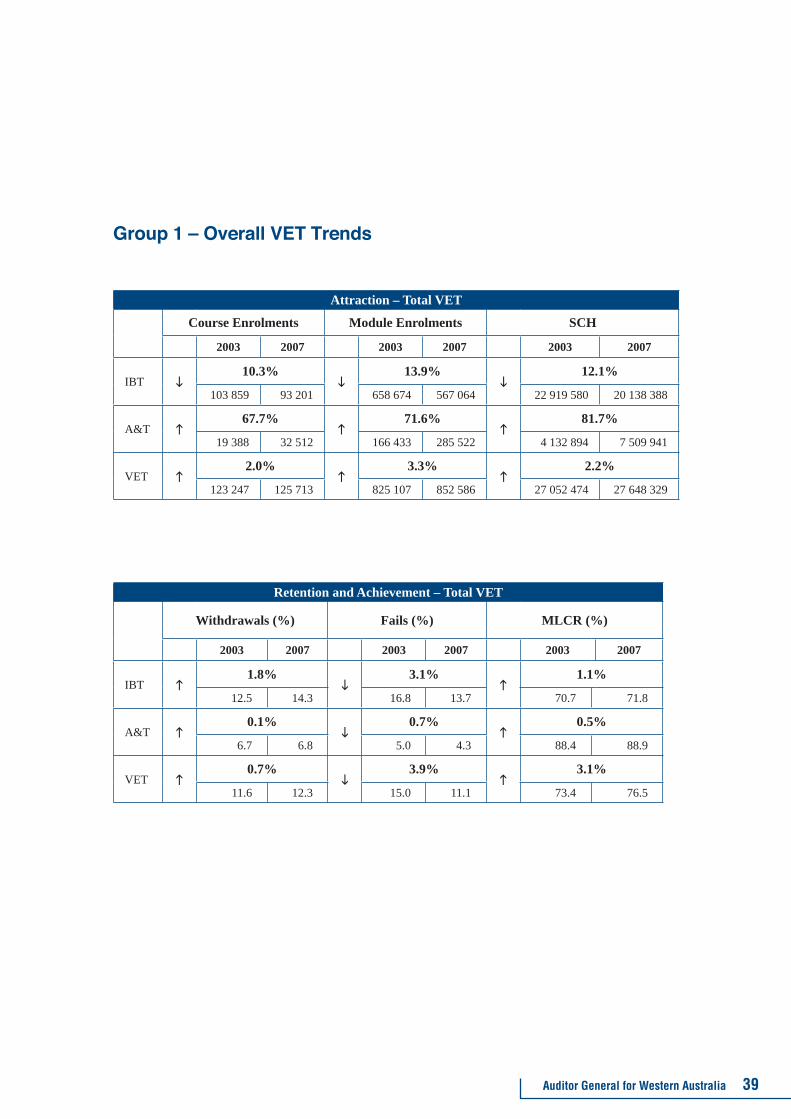
Auditor General for Western Australia 39
Group 1 – Overall VET Trends
Attraction – Total VET
Course Enrolments Module Enrolments SCH
2003 2007 2003 2007 2003 2007
IBT10.3% 13.9% 12.1%
103 859 93 201 658 674 567 064 22 919 580 20 138 388
A&T67.7% 71.6% 81.7%
19 388 32 512 166 433 285 522 4 132 894 7 509 941
VET2.0% 3.3% 2.2%
123 247 125 713 825 107 852 586 27 052 474 27 648 329
Retention and Achievement – Total VET
Withdrawals (%) Fails (%) MLCR (%)
2003 2007 2003 2007 2003 2007
IBT1.8% 3.1% 1.1%
12.5 14.3 16.8 13.7 70.7 71.8
A&T0.1% 0.7% 0.5%
6.7 6.8 5.0 4.3 88.4 88.9
VET0.7% 3.9% 3.1%
11.6 12.3 15.0 11.1 73.4 76.5
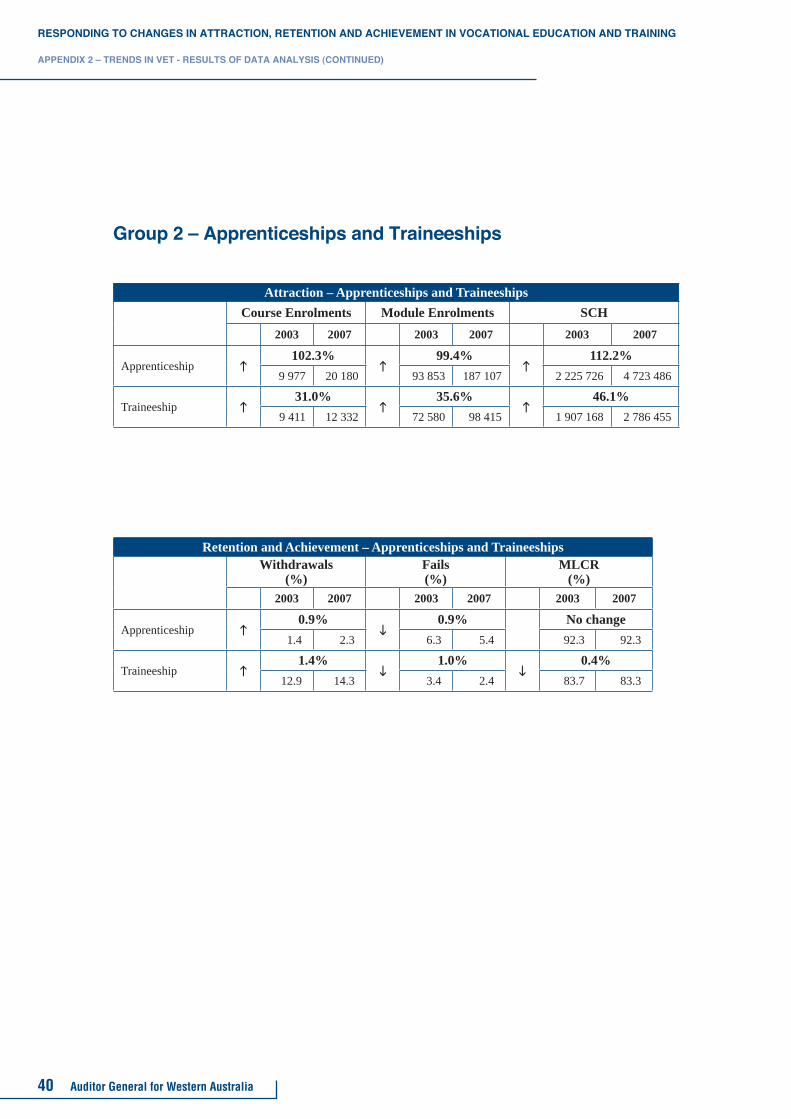
RESPONDING TO CHANGES IN ATTRACTION, RETENTION AND ACHIEVEMENT IN VOCATIONAL EDUCATION AND TRAINING
40 Auditor General for Western Australia
Group 2 – Apprenticeships and Traineeships
Attraction – Apprenticeships and TraineeshipsCourse Enrolments Module Enrolments SCH
2003 2007 2003 2007 2003 2007
Apprenticeship102.3% 99.4% 112.2%
9 977 20 180 93 853 187 107 2 225 726 4 723 486
Traineeship31.0% 35.6% 46.1%
9 411 12 332 72 580 98 415 1 907 168 2 786 455
Retention and Achievement – Apprenticeships and TraineeshipsWithdrawals
(%)Fails(%)
MLCR(%)
2003 2007 2003 2007 2003 2007
Apprenticeship0.9% 0.9% No change
1.4 2.3 6.3 5.4 92.3 92.3
Traineeship1.4% 1.0% 0.4%
12.9 14.3 3.4 2.4 83.7 83.3
APPENDIX 2 – TRENDS IN VET - RESULTS OF DATA ANALYSIS (CONTINUED)

Auditor General for Western Australia 41
Group 3 – IBT Trends by College
Attraction – IBT by College
Course Enrolments Module Enrolments SCH
2003 2007 2003 2007 2003 2007
West Coast23.0% 19.6% 12.6%
7 505 5 776 51 134 41 116 1 615 723 1 412 275
Challenger1.9% 3.2% 1.2%
13 722 13 467 101 323 104 527 3 194 676 3 232 668
Central19.7% 15.5% 9.5%
27 258 21 883 161 709 136 657 6 144 720 5 561 322
Swan10.1% 25.1% 19.6%
18 105 16 280 148 580 111 284 4 724 249 3 799 035
Central West7.4% 13.1% 14.7%
3 687 3 960 26 025 22 621 816 687 696 657
Great Southern18.7% 7.2% 13.3%
4 235 5 028 26 079 24 201 883 304 765 755
South West1.5% 20.6% 18.4%
7 292 7 181 49 011 38 930 1 576 038 1 286 808
Kimberley6.6% 7.0% 2.2%
3 212 3 423 11 805 12 626 382 239 390 770
CY O’Connor19.1% 0.3% 15.6%
3 616 4 308 14 472 14 425 479 598 404 823
Pilbara24.7% 1.0% 3.8%
3 835 4 783 15 373 15 528 492 919 511 513
Curtin34.2% 26.8% 33.3%
2 046 1 347 12 459 9 110 427 074 284 961

RESPONDING TO CHANGES IN ATTRACTION, RETENTION AND ACHIEVEMENT IN VOCATIONAL EDUCATION AND TRAINING
42 Auditor General for Western Australia
Retention and Achievement – IBT by College
Withdrawals (%) Fails (%) MLCR (%)
2003 2007 2003 2007 2003 2007
West Coast3.7% 3.9% 0.3%
20.2 16.5 9.6 13.5 70.2 69.9
Challenger0.5% 2.6% 1.9%
10.3 10.8 19.1 16.5 70.5 72.4
Central1.7% 0.9% 2.6%
13.6 15.3 16.0 16.9 70.4 67.8
Swan4.5% 6.6% 1.9%
13.3 17.8 17.8 11.2 68.8 70.7
Central West4.0% 5.8% 1.5%
11.7 15.7 17.9 12.1 70.2 71.7
Great Southern0.8% 20.6% 19.9%
11.2 12.0 29.9 9.3 58.9 78.8
South West0.5% 3.1% 2.6%
10.9 11.4 16.8 13.7 72.3 74.9
Kimberley1.5% 6.5% 5.0%
10.6 9.1 15.2 21.7 74.2 69.2
CY O’Connor5.1% 8.4% 13.5%
23.8 18.7 17.0 8.6 59.2 72.7
Pilbara4.7% 6.8% 11.3%
16.7 12.0 18.3 11.5 64.9 76.2
Curtin9.6% 17.0% 7.3%
5.1 14.7 21.4 4.4 73.5 80.8
APPENDIX 2 – TRENDS IN VET - RESULTS OF DATA ANALYSIS (CONTINUED)
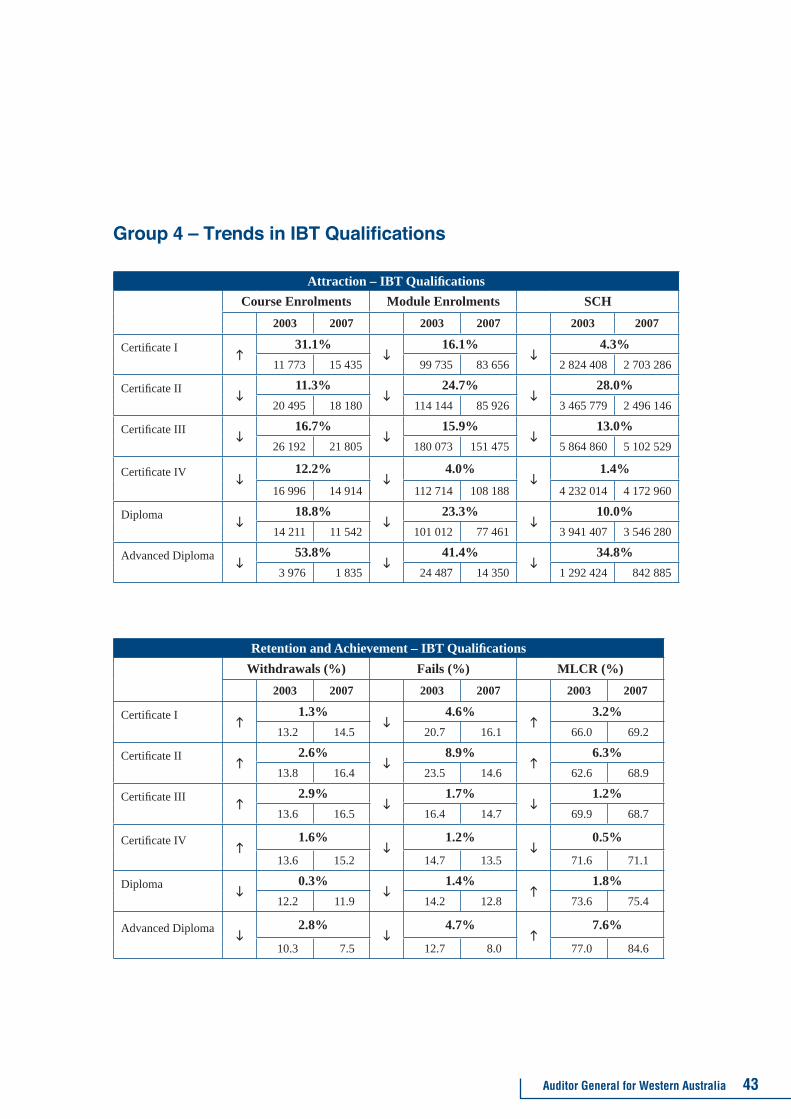
Auditor General for Western Australia 43
Group 4 – Trends in IBT Qualifi cations
Attraction – IBT Qualifi cationsCourse Enrolments Module Enrolments SCH
2003 2007 2003 2007 2003 2007
Certifi cate I 31.1% 16.1% 4.3%11 773 15 435 99 735 83 656 2 824 408 2 703 286
Certifi cate II 11.3% 24.7% 28.0%20 495 18 180 114 144 85 926 3 465 779 2 496 146
Certifi cate III 16.7% 15.9% 13.0%26 192 21 805 180 073 151 475 5 864 860 5 102 529
Certifi cate IV 12.2% 4.0% 1.4%16 996 14 914 112 714 108 188 4 232 014 4 172 960
Diploma 18.8% 23.3% 10.0%14 211 11 542 101 012 77 461 3 941 407 3 546 280
Advanced Diploma 53.8% 41.4% 34.8%3 976 1 835 24 487 14 350 1 292 424 842 885
Retention and Achievement – IBT Qualifi cationsWithdrawals (%) Fails (%) MLCR (%)
2003 2007 2003 2007 2003 2007
Certifi cate I 1.3% 4.6% 3.2%13.2 14.5 20.7 16.1 66.0 69.2
Certifi cate II 2.6% 8.9% 6.3%13.8 16.4 23.5 14.6 62.6 68.9
Certifi cate III 2.9% 1.7% 1.2%13.6 16.5 16.4 14.7 69.9 68.7
Certifi cate IV 1.6% 1.2% 0.5%
13.6 15.2 14.7 13.5 71.6 71.1
Diploma 0.3% 1.4% 1.8%12.2 11.9 14.2 12.8 73.6 75.4
Advanced Diploma 2.8% 4.7% 7.6%
10.3 7.5 12.7 8.0 77.0 84.6

RESPONDING TO CHANGES IN ATTRACTION, RETENTION AND ACHIEVEMENT IN VOCATIONAL EDUCATION AND TRAINING
44 Auditor General for Western Australia
Group 5 – Age Groups
Attraction – IBT by Age GroupCourse Enrolments Module Enrolments SCH
2003 2007 2003 2007 2003 2007
15-193.2% 14.3% 13.6%
28 981 28 068 269 958 231 260 8 898 999 7 684 403
20-2414.5% 23.2% 19.1%
16 456 14 072 109 271 89 953 3 995 453 3 232 338
25-2917.1% 18.9% 16.3%
10 899 9 030 57 145 46 332 2 076 625 1 737 818
30-3916.1% 12.6% 11.1%
20 058 16 827 97 424 85 179 3 529 715 3 138 794
40-4912.2% 7.2% 4.7%
15 823 13 896 75 959 70 472 2 749 024 2 619 572
50-652.7% 7.4% 9.0%
8 676 8 438 35 796 38 446 1 278 572 1 393 884
65 plus18.5% 26.7% 11.5%
906 1 074 2 214 2 806 92 288 102 946
Retention and Achievement – IBT by Age GroupWithdrawals (%) Fails (%) MLCR (%)
2003 2007 2003 2007 2003 2007
15-192.5% 2.7% 0.9%
12.2 14.7 17.8 15.1 68.5 69.4
20-241.1% 3.3% 2.7%
13.9 15.0 17.0 13.7 68.1 70.8
25-291.0% 3.5% 2.5%
13.8 14.8 16.5 13.0 69.2 71.7
30-391.6% 3.6% 2.5%
12.3 13.9 15.3 11.7 71.5 74.0
40-491.8% 2.9% 1.2%
11.6 13.4 14.4 11.5 73.2 74.4
50-652.7% 2.7% 0.4%
10.2 12.9 16.4 13.7 72.4 72.8
65 plus3.5% 5.1% 1.2%
9.5 13.0 28.5 23.4 61.0 62.2
APPENDIX 2 – TRENDS IN VET - RESULTS OF DATA ANALYSIS (CONTINUED)
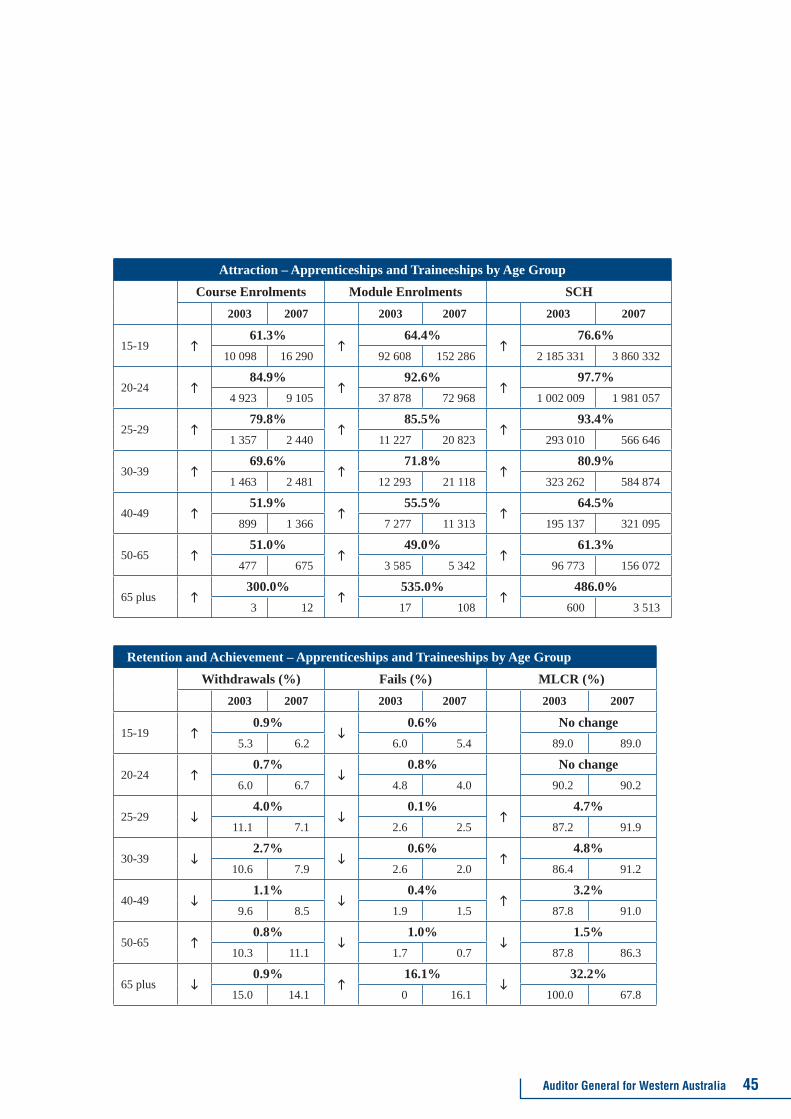
Auditor General for Western Australia 45
Attraction – Apprenticeships and Traineeships by Age Group Course Enrolments Module Enrolments SCH
2003 2007 2003 2007 2003 2007
15-1961.3% 64.4% 76.6%
10 098 16 290 92 608 152 286 2 185 331 3 860 332
20-2484.9% 92.6% 97.7%
4 923 9 105 37 878 72 968 1 002 009 1 981 057
25-2979.8% 85.5% 93.4%
1 357 2 440 11 227 20 823 293 010 566 646
30-3969.6% 71.8% 80.9%
1 463 2 481 12 293 21 118 323 262 584 874
40-4951.9% 55.5% 64.5%
899 1 366 7 277 11 313 195 137 321 095
50-6551.0% 49.0% 61.3%
477 675 3 585 5 342 96 773 156 072
65 plus300.0% 535.0% 486.0%3 12 17 108 600 3 513
Retention and Achievement – Apprenticeships and Traineeships by Age Group
Withdrawals (%) Fails (%) MLCR (%)2003 2007 2003 2007 2003 2007
15-190.9% 0.6% No change
5.3 6.2 6.0 5.4 89.0 89.0
20-240.7% 0.8% No change
6.0 6.7 4.8 4.0 90.2 90.2
25-294.0% 0.1% 4.7%
11.1 7.1 2.6 2.5 87.2 91.9
30-392.7% 0.6% 4.8%
10.6 7.9 2.6 2.0 86.4 91.2
40-491.1% 0.4% 3.2%
9.6 8.5 1.9 1.5 87.8 91.0
50-650.8% 1.0% 1.5%
10.3 11.1 1.7 0.7 87.8 86.3
65 plus0.9% 16.1% 32.2%
15.0 14.1 0 16.1 100.0 67.8

RESPONDING TO CHANGES IN ATTRACTION, RETENTION AND ACHIEVEMENT IN VOCATIONAL EDUCATION AND TRAINING
46 Auditor General for Western Australia
Group 6 – Occupational Groups
Attraction – IBT Occupational GroupsCourse Enrolments Module Enrolments SCH
2003 2007 2003 2007 2003 2007
Recreation71.6% 0.2% 64.8%
1 142 1 960 22 781 22 741 334 221 550 734
Visual and Performing Arts
0.4% 18.2% 1.3%
4 229 4 213 23 546 27 838 1 336 310 1 319 327
Community Service23.0% 25.6% 16.5%
5 598 4 312 39 220 29 179 1 411 676 1 178 805
Education and Childcare
3.2% 4.6% 8.1%4 128 4 261 36 371 34 692 1 191 541 1 287 542
Engineering and Drafting
2.4% 8.3% 18.5%
2 931 2 860 14 235 15 413 520 980 617 109
Health12.0% 0.2% 22.2%
2 177 2 438 17 136 17 175 736 482 899 844Electrical and Electronic Engineering
38.8% 25.8% 36.0%
2 044 1 251 11 615 8 621 416 321 266 346
Accounting23.8% 15.7% 18.5%
5 321 4 056 26 366 22 222 998 072 813 276
Management37.7% 42.9% 41.7%
4 891 3 048 24 898 14 212 977 302 569 729
Offi ce and Clerical36.8% 23.7% 16.2%
5 058 6 919 26 962 33 359 811 287 942 472
Computing63.5% 47.7% 46.0%
8 532 3 118 32 760 62 647 1 858 213 1 002 925
Adult Literacy7.2% 28.3% 9.3%
9 778 10 479 36 303 46 560 1 818 545 1 648 698
APPENDIX 2 – TRENDS IN VET - RESULTS OF DATA ANALYSIS (CONTINUED)

Auditor General for Western Australia 47
Retention and Achievement – IBT Occupational GroupsWithdrawals (%) Fails (%) MLCR (%)
2003 2007 2003 2007 2003 2007
Recreation3.4% 1.9% 1.5%
8.0 11.4 12.3 10.4 79.6 78.1
Visual and Performing Arts
2.3% 2.8% 5.1%
13.7 11.4 14.2 11.4 72.0 77.1
Community Service3.3% 0.3% 3.7%
10.7 14.0 8.1 8.4 81.2 77.5
Education and Childcare
1.6% 0.9% 0.7%13.7 12.1 12.6 13.5 73.7 74.4
Engineering and Drafting
2.4% 0.9% 1.5%
11.6 14.0 17.3 16.4 71.1 69.6
Health0.7% 1.5% 5.7%
9.6 10.3 8.5 10.0 73.7 79.4Electrical and Electronic Engineering
3.0% 0.4% 2.6%
11.5 14.5 26.7 26.3 61.8 59.2
Accounting3.2% 1.0% 2.3%
18.9 22.1 11.5 10.5 69.6 67.3
Management1.6% 0.7% 0.9%
19.1 20.7 14.1 13.4 66.7 65.8
Offi ce and Clerical0.3% 2.4% 1.9%
20.4 20.7 16.0 13.6 63.5 65.4
Computing5.9% 0.8% 5.1%
16.6 22.5 20.5 19.7 62.9 57.8
Adult Literacy5.3% 11.6% 6.2%
17.9 23.2 42.3 30.7 39.7 45.9

RESPONDING TO CHANGES IN ATTRACTION, RETENTION AND ACHIEVEMENT IN VOCATIONAL EDUCATION AND TRAINING
48 Auditor General for Western Australia
Attraction – Apprenticeships and Traineeships Occupation CategoriesCourse Enrolments Module Enrolments SCH
2003 2007 2003 2007 2003 2007
Automotive70.1% 60.0% 74.7%
1 966 3 344 21 828 34 931 476 168 831 702
Building and Construction
154.4% 119.0% 166.4%1 829 4 653 19 687 43 109 388 694 1 035 417
Food Processing64.9% 63.5% 71.2%
998 1 646 7 406 12 108 216 689 370 936
Metals and Mining98.1% 97.0% 105.6%
2 486 4 926 23 524 46 339 616 113 1 266 850
Personal Service109.1% 125.8% 135.9%
779 1 629 9 403 21 234 142 051 335 121
Electrical Trades164.2% 151.9% 148.0%
1 331 3 516 9 970 25 111 299 866 743 563
Offi ce and Clerical18.1% 24.4% 30.9%
2 035 2 403 14 054 17 490 382 069 500 313
Transport Trades, Storage
221.8% 252.1% 263.7%338 1 088 2 390 8 417 62 340 226 767
Retention and Achievement – Apprenticeships and Traineeships Occupation CategoriesWithdrawals (%) Fails (%) MLCR (%)
2003 2007 2003 2007 2003 2007
Automotive0.3% 0.4% No change
1.7 1.4 3.7 4.1 94.5 94.5
Building and Construction
0.8% 2.5% 1.8%2.3 3.1 5.1 2.6 92.5 94.3
Food Processing2.5% 3.9% 6.4%
9.3 6.8 4.9 1.0 85.7 92.1
Metals and Mining0.7% 0.1% 0.9%
1.4 2.1 5.6 5.7 93.0 92.1
Personal Service1.5% 2.4% 1.0%
5.3 3.8 2.2 4.6 92.5 91.5
Electrical Trades0.8% 3.4% 2.5%
0.4 1.2 9.8 6.4 89.8 92.3
Offi ce and Clerical5.9% 2.2% 3.7%
13.6 19.5 3.3 1.1 83.1 79.4
Transport Trades, Storage
17.3% 2.7% 19.9%23.0 5.7 2.7 0.0 74.4 94.3
APPENDIX 2 – TRENDS IN VET - RESULTS OF DATA ANALYSIS (CONTINUED)