
Responding to a Shadow Banking Crisis: the Lessons of 1763
64
1 Responding to a Shadow Banking Crisis: the Lessons of 1763 (This draft: February 12, 2012) Stephen Quinn Department of Economics Texas Christian University Box 298510 Fort Worth, TX 76129 [email protected] 817.257.6234 William Roberds Research Department Federal Reserve Bank of Atlanta 1000 Peachtree St., N.E. Atlanta, GA 30309 [email protected] 404.498.8970 Abstract In August 1763, northern Europe experienced a financial crisis with parallels to the 2008 Leh- man episode. The 1763 crisis was manifested in a loss of liquidity of acceptance loans, a form of securitized credit resembling modern asset-backed commercial paper. The crisis began with the failure of a major securitizer (“conduit”) in Amsterdam, and quickly spread to neighboring mar- kets. The central bank at the hub of the crisis, the Bank of Amsterdam, responded by broadening the range of acceptable collateral for its repo transactions. Using archival data on the Bank’s op- erations, we show 1) that the 1763 crisis was proportionately more severe than that experienced in 2008, 2) the Bank’s emergency liquidity infusion likely prevented the failure of two other ma- jor securitizers and provided indirect benefits to other market participants. While the underlying themes seem to have changed little in 250 years, the modest scope of the 1763 liquidity interven- tion, together with the lightly regulated nature of the eighteenth century financial landscape, pro- vide some informative contrasts with events of late 2008. Views expressed are those of the authors. The authors are grateful to Roger Farmer, Rod Garratt, and Ellis Tallman for comments on earlier drafts, to Christiaan van Bochove for making them aware of the Malinowski (2011) dataset, and to Christina Hartlage for research assistance.
Transcript of Responding to a Shadow Banking Crisis: the Lessons of 1763
1
Responding to a Shadow Banking Crisis: the Lessons of 1763
(This draft: February 12, 2012)
Stephen Quinn
Department of Economics Texas Christian University
Box 298510 Fort Worth, TX 76129
[email protected] 817.257.6234
William Roberds
Research Department Federal Reserve Bank of Atlanta
1000 Peachtree St., N.E. Atlanta, GA 30309
[email protected] 404.498.8970
Abstract In August 1763, northern Europe experienced a financial crisis with parallels to the 2008 Leh-man episode. The 1763 crisis was manifested in a loss of liquidity of acceptance loans, a form of securitized credit resembling modern asset-backed commercial paper. The crisis began with the failure of a major securitizer (“conduit”) in Amsterdam, and quickly spread to neighboring mar-kets. The central bank at the hub of the crisis, the Bank of Amsterdam, responded by broadening the range of acceptable collateral for its repo transactions. Using archival data on the Bank’s op-erations, we show 1) that the 1763 crisis was proportionately more severe than that experienced in 2008, 2) the Bank’s emergency liquidity infusion likely prevented the failure of two other ma-jor securitizers and provided indirect benefits to other market participants. While the underlying themes seem to have changed little in 250 years, the modest scope of the 1763 liquidity interven-tion, together with the lightly regulated nature of the eighteenth century financial landscape, pro-vide some informative contrasts with events of late 2008.
Views expressed are those of the authors. The authors are grateful to Roger Farmer, Rod Garratt, and Ellis Tallman for comments on earlier drafts, to Christiaan van Bochove for making them aware of the Malinowski (2011) dataset, and to Christina Hartlage for research assistance.

2
1. Introduction
The 2008 Lehman bankruptcy gave rise to two unlikely phenomena: a banking crisis in which
the liquidity of bank deposits was rarely called into question, and a collection of policy interven-
tions that rescued institutions outside the traditional regulatory safety net.
The Lehman crisis was not manifested as runs on banks (with some rare exceptions such as
Northern Rock) but as the dysfunction of markets for certain types of securities. Many of the af-
fected securities were the products of the shadow banking sector, a lightly regulated group of
nonbank institutions (Pozsar et al. 2010) that until the disruptions of 2007-8, had been able to
transform illiquid cash flows into financial claims with bank-deposit-like liquidity and “informa-
tion-insensitivity” (Dang et al. 2009).
The shadow banking superstructure began to totter in August 2007, and threatened to collapse
with the September 2008 failure of Lehman Brothers. The prospect of a worldwide financial
meltdown provoked an unparalleled response, as banks and shadow banks alike were shored up
through aggressive policy actions. Arguably the most salient feature of these policies was the
raw magnitude of public-sector liquidity they created (Allen and Moessner 2011), with central
bank balance sheets increasing to unprecedented multiples of their pre-crisis size.
Would a different pre-crisis regulatory environment have increased market resiliency (e.g.,
Acharya et al. 2010, Gorton and Metrick 2010)? It is hard to answer without verifying the ubiq-
uity of shadow bank fragility. What if governments and central banks had displayed a lesser re-
sponse to the Lehman failure? The counter-factual is difficult to construct (see e.g. McAndrews
et al. 2008, Adrian et al. 2010, Fleming et al. 2010) without some confirmation of how a run
propagates through the shadows. History helps answer these “what ifs,” so this paper goes to the
Amsterdam Crisis of 1763 to find a precedent that is outside the Anglo-American tradition. In
doing so, we follow Schnabel and Shin (2004) by drawing parallels between pre-Napoleonic
Continental banking institutions, and the shadow banking structures of today.
Why late eighteenth-century Amsterdam? Because it was replete with merchant banks offering
securitization services in a way analogous to, but not identical to modern issuers of asset-backed
commercial paper. To enhance credit and liquidity, the Dutch substituted a borrower’s obligation
3
with a debt guaranteed by the merchant bank. The borrowers were located all over the European
trading world, but the credit hub was Amsterdam, so credit risk was concentrated there. The
process also created a maturity mismatch, so the typical Dutch merchant bank financed itself
with new debt before the original borrowers were paid. Dependence on debt rollover made Ams-
terdam in 1763 as vulnerable to aggregate shocks as New York was in 2008.
In August 1763, the Lehman-like failure of the banking house Gebroeders de Neufville made
creditors reluctant to purchase new debt from surviving banks. Our investigations indicate that
the resulting shadow run was proportionally greater than that experienced in 2008. To measure
the run, we have reconstructed the weekly flow of funds into and out of accounts, reminiscent of
asset-backed commercial paper (ABCP) conduits, maintained by the eight largest merchant
banks at the Bank of Amsterdam (also the Bank). Large merchant banks were often obliged to
use the Bank to settle their debts, called bills of exchange, but light regulation otherwise meant
that the Dutch banks did not hide their trading activity. Rich archival data and straightforward
financial architecture allow us to reconstruct the portion of the panic that occurred through the
Bank’s accounts.
A second parallel is in the Bank of Amsterdam’s response to the crisis. As in 2008, access to
central bank liquidity was expanded on an ad hoc basis. Differently, this expansion was quite
narrow in scope. The ad hoc intervention worked through the Bank’s repo facilities to broaden
the set of assets eligible for repo to include silver bullion. Liquidity also expanded via the tradi-
tional channel of repo transactions with trade coins.
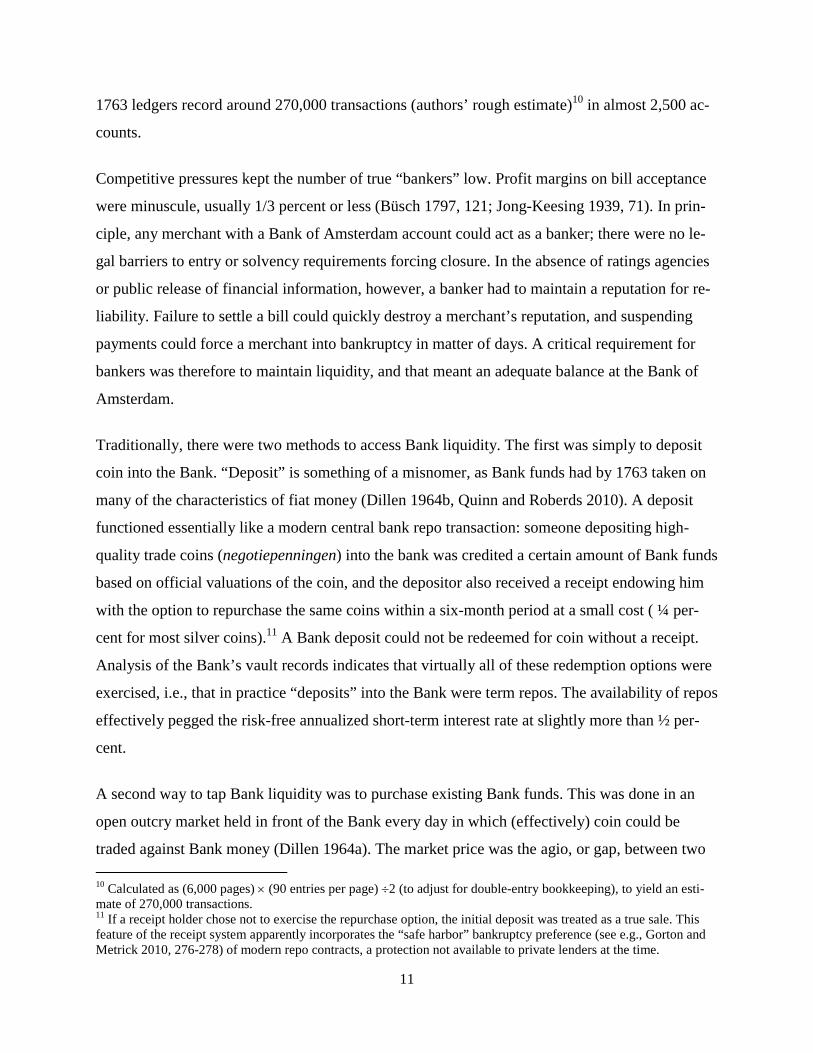
Figure 1 compares the expansion of the Bank of Amsterdam’s balance sheet in 1763 to the Fed-
eral Reserve’s in 2008-9. In each case, the balance sheets are scaled to the start of the crisis and
broken down by asset class. For the Federal Reserve, the breakdown includes traditional assets
(securities purchases), direct lending programs, and liquidity swaps with foreign central banks.
Figure 1 also plots assets of the Bank of Amsterdam acquired by traditional channels and by its
ad hoc bullion window. The comparison shows that the Bank of Amsterdam’s bullion window
and its traditional response were comparable in timing, but modest in scale, relative to the Fed’s
balance sheet expansions. The aggregate increase in liquidity was a “mere” 40 percent over six
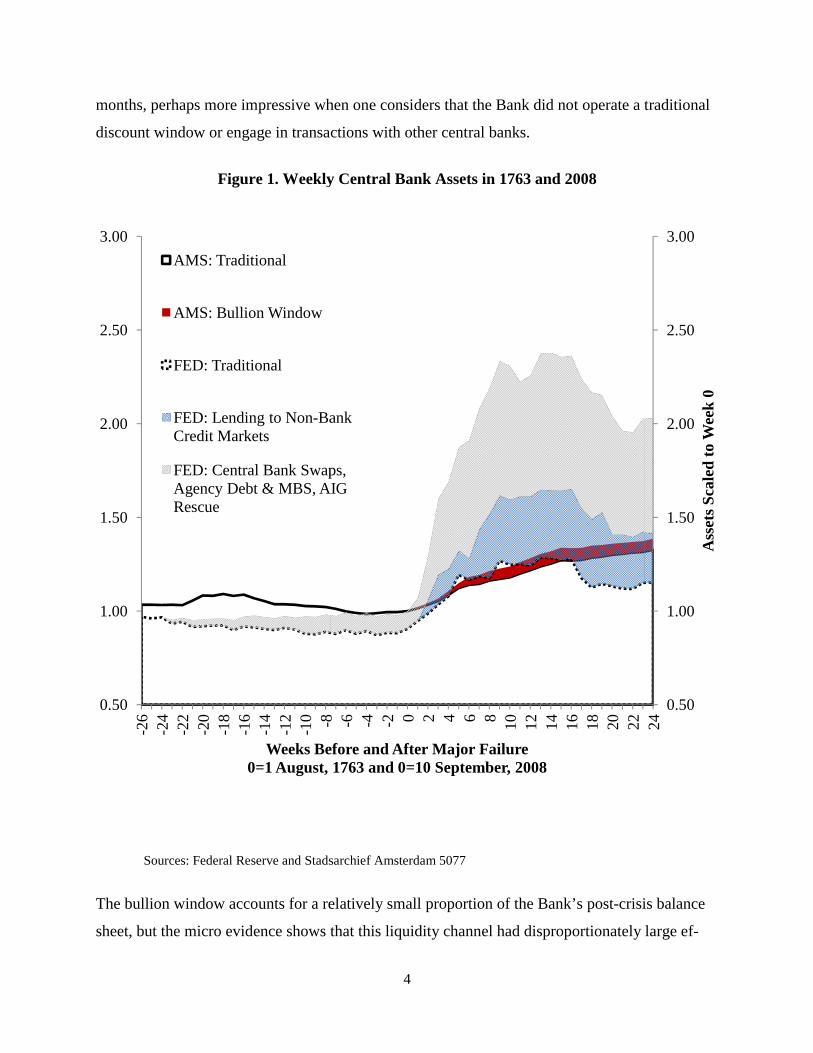
months, perhaps more impressive wh
discount window or engage in transa
Figure 1. Weekly
Sources: Federal Reserve and Stads
The bullion window accounts for a re
sheet, but the micro evidence shows
0.50
1.00
1.50
2.00
2.50
3.00
-26
-24
-22
-20
-18
-16
-14
-12
-10 -8
Weeks Be0=1 August,
AMS: Traditional
AMS: Bullion Window
FED: Traditional
FED: Lending to Non-BaCredit Markets
FED: Central Bank SwapAgency Debt & MBS, ARescue
4
hen one considers that the Bank did not operate a
actions with other central banks.
y Central Bank Assets in 1763 and 2008
sarchief Amsterdam 5077
elatively small proportion of the Bank’s post-crisi
that this liquidity channel had disproportionately
8 -6 -4 -2 0 2 4 6 8 10 12 14 16 18 20 22
efore and After Major Failure1763 and 0=10 September, 2008
ank
ps, AIG
traditional
is balance
large ef-
0.50
1.00
1.50
2.00
2.50
3.00
24
Ass
ets S
cale
d to
Wee
k 0

5
fects. Our new data set tracks liquidity creation by bank, and examination of this data shows that
the bullion window likely prevented the failure of at least two additional large merchant banks.
In this way, Amsterdam avoided further major bank failures within Amsterdam and avoided too-
big-to-fail bailouts. It is noteworthy that this balance was achieved despite Amsterdam being
more vulnerable to a crisis than a modern system: financial “firebreaks” such as central counter-
parties, deposit insurance, and a discount window were completely lacking.
As a precedent, the Crisis of 1763 confirms the model of a shadow bank as a financial firm that
has to roll over its financing before the backing assets mature. Shadow runs are the sudden ina-
bility to sell new debt, as arrangements designed to make claims money-like fail. The history
opens potential explanations for the ascent of modern shadow banking, for the Dutch system
evolved in response to demand for securitization rather than to avoid regulation. Finally, the sto-
ry shows that a shadow run was partially alleviated with aggressive repurchase facilities but
without explicit bailouts or too-big-to-fail guarantees.
The rest of this paper is organized as follows. Section 2 reviews related literature. Section 3 dis-
cusses banking institutions in eighteenth century Amsterdam. Section 4 discusses the collateral
shocks that preceded the crisis and section 5 discuses its outbreak. Section 6 presents empirical
evidence on the severity of the crisis, and section 7 analyzes policy responses. A final section
concludes.
2. Related literature
There is rich historical literature on the Panic of 1763, with contributions by Büsch (1797), Soet-
beer (1855), Sautijn Kluit (1865), Dillen (1922, 1931), Skalweit (1937), Henderson (1962), and
Spooner (2002), among others. The analysis below relies on these works, and especially on the
monograph of Jong-Keesing (1939), both for historical narrative and as guides to primary
sources.
The historical literature is synthesized by Schnabel and Shin (2004), who also propose a theoret-
ical model of contagion effects stemming from Neufville’s failure. Our analysis complements

6
theirs, in that we measure how the panic hit other banks and how the Bank of Amsterdam’s re-
sponse was able to limit the outbreak of contagion within the Amsterdam market.
Flandreau and Ugolini (2011) investigate a similar crisis and response story for London in 1866.
In England, the failure of a large bank caused shadow banks (called bill brokers) to suddenly be-
come unable to finance international acceptance credit. The Bank of England responded by ra-
pidly expanding liquidity (Flandreau and Ugolini 2011, 36-7). Unlike Amsterdam, however, the
English banks did not necessarily settle bills at their central bank, so the Bank of England ac-
counts did not double as conduits. In Amsterdam, we are able to reconstruct both lender of last
resort funding and the obligations pressing on shadow banks.
3. Shadow banking in 1763
Financial activity in late-eighteenth century Amsterdam was dominated by a group of merchant
banking firms. In contemporary parlance, these firms were known simply as banquiers or “bank-
ers” (Jong-Keesing 1939, 69). Bankers were proprietary firms that dealt in trade goods and that
also provided financing to other merchants. These firms were not deposit banks in the English
tradition; deposit-taking was viewed as an excessively risky, downmarket source of funding.
Aversion to deposits was famously crystallized in a clause of the partnership contracts of Ams-
terdam’s most prominent bank, Hope en Compagnie: “the business of this firm will be restricted
to matters of commerce and commissions, and it will not engage in negotiations relating to depo-
sited funds, or similar transactions” (Jong-Keesing 1939, 69; Buist 1974, 37).
Since deposits were scarce, financial intermediation was accomplished through a securitization
scheme known as the acceptance loan (acceptcrediet). The building block of the acceptance loan
was an instrument known as the bill of exchange. Somewhat resembling a modern check, a bill
of exchange transaction involved a minimum of three actors: a drawer, a drawee, and a benefi-
ciary (see e.g., Schnabel and Shin 2004, 935-939). The bill would be created by the drawer, who
would instruct the drawee to pay the beneficiary a certain sum, at a fixed place, at some future
date. The drawee would indicate his intention to pay the bill by signing or “accepting” it. A be-
neficiary could also transfer the bill to a fourth party by endorsing it over.

7
3.1 Acceptance loans and conduits
In an acceptance loan transaction, the lender was the drawee of a bill, typically a merchant bank-
er in a prominent commercial city such as Amsterdam. To make the arrangement work, the
banker had to “close the loop” of obligations created by the drawing of a bill, i.e., to somehow
arrange for repayment from the drawer. Table 2 below presents a stylized example of one com-
mon technique for constructing an acceptance loan. 1
For ease of comparison, consider first the interaction of four agents in the context of a modern,
ABCP type of arrangement (see, e.g., Brunnermeier 2009, Acharya, Suarez, and Schnabl 2010,
Kaperczyk and Schnabl 2010). There are three periods: 0, 1, and 2. Agent D is a debtor who bor-
rows for two periods, C1 is a creditor who lends early, C2 is a creditor who lends late, and B is a
banker-conduit who creates secondary debt and provides credit/liquidity enhancement. Table 1
presents a stylized version of ABCP, in which debt issued by B is “backed” by cash flows from
the activities of D.
Table 1: stylized ABCP conduit, 2008
Period 0: (a) D creates and sells an ASSET to B (b) B creates and sells ABCP1 to C1
Period 1: (a) B creates and sells ABCP2 to C2 (b) B repays C1 for ABCP1
Period 2: (a) D repays B for ASSET (b) B repays C2 for APCP2
A critical feature of the story, and the source of B’s profit, is that the ABCP issued by B has cre-
dit and liquidity guarantees that make it into a palatable investment for C1 and C2. As became
clear in 2007-2008, however, B’s guarantee to C1 may depend on rollover funding from C2 (Ka-
perczyk and Schnabl 2010).
1 The bill of exchange was a flexible instrument that allowed for many variations in the type of credit scheme that could be constructed. E.g., Schnabel and Shin (2004, 935-940) present a more complex example of an acceptance loan, in which the ultimate borrower is the beneficiary of the bill.
8
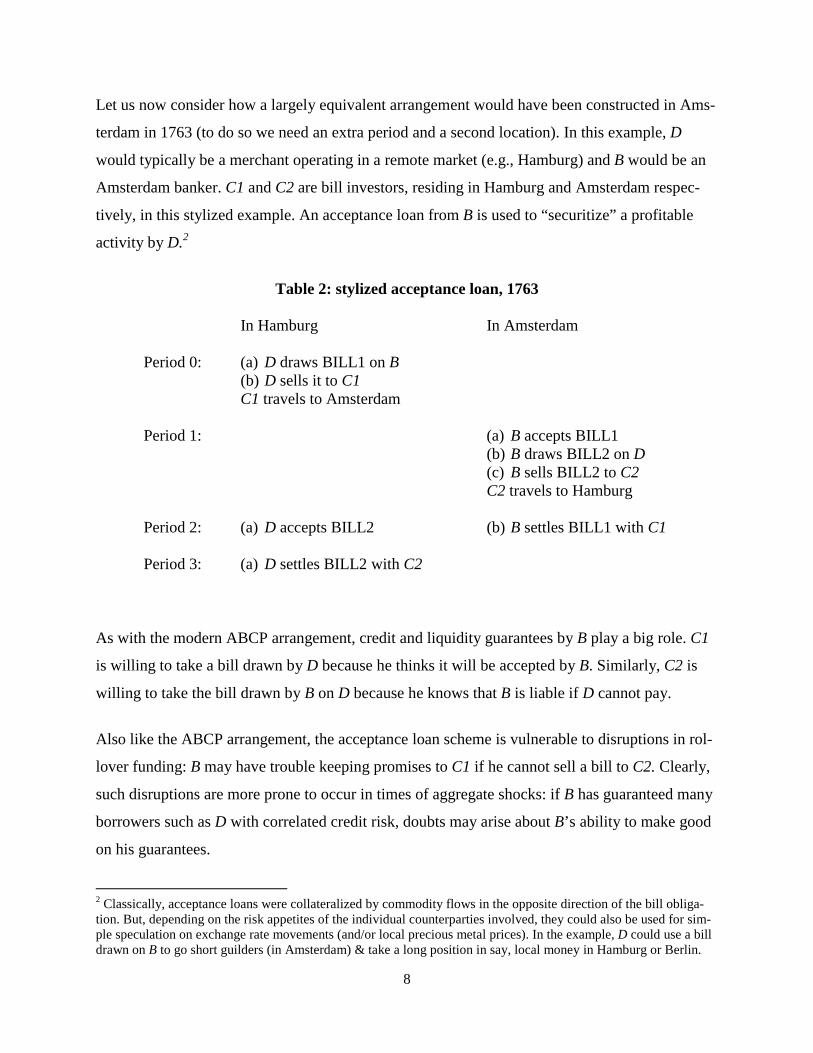
Let us now consider how a largely equivalent arrangement would have been constructed in Ams-
terdam in 1763 (to do so we need an extra period and a second location). In this example, D
would typically be a merchant operating in a remote market (e.g., Hamburg) and B would be an
Amsterdam banker. C1 and C2 are bill investors, residing in Hamburg and Amsterdam respec-
tively, in this stylized example. An acceptance loan from B is used to “securitize” a profitable
activity by D.2
Table 2: stylized acceptance loan, 1763
In Hamburg In Amsterdam Period 0: (a) D draws BILL1 on B
(b) D sells it to C1 C1 travels to Amsterdam
Period 1: (a) B accepts BILL1 (b) B draws BILL2 on D (c) B sells BILL2 to C2 C2 travels to Hamburg
Period 2: (a) D accepts BILL2
(b) B settles BILL1 with C1
Period 3: (a) D settles BILL2 with C2
As with the modern ABCP arrangement, credit and liquidity guarantees by B play a big role. C1
is willing to take a bill drawn by D because he thinks it will be accepted by B. Similarly, C2 is
willing to take the bill drawn by B on D because he knows that B is liable if D cannot pay.
Also like the ABCP arrangement, the acceptance loan scheme is vulnerable to disruptions in rol-
lover funding: B may have trouble keeping promises to C1 if he cannot sell a bill to C2. Clearly,
such disruptions are more prone to occur in times of aggregate shocks: if B has guaranteed many
borrowers such as D with correlated credit risk, doubts may arise about B’s ability to make good
on his guarantees.
2 Classically, acceptance loans were collateralized by commodity flows in the opposite direction of the bill obliga-tion. But, depending on the risk appetites of the individual counterparties involved, they could also be used for sim-ple speculation on exchange rate movements (and/or local precious metal prices). In the example, D could use a bill drawn on B to go short guilders (in Amsterdam) & take a long position in say, local money in Hamburg or Berlin.

9
One source of such aggregate shocks would be movements in exchange rates. Note that in con-
trast to Table 1, the borrower D in Table 2 is essentially shorting one currency (the guilder in
Amsterdam) to take a long position in another (the thaler in Hamburg). Indeed, one popular use
of acceptance credit was to fund speculation in exchange rates. This feature of acceptance loans
increased their susceptibility to market risk.
More critical than market risk, however, was another vulnerability that does not show up under
the modern ABCP arrangement: if C1 buys a bill from D, and B then declines to accept (“pro-
tests”) the bill, then D loses the funding of the bill and becomes subject to liquidity risk. When
bankers protest bills to conserve their own liquidity, they can force parties such as D into bank-
ruptcy, in which case a creditor such C1 has (at least temporarily) lost his principal on the first
trade.3 The acceptance credit (or bankers’ bills) common in later Anglo-American systems either
eliminated protest risk by having the bank accept the bill before the drawer sold it or reduced
protest risk through instruments of provisional acceptance such as a banker’s letter or a corres-
pondent’s assurance.4
Moreover, C1 could not escape principal risk by selling (“discounting”) the bill. “Holder in due
course” provisions of the prevailing commercial law meant that anyone transferring a bill to
another party (as often happened in organized bill markets) retained contingent liability if the
drawee could not pay (Schnabel and Shin 2004, 938-939). The limited extent of deposit banks
meant that bills sometimes circulated as money in large-value commercial transactions, especial-
ly after acceptance by a major bank. The attendant risks, stemming from the use of bills as a
monetary instrument, created especially destructive linkages during the course of the 1763 panic.
3.2 Banking and liquidity
The example in Table 2 suggests that any eighteenth-century merchant could function as a bank-
er, by simply accepting a bill. The historical evidence suggests that in many cases, however, this
3 Although C1 still has recourse against D, it might be difficult or time-consuming for C1 to collect. Principal risk could be manifested in other ways as well. Consider a scenario where B (for example, Neufville) accepts BILL1 in period 1(a) but goes bankrupt before maturity of the bill in period 2. C1 has again lost liquidity and D is liable for the full amount of the bill. Depending on circumstances, C1 could lose the entire amount of the initial trade. In a modern context, such cross-border risk might be termed “Herstatt risk” (Committee on Payment and Settlement Sys-tems 2003). 4 See Davis and Gallman (2001, 127-30); Ferderer (2003, 667-73); and Flandreau and Ugolini (2011, 7).

10
functionality was unrealized. While virtually all merchants in eighteenth-century Amsterdam
dealt in bills of exchange, these dealings were usually quite restricted. Most merchants’ bill
transactions were limited to a small group of “friends”—commercial contacts in other cities—
and even among friends, exposures were subject to strict limits. Also, the typical merchant’s bills
were rarely transferred more than once after issue (Jong-Keesing 1939, 58-65), indicating that
they had limited liquidity. Our analysis of bill settlement patterns suggests that Jong-Keesing’s
characterization would have been appropriate for over eighty percent of the merchants with ac-
counts at the Bank of Amsterdam, who settled less than one bill per week on average.
The banquiers provided a conspicuous exception to this pattern. Surviving records show that the
most active merchants in Amsterdam dealt in thousands of bills each year (see Table 3 below),
drawn by a wide range of counterparties. When the house of Neufville failed in August 1763, its
list of creditors included over 100 bill counterparties, the great majority of these residing in cities
outside of the Dutch Republic (Jong-Keesing 1939, 101-110). In many outlying areas, the only
commonly available form of trade finance was to draw a bill on a banker in Amsterdam.5 Ac-
cepted bankers’ bills were widely traded in secondary markets in Amsterdam and other commer-
cial centers.
It is possible to indirectly track much of the bill market in Amsterdam through its settlement ac-
tivity. Most bills drawn abroad on Amsterdam were payable through a municipally owned insti-
tution, the Bank of Amsterdam.6 7 At maturity of the bill, the beneficiary (or endorsee) holding
an accepted bill brought it to the drawee, who then discharged his obligation by transferring
Bank funds to the bill holder in the amount of the face value of the bill.8 There was no clearing
house and no netting of obligations.9 Meticulous and virtually complete records of the “funds
side” of these settlements are preserved in the ledgers of the Bank of Amsterdam: the Bank’s
5 Most markets did have traditional systems of longer-term lending based on mortgages. See e.g. Hoffman, Postel-Vinay and Rosenthal (2000). 6 The Bank’s main purpose was to allow for efficient book-entry settlement of bills of exchange. The Bank’s activi-ties generated substantial profits, but it was run more as a public utility than a profit-maximizing entity. See Dillen (1934) and Dehing and Hart (1997) on the history of the Bank. 7 There was a less important market for “current money” bills—bills settled outside the bank. This market was the domain of a group of intermediaries known as cashiers, whose activities are described in section 5 below. 8 In a modern context, this scheme would be classified as a delivery-versus-payment “model 1” (i.e., gross settle-ment against the full value of the security; see Committee on Payment and Settlement Systems 1992). 9 We note that the London Clearing House, the first deposit bank clearinghouse and prototype for many subsequent clearing organizations, was not founded until 1773 (Joslin 1954).
11
1763 ledgers record around 270,000 transactions (authors’ rough estimate)10 in almost 2,500 ac-
counts.
Competitive pressures kept the number of true “bankers” low. Profit margins on bill acceptance
were minuscule, usually 1/3 percent or less (Büsch 1797, 121; Jong-Keesing 1939, 71). In prin-
ciple, any merchant with a Bank of Amsterdam account could act as a banker; there were no le-
gal barriers to entry or solvency requirements forcing closure. In the absence of ratings agencies
or public release of financial information, however, a banker had to maintain a reputation for re-
liability. Failure to settle a bill could quickly destroy a merchant’s reputation, and suspending
payments could force a merchant into bankruptcy in matter of days. A critical requirement for
bankers was therefore to maintain liquidity, and that meant an adequate balance at the Bank of
Amsterdam.
Traditionally, there were two methods to access Bank liquidity. The first was simply to deposit
coin into the Bank. “Deposit” is something of a misnomer, as Bank funds had by 1763 taken on
many of the characteristics of fiat money (Dillen 1964b, Quinn and Roberds 2010). A deposit
functioned essentially like a modern central bank repo transaction: someone depositing high-
quality trade coins (negotiepenningen) into the bank was credited a certain amount of Bank funds
based on official valuations of the coin, and the depositor also received a receipt endowing him
with the option to repurchase the same coins within a six-month period at a small cost ( ¼ per-
cent for most silver coins).11 A Bank deposit could not be redeemed for coin without a receipt.
Analysis of the Bank’s vault records indicates that virtually all of these redemption options were
exercised, i.e., that in practice “deposits” into the Bank were term repos. The availability of repos
effectively pegged the risk-free annualized short-term interest rate at slightly more than ½ per-
cent.
A second way to tap Bank liquidity was to purchase existing Bank funds. This was done in an
open outcry market held in front of the Bank every day in which (effectively) coin could be
traded against Bank money (Dillen 1964a). The market price was the agio, or gap, between two 10 Calculated as (6,000 pages) × (90 entries per page) ÷2 (to adjust for double-entry bookkeeping), to yield an esti-mate of 270,000 transactions. 11 If a receipt holder chose not to exercise the repurchase option, the initial deposit was treated as a true sale. This feature of the receipt system apparently incorporates the “safe harbor” bankruptcy preference (see e.g., Gorton and Metrick 2010, 276-278) of modern repo contracts, a protection not available to private lenders at the time.

12
units of account: Bank money (the “bank” guilder or florin) versus the value of circulating mon-
ey (the “current” guilder or florin). During normal times, arbitrage tended to keep the agio close
to official differentials between these two units of account, i.e., between 3.85 and 4.1 percent.12
Both of these funding “pipelines” involved the use of expensive, high-quality collateral, i.e.,
trade coins. The Bank of Amsterdam was a conservatively run institution that did not extend cre-
dit against bills, allow accounts to overdraft, or operate any kind of Lombard facility.13 Despite
these restrictions, historical evidence shows that Amsterdam bankers were routinely able to settle
bills in amounts that greatly exceeded their average balances at the Bank, without tying up much
in the way of high-quality collateral. This trick required the use of creative, ABCP-conduit-like
arrangements of the type illustrated in Table 2.
3.2 Evidence
According to our simple model of eighteenth century merchant banking , a banker B’s source of
market funding would consist of bills drawn on debtors such as D. In normal times the banker
could easily sell these in the Amsterdam bill market. On the other side, the liabilities of the
banker would consist largely of bills drawn on and accepted by B, originating with this same
group of debtors.
To check the applicability of our simple shadow banking model, we examined the ledger ac-
counts of the Bank of Amsterdam. Notice in the Table 2 example, payments through the Bank’s
accounts would typically show up at two stages, period 1(c)—the sale of a bill by B to C2—and,
period 2(b)—the settlement of the original bill drawn on B. The Bank’s ledgers thus provide an
incomplete, but still highly informative picture of the banker’s activities. In particular, a mer-
chant banker’s account at the Bank represents a sort of “virtual conduit” for acceptance loans
provided by the banker, recording the payments in by debtors, the payments going out to credi-
tors, and the resultant cash balance.
12 These boundaries are for the ryxdaalder (originally called the dukaat), a silver coin that was the primary domestic coin used for repurchase agreements at the Bank (Dillen 1925, 906; Polak 1998, 73-4). 13 Accounts were not always reconciled on a daily basis, so there were occasional overdrafts. Also, for every year for a century, the Bank of Amsterdam had lent to a government sponsored entity the (Dutch East India Company) to finance ships sailing to Asia (Dillen 1925, 981-3).
13
An unfortunate limitation of the data is that the Bank’s ledgers record no information on the “se-
curities” side of a transaction. This poses several difficulties for our analysis. The first is that in-
formation available in modern empirical studies of ABCP (e.g., Covitz, Liang, and Suarez 2009),
such as maturity and yield of individual instruments, is lacking.
A second difficulty is that the recorded transfers undoubtedly do, in some cases, represent activi-
ty other than bill transactions. For example, Bank accounts were used for transfers of stock, so-
vereign lending, or sometimes even personal consumption expenditures.14 However, as the his-
torical literature seems to agree that the principal use of Bank accounts was for bill transactions,
we will simply assume that each recorded transaction corresponds to the transfer of a bill.
A third difficulty is that there is no reliable way to sort out banks’ cross-exposures. For example,
suppose we observe a payment from Bank 1 to Bank 2 on a certain day. This may represent a
“type 1” transaction: settlement of a bill previously drawn on Bank 1, but could also represent a
“type 2” transaction: Bank 1’s purchase, as an investment, of a bill drawn by Bank 2. This dis-
tinction does not matter for many of our inferences; however, at the peak of the crisis (August-
September 1763) our calculations will assume a lack of discretionary lending (type 2), so virtual-
ly all observed transactions are non-discretionary (type 1), for failure to honor an accepted bill
had legal consequences such as bankruptcy.
As with modern payment systems, the typical entry in the Bank’s ledgers is a datum of the form
ijdx (1)
representing a transfer of x bank florins from account j to account i on day d, entered as a debit
under merchant j’s accounts, with a corresponding credit entry for merchant i.15 Each ledger page
also contains an opening balance. These can be combined with the transfer data to yield a daily
opening balance jdb for each trading day. The scope of these data, which must be hand tran-
14 It should be emphasized that transfers over the Bank of Amsterdam’s accounts were generally “large-value” pay-ments. The average payment size in the bankers’ accounts is about 4,000 florins, as compared to the daily wage for a laborer of approximately one florin (Vries and Woude 1997). 15 Unlike modern payment systems, the Bank of Amsterdam’s accounts do not record the time of day when a pay-ment is made. In fact there is often a divergence of a day between the timing of a debit entry and the corresponding credit entry, suggesting that contemporary concept of “real-time gross settlement” amounted to at best daily settle-ment of accounts.
14
scribed, is a challenge. A full accounting of ijdx for the fiscal year 1763 (late January 1763 – ear-
ly January 1764) as is available with modern systems, would yield a data vector of approximate
dimension 1.5 billion (2,455 accounts × 2,455 accounts × ~250 trading days) with approximately
270,000 nonzero entries. To arrive at a dataset of manageable size, a number of simplifications
were employed.
The first of these was to time-aggregate ijdx into weekly payment flows for 50 weeks, for the
Bank was closed in January and in July to reconcile accounts. We also focus on the eight most
active players in the Amsterdam bill market in the years leading up to the panic, as identified in
Jong-Keesing (1939, 120). Together, payments to and from these players account for about eight
percent of transactions in the Bank’s ledgers in 1763, as measured by number of ledger entries.
Transactions between these eight accounts and the other account holders are aggregated into the
account of a fictional ninth agent (“rest of the Bank” or ROB). Finally, we employ a tenth ac-
count to keep track of coin inflows to and outflows from the first nine accounts.16 The end result
of these simplifications is a data vector { }ijtX of payments between the ten accounts over weeks
1, ,50t = … , of a more tractable dimension (≈ 10×10×50 = 5000 data points). In a similar fa-
shion, { }jdb was time-sampled to yield a weekly starting balance series{ }jtB .
Table 3 indicates the importance of rollover financing to the banks’ activities before the crisis.
With one exception (the firm Andries Pels & Zoonen), each bank’s weekly payments exceed the
funds initially available in its Bank of Amsterdam account. While there is some coin deposit and
withdrawal activity, the magnitude of this activity is small relative to the banks’ payment activi-
ty. We also note that the banks as a group are withdrawing more coin than is being deposited,
most likely in order to pursue an arbitrage described in Section 7 below.
<Table 3 is displayed in Appendix A>
The data in Table 3 are also consistent with Jong-Keesing’s (1939, 74-75) classification of Ams-
terdam bankers into the established, well-capitalized houses (Hope, Pels, and Clifford) and a
16 Additional accounts are necessary to track bullion deposits and withdrawals, discrepancies between debits and credits arising from missing entries, and changes in the capital position of the Bank. Details are given in appendix C.

15
more levered group of “parvenus” such as Neufville (in Table 3, including the firms of Vernede,
Smeth, Horneca Hogguer, and Cazenove) who had been able to break into the top ranks of the
bankers during the credit boom of the Seven Years’ War (1756-1763). The table shows that turn-
over in the parvenus’ accounts is quite active, in two cases (Neufville and Cazenove) exceeding
that the established firm of Pels. Bank balances are distinctly lower for the parvenus, and the
need for rollover financing correspondingly greater. Viewed from the perspective of its settle-
ment accounts, Gebroeders de Neufville does not appear any riskier than similar firms.
The Table 3 data can also be combined with data from Neufville’s bankruptcy filing (Jong-
Keesing 1939, 121) to shed some light on Neufville’s investment strategy. The house of Neuf-
ville suspended payments on July 30 with liabilities of 9.6 million bank florins, mostly in bills,
and (book) capital of 413 thousand florins, implying a leverage of 24 times capital. Neufville’s
weekly settlements through the Bank amounted to about 239,000 florins, implying that at least
2.5 percent of the firm’s portfolio was rolled over during an average week.17
An alternative perspective on liquidity flows documented in Table 3 is offered by the methodol-
ogy developed in Bech, Chapman, and Garratt (2010) [BCG]. Following their analysis, we fit a
simple Markov chain with states { }1, , 9… to the payments data ijtX , where the states correspond
to the eight large banks plus the ROB proxy account for the remaining Bank of Amsterdam ac-
count holders. An “adjacency matrix” is constructed for each data week t
ijtijt
ijtj
XW
X=∑
. (2)
The matrix tW is a stochastic matrix that indicates the probability of a guilder moving from one
Bank account to another. Following BCG, adjusted transition matrices tA for the Markov chain
are then constructed from tW , by taking
[0,1]iit ia θ= ∈ (3)
and
17 Neufville would have also needed to settle some bills payable in current money (Jong-Keesing 1939, 93).

16
( )1ijt i ijta wθ= − (4)
for j i≠ . BCG interpret the parameters iθ as the tendency of liquidity to be retained in account
i. Note also that from each tA one can calculate an associated steady-state probability distribu-
tion tπ over states, using standard techniques.
To calibrate the BCG model for January-June 1763, we first calculated the sample mean of the
distribution of relative starting balances (“liquidity”) ( )/it it itiy B B= ∑ over the nine accounts.
We then chose iθ to match this mean vector, by calculating time series of transition matrices tA
and the sample mean of the corresponding time series of implied steady-state distributions tπ .18
A three-parameter specification fits the empirical liquidity distribution very closely (see Appen-
dix B). Under this specification, 0iθ = for the parvenus (normalized value), .54iθ = for the es-
tablished banks, and .96iθ = for the rest of the bank. In words, liquidity is returned instanta-
neously from the parvenus, at an intermediate pace from the established banks, and very slowly
from the remaining accounts.
4. Collateral shocks
The Seven Years’ War led to a sharp expansion in lending activity in Amsterdam. The Amster-
dam bill market financed a wide range of activities associated with the war, including the move-
ment of military supplies, the floatation of sovereign loans, and movements of specie designed to
take advantage of fluctuating exchange rates (Jong-Keesing 1939, 55-86, Henderson 1962, 94-
95). The countdown to the August 1763 panic began with the slowdown of hostilities in late
1762. The Treaty of Hubertusburg (February, 1763) concluded the war and spawned two shocks
that diminished the value of the collateral backing Amsterdam’s bill transactions.
The first shock was a drop in the price of perishable commodities. Stocks of grain which had
been essential to maintaining armies in the field suddenly lost value. Grain prices in Berlin and
18 Formal estimation is problematic since (1) as BCG note, their model is not identified if all components of θ are free, and (2) in our relatively sparse dataset there is little time variation in the sample distribution of liquidity.
17
Hamburg dropped by 30 percent between November 1762 and May 1763. Even more ominous
was the decision by Prussia to dump its unused grain supplies on the Berlin market in May 1763,
leading to a 75% drop in the local price of wheat, with other agricultural prices soon following
(Schnabel and Shin 2004, 956-959). These sudden price movements impacted many of the Ams-
terdam traders’ counterparties in Berlin, but also some of the Amsterdam traders themselves.
Neufville, in particular, had collaborated with a “friend,” prominent Berlin merchant Johann
Ernst Gotzkowsky, in a disastrous deal to purchase a million guilders’ worth of grain from the
departing Russian army at the war’s end (Skalweit 1937, 94-95).
The second shock resulted from a sudden change in the direction of Prussian monetary policy. At
the start of the war, Prussia was on a monetary standard (i.e., mint equivalent) of 14 Reichstha-
lers per mark of fine silver. As the war persisted and Prussia’s fiscal situation became more des-
perate, a sequence of debasements eventually raised mint equivalents to as high as 40 thalers per
mark for some coins (Koser 1900, 341-351). The wartime inflation was extremely unpopular
with the nobility, and in May 1763 Prussia issued a new mint ordinance with the intent of revers-
ing its inflationary policies. The new ordinance demonetized the depreciated war coinage and
reduced the mint equivalent of the Reichsthaler to a “transitional” level of 19.75 thalers per mark
(Henderson 1962, 96).19 Again Neufville was negatively impacted. The firm had anticipated re-
ceiving a contract from the Prussian crown to deliver silver for the new coinage, but this deal did
not materialize (Spooner 2002, 82).
Prussian merchants holding debased wartime coinage now saw the nominal value of their colla-
teral cut in half. They responded by sending the demonetized coins to other markets where they
might have higher value as bullion (Büsch 1797, 123; Skalweit 1937, 45). Much coin was
shipped to Hamburg, where it was melted and converted to deposits at the Bank of Hamburg.
The Hamburg institution was a close copy of the Bank of Amsterdam, but unlike the Amsterdam
institution, it traditionally allowed depositors to pledge bullion as collateral (Sieveking 1934).
After undergoing this “liquidity transformation,” the silver could be accessed via bills of ex-
change payable at the Bank of Hamburg. Concerned about the inflow of unminted silver and the
19 This decision to undertake this move had already been made in December 1762, and word may have leaked out, as the Reichsthaler appreciated by about 10 percent from November 1762 through April 1763 in both Amsterdam and Hamburg (Schnabel and Shin 2004, 958).
18
subsequent outflow of high-quality coins, the Bank of Hamburg stopped accepting bullion depo-
sits, apparently sometime in early 1763.
The closing of the Hamburg bullion window led Hamburg merchants to ship silver directly to
Amsterdam (Büsch 1797, 124). Silver bullion was not eligible for deposit at the Bank of Ams-
terdam, but could be pledged as collateral in private transactions. However, the Amsterdam mar-
ket seems to have become quickly flooded with this type of collateral. Jong-Keesing (1939, 88,
note 4) cites a May 31 letter by the Amsterdam merchant De Vogel to his Hamburg correspon-
dent Emanuel Jenisch, describing the state of the Amsterdam money market at that time:
It is to our regret that the circumstances of business are now such that we cannot make our correspondence profitable … money is extremely scarce and the discount of first-rate bills is running at 5 percent20 in Bank money … . The crude bars of silver that are being smelted here from the money arriving in great quantities from Germa-ny, cannot be sold and are everywhere being borrowed against; these are also being discounted by 7 percent. … Everything is bad for business.
5. Outbreak of the panic
The proximate cause of the failure of Neufville was the suspension of payments by the minor
firm of Aron Joseph en Compagnie on July 28, 1763 (Jong-Keesing 1939, 121). Neufville’s ex-
posure to Aron Joseph was 163,000 florins, small relative to Neufville’s total book of 10 million
florins, but meaningful in the context of its 241,000 florin weekly funding requirement (Table 3).
Neufville suspended its payments at the Bank on July 30.
The failure of a firm of Neufville’s size—almost half as large as the Bank of Amsterdam itself—
shocked the Amsterdam markets. The immediate victims were a group of firms known as cash-
iers. The cashiers were comprised of about thirty financial intermediaries whose activities
formed a bridge between the large banks and ordinary merchants. Traditionally the cashiers had
served as brokers in the market for Bank funds (Dillen 1964a). By the last half of the eighteenth
century, their activities had expanded to include settlement of bills denominated in current guild-
ers, deposit-taking, and even the issue of “cashier’s receipts” that circulated locally as banknotes
(Jong-Keesing 1939, 80-81). The cashiers were run hard during the first days of the crisis, as pa- 20 Two to three percent was normal (Schnabel and Shin 2004, 942).
19
nicked holders of cashier’s receipts demanded coin from the issuers (Jong-Keesing 1939, 94-95,
164-165).
The runs on the cashiers had only an indirect effect on the Bank of Amsterdam, as the Bank itself
was unlikely to be subject to runs.21 To withdraw coin from the Bank, one had to have a deposit
receipt. Such claims were viewed as extremely secure, and receipt holders saw little reason to
sell their redemption options at a time of financial unrest. Account holders without receipts could
no more run the Bank than a modern holder of fiat money can run a modern central bank. What
they could do was to bid down the price of Bank money, denominated in bank guilders, against
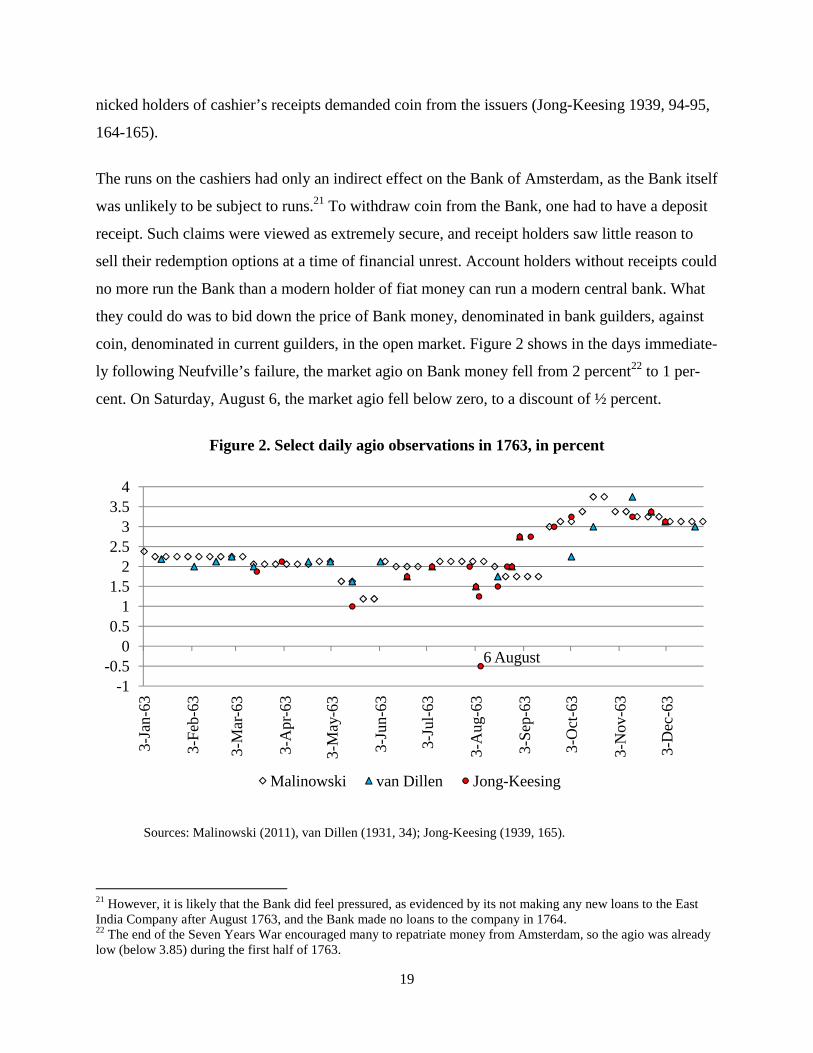
coin, denominated in current guilders, in the open market. Figure 2 shows in the days immediate-
ly following Neufville’s failure, the market agio on Bank money fell from 2 percent22 to 1 per-
cent. On Saturday, August 6, the market agio fell below zero, to a discount of ½ percent.
Figure 2. Select daily agio observations in 1763, in percent
Sources: Malinowski (2011), van Dillen (1931, 34); Jong-Keesing (1939, 165).
21 However, it is likely that the Bank did feel pressured, as evidenced by its not making any new loans to the East India Company after August 1763, and the Bank made no loans to the company in 1764. 22 The end of the Seven Years War encouraged many to repatriate money from Amsterdam, so the agio was already low (below 3.85) during the first half of 1763.
6 August
-1-0.5
00.5
11.5
22.5
33.5
4
3-Ja
n-63
3-Fe
b-63
3-M
ar-6
3
3-A
pr-6
3
3-M
ay-6
3
3-Ju
n-63
3-Ju
l-63
3-A
ug-6
3
3-Se
p-63
3-O
ct-6
3
3-N
ov-6
3
3-D
ec-6
3
Malinowski van Dillen Jong-Keesing
20
After two days and a central bank intervention (see Section 7 below), the agio bounced
back up to 2.13 percent, but the emergence of a negative agio was stunning development,
comparable to the appearance of negative T-bill rates the wake of the Lehman failure
(Derby and Rappaport 2008). A negative agio had been observed only once before, dur-
ing the French invasion of 1672 (Quinn and Roberds 2010, 16).
We interpret this development not as a sign of weakness of the Bank, but as evidence for
an extraordinary demand for coins, and a breakdown in the normal pricing relationships
between current and bank guilders. Bank funds were still in high demand, to settle ac-
cepted bills of exchange that were now coming due. In a normal market, a negative agio
would have been immediately arbitraged away by traders withdrawing coin from the
bank, selling the coin for bank funds in the open market, and using the bank funds to pur-
chase more coin. Such arbitrages were unattractive in a dysfunctional market, however.
6. Loss of liquidity in the Amsterdam bill market
In contrast to the cashiers, the first-round effects of Neufville’s failure on the shadow banks ap-
pear to have been rather limited. Rumors had been circulating for some time concerning Neuf-
ville’s solvency, and most of the large firms appear to have limited their exposure accordingly.23
More devastating to the large banks were the second-round effects of the crisis. In Amsterdam’s
most important satellite market, Hamburg, claims against Neufville amounted to around three
million florins, spread over 38 counterparties (Jong-Keesing 1939, 102). The bill market there
was faced with virtual collapse. On August 4, a group of prominent Hamburg merchants sent a
petition to Amsterdam, demanding a bankruptcy preference, and threatening a shutdown of their
market for Amsterdam bills if this was not granted:24
This morning … we received a fatal express, with the terrible news that you, the gen-tlemen of Amsterdam, would leave the Neufvilles to sink, by which we were all thun-
23 The exception was Smeth, whose bankruptcy claim against Neufville amounted to 318,750 bank florins (Jong-Keesing 1939, 110), twice its average weekly funding need (Table 3). 24 See Soetbeer (1855, 51) and Sautijn Kluit (1865, 25-26); English translation is from Tooke (1838, 149-150).
21
derstruck; never dreaming that so many men in their senses in your city could take such a step … which will infallibly plunge all Europe in an abyss of distress, if not remedied by you whilst it is still time.
We therefore send this … general letter to you …, to exhort and conjure you … to undertake still to support the Neufvilles, by furnishing what money they want, and giving them two or three persons of unquestionable probity and skill, for curators, that their affairs and their engagements may be concluded and terminated, without causing a general ruin … .
If you do not, gentlemen, we have unanimously resolved to suspend our own pay-ments as long as we shall judge it proper and necessary; and that we will not acquit them, or the counterprotests that shall come from you, or any whatever.
This proposal was rejected after some debate,25 and the Hamburg merchants’ threat only served
to initiate a three-month long shutdown of the Amsterdam market for Hamburg bills. To preserve
their own liquidity, Amsterdam bankers protested virtually all incoming bills drawn by Hamburg
counterparties (Jong-Keesing 1939, 166-171). In Hamburg, this blockade of acceptance credit
forced 93 firms into bankruptcy during the month of August (Soetbeer 1855, 52; Schnabel and
Shin 2004, 943-944). Similar shutoffs of credit and clusters of failures occurred in other places
dependent on the Amsterdam bill market, including Berlin (Skalweit 1937, 50) and Stockholm
(Jong-Keesing, 193-198).26
6.1 Measuring the loss of liquidity
The contraction of the bill market put the Amsterdam merchant bankers under heavy pressure, as
their ability to roll over funding (draw bills on debtors) was severely constricted. Although the
bankers did not issue deposits and could therefore not be “run” in the classical sense, they faced
a broadly equivalent loss of “funding liquidity” (Brunnermeier 2009, 91). The bankers did at-
tempt to control their exposures by protesting incoming bills. At the same time, they were sub-
ject to an immovable requirement to settle accepted bills: since the maturity (“usance”) of bills
25 A private bailout fund (“super SIV”) of 700,000 guilders was considered and rejected, largely due to the unpopu-larity of the Neufvilles (Jong-Keesing 1939, 121; Spooner 2002, 83.) 26 From the viewpoint of the Amsterdam banks, the blanket protests of foreign bills were justifiable as a way to insu-late themselves from potential insolvencies of Neufville’s counterparties. To the merchants in the outlying markets, these protests seemed like nothing more than a liquidity grab; a common complaint was that Amsterdam bankers even protested bills that were covered by collateral and therefore posed no credit risk to the drawee (Skalweit 1937, 86). Our data do not allow us to distinguish between these views.
22
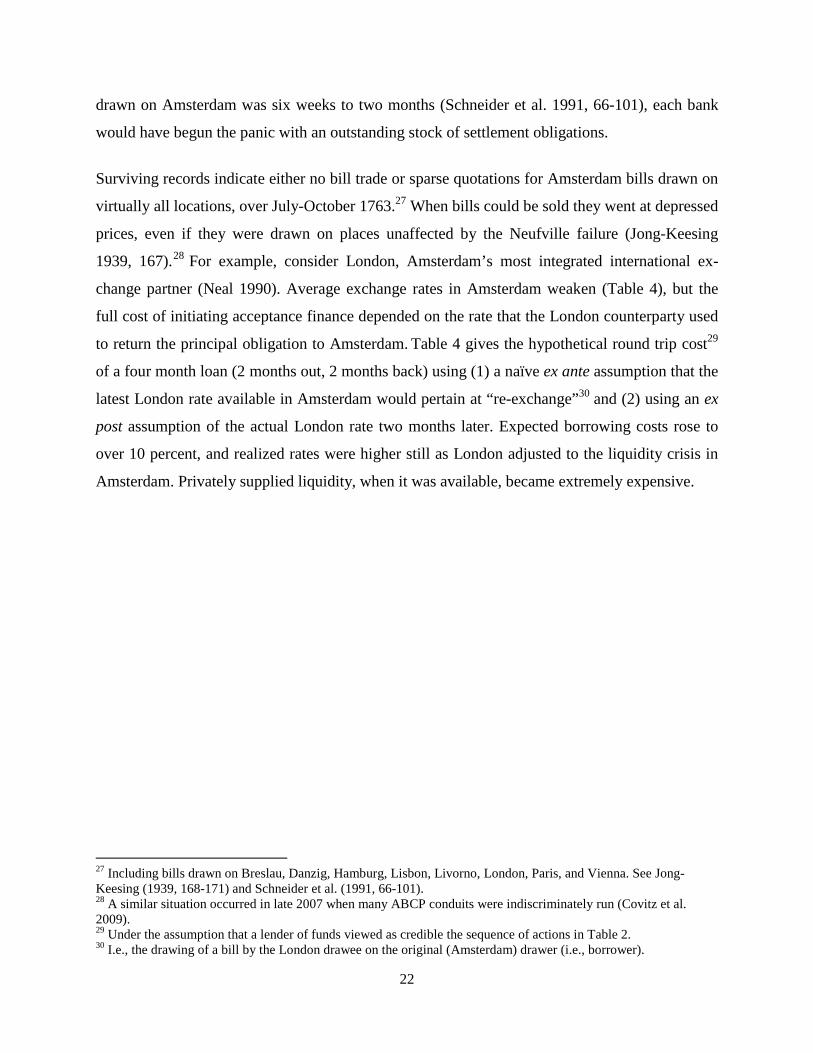
drawn on Amsterdam was six weeks to two months (Schneider et al. 1991, 66-101), each bank
would have begun the panic with an outstanding stock of settlement obligations.
Surviving records indicate either no bill trade or sparse quotations for Amsterdam bills drawn on
virtually all locations, over July-October 1763.27 When bills could be sold they went at depressed
prices, even if they were drawn on places unaffected by the Neufville failure (Jong-Keesing
1939, 167).28 For example, consider London, Amsterdam’s most integrated international ex-
change partner (Neal 1990). Average exchange rates in Amsterdam weaken (Table 4), but the
full cost of initiating acceptance finance depended on the rate that the London counterparty used
to return the principal obligation to Amsterdam. Table 4 gives the hypothetical round trip cost29
of a four month loan (2 months out, 2 months back) using (1) a naïve ex ante assumption that the
latest London rate available in Amsterdam would pertain at “re-exchange”30 and (2) using an ex
post assumption of the actual London rate two months later. Expected borrowing costs rose to
over 10 percent, and realized rates were higher still as London adjusted to the liquidity crisis in
Amsterdam. Privately supplied liquidity, when it was available, became extremely expensive.
27 Including bills drawn on Breslau, Danzig, Hamburg, Lisbon, Livorno, London, Paris, and Vienna. See Jong-Keesing (1939, 168-171) and Schneider et al. (1991, 66-101). 28 A similar situation occurred in late 2007 when many ABCP conduits were indiscriminately run (Covitz et al. 2009). 29 Under the assumption that a lender of funds viewed as credible the sequence of actions in Table 2. 30 I.e., the drawing of a bill by the London drawee on the original (Amsterdam) drawer (i.e., borrower).

23
Table 4. Average exchange rates for Amsterdam on London
Schellingen Banco/
English Pound, 2 Month Bills
Ex AnteRe-exchange Rate,
Annualized
Ex Post Re-exchange Rate,
Annualized January 1763 Through July 34.50 4.2% 4.2%
August 34.26 6.6% 12.3% September 33.79 10.9% 19.7%
October 34.65 6.6% 11.9% November 34.82 8.7% 10.3% December 35.13 7.4% 11.6%
January 1764 35.79 1.9% 6.7% February 35.88 4.8% 4.4%
March 36.02 4.7% 4.1%
Sources: Amsterdam rates from Jong-Keesing 1939, 168; London rates from the Course of the Exchange.
Loss of liquidity can also be seen in the payments data. One measure of market density is given
by a metric similar to that used by McAndrews and Rajan (2000) to study intraday payment
flows over Fedwire. This is the percentage of interbank payments funded through incoming
transfers
( )100 1t tPIT NR≡ − , (5)
where tNR is the ratio of net to gross “interbank”31 payments observed during week t, calculated
as
( ) ( )9 9 9 9 9
1 1 1 1 10.5 /t ijt jit ijti j j i j
NR X X X= = = = =
≡ −∑ ∑ ∑ ∑ ∑ (6)
The higher the value of tPIT the more symmetric are the flows of liquidity, and the less need for
banks to fund their settlement positions by providing additional collateral. Figure 3 charts the
evolution of tPIT over the data sample.
31 “Interbank” transactions are defined as transactions between two private accounts, i.e., ledger entries that do not involve the movement of metal into or out of the Bank.
24
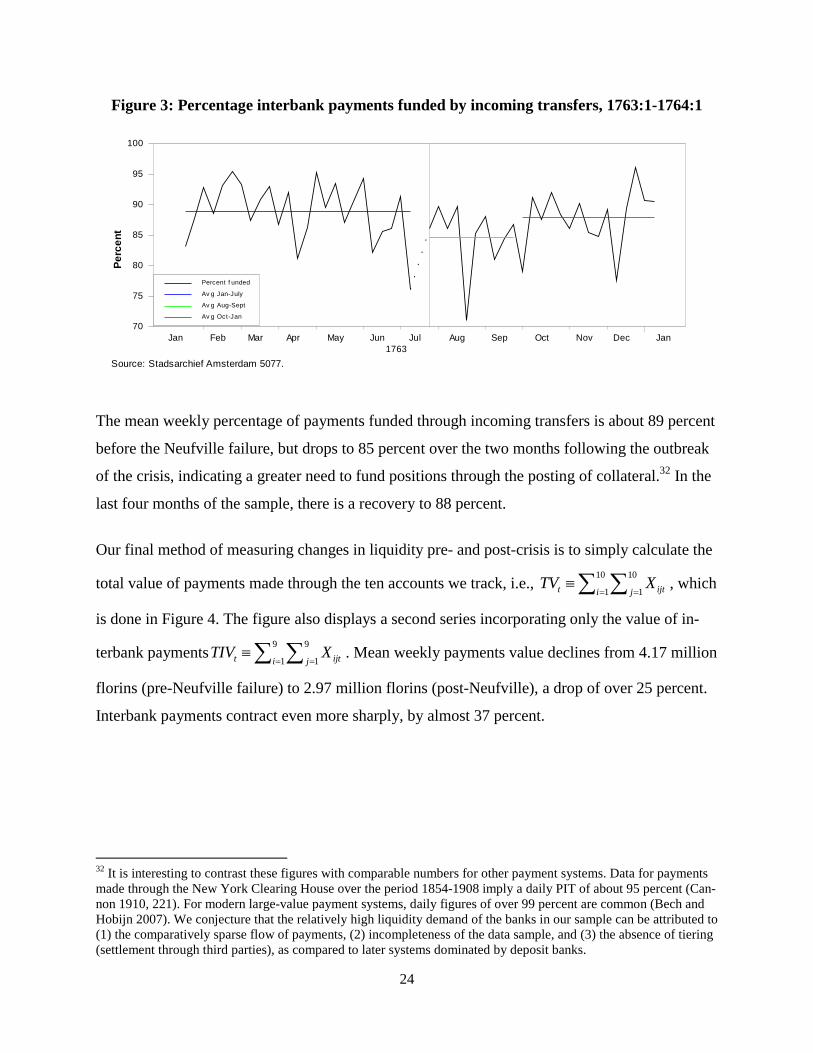
Figure 3: Percentage interbank payments funded by incoming transfers, 1763:1-1764:1
The mean weekly percentage of payments funded through incoming transfers is about 89 percent
before the Neufville failure, but drops to 85 percent over the two months following the outbreak
of the crisis, indicating a greater need to fund positions through the posting of collateral.32 In the
last four months of the sample, there is a recovery to 88 percent.
Our final method of measuring changes in liquidity pre- and post-crisis is to simply calculate the
total value of payments made through the ten accounts we track, i.e., 10 10
1 1t ijti jTV X
= =≡ ∑ ∑ , which
is done in Figure 4. The figure also displays a second series incorporating only the value of in-
terbank payments9 9
1 1t ijti jTIV X
= =≡ ∑ ∑ . Mean weekly payments value declines from 4.17 million
florins (pre-Neufville failure) to 2.97 million florins (post-Neufville), a drop of over 25 percent.
Interbank payments contract even more sharply, by almost 37 percent.
32 It is interesting to contrast these figures with comparable numbers for other payment systems. Data for payments made through the New York Clearing House over the period 1854-1908 imply a daily PIT of about 95 percent (Can-non 1910, 221). For modern large-value payment systems, daily figures of over 99 percent are common (Bech and Hobijn 2007). We conjecture that the relatively high liquidity demand of the banks in our sample can be attributed to (1) the comparatively sparse flow of payments, (2) incompleteness of the data sample, and (3) the absence of tiering (settlement through third parties), as compared to later systems dominated by deposit banks.
Source: Stadsarchief Amsterdam 5077.
Perc
ent
Jan Feb Mar Apr May Jun Jul Aug Sep Oct Nov Dec Jan1763
70
75
80
85
90
95
100
Percent f unded
Av g Jan-July
Av g Aug-Sept
Av g Oct-Jan

25
Figure 5: Aggregate payments value (weekly), 1763:1-1764:1
To gain some perspective on these numbers, it is instructive to consider changes experienced in
analogous aggregates in the wake of the Lehman bankruptcy. The daily mean value of U.S. dol-
lar payments over large-value systems33 falls from $8.6 trillion in 2008 to $7.0 trillion in 2009, a
reduction of 18 percent. (Committee on Payment and Settlement Systems 2011, table PS-3).
Higher frequency (monthly) statistics are available only for the Fedwire system34, and these
show a different pattern from that displayed in Figure 4. Fedwire payments activity peaks around
the time of the Lehman failure (reaching an all-time high of $3.2 trillion/day in September 2008)
and declines only gradually thereafter. Thus, Figure 4 attests to a substantial and immediate con-
traction of the Amsterdam bill market in August 1763.
7. Policy response
The post-Neufville credit freeze-up ultimately forced 38 Amsterdam firms into bankruptcy dur-
ing August and September 1763 (Jong-Keesing 1939, 130-145). Compared to Neufville, howev-
33 Computed as sum of the annual value of payments over Fedwire, the value of payments over CHIPS, and 85 per-cent of the value of payments over the multicurrency CLS system, all divided by 250. 34 www.frbservices.org/operations/fedwire/fedwire_funds_services_statistics.html.
Source: Stadsarchief Amsterdam 5077.
Mill
ions
Ban
k Fl
orin
s
Jan Feb Mar Apr May Jun Jul Aug Sep Oct Nov Dec Jan1763
0
1
2
3
4
5
6
7
All pay ments
Interbank only
26
er, these were small enterprises,35 and many were able to reopen within a few months, after set-
tling with creditors.36 By October, there are signs of the market returning to a more “normal”
state, albeit at lower levels of activity than before (Figure 4). These include a return of the agio to
a more normal range (Figure 2), an increase in the percentage of payments funded through in-
coming transfers (Figure 3) and a recovery of the exchange rate (Table 4). The Amsterdam mar-
ket as a whole was able to escape the devastation that took place in outlying locations.
This section will argue that a major reason for the comparatively mild impact of the panic in
Amsterdam was the provision of liquidity through the Bank of Amsterdam, which was able to
compensate for a shortage of market liquidity. As hinted at in Figure 1, demand for Bank bal-
ances was accommodated through two mechanisms. The first was the traditional “repo” (i.e., re-
ceipt) window for trade coins. The second was a new facility, a receipt window for unminted sil-
ver bullion. The bullion window was authorized on August 4, and the first transaction using this
window was recorded on August 6, the day the agio turned negative.37
Figure 5 gives some indication of the impact of these two facilities. The figure decomposes the
transactions in Figure 4 into groups, according to source of origination. The groups are (1) inter-
bank transactions originating from the three large established banks; (2) interbank transactions
originating with the parvenus; (3) interbank transactions originating from other Bank account
holders (ROB); and (4) inflows of metal, in the form of either coin or bullion.
35 The next largest bankrupt after Neufville was Cornelis Karsseboom, with liabilities of 3.5 million guilders (Jong-Keesing 1939, 146). The average liabilities of a bankrupt amounted to 669,000 guilders (Schnabel and Shin 2004, 963). 36 Settlements were common, given that “normal” resolution of bankruptcy could last up to 33 years. 37 For authorization, see Dillen (1925, 412). For start, see Amsterdam Stadsarchief 5077/1390, p. 30.

27
Figure 5: Payments value by source, 1763:1-1764:1
The figure shows that all interbank payments contract following the Neufville failure. The con-
traction is strongest in the ROB proxy account, from a pre-crisis level of about 2 million guild-
ers/ week (cf. Table 3) to a lower level of about 1.2 million, reflecting a lower demand for bank-
ers’ bills. Payments originating in bankers’ accounts do not drop off as quickly, Neufville’s col-
lapse notwithstanding. Lack of market funding caused the bankers to have a shortfall of about
300,000 guilders per week, which was partly made up through metal deposits. Metal inflows
peak about six weeks into the crisis, a time frame roughly corresponding to the usance of bills
drawn on Amsterdam in places such as Hamburg or Berlin.
The next sections provide a more detailed analysis of the impact of metal inflows.
7.1 Coin window
In many respects, coin deposits at the Bank of Amsterdam functioned much as modern central
bank repurchase transactions. Differently from the usual practice of modern central banks, how-
ever, the Bank did not try to actively vary the terms of its coin window. Nor did it attempt to
manage the quantity of receipts outstanding, but simply allowed these to adjust to market condi-
3-week moving averages. Source: Stadsarchief Amsterdam 5077.
Mill
ions
Ban
k Fl
orin
s
Jan Feb Mar Apr May Jun Jul Aug Sep Oct Nov Dec Jan1763
0.0
0.5
1.0
1.5
2.0
2.5LARGEST_BANKS
PARVENUS
ROB
Metal inf lows

28
tions.38 Thus, much of post-Neufville adjustment in the money stock can be attributed to endo-
genous shifts in the use of this facility, reflecting changes in market strategies of the merchant
banks.
Before the outbreak of the crisis, the data suggest that the merchant banks had been engaging in
arbitrage. The Bank of Amsterdam’s coin window allowed for redemptions of deposits (with a
receipt) at fixed terms that created an implied agio of around 4 percent depending on the coin.
Hence, when the market agio was below this official agio, someone holding a receipt option
could effectively purchase coins from the bank using the receipt contract’s relatively high im-
plied agio. They could then use the coins to purchase bank guilders at the low market rate
(around 2 percent depending on the week; see Figure 2). The process, however, had an endogen-
ous regulator in that the receipts themselves were negotiable with their own market price. The
execution of repurchase options would push up the price of remaining options and so increasing-
ly capture arbitrage profits without having to execute the repurchase.
Evidence of such arbitrage activity is given in Figure 6, which shows how the eight bankers (as a
group) kept their collective weekly balances (the grey area) stable. Before the failure of Neuf-
ville (vertical green line), the cumulative change (from the year start) in balances from net coin
repos (black line) remains negative, while the cumulative change in balances acquired by transfer
from the rest of the bank (red line) is positive by a similar amount. By mid-summer, this process
had churned through about 2 million bank guilders.
<Figure 6 follows next page>
38 In a similar vein, the European Central Bank engaged in several fixed-rate open market operations of indefinite size (“fixed rate tenders with full allotment”) in order to meet post-Lehman demands for liquidity; see Catalão-Lopes (2010).

Figure 6: Weekly total bank
Source: Stadsarchief Amsterdam 50
Following the Neufville failure, net t
months. To maintain their overall bal
bringing coin collateral into the bank
chose an expensive channel to mainta
liquidity without the Bank taking any
More specific evidence on the use of
the weekly balances of a particular m
29, the day before the Neufville failu
cumulative position from net transfer
already become illiquid the week of A
make use of the bullion window, but
sit of coin.
-2,000
-1,500
-1,000
-500
0
500
1,000
1,500
2,000
2,500
24-J
an-6
3
21-F
eb-6
3
21-M
ar-6
3
18-A
pr-6
3
Tho
usan
ds o
f Ban
k G
uild
ers
Balances CUM
29
ker balances in 1763 with accumulation by chan
077.
transfers flowed relentlessly from the bankers for
lances, the bankers created 2 million new bank gu
k. That is, the bankers forsook arbitrage returns an
ain their balances. This channel generated large a
y new policy action.
f the coin window is given in Figure 7. The figure
merchant bank, Horneca Hogguer en Compagnie,
ure, to the end of the Bank’s fiscal year. Horneca H
rs declines rapidly in August, and its account wou
August 8 but for coin receipts. Horneca Hogguer
was able to maintain its liquidity position through
16-M
ay-6
3
13-J
un-6
3
11-J
ul-6
3
8-A
ug-6
3
5-Se
p-63
3-O
ct-6
3
31-O
ct-6
3
28-N
ov-6
3
M Transfers CUM Coin CUM Bullion
nnel
two
uilders by
nd instead
amounts of
displays
from July
Hogguer’s
uld have
did not
h the depo-
26-D
ec-6
3
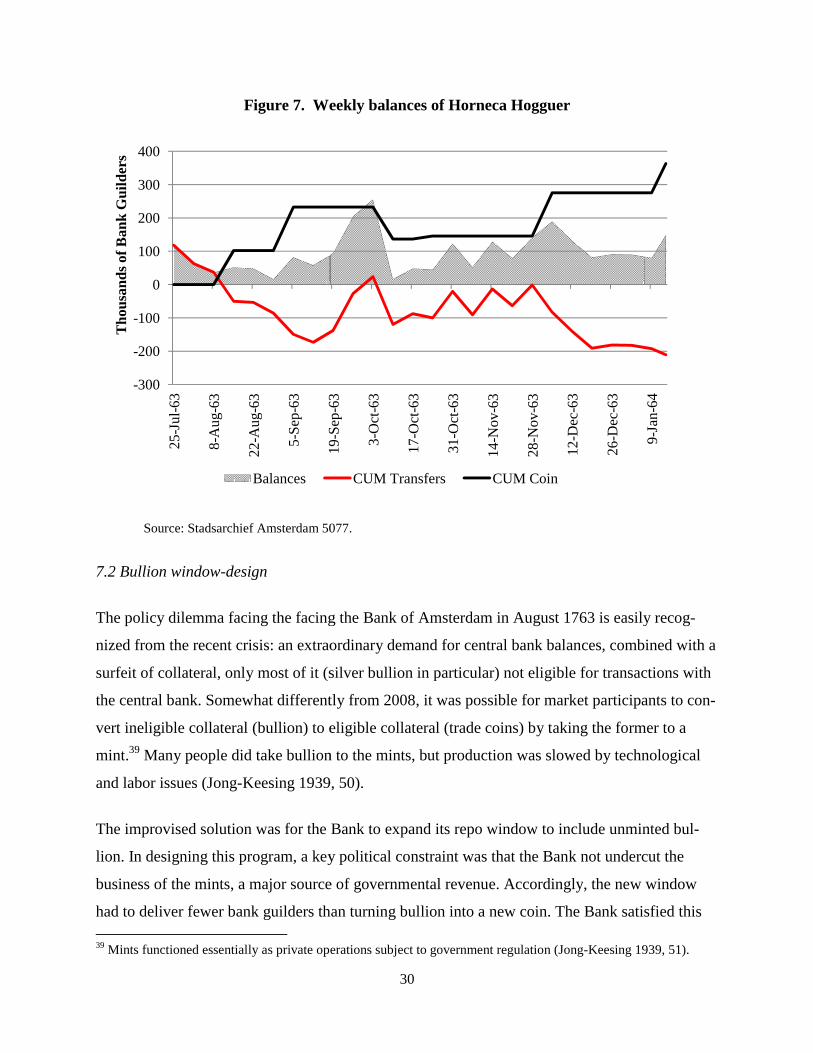
Figure 7. We
Source: Stadsarchief Amsterdam 50
7.2 Bullion window-design
The policy dilemma facing the facing
nized from the recent crisis: an extrao
surfeit of collateral, only most of it (s
the central bank. Somewhat different
vert ineligible collateral (bullion) to e
mint.39 Many people did take bullion
and labor issues (Jong-Keesing 1939
The improvised solution was for the
lion. In designing this program, a key
business of the mints, a major source
had to deliver fewer bank guilders th 39 Mints functioned essentially as private op
-300
-200
-100
0
100
200
300
40025
-Jul
-63
8-A
ug-6
3
22-A
ug-6
3
5-Se
p-63
19S
63
Tho
usan
ds o
f Ban
k G
uild
ers
Balances
30
eekly balances of Horneca Hogguer
077.
g the Bank of Amsterdam in August 1763 is easily
ordinary demand for central bank balances, comb
silver bullion in particular) not eligible for transac
tly from 2008, it was possible for market participa
eligible collateral (trade coins) by taking the form
n to the mints, but production was slowed by techn
9, 50).
Bank to expand its repo window to include unmin
y political constraint was that the Bank not underc
e of governmental revenue. Accordingly, the new
han turning bullion into a new coin. The Bank sati
erations subject to government regulation (Jong-Keesing 19
19-S
ep-6
3
3-O
ct-6
3
17-O
ct-6
3
31-O
ct-6
3
14-N
ov-6
3
28-N
ov-6
3
12-D
ec-6
3
26-D
ec-6
3
CUM Transfers CUM Coin
y recog-
bined with a
ctions with
ants to con-
mer to a
nological
nted bul-
cut the
window
sfied this
939, 51).
9-Ja
n-64
31
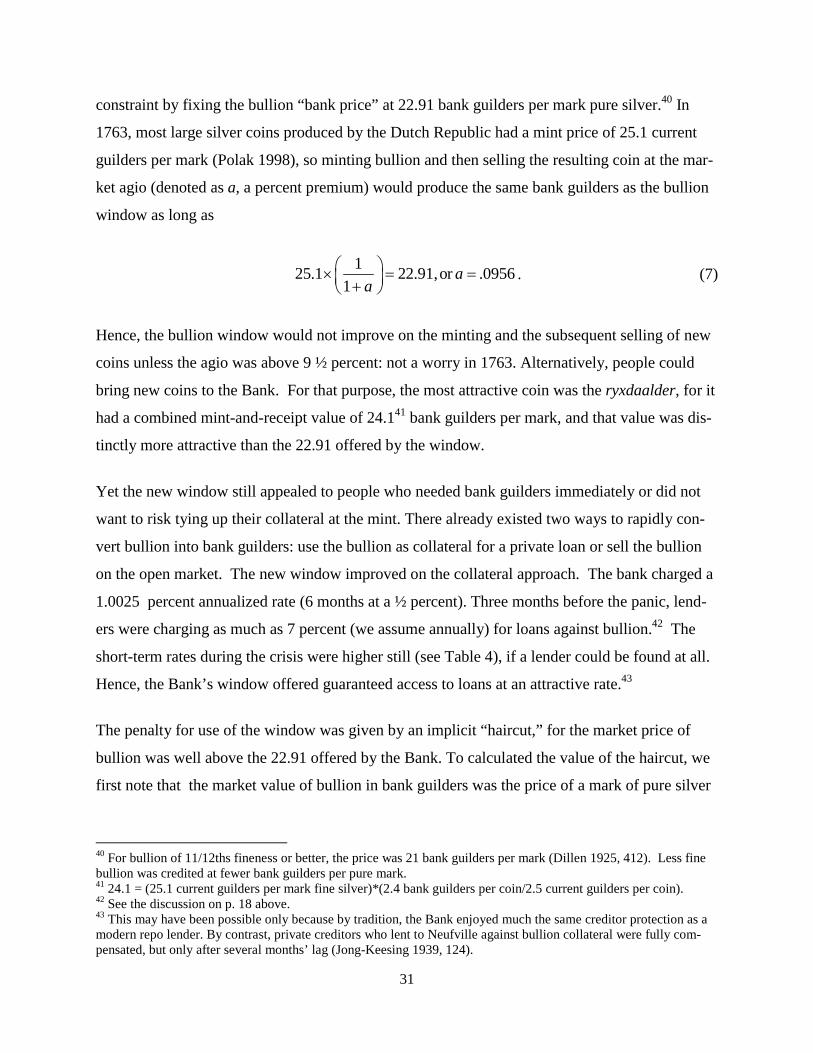
constraint by fixing the bullion “bank price” at 22.91 bank guilders per mark pure silver.40 In
1763, most large silver coins produced by the Dutch Republic had a mint price of 25.1 current
guilders per mark (Polak 1998), so minting bullion and then selling the resulting coin at the mar-
ket agio (denoted as a, a percent premium) would produce the same bank guilders as the bullion
window as long as
125.1 22.91,or .0956
1a
a⎛ ⎞× = =⎜ ⎟+⎝ ⎠
. (7)
Hence, the bullion window would not improve on the minting and the subsequent selling of new
coins unless the agio was above 9 ½ percent: not a worry in 1763. Alternatively, people could
bring new coins to the Bank. For that purpose, the most attractive coin was the ryxdaalder, for it
had a combined mint-and-receipt value of 24.141 bank guilders per mark, and that value was dis-
tinctly more attractive than the 22.91 offered by the window.
Yet the new window still appealed to people who needed bank guilders immediately or did not
want to risk tying up their collateral at the mint. There already existed two ways to rapidly con-
vert bullion into bank guilders: use the bullion as collateral for a private loan or sell the bullion
on the open market. The new window improved on the collateral approach. The bank charged a
1.0025 percent annualized rate (6 months at a ½ percent). Three months before the panic, lend-
ers were charging as much as 7 percent (we assume annually) for loans against bullion.42 The
short-term rates during the crisis were higher still (see Table 4), if a lender could be found at all.
Hence, the Bank’s window offered guaranteed access to loans at an attractive rate.43
The penalty for use of the window was given by an implicit “haircut,” for the market price of
bullion was well above the 22.91 offered by the Bank. To calculated the value of the haircut, we
first note that the market value of bullion in bank guilders was the price of a mark of pure silver
40 For bullion of 11/12ths fineness or better, the price was 21 bank guilders per mark (Dillen 1925, 412). Less fine bullion was credited at fewer bank guilders per pure mark. 41 24.1 = (25.1 current guilders per mark fine silver)*(2.4 bank guilders per coin/2.5 current guilders per coin). 42 See the discussion on p. 18 above. 43 This may have been possible only because by tradition, the Bank enjoyed much the same creditor protection as a modern repo lender. By contrast, private creditors who lent to Neufville against bullion collateral were fully com-pensated, but only after several months’ lag (Jong-Keesing 1939, 124).
32
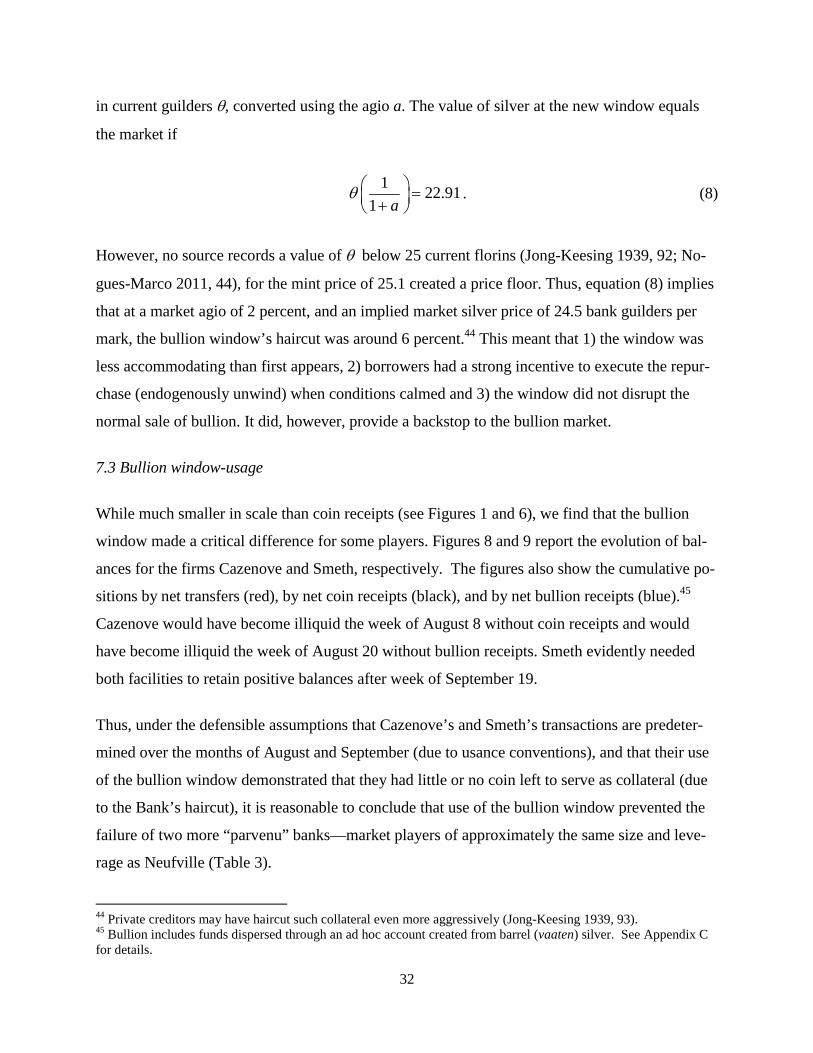
in current guilders θ, converted using the agio a. The value of silver at the new window equals
the market if
1 22.91
1 aθ ⎛ ⎞ =⎜ ⎟+⎝ ⎠
. (8)
However, no source records a value of θ below 25 current florins (Jong-Keesing 1939, 92; No-
gues-Marco 2011, 44), for the mint price of 25.1 created a price floor. Thus, equation (8) implies
that at a market agio of 2 percent, and an implied market silver price of 24.5 bank guilders per
mark, the bullion window’s haircut was around 6 percent.44 This meant that 1) the window was
less accommodating than first appears, 2) borrowers had a strong incentive to execute the repur-
chase (endogenously unwind) when conditions calmed and 3) the window did not disrupt the
normal sale of bullion. It did, however, provide a backstop to the bullion market.
7.3 Bullion window-usage
While much smaller in scale than coin receipts (see Figures 1 and 6), we find that the bullion
window made a critical difference for some players. Figures 8 and 9 report the evolution of bal-
ances for the firms Cazenove and Smeth, respectively. The figures also show the cumulative po-
sitions by net transfers (red), by net coin receipts (black), and by net bullion receipts (blue).45
Cazenove would have become illiquid the week of August 8 without coin receipts and would
have become illiquid the week of August 20 without bullion receipts. Smeth evidently needed
both facilities to retain positive balances after week of September 19.
Thus, under the defensible assumptions that Cazenove’s and Smeth’s transactions are predeter-
mined over the months of August and September (due to usance conventions), and that their use
of the bullion window demonstrated that they had little or no coin left to serve as collateral (due
to the Bank’s haircut), it is reasonable to conclude that use of the bullion window prevented the
failure of two more “parvenu” banks—market players of approximately the same size and leve-
rage as Neufville (Table 3).
44 Private creditors may have haircut such collateral even more aggressively (Jong-Keesing 1939, 93). 45 Bullion includes funds dispersed through an ad hoc account created from barrel (vaaten) silver. See Appendix C for details.
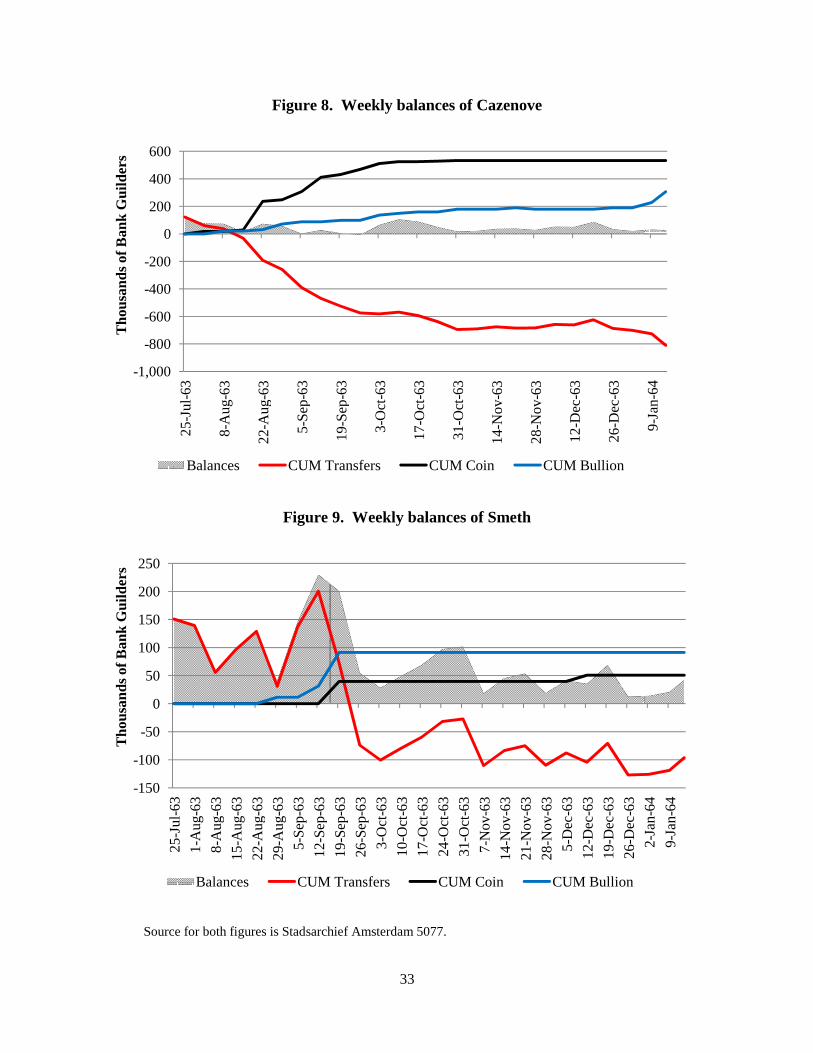
Figure 8.
Figure
Source for both figures is Stadsarch
-1,000
-800
-600
-400
-200
0
200
400
600
25-J
ul-6
3
8-A
ug-6
3
22-A
ug-6
3
5-Se
p-63
Tho
usan
ds o
f Ban
k G
uild
ers
Balances CUM T
-150
-100
-50
0
50
100
150
200
250
25-J
ul-6
31-
Aug
-63
8-A
u g-6
315
-Aug
-63
22-A
u g-6
329
-Aug
-63
5-Se
p-63
12-S
e p-6
3
Tho
usan
ds o
f Ban
k G
uild
ers
Balances CUM
33
. Weekly balances of Cazenove
9. Weekly balances of Smeth
hief Amsterdam 5077.
19-S
ep-6
3
3-O
ct-6
3
17-O
ct-6
3
31-O
ct-6
3
14-N
ov-6
3
28-N
ov-6
3
12-D
ec-6
3
26-D
ec-6
3
Transfers CUM Coin CUM Bullion
19-S
ep-6
326
-Sep
-63
3-O
ct-6
310
-Oct
-63
17-O
ct-6
324
-Oct
-63
31-O
ct-6
37-
Nov
-63
14-N
ov-6
321
-Nov
-63
28-N
ov-6
35-
Dec
-63
12-D
ec-6
319
-Dec
-63
26-D
ec-6
3
M Transfers CUM Coin CUM Bullion
9-Ja
n-64
2-Ja
n-64
9-Ja
n-64
34
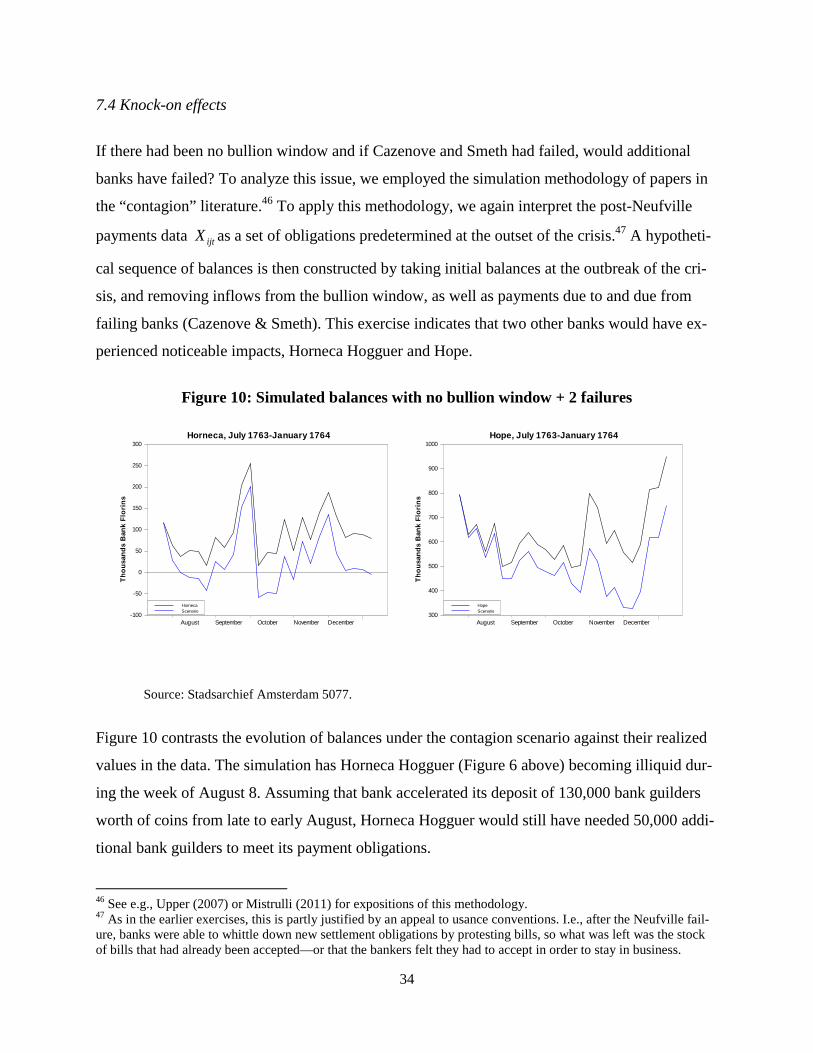
7.4 Knock-on effects
If there had been no bullion window and if Cazenove and Smeth had failed, would additional
banks have failed? To analyze this issue, we employed the simulation methodology of papers in
the “contagion” literature.46 To apply this methodology, we again interpret the post-Neufville
payments data ijtX as a set of obligations predetermined at the outset of the crisis.47 A hypotheti-
cal sequence of balances is then constructed by taking initial balances at the outbreak of the cri-
sis, and removing inflows from the bullion window, as well as payments due to and due from
failing banks (Cazenove & Smeth). This exercise indicates that two other banks would have ex-
perienced noticeable impacts, Horneca Hogguer and Hope.
Figure 10: Simulated balances with no bullion window + 2 failures
Source: Stadsarchief Amsterdam 5077.
Figure 10 contrasts the evolution of balances under the contagion scenario against their realized
values in the data. The simulation has Horneca Hogguer (Figure 6 above) becoming illiquid dur-
ing the week of August 8. Assuming that bank accelerated its deposit of 130,000 bank guilders
worth of coins from late to early August, Horneca Hogguer would still have needed 50,000 addi-
tional bank guilders to meet its payment obligations.
46 See e.g., Upper (2007) or Mistrulli (2011) for expositions of this methodology. 47 As in the earlier exercises, this is partly justified by an appeal to usance conventions. I.e., after the Neufville fail-ure, banks were able to whittle down new settlement obligations by protesting bills, so what was left was the stock of bills that had already been accepted—or that the bankers felt they had to accept in order to stay in business.
Horneca, July 1763-January 1764
Thou
sand
s B
ank
Flor
ins
August September October November December-100
-50
0
50
100
150
200
250
300
HornecaScenario
Hope, July 1763-January 1764
Thou
sand
s B
ank
Flor
ins
August September October November December300
400
500
600
700
800
900
1000
HopeScenario
35
Of the remaining four banks, the biggest effects are for Hope, with a cumulative reduction in
balances of about 200,000 guilders.48 This loss comes primarily late in the year, however, so the
number serves as more of an upper bound than a point estimate of the loss. Buist (1974, 520)
puts the capital of Hope en Compagnie at 4.6 million current guilders in 1763, suggesting that
Hope would have easily absorbed shortfalls stemming from the failures of additional parvenus,
so long as asset liquidation was not a problem.49 Nonetheless, even for Hope, 200,000 guilders
would have been a considerable sum, equal to 44 percent of the firm’s distributed profits for the
year (Buist 1975, 521).
The above exercise does not calculate additional knock-on failures within the rest of the Bank of
Amsterdam. This is a limitation of our data, but the Neufville experience suggests that more
bankruptcies likely would have resulted, both within Amsterdam and abroad. It is probable that
the bullion window succeeded in stopping an additional batch of failures, even if we do not know
the number and magnitude of these. For example, Figure 11 plots the cumulative position of the
coin window use and the bullion window use by the rest of the Bank.50 From July 29 to Septem-
ber 26, the rest of the Bank used each facility in similar amounts, 931,000 bank guilders for coins
and 837,000 for bullion. So during the crisis, the rest of the bank brought in 43 percent of the
coin that the bankers did, yet they brought in 167 percent of the bullion. Some non-bankers ap-
pear to have had a greater need for the bullion window than did the bankers.
<Figure 11 follows next page.>
48 This figure does not change by very much if we assume that Horneca Hogguer also fails. 49 This inference is buttressed by Hope’s offer to contribute half a million guilders to a bailout fund that was pro-posed at the beginning of the crisis (Dillen 1922, 249). 50 The rest of the Bank’s net position had been stable for months prior to Figure 10

36
Figure 11: Two cumulative positions for the rest of the Bank, by week.
Source: Stadsarchief Amsterdam 5077.
Figure 11 also shows that non-banks stopped using the bullion window after worst effects of the
banking crisis in Amsterdam had passed. Outside, however, the Panic of 1763 only served to
mark the beginning of a deep and long recession, most notably in Prussia (Schnabel and Shin
2004, 945-946). One consequence of the lingering effects of the crisis seems to have been a
“flight to quality”: net coin flows into the Bank of Amsterdam surged by 4.1 million bank guild-
ers in the fourth quarter, and the Bank reached its two-century maximum balance of 30.9 million
bank guilders (Dillen 1925, 962-6). While 18 percent of the last-quarter surge were ryxdaalders
(likely newly minted), almost all the rest were Spanish dollars.51 The fact that this tsunami of sil-
ver receded the next year52 suggests to us that the crisis forced many non-bankers into direct li-
quidity creation in order to settle existing obligations – including debts with a maturity of three
or more months when the crisis struck.
7.6 Paths not taken
A modern observer might ask why the Bank of Amsterdam did not respond to the crisis using the
more familiar central banking tools of discount window lending and active open market opera-
tions.
51 Calculated using Amsterdam Stadsarchief 5077/1390, folios 47-9. 52 Balances had fallen to 26 million by the end of 1764 and to 16 ½ million by the end of 1765 (Dillen 1925, 996).
0123456
25-J
ul-6
3
8-A
ug-6
3
22-A
ug-6
3
5-Se
p-63
19-S
ep-6
3
3-O
ct-6
3
17-O
ct-6
3
31-O
ct-6
3
14-N
ov-6
3
28-N
ov-6
3
12-D
ec-6
3
26-D
ec-6
3
9-Ja
n-64
Mill
ions
of B
ank
Gui
lder
s
CUM Coin CUM Bullion

37
In the case of the former, the answer is simply that it was beyond the Bank’s charter to lend to
individuals or accept debt obligations (bills) as collateral. In the case of the latter, the available
policy options would have worsened either the crisis inside the Bank or the crisis outside the
Bank. The open market sale of coins by the Bank could lift the agio, but it would have also de-
creased the supply of bank guilders.53 In addition, vault records indicate that at the time of the
crisis, the Bank held only 281,804 bank guilders54 of “unencumbered reserves” (coins not held
under receipt), so a sale policy was not a realistic option. In contrast, purchases of coins would
have increased liquidity within the Bank, but it would have put downward pressure on the agio.
Bullion purchases55 posed similar problems, for silver bullion was rushing to the Dutch mints.
Reducing this flow would disrupt seigniorage revenue to provincial governments, disrupt the in-
crease in the supply of current money, and disrupt the resultant recovery of the agio. By opening
a bullion window, the Bank avoided these problems, while still offering a Bagehot-like balance
of unlimited potential quantity at a price only the neediest would chose.
7. Lessons learned
The Panic of 1763 offers a distressingly familiar recipe for financial conflagration. Flammable
ingredients include a system of securitization with numerous embedded liabilities (acceptance
loans), a large shock to collateral values (the end of the Seven Years’ War), and erratic policy
decisions (on the part of the Prussian monetary authorities). The spark is provided by the col-
lapse of a single participant (Neufville) who is “too interconnected to fail” (in the view of Ham-
burg petitioners), but who fails nonetheless. Missing from the mix are the too-big-to-fail distor-
tions of modern financial environments, but these were hardly necessary in the lightly regulated
world of eighteenth-century finance.
53 Mees (1838, 109) argues that the Bank also feared that coins used to purchase Bank florins would quickly be shipped abroad, depriving Amsterdam of needed collateral. 54 Calculated using Amsterdam Municipal Archives 5077/1390, folios 0, 3 and 43. See Appendix C. 55 In the seventeenth Century, the Bank bought and sold bullion through open market operations (Quinn and Robe-rds 2010), but by the eighteenth century, its purchases consisted primarily of single-guilder coins that had no colla-teral rights at the Bank.
38
The Bank of Amsterdam’s firefighting efforts also displayed a light touch—by the standards of
2008—but our evidence shows that they were effective within the confines of the Amsterdam
market. Unlimited amounts of liquidity were made available, on fixed terms, through the Bank’s
traditional (coin) repo window, a type of policy that would be repeated 245 years later. A second
window was opened for less conventional assets (bullion). This window was lightly used, yet it
was well designed for its limited purpose. It assisted a central niche of market participants, and
did not disrupt adjustment processes occurring outside the Bank.
The two liquidity facilities, working in combination, prevented additional failures of major mar-
ket participants, and contained the domestic fallout from the crisis. The Bank’s victory was only
partial, however, because it could not route liquidity to where it was needed most—to outlying
localities where the flow of trade credit depended on access to the Amsterdam market. This poli-
cy failure was compounded by a lack of finality in financial transactions, leading to chains of
defaults and a complete shutdown of credit in some areas.
This mixed record leads to the following implication for understanding the effectiveness of the
post-Lehman policy interventions: that the success of these efforts may not have been attributa-
ble to the ingenious design of specific facilities, or the sheer mass of liquidity offered up. Rather,
the key elements may have been what northern Europe lacked in August 1763: robust settlement
institutions and the free flow of liquidity across national borders.
39
References
Adrian, Tobias, Karin Kimbrough, and Dina Marchioni. 2010. “The Federal Reserve’s Commer-cial Paper Funding Facility.” Federal Reserve Bank of New York, Staff Report no. 423.
Allen, William A. and Richhild Moessner. 2011. “The international propagation of the financial crisis of 2008 and a comparison with 1931.” Bank for International Settlements, Working Paper no. 248.
Bech, Morten L. and Bart Hobijn. 2007. “Technology Diffusion within Central Banking: the Case of Real-Time Gross Settlement.” International Journal of Central Banking (Septem-ber), 147-181.
Bech, Morten L., James T.E. Chapman, and Rodney J. Garratt. 2010. “Which bank is the ‘cen-tral’ bank?” Journal of Monetary Economics 57, 352-363.
Brunnermeier, Markus K. 2009. “Deciphering the Liquidity and Credit Crunch 2007-2008.” Journal of Economic Perspectives 23(1), 77-100.
Buist, Marten G. 1974. At spes non fracta: Hope & Co. 1770-1815. Martinus Nijhoff, the Hague.
Büsch, Johann Georg. 1797. Versuch einer Geschichte der Hamburgischen Handlung nebst 2 kleineren Schriften verwandten Inhalts. Benjamin Gottlob Hoffman, Hamburg.
Cannon, James G. 1910. Clearing Houses. Report by the National Monetary Commission to the U.S. Senate, 61st Congress, 2nd session, Doc. 491. Government Printing Office, Washington, D.C.
Catalão-Lopes, Margarida. 2010. “Fixed- and Variable-Rate Tenders in the Management of Li-quidity by the Eurosystem: Implications of the Recent Credit Crisis.” International Journal of Central Banking 6(2): 199-230.
Committee on Payment and Settlement Systems. 1992. Delivery versus Payment in Securities Settlement Systems. Bank for International Settlements, Basel.
Committee on Payment and Settlement Systems. 2003. A glossary of terms used in payments and settlement systems. Bank for International Settlements, Basel.
Committee on Payment and Settlement Systems. 2011. Statistics on payment and settlement sys-tems in the CPSS countries – Figures for 2009. Bank for International Settlements, Basel.
Covitz, Daniel M., Nellie Liang, and Gustavo A. Suarez. 2009. “The Evolution of a Financial Crisis: Panic in the Asset-Backed Commercial Paper Market.” Finance and Economics Dis-cussion Series no. 2009-36, Federal Reserve Board.
40
Dang, Tri Vi, Gary Gorton, and Bengt Holmström. 2009. “Opacity and the Optimality of Debt for Liquidity Provision.”
Davis, Lance and Robert Gallman. 2001. Evolving Financial Markets and International Capital Flows. Cambridge: Cambridge University Press.
Dehing, Pit, and Marjolein ‘t Hart. 1997. “Linking the fortunes, currency and banking, 1550-1800.” In A Financial History of the Netherlands, ed. Marjolein ‘t Hart, Joost Jonker and Jan Luiten van Zanden, 37-63. Cambridge University Press, Cambridge.
Derby, Michael S. and Liz Rappaport. 2008. “Safety Trumps Yield in Bill Sales—Investors Scoop Up 0% Short-Term Notes.” Wall Street Journal, 10 December.
Dillen, Johannes Gerard van. 1922. “De Beurscrisis te Amsterdam in 1763.” Tijdschrift voor Geschiedenis.
Dillen, Johannes Gerard van. 1925. Bronnen Tot de Geschiedenis der Wisselbanken. Martinus Nijhoff, The Hague.
Dillen, Johannes Gerard van. 1931. “Effectenkoersen aan de Amsterdamsche Beurs 1723-1794.” Economisch-Historish Jaarboek, 17, 1-46.
Dillen, Johannes Gerard van. 1934. “The Bank of Amsterdam.” In History of the Principal Pub-lic Banks, ed. Johannes Gerard van Dillen, 79-124. Martinus Nijhoff, The Hague.
Dillen, Johannes Gerard van. 1964a. “Oprichting en Functie der Amsterdamse Wisselbank in de zeventiende Eeuw 1609-1686,” in J.G. van Dillen, ed. Mensen en Achtergronden, Studies uitgegeven ter gelegenheid van de tachtigste jaardag van de schrijver. J.B. Wolters, Groningen.
Dillen, Johannes Gerard van. 1964b. “Bloeitijd der Amsterdamse Wisselbank 1687-1781,” in J.G. van Dillen, ed. Mensen en Achtergronden, Studies uitgegeven ter gelegenheid van de tachtigste jaardag van de schrijver. J.B. Wolters, Groningen.
Ferderer, J. Peter. 2003. “Institutional Innovation and the Creation of the Liquid Financial Mar-kets: the Case of Bankers’ Acceptances, 1914-1934.” Journal of Economic History 63: 666-94.
Flandreau, Marc and Stefano Ugolini. 2011. “Where it All Began: Lending of Last Resort and the Bank of England during the Overend, Gurney Panic of 1866.” Graduate Institute of Inter-national and Development Studies Working Paper No: 04/2011.
Fleming, Michael J., Warren B. Hrung, and Frank Keane. 2010. “Repo Market Effects of the Term Securities Lending Facility.” Federal Reserve Bank of New York Staff Report #426.

41
Gorton, Gary and Andrew Metrick. 2010. “Regulating the Shadow Banking System.” Brookings Papers on Economic Activity (Fall): 261-303.
Henderson, W. O., 1962. “The Berlin Commercial Crisis of 1763.” The Economic History Re-view, New Series 15(1), 89-102.
Hoffman, Philip, Gilles Postal-Vinay and Jean-Laurent Rosenthal. 2000. Prices Markets: The Political Economy of Credit in Paris. Chicago University Press, Chicago.
Jong-Keesing, Elisabeth Emmy de, 1939. De Economische Crisis van 1763 te Amsterdam. N.V. Intern. Uitgevers en h. Mij, Amsterdam.
Joslin, David M. 1954. “London Private Bankers 1720-1785.” Economic History Review, second series, 7, 167-186.
Kapperczyk, Marcin and Phillip Schnabl. 2010. “When Safe Proved Risky: Commercial Paper during the Financial Crisis of 2007-2009.” Journal of Economic Perspectives 24(1), 29-50.
Koser, Reinhold. 1900. Die preussischen Finanzen im siebenjährigen Krieg. Forschungen zur brandenburgischen und preussischen Geschichte, Leipzig.
Malinowski, Mikokaj. 2011. “Weekly Prices in Amsterdam in the 18th Century.” International Institute of Social History, Historical Prices and Wages at www.iisg.nl/hpw/
McAndrews, James and Samira Rajan. 2000. “The Timing and Funding of Fedwire Funds Trans-fers.” Federal Reserve Bank of New York Economic Policy Review 6(2), 17-32.
McAndrews, James, Asani Sarkar, and Zhenyu Wang. 2008. “The Effect of the Term Auction Facility on the London Inter-Bank Offered Rate.” Federal Reserve Bank of New York, Staff Report no. 335.
Mees, Willem C. 1838. Proeve eener Geschiedenis van het Bankwezen in Nederland geduerende den Tijd der Republiek. W. Messcuert, Rotterdam.
Mistrulli, Paolo Emilio. 2011. “Assessing financial contagion in the interbank market: Maximum entropy versus observed interbank lending patterns.” Journal of Banking and Finance 35, 1114-1127.
Nogues-Marco, Pilar. 2011. “Competing Bimetallic Ratios: Amsterdam, London and Bullion Arbitrage in the 18th Century.” Universidad Carlos III de Madrid, Working Papers in Eco-nomic History, WP 11-03.
Polak, Menno. 1998. Historiografie en Economie van de ‘Muntchaos’, Deel II. NEHA, Amster-dam.
42
Pozsar, Zoltan, Tobias Adrian, Adam Ashcraft, and Hayley Boesky. 2010. “Shadow Banking.” Staff Report no. 458, Federal Reserve Bank of New York.
Quinn, Stephen and William Roberds. 2010. “How Amsterdam got Fiat Money.” Federal Re-serve Bank of Atlanta Working Paper 2010-17.
Sautijn Kluit, W.P. 1865. De Amsterdamsche Beurs in 1763 en 1773. W.H. Zeelt, Amsterdam.
Schnabel, Isabel, and Hyun Song Shin, 2004. “Liquidity and Contagion: The Crisis of 1763.” Journal of the European Economic Association 2(6): 929-968.
Schneider, Jürgen, Oskar Schwarzer, and Petra Schnelzer. 1991. Historische Statistik von Deut-schland. Band XII: Statistik der Geld- und Wechselkurse in Deutschland und im Ostseeraum (18. Und 19. Jahrhundert). Scripta-Mercuratae-Verlag, St. Katharinen.
Sieveking, Heinrich, 1934. “Die Hamburger Bank.” In History of the Principal Public Banks, ed. Johannes Gerard van Dillen, 125-160. Martinus Nijhoff, The Hague.
Skalweit, Stephan, 1937. Die Berliner Wirtschaftskrise von 1763 und ihre Hintergründe. W. Kohlhammer, Stuttgart-Berlin.
Soetbeer, Adolph, 1855. Beiträge und Materialien zur Beurtheilung von Geld- und Bank-Fragen mit besonderer Rücksicht auf Hamburg. Herold’sche Buchhandlung, Hamburg.
Spooner, Frank C. 2002. Risks at Sea: Amsterdam insurance and maritime Europe, 1766-1780. Cambridge University Press.
Tooke, Thomas. 1838. A History of Prices and of the State of Circulation from 1793 to 1837, Vol. I. Longman, Orme, Brown, Green, and Longmans, London.
Upper, Christian. 2007. “Using counterfactual simulations to assess the contagion in interbank markets.” Bank for International Settlements, Working Paper no. 234.

43
Appendix A: Additional table.

44
Table 3: Overview of Bank of Amsterdam transactions, January-July 1763
(units are thousands of bank florins unless otherwise indicated)
Merchant bank (account j)
Mean weekly starting bal-
ance 1
jttT B− ∑
Number debit
entries, account
j
Mean weekly interbank56
debits 91
1 ijtt iT X−
=∑ ∑
Mean coin withdraw-
als 1
10, jttT X− ∑
Mean coin deposits 1
,10,j ttT X− ∑
Mean total debits
101
1 ijtt iT X−
=∑ ∑
Mean ratio debits /
balances
( )101
1/ijt jtt i
T X B−
=∑ ∑
Hope & Compagnie 439.3 2151 448.2 25.7 24.2 473.9 1.12 Andries Pels & Zoonen 359.7 1485 220.8 25.0 0.0 245.8 0.70 George Clifford & Zoonen 277.1 1819 368.9 23.4 1.9 392.3 1.49 Gebroeders de Neufville 103.3 1395 239.3 2.0 0.4 241.3 2.69 Vernede & Compagnie 99.0 120457 179.2 0.4 1.4 179.5 2.75 Raymond & Theodoor de Smeth 77.7 799 153.8 10.8 0.0 164.5 2.57
Horneca Hogguer & Co. 69.7 987 134.0 12.8 1.0 146.7 2.51 Charles & Theophilus Caze-nove 68.7 1351 224.4 3.3 0.0 227.7 4.25
Total 8 large banks 1,494.5 11,191 1968.6 103.4 28.9 2071.7
(Rest of the Bank accounts) 21,686.0 1811.358 114.0 150.5 1925.359
56 “Interbank” refers to transactions between private accounts that do not involve the flow of metal into or out of the Bank. 57 Authors’ estimate. 58 Sum of transfers to eight most active accounts. 59 Sum of coin withdrawals plus transfers to eight most active accounts.
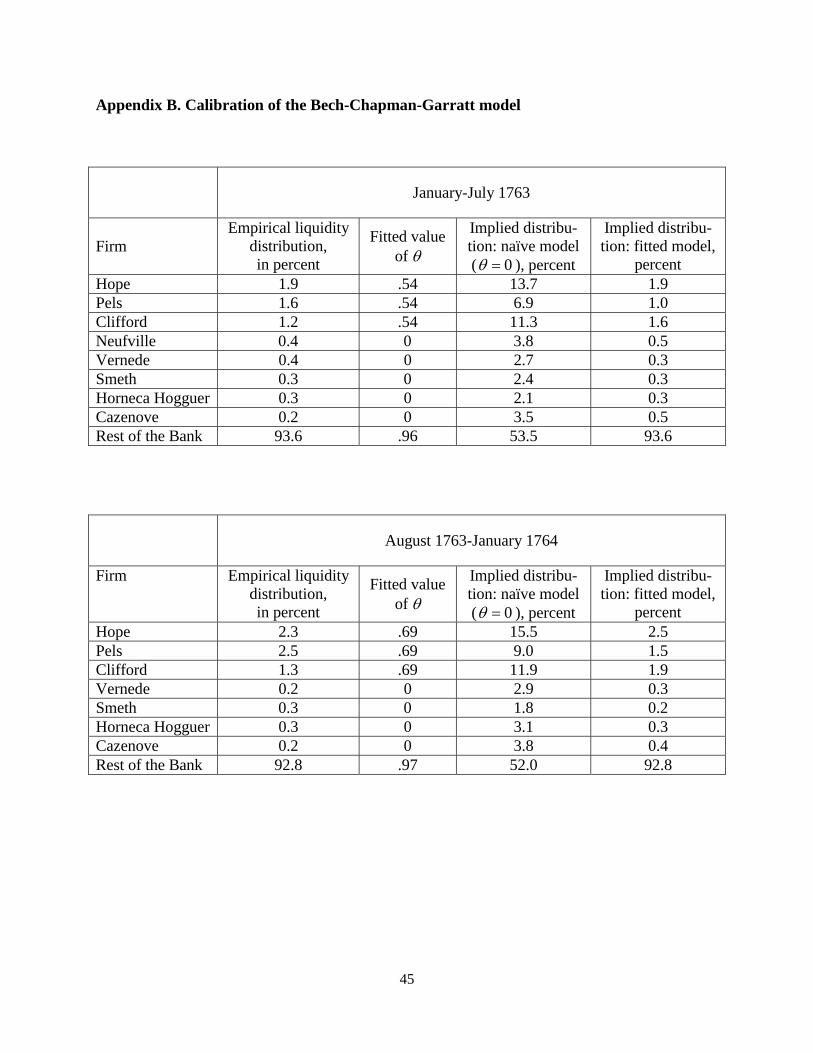
45
Appendix B. Calibration of the Bech-Chapman-Garratt model
January-July 1763
Firm Empirical liquidity
distribution, in percent
Fitted value of θ
Implied distribu-tion: naïve model ( 0θ = ), percent
Implied distribu-tion: fitted model,
percent Hope 1.9 .54 13.7 1.9 Pels 1.6 .54 6.9 1.0 Clifford 1.2 .54 11.3 1.6 Neufville 0.4 0 3.8 0.5 Vernede 0.4 0 2.7 0.3 Smeth 0.3 0 2.4 0.3 Horneca Hogguer 0.3 0 2.1 0.3 Cazenove 0.2 0 3.5 0.5 Rest of the Bank 93.6 .96 53.5 93.6
August 1763-January 1764
Firm Empirical liquidity distribution, in percent
Fitted value of θ
Implied distribu-tion: naïve model ( 0θ = ), percent
Implied distribu-tion: fitted model,
percent Hope 2.3 .69 15.5 2.5 Pels 2.5 .69 9.0 1.5 Clifford 1.3 .69 11.9 1.9 Vernede 0.2 0 2.9 0.3 Smeth 0.3 0 1.8 0.2 Horneca Hogguer 0.3 0 3.1 0.3 Cazenove 0.2 0 3.8 0.4 Rest of the Bank 92.8 .97 52.0 92.8

46
Appendix C. Data
I. Construction of payments data
Data regarding the account activity of the eight merchant bankers at the Bank of Amsterdam are
derived from the original, extant records kept at the Amsterdam Municipal Archive (Stadsarchief
Amsterdam) inventory number 5077. These accounts allow us to construct a weekly matrix of
gross flows between each banker, the other account holders (rest of the Bank, or ROB), and the
Bank itself.
A. Merchant Bankers
For the fiscal year 1763, the bank account of each of the eight merchant bankers was photo-
graphed. The accounts were substantial. For example, Hope & Co.’s account ran 39 folios during
the second half of 1763. The ledger inventory numbers are 5077/ 440, 441 and 442 for 1763a
(Jan-Jul); and 5077/443, 444 and 445 for 1763b (Aug-Jan 1764). To expedite processing, we li-
mited our focus.
• We calculated the gross flows into and out of each account by week. This was expedited by
the fact that the Bank calculated cumulative debts and cumulative credits every 5 transac-
tions. The Bank only netted debits and credits when transferring a banker’s balance to a new
folio.
• We then examined each transfer payment and recorded those to or from another merchant
banker. After repeating this for all eight bankers, we cross-referenced the transactions to
double check our results and identify errors.
B. Bank of Amsterdam
To detail changes in the stock of bank money and how those changes occurred, we photographed
and reconstructed two sets of accounts.
1. Specie Kamer (“coin room” or master account)
One set of accounts record the creation and destruction of bank guilders. The creation of
bank guilders through the deposit of collateral/creation of receipts was recorded under the
title of the bank officers receiving the coin. In 1763, these receivers were Willem van
Housen (5077/441 and 444) and Hendrik Graauwhart (5077/442 and 445). All other
47
transactions that altered the quantity of bank money were recorded in a type of master ac-
count called the Specie Kamer (5077/441 and 444). It records 1) bank guilder destruction
such as withdrawals via receipt, fee payments, interest payments, loan repayments and
open market sales and 2) non-receipt bank guilder creation such as loans and open market
purchases.
2. Collateral Book (Groetboeken van de Specie Kamer)
A different set of accounts (5077/1390) detail the flow of coins and bullion into and out
of the Bank in the fiscal year 1763. This book records the coin surrendered to the Bank in
order to create bank guilders and a receipt, the coins repurchased from the Bank, and the
interest paid to execute or rollover receipt options. The book also records bullion flows,
but not bullion fineness.
C. Rest of the Bank
We calculated the Rest of the Bank as the remainder of flows into and out of the individual ac-
counts unaccounted for by other merchant bankers or by the Bank of Amsterdam.

48
II. Analysis of the bullion window
On August 4, 1673, the AWB authorized a repo window for silver bullion (Dillen 1925: 412).
The bank set the minimum collateral amount at 10,000 bank guilders. Depositors got a standard
receipt at a 0.5 percent repurchase/renewal rate.
The bank scaled silver bullion’s price by fineness. To see this, Table C1 standardizes the various
fineness rates on a bank-guilders-per-mark-pure-silver scale. We call this the bank price, for it is
analogous to a coin’s mint price. The differences being that the bank price delivered Bank (fiat)
money of account instead of coins. Also, the Bank did not charge a fee to produce bank guilders.
Instead, it charged a fee to destroy them. The price scale gave customers an incentive to cast sil-
ver to a fineness of 11/12‘ths. Extant sources do not record the fineness of bullion actually re-
ceived, so our analysis assumes silver bullion presented to the window had a fineness of 91.7
percent.
Table C1. Silver bullion’s bank price
Fineness
Bank Guilders
per Mark
Bank Guilders
per Mark Pure Silver
11/12 91.7% 21 22.91
10/12 83.3% 19 22.80
9/12 75.0% 17 22.67
8/12 66.7% 15 22.50
7/12 58.3% 13 22.29
6/12 50.0% 11 22
5/12 41.7% 9 21.60
4/12 33.3% 7 21
3/12 25% 4.5 18
Source: Dillen (1925, 412).

49
Those holding silver bullion had other ways to gain bank guilders, so the new facility had to
strike a balance between effectiveness and destabilization. It needed a price point that could help
alleviate the liquidity crisis while not creating an incentive to avoid the minting of coins, or
worse, the melting of existing coins. To check this, we will consider two alternative ways to
convert bullion into bank guilders through Dutch mints. One could mint bullion and then pur-
chase bank guilders on the agio (secondary) market. Or, one could mint bullion and then use the
bank’s repurchase facilities.
A. Options to acquire liquidity: mint bullion
1. Mint bullion and buy bank guilders
The rate at which bullion can be converted (coined) into current money is called the mint
price, and customers seek the highest mint price available. In 1763, most large silver coins in
the Dutch Republic had a mint price of 25.1 current guilders per mark pure silver (Polak
1998). Denote the agio percent rate as a. Minting bullion and then selling the resulting coin
on the agio market would produce the same bank guilders as the bullion window if
125.1 22.91,or .09561
aa
⎛ ⎞× = =⎜ ⎟+⎝ ⎠
So the bullion window would not disrupt minting incentives unless the agio was above 9.56
percent.
The exception to the common mint price was the Zeeland ryxdaalder. To promote its own
mint business, the province of Zeeland set their price floor above that used by the rest of the
Dutch Republic. Zeeland increased the legal value of their ryxdaalder (introduced in 1659 at
2.5 current guilders), to 2.55 in 1672, 2.6 in 1747, and 2.65 in 1762 (Polak 1998, 73). In turn,
arbitrage caused the market price of Zeeland ryxdaalders throughout the Republic to follow
(Polak 1998, 202). If the Zeeland ryxdaalder held its value in Amsterdam, then its mint price
of 26.127 would outperform the bullion window for any agio up to 14 percent.

50
2. Mint bullion and repo at the coin window
Some Dutch coins had repurchase (“repo”) windows at the Bank, and the bank guilder values
the Bank assigned those coins meant that minting coins and then repoing them was always
superior to the bullion window. To see this, Table C2 calculates the number of coins in a
mint price, and then multiplies that number by the bank guilders per coin the Bank offered.
Again, people sought the highest “bank price” for their bullion. The ryxdaalder offered the
most at 24.10 bank guilders per mark pure silver, and that price exceeds the 22.91 offered
bullion, so the bullion window did not alter long-term incentives to mint-and-repo.
Table C2. Specifics of Dutch coins with Bank repo windows
Ryxdaalder
Zeeland
Ryxdaalder
Ducat
Drie
Gulden
Mint Price
(current guilders per
mark fine silver)
25.1 26.127 25.1 25.1
Current Guilders
Per Coin 2.5 2.65 3.15 3
Coins per Mark
at Mint Price 10.04 9.86 7.97 8.37
Bank Guilders
per Coin 2.4 2.4 3 2.85
Bank Price
Bank Guilders
Per mark of fine silver
(via a mint)
24.10 23.66 23.91 23.85
We should note that the Zeeland ryxdaalder was particularly unattractive for mint-and-repo,
for the substantial seigniorage the province took during minting meant that Zeeland ryx-
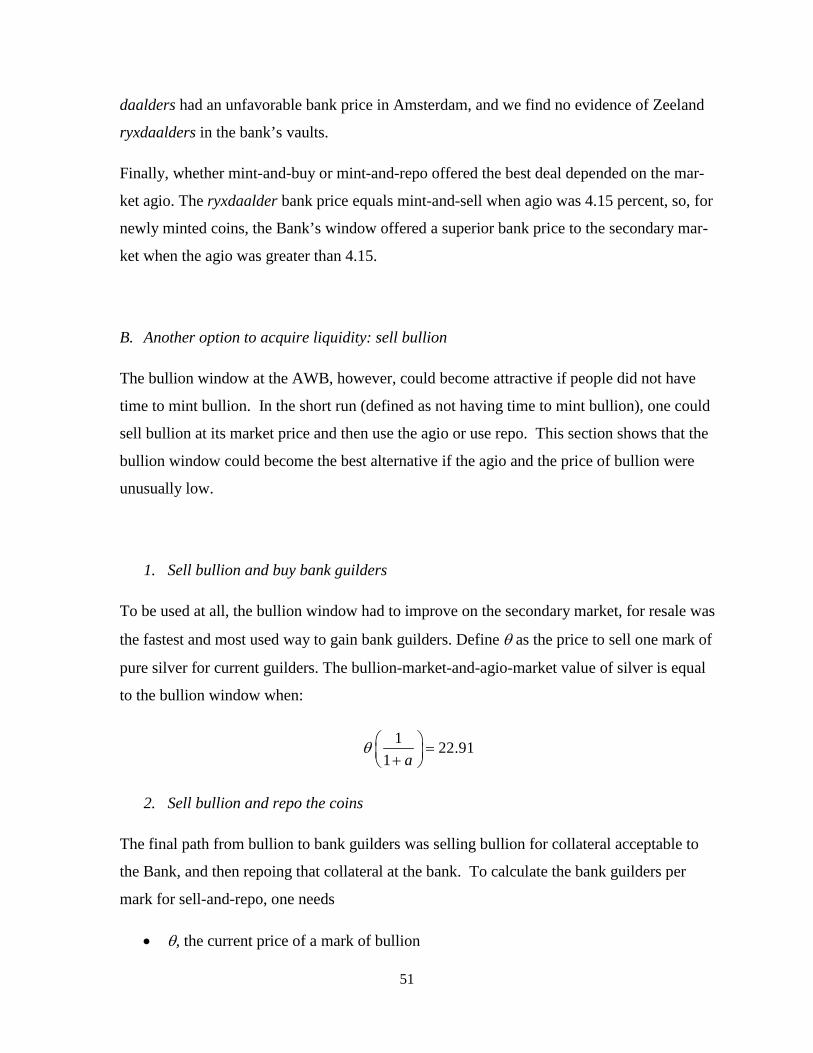
51
daalders had an unfavorable bank price in Amsterdam, and we find no evidence of Zeeland
ryxdaalders in the bank’s vaults.
Finally, whether mint-and-buy or mint-and-repo offered the best deal depended on the mar-
ket agio. The ryxdaalder bank price equals mint-and-sell when agio was 4.15 percent, so, for
newly minted coins, the Bank’s window offered a superior bank price to the secondary mar-
ket when the agio was greater than 4.15.
B. Another option to acquire liquidity: sell bullion
The bullion window at the AWB, however, could become attractive if people did not have
time to mint bullion. In the short run (defined as not having time to mint bullion), one could
sell bullion at its market price and then use the agio or use repo. This section shows that the
bullion window could become the best alternative if the agio and the price of bullion were
unusually low.
1. Sell bullion and buy bank guilders
To be used at all, the bullion window had to improve on the secondary market, for resale was
the fastest and most used way to gain bank guilders. Define θ as the price to sell one mark of
pure silver for current guilders. The bullion-market-and-agio-market value of silver is equal
to the bullion window when:
1 22.911 a
θ ⎛ ⎞ =⎜ ⎟+⎝ ⎠
2. Sell bullion and repo the coins
The final path from bullion to bank guilders was selling bullion for collateral acceptable to
the Bank, and then repoing that collateral at the bank. To calculate the bank guilders per
mark for sell-and-repo, one needs
• θ, the current price of a mark of bullion

52
• the implicit agio per coin ( ).
The bank guilders per mark bullion becomes ( ). For any θ, customers seek the lowest implicit agio, but the implicit agio varied by coin. The
implicit agio is the ratio of current guilders per coin in Table C3 over the bank guilders per
coin in Table C2.
Table C3. Implicit agio by coin
Ryxdaalder
Ducat Drie Gulden
1. Current guilders per coin 2.5 3.15 3
2. Bank guilders per coin 2.4 3 2.85
3. Implicit Agio
(row 1 / row 2)-1 4.1% 5% 5.2%
Of the Dutch coins, the lowest implicit agio was the ryxdaalder, so the bullion window of-
fered the same bank guilders as selling bullion for ryxdaalders (and then repoing them) when 1(1 + ) = 22.91, = 23.86
So, if the price of bullion fell below 23.86, then the bullion window was superior to sell-and-
repo. That bullion price threshold, however, assumes no money changing fees. It also as-
sumes that the price of coins did not rise above their ordinance price-floors, so the threshold
could easily have been higher depending on market conditions.
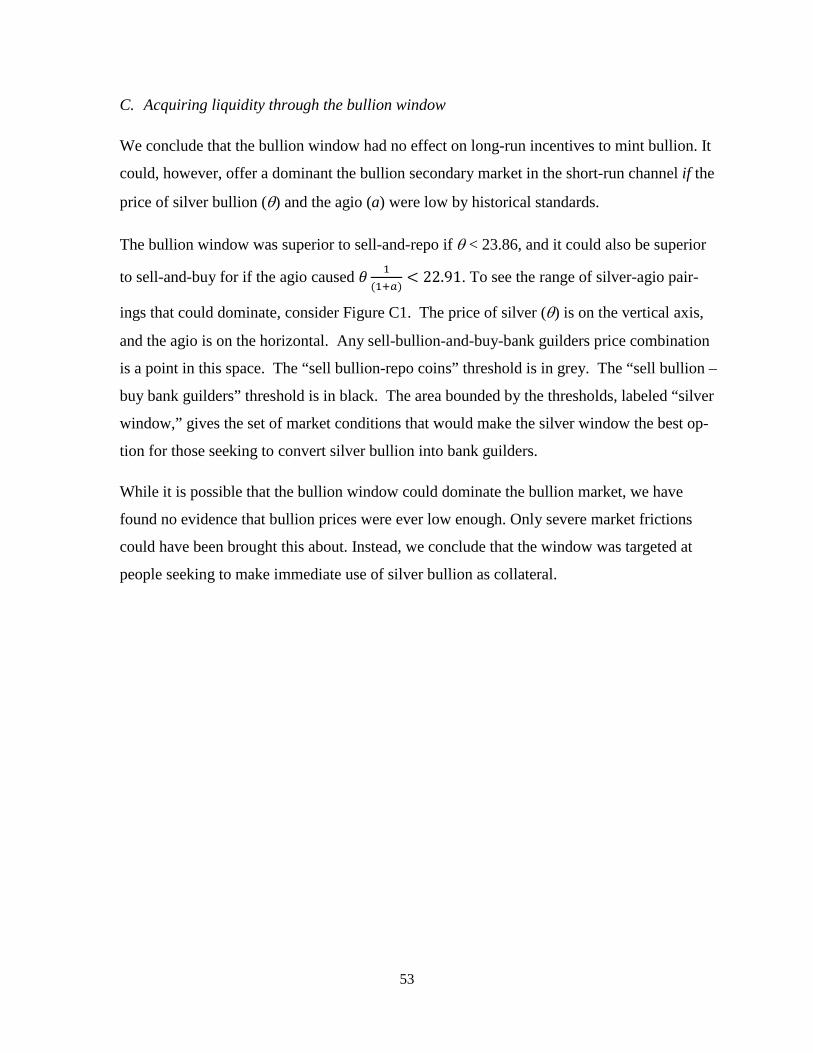
53
C. Acquiring liquidity through the bullion window
We conclude that the bullion window had no effect on long-run incentives to mint bullion. It
could, however, offer a dominant the bullion secondary market in the short-run channel if the
price of silver bullion (θ) and the agio (a) were low by historical standards.
The bullion window was superior to sell-and-repo if θ < 23.86, and it could also be superior
to sell-and-buy for if the agio caused ( ) < 22.91. To see the range of silver-agio pair-
ings that could dominate, consider Figure C1. The price of silver (θ) is on the vertical axis,
and the agio is on the horizontal. Any sell-bullion-and-buy-bank guilders price combination
is a point in this space. The “sell bullion-repo coins” threshold is in grey. The “sell bullion –
buy bank guilders” threshold is in black. The area bounded by the thresholds, labeled “silver
window,” gives the set of market conditions that would make the silver window the best op-
tion for those seeking to convert silver bullion into bank guilders.
While it is possible that the bullion window could dominate the bullion market, we have
found no evidence that bullion prices were ever low enough. Only severe market frictions
could have been brought this about. Instead, we conclude that the window was targeted at
people seeking to make immediate use of silver bullion as collateral.
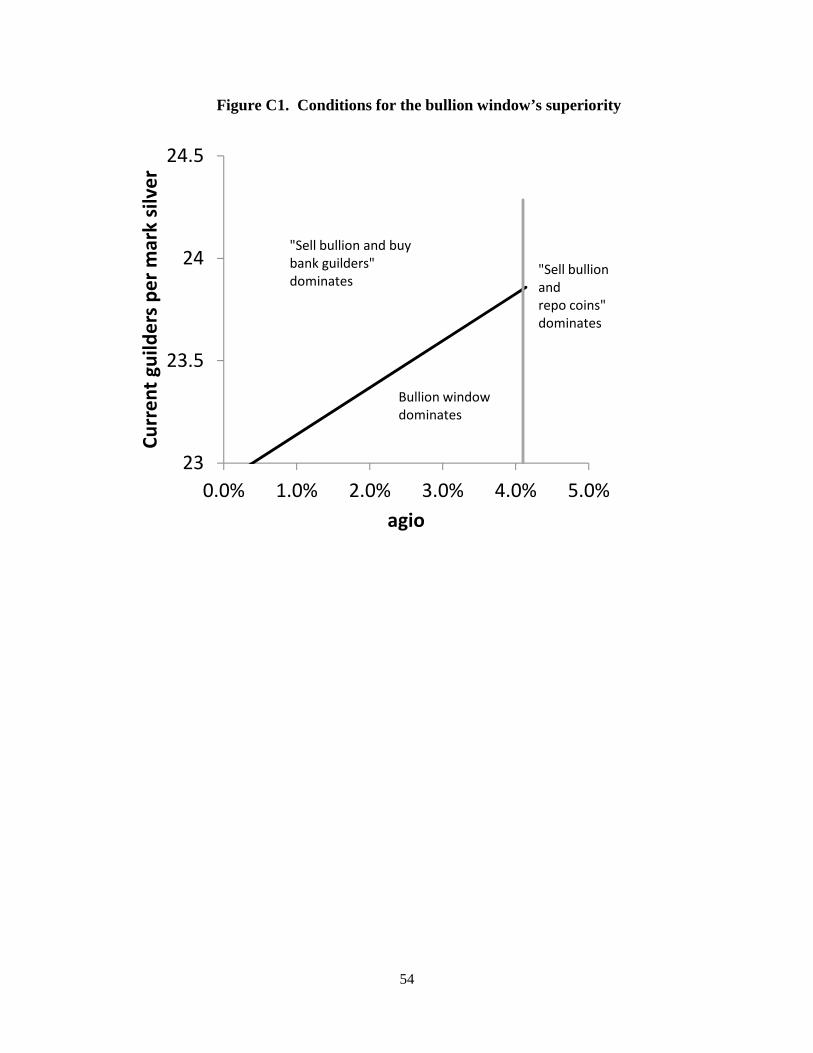
54
Figure C1. Conditions for the bullion window’s superiority
23
23.5
24
24.5
0.0% 1.0% 2.0% 3.0% 4.0% 5.0%
Curr
ent g
uild
ers
per m
ark
silv
er
agio
"Sell bullion and buy bank guilders" dominates
"Sell bullionand repo coins"dominates
Bullion window dominates
55
III. Analysis of Vaaten silver deposits
In September 1763, a merchant named Benjamin Veijtel Ephraim used the bullion window to
transform silver bullion into bank money payments to a few bankers. We consider this money as
banker liquidity gained through the bullion window. This section explains what happened.
Benjamin Veijtel Ephraim was a member of a German Jewish family that supplied silver to the
Prussian mints (Koser 1900). In installments on September 8, 10 and 13, Ephraim brought
364,864 bank guilders worth of bullion to the bullion window (5077/1390, f. 30). The operation,
however, was unique in a number of ways.
The Bank gave this bullion the title vaaten (barrel) silver, presumably because it arrived in bar-
rels. All other bullion deposits were labeled baeren (bars). Although Ephraim took the receipts
for the vaaten silver, he did not get the bank guilders. Rather, the Bank created, and directly cre-
dited a special purpose account just for this money. The account was jointly held by three mer-
chant bankers (Andries Pels & Zoonen, George Clifford & Zoonen , and Raymond & Theodor de
Smeth) and one potential banker (Harmen van de Poll).
No sooner had the money arrived than it was dispersed to the owners, a prominent bullion mer-
chant, and Ephraim himself. Table C4 reconstructs these transactions and shows how we ac-
counted for them.
Our interpretation of these events is that Ephraim owed these bankers money, and this was an
acceptable way to pay them. We suspect this based on the approaches not taken. Ephraim could
have had the funds credited to his own account, but then the bankers would have had to rely on
him to transfer the funds to their account. The fact that a residual 16,000 went to Ephraim’s ac-
count underscores that he got what was left.
Alternately, Ephraim could have given the silver to the bankers. That he did not sell the silver
suggest that market prices were low and expected to recover. That he did not give the silver over
as private collateral suggests that either market terms were less attractive than the bullion win-
dow or that the bankers preferred to let the Bank handle the collateral.
Finally, we know that Ephraim retained the receipts for the deposited silver, for he began repur-
chasing the vaaten silver starting on November 3 (5077/1390, f. 31; 5077/443, f. 141). Again, the
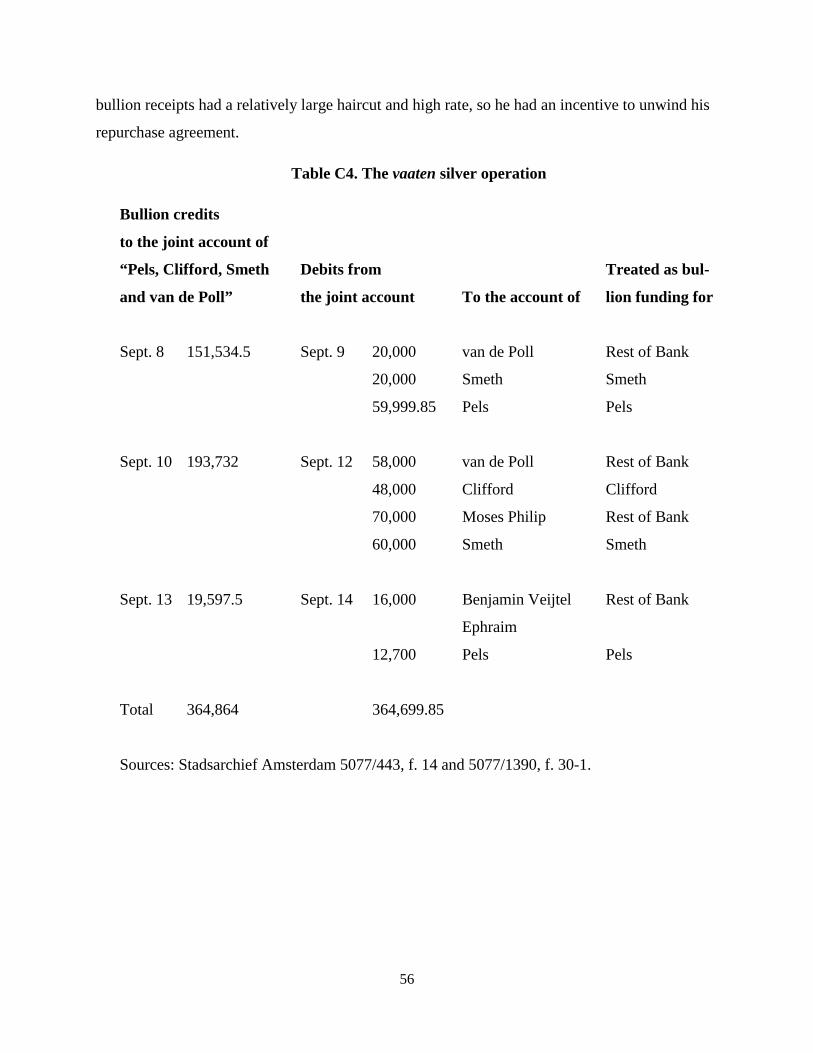
56
bullion receipts had a relatively large haircut and high rate, so he had an incentive to unwind his
repurchase agreement.
Table C4. The vaaten silver operation
Bullion credits
to the joint account of
“Pels, Clifford, Smeth
and van de Poll”
Debits from
the joint account To the account of
Treated as bul-
lion funding for
Sept. 8 151,534.5 Sept. 9 20,000 van de Poll Rest of Bank
20,000 Smeth Smeth
59,999.85 Pels Pels
Sept. 10 193,732 Sept. 12 58,000 van de Poll Rest of Bank
48,000 Clifford Clifford
70,000 Moses Philip Rest of Bank
60,000 Smeth Smeth
Sept. 13 19,597.5 Sept. 14 16,000 Benjamin Veijtel
Ephraim
Rest of Bank
12,700 Pels Pels
Total 364,864
364,699.85
Sources: Stadsarchief Amsterdam 5077/443, f. 14 and 5077/1390, f. 30-1.

57
IV. Mint Activity
In the monetary system of the Dutch Republic, a silver bullion price below 25.1 current guilders
per mark pure silver would encourage minting. In 1763-4, there, was a great deal of minting.
Figure A2 shows the production of silver coins at the Republic’s six provincial mints from 1740
to 1798. The series has two caveats. It is smoothed because mint report periods were irregular,
so we cannot be more specific regarding when the surge began and ended. The series is also oc-
casionally incomplete, so it is a minimum.
The spike in 1763-4 dwarfs previous years. The two year total of about 1 million marks trans-
lates into roughly 25 million current guilders. That flow is approximately the same size as the
Bank of Amsterdam’s stock of metal, and only 1 to 2 million of that production moved directly
to the Bank.
In normal times, the dominant coin produced was the ryxdaalder: a coin used for international
trade. Again, the ryxdaalder had a superior implicit agio than other Dutch coins (see Appendix
Table C3). Zeeland Ryxdaalder production (for domestic use) is in grey, and its production clear-
ly increased with the provincial price floor increases in 1747 and 1762.
The crisis, however, also brought a surge in the gulden production. The gulden had no repo win-
dow at the Bank and was not used for export, so evidently many people wanted coins to make
current guilder payments in the domestic economy rather than payments inside the bank or for
international trade. The mint numbers suggest that the Panic of 1763 particularly disrupted the
domestic Dutch payment system.
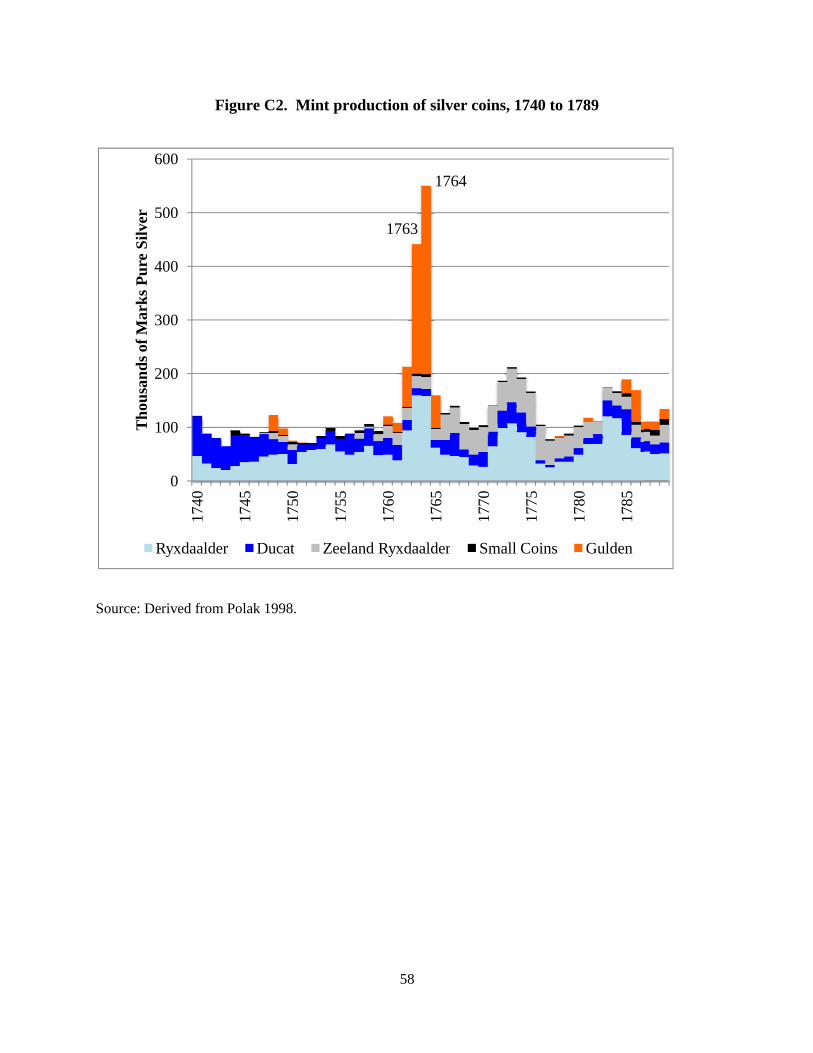
Figure C2. Mint
Source: Derived from Polak 1998.
0
100
200
300
400
500
600
1740
1745
1750
Tho
usan
ds o
f Mar
ks P
ure
Silv
er
Ryxdaalder Ducat Z
58
production of silver coins, 1740 to 1789
1763
1764
1755
1760
1765
1770
1775
1780
1785
Zeeland Ryxdaalder Small Coins Gulden
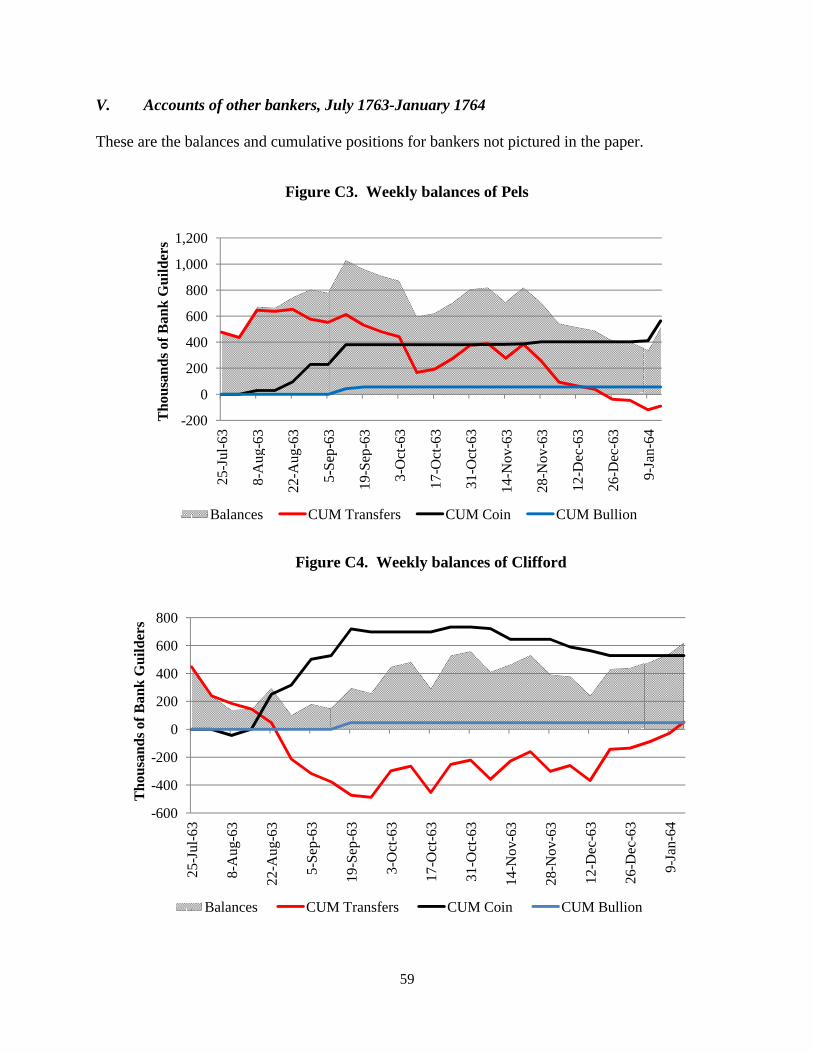
V. Accounts of other bankers, J
These are the balances and cumulativ
Figure
Figur
-200
0
200
400
600
800
1,000
1,20025
-Jul
-63
8-A
u g-6
3
22-A
ug-6
3
5-Se
p-63
Tho
usan
ds o
f Ban
k G
uild
ers
Balances CUM
-600
-400
-200
0
200
400
600
800
25-J
ul-6
3
8-A
ug-6
3
22-A
ug-6
3
5-Se
p-63
Tho
usan
ds o
f Ban
k G
uild
ers
Balances CUM
59
July 1763-January 1764
ve positions for bankers not pictured in the paper.
e C3. Weekly balances of Pels
re C4. Weekly balances of Clifford
5-Se
p-63
19-S
ep-6
3
3-O
ct-6
3
17-O
ct-6
3
31-O
ct-6
3
14-N
ov-6
3
28-N
ov-6
3
12-D
ec-6
3
26-D
ec-6
3
9J
64
M Transfers CUM Coin CUM Bullion
19-S
ep-6
3
3-O
ct-6
3
17-O
ct-6
3
31-O
ct-6
3
14-N
ov-6
3
28-N
ov-6
3
12-D
ec-6
3
26-D
ec-6
3
M Transfers CUM Coin CUM Bullion
9-Ja
n-64
9-Ja
n-64

Figure
Figure C
0.00
200.00
400.00
600.00
800.00
1,000.00
25-J
ul-6
3
8-A
ug-6
3
22-A
ug-6
3
5-Se
p-63T
hous
ands
of B
ank
Gui
lder
s
Balances
-250-200-150-100-50
050
100150200250300
25-J
ul-6
3
8-A
ug-6
3
22-A
ug-6
3
5-Se
p-63
Tho
usan
ds o
f Ban
k G
uild
ers
Balances CUM
60
C5. Weekly balances of Hope
6. Weekly balances of Vernede
5-Se
p-63
19-S
ep-6
3
3-O
ct-6
3
17-O
ct-6
3
31-O
ct-6
3
14-N
ov-6
3
28-N
ov-6
3
12-D
ec-6
3
26D
ec63
CUM Transfers CUM Coin
19-S
ep-6
3
3-O
ct-6
3
17-O
ct-6
3
31-O
ct-6
3
14-N
ov-6
3
28-N
ov-6
3
12-D
ec-6
3
26D
ec63
M Transfers CUM Coin CUM Bullio
26-D
ec-6
3
9-Ja
n-64
26-D
ec-6
3
9-Ja
n-64
on
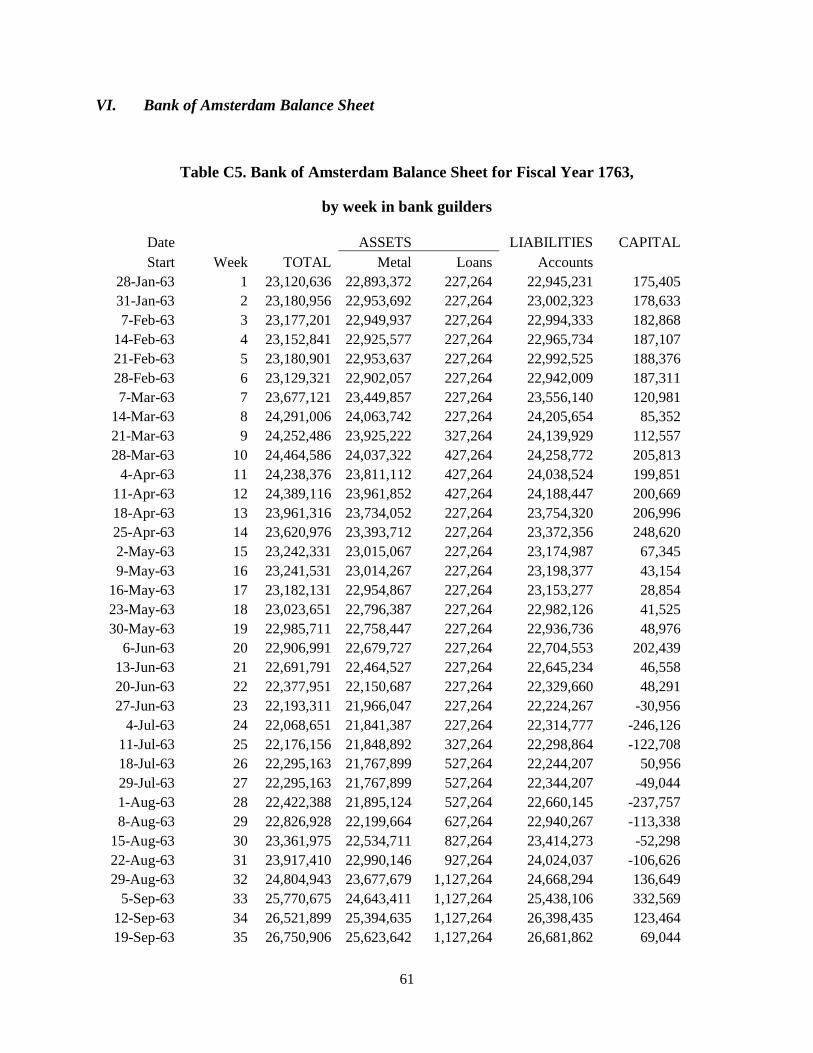
61
VI. Bank of Amsterdam Balance Sheet
Table C5. Bank of Amsterdam Balance Sheet for Fiscal Year 1763,
by week in bank guilders
Date ASSETS LIABILITIES CAPITALStart Week TOTAL Metal Loans Accounts
28-Jan-63 1 23,120,636 22,893,372 227,264 22,945,231 175,40531-Jan-63 2 23,180,956 22,953,692 227,264 23,002,323 178,6337-Feb-63 3 23,177,201 22,949,937 227,264 22,994,333 182,868
14-Feb-63 4 23,152,841 22,925,577 227,264 22,965,734 187,10721-Feb-63 5 23,180,901 22,953,637 227,264 22,992,525 188,37628-Feb-63 6 23,129,321 22,902,057 227,264 22,942,009 187,3117-Mar-63 7 23,677,121 23,449,857 227,264 23,556,140 120,981
14-Mar-63 8 24,291,006 24,063,742 227,264 24,205,654 85,35221-Mar-63 9 24,252,486 23,925,222 327,264 24,139,929 112,55728-Mar-63 10 24,464,586 24,037,322 427,264 24,258,772 205,813
4-Apr-63 11 24,238,376 23,811,112 427,264 24,038,524 199,85111-Apr-63 12 24,389,116 23,961,852 427,264 24,188,447 200,66918-Apr-63 13 23,961,316 23,734,052 227,264 23,754,320 206,99625-Apr-63 14 23,620,976 23,393,712 227,264 23,372,356 248,6202-May-63 15 23,242,331 23,015,067 227,264 23,174,987 67,3459-May-63 16 23,241,531 23,014,267 227,264 23,198,377 43,154
16-May-63 17 23,182,131 22,954,867 227,264 23,153,277 28,85423-May-63 18 23,023,651 22,796,387 227,264 22,982,126 41,52530-May-63 19 22,985,711 22,758,447 227,264 22,936,736 48,976
6-Jun-63 20 22,906,991 22,679,727 227,264 22,704,553 202,43913-Jun-63 21 22,691,791 22,464,527 227,264 22,645,234 46,55820-Jun-63 22 22,377,951 22,150,687 227,264 22,329,660 48,29127-Jun-63 23 22,193,311 21,966,047 227,264 22,224,267 -30,956
4-Jul-63 24 22,068,651 21,841,387 227,264 22,314,777 -246,12611-Jul-63 25 22,176,156 21,848,892 327,264 22,298,864 -122,70818-Jul-63 26 22,295,163 21,767,899 527,264 22,244,207 50,95629-Jul-63 27 22,295,163 21,767,899 527,264 22,344,207 -49,0441-Aug-63 28 22,422,388 21,895,124 527,264 22,660,145 -237,7578-Aug-63 29 22,826,928 22,199,664 627,264 22,940,267 -113,338
15-Aug-63 30 23,361,975 22,534,711 827,264 23,414,273 -52,29822-Aug-63 31 23,917,410 22,990,146 927,264 24,024,037 -106,62629-Aug-63 32 24,804,943 23,677,679 1,127,264 24,668,294 136,649
5-Sep-63 33 25,770,675 24,643,411 1,127,264 25,438,106 332,56912-Sep-63 34 26,521,899 25,394,635 1,127,264 26,398,435 123,46419-Sep-63 35 26,750,906 25,623,642 1,127,264 26,681,862 69,044
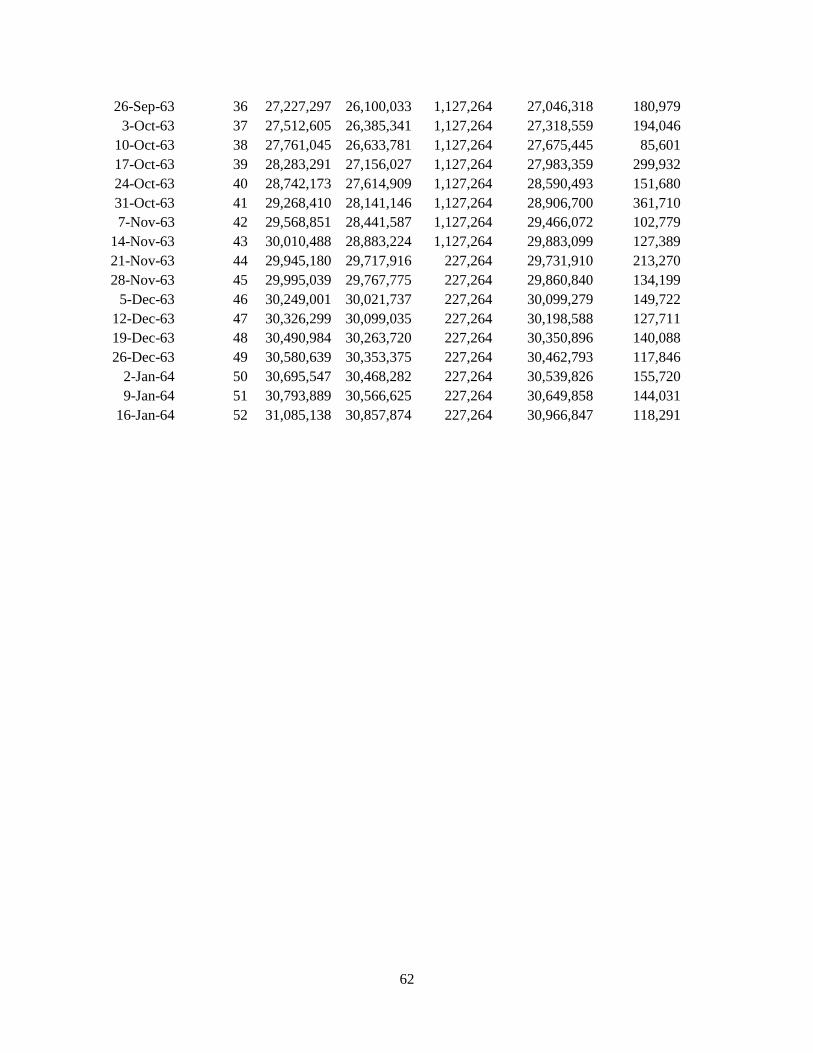
62
26-Sep-63 36 27,227,297 26,100,033 1,127,264 27,046,318 180,9793-Oct-63 37 27,512,605 26,385,341 1,127,264 27,318,559 194,046
10-Oct-63 38 27,761,045 26,633,781 1,127,264 27,675,445 85,60117-Oct-63 39 28,283,291 27,156,027 1,127,264 27,983,359 299,93224-Oct-63 40 28,742,173 27,614,909 1,127,264 28,590,493 151,68031-Oct-63 41 29,268,410 28,141,146 1,127,264 28,906,700 361,7107-Nov-63 42 29,568,851 28,441,587 1,127,264 29,466,072 102,779
14-Nov-63 43 30,010,488 28,883,224 1,127,264 29,883,099 127,38921-Nov-63 44 29,945,180 29,717,916 227,264 29,731,910 213,27028-Nov-63 45 29,995,039 29,767,775 227,264 29,860,840 134,199
5-Dec-63 46 30,249,001 30,021,737 227,264 30,099,279 149,72212-Dec-63 47 30,326,299 30,099,035 227,264 30,198,588 127,71119-Dec-63 48 30,490,984 30,263,720 227,264 30,350,896 140,08826-Dec-63 49 30,580,639 30,353,375 227,264 30,462,793 117,846
2-Jan-64 50 30,695,547 30,468,282 227,264 30,539,826 155,7209-Jan-64 51 30,793,889 30,566,625 227,264 30,649,858 144,031
16-Jan-64 52 31,085,138 30,857,874 227,264 30,966,847 118,291
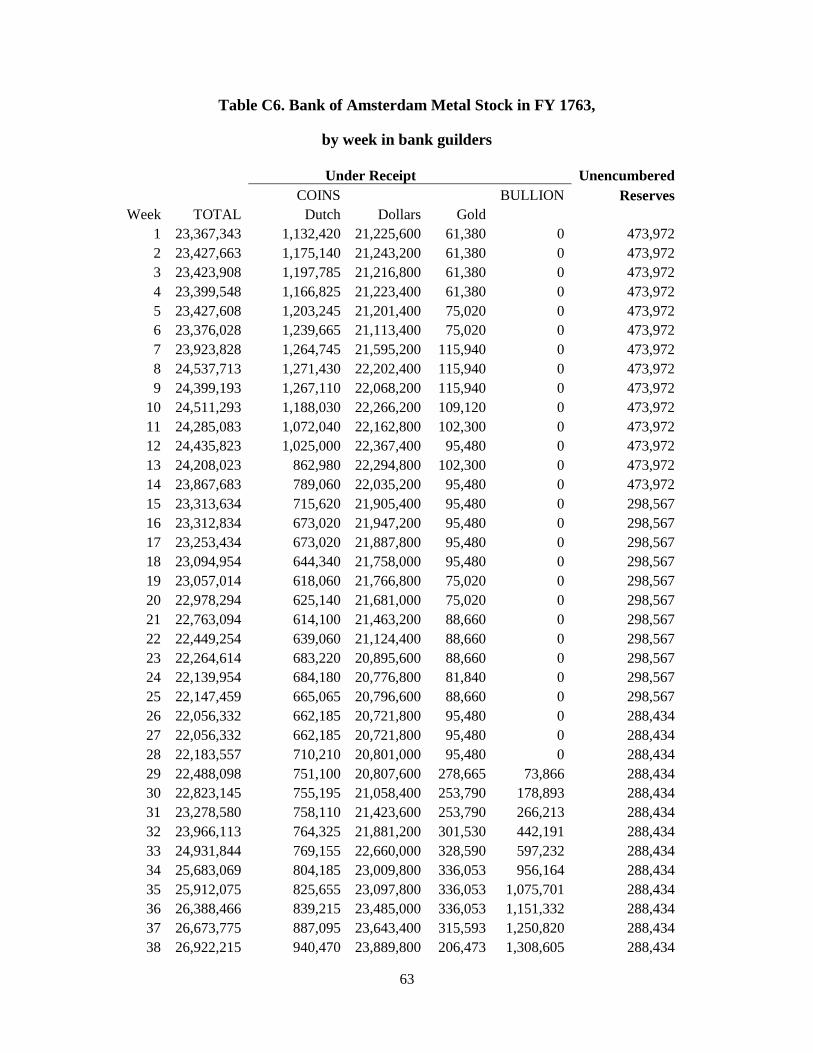
63
Table C6. Bank of Amsterdam Metal Stock in FY 1763,
by week in bank guilders
Under Receipt UnencumberedCOINS BULLION Reserves
Week TOTAL Dutch Dollars Gold1 23,367,343 1,132,420 21,225,600 61,380 0 473,9722 23,427,663 1,175,140 21,243,200 61,380 0 473,9723 23,423,908 1,197,785 21,216,800 61,380 0 473,9724 23,399,548 1,166,825 21,223,400 61,380 0 473,9725 23,427,608 1,203,245 21,201,400 75,020 0 473,9726 23,376,028 1,239,665 21,113,400 75,020 0 473,9727 23,923,828 1,264,745 21,595,200 115,940 0 473,9728 24,537,713 1,271,430 22,202,400 115,940 0 473,9729 24,399,193 1,267,110 22,068,200 115,940 0 473,972
10 24,511,293 1,188,030 22,266,200 109,120 0 473,97211 24,285,083 1,072,040 22,162,800 102,300 0 473,97212 24,435,823 1,025,000 22,367,400 95,480 0 473,97213 24,208,023 862,980 22,294,800 102,300 0 473,97214 23,867,683 789,060 22,035,200 95,480 0 473,97215 23,313,634 715,620 21,905,400 95,480 0 298,56716 23,312,834 673,020 21,947,200 95,480 0 298,56717 23,253,434 673,020 21,887,800 95,480 0 298,56718 23,094,954 644,340 21,758,000 95,480 0 298,56719 23,057,014 618,060 21,766,800 75,020 0 298,56720 22,978,294 625,140 21,681,000 75,020 0 298,56721 22,763,094 614,100 21,463,200 88,660 0 298,56722 22,449,254 639,060 21,124,400 88,660 0 298,56723 22,264,614 683,220 20,895,600 88,660 0 298,56724 22,139,954 684,180 20,776,800 81,840 0 298,56725 22,147,459 665,065 20,796,600 88,660 0 298,56726 22,056,332 662,185 20,721,800 95,480 0 288,43427 22,056,332 662,185 20,721,800 95,480 0 288,43428 22,183,557 710,210 20,801,000 95,480 0 288,43429 22,488,098 751,100 20,807,600 278,665 73,866 288,43430 22,823,145 755,195 21,058,400 253,790 178,893 288,43431 23,278,580 758,110 21,423,600 253,790 266,213 288,43432 23,966,113 764,325 21,881,200 301,530 442,191 288,43433 24,931,844 769,155 22,660,000 328,590 597,232 288,43434 25,683,069 804,185 23,009,800 336,053 956,164 288,43435 25,912,075 825,655 23,097,800 336,053 1,075,701 288,43436 26,388,466 839,215 23,485,000 336,053 1,151,332 288,43437 26,673,775 887,095 23,643,400 315,593 1,250,820 288,43438 26,922,215 940,470 23,889,800 206,473 1,308,605 288,434
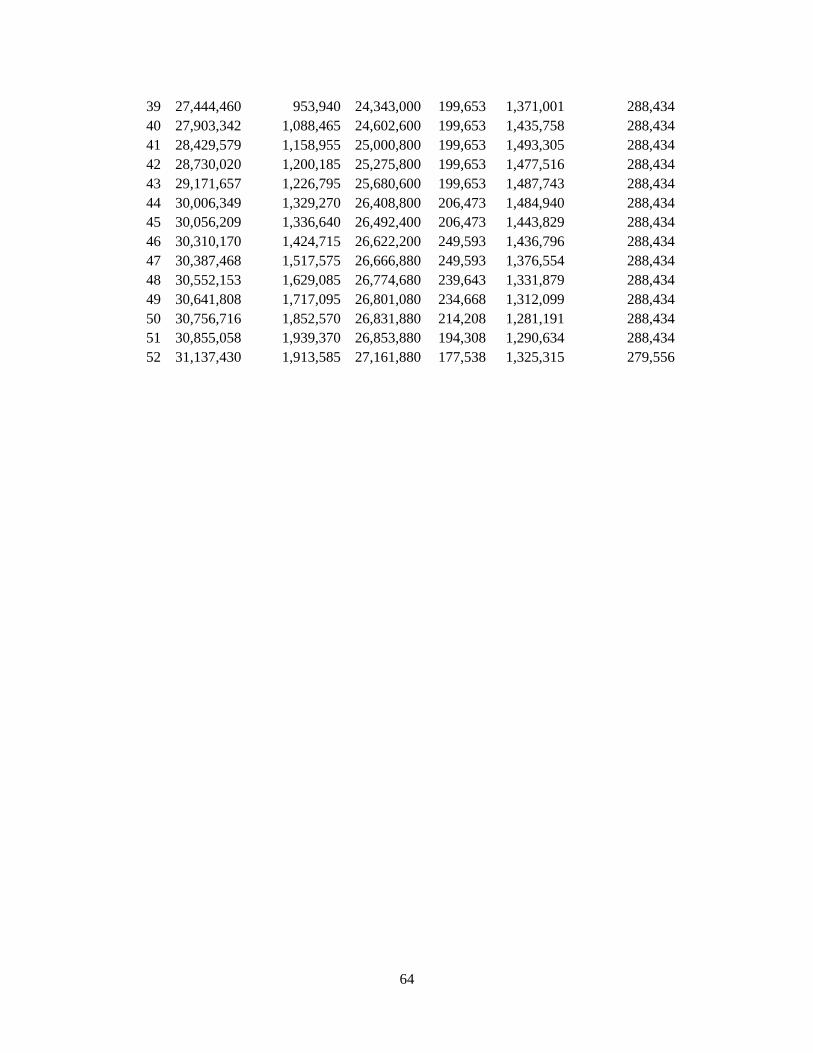
64
39 27,444,460 953,940 24,343,000 199,653 1,371,001 288,43440 27,903,342 1,088,465 24,602,600 199,653 1,435,758 288,43441 28,429,579 1,158,955 25,000,800 199,653 1,493,305 288,43442 28,730,020 1,200,185 25,275,800 199,653 1,477,516 288,43443 29,171,657 1,226,795 25,680,600 199,653 1,487,743 288,43444 30,006,349 1,329,270 26,408,800 206,473 1,484,940 288,43445 30,056,209 1,336,640 26,492,400 206,473 1,443,829 288,43446 30,310,170 1,424,715 26,622,200 249,593 1,436,796 288,43447 30,387,468 1,517,575 26,666,880 249,593 1,376,554 288,43448 30,552,153 1,629,085 26,774,680 239,643 1,331,879 288,43449 30,641,808 1,717,095 26,801,080 234,668 1,312,099 288,43450 30,756,716 1,852,570 26,831,880 214,208 1,281,191 288,43451 30,855,058 1,939,370 26,853,880 194,308 1,290,634 288,43452 31,137,430 1,913,585 27,161,880 177,538 1,325,315 279,556