RESOURCE MATERIALS from PACIFIC REGIONAL ENERGY …
188
RESOURCE MATERIALS from PACIFIC REGIONAL ENERGY PROGRAM Power Utility GIS Workshop 14-17 April 1998 April 1998 SOPACMiscellaneousReport281 1 SOPAC Secretariat 2 Apia Observatory
Transcript of RESOURCE MATERIALS from PACIFIC REGIONAL ENERGY …

RESOURCE MATERIALSfrom
PACIFIC REGIONAL ENERGY PROGRAMPower Utility GIS Workshop
14-17 April 1998
April 1998 SOPACMiscellaneousReport281
1SOPAC Secretariat2Apia Observatory

Pacific Regional Energy Programme
Power Utility GIS Workshop
14 - 17 April 1998
Welcome Address
The Regional Pacific Energy Programme (PREP) is funded with 4.5 million ECU by theEuropean Union and assists the countries of the South Pacific to manage their energy in asustainable way. PREP assists eight ACP countries in advisory and training. One of theassistance is the promotion of the State-of-the Art planning and management tools. Geo-graphical Information Systems can help to provide a spatial overview of all power utilityassets necessary to distribute energy in an efficient way.
Following up from the pilot project that was conducted in Tonga 1997, two utilitiesnamely FEA (Fiji Electricity Authority) and SIEA (Solomon Islands Electricity Author-ity) requested assistance for the similar set-up to be introduced into their respective utili-ties. This workshop is a culmination of the project, which commenced three month ago. Itis preliminary designed to demonstrate the necessary processes to be undertaken to suc-cessfully undertake implementing the GIS into utility IT system. It is a very powerfultool, but requires commitment by utility personal insuring accurate data input and main-tenance. The success of this is largely dependant on the utilities carrying out their part.This project in the main has be funded by PREP in co-operation with the utilities on acost share basis.
As you can appreciate, the efforts carried out to-date covers a very small portion of theutility system. It is in your interest to insure that the method implemented for a small areawill be replicated to the rest of the distribution system. The participation of SOPAC inthis project gives regional backup in the sustainability of GIS implementation. They willbe available to support you as you carry out the exercise to its successful completion. Theball is in your court.
Lautoka 14.04.98
/~~/ \! '-I . .\ ·~irie
(Regional Power Sector Advisor)

Pacific Regional Energy Programme
Power Utility GIS Workshop
14 - 17 April 1998
Participants
Country Utility NameTonga Tonga Electric Power Board Paula HemalotoTonga Tonga Electric Power Board Edwin FC Liava'aTonga Tonga Water Board Vahaakolo Pale1eiSolomon Islands Solomon Islands Electricity Authority Martin RasuSolomon Islands Solomon Islands Electricity Authority Robinson T. WoodFiji Fiji Electricity Authority Vilisi KalouFiji Fiji Electricity Authority Maile Finau UlukalalaFiji Fiji Electricity Authority Timoci BavadraFiji Fiji Electricity Authority Ajay KumarFiji Fiji Electricity Authority Rupeti Levaci

Pacific Regional Energy Programme
Power Utility GIS Workshop
14 - 17 April 1998
Provisional Agenda
Tuesday 10:30 10:45 Opening of workshop14.04.98 10:45 11:00 Opening of workshop
11:00 12:00 Introduction12:00 13:00 Lunch13:00 17:00 Visit FEA field sites
Wednesday 08:00 09:00 Handling tabular data MS-Access15.04.98 09:00 10:00 Handling tabular data
10:00 10:30 Tea break10:30 11:00 Mapping with GIS repetition11:00 11:30 GIS applied for power utilities11:30 12:00 GIS applied for power utilities12:00 13:00 Lunch13:00 13:30 Menu update with MapBasic13:30 15:00 Menu update with MapBasic15:00 15:30 Tea break15:30 16:00 GIS image backdrop repetition16:00 16:30 GIS image backdrop import16:30 17:00 Future image data for GIS backdrop
Thursday 08:00 09:00 GPS introduction16.04.98 09:00 11:00 GPS field survey
11:00 11:30 Tea break11:30 12:00 GPS data import/editing to MapInfo12:00 13:00 Lunch13:00 14:00 GPS data import/editing to MapInfo14:00 14:30 e-mail and Modem Database update14:30 15:00 e-mail and Modem Database update15:00 15:30 Tea break15:30 16:30 National and regional networking
Friday 08:00 12:00 Individual talks ..., exercise17.04.98 12:00 13:00 Lunch

Pacific Regional Energy Programme
Power Utility GIS Workshop
14 - 17 April1998
Content of Folder:
GIS for Regional Utilities, an Introduction PPT presentation notesHandling Tabular Databases with MS-Access PPT presentation notesBasics of GIS PPT presentation notesMapping with GIS PPT presentation notesGIS Applied for Power Utilities PPT handoutMenu Update with MapBasic PPT handoutImage Backdrop for GIS PPT presentation notesAvailable and Future Image Data for GIS Backdrop PPT presentation notesGPS Introduction PPT presentation notesDifferential GPS PPT presentation notesE-Mail and Modem Database Update PPT presentation notesNational and Regional Networkin PPT handoutAn Appropriate mid-range Geographic Information PaperSystem for Use in Pacific Island CountriesGeoExplorer II PR materialGIS and Remote Sensing Newsletter Newsletter
The Regional Pacific Energy Programme (PREP) is funded with 4.5 millionECU by the European Union and assists the countries ofthe South Pacific tomanage their energy in a sustainable way. PREP assists eight ACP countriesin advisory and training. One of the assistance is the promotion of the State-of-the Art planning and management tools. Geographical InformationSystems can help to provide a spatial overview of all power utility itemsnecessary to distribute energy in an efficient way.
Further information see: "PREP, A Regional Energy Programme for allPacific ACP Countries"
Rupeti Levaci, Vilisi Kalou 1


GIS for FEA Power Utility Lautoka, 14.04.98
Project bounds••
• funding: European Union (Lome III )• implementation: PREP, SOPAC, FEA, SIEA• duration: 3 1/2 months_• team: Gerhard Zieroth, John Pirie, Franck Martin,
Leslie Allinson, Wolf Forstreuter, Olivier Duperray,Rupetti Levaci, Vilisi Kalou, Vincent Fiuta, MartinRasu
• software used: Maplnfo, MapBasic, MS-:~Access, MS-Office 97, ERDAS
• location: FEA Lautoka SIEA Honiara (pilotsites), SOPAC (system development)
Already in 1991, FEA recognised the advantage to manage important itemsof Fiji's power supply by the help of digital databases. Databases allow afast search and select, summaries and report writing. At that time, dBASEIII+ software was selected to store all information about transformers.
1997 the regional PREP workshop on GIS for power utilities demonstratedthe application of modem databases such as MicroSoft Access.Furthermore, the workshop showed the advantage to link tabular data storedin relational databases with spatial data (digital maps). The workshopinitialised a discussion within FEA management, which lead into a formalrequest to PREP performing a similar exercise with FEA.
European Union as donor agency agreed to set up a new project to help FEAand SIEA in establishing relational and spatial databases.
Rupeti Levaci, Vilisi Kalou 3


GIS for FEA Power Utility Lautoka, 14.04.98
Demand for Improvement ,.• more economic power management
• analysis of transformer overload-• geographical overview of voltage drop
due to consumption increase• fast location of fault area• improved asset management to avoid .--
faults• better service to customer
Even having such an environmentally sound power supply situation, it isimportant to economise the power distribution and consumption. Dieselpower generation has to be minimised as far as possible.
Rupeti Levaci, Vilisi Kalou 5

GIS for FEA Power Utility Lautoka, 14.04.98
Creating Tabular Database•
• typing of information into database• converting dBASE data to MS-ACCESS
- improved structure and integrity- user friendly in MS environment-
• cleaning the existing database tables- duplication of records- incomplete records .~.
• scanning of drawings and images• developing forms, queries and reports
Most of all information has to be typed into a computer to convertinformation, which is written on cards or exists in physical files, to digitaldatabase tables. Other information e.g. consumer or transformer data isalready stored in digital files. Required parts have to be converted to Accessformat to be an integrated part of the FEA utility database.
After importing all information into Access the integrity has to be checkedand different tables have to be linked together. The project created twodifferent types of database tables:
a) "Basic Tables" containing descriptive information e.g. the table"LineVolt", which keeps all voltage types existing in Fiji's power lines;
b) "Main Tables" containing all information necessary to manage alltransformers, lines, consumers, meters, power poles of Fiji's electric powerutility. E.g., the table "Line" contains information about the voltage,conductor, length, etc. of the lines.
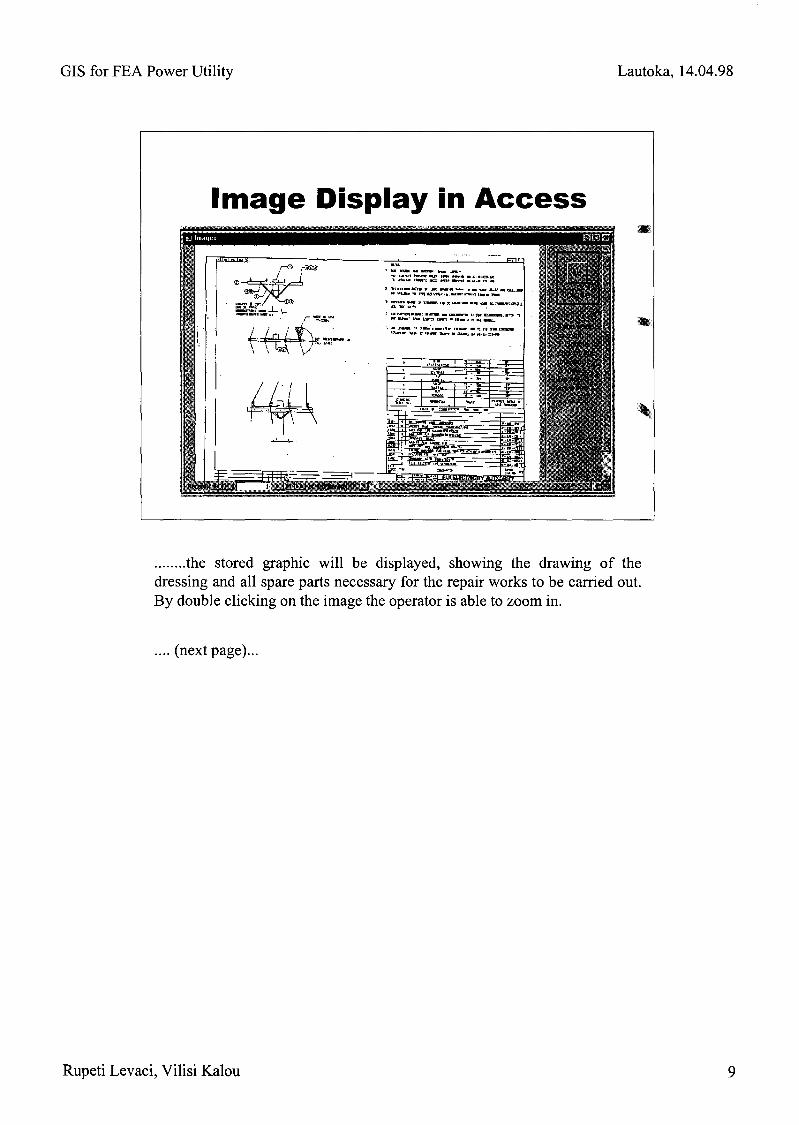
Some information is stored in graphical form such as line dressing orpossible stays of a power pole. Such graphs were scanned and then linked tothe database. Furthermore, photos are necessary in some cases to explaintypes of asset items. The project scanned and linked them to the database aswell.
Rupeti Levaci, Vilisi Kalou 6


GIS for FEA Power Utility Lautoka, 14.04.98
Performing GPS Survey•
• Installation of GPS software• perform training on the job by surveying-
power poles• establishing e-mail link to GPS base
station.--.
FEA purchased advance GPS equipment, 1996. Due to computer hardwareproblems this equipment was not used. The project will install the necessarysoftware on new available computer and perform the necessary training tooperate the system.
Rupeti Levaci, Vilisi Kalou 14

GIS for FEA Power Utility Lautoka, 14.04.98
The system components are:
1) a GPS rover, which will be used to survey the position of utility itemssuch as power poles,
2) a GPS base station located in Lautoka (the photo shows the base stationantenna on top of the office) allowing to record positional data fordifferential correction,
3) a Pathfinder office software necessary to perform the geometriccorrection.
The system will allow to record the position with about two metersaccuracy. Furthermore, the system will provide backup data for all GPSusers in Fiji, which is dependent on the only base station located in theMSD-Forestry, Colo-i-Suva.
Rupeti Levaci, Vilisi Kalou 15
GIS for FEA Power Utility Lautoka, 14.04.98
The Future
Trained staff available plusscalable and adaptable systemready for transfer to utilities ofother Pacific Island Countries
Rupeti Levaci, Vilisi Kalou 16
GIS for FEA Power Utility Lautoka, 14.04.98
For further informationPREPPrivate Mail Bag, GPO, Suva, Fiji IslandsFax: +679-303828, e-mail: [email protected]
FEAPrivate Mail Bag,Suva, FijiFax: +679-311882, e-mail: [email protected]
SOPACPrivate Mail Bag, GPO, Suva, Fiji IslandsFax: +679·370040, e-mail: [email protected]
Rupeti Levaci, Vilisi Kalou 17

11/04/98
Pacific Regional Energy Programme
Power Utility GIS Workshop
Workshop funded by European UnionManaging agency: Pacific Regional Energy ProgrammeImplementing agency: SOPACImplementation for the Fiji Electricity Authority and SolomonIslands Electricity Authority
1

11/04/98
In this presentation, we will introduce the various concepts of adatabase, and especially what makes the difference between adatabase and other software manipulating data.
There are several database software on the market, such as Dbase,FoxPro, Oracle, MS-Access, Paradox.
Dbase was one of the first database software which had and still has agreat success. It was the first software to organise data, but also allowto program in a simple language in order to perform specific andtailored tasks.
FoxPro is a newer version of Dbase including the windows interface.
Ms-Access is the answer from Microsoft to integrated databasesoftware. It is easy to use, sometimes too easy ...
Paradox is a great contender of MS-Access and support the samefeatures.
Oracle, is a Client/Server Database. It means that the database islocated on one computer, and the view and forms on another computer.It is a true multi-user, multi-procedures system for large organisations.
We will be using MS-Access here, because it is fully integrated insideWindows 95, the MS-Office Suite and it is compatible with Maplnfo.
2

11/04/98
Topics of Discussion• Whafi:is a database• Difference between a database
and a spreadsheet• Linking tables• Forms/ Reports / Procedures• Linking with the outside world
For a quick review of a database software, we need to specify what is adatabase. We will also compare a database against a spreadsheet toemphasise the differences.
When you choose a database, you need to ensure that the system isable to create links between tables, create forms, reports andprocedures to organise the data.
The next important point is the ability of the database to export andimport data from other software.
3
11/04/98
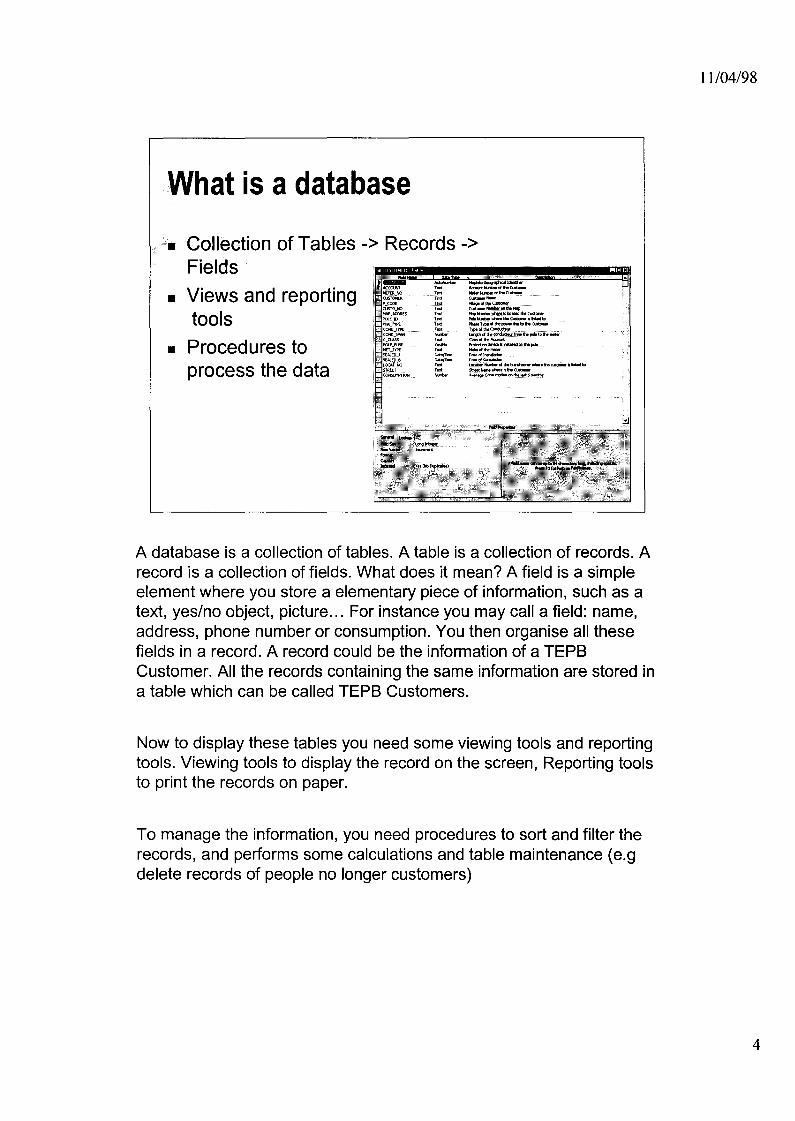
A database is a collection of tables. A table is a collection of records. Arecord is a collection of fields. What does it mean? A field is a simpleelement where you store a elementary piece of information, such as atext, yes/no object, picture ... For instance you may call a field: name,address, phone number or consumption. You then organise all thesefields in a record. A record could be the information of a TEPSCustomer. All the records containing the same information are stored ina table which can be called TEPS Customers.
Now to display these tables you need some viewing tools and reportingtools. Viewing tools to display the record on the screen, Reporting toolsto print the records on paper.
To manage the information, you need procedures to sort and filter therecords, and performs some calculations and table maintenance (e.gdelete records of people no longer customers)
4
11/04/98
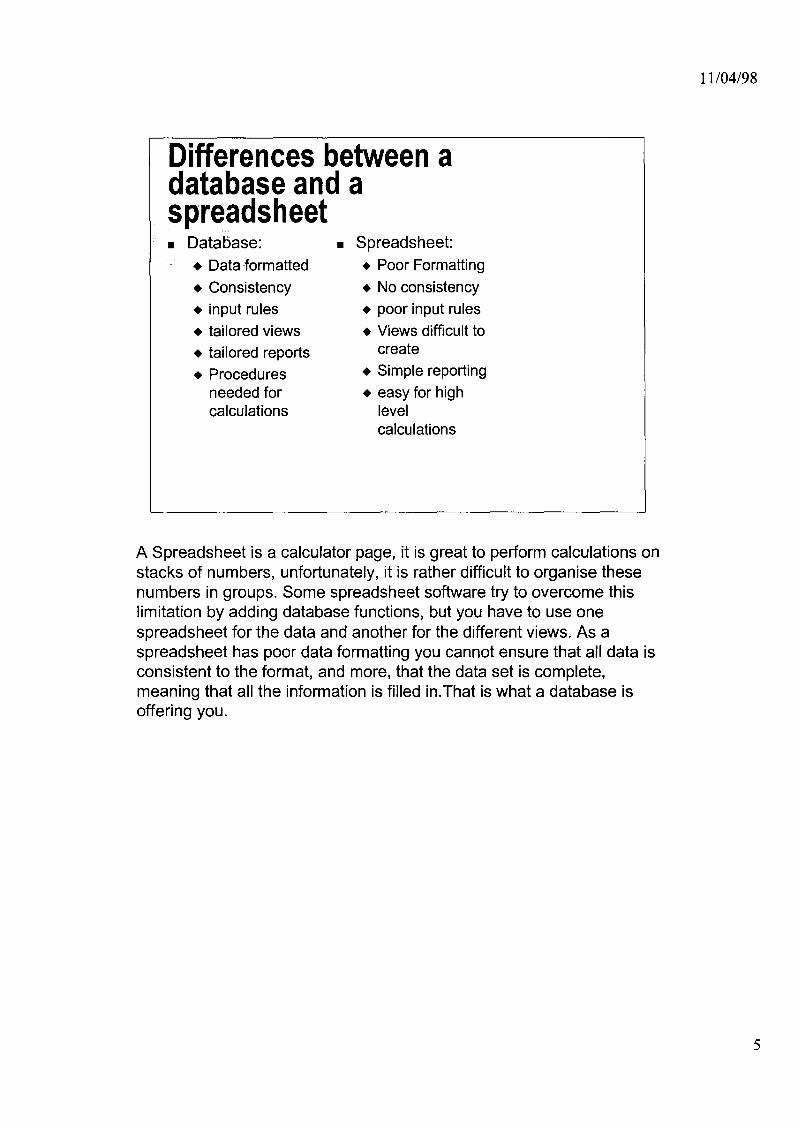
Differences between adatabase and aspreadsheet• Database: • Spreadsheet:
+ Data formatted + Poor Formatting+ Consistency + No consistency+ input rules + poor input rules+ tailored views + Views difficult to+ tailored reports create+ Procedures + Simple reporting
needed for + easy for highcalculations level
calculations
A Spreadsheet is a calculator page, it is great to perform calculations onstacks of numbers, unfortunately, it is rather difficult to organise thesenumbers in groups. Some spreadsheet software try to overcome thislimitation by adding database functions, but you have to use onespreadsheet for the data and another for the different views. As aspreadsheet has poor data formatting you cannot ensure that all data isconsistent to the format, and more, that the data set is complete,meaning that all the information is filled in.That is what a database isoffering you.
5

11/04/98
Linking tables• Insure relationship between 2
objects
Let say, you have a table of customers and a table of monthlyconsumption by customer. You want to display each customer and seeat the same time its monthly consumption. You therefore create arelationship between the customer table and the consumption tableusing the account field as link. You inform the database system thatthese two tables are related and that information should be manageddifferently. For instance you decide to change the account number ofone particular customer, the account number must also change in therelated table to keep the related record together with the customerrecord. Creating the relationship ensure this behaviour.
6
11/04/98
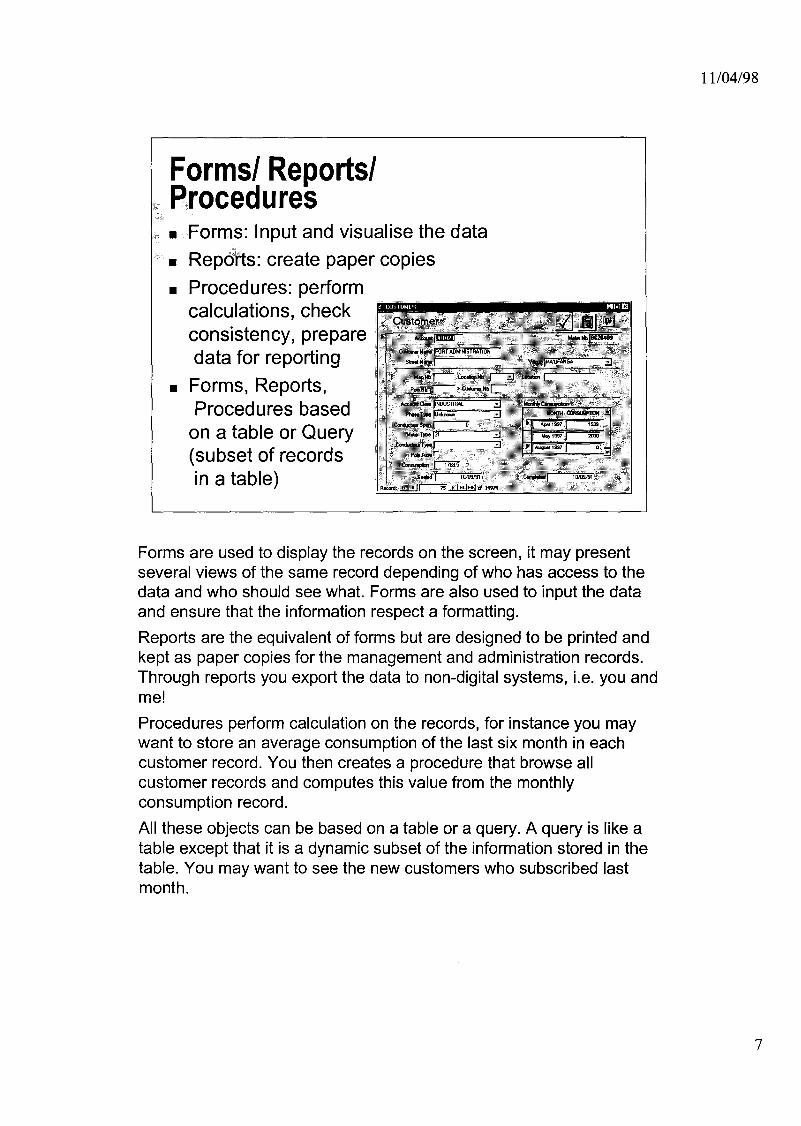
Formsl ReportslProcedures• Forms: Input and visualise the data• Reports: create paper copies• Procedures: perform
calculations, checkconsistency, preparedata for reporting
• Forms, Reports,Procedures based
on a table or Query(subset of recordsin a table)
Forms are used to display the records on the screen, it may presentseveral views of the same record depending of who has access to thedata and who should see what. Forms are also used to input the dataand ensure that the information respect a formatting.
Reports are the equivalent of forms but are designed to be printed andkept as paper copies for the management and administration records.Through reports you export the data to non-digital systems, i.e. you andme!
Procedures perform calculation on the records, for instance you maywant to store an average consumption of the last six month in eachcustomer record. You then creates a procedure that browse allcustomer records and computes this value from the monthlyconsumption record.
All these objects can be based on a table or a query. A query is like atable except that it is a dynamic subset of the information stored in thetable. You may want to see the new customers who subscribed lastmonth.
7

11/04/98
Linking with the outsideworld• To...()th~r databases (staff and
project)• To other programs (Maplnfo)• To the rest of the world (Internet)• Method DDSe compliant
database.
It is important when you select a database to check its possibilities tolink to other software and databases. The first item to check is theability to link two databases together. For instance you may have a staffdatabase, including payroll, holidays and a database of projectsincluding, tasks, resources, calendar. You want to attribute projects tostaff, you need to be able to link a table from the first database to atable in the second database.
The format of different databases could be included in the import exportformat of other software such as a word processor or a GIS. Forinstance Maplnfo reads and writes access tables.
The new way is to publish database on the internet. It is easier to opena Web browser than MS-Access, and to look for a phone number, it issometime a killer to use access.
All these links are usally done through ODBC, Open DataBaseConnectivity. It is a common set of procedures that software uses to digout information from a database. Make sure your database is ODBCcompliant.
8

11/04/98
FEAlSIEA database
•• Relationsh ips• View• Maplnfo link
Here is just a sample of what could be a database system linked to amapping system to create a GIS system. You have seen so far the firstpart the database: the organisation of the information.
9
11/04/98
What did you learn?.HDBIV1S: Relational DataBase
Management System• ODBC: Open DataBase
Connectivity• SQl: Simple Query language
You didn't notice it, but you just learned what is a RDBMS, a relationalDataBase Management System. MS-Access is a RDBMS. It includeslinks between tables (Relational DataBase) and it contains formsreports and procedures (Management system).
You also learned to ensure that all database software should be ODBCcompliant, to ensure you can import and export data as well as linktables with external software.
SQl is the language which is used to filter data in tables. In MS-Accessyou don't need to know SQl to filter the data, as a user interfaceconvert your request in SQl, but this language is Widely used in alldatabase systems.
10
11/04/98
What Next...
• Application exercise• More Information: Help in
software ...• Help line: [email protected]
You now need to do some exercises to apply the concepts you justlearned.
In all modern software like access, there are some samples database,tutorials and help. Make sure you know how to access thesecomponents as they are a great source of information.
You can also contact me over the internet and I will try to answer yourquestions.
11


Basics of GIS Lautoka, 15.04.98
When people talk about tiIS
..... they speak about:
• Remote Sensing or,• GPS application or ,
•.... really about tiIS ?
Often other terms such as GPS or Remote Sensing are combined under thegeneral term GIS. GPS as well as Remote Sensing requires differenthardware software and knowledge. A GIS is not capable to fulfil these jobssummarised under these term.
A GPS is a Global Positioning System that allows to navigate and to map bydefining the exact position of locations in the field using satelliteinformation, The mapping results are often stored in a GIS.
Remote Sensing is the interpretation and measurement of objects from thedistance. Normally aerial photographs or satellite imagery is used for thiskind of work. Again the analysis results are often used by a GIS, but the GISsoftware cannot do the analysis.
WolfForstreuter GOPA 2
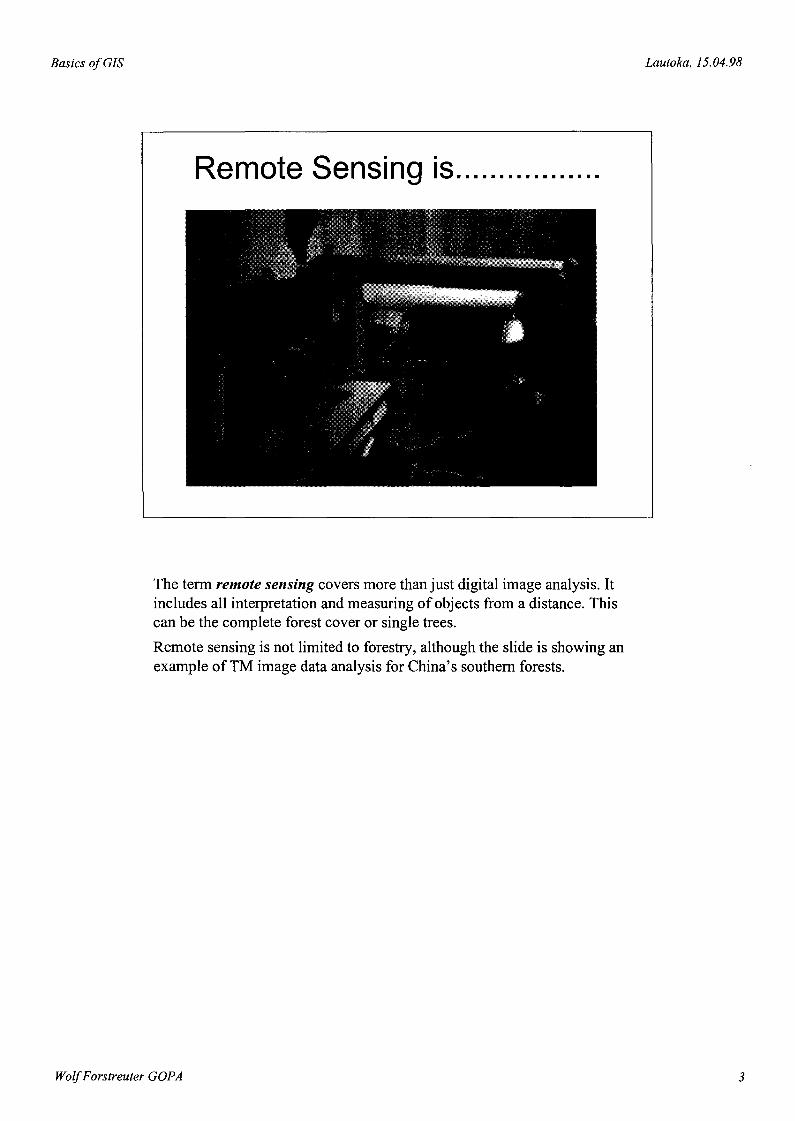
The term remote sensing covers more than just digital image analysis. Itincludes all interpretation and measuring of objects from a distance. Thiscan be the complete forest cover or single trees.
Remote sensing is not limited to forestry, although the slide is showing anexample ofTM image data analysis for China's southern forests.
WolfForstreuter GOPA 3
Basics of GIS Lautoka, 15.04.98
Remote Sensing is .
• satellite image analysis .• aerial photo analysis .
• it is the interpretation ormeasurement of objects withouttouching them Results are oftenstored in a GIS
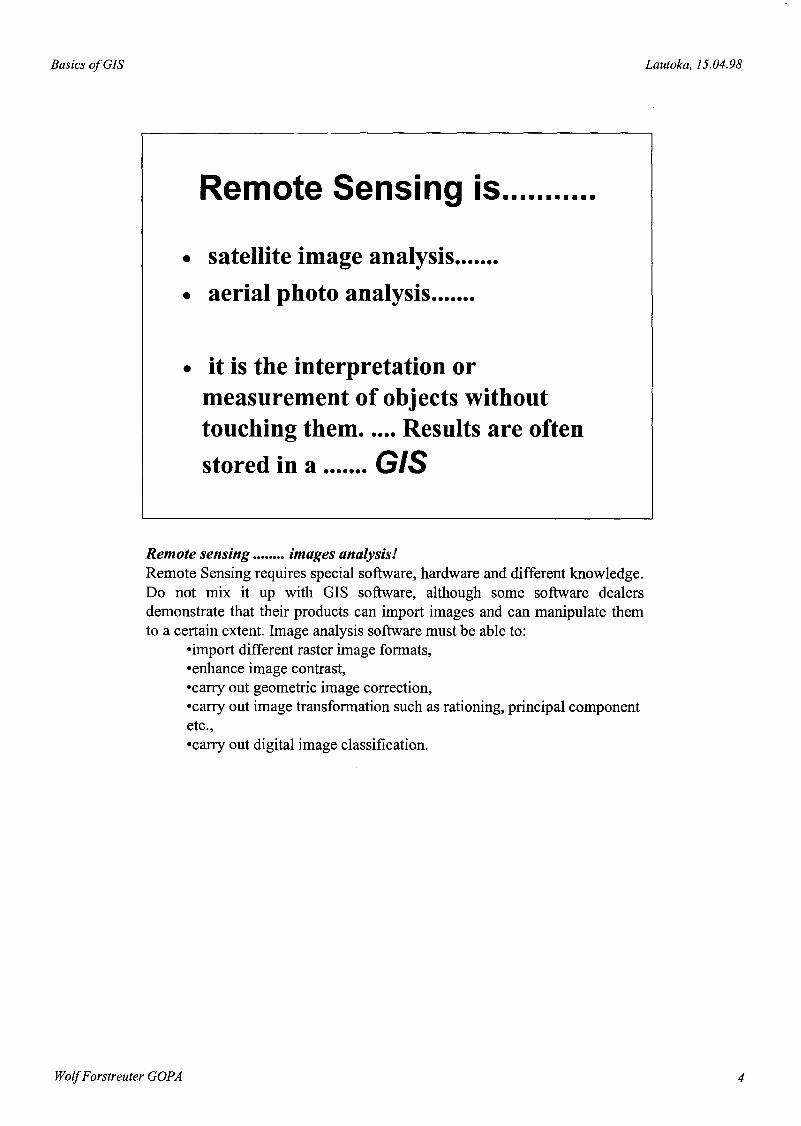
Remote sensing images analysis!Remote Sensing requires special software, hardware and different knowledge.Do not mix it up with GIS software, although some software dealersdemonstrate that their products can import images and can manipulate themto a certain extent. Image analysis software must be able to:
-import different raster image formats,·enhance image contrast,-carry out geometric image correction,-carry out image transformation such as rationing, principal componentetc.,-carry out digital image classification.
WolfForstreuter GOPA 4

Basics of GIS Lautoka,15.04.98
The slide above shows GPS application for forest plantation mapping in FijiIslands. It was the first time the plantation boundaries have been mapped at1:10,000 scale. The survey before only prepared sketch maps with veryincorrect boundaries. Mapping with differential GPS allowed a precision ofsub five-meter, which is sufficient for forest maps at 1:10,000 scale.
WolfForstreuter GOPA 5
Basics of GIS Lautoka, 15.04.98
a G PS is .• a Global Positioning System
• .... it allows you to determine yourposition using positioning satellites. Itcan be used to update maps which arestored in a GIS.
Remote sensing ....•.•. images analysis!
Remote Sensing requires special software, hardware and differentknowledge. Do not mix it up with GIS software, although some softwaredealers demonstrate that their products can import images and canmanipulate them to a certain extent. Image analysis software must be ableto:
-import different raster image formats,
-enhance image contrast,
·carry out geometric image correction,
-carry out image transformation such as rationing, principalcomponent etc.,
-carry out digital image classification.
WolfForstreuter GOPA 6


A GIS is a Geographic Information System. The stored information isdefined by X and Y position, sometimes even by additional Z value. A GISis sometimes named LIS and called Land Information System, but theoverall term is defined as geographic information system indicating thatspatial information is added to the data.
WolfForstreuter GOPA 8
Basics of GIS Lautoka, 15.04.98
a GIS handles maps, it can :
• store maps digitally,• print. digitally stored maps,• analyse maps (area, distance, number of...),• update maps,• combine different maps,• produce new maps by linking data bases to
spatial information.
A GIS first is able to store and to print maps. Many systems are limited tothese two activities. However, there are many more jobs, which can beperformed by using GIS application, such as automatically update maps bychanging the data of a relational database. It is also possible to updaterelational databases by changing the map content. Planning is performedeasier than before by displaying different scenarios. All map analysis, suchas area estimation, the GIS calculates automatically. Furthermore, some GISare capable to combine the content of different maps by overlaying them.
WolfForstreuter GOPA 10
Basics of GIS Lautoka, 15.04.98
Data Input to GIS
e table data linked to a map object,e polygons, lines or points from another
map or image by employing a digitisingtable,
e direct import of satellite or scanned aerialphotographs as raster data sets,
e direct import of polygons, lines and pointsfrom GPS units.
There are different types of data, which can be imported to a GIS:
enon spatial data can be typed into the GIS in tables linked tomap layers. It is also possible to import complete table linkedto a map object,
ea digiti sing table allows to import polygons, lines or pointsfrom another map or image,
esatellite or scanned aerial photographs can be importeddirectly as digital raster data sets,
epolygons, lines and points can be imported directly fromGPS units.
Most GIS software packages provide modules, which allow to edit maps,which includes to add legends, include symbols in the map layer or overlaythe map with a grid. Even if a GIS software is restricted to data input andmap production a permanent map update is possible in less time than beforewhen all this had to be done manually.
WolfForstreuter GOPA 11

Basics of GIS Lautoka, 15.04.98
The slide above shows digiti sing work for Jinggu County, YuannanProvince, China. The map is fixed on the digiti sing table and the operatortells the system the position and the comer co-ordinates of the map as wellas projection, scale, spheroid and datum. If the operator then follows withthe mouse the course of rivers or roads their co-ordinates are stored in thecorrelated GIS layer.
WolfForstreuter GOPA 12

Basics o/GIS Lautoka, 15.04.98
Why printing a map by GiS ....
• faster than hand drawing,• more accurate,• style adjustable,• map content selectable,• a digital map can be sent via telephone and
printed by the end user.
Map printing is a semi automatic process carried out by pen plotter or ink jetplotter. The plotter will always produce exactly the spatial informationstored in the GIS, there will be no "individual difference".
There is just a small instruction necessary to the system and the map will beproduced with Chinese village names of Jinggu County. If the roads on themap are shown in black and red seems to be more suitable just a smallinstruction is necessary to change it. Style of the output is adjustable!
The GIS of Jinggu County stores already more information, than can beshown on a map sheet without loosing the overview. The user can definewhat the map should show, e.g. the Forestry Department may want to haveall sub-compartment boundaries and numbers while for another user thisinformation is disturbing and he does not include it in the print output.
WolfForstreuter GOPA 13

Basics of GIS Lautoka, 15.04.98
No-p~eY~Y!
the GIS does:
area statistic
statistic of outline
calculation of pointswithin the area
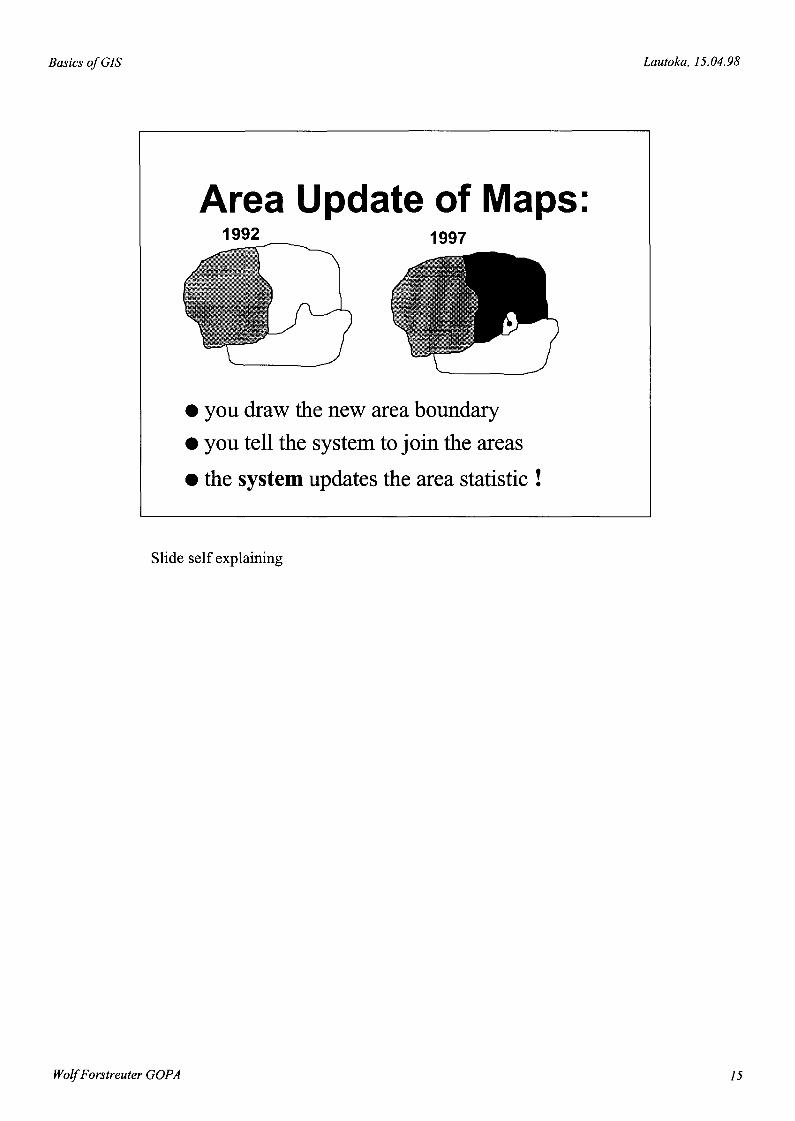
Slide self explaining
WolfForstreuter GOPA 14
Basics of GIS Lautoka, 15.04.98
Slide self explaining
WolfForstreuter GOPA 15

Basics of GIS Lautoka, 15.04.98
Update of PointFeatures
The slide above shows a MapInfo display of the Electrical Power Board inTonga, which has linked its relational database to the GIS. The displayshows power poles of the city. If a field team comes back into the office andchanges the information in the GIS (e.g. the type of pole has changed) theycan modify the screen and the connected database will be updatedautomatically.
WolfForstreuter GOPA 16

Basics of GIS Lautoka, 15.04.98
Slide self explaining
WolfForstreuter GOPA 17

Basics o/GIS Lautoka, 15.04.98
Before using GIS facilities, an operator had to use light tables to overlay onemap on top of the other. The slide above shows the possible overlay of sub-compartments over a soil map. The GIS provides exact figures how manyhectares of forest type A and how many hectares of forest type B is growingon soil type A and how many on soil type B. This information can be aninput for growth modelling.
As long as the maps have a similar scale the system does such an analysisautomatically. Even if the projection, spheroid or datum is different, thesystem can transform the map. It is understood that all maps have to be indigital form, before overlaying them
WolfForstreuter GOPA 18

Basics o/GIS Lautoka, 15.04.98
The automatic map update by changing the relational database can be usedto visualise different scenarios. E.g. In the Tonga Electrical Power Board theGIS can show, which part of the town is without power if a specific line ortransformer gives up. If a contour map is included in the system, if would bepossible to show, which transformer is under water by increasing the waterlevel to 3, 5 or 6 meters.
Before using GIS tools all analysis of map content had to be estimatedmanually. Dot grids or planimeter have been used to calculate the area. Linefeatures on maps like roads or power lines were measured in a similar wayand point features such as power poles within a particular area were countedor estimated in a statistically approved way.
A GIS performs this automatically, fast and with high precision.
WolfForstreuter GOPA 19

The slide above shows a possible scenario in Jinggu County. Three differentforest types cover three sub-compartments.
WolfForstreuter GOPA 20

Basics o/GIS Lautoka, 15.04.98
• A) 15% Pinus, 30%Salix, 55% Quercus
• B) 35 % Pinus, 55%Salix, 10% Quercus
• C) 14 % Pinus, 35%Salix, 51% Quercus
Forest Type Map Legend after Logging:• A) = Hardwood Forest• B) = Softwood Forest• C) = Hardwood Forest
The slide above shows the same sub-compartments known from the lastslide, after logging operation. The logging removed most of the pine incompartment A . Once the statistic is updated after a post harvest inventoryis carried out or new satellite data is analysed, the map will showautomatically sub-compartment A as hardwood forest, because the GIS islinked to the forestry database.
wolf Forstreuter GOPA 21
Basics of GIS Lautoka, 15.04.98
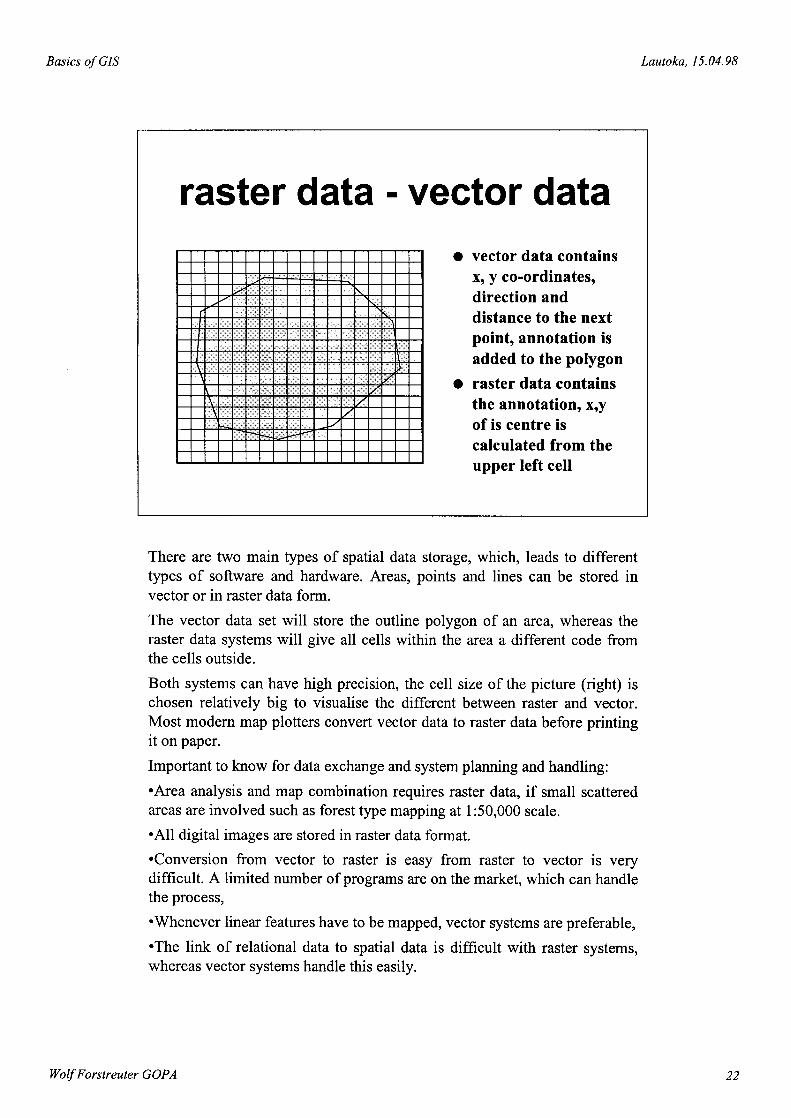
raster data - vector data• vector data contains
x, yeo-ordinates,direction anddistance to the nextpoint, annotation isadded to the polygon
• raster data containsthe annotation, x,yof is centre iscalculated from theupper left cell
There are two main types of spatial data storage, which, leads to differenttypes of software and hardware. Areas, points and lines can be stored invector or in raster data form.
The vector data set will store the outline polygon of an area, whereas theraster data systems will give all cells within the area a different code fromthe cells outside.
Both systems can have high precision, the cell size of the picture (right) ischosen relatively big to visualise the different between raster and vector.Most modem map plotters convert vector data to raster data before printingit on paper.
Important to know for data exchange and system planning and handling:
-Area analysis and map combination requires raster data, if small scatteredareas are involved such as forest type mapping at 1:50,000 scale.
-All digital images are stored in raster data format.
-Conversion from vector to raster is easy from raster to vector is verydifficult. A limited number of programs are on the market, which can handlethe process,
-Whenever linear features have to be mapped, vector systems are preferable,
-The link of relational data to spatial data is difficult with raster systems,whereas vector systems handle this easily.
WolfForstreuter GOPA 22

Basics of GIS Lautoka, 15.04.98
Vector Data• linear features appear more precisely,• needs less computer space than raster data,• output can be produced employing a pen
plotter which allows dialine technique,• the number of polygons within one map
sheet is limited (1000 - 9000),• cadastrial data is vector data.
Slide self explaining
WolfForstreuter GOPA 23

Basics of GIS Lautoka,15.04.98
Raster Data
• takes more computer space, annotationvalues> 256 are stored in 16 Bit,
• area analysis just has to count the number ofpixels within an area, very fast!
• alphanumeric operations very fast, this isimportant for every overlay analysis!
• difficult to address specific areas.• satellite images are raster data sets !
Slide self explaining
WolfForstreuter GOPA 24

Mapping with GIS Lautoka, 15.04.98
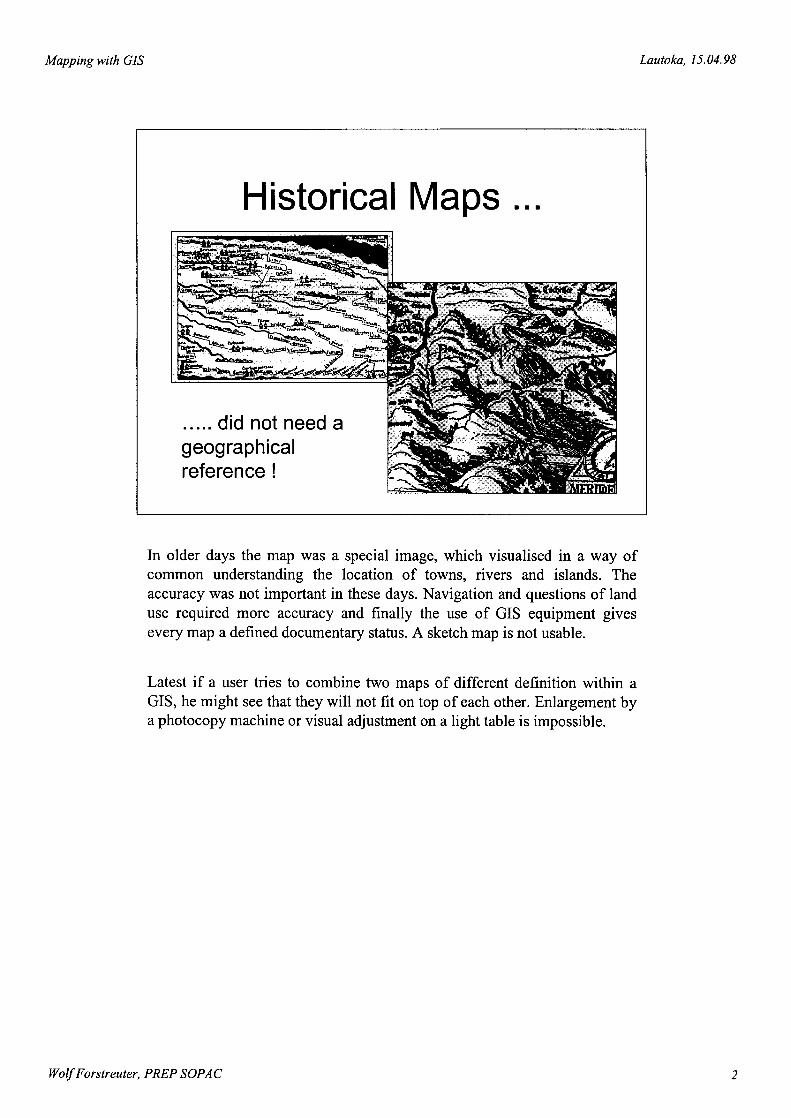
In older days the map was a special image, which visualised in a way ofcommon understanding the location of towns, rivers and islands. Theaccuracy was not important in these days. Navigation and questions of landuse required more accuracy and finally the use of GIS equipment givesevery map a defined documentary status. A sketch map is not usable.
Latest if a user tries to combine two maps of different definition within aGIS, he might see that they will not fit on top of each other. Enlargement bya photocopy machine or visual adjustment on a light table is impossible.
Wolf Forstreuter, PREPSOPAC 2
Mapping with GIS Lautoka, 15.04.98
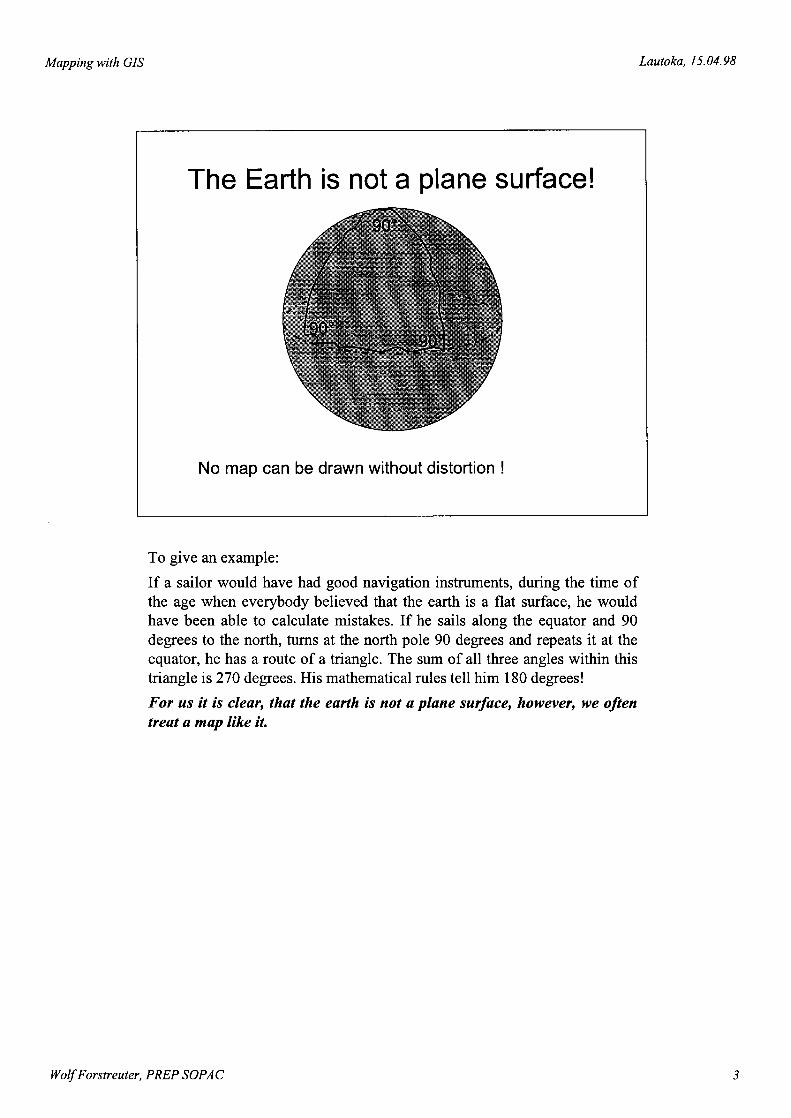
To give an example:
If a sailor would have had good navigation instruments, during the time ofthe age when everybody believed that the earth is a flat surface, he wouldhave been able to calculate mistakes. If he sails along the equator and 90degrees to the north, turns at the north pole 90 degrees and repeats it at theequator, he has a route of a triangle. The sum of all three angles within thistriangle is 270 degrees. His mathematical rules tell him 180 degrees!
For us it is clear, that the earth is not a plane surface, however, we oftentreat a map like it.
Wolf Forstreuter, PREPSOPAC 3

Mapping with GIS Lautoka, 15.04.98
If a map is the minimised flat outline of the earth's surface, problems areobvious. The surface of the earth is a globule, which cannot be put into a flatsheet of paper. And it is the truth no map is correct! However, there aresome rules to do it in one or the other optimised way and this is calledprojection.
The main projections are the azimuthal, the cylindrical and the conicalprojection. These main projections can be sub-divided, but they will referalways to these three main types.
Wolf Forstreuter, PREPSOPAC 4
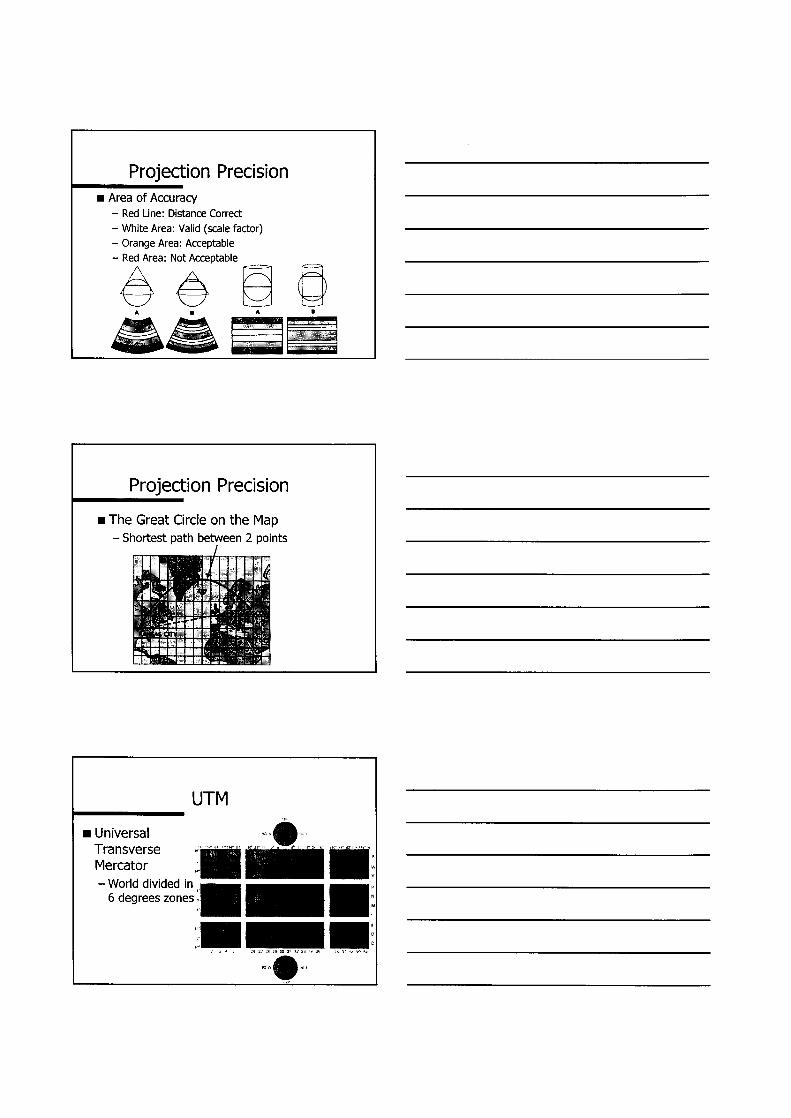
Mapping with GIS Lautoka, 15.04.98
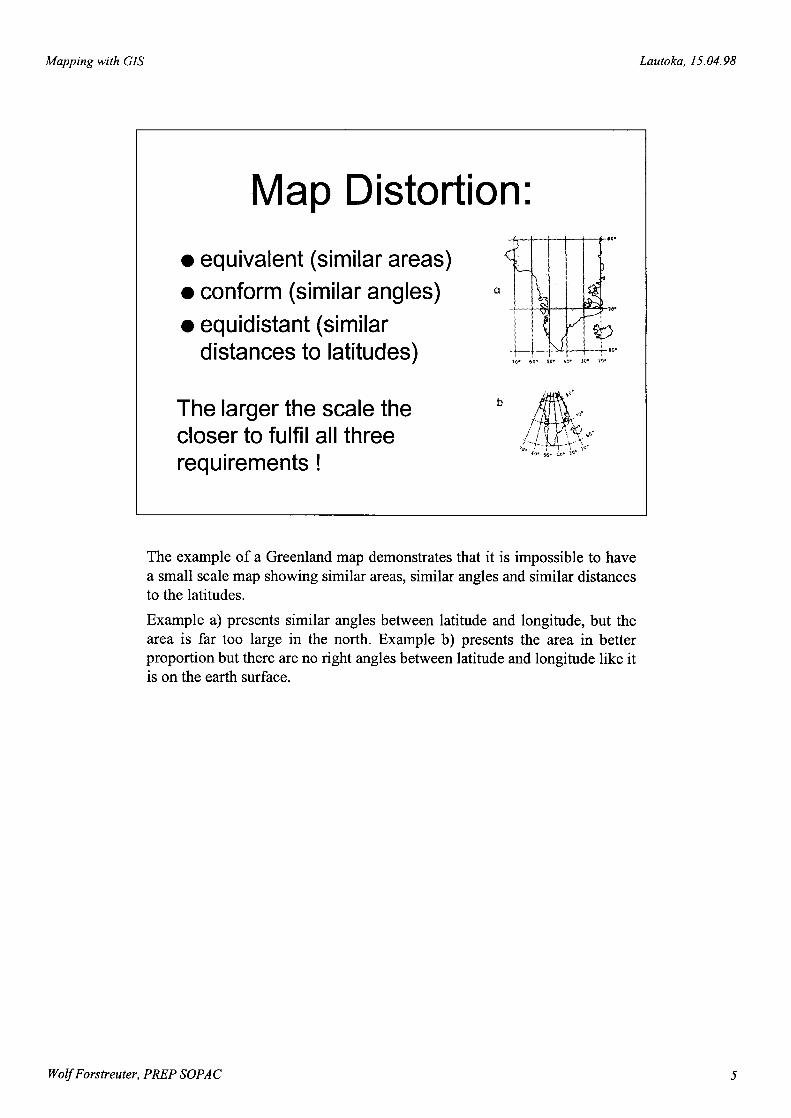
The example of a Greenland map demonstrates that it is impossible to havea small scale map showing similar areas, similar angles and similar distancesto the latitudes.
Example a) presents similar angles between latitude and longitude, but thearea is far too large in the north. Example b) presents the area in betterproportion but there are no right angles between latitude and longitude like itis on the earth surface.
WolfForstreuter, PREPSOPAC 5

Mapping with GIS Lautoka, 15.04.98
The polyhedra projection is a mixed type of projection. The map is onlytouching the earth surface at the four map comers. It seems to be ideal, butalso this projection type cannot present a globule. The error is onlyminimised for large scale maps. The map sheets cannot be joined in a GIS ifthere is no calculation of projection involved.
WolfForstreuter, PREPSOPAC 6

Mapping with GIS Lautoka, 15.04.98
If the map has the same scale and the same map projection features can beplaced in different position if a different spheroid is used. Knowing that theearth is not a globule it is necessary to defined its shape. The spheroiddefines the minor and major axis of the ellipse describing best themathematical earth's shape.
Old spheroids were adjusted to the specific mapping and grid system of thecountries in which they were used. Because of the measure inaccuracy inolder days the same spheroid applied in different countries relates todifferent results. This is defined by the datum. However, modemcalculations e.g, the spheroid WGS84, which is used by the American globalpositioning system, is well calculated, a datum in not necessary.
WolfForstreuter, PREPSOPAC 7

Mapping with GIS Lautoka, 15.04.98
The scale of the map does define the distance between two locations on themap in proportion to the reality. However, the scale describes more than therelation of distances only! The scale also describes the generalisation ofmapped features. Very often the praxis can be noted that scale adjustment iscarried out by help of an enlargement of a photocopy machine. Firstly, aphotocopy machine will enlarge x and y direction differently. Secondlythese maps never will fit in a GIS. It will lead to problems later. Bothimages of the same area mapped at 1:500,000 scale (above) and at1:5,000,000 scale and then enlarged show clearly the difference ingeneralisation. It is not possible to superimpose one map on top of eachother!
However, this is the most used praxis and relates to frequent GIS relatedproblems.
WolfForstreuter, PREP SOPAC 8

Mapping with GIS Lautoka, 15.04.98
Another example:
Somebody only has a map at 1:100,000 scale and wants to use it forrecording features at 1:10,000 scale. He may use the photocopy machine toenlarge the map 10 times. If he has a very good photocopy machine and heis lucky, he gets the map more or less in the correct proportion. However, hehas a complete different information, not usable for 1:10,000 scale.
WolfForstreuter, PREP SOPAC 9
Mapping with GIS Lautoka, 15.04.98
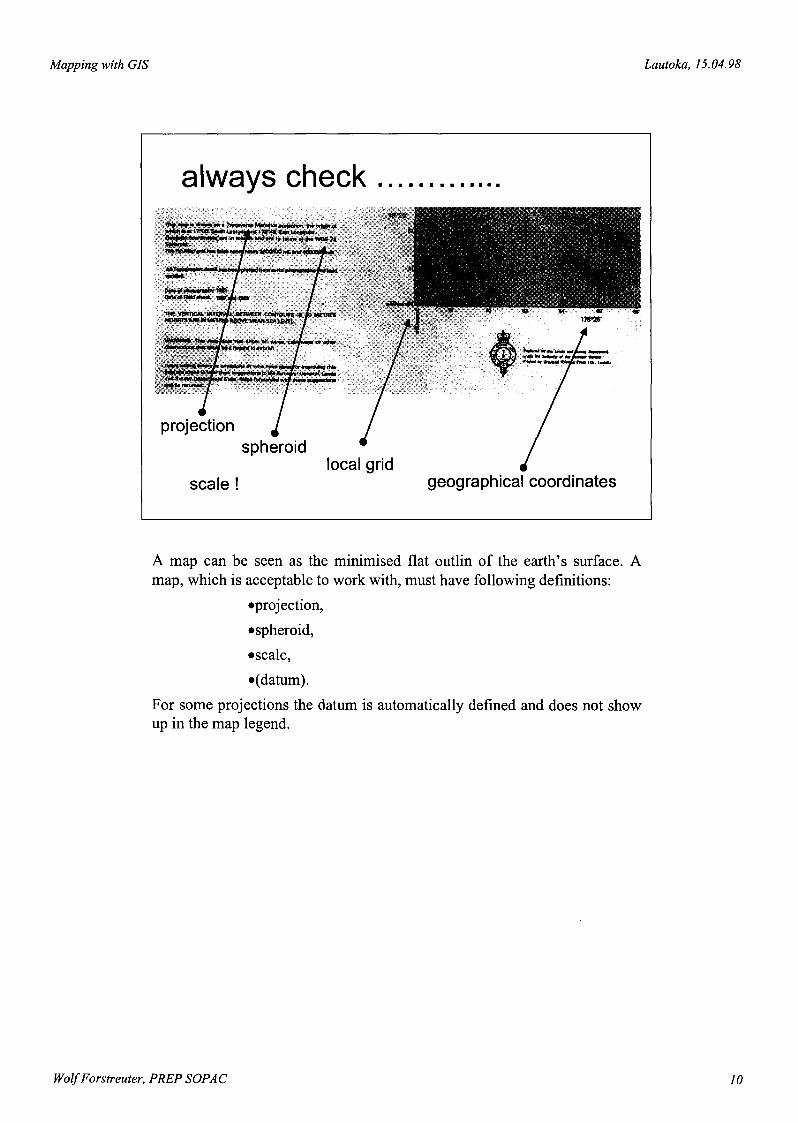
A map can be seen as the minimised flat outlin of the earth's surface. Amap, which is acceptable to work with, must have following definitions:
.proj ection,
.spheroid,
.scale,
.(datum).
For some projections the datum is automatically defined and does not showup in the map legend.
WolfForstreuter, PREP SOPAC 10


-GIS & Image Backdrop -Lautoka, 15.04.98
GIS & Image Data
FEASIEA Power Utility GIS Workshop
PREP
SO PACWolf Forstreuter
GIS Backdrop
The use of raster image data as a Geographic Information System (GIS)background layer is increasing world-wide. GIS applications enable non-cartographers to add spatial reference to their data that creates a greater needto update the maps and requires increased detail of information. A way ofshortening the production time of these detailed maps is throughemployment of aerial photographs or satellite images.
-Wolf Forstreuter -1

-GIS & Image Backdrop -Lautoka, 15.04.98
Advantage of GIS Backdrop
These remotely sensed images allows for the spatial technical information tobe placed into the natural environment, in our case the elements of a powerutility are displayed on top of the corrected aerial photograph. The benefitsof having this backdrop or underlay include:
-Field teams will have a better orientation than working with onlycadastral maps due to the additional information in the raster images
- .Improved view of most construction sites, as trees that grow in path of apower line are visible on the image.
-A customer can be connected in the most effective way as the imageshows all buildings, car parking areas, minor roads and other necessaryitems not shown in the cadastral map.
-Wolf Forstreuter -2

-GIS & Image Backdrop -Lautoka, 15.04.98
The Steps of Creating GIS Backdrop
The process of creating a background image that is not available in digitalformat will normally follow three steps,
a) scanning ofthe image,
b) geometric correction which includes:
-geometric transformation
-contrast adjustment and
-stitching of the scanned images
c) the actual import to the GIS.
-Wolf Forstreuter -3
-GIS & Image Backdrop -Lautoka, 15.04.98
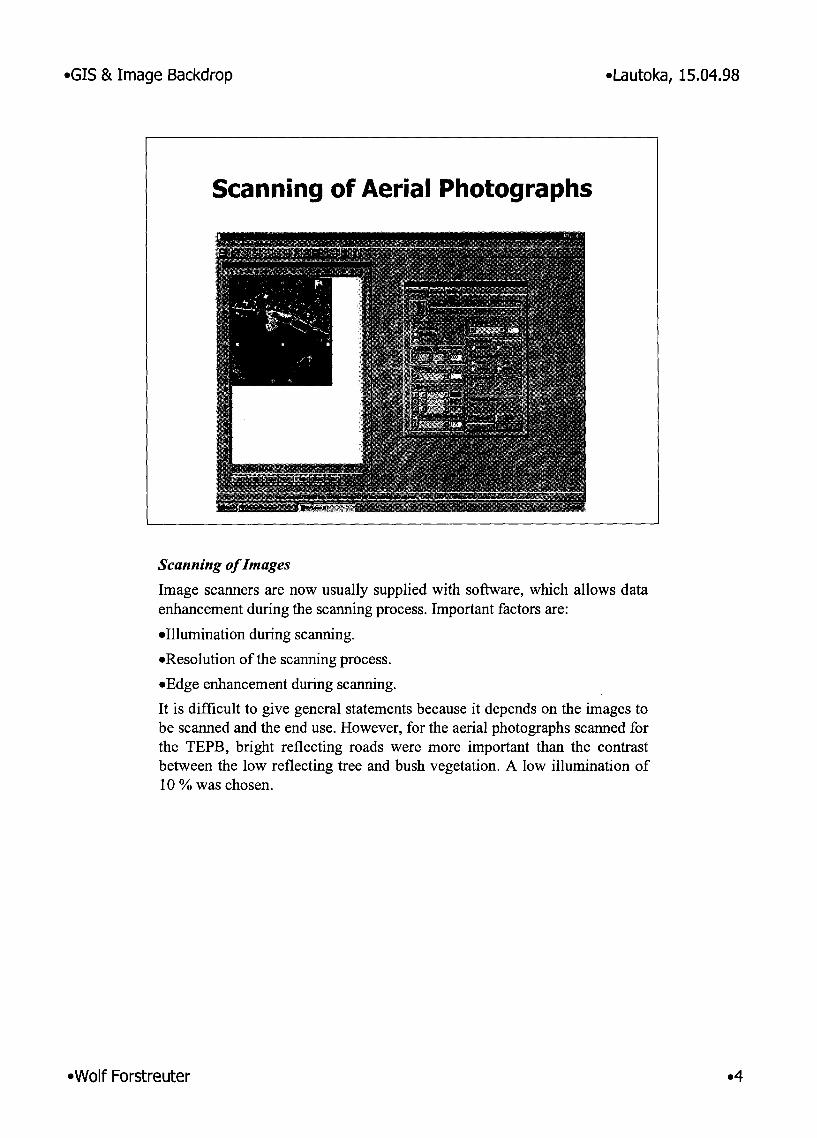
Scanning of Images
Image scanners are now usually supplied with software, which allows dataenhancement during the scanning process. Important factors are:
eIllumination during scanning.
eResolution of the scanning process.
eEdge enhancement during scanning.
It is difficult to give general statements because it depends on the images tobe scanned and the end use. However, for the aerial photographs scanned forthe TEPB, bright reflecting roads were more important than the contrastbetween the low reflecting tree and bush vegetation. A low illumination of10 % was chosen.
-Wolf Forstreuter -4

-GIS & Image Backdrop -Lautoka, 15.04.98
Resolution
The optimal resolution was tested in a small test series. Using 600 dots perinch (dpi) even power poles could be identified in sunny areas on the image,which were hardly to see with a resolution of 300 dpi. 900 dpi did not showa recognisable improvement and 1200 dpi exceeded the memory of thescanner. It should be noted that doubling the resolution increases the filesize by four times. For the TEPB project all images have been scanned with600 dpi.
-Wolf Forstreuter -5
-GIS & Image Backdrop -Lautoka, 15.04.98
Geometric Correction ....
Two Actions in one go !• Change of image geometry
• Change of radiometric image content
...... .Image analysis software
The Geometric Correction
The geometric correction was completed using the image analysis softwareERDAS Imagine through three independent steps:
-Transformation from central projection of every aerial photograph toorthogonal map projection.
-Stitching of all corrected photographs to one background layer
-Contrast adjustment ofthe images
Although the same module handles the last two steps they are independentprocedures.
-Wolf Forstreuter -6
-GIS & Image Backdrop -Lautoka, 15.04.98
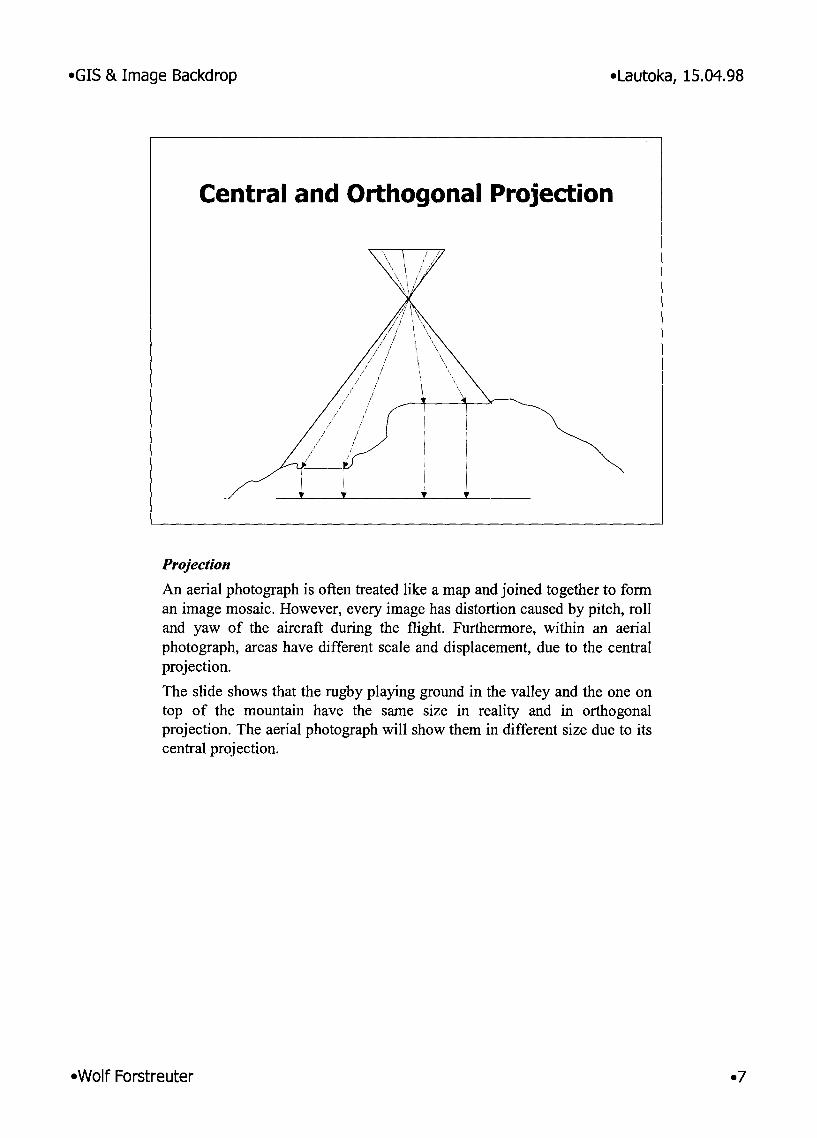
Projection
An aerial photograph is often treated like a map and joined together to forman image mosaic. However, every image has distortion caused by pitch, rolland yaw of the aircraft during the flight. Furthermore, within an aerialphotograph, areas have different scale and displacement, due to the centralprojection.
The slide shows that the rugby playing ground in the valley and the one ontop of the mountain have the same size in reality and in orthogonalprojection. The aerial photograph will show them in different size due to itscentral projection.
-Wolf Forstreuter -7

-GIS & Image Backdrop -Lautoka, 15.04.98
Types of Geometric Correction
There are three main types of geometric correction of raster data:
-Polynomial correction.
-Rubber sheet correction.
-Ortho correction.
The polynomial correction can be subdivided into linear, seconddegree and correction with polynoms of higher degree.The rubber sheet correction requires a net of GCPs systematicallydistributed over the entire image. The program ensures that theGCPs exactly fit into the new position. The program performs aseparate linear transformation for each sub-area of the image locatedbetween three GCPs.An orthogonal correction is the most sophisticated geometriccorrection. Such a program requires a digital elevation model in thescale of the output image or a very dense network of GCPs givingvalues for X, Y and Z axis.The rubber sheet correction and the orthogonal projection are onlyimplemented in sophisticated image analysis software. Maplnfo onlyprovides linear rectification, the image transformation must beperformed outside of Maplnfo environment.
-Wolf Forstreuter -8
-GIS & Image Backdrop -Lautoka, 15.04.98
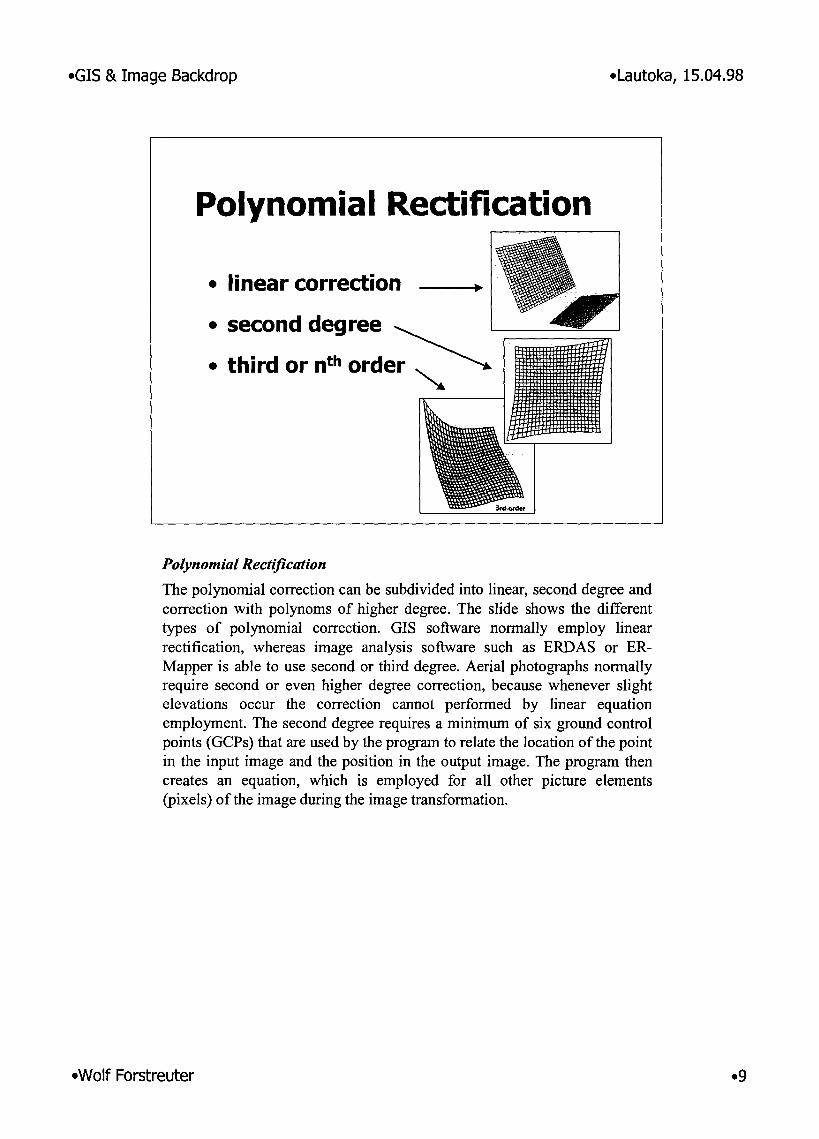
Polynomial Rectification
The polynomial correction can be subdivided into linear, second degree andcorrection with polynoms of higher degree. The slide shows the differenttypes of polynomial correction. GIS software normally employ linearrectification, whereas image analysis software such as ERDAS or ER-Mapper is able to use second or third degree. Aerial photographs normallyrequire second or even higher degree correction, because whenever slightelevations occur the correction cannot performed by linear equationemployment. The second degree requires a minimum of six ground controlpoints (GCPs) that are used by the program to relate the location of the pointin the input image and the position in the output image. The program thencreates an equation, which is employed for all other picture elements(pixels) of the image during the image transformation.
-Wolf Forstreuter -9

-GIS & Image Backdrop -Lautoka, 15.04.98
Selection of Ground Control Points (GCPs)
The operator must collect GCPs for locations for which he knows the exactco-ordinates. He must have a map of the area or he carries out GPS survey.Furthermore, he must be able to identify the GCPs both on the image and onthe map.
-Wolf Forstreuter -10

-GIS & Image Backdrop -Lautoka, 15.04.98
Distribution of GCPs
The operator has to distribute the GCPs in a relative systematic way alloberthe image to rectify. Important are the edges and the corners, a rectificationdoes not work if the operator concentrate the GCPs in the center. Imageparts without interest for the later backdrop, such as the ocean in the lowerpart of the slide above, do not need GCPs.
-Wolf Forstreuter -11

-GIS & Image Backdrop -Lautoka, 15.04.98
Transformation Matrix
Comparing the location of GCPs in the image and in the output matrix(output image) the software builds a transformation equation. The softwarealso shows the displacement of every GCP compared to the averagetransformation. The RMS erros (window upper right) shows the averageerror for every pixel. The unit is "pixel" the transformation error in this caseis 2m because the pixel size is O.5m.
Important: The RMS error does not indicate the accuracy of the geometriccorrection! The operator must check on the transformed image.
-Wolf Forstreuter -12
-GIS & Image Backdrop -Lautoka, 15.04.98
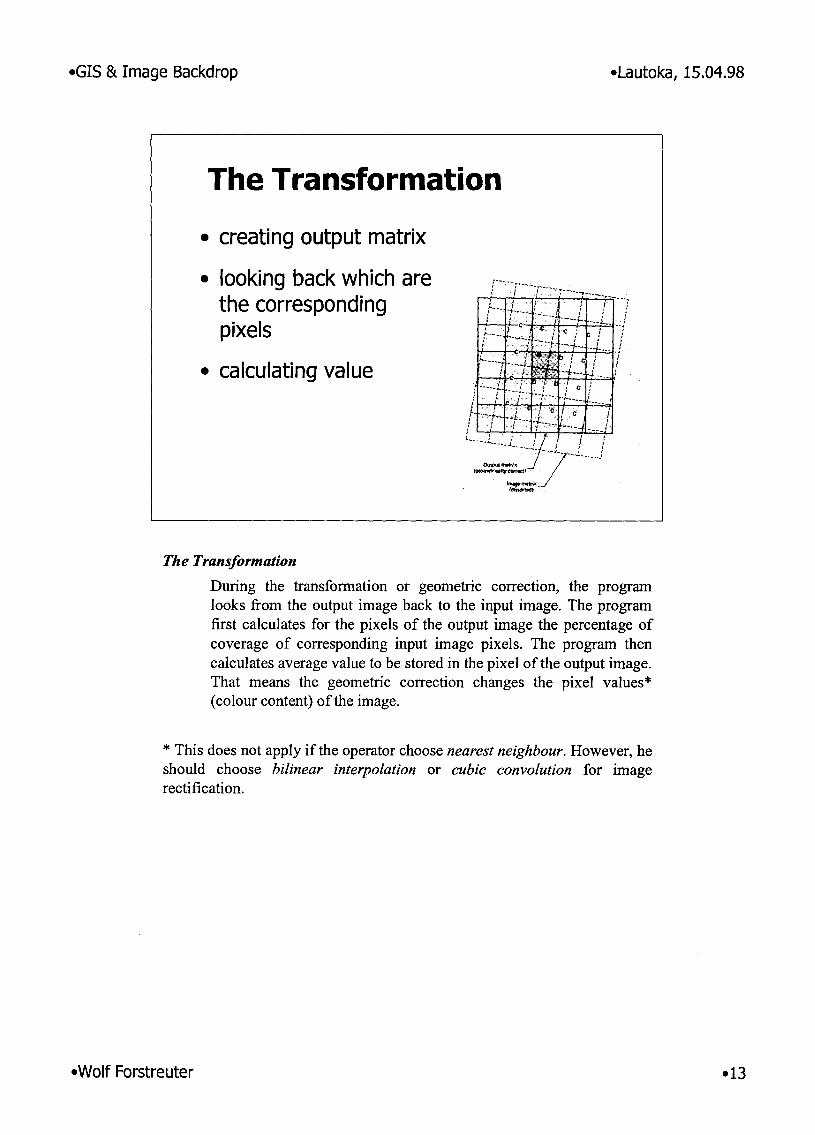
The Transformation
• creating output matrix
• looking back which arethe correspondingpixels
• calculating value
The Transformation
During the transformation or geometric correction, the programlooks from the output image back to the input image. The programfirst calculates for the pixels of the output image the percentage ofcoverage of corresponding input image pixels. The program thencalculates average value to be stored in the pixel of the output image.That means the geometric correction changes the pixel values*(colour content) of the image.
* This does not apply if the operator choose nearest neighbour. However, heshould choose bilinear interpolation or cubic convolution for imagerectification.
-Wolf Forstreuter -13

-GIS & Image Backdrop -Lautoka, 15.04.98
Radiometric Characteristics of Aerial Photographs
Due to its central projection an aerial photograph has different radiometriccharacteristics compared with a satellite image, which is homogeneouswithin one data set. Three main reasons that cause radiometric inhomogenityof an aerial photograph are:
-Exposure falloff.
-Hot spot phenomena.
eDifferential shading.
Every photo has more light in its centre than at its edges, which is called theexposure falloff. In tropical countries such as Tonga, the sun is high enoughon the sky that there will be an area where the beams from the sun reflectedfrom the smooth surface will hit the camera lens directly. This phenomena iscalled the "Hot Spot". Furthermore, objects can be illuminated on one sideof the image; the same type of object can be in the shadow at the other sideof the same image. The differential shading is the most obvious radiometricdifference when images are stitched together.
-Wolf Forstreuter -14

-GIS & Image Backdrop -Lautoka, 15.04.98
Image Stitching
After correcting the single aerial photographs they have to be stitchedtogether to provide a homogeneous layer. Overlapping parts have to be cutand the cut images have to be correctly placed in one output matrix. Slightgeometric aberrations on the joints ofthe images the program homogenize.
-Wolf Forstreuter -15
-GIS & Image Backdrop -Lautoka, 15.04.98
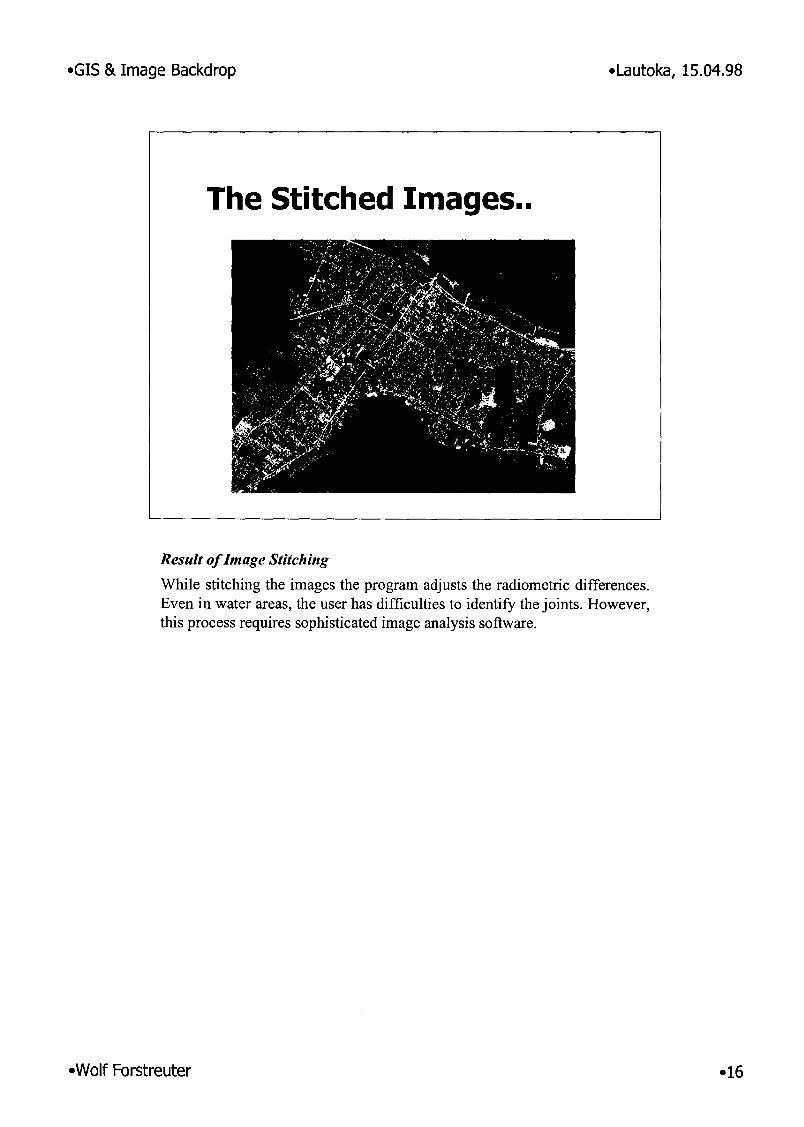
Result of Image Stitching
While stitching the images the program adjusts the radiometric differences.Even in water areas, the user has difficulties to identify the joints. However,this process requires sophisticated image analysis software.
-Wolf Forstreuter -16
-GIS & Image Backdrop -Lautoka, 15.04.98
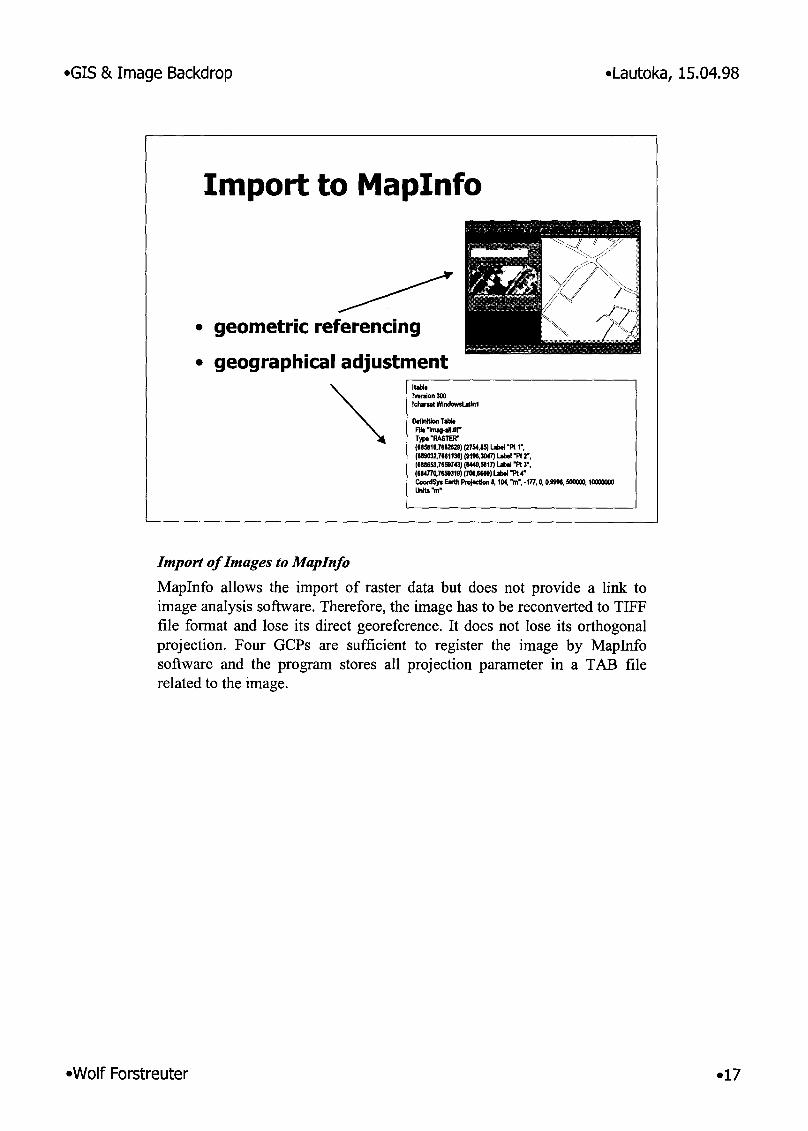
Import of Images to MapInfo
MapInfo allows the import of raster data but does not provide a link toimage analysis software. Therefore, the image has to be reconverted to TIFFfile format and lose its direct georeference. It does not lose its orthogonalprojection. Four GCPs are sufficient to register the image by MapInfosoftware and the program stores all projection parameter in a TAB filerelated to the image.
-Wolf Forstreuter -17

-GIS & Image Backdrop -Lautoka, 15.04.98
Satellite Images
Due to very high altitude during image recording and due to differentsensors such as scanners digital satellite images do not create that manyproblems if they are used for image backdrop. They do not have thedescribed radiometric differences within the image described before as.
-exposure fall off
-hot spot
-differential shading
Furthermore:
-they have already nearly orthogonal projection,
ethey cover larger areas with one image, which requires less GCPs forcorrection and
ethey are much cheaper if compared on a hectare basis.
-Wolf Forstreuter -18
-GIS & Image Backdrop -Lautoka, 15.04.98
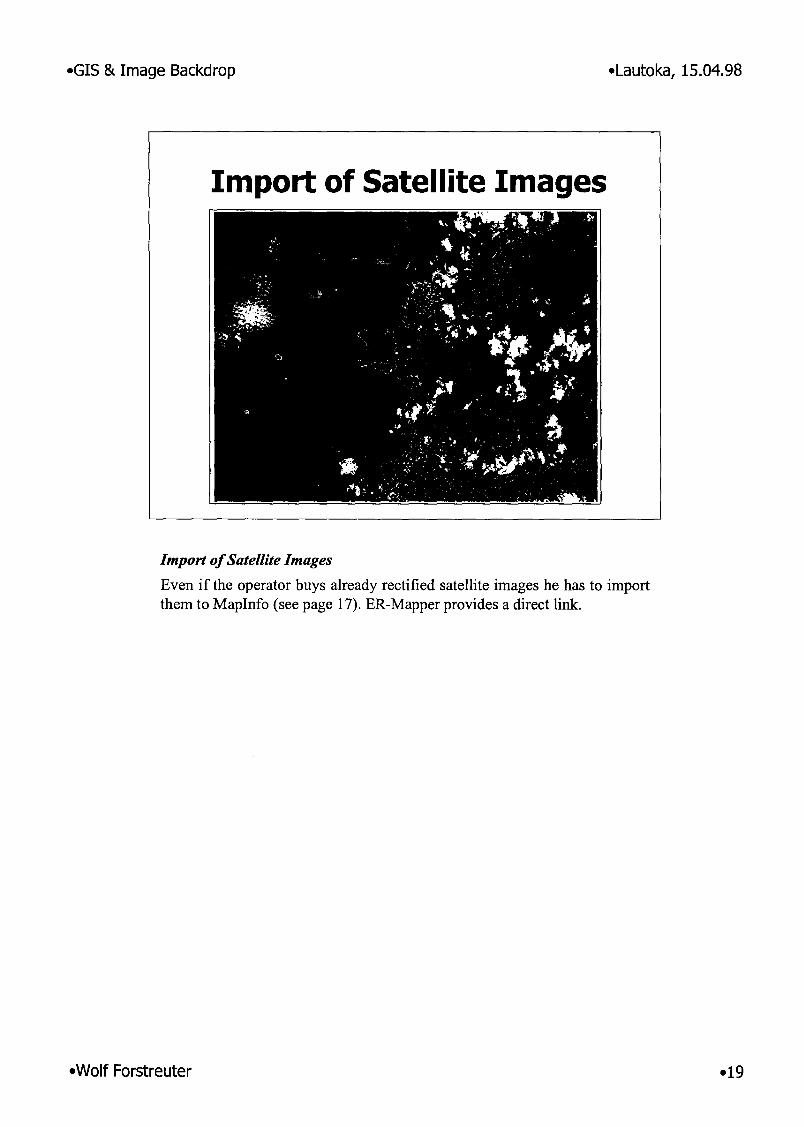
Import of Satellite Images
Even if the operator buys already rectified satellite images he has to importthem to Maplnfo (see page 17). ER-Mapper provides a direct link.
-Wolf Forstreuter -19

-GIS & Image Backdrop -Lautoka, 15.04.98
1:50,000 Backdrop of FEA-GIS
The slide shows the overlay of Fiji's 132kV line on a Landsat TM Backdrop.The lake in the lower left is the Monasavu dam.
-Wolf Forstreuter -20
-GIS & Image Backdrop -Lautoka, 15.04.98
Questions ..... ?
Thanks for attention,
Wolf Forstreuter
e-mail [email protected]
e-mail [email protected]
fax: +49-6172-930350
ConclusionTo create a background layer produced by aerial photographs is a timeconsuming process. It requires hardware such as a high speed computer withsufficient free capacity hard drive and a scanner of A3 size and 600 dpiresolution. In addition image analysis software is essential.
In 1998, digital satellite images will be available, which provide 1 metreresolution and required projection. These images will be a better choice thanaerial photography, which is not designed for GIS backdrop.
-Wolf Forstreuter -21
Available and Future Images/or GIS Backdrop * Lautoka,15.04.9807/16/96
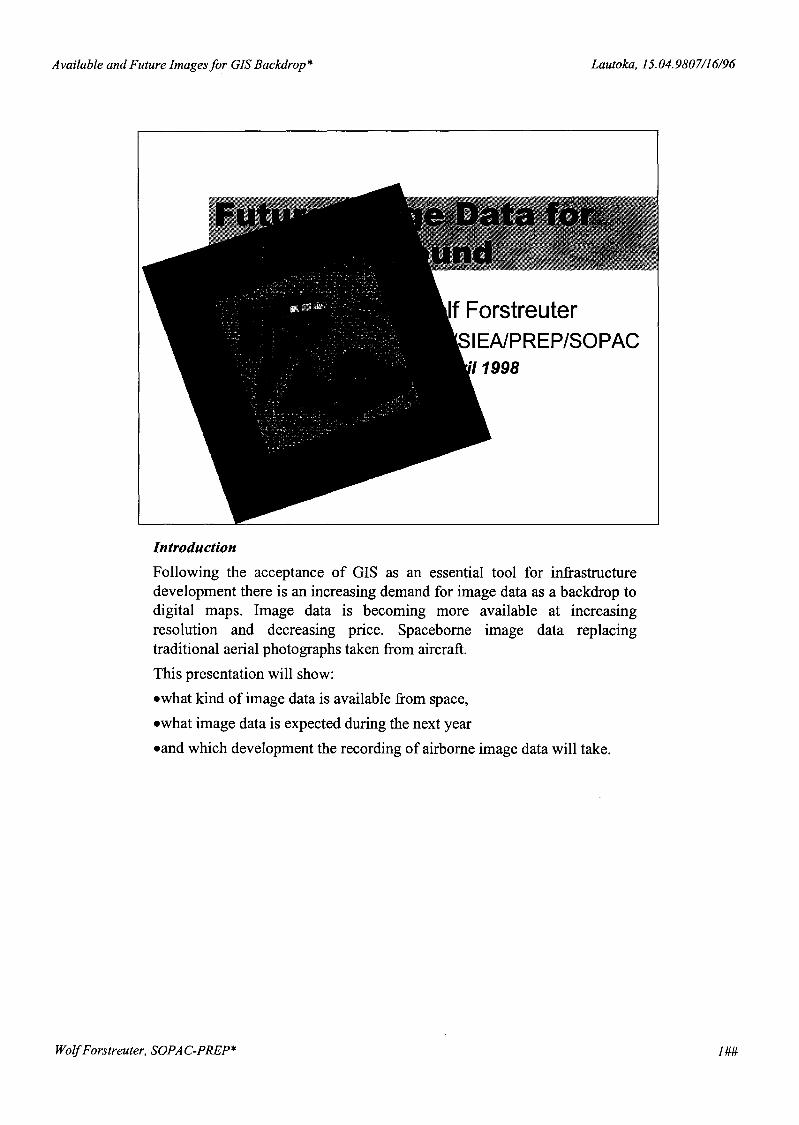
Introduction
Following the acceptance of GIS as an essential tool for infrastructuredevelopment there is an increasing demand for image data as a backdrop todigital maps. Image data is becoming more available at increasingresolution and decreasing price. Spaceborne image data replacingtraditional aerial photographs taken from aircraft.
This presentation will show:
ewhat kind of image data is available from space,
ewhat image data is expected during the next year
eand which development the recording of airborne image data will take.
WolfForstreuter, SOPAC-PREP* 1##

Available and Future Images/or GIS Backdrop * Lautoka,15.04.9807/16/96
Data Sources
Available images sensors and platforms- space scanner
Landsat, SPOT, IRS, MOMS, Quick Bird- space cameras
KFA-1000, TK-350, KVR-1000,- airborne scanners- airborne cameras
metric, small format, video- other data e.g. radar etc ..
Data Sources
For many operators every image is a "Photo". They do not differentiatebetween different sensors recording the image and platforms where thesensors are mounted. If an operator needs to import image data into GIS,these facts suddenly become important. The sensor/platform combinationcreates different image projection, different data type and different imagecontent.This presentation will briefly describes the difference between scanner dataand photographic images as well as the difference between space platformsand aircraft.
WolfForstreuter, SOPAC-PREP* 2##

Available and Future Images/or GIS Backdrop * Lautoka,15.04.9807/16/96
Space Vehicles:
There are different types of space platforms:
Permanent space stations such as MIR, which operate for many years andover-fly at relatively low altitude (little more than 200km). The time fortaking images is nearly unlimited.
Spacecraft such as the space shuttle, which can have on-board sensors suchas the metric or the large format camera can stay only very limited time inspace. The orbit is similar to the permanent stations between 200 and 300km.
Earth observation satellites surround the earth on a relatively high orbit(600 and above). They mostly operate for 3 to 5 years and provide a nearlyunlimited number of images. They carry digital sensors, as they have totransmit the images to earth.
There are also low flying satellites equipped with photographic cameras.They send film and camera back by parachute and disappear in space aftertheir mission.
All space vehicles have in common:
a) high altitude compared with planes,
b) can provide repeating image coverage,
c) no permit for image recording required.
WolfForstreuter, SOPAC-PREP* 3##
Available and Future Images/or GIS Backdrop * Lautoka,15.04.9807/16/96
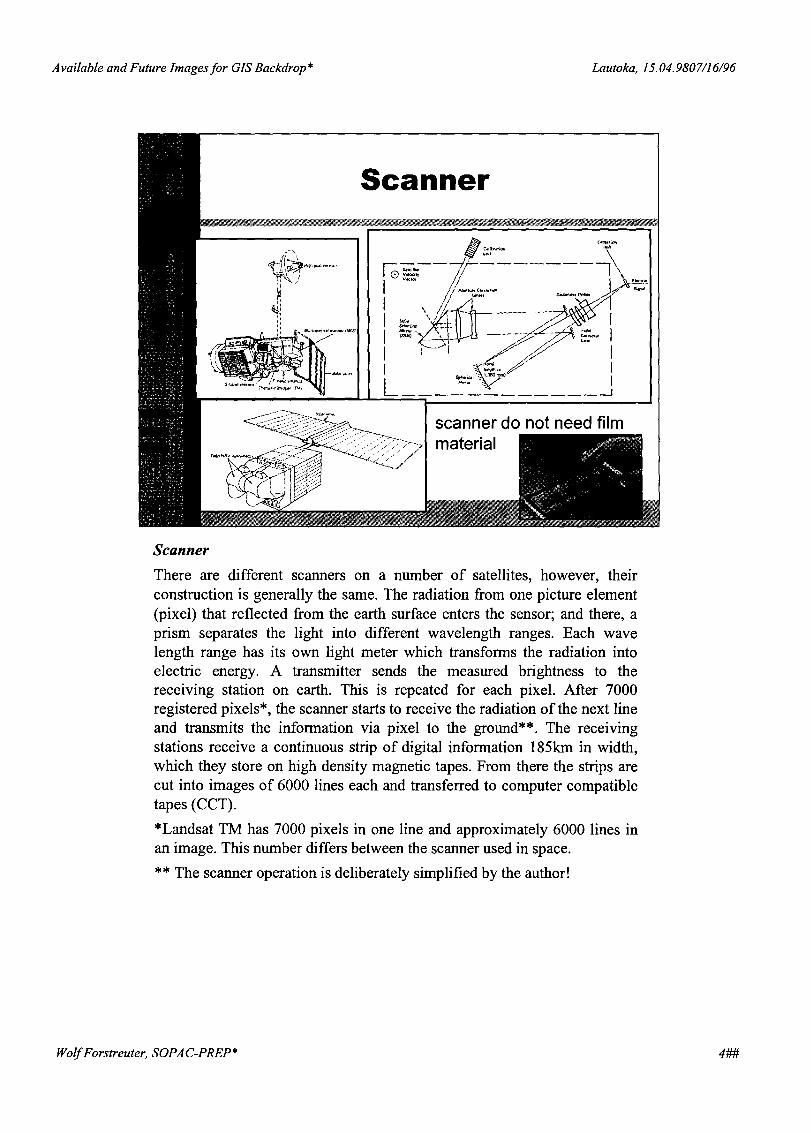
Scanner
There are different scanners on a number of satellites, however, theirconstruction is generally the same. The radiation from one picture element(pixel) that reflected from the earth surface enters the sensor; and there, aprism separates the light into different wavelength ranges. Each wavelength range has its own light meter which transforms the radiation intoelectric energy. A transmitter sends the measured brightness to thereceiving station on earth. This is repeated for each pixel. After 7000registered pixels*, the scanner starts to receive the radiation of the next lineand transmits the information via pixel to the ground**. The receivingstations receive a continuous strip of digital information 185km in width,which they store on high density magnetic tapes. From there the strips arecut into images of 6000 lines each and transferred to computer compatibletapes (CCT).
*Landsat TM has 7000 pixels in one line and approximately 6000 lines inan image. This number differs between the scanner used in space.
** The scanner operation is deliberately simplified by the author!
Wolf Forstreuter, SOPAC-PREP* 4##
Available and Future Images/or GIS Backdrop * Lautoka, 15.04.9807/16/96
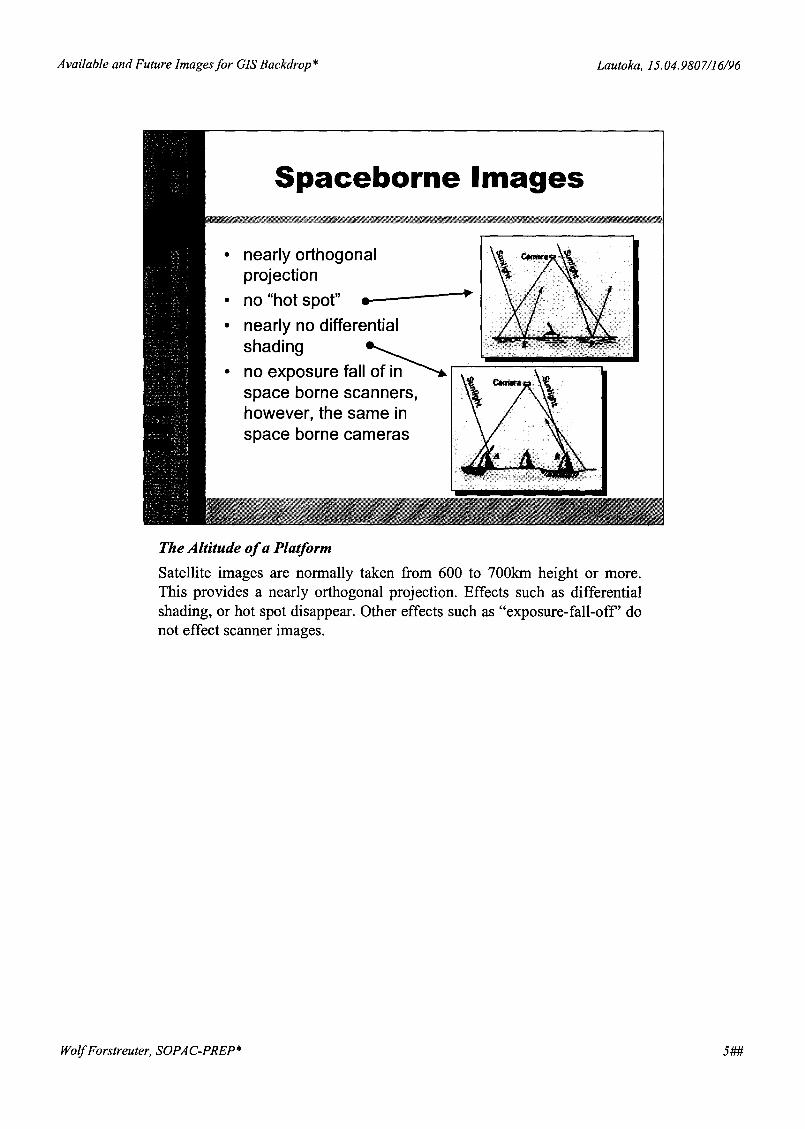
The Altitude of a Platform
Satellite images are normally taken from 600 to 700km height or more.This provides a nearly orthogonal projection. Effects such as differentialshading, or hot spot disappear. Other effects such as "exposure-fall-off' donot effect scanner images.
WolfForstreuter, SOPAC-PREP* 5##
Available and Future Images/or GIS Backdrop * Lautoka, 15.04.9807/16/96
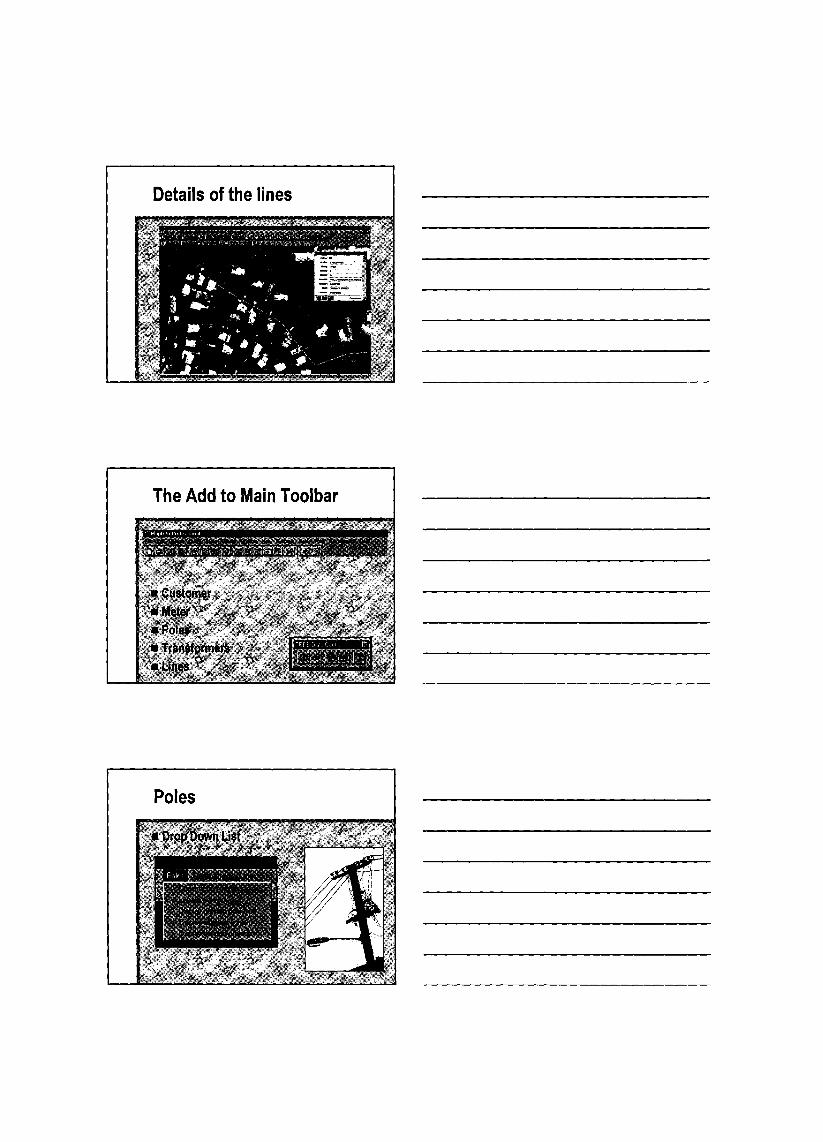
Resolution and Scale
Mapping of areas and objects:
• Landsat MSS (70m) 1:100,000• Landsat TM / SPOT XS (25m) 1: 50,000• SPOT panchromatic (10m) 1: 25,000• IRS-1 C panchromatic (8m) 1: 10,000• MOMS panchromatic (5m) 1: 10,000• Quick Bird panchromatic (1m) 1: 5,000
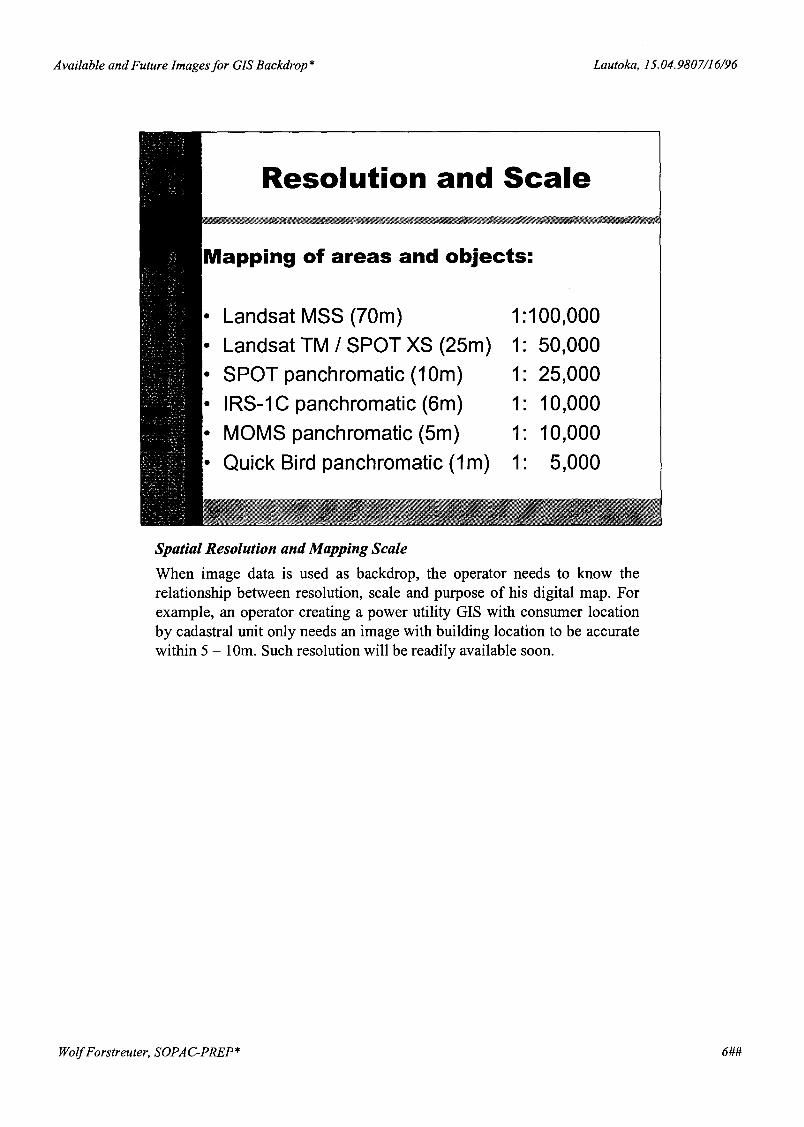
Spatial Resolution and Mapping Scale
When image data is used as backdrop, the operator needs to know therelationship between resolution, scale and purpose of his digital map. Forexample, an operator creating a power utility GIS with consumer locationby cadastral unit only needs an image with building location to be accuratewithin 5 - 10m. Such resolution will be readily available soon.
WolfForstreuter, SOPAC-PREP* 6##

Available and Future Images/or GIS Backdrop * Lautoka,15.04.9807/16/96
Landsat Satellites
• Landsat I to Landsat III (first civil data)• Landsat IV (download via relay satellite)• Landsat V (still operating)• Landsat VI (did not reach orbit)• Landsat VII (launch planned for 1989)• IKONOS 1 (launch planned for 1999)
LandsatThe satellites of the Landsat family (Land Use Satellite) started the area ofspacebome digital remote sensing in 1997. The first three satellites of thisseries were equipped with video cameras and had a sensor onboard calledMulti Spectral Scanner (MSS). The MSS data was the most widely usedspace images for a long time. The spatial resolution with about 70mallowed mapping up to 1:100.000 scale. Landsat 4 was equipped with asensor called Thematic Mapper (TM) which delivered data of 30m spatialresolution (mapping 1:50,000) and a spectral resolution up to the thermalinfrared band. Landsat 4 was able to download data via relay satellite to theground antenna in the USA. Landsat 4 data was used for mapping Fiji'stropical rain forest. Landsat 5, which has the same sensors as Landsat 4onboard, does not have the link to the relay satellite. It was impossible topurchase data from the South Pacific. Landsat 6 did not reach its orbit afterthe launch, and landed somewhere in the ocean.
Wolf Forstreuter, SOPAC-PREP* 7##

Available and Future Images/or GIS Backdrop * Lautoka,15.04.9807/16/96
Landsat VII
• multispectral bands:- blue (0.450 - 0.515 IJm), 30m- green (0.525 - 0.605IJm), 30m- red (0.630 - 0.690lJm), 30m- near-infrared (0.750 - 0.900lJm), 30m- short-wave infrared (1.55 - 1.75IJm), 30m- middle infrared (3.09 - 2.35IJm), 30m- thermal infrared (10.40 - 12.50 IJm), 60m
• panchromatic band:- panchromatic (0.520 - 0.900),15m
Landsat VII
NASA had planned the launch of Landsat 7 for July, however, two of thefour power modules thematic mapping instrument failed in recent testing.The launch probably will be delayed until December 1998. Like the earlierTM sensors, the Landsat7 Enhanced Thematic Mapper Plus (ETM+) willprovide data in six visible, near infrared (NIR) and short wave infrared(SWIR) bands. In addition, ETM+ will provide improved resolution for thethermal infrared (TIR) band (60 m vs. 120 m), a panchromatic band with15m resolution.
Wolf Forstreuter, SOPAC-PREP* 8##
Available and Future Images/or GIS Backdrop * Lautoka,15.04.9807/16/96
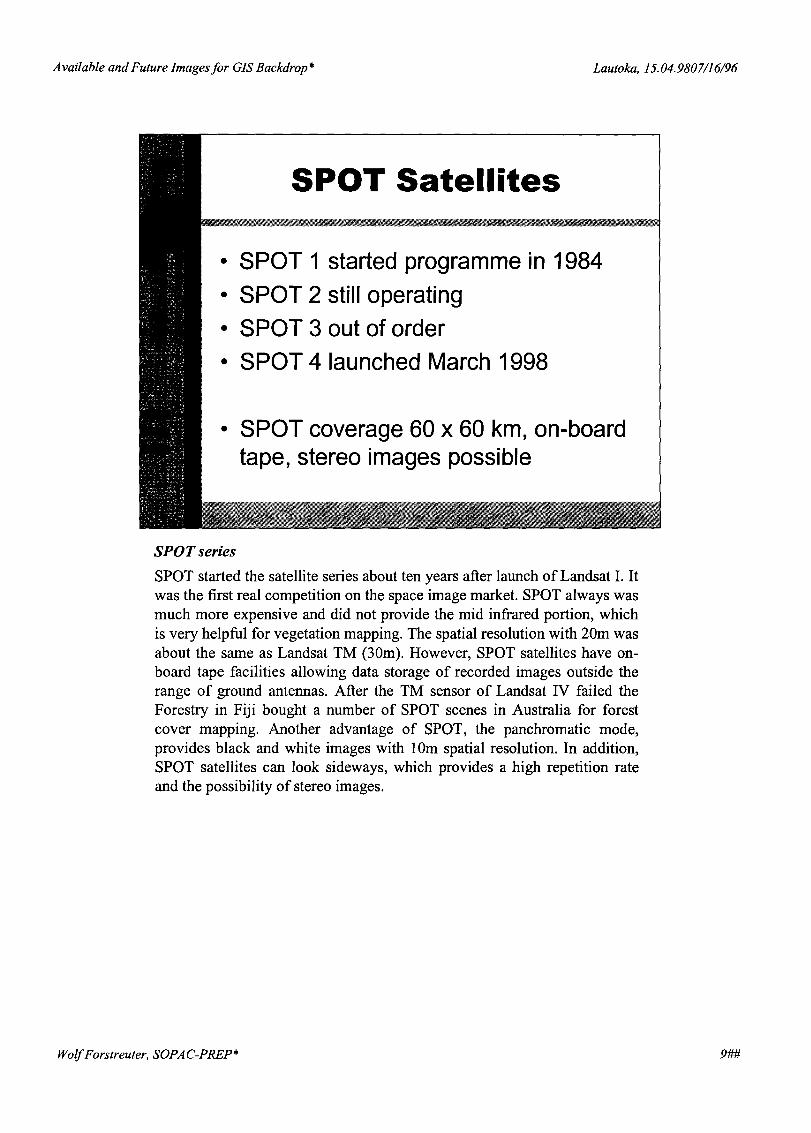
SPOT Satellites
• SPOT 1 started programme in 1984• SPOT 2 still operating• SPOT 3 out of order• SPOT 4 launched March 1998
• SPOT coverage 60 x 60 km, on-boardtape, stereo images possible
SPOT seriesSPOT started the satellite series about ten years after launch of Landsat I. Itwas the first real competition on the space image market. SPOT always wasmuch more expensive and did not provide the mid infrared portion, whichis very helpful for vegetation mapping. The spatial resolution with 20m wasabout the same as Landsat TM (30m). However, SPOT satellites have on-board tape facilities allowing data storage of recorded images outside therange of ground antennas. After the TM sensor of Landsat IV failed theForestry in Fiji bought a number of SPOT scenes in Australia for forestcover mapping. Another advantage of SPOT, the panchromatic mode,provides black and white images with 10m spatial resolution. In addition,SPOT satellites can look sideways, which provides a high repetition rateand the possibility of stereo images.
WolfForstreuter, SOPAC-PREP* 9##

Available and Future Images/or GIS Backdrop * Lautoka,15.04.9807/16/96
SPOT 4
• multispectral bands:- green (0.50 to 0.59 IJm), 20m- red (0,61 to 0,68 IJm), 20m- near-infrared (0,78 to 0,89 IJm), 20m- short-wave infrared (1,58 to 1,75 IJm), 20m
• panchromatic band: 10m
• on-board tape• stereo images
SPOT 4SPOT 4 was successfully launched on Tuesday, 24 March 1998 and hasalready recorded the first images. This is an additional SPOT satellite inspace, which can deliver data from the South Pacific. The Short-waveinfrared band is the major development for SPOT 4. There is also a new"vegetation" instrument which operates in the same four spectral bands asthe high resolution visible infrared bands (HRVIR), but at a reduced, lkmspatial resolution.
Wolf Forstreuter, SOP AC-PREP* 10##

Available and Future Imagesfor GIS Backdrop * Lautoka,15.04.9807/16/96
IRS·1C Images
- digital images recorded fromIndian Satellitedistributed by Space Imagine EOSAT
- multispectral sensorspatial resolution 23.5m, usable for mapping at1:50,000 scale
- panchromatic sensorspatial resolution 5.8m, usable for mapping at1:15,000 scale, normal pan scene 70 x 70 km $US2,500
IRS-IeIRS, the Indian Remote Sensing Satellite program operates, as the namesuggests, from India. Space Imaging EOSAT handles the data distributionoutside of the sub-continent. The satellite has two interesting sensors onboard, LISS-3 and WiFS (Wide Field Sensor). The onboard tape facilitiesallow recording scenes from the South Pacific. LISS-3 covers the green, redand the near infrared portion with a spatial resolution of 23.5m, resampledto 20m. An additional infrared band is available with a spatial resolution of70m. Panchromatic data is recorded with a spatial resolution of 5.8m,resampled to 5m. WiFS data has a spatial resolution of 189 m and onlyrecords the red and the near infrared band, but the swath width covers 774KIn.
SOPAC is purchasing the first scene* for a Pacific Island Country.
* satellite scene = satellite image
Wolf Forstreuter, SOPAC-PREP* 11##
Available and Future Imagesfor GIS Backdrop * Lautoka,15.04.9807/16/96
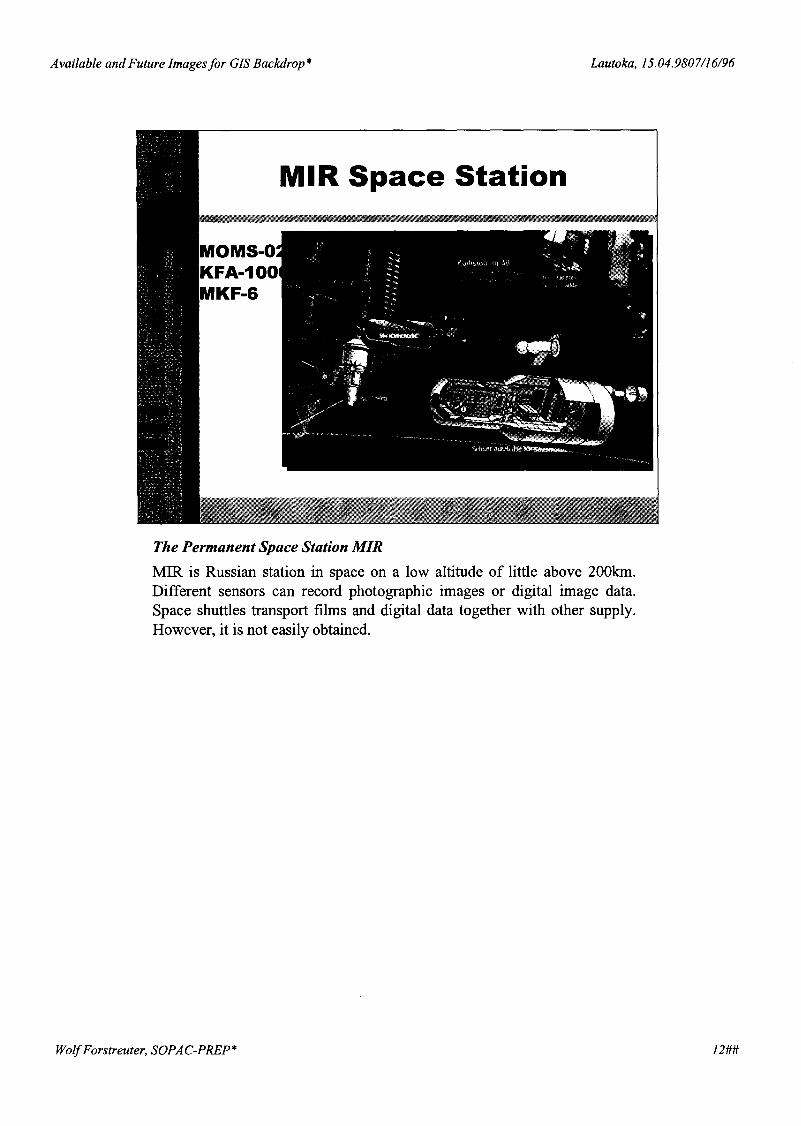
The Permanent Space Station MIRMIR is Russian station in space on a low altitude of little above 200km.Different sensors can record photographic images or digital image data.Space shuttles transport films and digital data together with other supply.However, it is not easily obtained.
Wolf Forstreuter, SOPAC-PREP* 12##

Available and Future Images/or GIS Backdrop b)* Lautoka, 15.04.9807/16/96
MOMS 02 Images
- sensor on space station MIRimages will be distributed by EURIMAGE
- multispectral sensorspatial resolution 13.5m
- panchromatic sensorspatial resolution 4.5m, stereo images online, thematic mapping and DTMgeneration at 1:10,000 should be possible,images not on the market yet
MOMS-02
The MOMS-02 sensor was installed on the Russian space station MIR. Thissensor can provide panchromatic images with 4.5m spatial resolution.There have been problems to correct the data geometrically and the imagesdid not enter the market. If the current problems can be solved, data fromSouth Pacific Island Countries could be ordered.
WolfForstreuter, SOPAC-PREP* 1##

Available and Future Images for GIS Backdrop b) * Lautoka, 15.04.9807/16/96
EarlyBird
EarthWatch Incorporated developed the satellite EarlyBird. This companywas formed in March 1995, by the merger of the commercial remotesensing efforts of Ball Aerospace & Technologies Corp., and WorldViewImaging Corp. EarthWatch's partners include Hitachi Ltd., Datron SystemsInc., Nuova Telespazio s.p.a., and MacDonald, Dettwiler and AssociatesLtd.
EarlyBird was launched on Christmas Day 1997 in SvobodnyCosmodrome, Eastern Russia. Fifteen minutes after launch, an EarthWatchground station in Tromse, Norway received a downlink signal confirmingthat the satellite successfully separated from the launch vehicle and hadautomatically initialized the onboard processors. A happy Christmas! .....EarlyBird was the highest-resolution remote sensing satellite ever madeavailable to the commercial market.
The sad story ..... Four days later the EarthWatch engineers lost thecommunication contact with EarlyBird.
Wolf Forstreuter, SOPAC-PREP* 2##
Available and Future Images/or GIS Backdrop b)* Lautoka,15.04.9807/16/96
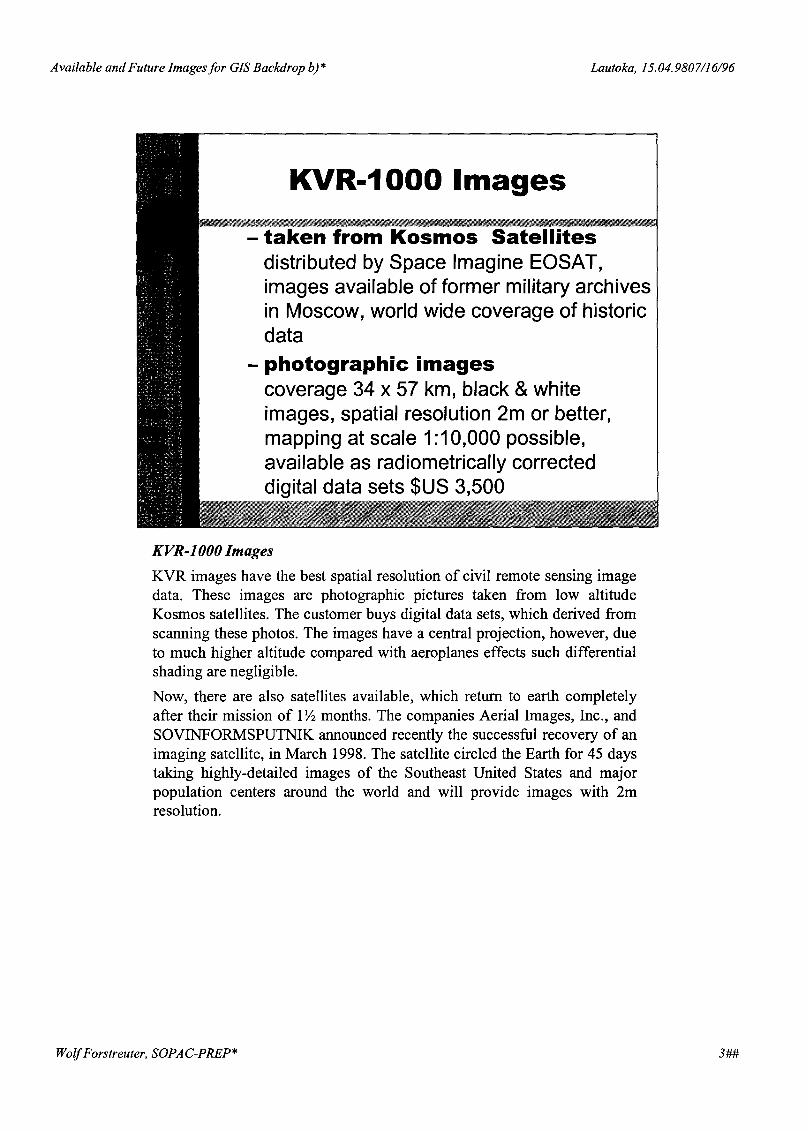
KVR-IOOO ImagesKVR images have the best spatial resolution of civil remote sensing imagedata. These images are photographic pictures taken from low altitudeKosmos satellites. The customer buys digital data sets, which derived fromscanning these photos. The images have a central projection, however, dueto much higher altitude compared with aeroplanes effects such differentialshading are negligible.
Now, there are also satellites available, which return to earth completelyafter their mission of 1~ months. The companies Aerial Images, Inc., andSOVINFORMSPUTNIK announced recently the successful recovery of animaging satellite, in March 1998. The satellite circled the Earth for 45 daystaking highly-detailed images of the Southeast United States and majorpopulation centers around the world and will provide images with 2mresolution.
WolfForstreuter, SOPAC-PREP* 3##
Available and Future Images for GIS Backdrop b) * Lautoka, 15.04.9807/16/96
QuickBird
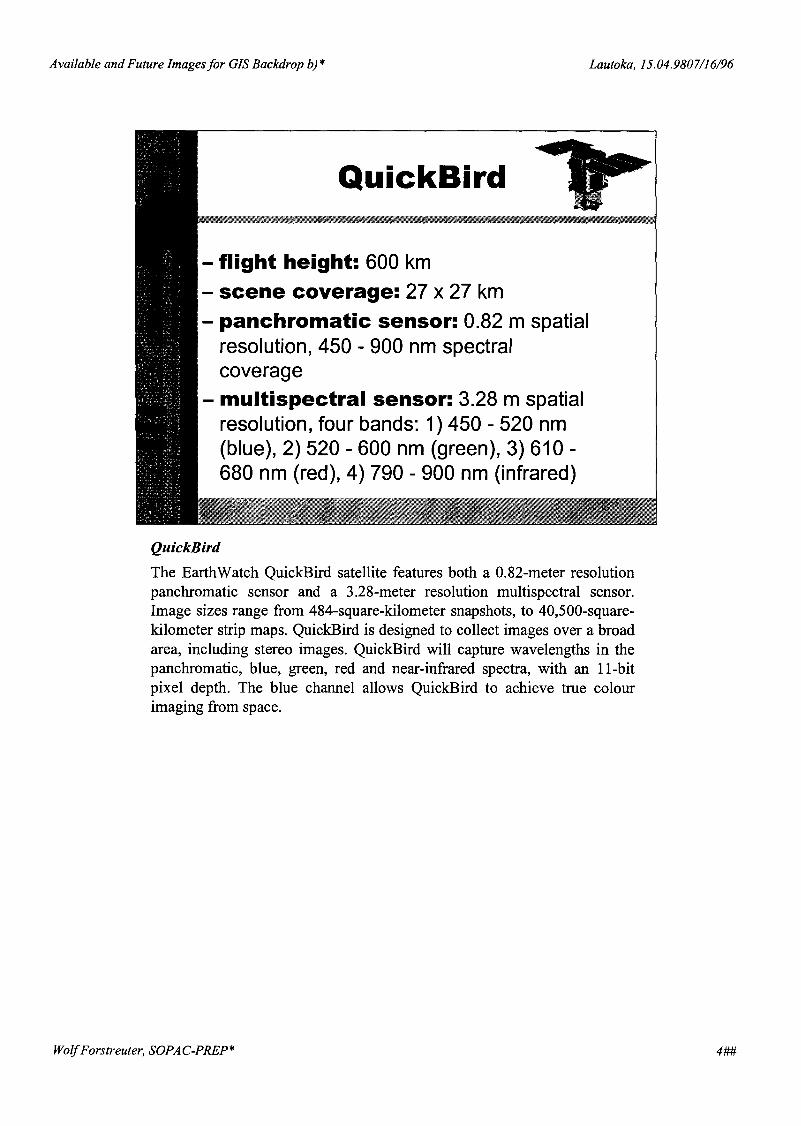
The EarthWatch QuickBird satellite features both a O.82-meterresolutionpanchromatic sensor and a 3.28-meter resolution multispectral sensor.Image sizes range from 484-square-kilometer snapshots, to 40,500-square-kilometer strip maps. QuickBird is designed to collect images over a broadarea, including stereo images. QuickBird will capture wavelengths in thepanchromatic, blue, green, red and near-infrared spectra, with an l l-bitpixel depth. The blue channel allows QuickBird to achieve true colourimaging from space.
Wolf Forstreuter, SOPAC-PREP* 4##
Available and Future Images/or GIS Backdrop b)* Lautoka, 15.04.9807/16/96
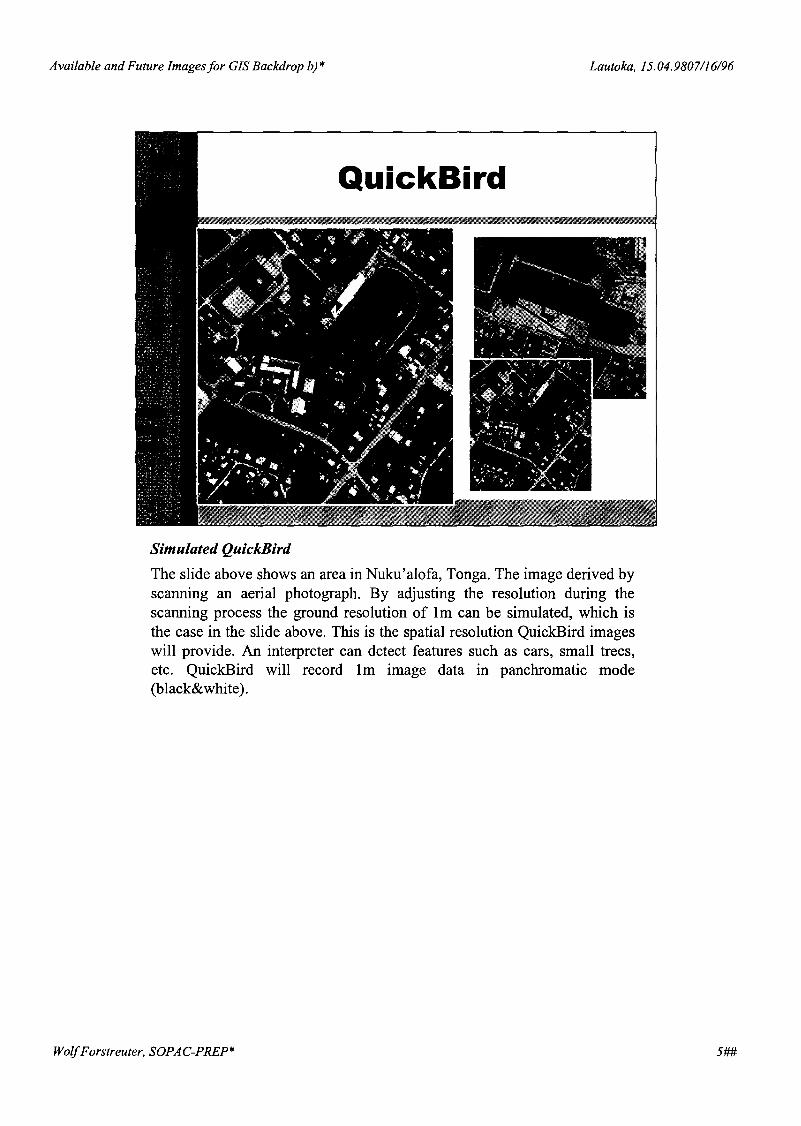
Simulated QuickBird
The slide above shows an area in Nuku'alofa, Tonga. The image derived byscanning an aerial photograph. By adjusting the resolution during thescanning process the ground resolution of 1m can be simulated, which isthe case in the slide above. This is the spatial resolution QuickBird imageswill provide. An interpreter can detect features such as cars, small trees,etc. QuickBird will record 1m image data in panchromatic mode(black&white).
WolfForstreuter, SOPAC-PREP* 5##
Available and Future Imagesfor GIS Backdrop b)* Lautoka,15.04.9807/16/96
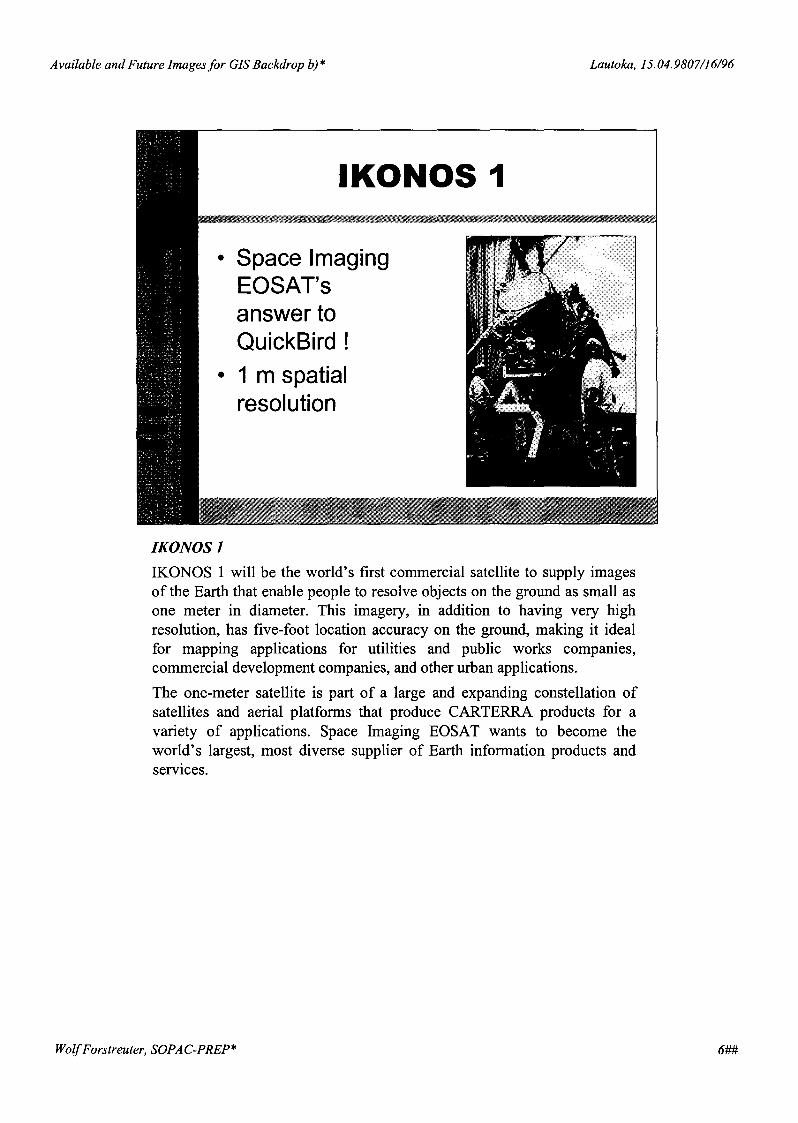
IKONOSIIKONOS 1 will be the world's first commercial satellite to supply imagesof the Earth that enable people to resolve objects on the ground as small asone meter in diameter. This imagery, in addition to having very highresolution, has five-foot location accuracy on the ground, making it idealfor mapping applications for utilities and public works companies,commercial development companies, and other urban applications.
The one-meter satellite is part of a large and expanding constellation ofsatellites and aerial platforms that produce CARTERRA products for avariety of applications. Space Imaging EOSAT wants to become theworld's largest, most diverse supplier of Earth information products andservices,
WolfForstreuter, SOPAC-PREP* 6##
Available and Future Images/or GIS Backdrop b)* Lautoka,15.04.9807/16/96
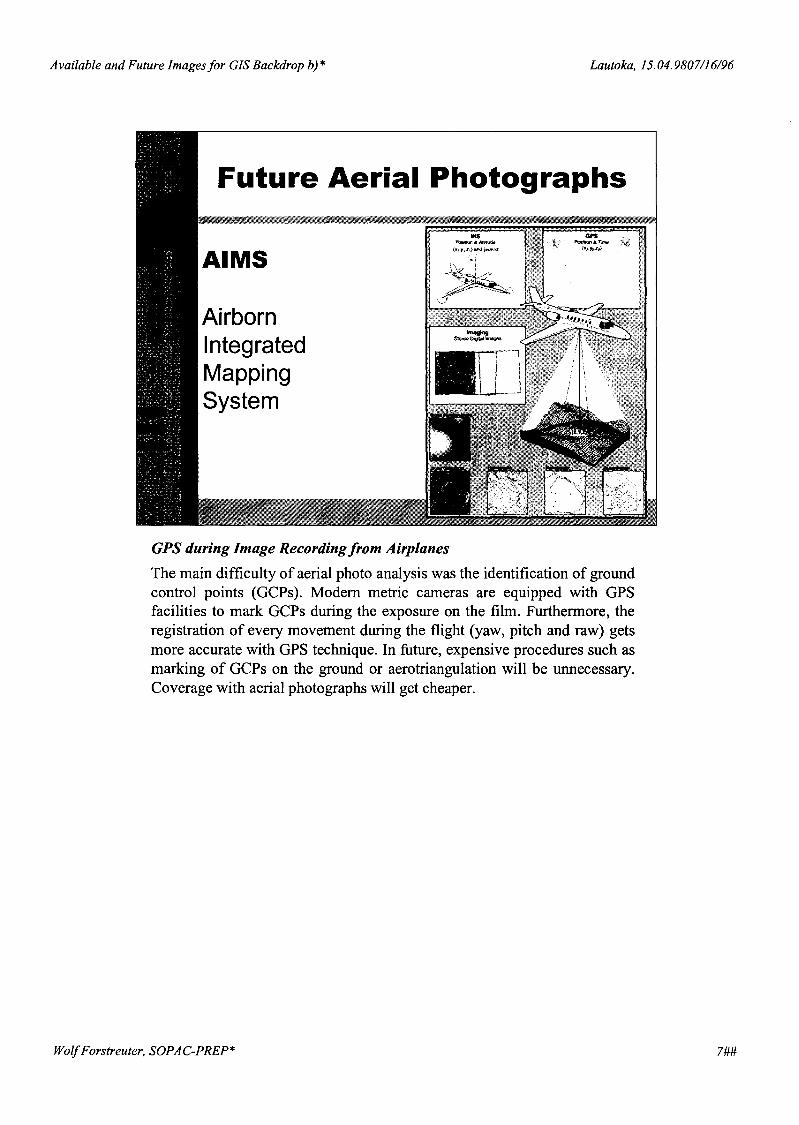
GPS during Image Recording from Airplanes
The main difficulty of aerial photo analysis was the identification of groundcontrol points (GCPs). Modem metric cameras are equipped with GPSfacilities to mark GCPs during the exposure on the film. Furthermore, theregistration of every movement during the flight (yaw, pitch and raw) getsmore accurate with GPS technique. In future, expensive procedures such asmarking of GCPs on the ground or aerotriangulation will be unnecessary.Coverage with aerial photographs will get cheaper.
WolfForstreuter, SOPAC-PREP* 7##
Available and Future Images/or GIS Backdrop b)* Lautoka,15.04.9807/16/96
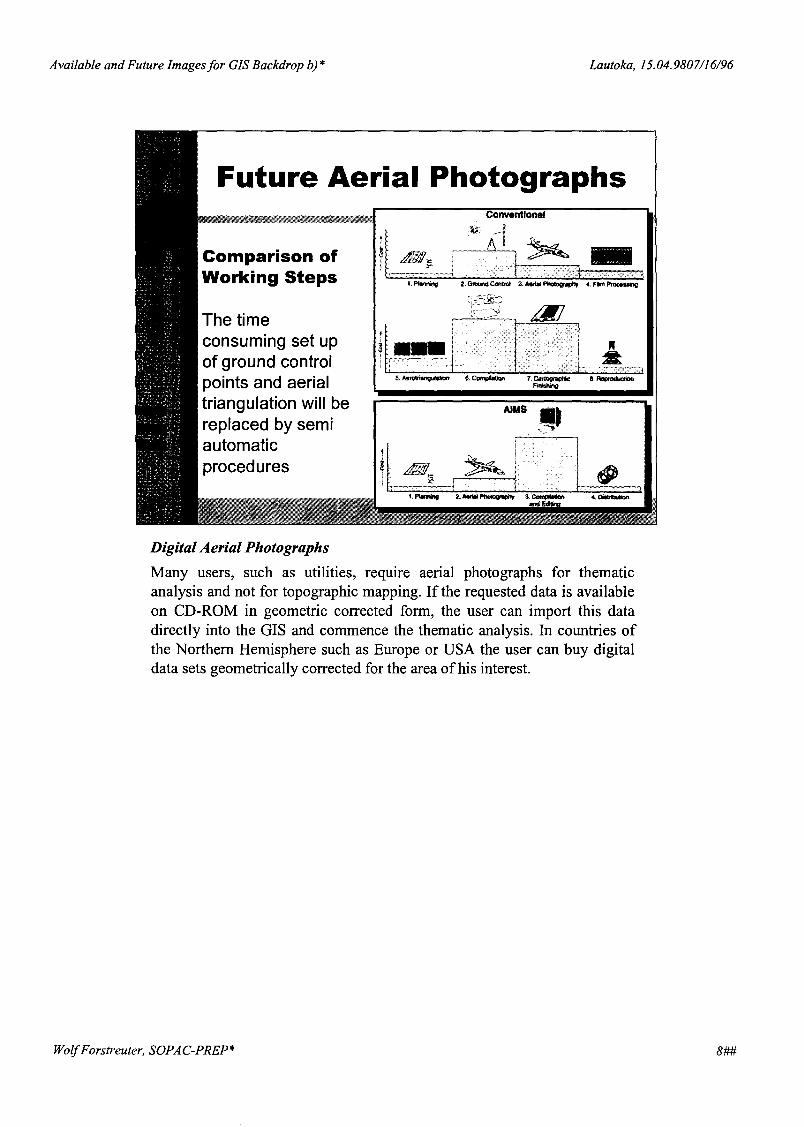
Digital Aerial Photographs
Many users, such as utilities, require aerial photographs for thematicanalysis and not for topographic mapping. If the requested data is availableon CD-ROM in geometric corrected form, the user can import this datadirectly into the GIS and commence the thematic analysis. In countries ofthe Northern Hemisphere such as Europe or USA the user can buy digitaldata sets geometrically corrected for the area of his interest.
WolfForstreuter, SOPAC-PREP* 8##
Available and Future Images/or GIS Backdrop b)* Lautoka,15.04.9807/16/96
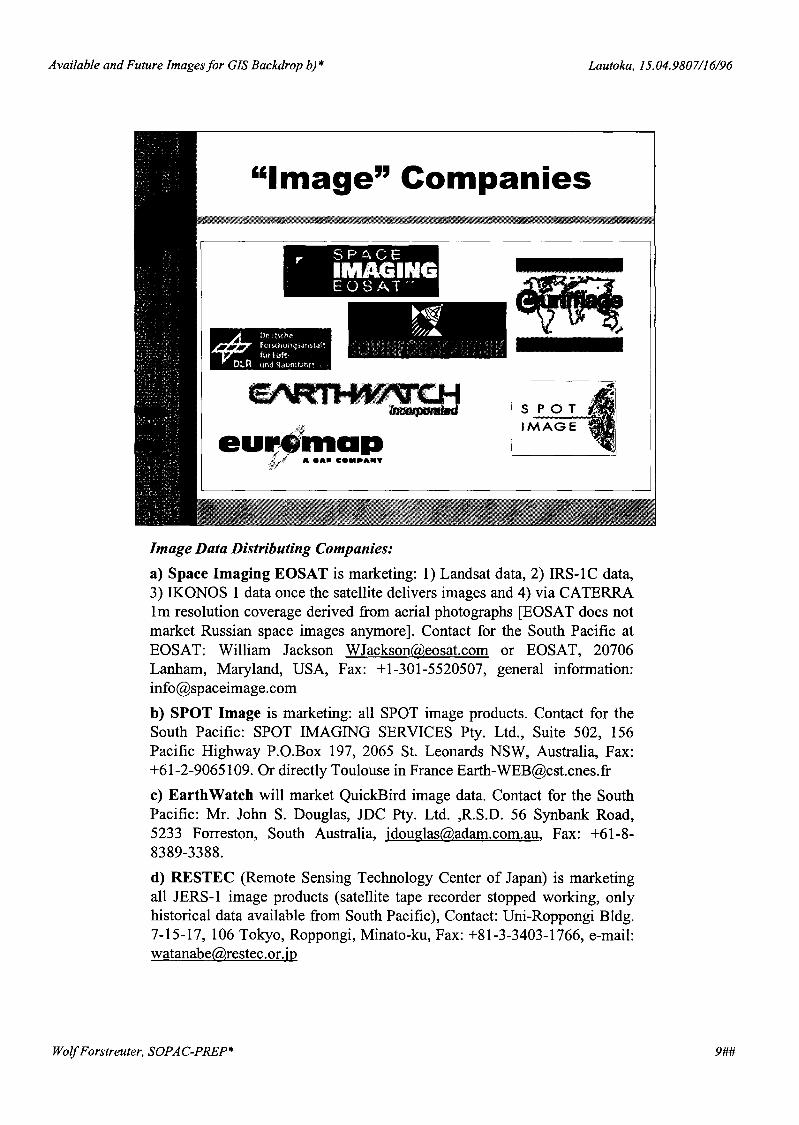
Image Data Distributing Companies:
a) Space Imaging EOSAT is marketing: 1) Landsat data, 2) IRS-lC data,3) IKONOS 1 data once the satellite delivers images and 4) via CATERRA1m resolution coverage derived from aerial photographs [EOSAT does notmarket Russian space images anymore]. Contact for the South Pacific atEOSAT: William Jackson [email protected] or EOSAT, 20706Lanham, Maryland, USA, Fax: +1-301-5520507, general information:[email protected]
b) SPOT Image is marketing: all SPOT image products. Contact for theSouth Pacific: SPOT IMAGING SERVICES Pty. Ltd., Suite 502, 156Pacific Highway P.O.Box 197, 2065 S1. Leonards NSW, Australia, Fax:+61-2-9065109. Or directly Toulouse in France [email protected]
c) EarthWatch will market QuickBird image data. Contact for the SouthPacific: Mr. John S. Douglas, IDC Pty. Ltd. ,RS.D. 56 Synbank Road,5233 Forreston, South Australia, [email protected], Fax: +61-8-8389-3388.
d) RESTEC (Remote Sensing Technology Center of Japan) is marketingall JERS-l image products (satellite tape recorder stopped working, onlyhistorical data available from South Pacific), Contact: Uni-Roppongi Bldg.7-15-17, 106 Tokyo, Roppongi, Minato-ku, Fax: +81-3-3403-1766, e-mail:[email protected]
WolfForstreuter, SOPAC-PREP* 9##

Available and Future Imagesfor GIS Backdrop b)* Lautoka,15.04.9807/16/96
ConclusioneFor many areas, there are no paper or digital maps 1:10,000 available forSouth Pacific Island Countries
eImage data will get cheaper, because of developing technology.
eGPS technology makes own image rectification possible.
eThis will allow to use image backdrop to replace thematic maps.
Where there are no or limited maps available it will be more cost efficientto use images from the new generation of satellites to provide 1 - 5moperational maps. That will be sufficient for utility mapping and willreduce the requirements for traditional survey procedures.
WolfForstreuter, SOPAC-PREP* 10##
Available and Future Images/or GIS Backdrop b)* Lautoka,15.04.9807/16/96
Further Information:00_ c· il·1 ilililliJil'&_':-'1_1E_~~ilililliJil'~~~_
- GIS & Remote Sensing Newsletter
- e-mail contact:
Wolf [email protected]@compuserve.com
Further Information
-There will always be a chapter in the GIS & Remote Sensing Newsletterinforming about the latest development of remote sensing data for SouthPacific Island Countries.
-SOPAC is always addressable and the author will always be available viae-mail.
Wolf Forstreuter, SOPAC-PREP* 11##

Basics ofGPS Lautoka,16.04.98
Potential of GPS for GIS
Pacific Regional Energy ProgrammePower Utility Workshop
FEA, SIEA, PREP, SOPAC
Wolf Forstreuter
Potential of GPS for GIS
This presentation will introduce the potential of GPS application for GIS datamanagement. It will not go into details such as sources of error or differential
correction.
Wolf Forstreuter 1
Basics of GPS Lautoka, 16.04.98
a GPS is .• a Global Positioning System
• .... it allows you to determine yourposition using positioning satellites. Itcan he used to update maps which arestored in a GIS.
TheGPS Tool
Today, GPS technology is employed by:
• ships to navigate during low visibility,
• cars to find the right address,
• farmers to put the exact amount of fertiliser or pesticide on to the rightsquare meter of his field,
• utilities to manage their assets.
All application utilises the potential of the system to determine theexact position in a fast and precise way.
Wolf Forstreuter 2
Basics of GPS Lautoka, 16.04.98
What is a GPS ?
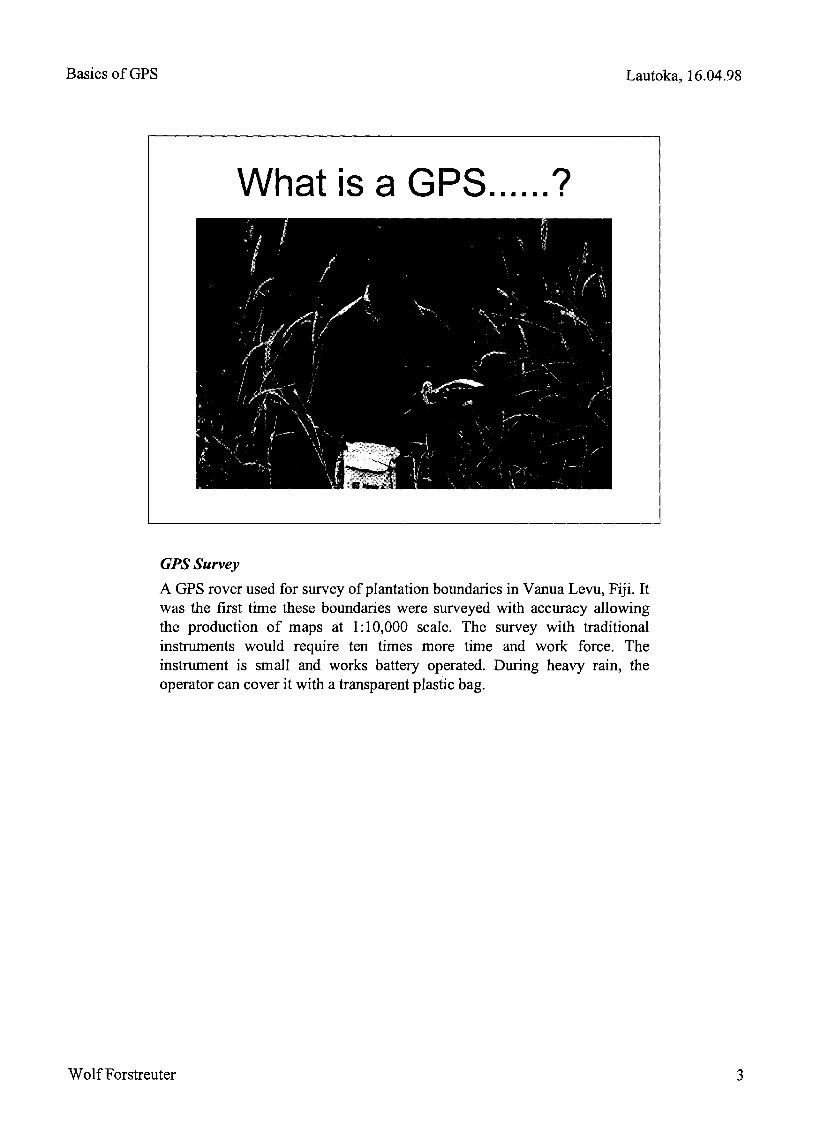
GPSSurvey
A GPS rover used for survey of plantation boundaries in Vanua Levu, Fiji. Itwas the first time these boundaries were surveyed with accuracy allowingthe production of maps at 1:10,000 scale. The survey with traditionalinstruments would require ten times more time and work force. Theinstrument is small and works battery operated. During heavy rain, theoperator can cover it with a transparent plastic bag.
Wolf Forstreuter 3
Basics of GPS Lautoka, 16.04.98
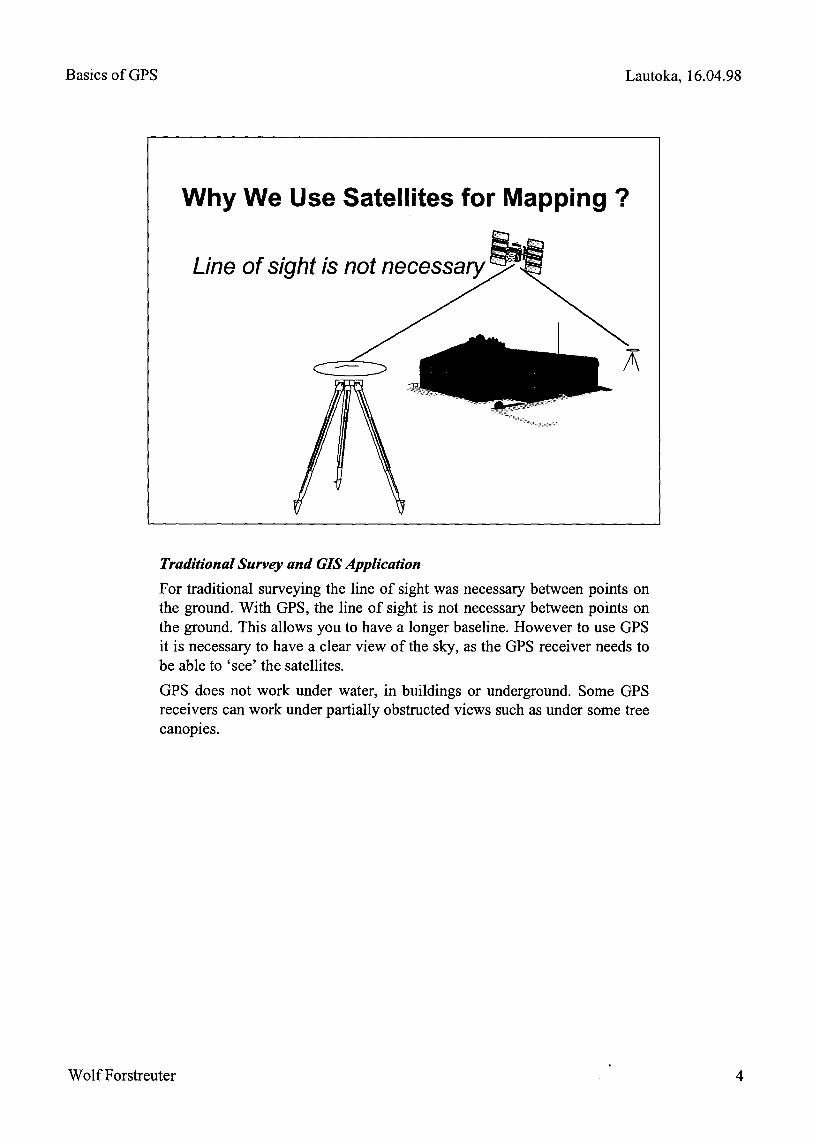
Traditional Survey and GIS Application
For traditional surveying the line of sight was necessary between points onthe ground. With GPS, the line of sight is not necessary between points onthe ground. This allows you to have a longer baseline. However to use GPSit is necessary to have a clear view of the sky, as the GPS receiver needs tobe able to 'see' the satellites.GPS does not work under water, in buildings or underground. Some GPSreceivers can work under partially obstructed views such as under some treecanopies.
Wolf Forstreuter 4

Basics of GPS Lautoka, 16.04.98
Navigation• Relocation of existing features in the
field- Take coordinates from GIS and create a
waypoint file
• Finding an existing asset for:- Maintenance and repair- GIS update and mformatiqn verijication
GPS Navigation
Navigation is one of many GPS applications. The operator types at home thepositions of different locations into the instrument and the rover guides himafterwards. The rover then displays the direction and distance to the itemsthe operator wants to visit in the field.
Wolf Forstreuter 5

Basics ofGPS Lautoka, 16.04.98
Data Capture of Line Features:
The slide shows mapping of forest roads in Fiji. In 1995 when the imagewas taken, the car provided the electricity from the electric lighter andthrough the open roof the instrument received the satellite signals. Fiji'sForestry Department was able to map the roads of all their plantations withina minimum of time. Today, the instrument could be equipped with a carantenna (lower right) which would make mapping even more easy.
Wolf Forstreuter 6

Basics of GPS Lautoka, 16.04.98
Concept of Trilateration
By measuring the distance from several satellites, you can figure out yourposition through mathematics. The system requires four satellites to get a 3Dposition fix. 24 satellites are moving in space on non geostationary orbits.
Wolf Forstreuter 7
Basics ofGPS Lautoka, 16.04.98
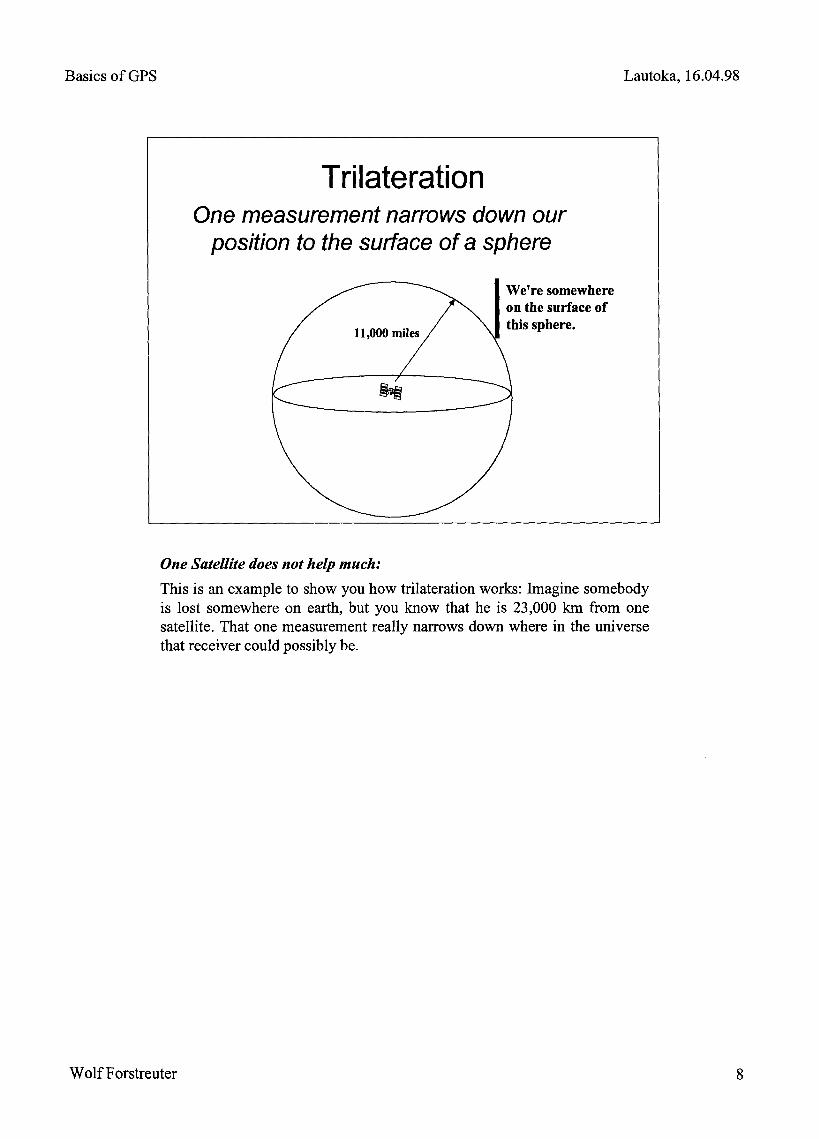
One Satellite does not help much:
This is an example to show you how trilateration works: Imagine somebodyis lost somewhere on earth, but you know that he is 23,000 km from onesatellite. That one measurement really narrows down where in the universethat receiver could possibly be.
Wolf Forstreuter 8

Basics of GPS Lautoka, 16.04.98
The Second Satellite Narrows down the Area:
With a second measurement the receiver is 23,000 km away from onesatellite and at the same time we are 26,000 km from a second satellite. Thedistance from the second satellite helps to narrow the possible location. Thereceiver must be somewhere within the intersection ofthe two spheres.
Wolf Forstreuter 9

Basics of GPS Lautoka, 16.04.98
The Third Measurement Narrows to just two Points:
A third measurement adds a third sphere, which will intersect the circleformed by the other two. The intersection occurs at two points and so withthree measurements the receiver has narrowed down its position to just twopoints in the entire universe.
Wolf Forstreuter 10
Basics ofGPS Lautoka, 16.04.98
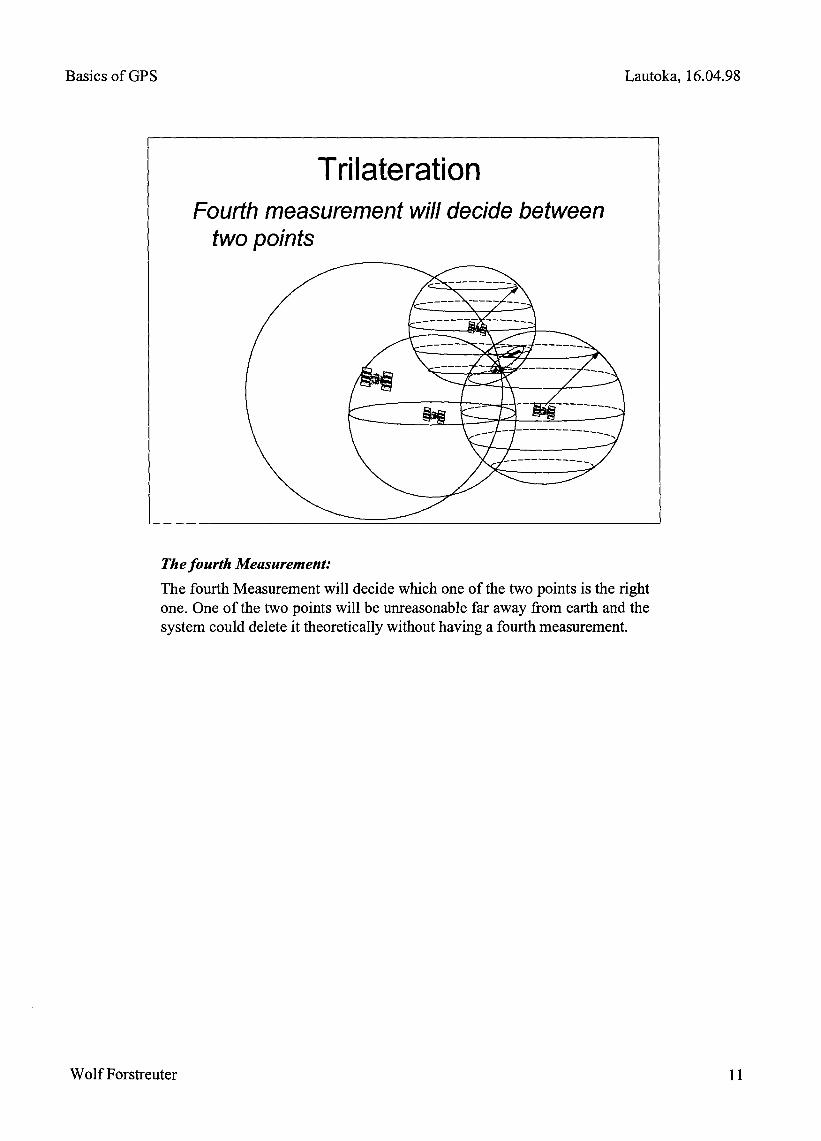
The fourth Measurement:
The fourth Measurement will decide which one of the two points is the rightone. One of the two points will be unreasonable far away from earth and thesystem could delete it theoretically without having a fourth measurement.
Wolf Forstreuter 11

Basics of GPS
Wolf Forstreuter
Trilateration
In practice 3 measurements are enoughbecause
• We can discard one point because it willbe a ridiculous answer- Out in space- Or moving at high speed
• But we do need the 4th measurement tocancel out clock errors
The real Reason/or the Fourth Measurement:In theory, three measurements are enough to determine a position. Thesystem could not be in one position because it would be a ridiculous answer.(It may be in a different hemisphere or nowhere near earth.) Fourmeasurements are important for solving for four components.
• Latitude
• Longitude
• Altitude
• TimeOne measurement is required for each component. Time measurement isimportant because it adjusts the rover clock.
Lautoka, 16.04.98
12
Basics ofGPS Lautoka, 16.04.98
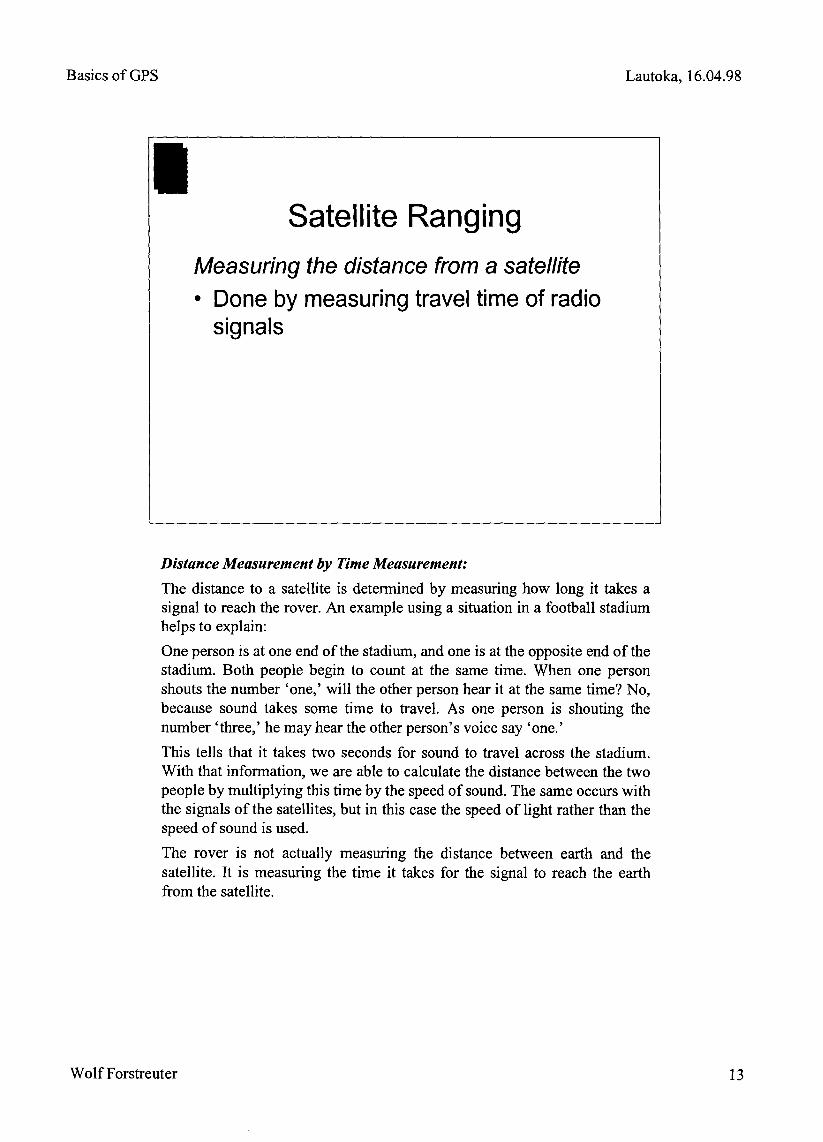
Satellite RangingMeasuring the distance from a satellite• Done by measuring travel time of radio
signals
Distance Measurement by Time Measurement:
The distance to a satellite is determined by measuring how long it takes asignal to reach the rover. An example using a situation in a football stadiumhelps to explain:
One person is at one end of the stadium, and one is at the opposite end of thestadium. Both people begin to count at the same time. When one personshouts the number 'one,' will the other person hear it at the same time? No,because sound takes some time to travel. As one person is shouting thenumber 'three,' he may hear the other person's voice say 'one.'
This tells that it takes two seconds for sound to travel across the stadium.With that information, we are able to calculate the distance between the twopeople by multiplying this time by the speed of sound. The same occurs withthe signals of the satellites, but in this case the speed of light rather than thespeed of sound is used.
The rover is not actually measuring the distance between earth and thesatellite. It is measuring the time it takes for the signal to reach the earthfrom the satellite.
Wolf Forstreuter 13

Basics of GPS Lautoka, 16.04.98
Speed-at-Light MeasurementMeasure how long it takes the GPS signal
to get to us
• Multiply that time by 300,000 km/sec- Time (sec) x 300,000 = km
• If you've got a good clock in thereceiver, all you need to know is exactlywhen signal left satellite
The Speed-of-Light Measurement:
Once it is known how long it took the signal to reach us, the distance can beworked out.
To work out the distance the travel time has to be multiplied by the speed oflight, to get the distance between our position and the satellite.
time x 300,000 =kilometres, or
time x 186,000 =miles
The hard part is knowing exactly when the signal left the satellite.
Wolf Forstreuter 14

Basics of GPS Lautoka, 16.04.98
How Do We Know When theSignal Left the Satellite?
One of the Clever Ideas of GPS:• Use same code at receiver and satellite• Synchronize satellites and receivers so they're
generating same code at same time• Then we look at the incoming code from the satellite
and see how long ago our receiver generated thesame code
The Code:
To work out when the signal left the satellite the GPS receiver uses theincoming code. Each satellite has its own unique code called a Pseudo-Random Code. The codes are not really random. They are carefully selectedand repeat every millisecond. The codes are binary (string of l's and O's)generated and broadcasted by the satellites.
Both the satellites in space and the receivers on the ground are generatingthe same code at exactly the same time. (Assume for now that the satelliteand receiver are exactly synchronised.)
The receiver looks at the incoming code and compares it to the codegenerated internally. The receiver calculates the lapse or delay experiencedand multiplies by the speed of light.
That's why Pathfinder receivers are called code phase receivers. The code isactually being measured.
¥olfForstreuter 15

Basics ofGPS Lautoka, 16.04.98
Accurate ClocksNecessary to measure travel time• Making sure both receiver and satellite are
synchronized• Whole system depends on very accurate
clocks• Satellites have atomic clocks
- Accurate but expensive
• Ground receivers just need consistent clocks- The secret is in the extra satellite measurement
that adjusts the receiver clock
Importance of Accurate Clocks:
For the whole code thing to work, the satellites and our ground receiversmust be generating their codes at exactly the same time.
Satellites have atomic clocks which means that they measure time by usingthe oscillations of a particular atom as a metronome. It is the most accuratemethod for time-keeping ever developed. However, it is very expensive($100,000 per clock). Each satellite has four atomic clocks.
With this expense in mind, it's not practical to have atomic clocks in thereceivers. All that is needed on the ground are very consistent clocks.Ground receivers use quartz clocks that are consistent for short periods oftime and are fairly inexpensive, much like the quartz watches you wear onyour wrists.
The ground receiver clocks can be perfectly synched to universal time byusing an extra ranging measurement (the 4th measurement) to calculate theslowness or fastness of our clocks here on the ground.
The receiver clock is constantly being calibrated by the satellite. Eventually,the receiver clock will update itself no matter what time is set.
Wolf Forstreuter 16
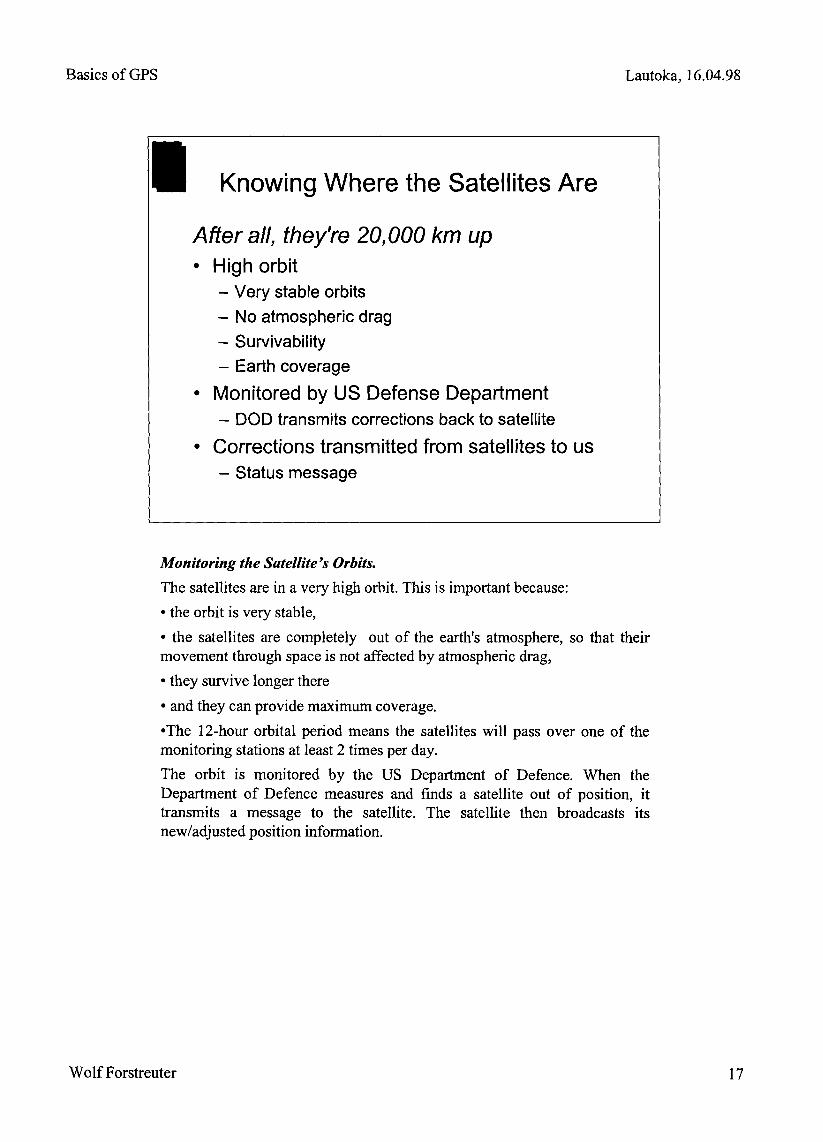
Basics of GPS Lautoka, 16.04.98
Knowing Where the Satellites Are
After all, they're 20,000 km up• High orbit
- Very stable orbits- No atmospheric drag- Survivability- Earth coverage
• Monitored by US Defense Department- DOD transmits corrections back to satellite
• Corrections transmitted from satellites to us- Status message
I I
Monitoring the Satellite's Orbits.
The satellites are in a very high orbit. This is important because:
• the orbit is very stable,
• the satellites are completely out of the earth's atmosphere, so that theirmovement through space is not affected by atmospheric drag,
• they survive longer there
• and they can provide maximum coverage.
-The 12-hour orbital period means the satellites will pass over one of themonitoring stations at least 2 times per day.
The orbit is monitored by the US Department of Defence. When theDepartment of Defence measures and finds a satellite out of position, ittransmits a message to the satellite. The satellite then broadcasts itsnew/adjusted position information.
Wolf Forstreuter 17
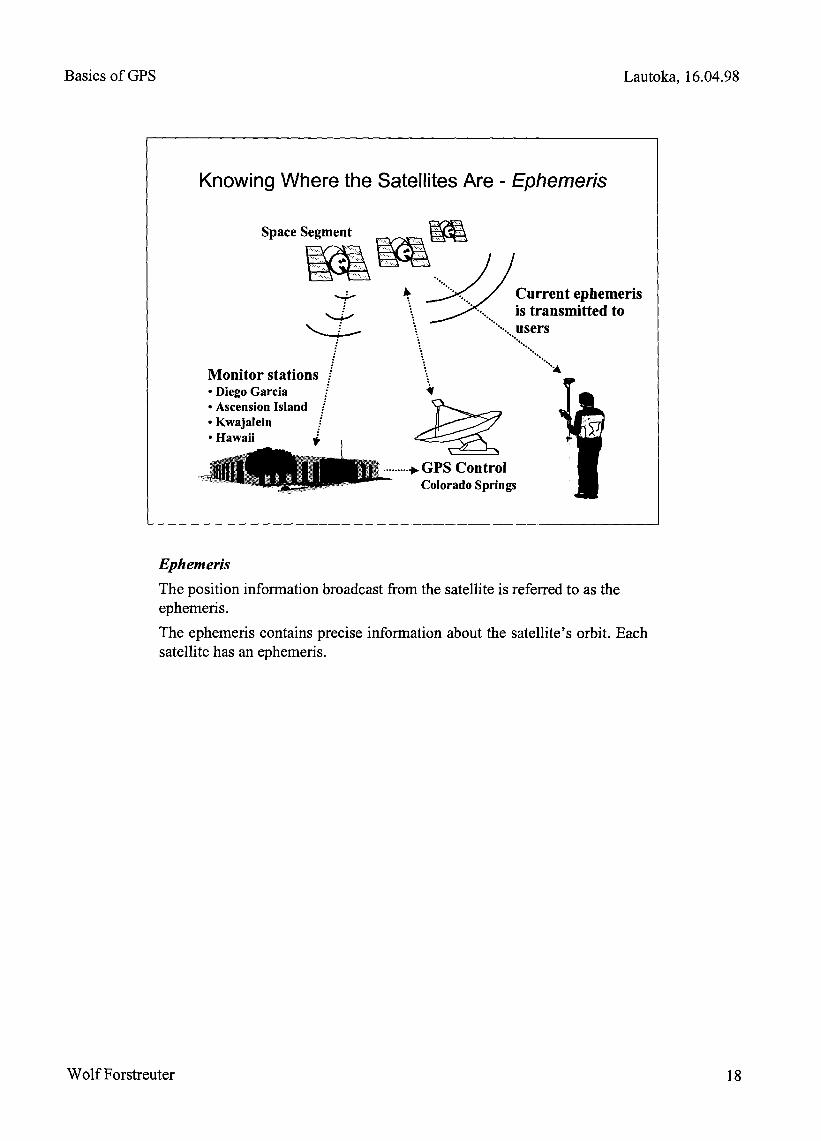
Basics ofGPS Lautoka, 16.04.98
Ephemeris
The position information broadcast from the satellite is referred to as theephemeris.
The ephemeris contains precise information about the satellite's orbit. Eachsatellite has an ephemeris.
Wolf Forstreuter 18

Basics of GPS Lautoka, 16.04.98
Atmospheric Corrections:
Atmospheric conditions can affect the accuracy of positions. GPS does notoperate in a vacuum. When the signal travels through any real medium, likeair or water, it slows down.
The GPS signals are affected by the ionosphere - a band of chargedparticles. Signals bounce around when travelling through charged particles.As the signal bounces, the amount of time it takes to reach the earthincreases. This can alter the calculated position. Ionospheric error is thegreatest during the heat of the day.
The GPS receiver takes these delays into account before it calculates aposition.
Our weather occurs in the troposphere. The tropospheric effects are onlysignificant ifthe rover and base are greater than 300 miles apart.
Wolf Forstreuter 19
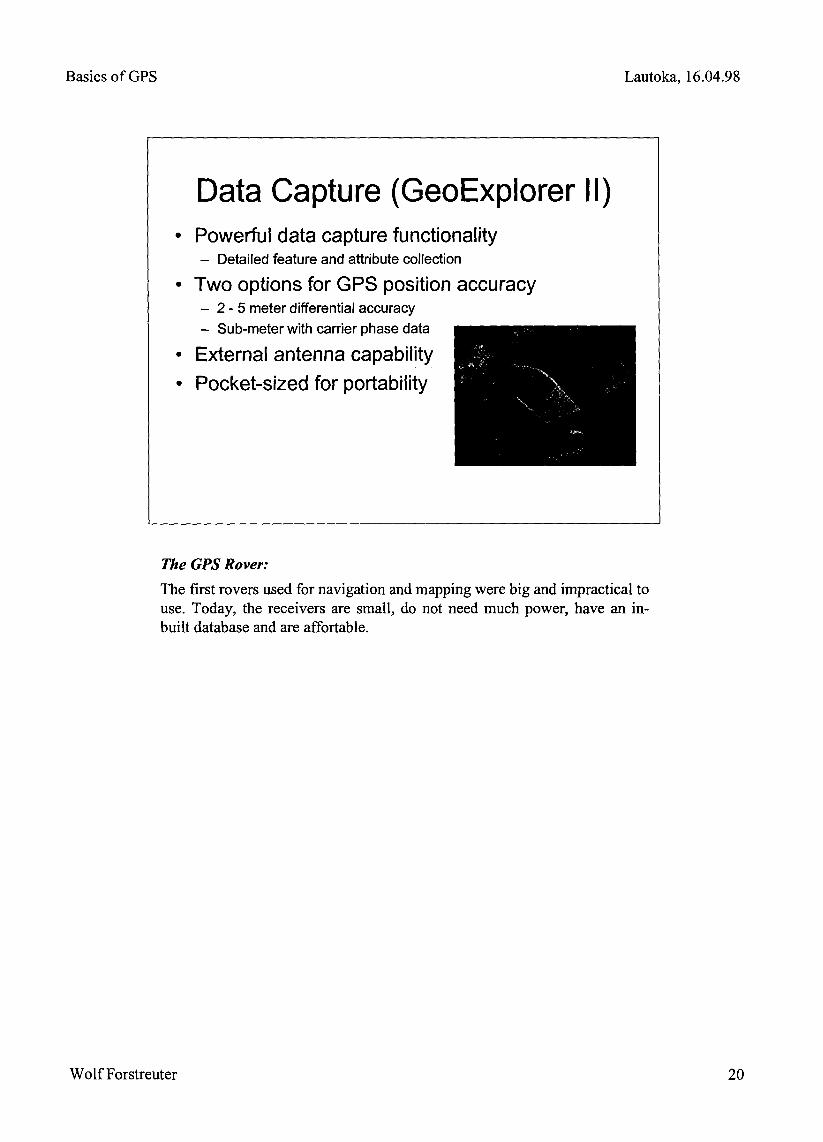
Basics ofGPS Lautoka, 16.04.98
The GPS Rover:
The first rovers used for navigation and mapping were big and impractical touse. Today, the receivers are small, do not need much power, have an in-built database and are affortable.
Wolf Forstreuter 20

Basics of GPS Lautoka, 16.04.98
Data Capture of Line Features:
The slide shows mapping of forest roads in Fiji. In 1995 when the imagewas taken, the car provided the electricity from the electric lighter andthrough the open roof the instrument received the satellite signals. Fiji'sForestry Department was able to map the roads of all their plantations withina minimum of time. Today, the instrument could be equipped with a carantenna (lower right) which would make mapping even more easy.
Wolf Forstreuter 21
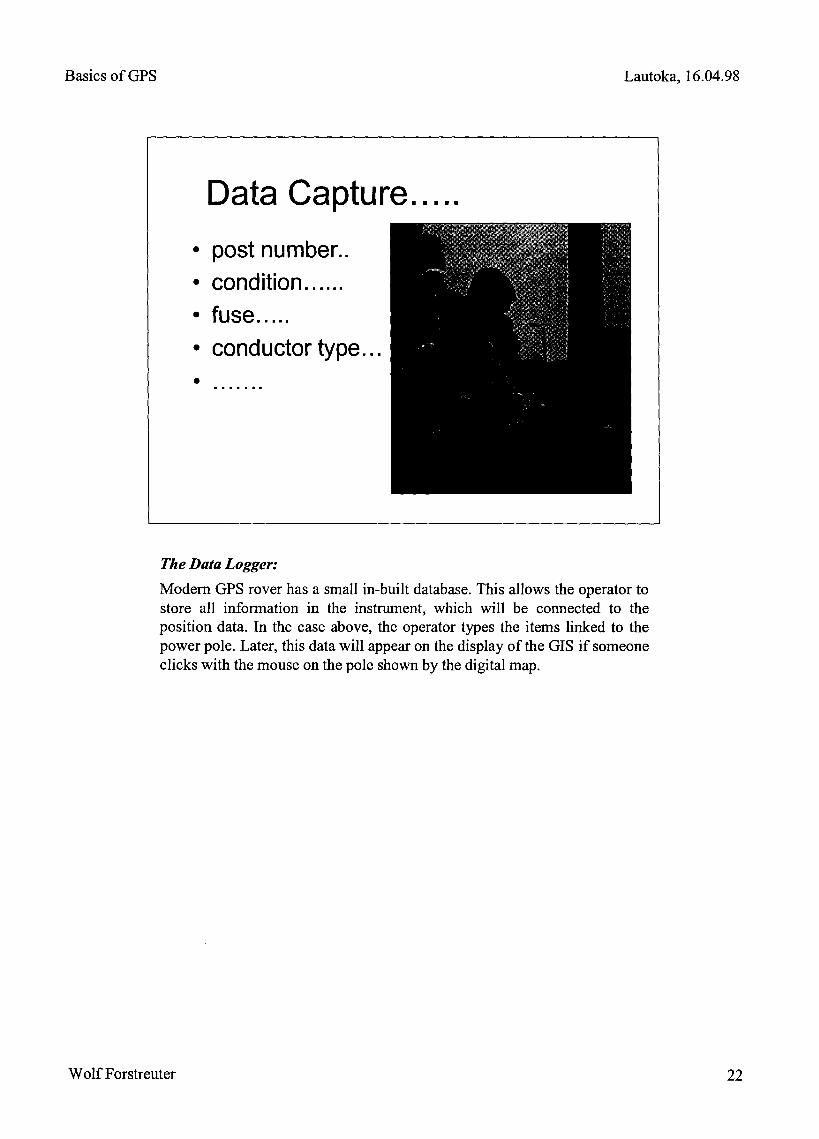
Basics ofGPS Lautoka, 16.04.98
The Data Logger:Modem GPS rover has a small in-built database. This allows the operator tostore all information in the instrument, which will be connected to theposition data. In the case above, the operator types the items linked to thepower pole. Later, this data will appear on the display ofthe GIS if someoneclicks with the mouse on the pole shown by the digital map.
Wolf Forstreuter 22
Basics ofGPS Lautoka, 16.04.98
GPS Products:
To do more than a rough position calculation a differential correction isessential. Differential correction requires a base station and special software.A further presentation will cover the details.
Wolf Forstreuter 232

Basics ofGPS Lautoka, 16.04.98
Thanks for your attention!
Wolf Forstreuter,
[email protected]@compuserve.comfax: +49-6172-930350
Wolf Forstreuter 24

Differential GPS Lautoka, 15.04.98
Differential GPS
Pacific Regional Energy ProgrammePower Utility Workshop
FEA~SIEA~PREP~ SOPAC
Wolf Forstreuter
Differential GPS, an Introduction
The presentation provides a short overview of the basic knowledgenecessary to understand the technique of differential correction. This secondpresentation about GPS will also explain the errors, which can disturb thesatellite signal.
Wolf Forstreuter 1

Differential GPS Lautoka, 15.04.98
How Accurate is a GPS ?
• Depends on some variables- Time spent on measurements- Design of receiver- Relative positions of satellites
• Can be more than 100 meters with non-differential GPS
• Sub-meter to 5 meters with differential GPS• Sub-centimeter accuracy from survey products• US Government can (and does) degrade
accuracy
How Accurate is a GPS ?Many GPS dealers sell hand held GPS systems and specify that the accuracyis in a range of about ±15m. This is not wrong but not correct either.Actually, the display in the instrument will show an accuracy value of 15m,however, the received data is not always that accurate. The data may have itif all parameters are fitting best, but normally external and internal influencecause the systems to be out of horizontal position up to 100m.
This is no problem if you go by boat, but it will cause problems if you wantto use the data for mapping purpose.
Wolf Forstreuter 2

Differential GPS Lautoka, 15.04.98
The Main Features of the GPS System
Just to repeat the main features ofa GPS positioning calculation:
• Position calculation is based on trilateration.
• The distance to the satellites the rover calculates by comparing the rovertime with the time the signal was send from the satellite.
• Four satellites are sufficient to calculate your 3D position, because thefourth measurement determines the correct rover time.
• The position of the satellites is known and monitored.
• Correction to atmospheric disturbance is possible.
Wolf Forstreuter 3
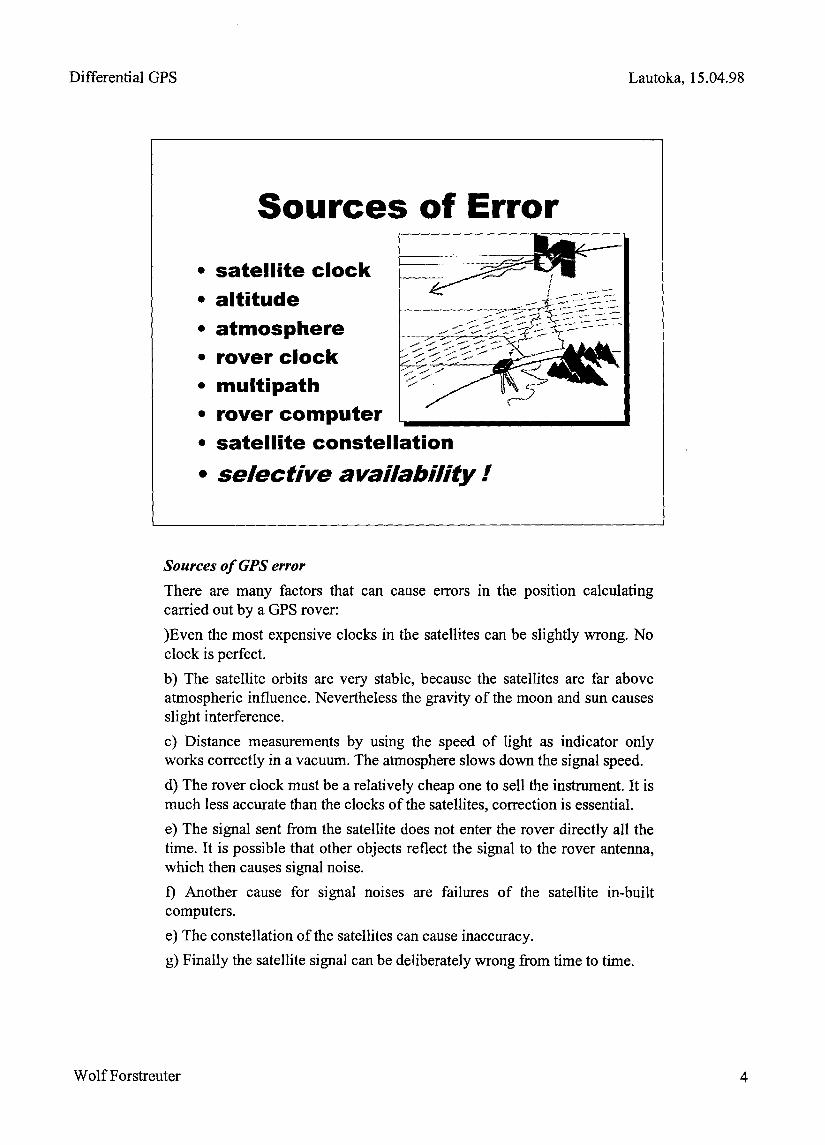
Differential GPS Lautoka, 15.04.98
Sources of GPS error
There are many factors that can cause errors in the position calculatingcarried out by a GPS rover:
)Even the most expensive clocks in the satellites can be slightly wrong. Noclock is perfect.
b) The satellite orbits are very stable, because the satellites are far aboveatmospheric influence. Nevertheless the gravity of the moon and sun causesslight interference.
c) Distance measurements by using the speed of light as indicator onlyworks correctly in a vacuum. The atmosphere slows down the signal speed.
d) The rover clock must be a relatively cheap one to sell the instrument. It ismuch less accurate than the clocks of the satellites, correction is essential.
e) The signal sent from the satellite does not enter the rover directly all thetime. It is possible that other objects reflect the signal to the rover antenna,which then causes signal noise.
f) Another cause for signal noises are failures of the satellite in-builtcomputers.
e) The constellation of the satellites can cause inaccuracy.
g) Finally the satellite signal can be deliberately wrong from time to time.
Wolf Forstreuter 4

Differential GPS Lautoka, 15.04.98
Hovvto Correct theSatellite Clock?
a) the satellite clock is very accurate, it isan atomic clock (100.000 $US)
b) the ground station can adjust the clock
c) if the US Defence Department puts itdeliberately wrong, there no hope!
How to Correct the Satellite's Clock
The GPS satellites are equipped with very accurate clocks. These are atomicclocks one of them costs about 100,000 USD and has an accuracy in thenanosecond range (0.000000001 second). The satellite has four of them.Nevertheless, the ground stations observe these clocks and adjust them ifnecessary.
However, the satellite does not receive always the correct time from thesatellite because the transmitted information is deliberately wrong instructedby the US Defence Department!
Wolf Forstreuter 5

Differential GPS Lautoka, 15.04.98
How to Correct the Satellite's Altitude
GPS satellites flying at very high altitude, a in very stable orbit far awayfrom atmospheric influence. Nevertheless, there is some disturbance: Thegravity of the moon, the gravity of the sun and solar radiation can effect theorbit.The GPS satellites surrounding the earth within 12 hours. The satelliteobservation stations of the US Defence Department notice any slightdifference in altitude. The Defence Department then sends this informationback to the satellite and the system adds it to the signal transmitted to theGPS rovers on earth.However, there is sometimes a slightly incorrect position code in thetransmitted information deliberately included by the US DefenceDepartment!
Wolf Forstreuter 6
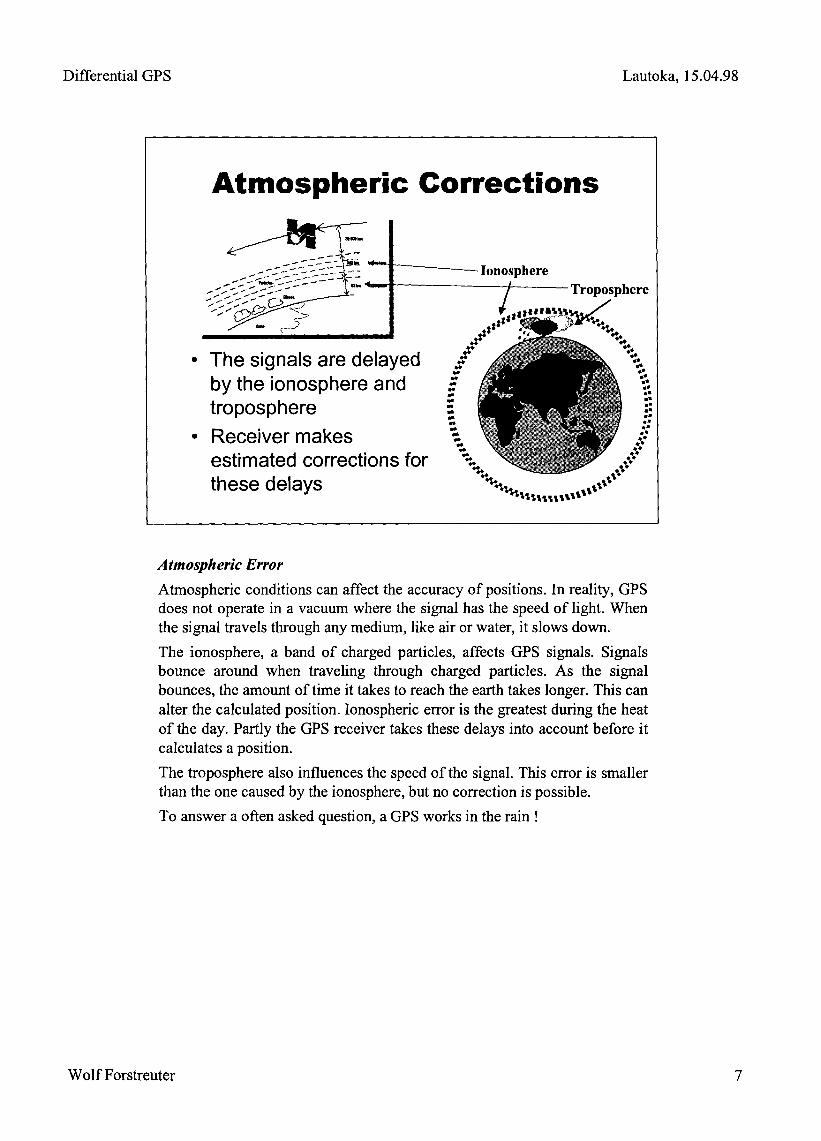
Differential GPS Lautoka, 15.04.98
Atmospheric Error
Atmospheric conditions can affect the accuracy of positions. In reality, GPSdoes not operate in a vacuum where the signal has the speed of light. Whenthe signal travels through any medium, like air or water, it slows down.
The ionosphere, a band of charged particles, affects GPS signals. Signalsbounce around when traveling through charged particles. As the signalbounces, the amount of time it takes to reach the earth takes longer. This canalter the calculated position. Ionospheric error is the greatest during the heatof the day. Partly the GPS receiver takes these delays into account before itcalculates a position.
The troposphere also influences the speed of the signal. This error is smallerthan the one caused by the ionosphere, but no correction is possible.
To answer a often asked question, a GPS works in the rain!
Wolf Forstreuter 7

Differential GPS Lautoka, 15.04.98
How to correct the Rover Clock?
The rovers have less expensive clocks compared with the atomic clocks inthe satellites. These cheaper clocks normally create more errors. However,when the rover uses three satellites to calculate the position one additionalsatellite provides information to adjust the in built clock.
The example shown by the slide above demonstrates position calculation atsea, where 2D receiving is sufficient. If the rover clock is off time, thecalculated distance to the satellites is wrong. The rover is still able tocalculate a position (indicated by xx in the drawing) from the wrongdistance to both satellites A and B. Measuring the distance to the thirdsatellite C the calculation of a common position is impossible. However, therover computer is now able to adjust the clock by calculating the pointwhere all distances would be correct.
Wolf Forstreuter 8

Differential GPS Lautoka, 15.04.98
Hovv to correct errorscaused by multipathand rover computer?
• Sorry, no wayto correct this !
• However, ... it isvery low
Typical Errors:satellite clock 1.5maltitude 2.5mionosphere 5.0mtroposphere O.5mreceiver noise O.3mmultipath O.6mSA 30.0m
Error caused by Multipath and Rover Computer
Most position calculating disturbed by the error sources is so out of rangethat the computer eliminates them before added to the stored position data.Secondly, the overall influence is little. However, there is no way to avoid orto correct this error.
Wolf Forstreuter 9

Differential GPS Lautoka, 15.04.98
The Satellite ConstellationD11ut1M et Pr'cfthlft(Dl)Pt; .-.-~
1k •••• ~lII:po __ ...........,~...,.U. •••••••••.clMer~
tllNllly"'~ro_iI>OIl_ofUfICMaIIlIty'beqUMOf ••.•••••. errora
Position Dilution of Precision (PDOP)
The Satellite Constellation
The Position Dilution of Precision (PDOP) is an indication of the currentsatellite geometry. It is the result of a calculation that takes into accounteach satellite's location relative to the other satellites in the constellation. Alow DOP indicates a higher probability of accuracy. A high DOP indicates alower probability of accuracy.Ideally, the position is a point where two satellite ranges intersect. In reality,the position is located in an area of uncertainty because the satellite rangeerrors. The area representing position of uncertainty becomes larger if thesatellites are closer together.
Wolf Forstreuter 10
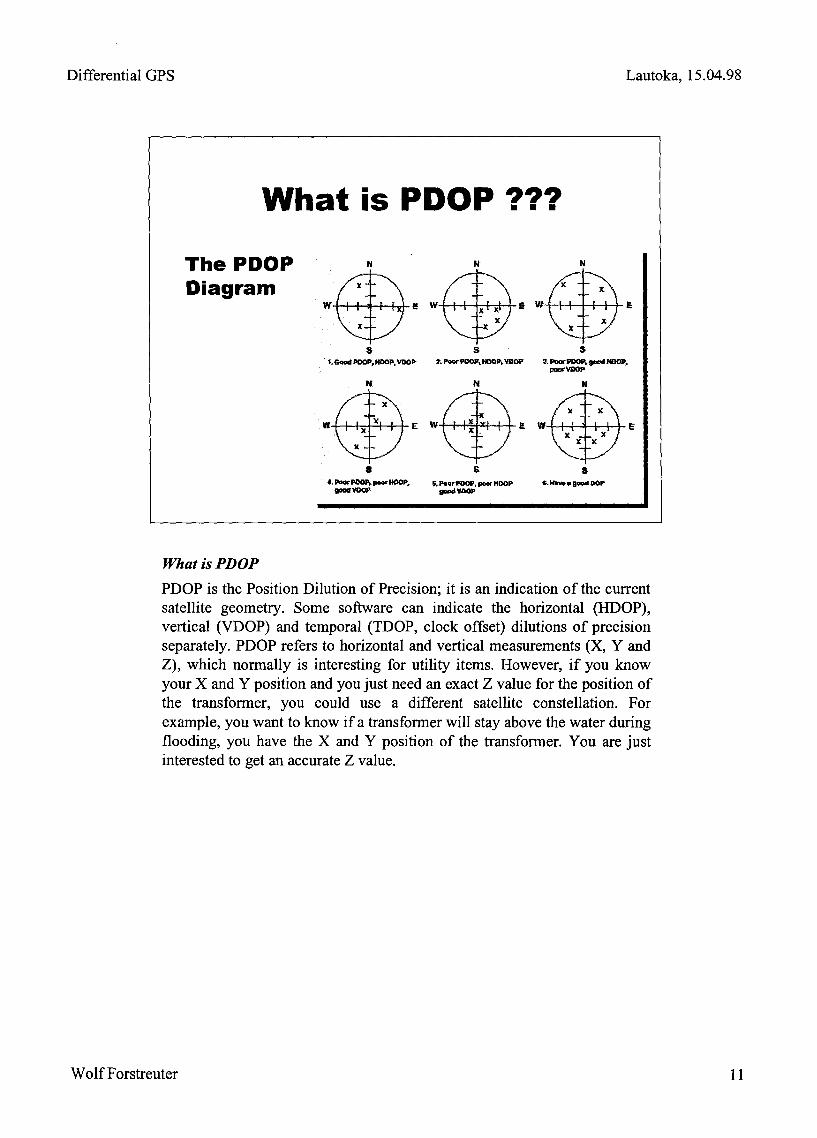
Differential GPS Lautoka, 15.04.98
What;sPDOP
PDOP is the Position Dilution of Precision; it is an indication of the currentsatellite geometry. Some software can indicate the horizontal (HDOP) ,vertical (VDOP) and temporal (TDOP, clock offset) dilutions of precisionseparately. PDOP refers to horizontal and vertical measurements (X, Y andZ), which normally is interesting for utility items. However, if you knowyour X and Y position and you just need an exact Z value for the position ofthe transformer, you could use a different satellite constellation. Forexample, you want to know if a transformer will stay above the water duringflooding, you have the X and Y position of the transformer. You are justinterested to get an accurate Z value.
Wolf Forstreuter 11

Differential GPS Lautoka, 15.04.98
What is "SA" ?
• Selective Availability• US Defence Department stores
deliberately wrong time and wrongaltitude information in the satellitesignal.
• this information changes everysecond, you cannot calculate a dailycorrection factor.
• However, we can correct the error III
What is selective Availability (SA) ?
Due to US military restrictions, the satellites send at certain intervalsincorrect position information. The time information as well as the orbitinformation can be wrong. This causes inaccuracy up to 100meters.A differential correction can eliminate this error.
Wolf Forstreuter 12
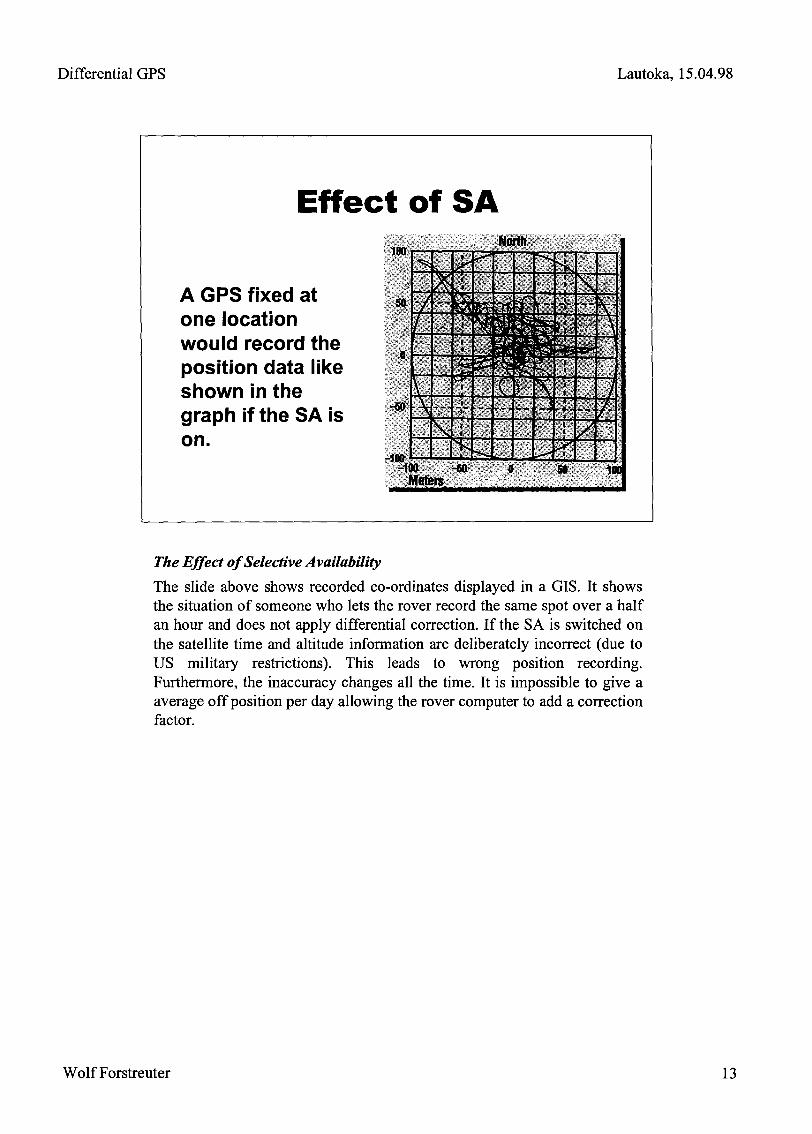
Differential GPS Lautoka, 15.04.98
The Effect of Selective Availability
The slide above shows recorded co-ordinates displayed in a GIS. It showsthe situation of someone who lets the rover record the same spot over a halfan hour and does not apply differential correction. If the SA is switched onthe satellite time and altitude information are deliberately incorrect (due toUS military restrictions). This leads to wrong position recording.Furthermore, the inaccuracy changes all the time. It is impossible to give aaverage off position per day allowing the rover computer to add a correctionfactor.
Wolf Forstreuter 13
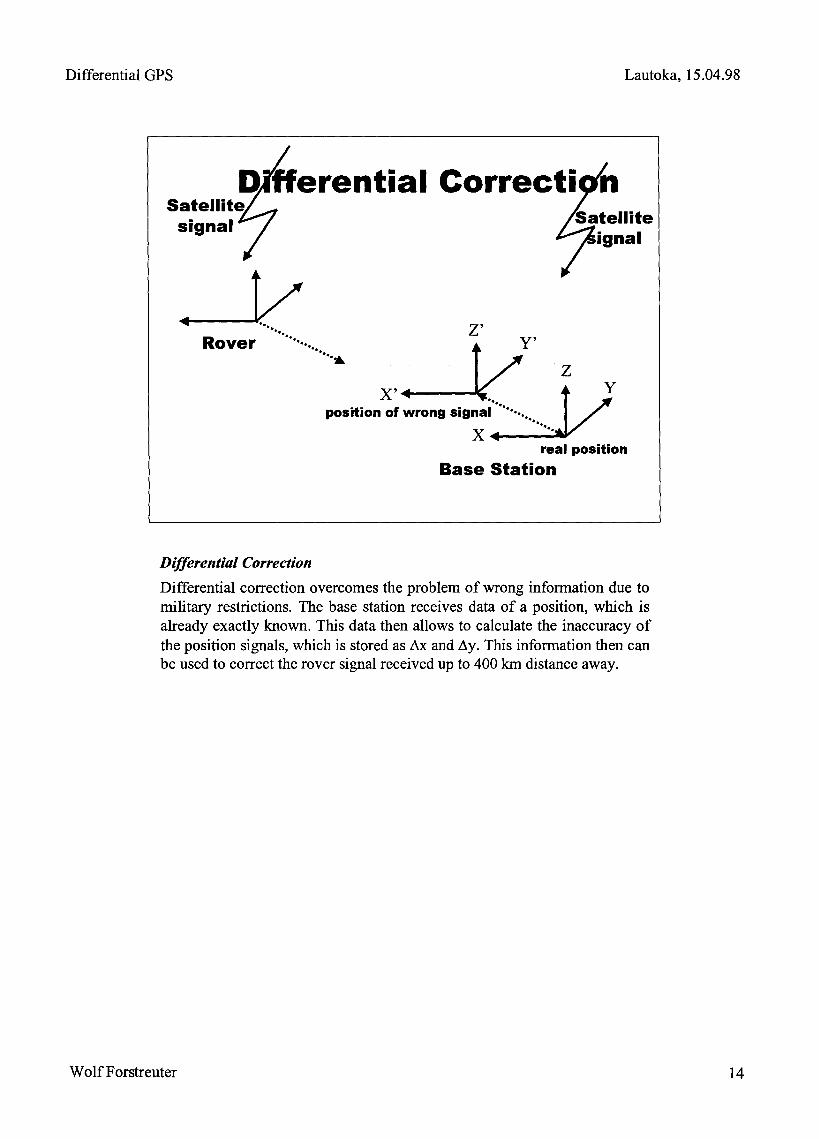
Differential GPS Lautoka, 15.04.98
Differential Correction
Differential correction overcomes the problem of wrong information due tomilitary restrictions. The base station receives data of a position, which isalready exactly known. This data then allows to calculate the inaccuracy ofthe position signals, which is stored as ~x and ~y. This information then canbe used to correct the rover signal received up to 400 km distance away.
Wolf Forstreuter 14

Differential GPS Lautoka, 15.04.98
Community Base Station (CBS)
A Community Base Station has a slightly different design compared with aGPS rover. The antenna allows to receive more satellite because it sees alsosatellites just coming up on the horizon. The installation therefore should fixthe antenna on a roof of building with a clear view around. In addition, theCBS has more channels than a GPS rover. This increases the cost of thisinstrument but enables it to receive more satellites at the same time.
Wolf Forstreuter 1~2

Differential GPS Lautoka, 15.04.98
Communication between CBS and Rover
The data of the Community Base Station (CBS) must correct the datareceived by the rover. There are systems doing this on-line by sending ~xand ~y for every satellite via radio to the rover. However, this requiresexpensive equipment and it is not necessary for mapping purpose. Theoperator can make data corrections at any time later, provided the basestation and rover receive the data at the same time. A direct link betweenrover and base station is not necessary.
The slide above shows the situation in the Forestry Department in Fiji. Therover data (not the base station data) is downloaded to a laptop computerand then sent via e-mail to the base station in Suva for differential correctionand credibility check.
Wolf Forstreuter 16

Differential GPS Lautoka, 15.04.98
Pathfinder OfficePowerful Windows based postprocessing
softwareProvides the tools for
- Effectively preparing for GPSdata capture, and
- Efficiently processing fielddata ready for the GIS
• Makes GPS mappingsimple and easy!
The Pathfinder Office
Many GIS systems have the ability to import GPS data. They are not able tocarry out the differential correction. GPS software is required to carry outthis function. Pfinder (the old version) or PathFinder (delivered togetherwith the rover, now) are software packages which perform differentialcorrection.
Wolf Forstreuter 1714
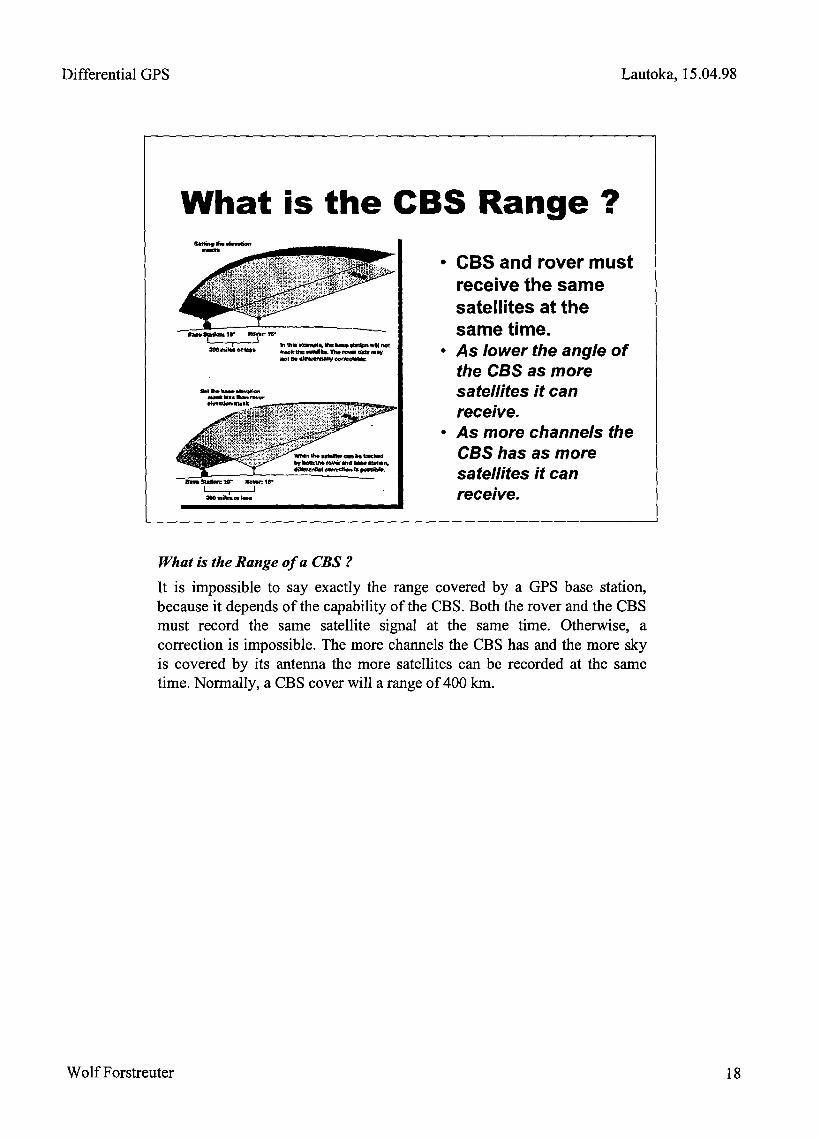
Differential GPS Lautoka, 15.04.98
What is the Range of a CBS?
It is impossible to say exactly the range covered by a GPS base station,because it depends of the capability ofthe CBS. Both the rover and the CBSmust record the same satellite signal at the same time. Otherwise, acorrection is impossible. The more channels the CBS has and the more skyis covered by its antenna the more satellites can be recorded at the sametime. Normally, a CBS cover will a range of 400 Ian.
Wolf Forstreuter 18
DifferentialGPS Lautoka, 15.04.98
Thanks for attention!
Wolf Forstreuter,
[email protected]@compuserve.comfax: +49-6172-930350
Wolf Forstreuter 19


11/04/98
IntroductionUS61111!!pfremotetools to update andmaintain a database
• How to spread a database inseveral places
The problem is how to maintain a system remotely.
Another issue is how to give access to several people to the same datasets especially when these groups of people are far beyond the rangeof a Local Area Network (LAN)

11/04/98
Topics of Discussion• Cliemt.lServer System
• Replicas• Internet! modem updates
Some of solutions presented here have different advantages andproblems. The solutions that we will see are the implementation of aclient server system, use of the replica feature in MS-Access, and useof modems or generally the internet to send and receive updates.
3

11/04/98
In a Client! Server solution the database is already spread over severalcomputers, and the notion of network is already implemented inside thedesign of the database. Unfortunately this type of system is quiteexpensive to install and to maintain.
The different computers can be organised in a LAN but also in a WANwhere secondary servers maintains replicas of the database andsynchronise transactions.
4
Clii.snt/ Server System.Sel"V.er Computer contains the
Data• Client computers request and
reports the data• Client! Server
Computers couldbe the same or
kilometers away

11/04/98
In MS-Access, you can create a replica databases. The replicadatabases can then be given to people. An application would be toinstall a replica on a laptop. This laptop will then be used by the surveydepartment to check poles, lines, customers on the field.
At the end of the survey the replica will be synchronised back with theoriginal master database.
The replica can be saved on a floppy or to a distant computer over aLAN or phone lines. As a sample the current database is 20Mb and withhigh speed modem it will take roughly 2 hours to transfer the databaseto another computer.
The disadvantage is you have to ensure that a methodology is n placeto ensure that replicas don't become standalone databases and are notanymore synchronised with the master database. Also a contentionprocedure should be created when 2 identical records have beenupdated in 2 different replicas and then you synchronise them back tothe master database.
5
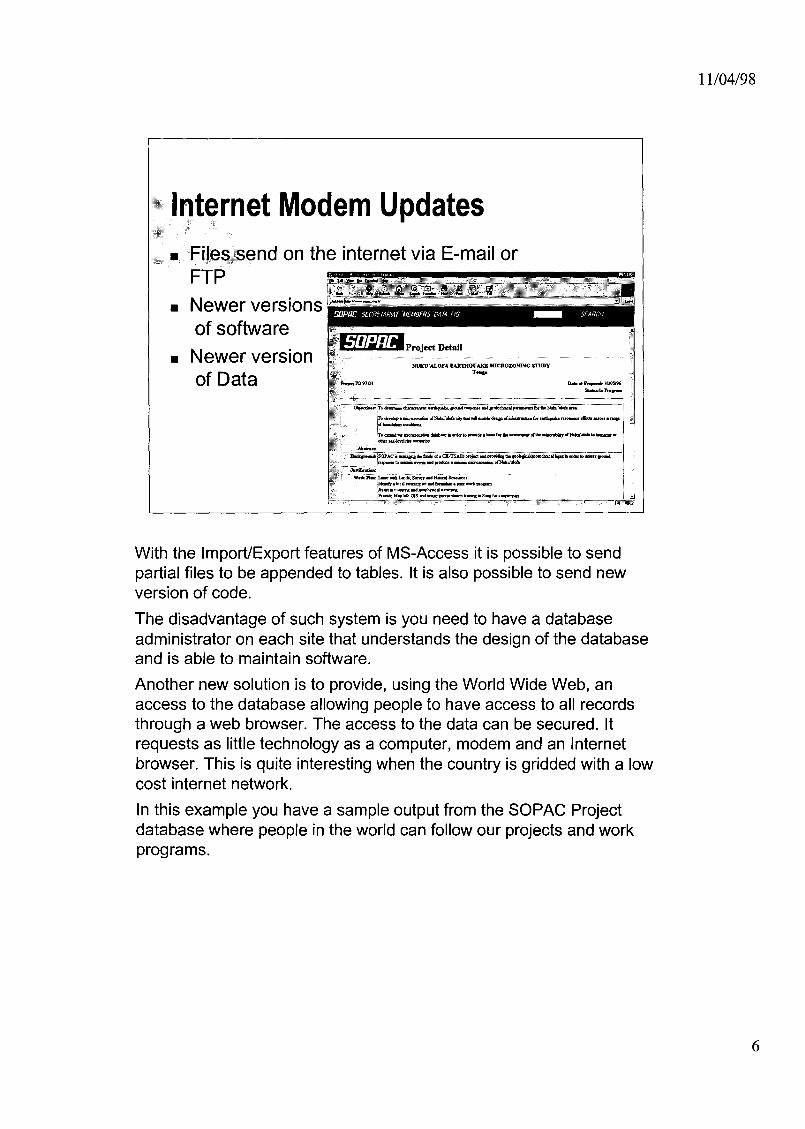
11/04/98
With the Import/Export features of MS-Access it is possible to sendpartial files to be appended to tables. It is also possible to send newversion of code.
The disadvantage of such system is you need to have a databaseadministrator on each site that understands the design of the databaseand is able to maintain software.
Another new solution is to provide, using the World Wide Web, anaccess to the database allowing people to have access to all recordsthrough a web browser. The access to the data can be secured. Itrequests as little technology as a computer, modem and an Internetbrowser. This is quite interesting when the country is gridded with a lowcost internet network.
In this example you have a sample output from the SOPAC Projectdatabase where people in the world can follow our projects and workprograms.
6
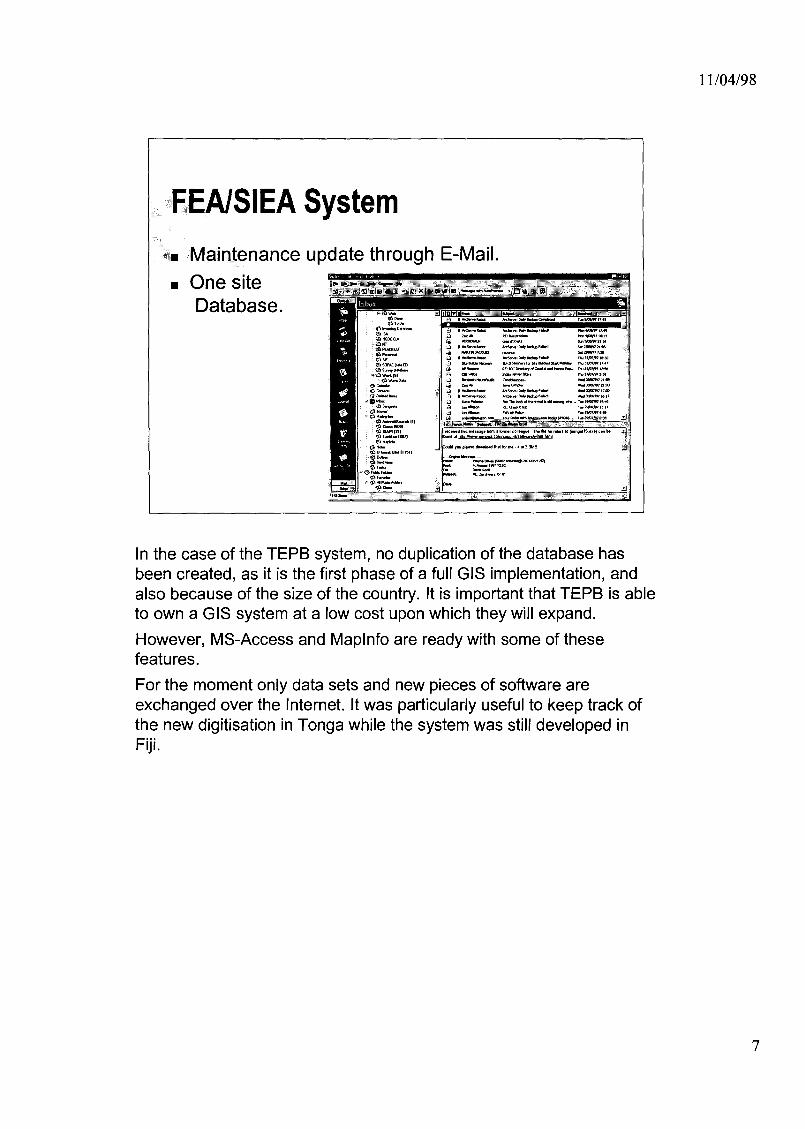
11/04/98
In the case of the TEPS system, no duplication of the database hasbeen created, as it is the first phase of a full GIS implementation, andalso because of the size of the country. It is important that TEPS is ableto own a GIS system at a low cost upon which they will expand.However, MS-Access and Maplnfo are ready with some of thesefeatures.For the moment only data sets and new pieces of software areexchanged over the Internet. It was particularly useful to keep track ofthe new digitisation in Tonga while the system was still developed inFiji.
7

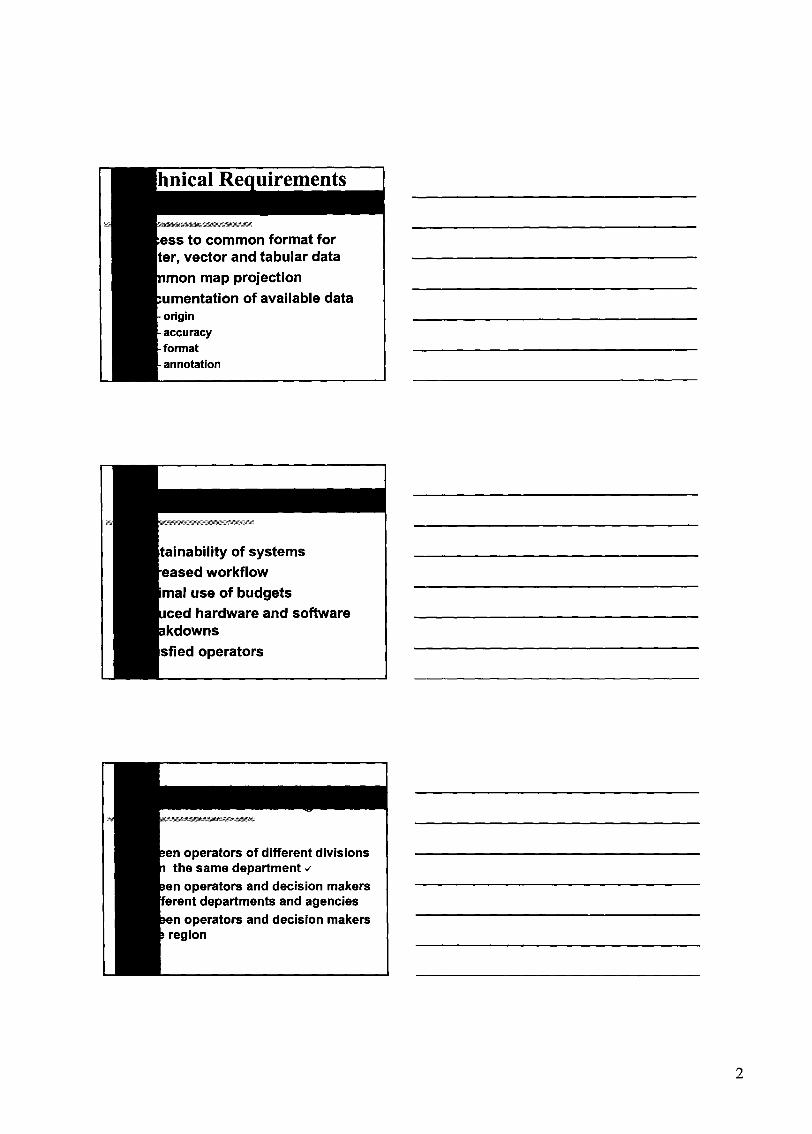
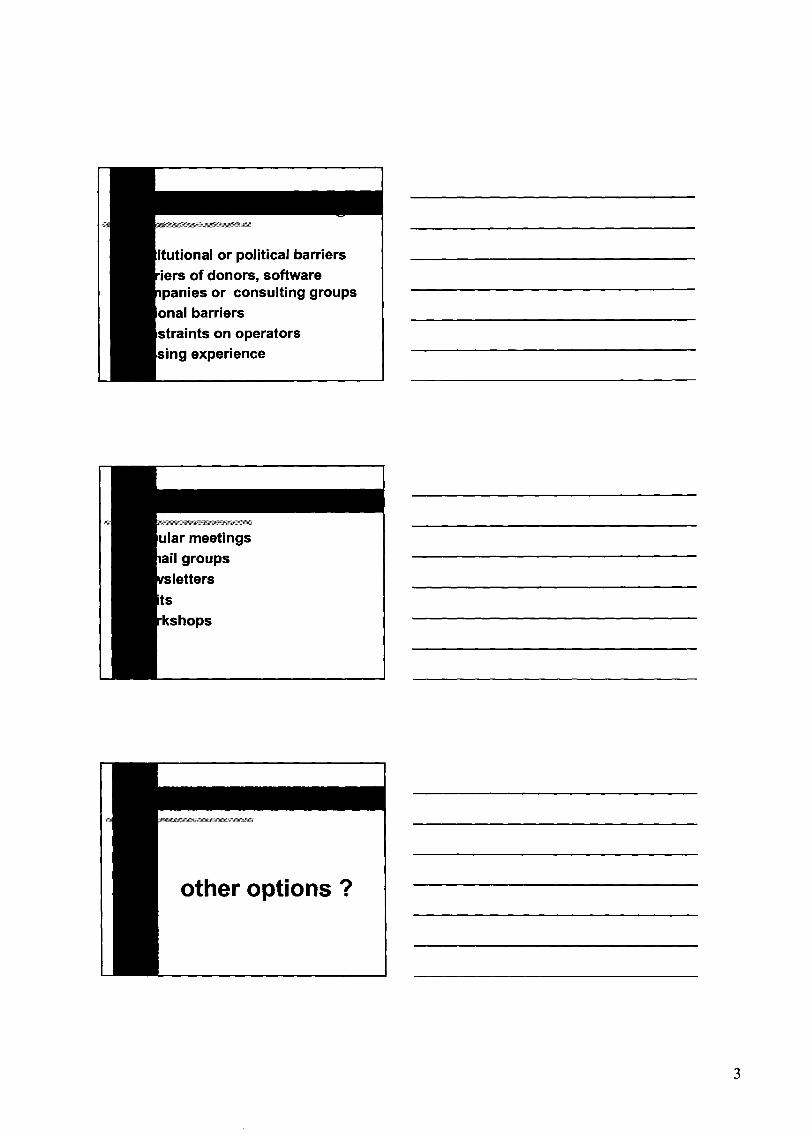

AN APPROPRIATE MID-RANGE GEOGRAPHIC INFORMATION SYSTEMFOR USE IN PACIFIC ISLAND COUNTRIES
14 April, 1997
Leslie J. Allinson
South Pacific Applied Geoscience CommissionPrivate Mail Bag, GPO
Suva, Fiji
Tel: +679381377 Fax: +679370040 E-mail: [email protected] www.sopac.org.fj
Many government and non government organisations in Pacific Island Countries (PIC)are using or evaluating Geographic Information Systems (GIS) as a tool to assist invisual ising information as well as storing valuable datasets for the management of thevarious resources. In inter-government and government organisations and statutoryauthorities, GIS has been applied to:
• Environmental Protection• Fisheries, Forestry and Agriculture• Geosciences• Heath and Education• Power, Water and Telecommunications Utilities
Several candidates have been promoted and there has been confusion over which toolis the best. The candidates are Arc/Info and Maplnfo and while there has been a limitedadoption of other GIS/Mapping tools such as AutoCAD, InfoMap, Microstation andSmallworld these will not be considered as they are either a specialist mapping tool, nota GIS, or have minimal market penetration.
The South Pacific Applied Geoscience Commission (SOPAC) selected Maplnfo as themost appropriate tool in 1992 for the folloWing reasons:
• Windows interface• Ease of learning• Ability to import datasets from Dbase and Excel• Good fit with the emerging Microsoft Office products• MapBasic development language• Cost effective
Since 1992, Maplnfo has become the market leader in mid range GIS and the fit with theMicrosoft family of products has ensured sustainability.
Arc/Info, on the other hand, is a fully featured GIS and but suffers from:
• Steep learning curve• Difficult to use• Windows viewer separate

• Expensive
Arc/Info has been successfully used on some projects but it is not a tool that isrecommended for the non-specialist user. Much of the penetration of Arc/Info in PIC hasresulted from it being promoted by consultants who want continuing work maintainingsystems, recommended as packages by commercial organisations or provided free byprogrammes which are not in touch with the realities of resources in PIC.
The following is complied from information available on the web and includes acomparison of Maplnfo and Arc/Info from a GIS reseller/developer and information onArc/Info to Maplnfo conversion tool.
Important but little-known facts
Maplnfo is the market leader on the desktop and ArclInfo is trying hard to catch up.• MapInfo is available in 16 different language versions.• MapInfo has hundreds of thousands of copies in use world-wide.• MapInfo (not ArclInfo) is the official government mapping standard in Australia.• MapInfo is the de facto world-wide standard for telecommunications applications.• Map Info is in wide use at the USGS, at international forest product companies, and other
"real" GIS sites?• It is true that ArclInfo is the market leader in universities and colleges. It is also the GIS
market leader in large government agencies that emphasise UNIX computers. IntergraphCorporation software is the market leader in GIS if we just consider Windows NT software.Tens of thousands of ArcView software packages have been distributed. However theoverwhelming majority of these appear to have been sent to organisations which already hadUNIX ArclInfo.
Maplnfo Professional is one of a family of products ranging from the very simple to the very technical• Did you know that Map Info has a server version that runs with Oracle on high-end UNIX
workstations and competes against ESRI SDE?• Did you know that MapInfo's programmable "map object" technology, embedded in Microsoft
Office since 1995, is available today as a separate product?• Did you know that Microsoft Excel's mapping feature, used by more than 1,000,000 people
world-wide, uses native MapInfo map format files.• Did you know that MapInfo's ProServer product enables Internet and Intranet mapping-and
offers ALL the technical features of standalone MapInfo Professional?
Maplnfo Pro out-of-the-box does important things that even Workstation Arc/Info (much the lessArclView) does not do.• MapInfo Pro, because it supports the OLE industry standard, lets you simply "drag and drop"
a map into Word (for example). This MapInfo map, although embedded in Word, can still bechanged. ArcView does not support the OLE standard. If you cut and past a map into Wordfrom ArcView, you get a static bitmap which cannot be changed.
• MapInfo Pro's "animation layer" makes possible new cost-effective GPS and AVL andsimulation applications. With the animation layer, MapInfo can show moving objects on thescreen. In contrast, with Arc/Info, the screen re-draws each time any object moves.
• MapInfo Pro Rev 4.1 lets you directly use data tables in MS-Access, WITHOUTTRANSLATION. No more slow-and-complicated ODBC connections. Nor do you need toexport Access data into DBF format (as required by ArcView and UNIX Arc/Info).
• Expensive
Arc/lnfo has been successfully used on some projects but it is not a tool that isrecommended for the non-specialist user. Much of the penetration of Arc/Info in PIC hasresulted from it being promoted by consultants who want continuing work maintainingsystems, recommended as packages by commercial organisations or provided free byprogrammes which are not in touch with the realities of resources in PIC.
The following is complied from information available on the web and includes acomparison of Maplnfo and Arc/Info from a GIS reseller/developer and information onArc/lnfo to Maplnfo conversion tool.
Important but little-known facts
Maplnfo is the market leader on the desktop and ArclInfo is trying hard to catch up.• Map Info is available in 16 different language versions.• MapInfo has hundreds of thousands of copies in use world-wide.• MapInfo (not ArclInfo) is the official government mapping standard in Australia.• MapInfo is the de facto world-wide standard for telecommunications applications.• Map Info is in wide use at the USGS, at international forest product companies, and other
"real" GIS sites?• It is true that ArclInfo is the market leader in universities and colleges. It is also the GIS
market leader in large government agencies that emphasise UNIX computers. IntergraphCorporation software is the market leader in GIS if we just consider Windows NT software.Tens of thousands of ArcView software packages have been distributed. However theoverwhelming majority of these appear to have been sent to organisations which already hadUNIX ArclInfo.
Maplnfo Professional is one of a family of products ranging from the very simple to the very technical.• Did you know that MapInfo has a server version that runs with Oracle on high-end UNIX
workstations and competes against ESRI SDE?• Did you know that MapInfo's programmable "map object" technology, embedded in Microsoft
Office since 1995, is available today as a separate product?• Did you know that Microsoft Excel's mapping feature, used by more than 1,000,000 people
world-wide, uses native MapInfo map format files.• Did you know that MapInfo's ProServer product enables Internet and Intranet mapping-and
offers ALL the technical features of standalone MapInfo Professional?
Maplnfo Pro out-of-the-box does important things that even Workstation Arc/Info (much the lessArclView) does not do.• MapInfo Pro, because it supports the OLE industry standard, lets you simply "drag and drop"
a map into Word (for example). This MapInfo map, although embedded in Word, can still bechanged. ArcView does not support the OLE standard. If you cut and past a map into Wordfrom ArcView, you get a static bitmap which cannot be changed.
• MapInfo Pro's "animation layer" makes possible new cost-effective GPS and AVL andsimulation applications. With the animation layer, MapInfo can show moving objects on thescreen. In contrast, with Arc/Info, the screen re-draws each time any object moves.
• MapInfo Pro Rev 4.1 lets you directly use data tables in MS-Access, WITHOUTTRANSLATION. No more slow-and-complicated ODBC connections. Nor do you need toexport Access data into DBF format (as required by ArcView and UNIX ArclInfo).

• MapInfo has always supported the industry-standard and powerful SQL query language. So inMap Info, unlike in ArclInfo, you can simply and quickly combine data tables having "many-to-many" relationships; create sub-totals or other aggregations using the SQL "group by"clause; and use SQL's "sub-selects" to combine data in several tables. ArcView uses its ownArcView/Avenue syntax rather than SQL. ..except when you are connected to a remotedatabase in which case you switch (mental) gears and have to use SQL. .
• MapInfo Pro lets you display two images (raster layers) simultaneous for the same place. Thisis possible because with MapInfo, unlike ArclInfo, you can set one colour of an image to betransparent. One useful application: powerful combinations of scanned USGS quad sheets anddigital orthophotos.
• MapInfo Pro can display and symbolise groups of maps, as though they were a singleseamless map. Using this "seamless map" feature, you can treat, for example, all county streetmaps for California as though they were a single file. Similarly you could give a single nameto a group of all orthophotos of Columbia County. With a single name, you can turn thesemany maps OFF or ON with a single mouse click. ArcView does not offer this feature at all.With Workstation ArclInfo you can simulate this feature by using the Arc/Info Librarycommands, but the process is much more complex than with MapInfo.
• MapInfo can handle very large files. In our office at SGSI, we commonly display line andpolygon maps that are bigger than 100 MB in size. MapInfo Pro can also manage raster files,such as 200 MB orthophotographs. You can also print these large maps, without add-onsoftware. In contrast, ArclInfo users are accustomed to having to segment their files in tosmaller pieces in order to get adequate performance. Many Workstation ArclInfo sites also useextra cost add-on's such as ArcPress or Image Alchemy in order to print even small rasterimages.
• When splitting map lines or regions, MapInfo Pro automatically splits data values associatedwith each map feature. The same functions are built into MapInfo for situations where you arecombining or merging map regions or lines. In Workstation ArclInfo you can write a programto do this.
Maplnfo Pro out-of-the-box includes "serious" GISfeatures.• Fully programmable, including complete control over the user interface, access to the co-
ordinates of individual map features, and ability to "call" external DLL's or other programs.Programmatic control can be from Visual Basic, C, Powerbuilder, or other programs thatsupport the OLE standard. Alternatively, users can use the separate MapBasic programminglanguage.
• Full polygon overlay, including splitting one feature with another.• Full polygon, line and other feature editing include adding and moving shape points plus the
ability to move any coincident nodes in the same layer.• Creates new permanent buffer zones around points or lines, including automatic scaling of the
buffers based on data table values.• Vector and raster map combinations, including ability to use TIFF, BIL, JPEG, GIF and other
formats. MapInfo can register images interactively on screen and can print large raster maps(without add-ons like ArcPress or Image Alchemy).
• Integration and overlay of map layers built with different co-ordinate systems. This can occuron-the-fly for display. UNIX ArclInfo cannot do this. Alternatively maps can be re-projectedand saved with permanent new co-ordinates.
• Supports WinTab and VTI digitising tablet interfaces. Note: MapInfo Pro, in the currentrevision, does not have "clean & build" capability. [Neither does ArcView.]
• Supports OLE automation for "drag and drop" placement and "in place editing" of maps inword processing documents.