Resolving cancer heterogeneity by single cell sequencing talks/sfaf12-xun.pdf · Resolving cancer...
57
Resolving cancer heterogeneity by single cell sequencing Xu Xun Deputy Director of BGI
Transcript of Resolving cancer heterogeneity by single cell sequencing talks/sfaf12-xun.pdf · Resolving cancer...

Resolving cancer heterogeneity by single cell sequencing
Xu Xun Deputy Director of BGI

Nothing in biology makes sense except in light of evolu?on
Theodosius Dobzhansky
“Tree” type of thinking of Genomics They are different, they are also related
2

Cancer is a game of cell evolu1on
Mel Greaves & Carlo C. Maley Colonal evolution in cancer (2012) Nature

Single Cell Genomics Analysis
4

Digested Tissues Single Cell
Hiseq 2000 Sequencing
Cell isola?on
WGA (MDA)
Sequencing the Single Cell Genome by Next Genera1on Sequencing (NGS)
Library Prepara?on
Enough Amount of DNA
Bioinforma?cs Analysis
Single Cell Genomics
5

• Digest the tissue and randomly select the single cells by the inverted microscope and microcapillary pipetting.
6
Single Cell GenomicsSingle Cell Isola1on

Single Cell Genomics
7
Whole‐genome amplifica?on (WGA) based on mul?ple‐displacement amplifica?on with the phi29 enzyme

Our method PCR based method
Single Cell Genomics
8

Sample set: single cell from the first Asian genome donor (YH); and control form the same ?ssue.
Data set : 13X and 18X for two replica?ons
Single cell 1 Single cell 2 Control
Raw data (Gb) 35.47 47.99 48.72
Average depth 13.32 17.82 18.03
Genome coverage (%) 95.77 94.46 99.91
Method Evalua1on
Single Cell Genomics
9 Hou et al. Cell 2012

Method Evalua1on
• No obvious genome wide coverage limita;on by single cell sequencing
Single Cell Genomics
10

• No obvious genome wide coverage limita;on; GC content does impact the even distribu;on of WGA data.
GC content impact
Method Evalua1on
Single Cell Genomics
11

Sample IDFDR (False posi1ve
muta1on) rate
Single cell 1 7.2E‐5
Single cell 2 8.9E‐5
Note: 1. FDR (False discovery rate) = Error SNP # in single cell/confident homo.
SNP # in control; 2. Here FDR contains WGA error, sequencing error, and mapping error; 3. WGA error:E‐5~E‐6 (J. Guillermo Paez, et al. Nucleic Acids Research, 2004, Vol. 32,
No. 9 e71)
WGA Ar1facts Rate Es1mate Single Cell Genomics
(Calculated by comparing consensus sequence between YH single cell and YH million cells data )
12

FN & FDR sites do not show specific base type bias beyond muta1ons
Single Cell Genomics
ADO (FN) Amplification & Sequencing Error (FDR)
Frac?on of false discovery sites
13

Single Cell Genomics
Pie Chart of Distribu?on of Biological Categories of Genes (GO) with Amplifica?on Failure
Amplification failure genes do not show preference on different biological processes
3%
14

Single Cell on Cancer Genomics
15

• Where is the solutions for rare and rarity cancer samples?
• How can we differentiate such a mixed tumor tissues?
• What type of the genetic changes
is relevant to cancer development?
Samples limitation
Heterogeneity
Cancer Progression
Blocks Questions
16

Cancer is a game of cell evolu1on
Mel Greaves & Carlo C. Maley Colonal evolution in cancer (2012) Nature

A Lesson From High Altitude Adaption
What is the gene;c basis of difference in gi_ed ability to adapt for high al;tude?
X. Yi, et.al. 2010. Science 329:75‐8. 18

A Lesson From High Altitude Adaption
? ? ? ? ? ? ? ? ? ? ? ? ? ? ? ? ? ? ? ? ? ? ? ? ? ? ? ? ? ? ? ? ? ? ? ? ? ? ? ? ? ? ? ? ? ? ? ? ? ?
? ? ? ? ? ? ? ? ? ? ? ? ? ? ? ? ? ? ? ? ? ? ? ? ? ? ? ? ? ? ? ? ? ? ? ? ? ? ? ?
50 Tibetan Individuals 40 Han Chinese Individuals
What is the genetic basis of difference in gifted ability to adapt for high altitude?
Xin Yi,et al Sequencing of 50 Human Exomes Reveals Adaptation to High Altitude. Science. 2010 July; 329(5987): 75-78
19

A Lesson From High Altitude Adaption
• Building phylogenetic tree and structure analysis for different groups of people using SNP
Jun Wang, et al. Nature 2008 Nov 6; 456(7218): 60‐5. Li R, et al. Nat Biotechnol. 2009 Dec 7. 20

A Lesson From High Altitude Adaption
• SNP information shows that Tibetan and Han Chinese are genetically very similar and the evolution history was revealed as follow:
21

A Lesson From High Altitude Adaption
• Here are the power of Population Branch Statistic (PBS) and Genes with significant PBS selection signals
22

50 Tibetan Individuals 40 Han Chinese Individuals
The gene (EPAS1) showing strongest selection signal (up to 80% frequency change in allele distribution) Function further validated in - Association with blood hemoglobin level - Expression level difference in placenta
A Lesson From High Altitude Adaption
23

• Heterogeneous individual population • Phylogenic structure • Evolution history inference • Key genes to hypoxia!
• Heterogeneous cell population • Cell lineage analysis • Development history inference • Key genes to tumor?
Apply Population Analysis to Cancer Stem cells
Normal tissue with random “neutral” somatic mutations
Accumulation of some somatic mutations become “beneficial”
Tumor tissue development
24

Four Cases from 1,000 Single Primary Tumor Cells SequencingCancer type Sample ID Single cell number
Cancer cell #/control cell #(sequencing available
number)
Gender Descrip1on
Essen1al thrombocytosis (ET) ET 100/31(53/8) M a JAK2‐nega1ve pa1ent;
published on Cell, 2012
Clear cell renal cell cancer (ccRCC‐1) CCRCC‐1 20/6 (20/6) M
a VHL‐wild type pa1ent; large pa1ent cohort also analyzed (Guo et al.,
2011); published on Cell ,2012
Bladder transi1onal cell cancer (BTCC) BTCC 59/16 (47/11) M
a muscle invasive type pa1ent; large pa1ent
cohort also analyzed (Gui et al., 2011); submiZed on
Giga‐Science
Colon cancer Colorectal 106/30 (64/6) Mlarge pa1ent cohort also analyzed (unpublished); manuscript in prepara7on
25
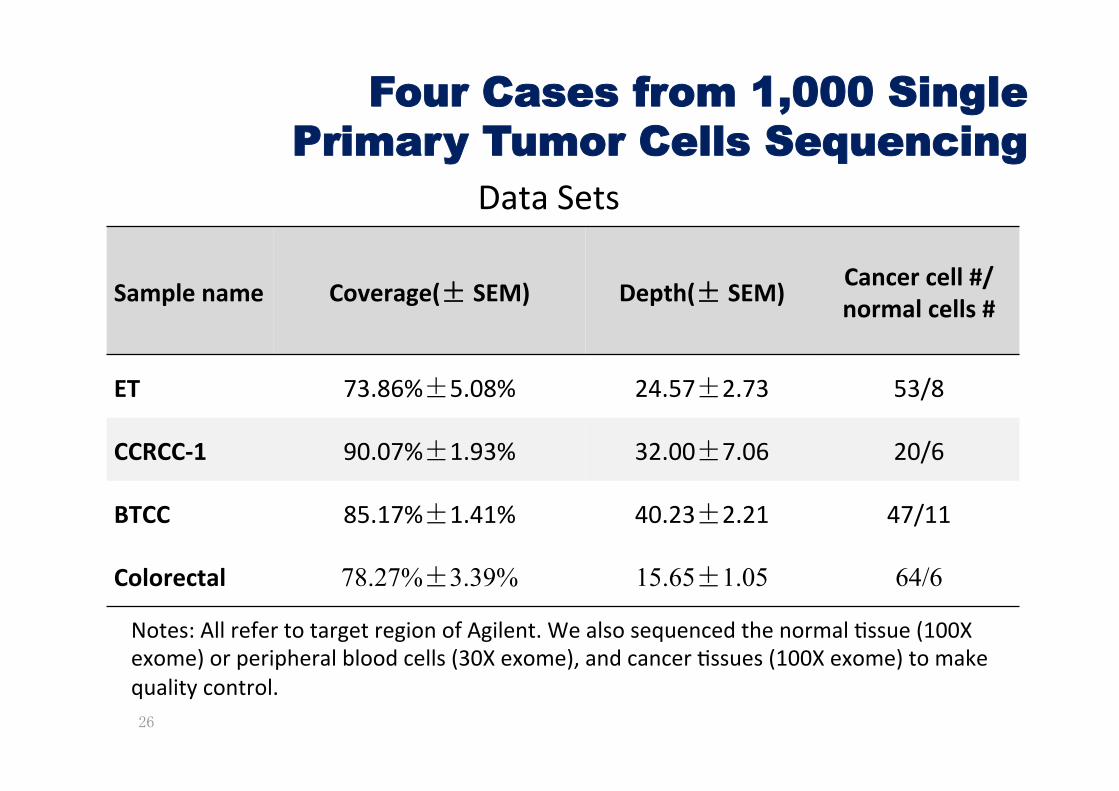
Notes: All refer to target region of Agilent. We also sequenced the normal ?ssue (100X exome) or peripheral blood cells (30X exome), and cancer ?ssues (100X exome) to make quality control.
Sample name Coverage(± SEM) Depth(± SEM) Cancer cell #/normal cells #
ET 73.86%±5.08% 24.57±2.73 53/8
CCRCC‐1 90.07%±1.93% 32.00±7.06 20/6
BTCC 85.17%±1.41% 40.23±2.21 47/11
Colorectal 78.27%±3.39% 15.65±1.05 64/6
Data Sets
Four Cases from 1,000 Single Primary Tumor Cells Sequencing
26

SNP calling Population analysis
Progression inferring
Analysis pipeline
Observe the soma1c muta1on paZern in single cell level Soma1c muta1on sta1s1cs
Derived allelic frequency spectrum of soma1c muta1ons
Muta1on prevalence of single cell level in different cancer
Soma1c muta1on types of single cell level in different cancer
Cancer‐mutated genes
Func1onal valida1on
Four Cases from 1,000 Single Cancer Cells Sequencing
27

Essen?al Thrombocythemia
Four Cases from 1,000 Single Primary Tumor Cells Sequencing
A Wright's stained bone marrow aspirate smear of a JAK2‐nega1ve ET pa?ent
Myeloprolifera?ve neoplasm
is a kind of hematopoie?c
tumours that originate from
the gene?cally varia?ons
contained hematopoie?c stem
cells or progenitors and lead
to abnormal differen?a?on
and myelopoiesis
28

Essen?al Thrombocythemia
Soma;c allele frequency between single cell sequencing and millions of cells shows consistency; PCA analysis dis;nguish cancer and normal cells apparently
Four Cases from 1,000 Single Tumor Cells Sequencing
29
Heterogeneity:

Phylogene;c analysis shows three “cancer” cells present among normal cells, and also showed the homogeneity of renal cancer (no obvious subpopula;ons were observed)
Renal Cancer (ccRCC‐1)
30
Heterogeneity: Four Cases from 1,000 Single
Tumor Cells Sequencing

Comparing the simula;on of soma;c mutated allele frequency and our data shows the poten;al monoclonal origin of this kind of disease.
Essen?al Thrombocythemia
31
Progression: Four Cases from 1,000 Single
Tumor Cells Sequencing

Cancer cells
Normal cells
This indicates that this TCC is very likely to originate from only one ancestral tumour cell with heterozygous muta;ons
Bladder Cancer (BTCC)
32
Progression: Four Cases from 1,000 Single
Tumor Cells Sequencing

Bladder Cancer (BTCC)
Genes
A
N
C
B
The tumour cells could be classified into 3 iden;fiable subclones with different gene;c muta;onal signatures with 3 different groups of genes (A, B, C); N represents normal cells here.
33
Progression:

The tumour evolu;on inferred by the heatmap
Bladder Cancer (BTCC)
34
Progression:
Muscle invasive?
Four Cases from 1,000 Single Tumor Cells Sequencing

• In Clone B, ATM is specifically mutated and found recurring in
5 other TCC pa?ents in the pa?ent cohort. It is a known tumour suppressor that plays a key role as a cell cycle
checkpoint kinase in response to DNA damage and is a
regulator of a wide variety of downstream proteins (Rotman
and Shiloh 1998; Branzei and Foiani 2008). Defects in this
gene could increase muta?on rate and genome instability and
facilitate tumour progression
Gene ATM
Bladder Cancer (BTCC)
35
Progression: Four Cases from 1,000 Single
Tumor Cells Sequencing

• Clone‐C‐specific mutated genes COL6A3 and KIAA1958 both
recurred in 4 addi?onal pa?ents in the pa?ent cohort.
COL6A3 is reported to have significant changes in expression
level in tumour ?ssue(Smith, Culhane et al. 2009) and is a
subunit of collagen IV, a cancer biomarker(Ohlund, Lundin et
al. 2009). The KIAA1958 gene encode a unknown protein.
Bladder Cancer (BTCC)
36
Progression: Four Cases from 1,000 Single
Tumor Cells Sequencing

Driver predic;on of the non‐synonymous soma;c muta;ons: Q‐score was calculated according to a modified method by (Youn and Simon 2011). Genes with Q‐score more than 1 were iden?fied as key genes.
ABCB5
ANAPC1
ARHGAP5
ASNS
DLEC1 DMXL1
DNAJC17
FAM115C
FRG1
MLL3
NTRK1
PABPC1 PDE4DIP
RETSAT
SESN2 ST13
TOP1MT
USP32
‐2
0
2
4
6
8
10
12
‐2 0 2 4 6 8 10 12 14 16 18 20
Observed Soma?
c Muta?
on Num
ber
Essen?al Thrombocythemia
37
Key Muta1ons Four Cases from 1,000 Single
Tumor Cells Sequencing

G e n e Name
Muta?on Type
Monoclone‐origin Gene
Func?onal Analyses
SESN2 Missense Yes SESN2 encoded a member of the sestrin family of SESN1‐related proteins and was an an?oxidant ac?vated by p53. Muta?on in SESN2 may lead to lack of DNA repair and damage preven?on
ST13 Nonsense No ST13 encodes an Hsc70‐interac?ng protein in controlling the ac?vity of regulatory proteins such as steroid receptors and regulators of prolifera?on or apoptosis. Muta?on in ST13 may contribute to loss the control of apoptosis and lead to abnormal prolifera?on.
NTRK1 Missense No A known oncogene, muta?on in NTRK1 may contribute to sustained angiogenesis and cell prolifera?on
ABCB5 Missense No Up‐regula?on of ABCB5 was responsible for mul?drug resistance in several cancers
Key genes with known func;on and correla;on with cancer.
Essen?al Thrombocythemia
38
Key Muta1ons Four Cases from 1,000 Single
Tumor Cells Sequencing

SESN2
DNA repair
Glucocorticoid
ST13
NTRK1RAS
RAF MAPK
ERK
Proliferation
Energy metabolism
ABCB5
Membrane permeability
Ribosome
Smooth endoplasmic reticulum
Rough endoplasmic reticulum
Nucleus
Nucleus transcription
factor
mitochondrion
Immune response
Apoptosis
39
Key Muta1ons

Renal Cancer (ccRCC‐1)
40
Key Muta1ons
Thanks to the large Chinese ccRCC pa?ent cohort data, we compare
the muta?ons in this pa?ent and muta?ons in the large pa?ent
cohort, and found these recurrently genes.
Four Cases from 1,000 Single Tumor Cells Sequencing

Mutated genes landscape: mountain (;ssue common muta;on) and hill(cell specific muta;on) genes;
Renal Cancer (ccRCC‐1)
41
Key Muta1ons Four Cases from 1,000 Single
Tumor Cells Sequencing

Colorectal
42
Key Muta1ons
Thanks to the large colon cancer cohort data, we compare the muta?ons in this pa?ent
and muta?ons in the large pa?ent cohort, and found recurrent genes which may play
important roles in this individual.
Four Cases from 1,000 Single Tumor Cells Sequencing

SLC12A5 was upregulated in colon cancer cell lines
Cac
o-2
CL-
14
DLD
-1
HC
T11
6
LoVo
HT
29
SW48
0
SW62
0
SW11
16
2N
Mar
ker
SLC12A5
RT-PCR
β-Actin
1N
3N
4N
H2O
Func1onal analysis Colorectal
Four Cases from 1,000 Single Tumor Cells Sequencing
43

Construction of wild-type and mutant SLC12A5 expression vector by site-directed mutagenesis
SCL12A5-WT SCL12A5-Mut
Func1onal analysis
Colorectal Four Cases from 1,000 Single
Tumor Cells Sequencing
44

mRNA & protein expression of SLC12A5 in colon cancer cells transfected with WT and mutant SLC12A5-expressing plasmid
SW480
SLC12A5
β-actin
SW1116
SLC12A5
GAPDH
RT-PCR
Western blot
Func1onal analysisColorectal
Four Cases from 1,000 Single Tumor Cells Sequencing
45

Mutant SLC12A5 promoted colony formation
SLC12A5-WT
SLC12A5-Mut
Col
ony
num
ber
P < 0.01
SLC12A5-WT
SLC12A5-Mut
Col
ony
num
ber
P < 0.05Func1onal analysis
Colorectal Four Cases from 1,000 Single Tumor Cells
Sequencing
46

Mutant SLC12A5 promoted colon cancer cell proliferation
SW480 (Stable transfection) SW1116 (Stable transfection)
P < 0.0001 P < 0.0001
Func1onal analysisColorectal Four Cases from 1,000 Single
Tumor Cells Sequencing
47

Mutant SLC12A5 reduced apoptosis
P < 0.01
7-A
AD
Annexin V
SW480-SLC12A5-WT
SW480-SLC12A5-Mut
Ear
ly a
popt
otic
cel
l (%
)
P < 0.05
SW1116-SLC12A5-WT
SW1116-SLC12A5-Mut
Ear
ly a
popt
otic
cel
l (%
)
Func1onal analysis
Colorectal
Four Cases from 1,000 Single Tumor Cells Sequencing
48

• A novel oncogenic mutation in SLC12A5 with
growth-promoting and anti-apoptotic function
was identified
Func1onal analysis
Colorectal
Four Cases from 1,000 Single Tumor Cells Sequencing
49

• We successfully infer the intratumoral heterogeneity and
progression panern from both blood tumor and solid tumor by
single‐cell exome sequencing;
• We iden?fied key muta?ons and genes using independent
methods in an individual tumor;
• Our results indicate the further applica?on of single cell sequencing on cancer personalized medicine and target
therapy.
Summary
50
Four Cases from 1,000 Single Tumor Cells Sequencing

Life is a Game of Cell Evolu1on

Detec1on Resolu1on
• 50% of events resolved to within 10.5kb • 80% of events resolved to within 40kb
Cell
Frac?on of events overlapping hotspots
• 42.2% of events overlap known hotspots, vs 23.4% overlapping ‘coldspots’ (p<0.001).
• Cannot reject null hypothesis of uniform hotspot usage across cells.

• Researchers have long sought a way to determine the amount of recombination that occurs in humans, and they have come up with several indirect ways to measure it in families or in populations.
• single-cell sequencing provides a window on recombination, the process by which matching chromosomes exchange pieces of their DNA during cell division. Recombination helps generate genetic diversity by putting various versions of genes together in new combinations.

Sperm
Retro‐transposon heterogeneity
Monoclonal cancer evolu?on
Carcinogen (physical/chemical/environment)
polyclonal cancer evolu?on
Pathogen (bacteria/virus)
Pharmacogenomics
Expression markers of cell lineage
TCR/BCR/MHC polymorphism
Expression markers of cell lineage
Trans‐omics marker
Primary tumor Metastasis/recurrent tumor
Primary tumor
Immun
e
Embryo development
Embryo
Life is a Game of Cell Evolu1on
Evolu?on
Element
Gene and regula?on network
Trans‐omics marker

Acknowledgement
• R&D center of BGI-Shenzhen: cell isolation, amplification, and analysis;
• BGI-Shenzhen Bioinformatics center: perform the analysis;
• BGI-Shenzhen NGS Platform: sequencing;
• Peking University Shenzhen Hospital and Shenzhen Second People’s Hospital for providing the renal cancer and bladder cancer samples;
• Peking University First Hospital for providing the leukemia samples;
• Peking University Cancer Hospital for providing the gastric cancer and colon cancer samples;
• Stanford University School of Medicine Prof. Matthew Scott and his lab: collaborate on Medulloblastoma project
55

International Conference on Genomics September 27 – 28, 2012 · Children’s Hospital of Philadelphia
Come meet CEOs, directors, and senior execu?ves from BGI, Merck, Pfizer, Sanofi, GSK, BMS, Illumina, Life Technologies, NHGRI, FDA, USDA, Harvard, UC Davis and many more!
Visit www.icgamericas.org
Lab Tours Penn Museum Gourmet Dinner

With over 40 renowned speakers, including:
Dr. Huanming Yang Chairman & Professor BGI
Dr. Jun Wang Execu1ve Director BGI
Dr. Hakon Hakonarson CAG Director CHOP
Dr. Eric D. Green Director NHGRI
Dr. George M. Church Professor Harvard Medical School
Dr. Rupert Vessey Senior VP Merck
Dr. Stephanie Chissoe Ac1ng Head of Gene1cs GlaxoSmithKline
Dr. James WaZers Head of Applied Genomics Sanofi Oncology
Dr. Howard‐Yana Shapiro Global Director of Plant Science Mars Incorporated
Gregory T. Lucier CEO Life Technologies
Frank Witney President & CEO Affymetrix
Dr. Howard J. Jacob HMGC Director Medical College of Wisconsin
Dr. Gabriel G. Haddad Pediatrics Dept. Chair UC San Diego
Dr. Richard W. Michelmore Director UC Davis Genome Center
Dr. Joe Gray Director and Chair of Biomedical Engineering OHSU
Dr. Andy Shih VP of Scien1fic Affairs Au1sm Speaks
Dr. Eric Brown Director Division of Microbiology FDA
Mr. Yingrui Li Head of Bioinforma1cs BGI
Visit www.icgamericas.org