
Hierarchical tumor heterogeneity mediated by cell contact ...
31
Hierarchical tumor heterogeneity mediated by cell contact between distinct genetic subclones Swathi Karthikeyan, … , Sarah Croessmann, Ben Park J Clin Invest. 2021. https://doi.org/10.1172/JCI143557. In-Press Preview Intratumor heterogeneity is an important mediator of poor outcomes in many cancers, including breast cancer. Genetic subclones frequently contribute to this heterogeneity, however their growth dynamics and interactions remain poorly understood. PIK3CA and HER2 alterations are known to co-exist in breast and other cancers. Herein, we present data that describe the ability of oncogenic PIK3CA mutant cells to induce the proliferation of quiescent HER2 mutant cells through a cell-contact mediated mechanism. Interestingly, the HER2 cells proliferated to become the major subclone over PIK3CA counterparts both in vitro and in vivo. Furthermore, this phenotype was observed in both hormone receptor positive and negative cell lines, and was dependent on the expression of fibronectin from mutant PIK3CA cells. Analysis of human tumors demonstrated similar HER2:PIK3CA clonal dynamics and fibronectin expression. Our study provides insights into non-random subclonal architecture of heterogenous tumors, which may aid understanding of tumor evolution and future strategies for personalized medicine. Research Cell biology Oncology Find the latest version: https://jci.me/143557/pdf
Transcript of Hierarchical tumor heterogeneity mediated by cell contact ...

Hierarchical tumor heterogeneity mediated by cell contactbetween distinct genetic subclones
Swathi Karthikeyan, … , Sarah Croessmann, Ben Park
J Clin Invest. 2021. https://doi.org/10.1172/JCI143557.
In-Press Preview
Intratumor heterogeneity is an important mediator of poor outcomes in many cancers, including breast cancer. Geneticsubclones frequently contribute to this heterogeneity, however their growth dynamics and interactions remain poorlyunderstood. PIK3CA and HER2 alterations are known to co-exist in breast and other cancers. Herein, we present datathat describe the ability of oncogenic PIK3CA mutant cells to induce the proliferation of quiescent HER2 mutant cellsthrough a cell-contact mediated mechanism. Interestingly, the HER2 cells proliferated to become the major subclone overPIK3CA counterparts both in vitro and in vivo. Furthermore, this phenotype was observed in both hormone receptorpositive and negative cell lines, and was dependent on the expression of fibronectin from mutant PIK3CA cells. Analysisof human tumors demonstrated similar HER2:PIK3CA clonal dynamics and fibronectin expression. Our study providesinsights into non-random subclonal architecture of heterogenous tumors, which may aid understanding of tumor evolutionand future strategies for personalized medicine.
Research Cell biology Oncology
Find the latest version:
https://jci.me/143557/pdf

Hierarchical tumor heterogeneity mediated by cell contact between distinct genetic 1 subclones 2 3 4 Swathi Karthikeyan1*, Ian Waters1*, Lauren Dennison1, David Chu1, Joshua Donaldson2, Dong 5 Ho Shin2, D. Marc Rosen1, Paula I. Gonzalez-Ericsson3,4, Violeta Sanchez3,4, Melinda E. 6 Sanders3,4, Morgan Pantone2, Riley Bergman2, Brad Davidson2, Sarah Reed2, Daniel J. 7 Zabransky1, Karen Cravero1, Kelly Kyker-Snowman1, Berry Button1, Hong Yuen Wong2, Paula 8 J. Hurley2, Sarah Croessmann2†, Ben Ho Park1,2†. 9
1. The Sidney Kimmel Comprehensive Cancer Center, The Johns Hopkins University 10 School of Medicine, Baltimore, Maryland 11
2. Division of Hematology, Oncology, Department of Medicine, Vanderbilt Ingram Cancer 12 Center, Vanderbilt University Medical Center, Nashville, Tennessee 13
14 3. Department of Pathology, Microbiology, and Immunology, Vanderbilt University 15
Medical Center, Nashville, Tennessee 16 17
4. Breast Cancer Research Program, Vanderbilt University Medical Center, Nashville, 18 Tennessee 19 20
21 *These authors contributed equally: Swathi Karthikeyan, Ian Waters 22 23
†Corresponding Author Contact Information: 24 Sarah Croessmann, Ph.D., 2220 Pierce Avenue, PRB 618, Vanderbilt-Ingram Cancer Center, 25 Vanderbilt University Medical Center, Nashville, TN 37232, [email protected] 26 27 Ben Ho Park, M.D., Ph.D., 2220 Pierce Avenue, PRB 777, Vanderbilt-Ingram Cancer Center, 28 Vanderbilt University Medical Center, Nashville, TN 37232, [email protected]. 29 30
Conflict of interests: 31
B.H.P. is a paid consultant for Jackson Labs, Casdin Capital, Pathovax, Sermonix and is a paid 32 scientific advisory board member for Celcuity Inc. Under separate licensing agreements 33 between Horizon Discovery, LTD and The Johns Hopkins University, D.J.Z, P.J.H, and B.H.P. 34 are entitled to a share of royalties received by the University on sales of products. The terms of 35 this arrangement are being managed by the Johns Hopkins University in accordance with its 36 conflict of interest policies. No other authors declare potential conflicts of interest. 37
None of the authors have a financial relationship with the organizations that sponsored the 38 research. 39
40

Abstract 41
Intratumor heterogeneity is an important mediator of poor outcomes in many cancers, including 42
breast cancer. Genetic subclones frequently contribute to this heterogeneity, however their 43
growth dynamics and interactions remain poorly understood. PIK3CA and HER2 alterations are 44
known to co-exist in breast and other cancers. Herein, we present data that describe the ability of 45
oncogenic PIK3CA mutant cells to induce the proliferation of quiescent HER2 mutant cells 46
through a cell-contact mediated mechanism. Interestingly, the HER2 cells proliferated to become 47
the major subclone over PIK3CA counterparts both in vitro and in vivo. Furthermore, this 48
phenotype was observed in both hormone receptor positive and negative cell lines, and was 49
dependent on the expression of fibronectin from mutant PIK3CA cells. Analysis of human 50
tumors demonstrated similar HER2:PIK3CA clonal dynamics and fibronectin expression. Our 51
study provides insights into non-random subclonal architecture of heterogenous tumors, which 52
may aid understanding of tumor evolution and future strategies for personalized medicine. 53
54
55
56
57
58
59
60
61
62
63

Introduction 64
Breast cancer is the most common cancer among women worldwide and the second 65
leading cause of cancer related deaths(1). Like many other cancers, breast cancer has been shown 66
to be extremely heterogenous. The presence of multiple clones within a single tumor is common 67
and may be functionally important(2-5). Phosphatidylinositol-4,5-bisphosphate 3-kinase catalytic 68
subunit alpha (PIK3CA) and Erb-B2 Receptor Tyrosine Kinase/Human Epidermal Growth Factor 69
Receptor 2 (ERBB2/HER2) are altered in approximately 30% and 20% of breast cancers, 70
respectively(6, 7). In some patients, PIK3CA mutations have been shown to co-occur with HER2 71
alterations, either with amplification/overexpression of Wild Type (WT) HER2 or less 72
commonly with HER2 somatic mutations(3, 8, 9). Prior studies have shown that PIK3CA and 73
HER2 missense mutations within the same cell cooperate and lead to increased biochemical 74
signaling(10). Additionally, past reports have demonstrated that in some human breast cancers, 75
subclonal populations with genetic alterations in PIK3CA or HER2 are present in separate cancer 76
cells(3). Other studies have suggested that intercellular interactions between distinct tumor cells 77
may lead to growth advantage for the tumor as an overall mass. However, common human breast 78
cancer mutations were not queried in these studies and soluble mediators of signaling were 79
implicated as possible mechanisms(11-17). We hypothesized that gene-specific interactions 80
between cells carrying a PIK3CA mutation and those carrying a HER2 mutation could result in 81
phenotypic transformations and may have important implications for tumor evolution. 82
83
84
85
86

Results 87
Clonal Dynamics of HER2:PIK3CA Co-Cultures 88
To test this hypothesis, we utilized MCF-10A, a spontaneously immortalized non-89
tumorigenic breast epithelial cell line, which is hormone receptor and HER2 receptor negative 90
and epidermal growth factor (EGF)-dependent for proliferation(18). Our lab has previously 91
demonstrated that isogenic incorporation of PIK3CA mutations into MCF-10A results in EGF 92
growth independence, a property that is associated with increased malignant potential 93
(Supplementary Table S1)(19, 20). Conversely, MCF-10A cells with an isogenic HER2 L755S 94
missense mutation retain the parental characteristic of EGF dependence(10). These properties 95
allowed us to design a system in which we could evaluate interactions between two genetically 96
distinct subclones - one that is quiescent in the absence of exogenous growth factor and one that 97
proliferates in the same conditions. 98
99
To study these interactions, we co-cultured MCF-10A cells containing a HER2 L755S 100
mutation with isogenic cells harboring a PIK3CA E545K mutation in the absence of exogenous 101
EGF, as described in the experimental design (Supplementary Fig. S1). Both the HER2 L755S 102
and PIK3CA E545K variants are activating mutations that have oncogenic properties in the 103
absence of amplification. Droplet digital PCR (ddPCR) and stable integration of fluorescent 104
proteins were utilized to quantify and visualize the differences in growth patterns. HER2 mutant 105
cells, which normally undergo G1 cell-cycle arrest in the absence of EGF, actively divided when 106
co-cultured with the PIK3CA mutant cells. Intriguingly, with continued passage HER2 cells 107
outgrew their PIK3CA counterparts and became the dominant population in co-culture despite 108
the absence of EGF. This effect appeared gene-specific, as neither “wildtype” MCF-10As (WT) 109

control cell lines carrying a silent mutation(21), nor AKT1 E17K mutants, another EGF 110
dependent cell line(22), gained EGF independence when co-cultured with the PIK3CA mutants 111
(Fig. 1a,b,c,d; Supplementary Fig. S2a). Similarly, MCF-10As containing the NOTCH1 P448fs 112
mutation, which has also been shown to lead to EGF independence ([Cravero], unpublished 113
observations) failed to induce EGF independence in the HER2 mutants (Supplementary Fig. S2). 114
Strikingly, this phenomenon was also observed when skewing co-culture seeding ratios in favor 115
of, or against the HER2 mutant cells (90% or 10%, respectively) (Fig. 1i). These results suggest 116
that subclonal architecture is non-random and selective pressures on a heterogenous population 117
of cancer cells will establish a consistent hierarchy of genetic subclones. 118
119
We sought to validate these findings and examine the HER2:PIK3CA clonal dynamics in 120
vivo by utilizing MCF-7, a tumorigenic hormone receptor positive, HER2 negative human breast 121
cancer epithelial cell line(23) that natively harbors a PIK3CA E545K mutation. To create an 122
analogous system to the MCF10A cell line, the HER2 L755S mutation was incorporated into an 123
isogenically PIK3CA corrected MCF-7 cell line (WT for PIK3CA)(24). The MCF-7 cells are not 124
growth factor dependent, therefore the HER2 and PIK3CA mutant cells proliferate at similar 125
rates in all growth conditions. However, consistent with the MCF-10A cells, the HER2 mutant 126
cells showed increased proliferation and became the predominant population in co-culture when 127
grown with parental MCF-7 cells containing the PIK3CA mutation. This was in stark contrast to 128
the corrected PIK3CA wildtype (WT) MCF-7 cells, which showed similar patterns of growth in 129
co-culture or in isolation (Fig. 1e,f,g,h). Consistent with prior results, regardless of initial seeding 130
ratios, the HER2 mutants evolved as the predominant population when co-cultured with mutant 131
PIK3CA cells (Fig. 1j). 132

133
In order to evaluate these interactions in vivo, mice were inoculated with each cell line 134
separately or co-inoculated with an equal number of either the HER2:PIK3CA mutants or the 135
WT:PIK3CA mutants. Co-inoculums of both HER2:PIK3CA and WT:PIK3CA grew better than 136
respective HER2 and WT controls that were grown in isolation. The overall tumor volumes for 137
the PIK3CA mutant control exceeded that of the other groups (Fig. 1k). On average, the 138
WT:PIK3CA tumors were composed predominantly of PIK3CA mutant cells. Conversely, the 139
HER2:PIK3CA co-inoculated tumors were predominately HER2 mutant cells (Supplementary 140
Fig. S3). Fluorescence imaging of the tumors validated these findings (Fig. 1l). These in vivo 141
results provide additional evidence that corroborated our in vitro findings. 142
143
Cell-Contact Interactions Mediated by Fibronectin 144
We next addressed how mechanistically these two subclonal populations interacted on a 145
cellular level. Live-cell fluorescence time-lapse imaging was utilized to provide an initial 146
understanding. The videos (Supplementary Video 1) and representative images (Fig. 2a) revealed 147
the requirement of cell-cell contact for this phenomenon to occur. HER2 mutant cells (labeled 148
red) that were in contact with the PIK3CA mutant cells (labeled green) underwent cell division 149
(white triangles), while those devoid of contact remained quiescent (blue arrows) despite being 150
within a few microns of the nearest PIK3CA mutant cells. We observed similar findings when 151
cells were cultured in three-dimensional basement membrane (Supplementary Fig. S4 and 152
Supplementary Video 2). Consistent with these results, we did not find significant contributions 153
from paracrine factors in trans-well co-culture experiments (Supplementary Fig. S5). This 154

suggested that the mechanism driving this phenotype required extremely close proximity or 155
direct contact between cells. 156
157
In pursuit of identifying the molecular agent mediating these subclonal interactions, we 158
performed a transcriptome-wide analysis on the HER2 and PIK3CA mutant cells grown in 159
isolation and in co-culture. Genes that were differentially regulated when comparing the co-160
culture to the HER2 mutant controls were investigated further (Supplementary Fig. S6). FN1, 161
coding for the extracellular matrix glycoprotein fibronectin, was the most upregulated gene 162
independently, and when normalized to controls (Fig. 2b). Unlike other genes, whose differential 163
expression could be attributed to the presence of PIK3CA cells in the bulk co-culture, the 164
expression of FN1 was elevated to an even greater extent in the co-culture than in either control 165
cell line. Elevated expression of fibronectin in HER2:PIK3CA co-cultures was confirmed by 166
immunofluorescence (Supplementary Fig. S7). These alterations suggested that fibronectin could 167
be playing an important role in facilitating the observed co-culture phenotype. 168
169
To study the effect of extracellular fibronectin on the growth of the HER2 mutant cells, 170
we plated WT, HER2 and PIK3CA mutant cells onto uncoated and fibronectin-coated plates in 171
the absence of EGF. HER2 mutant cells showed a significant (>2.5 fold) increase when plated 172
onto fibronectin. The PIK3CA mutants and WT cells did not display any significant change in 173
growth rate (Fig. 2c). To further substantiate this finding, we transiently inhibited the cellular 174
binding of fibronectin in co-cultures by competitive inhibition of fibronectin-integrin interactions 175
using a synthetic Arg-Gly-Asp-Ser (RGDS) peptide (25, 26). ddPCR analysis and fluorescence 176
imaging revealed a 15% reduction (p<0.01) in the fraction of HER2 mutant cells in co-cultures 177

that were subject to the RGDS peptide treatment (Fig. 2d,e). It is important to note that the 178
modest, although statistically significant, reduction in the growth of HER2 mutants may be 179
attributed to the short duration of the RDGS peptide treatment. 180
181
In order to definitively evaluate the role of fibronectin, we used the CRISPR-Cas 9 182
system to knock-out FN1 in both the MCF-10A and the MCF-7 PIK3CA mutant cells. Western 183
blots confirmed the absence of fibronectin in both cell lines (Fig. 3a,b). Disruption of FN1 did 184
not affect the growth or morphology of the PIK3CA mutants (Supplementary Fig. S8). 185
Microscopic images showed an occasional absence of contiguous membrane contact in cells that 186
lacked fibronectin in comparison with cells that retained expression in co-culture (Fig. 3c), 187
confirming the necessity of FN1 for mediating this phenotype. Importantly, FN1-null PIK3CA 188
mutants did not support the growth of HER2 mutants in co-culture. Both MCF-10A (Fig. 3d) and 189
MCF-7 (Fig. 3e) HER2 mutant cells exhibited a reversal of the growth induction phenotype 190
when co-cultured with FN1 knockout cells. These results confirmed that fibronectin is an 191
essential component of HER2:PIK3CA interactions that lead to the observed phenotype of clonal 192
hierarchy. 193
194
Fibronectin is known to interact with integrin α5β1(27). Fibronectin-integrin interactions 195
have been shown to stimulate the activity of MAP kinases like ERK1 and ERK2 downstream(28, 196
29). ERK activation in turn, is known to induce cyclin D1 expression leading to cell cycle 197
progression(30, 31). To test if this could be the potential downstream signaling that leads to the 198
HER2 mutant growth in co-culture, we flow sorted the HER2 mutants that were grown in co-199
culture with the PIK3CA mutants and performed a gene expression analysis using a PCR Array 200

(Supplementary Fig. S9). In comparison to the HER2 mutants grown by themselves, those in co-201
culture showed a significant increase in MAP2K1 which encodes a mitogen activated protein 202
kinase kinase known to activate ERK1 and ERK2. Additionally, they also showed a significant 203
upregulation in the expression of CCND1 which encodes for cyclin D1. Taken together, this 204
suggests that a MAP kinase mediated induction of cyclin D1 results in the growth of the HER2 205
mutants in co-culture. 206
207
Clinical Evidence of Clonal Dynamics and Role of Fibronectin 208
To determine the clinical relevance of this phenomenon, we retrospectively analyzed data from 209
targeted sequencing of breast tumors (GENIE cohort v7.0) using cBioPortal(32). From a total of 210
9998 patients, those that had a co-occurrence of HER2 and PIK3CA mutations (n = 119 211
patients/124 samples) were selected and the allele frequencies of HER2 and PIK3CA were 212
obtained (Fig. 4a). Our analysis showed that all tumors with high HER2 allele frequencies (>0.5), 213
except one, had a PIK3CA subclonal population with dramatically lower allele frequencies (n=12 214
patients/12 samples), mirroring the trend observed in our co-cultures (Fig. 4b, Supplementary 215
Table S2). Additionally, patient sample 3 and 14 are serial samples obtained from the same 216
patient (Supplementary Table S2). Sample 14 was obtained at an earlier timepoint and had a 217
HER2 allele fraction of 0.49, while sample 3 was obtained from the same tumor at a later time 218
point and showed a higher HER2 allele fraction of 0.88. There was also a corresponding, 219
although minor, decrease in the PIK3CA allele fraction. These changes further mirror the 220
dynamics seen in our in vitro system. Secondly, tumor tissue obtained from a cohort of patients 221
with stage I to stage III ER positive/HER2 negative breast cancer was analyzed for fibronectin 222
expression(33). Of 22 tumors with a PIK3CA alteration, two showed robust fibronectin 223

expression, while none of the tumors that were wild type for PIK3CA had fibronectin expression 224
(Fig. 5a,b). To expand on this finding, we retrospectively analyzed data from targeted 225
sequencing of a large cohort of breast tumors (cBioPortal, METABRIC)(34, 35) (Fig. 5c). A 226
total of 82 tumors had increased FN1 expression. 46% (n=38) of these tumors contained a 227
PIK3CA alteration, while an additional 22% (n=18) had alterations in one or more other genes 228
involved in PI3K pathway (Fig. 5d). Taken together, these data provide clinical relevance to our 229
in vitro and in vivo findings. 230
231
Discussion 232
Tumor subclones have been portrayed as self-interested competitors, but theoretical 233
hypotheses suggesting a role for subclonal interactions have gained experimental support in 234
recent years(11-17, 36). We believe the system described herein is a powerful model to study 235
interactions between genetically distinct subclones and allows for focused interrogation of 236
specific subclonal contributions to clonal dynamics and heterogeneity in human cells. Our results 237
show that interaction between subclonal populations can lead to unexpected, but consistent 238
patterns in subclonal architecture in vitro, in vivo, and across different cancerous and non-239
cancerous human cell lines. 240
The vast majority of studies examining subclonal interactions have implicated paracrine 241
factors such as TGF-α and β, WNT, amphiregulin and various cytokines as mediators(11-17). 242
Our findings, however, demonstrate a contact-mediated mechanism involving fibronectin as the 243
primary mediator of subclonal growth in mutant HER2 and mutant PIK3CA co-cultures. Prior 244
studies have shown that fibronectin is upregulated during breast cancer development(37-39) and 245

previous work using the PIK3CA E545K mutant MCF-10A cells utilized in this study 246
demonstrated that these cells produce increased fibronectin(40). Altogether, our results 247
consistently indicate that fibronectin can drive the proliferation of HER2 cells and that there may 248
be cooperative subclonal remodeling of the microenvironment. 249
Improving our understanding of tumor evolution is a critical need to advance cancer 250
diagnosis, therapy, and personalized medicine. Here, we demonstrate that fibronectin-mediated 251
interactions between genetically distinct subclones can result in a consistent clonal hierarchy. In 252
the era of clinical tumor sequencing, deciphering these subclonal interactions has potential to 253
positively impact the management of tumors with varying degrees of heterogeneity. 254
255
Methods 256
257
Cell Culture 258
The MCF-10A cell line(18) and its derivatives were maintained in DMEM/F12 (1:1) (Thermo 259
Fisher Scientific, Waltham, MA) supplemented with 5% horse serum (Life Technologies, 260
Carlsbad, CA), 20 ng/mL EGF (Sigma-Aldrich, St. Louis, MO), 10 µg/mL insulin (Life 261
Technologies), 0.5 µg/mL hydrocortisone (Sigma-Aldrich), 0.1 µg/mL cholera toxin (Sigma-262
Aldrich), and 1% Penicillin-Streptomycin (Life Technologies). The exception was the MCF-10A 263
derived PIK3CA E545K mutant cell line, which was maintained on the same media described 264
above, but without supplemental EGF. All assays using MCF-10A background cells were done 265
in DMEM:F12 (1:1) media containing 1% charcoal dextran stripped FBS (Life Technologies) 266
supplemented with insulin, hydrocortisone, cholera toxin, Penicillin-Streptomycin, and lacking 267
EGF. MCF-10A parental cells were purchased from ATCC (Manassas, VA). PIK3CA E545K 268

knock-ins were created in a previous study(19), as were the HER2 L755S mutant(10) and SF3B1 269
R702R silent substitution cells(21). The MCF-7 cell line(23) was purchased from ATCC. 270
Parental MCF-7 cells and its derivatives were maintained in phenol red-free DMEM:F12 (1:1) 271
supplemented with 5% Fetal Bovine Serum (Life Technologies) and 1% Penicillin-Streptomycin. 272
The same media was used for any assays involving these cells. The PIK3CA WT MCF-7 cells 273
and the HER2 L755S knock-ins were previously developed in our lab(10, 24). The MCF-10A 274
FN1 knock outs were maintained in the same medium as the parental with an addition of 1 µg/ml 275
of Puromycin (Thermo Fisher Scientific). The MCF-7 FN1 knock outs were maintained in 276
DMEM:F12 (1:1) supplemented with 5% Fetal Bovine Serum (Life Technologies), 1% 277
Penicillin-Streptomycin and 2 µg/ml of Puromycin. Assays involving the knockouts were 278
performed in the same assay media used for their corresponding parental cell line. MCF-10A and 279
MCF-7 cell lines were verified by STR profiling. 280
281
Co-Cultures 282
Cells were plated at the indicated ratio into T25 flasks (Corning) as shown in Extended data Fig. 283
1. The co-cultures were grown to near-confluency and then split at a 1:10 ratio. Genomic DNA 284
(gDNA) was extracted at each split for analysis by droplet digital PCR (dPCR). Control cultures 285
were allowed to grow until the flasks of one of the controls (e.g. HER2 or PIK3CA) reached 286
confluency. At this point, cells from each control were mixed with equal volumes to yield the 287
artificial mixes. 288
289
Droplet Digital PCR 290

gDNA used for ddPCR was extracted using the QIAamp DNA Blood Mini Kit (Qiagen, Hilden, 291
Germany) and then digested using CviQI (New England Biolabs, Ipswich, MA) restriction 292
enzyme. The digested DNA was purified using the QIAquick PCR Purification kit (Qiagen). 293
ddPCR reactions were performed using the BioRad QX200 system (BioRad, Hercules, CA) 294
according to the manufacturer’s protocol. Sequences of the primers and probes used in this study 295
are listed in Supplementary Table S3. In the case of the Dual-Mutant assay, the FAM-tagged 296
probe was designed to detect the mutant allele of one gene and the HEX-tagged probe was 297
designed to detect the mutant allele of the other gene of interest. For Dual-Mutant reactions, 298
forward and reverse primers were added for both loci. The working concentrations of the primers 299
were doubled, and their volumes halved to maintain the same concentrations as recommended in 300
the manufacturer protocol. Positive droplets for each channel were identified using the 301
QuantaSoft program (BioRad) and the fraction of each cell in the co-culture was calculated 302
according to the calculations in Supplementary Methods. 303
304
Lentivirus-Mediated Stable Integration of Fluorescent Proteins 305
Lentiviral vectors containing fluorescent proteins (#20131202, Takara Bio USA, Mountain 306
View, CA) were used to transduce cells according to the manufacturer’s protocol. Plasmid 307
sequences were, 308
1. rLV-EF1a-tdTomato-IRES-Puro-WPRE for red cells 309
2. rLV-EF1a-ZsGreen1-IRES-Puro-WPRE for green cells 310
Briefly, cells were seeded at sub-confluent concentrations and infected post 24hrs with a mixture 311
of the viral particles in media and polybrene (800 µg/mL). Following an overnight incubation, 312
the cells were recovered by replacing the transduction media with normal maintenance media. 313
Fluorescence was assessed 48 hours post recovery and the cells were then single cell diluted to 314
isolate individual clones. The isolated clones were then evaluated for fluorescence and their 315
growth rates were compared to that of the parental using crystal violet staining (data not shown). 316
Clones that most closely resembled the parental growth rates and expressed the fluorescent 317
protein were selected. Fluorescence imaging was performed using the EVOS M7000 system 318
(Thermo Fisher). 319
320
Xenograft Assays 321
A total of 35 female athymic nude mice with supplemental estrogen pellets (Harlan Laboratories, 322
Indianapolis, IN) were assigned to a total of 5 groups: 5 mice x 3 control groups and 10 mice x 2 323
co-inoculation groups. 2 x 10⁶ cells were resuspended in Geltrex LDEV-Free Reduced Growth 324
Factor Basement Membrane Matrix (Thermo Fisher) and injected subcutaneously. Co-325
inoculations were accomplished by mixing equal number of cells from each cell line prior to 326
resuspension in Geltrex. Tumor volumes were periodically assessed using calipers to measure 327
the length, width, and height for each tumor. 328
329
Xenograft Processing 330
Tumors were harvested upon reaching a predetermined threshold (1.5cm3) or at the termination 331
of the experiment. Upon extraction, each tumor was placed in 10% formalin for 1 hour and then 332
30% sucrose in PBS overnight. The tumors were then cut into two halves. One half was used for 333
genomic DNA extraction using the DNeasy Blood & Tissue kit (Qiagen) for ddPCR analysis. 334
The other half was prepared for fluorescence imaging. In order to preserve the endogenous 335
fluorescence of the xenograft cells, tumors were preserved in Optimal Cutting Temperature 336
(OCT) Compound (Fisher Scientific, Hampton, NH) and stored at -80°C. Cryosectioning was 337
then performed by the Johns Hopkins Oncology Tissue Services Core. Cryosectioned slides were 338
then stained with DAPI and mounted using a mixture of 20mM Tris, pH 8.0, 0.5% N-propyl 339
gallate, and 90% glycerol. 340
341
Time-Lapse Imaging 342
Cells were plated in isolation or in co-culture and were allowed to grow for 24 hours. They were 343
then transferred to the incubator of the IncuCyte (Essen BioScience), which was kept at 37°C 344
and 5% CO2. Periodic phase and fluorescence images were taken at 10x magnification using the 345
IncuCyte’s internal camera. 346
347
Microarray 348
RNA was extracted from controls and co-cultures in quadruplicate using the RNeasy and 349
QiaShredder kits (Qiagen). Samples were sent to the Johns Hopkins Deep Sequencing & 350
Microarray Core, which performed quality control measures and subjected the RNA to the 351
Affymetrix Clariom S Array. Downstream analysis was performed using the Transcriptome 352
Analysis Console (TAC) Software (Thermo Fisher). Transcriptome data were deposited in 353
NCBI’s Gene Expression Omnibus (GEO) and is accessible through GEO series accession 354
number GSE165065. 355
356
Fibronectin Coating 357
Fibronectin from human plasma (Sigma-Aldrich) was dissolved to 1 mg/mL in sterile water by 358
placing in 37 °C for 30 minutes. The soluble fibronectin was then diluted in a minimal volume of 359

HBSS and applied to each plate at a concentration of 5 µg/cm. Plates were left to air-dry for at 360
least 45 minutes before cells were added. 361
362
CRISPR Cas-9 system: 363
The CRISPR-Cas 9 system was used to knockout FN1 in the MCF-10A and the MCF-7 PIK3CA 364
mutants. Guide RNA sequences were chosen from the GeCKov2 library pool(41). Vectors were 365
created by cloning the guide RNAs into the lentiCRISPR v2 one vector system backbone. Each 366
vector was then co-transfected with lentiviral packaging plasmids CMV dR8.91 and vsvg into 367
HEK293T cells. The harvested virus was used to infect the PIK3CA mutants in confluent 6-well 368
plates for 24 hrs. Post infection, the transduced cells were recovered for 4 hours following which 369
they were selected using puromycin for 3 days (1 µg/ml for MCF-10As and 2 µg/ml for MCF-7). 370
Post-selection, the cells were single cell diluted and individual colonies were sequenced at the 371
locus to identify clones with insertions/deletions at the cut site. The selected clones were further 372
analyzed by western blot to verify complete knockout of FN1. 373
Western blot analysis 374
MCF-10A cells were seeded in 6-well plates in DMEM:F12 (1:1) media containing 1% charcoal 375
dextran stripped FBS (Life Technologies) supplemented with insulin, hydrocortisone, cholera 376
toxin and Penicillin-Streptomycin. The MCF-7 cells were plated in DMEM:F12 (1:1) 377
supplemented with 1% charcoal dextran stripped FBS (Life Technologies) and 1% Penicillin-378
Streptomycin. For lysate preparation, the cells were washed thoroughly with phosphate buffered 379
saline (PBS) to avoid serum cross-reactivity with the FN1 antibody, following which they were 380
scrapped in PBS and centrifuged to remove any residual serum. The supernatant was discarded 381

and the cell pellet was resuspended in Laemmli buffer. The lysates were resolved by SDS-PAGE 382
using NuPAGE gels (Invitrogen). Since fibronectin is a high molecular weight protein the gels 383
were incubated in 20% ethanol at room temperature for 5-10 minutes prior to transfer. The 384
proteins were transferred onto PVDF membranes using iBlot 2 (Invitrogen) and the membranes 385
were probed with anti-fibronectin antibody (ab2413, Abcam) diluted in primary antibody 386
dilution buffer (R2004, Kwikquant). TBST was replaced with clean wash buffer (R2001) in all 387
steps. Images were acquired according to manufactures protocol using the Kwikquant Imager 388
(Kindle Biosciences, LLC, Greenwich, CT). 389
Flow sorting for PCR Array 390
HER2 mutants (MCF-10A background) were co-cultured with the PIK3CA mutants in MCF-10A 391
assay media in the absence of phenol red for 5 days. HER2 mutants grown in isolation were used 392
as control. The control and co-cultured cells were trypisinized and centrifuged at 200g for 5 393
minutes. The cell pellets were resuspended in PBS + 3% charcoal dextran stripped FBS. Flow 394
sorting was carried out at the Vanderbilt Flow Cytometry Shared Resource using the 100uM 395
flow nozzle. RFP tagged HER2 mutants were separated using assay media with 20% charcoal 396
dextran stripped FBS as catch buffer. 397
398
PCR Array 399
Total RNA was extracted from controls and co-cultures using the RNeasy Mini kit (Qiagen). The 400
RNA was reverse transcribed using the RT2 First Strand kit (Qiagen) according to the 401
manufacturer’s protocol. The expression of a total of 84 genes was tested using the RT2 Profiler 402
PCR Array Human Kit EGF/PDGF Signaling Pathway Sampler (GeneGlobe ID PAHS-040Z). 403
The data obtained was analyzed using the GeneGlobe data analysis center from Qiagen 404

according to the manufacturer’s instructions. The average of five housekeeping genes (ACTB, 405
B2M, GAPDH, HPRT1, RPLP0) was used for normalization. The data generated in this array has 406
been deposited in NCBI’s Gene Expression Omnibus (GEO) and is accessible through GEO 407
series accession number GSE165150. 408
409
Immunohistochemical staining of patient tumors 410
Patient tissue, from stage 1-stage III operable ER+/ HER2- breast tumors from postmenopausal 411
patients who with received 15-21 days of letrozole prior to surgery, were obtained from a prior 412
Vanderbilt Ingram-Cancer center trial (BRE0776)(33). Since fibronectin is widely expressed by 413
different cell types and is a part of the extracellular matrix, we were unable to use the matched 414
normal tissue from the tissue microarray as a negative control. Therefore, cell pellets from the 415
FN1 knockouts and the corresponding FN1+ parentals created in our lab for this paper were used 416
as negative and positive controls respectively. Pellets were sectioned by the Translational 417
Pathology Shared Resource at Vanderbilt University. The tissues and sectioned pellet controls 418
were stained with ab2413 anti-fibronectin primary (Abcam) and #26836 Fibronectin/FN1 419
(E5H6X) Rabbit mAb (Cell signaling). 420
421
cBioPortal data analysis 422
Information for in-silico data analyses were obtained using the METABRIC and GENIE 423
databases and analyzed using cBioPortal (https://www.cbioportal.org). Genomic profiles 424
including mutations, allelic frequencies and mRNA expression z-scores were obtained and 425
analyzed further using the GraphPad prism. In the METABRIC dataset, samples were filtered 426
based on increased FN1 expression (FN1: EXP >2) prior to analysis of genetic alterations in 427
PIK3CA, AKT1, AKT2, AKT3, PIK3C2B and PTEN genes. In the GENIE dataset (breast cancer 428
cohort), samples with co-occurrence of HER2 (searched using the genetic nomenclature of 429
ERBB2 in cBioPortal) and PIK3CA mutations were selected. Within the selected subset, samples 430
which had both the HER2 and PIK3CA allele frequency data were separated and analyzed. 431
Transwell Assays 432
PIK3CA mutant cells were seeded into the wells of transwell plates (VWR, Radnor, PA). 433
Meanwhile, HER2 or WT cells were seeded onto transwell inserts with a pore size of 0.4 µM. 434
After allowing the cells on the insert to settle, the inserts were transferred into the transwell 435
plates. Assay media was added such that cells on the insert were covered on the apical and 436
basolateral sides. Media was replenished periodically. After 7-10 days, inserts were removed and 437
both the inserts and the plated cells were trypsinized and counted using a Beckman Coulter 438
counter. 439
Immunofluorescent staining of in vitro co-cultures 440
A 1:1 mixture of fluorescent HER2 cells (described above) and non-fluorescent PIK3CA cells 441
(MCF-10A background) were plated onto Nunc™ Lab-Tek™ Chamber Slides (ThermoFisher). 442
Co-cultures were grown for 7 days. Slides were fixed with 4% paraformaldehyde and stained 443
using ab2413 anti-fibronectin primary (Abcam) and Donkey anti-rabbit Alexa Flour 405 444
secondary (Abcam). Prior to imaging, Fluorescence Mounting Media was added to each slide 445
(https://nic.med.harvard.edu/resources/media/). Images were taken using a Nikon C1 Confocal 446
Microscope. 447
448

3D Matrigel Assay and Imaging 449
Fluorescent HER2 and PIK3CA MCF-10A background cells (described above) were plated into 450
multi-well plates containing Geltrex LDEV-Free Reduced Growth Factor Basement Membrane 451
Matrix (Thermo Fisher) and assay media as previously described(42). Cells were grown for 12 452
days and then imaged. Images were taken using a Nikon C1 Confocal Microscope and image 453
processing was performed using ImageJ (https://imagej.nih.gov/ij/). 454
455
Statistics 456
Statistical analyses were performed using the GraphPad Prism 5 software (GraphPad Software, 457
CA). Unpaired T-test, one-way ANOVA, and two-way ANOVA functions were used in the 458
appropriate contexts to analyze our results. All averages and error bars represent the mean and 459
S.E.M. of each group. Significance denoted by “*” indicates p < 0.05, “**” indicates p < 0.01 460
and “***” indicates p<0.001. 461
462
Study approval 463
All animal care and experimental protocols was approved by the Institutional Animal Care and 464
Use Committee (IACUC) of Johns Hopkins University. All human samples were obtained from 465
prior studies conducted in accordance with the IRBs of Vanderbilt University Medical Center. 466
467
Author contributions: 468 469 S.K., I.W., and B.H.P. conceived and designed research. B.H.P. and S.C. supervised the project. 470 S.K., I.W., L.D., D.C. developed protocols and designed experiments. S.K., I.W., L.D., D.H.S., 471 M.R., M.P., R.B., B.D., S.R. carried out experiments. P.G.-E., V.S., M.E.S. carried out 472 immunohistochemical staining of patient tumors. S.K., S.C. carried out in silico data analysis. 473 S.K., I.W., L.D., S.C., B.H.P. analyzed and interpreted data. J.D., K.C., K.K.S., B.B., D.J.Z., 474

H.Y.W., P.J.H. contributed to data interpretation and troubleshooting discussions. S.K., I.W., 475 S.C., B.H.P. wrote the manuscript with comments from all co-authors. 476 477
Acknowledgements 478
This work was supported by: MICTP T32 (2T32CA009592-31A1) (B.D.), The American Cancer 479 Society 131356-RSG-17-160-01-CSM and The National Cancer Institute/National Institute of 480 Health RO1CA211695-01A1 (P.J.H.), as well as The Breast Cancer Research Foundation, 481 Komen Foundation, NIH CA214494, CA194024 (B.H.P.). We would also like to thank and 482 acknowledge the support of The Canney Foundation, the Marcie and Ellen Foundation, Amy and 483 Barry Baker and the Vanderbilt-Ingram Cancer Center support grant (NIH CA068485) and 484 Breast Cancer SPORE (NIH CA098131). The authors would like to acknowledge the American 485 Association for Cancer Research and its financial and material support in the development of the 486 AACR Project GENIE registry, as well as members of the consortium for their commitment to 487 data sharing. Interpretations are the responsibility of study authors. We dedicate this work to the 488 loving memory of Dr. David Chu, who continues to inspire us to find cures for all cancers. 489
490
491
References 492 493 1. Siegel RL, Miller KD, and Jemal A. Cancer statistics, 2019. CA Cancer J Clin. 2019;69(1):7-494
34. 495 2. Yates LR, et al. Subclonal diversification of primary breast cancer revealed by 496
multiregion sequencing. Nat Med. 2015;21(7):751-9. 497 3. Janiszewska M, et al. In situ single-cell analysis identifies heterogeneity for PIK3CA 498
mutation and HER2 amplification in HER2-positive breast cancer. Nat Genet. 499 2015;47(10):1212-9. 500
4. Gerstung M, et al. The evolutionary history of 2,658 cancers. Nature. 501 2020;578(7793):122-8. 502
5. Salcedo A, et al. A community effort to create standards for evaluating tumor subclonal 503 reconstruction. Nat Biotechnol. 2020;38(1):97-107. 504
6. Mukohara T. PI3K mutations in breast cancer: prognostic and therapeutic implications. 505 Breast Cancer (Dove Med Press). 2015;7:111-23. 506
7. Arteaga CL, and Engelman JA. ERBB receptors: from oncogene discovery to basic science 507 to mechanism-based cancer therapeutics. Cancer Cell. 2014;25(3):282-303. 508
8. Cerami E, et al. The cBio cancer genomics portal: an open platform for exploring 509 multidimensional cancer genomics data. Cancer Discov. 2012;2(5):401-4. 510
9. Gao J, et al. Integrative analysis of complex cancer genomics and clinical profiles using 511 the cBioPortal. Sci Signal. 2013;6(269):pl1. 512

10. Zabransky DJ, et al. HER2 missense mutations have distinct effects on oncogenic 513 signaling and migration. Proc Natl Acad Sci U S A. 2015;112(45):E6205-14. 514
11. Wu M, Pastor-Pareja JC, and Xu T. Interaction between Ras(V12) and scribbled clones 515 induces tumour growth and invasion. Nature. 2010;463(7280):545-8. 516
12. Inda MM, et al. Tumor heterogeneity is an active process maintained by a mutant EGFR-517 induced cytokine circuit in glioblastoma. Genes Dev. 2010;24(16):1731-45. 518
13. Calbo J, et al. A functional role for tumor cell heterogeneity in a mouse model of small 519 cell lung cancer. Cancer Cell. 2011;19(2):244-56. 520
14. Cleary AS, Leonard TL, Gestl SA, and Gunther EJ. Tumour cell heterogeneity maintained 521 by cooperating subclones in Wnt-driven mammary cancers. Nature. 522 2014;508(7494):113-7. 523
15. Marusyk A, Tabassum DP, Altrock PM, Almendro V, Michor F, and Polyak K. Non-cell-524 autonomous driving of tumour growth supports sub-clonal heterogeneity. Nature. 525 2014;514(7520):54-8. 526
16. Zhang M, et al. Intratumoral heterogeneity in a Trp53-null mouse model of human 527 breast cancer. Cancer Discov. 2015;5(5):520-33. 528
17. Franco OE, et al. Altered TGF-alpha/beta signaling drives cooperation between breast 529 cancer cell populations. FASEB J. 2016;30(10):3441-52. 530
18. Soule HD, et al. Isolation and characterization of a spontaneously immortalized human 531 breast epithelial cell line, MCF-10. Cancer Res. 1990;50(18):6075-86. 532
19. Gustin JP, et al. Knockin of mutant PIK3CA activates multiple oncogenic pathways. Proc 533 Natl Acad Sci U S A. 2009;106(8):2835-40. 534
20. Ignatoski KM, Lapointe AJ, Radany EH, and Ethier SP. erbB-2 overexpression in human 535 mammary epithelial cells confers growth factor independence. Endocrinology. 536 1999;140(8):3615-22. 537
21. Dalton WB, et al. Hotspot SF3B1 mutations induce metabolic reprogramming and 538 vulnerability to serine deprivation. J Clin Invest. 2019;129(11):4708-23. 539
22. Lauring J, et al. Knock in of the AKT1 E17K mutation in human breast epithelial cells does 540 not recapitulate oncogenic PIK3CA mutations. Oncogene. 2010;29(16):2337-45. 541
23. Soule HD, Vazguez J, Long A, Albert S, and Brennan M. A human cell line from a pleural 542 effusion derived from a breast carcinoma. J Natl Cancer Inst. 1973;51(5):1409-16. 543
24. Beaver JA, et al. PIK3CA and AKT1 mutations have distinct effects on sensitivity to 544 targeted pathway inhibitors in an isogenic luminal breast cancer model system. Clin 545 Cancer Res. 2013;19(19):5413-22. 546
25. Pierschbacher MD, and Ruoslahti E. Cell attachment activity of fibronectin can be 547 duplicated by small synthetic fragments of the molecule. Nature. 1984;309(5963):30-3. 548
26. Moon C, Han JR, Park HJ, Hah JS, and Kang JL. Synthetic RGDS peptide attenuates 549 lipopolysaccharide-induced pulmonary inflammation by inhibiting integrin signaled MAP 550 kinase pathways. Respir Res. 2009;10(1):18. 551
27. Li F, Redick SD, Erickson HP, and Moy VT. Force Measurements of the α5β1 Integrin–552 Fibronectin Interaction. Biophysical Journal. 2003;84(2):1252-62. 553
28. Zhu X, and Assoian RK. Integrin-dependent activation of MAP kinase: a link to shape-554 dependent cell proliferation. Mol Biol Cell. 1995;6(3):273-82. 555

29. Chen Q, Kinch MS, Lin TH, Burridge K, and Juliano RL. Integrin-mediated cell adhesion 556 activates mitogen-activated protein kinases. J Biol Chem. 1994;269(43):26602-5. 557
30. Lavoie JN, L'Allemain G, Brunet A, Muller R, and Pouyssegur J. Cyclin D1 expression is 558 regulated positively by the p42/p44MAPK and negatively by the p38/HOGMAPK 559 pathway. J Biol Chem. 1996;271(34):20608-16. 560
31. Weber JD, Raben DM, Phillips PJ, and Baldassare JJ. Sustained activation of extracellular-561 signal-regulated kinase 1 (ERK1) is required for the continued expression of cyclin D1 in 562 G1 phase. Biochem J. 1997;326(Pt 1):61-8. 563
32. Consortium APG. AACR Project GENIE: Powering Precision Medicine through an 564 International Consortium. Cancer Discov. 2017;7(8):818-31. 565
33. Giltnane JM, et al. Genomic profiling of ER(+) breast cancers after short-term estrogen 566 suppression reveals alterations associated with endocrine resistance. Sci Transl Med. 567 2017;9(402):eaai7993. 568
34. Pereira B, et al. The somatic mutation profiles of 2,433 breast cancers refines their 569 genomic and transcriptomic landscapes. Nat Commun. 2016;7:11479. 570
35. Curtis C, et al. The genomic and transcriptomic architecture of 2,000 breast tumours 571 reveals novel subgroups. Nature. 2012;486(7403):346-52. 572
36. Axelrod R, Axelrod DE, and Pienta KJ. Evolution of cooperation among tumor cells. Proc 573 Natl Acad Sci U S A. 2006;103(36):13474-9. 574
37. Vasaturo F, et al. Comparison of extracellular matrix and apoptotic markers between 575 benign lesions and carcinomas in human breast. Int J Oncol. 2005;27(4):1005-11. 576
38. Hao X, et al. Differential gene and protein expression in primary breast malignancies and 577 their lymph node metastases as revealed by combined cDNA microarray and tissue 578 microarray analysis. Cancer. 2004;100(6):1110-22. 579
39. Woodward TL, Mienaltowski AS, Modi RR, Bennett JM, and Haslam SZ. Fibronectin and 580 the alpha(5)beta(1) integrin are under developmental and ovarian steroid regulation in 581 the normal mouse mammary gland. Endocrinology. 2001;142(7):3214-22. 582
40. Young CD, et al. Activating PIK3CA Mutations Induce an Epidermal Growth Factor 583 Receptor (EGFR)/Extracellular Signal-regulated Kinase (ERK) Paracrine Signaling Axis in 584 Basal-like Breast Cancer. Mol Cell Proteomics. 2015;14(7):1959-76. 585
41. Sanjana NE, Shalem O, and Zhang F. Improved vectors and genome-wide libraries for 586 CRISPR screening. Nat Methods. 2014;11(8):783-4. 587
42. Debnath J, Muthuswamy SK, and Brugge JS. Morphogenesis and oncogenesis of MCF-588 10A mammary epithelial acini grown in three-dimensional basement membrane 589 cultures. Methods. 2003;30(3):256-68. 590
591 592 Main Figure Legends 593 594

595 596 Fig. 1: Interactions between HER2 and PIK3CA mutant cells result in altered, non-random 597 growth dynamics. (a) Co-culture of MCF-10A cells containing a HER2 mutation and those 598 containing a PIK3CA mutation. Genomic DNA was collected upon confluency for analysis by 599 droplet digital PCR (ddPCR). Artificial mixes were obtained as described in Supp. Fig. S1. The 600 fraction of HER2 cells was plotted as the mean ± s.e.m. (n=3). (b) Co-culture of MCF-10A WT 601 cells and those containing a PIK3CA mutation carried out as described in (a). (c) Representative 602 images of co-cultures using fluorescently labeled HER2 mutants (red) and PIK3CA mutants 603 (green) and (d) co-cultures using fluorescently labelled MCF-10A WT cell (red) and PIK3CA 604 mutants (green). Top image is early passage (approx. 10 days) and bottom image is late passage 605 (approx. 40 days for MCF-10A and 25 days for MCF-7). Scale = 400 µM. (e) Co-culture assays 606
of MCF-7 background cells containing a HER2 mutation or (f) corrected WT MCF-7 cells, as 607 performed in (a). (g) Representative images of co-cultures using fluorescently labeled MCF-7 608 HER2 mutants (red) and a PIK3CA mutants (green) and (h) co-cultures using fluorescently labeled 609 MCF-7 WT cells (red) and PIK3CA mutants. Scale = 400 µM. (i) Co-cultures of HER2 and 610 PIK3CA mutant cells with skewed starting ratios in the MCF-10A and (j) MCF-7 backgrounds. 611 Cellular fractions were determined by ddPCR (Mean ±s.e.m., n=2). (k) Xenograft study of MCF-612 7 panel (WT, HER2, and PIK3CA mutation). Subcutaneous injection of athymic nude mice with 613 estrogen supplementation. Cells were inoculated individually (n=5) and in co-inoculations of 614 HER2:PIK3CA or WT:PIK3CA (n=10). ***p < 0.001 by two-way ANOVA followed by 615 Bonferroni multiple comparisons test. (l) Representative fluorescent images of cryosectioned co-616 inoculated tumors. Left, WT (red) and PIK3CA mutant (green); Right, HER2 mutant (red) and 617 PIK3CA mutant (green). Scale = 400 µM. 618 619 620 621 622 623 624
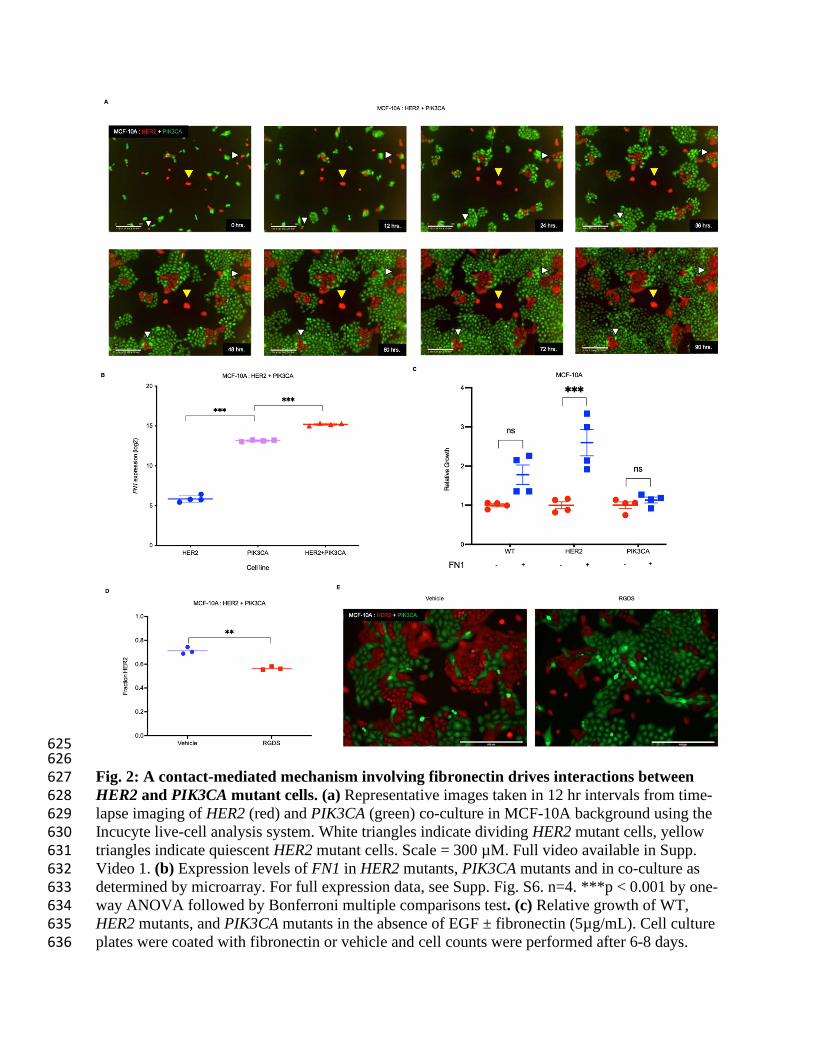
625 626 Fig. 2: A contact-mediated mechanism involving fibronectin drives interactions between 627 HER2 and PIK3CA mutant cells. (a) Representative images taken in 12 hr intervals from time-628 lapse imaging of HER2 (red) and PIK3CA (green) co-culture in MCF-10A background using the 629 Incucyte live-cell analysis system. White triangles indicate dividing HER2 mutant cells, yellow 630 triangles indicate quiescent HER2 mutant cells. Scale = 300 µM. Full video available in Supp. 631 Video 1. (b) Expression levels of FN1 in HER2 mutants, PIK3CA mutants and in co-culture as 632 determined by microarray. For full expression data, see Supp. Fig. S6. n=4. ***p < 0.001 by one-633 way ANOVA followed by Bonferroni multiple comparisons test. (c) Relative growth of WT, 634 HER2 mutants, and PIK3CA mutants in the absence of EGF ± fibronectin (5µg/mL). Cell culture 635 plates were coated with fibronectin or vehicle and cell counts were performed after 6-8 days. 636

n=4. ***p < 0.001 by one-way ANOVA followed by Bonferroni multiple comparisons test. (d) 637 HER2:PIK3CA co-cultures were treated with vehicle or an RGDS competitive inhibitor of 638 fibronectin:integrin binding. Cellular fraction was determined by ddPCR. n=3. **p < 0.01 by 639 one-way ANOVA followed by Bonferroni multiple comparisons test. (e) Representative images 640 from each condition are shown (HER2 (red) PIK3CA (green)). 641 642 643 644 645 646 647 648 649 650 651 652 653 654 655

656 Fig. 3: ECM protein fibronectin is a necessary mediator of HER2:PIK3CA clonal dynamics 657 in co-culture. (a,b) Sanger sequencing traces and western blots demonstrating the knockout of 658 FN1 in PIK3CA mutants in (a) MCF-10A and (b) MCF-7 backgrounds Red arrows indicate 659 alterations. (c) Imaging of MCF-10A PIK3CA mutant cells with knocked-out fibronectin and 660 HER2 mutant cells with WT fibronectin in co-culture demonstrating differences in cellular 661 morphology in the absence of FN1. Identification of HER2 vs PIK3CA cells was accomplished 662 using fluorescence imaging of HER2 cells tagged with tdTomato (inset). Scale =150 µM. (d) Co-663 culture of HER2 mutant cells with FN1 knock-out PIK3CA mutants in the MCF-10A and (e) 664 MCF-7 backgrounds. Cellular fraction determined by ddPCR, n=2. Representative fluorescent 665 images at early and late passage shown (HER2 (red), FN1 knock-out PIK3CA (untagged)). Early 666 and late passages indicate 7 and 45 days, respectively for MCF-10As and 16 and 24 days for 667 MCF-7s. Scale = 800 µM. 668

669 670 Fig. 4: Clinical data from breast cancer patients corroborates HER2:PIK3CA clonal 671 dynamics. (a) Schematic of the patient selection criteria for the cBioPortal-based analysis of the 672 GENIE cohort v7.0. (b) Allelic frequencies of HER2 (red) and PIK3CA (green) in breast tumors 673 which had a co-occurrence of HER2 and PIK3CA mutations, sorted by HER2 allele frequency. 674 The gray box indicates patients with HER2 allele frequency < 0.5. For further information on 675 patient samples, see Supplementary Table 1. 676

677 Fig. 5: Clinical data from breast cancer patients corroborates the role of fibronectin. 678 (a) Immunohistochemical staining of small patient cohort for fibronectin in human breast tumors 679 with and without PIK3CA alterations. Tumors with alterations in PIK3CA are shown in blue and 680 those with high fibronectin are shown in red. Unaltered tumors are shown in grey. (b) 681 Representative images of fibronectin IHC in human breast tumors with a PIK3CA (left) 682 alteration and without a PIK3CA alteration (right). Scale = 100 µM. (c) Schematic of patient 683 selection and analysis of the METABRIC dataset using cBioPortal. (d) Quantification of 684 PIK3CA alterations and alterations in other genes involved in the PI3K pathway, in breast tumors 685 with increased fibronectin as analyzed by cBioPortal using the METABRIC dataset. 686


![Personalized market response analysis for a wide variety ...uses the framework of hierarchical Bayes modeling [30]. Details are described in Sect. 3.1. Heterogeneity models can ...](https://static.fdocuments.us/doc/165x107/5f0f89417e708231d444a649/personalized-market-response-analysis-for-a-wide-variety-uses-the-framework.jpg)