
Reservations and the Politics of Fear - Faculty of...
59
Reservations and the Politics of Fear Siwan Anderson and Patrick Francois ∗ May 2017 Abstract Reserving political office for members of a particular, usually traditionally disadvantaged, group is a common form of political quota in many parts of the world. We first show that if political dysfunction is due to “politics of fear” factors that make individuals support members of their own group for political office (despite their incompetence or venality), then such quotas may improve governance. But this does not occur if the reserved groups are either extremely powerful, or extremely weak. We measure governance outcomes and group strength in rural Indian villages. We show that political office reservations in these villages do indeed improve governance, but only when allocated to groups that are neither too strong or too weak. ∗ CIFAR and University of British Columbia, Vancouver School of Economics, [email protected], [email protected]. The authors would like to thank our collaborators for much of the work in this project – Ashok Kotwal and Ashwini Kulkarni. In addition to their input, we have also benefited from discussions with James Fearon, Francesco Trebbi, Matilde Bombardini, Daron Acemoglu, Torsten Persson, Debraj Ray, E. Somanathan, and seminar participants at the Canadian Institute for Advanced Research meetings Toronto, Aix-Marseilles School of Economics, Monash University, ISI Delhi, UBC, BREAD Stanford Meetings, Hong Kong University and Hong Kong University of Science and Technology. 1
Transcript of Reservations and the Politics of Fear - Faculty of...
Reservations and the Politics of Fear
Siwan Anderson and Patrick Francois∗
May 2017
Abstract
Reserving political office for members of a particular, usually traditionally disadvantaged, group is acommon form of political quota in many parts of the world. We first show that if political dysfunctionis due to “politics of fear” factors that make individuals support members of their own group forpolitical office (despite their incompetence or venality), then such quotas may improve governance.But this does not occur if the reserved groups are either extremely powerful, or extremely weak. Wemeasure governance outcomes and group strength in rural Indian villages. We show that political officereservations in these villages do indeed improve governance, but only when allocated to groups that areneither too strong or too weak.
∗CIFAR and University of British Columbia, Vancouver School of Economics, [email protected],[email protected]. The authors would like to thank our collaborators for much of the work in this project –Ashok Kotwal and Ashwini Kulkarni. In addition to their input, we have also benefited from discussions with JamesFearon, Francesco Trebbi, Matilde Bombardini, Daron Acemoglu, Torsten Persson, Debraj Ray, E. Somanathan, and seminarparticipants at the Canadian Institute for Advanced Research meetings Toronto, Aix-Marseilles School of Economics, MonashUniversity, ISI Delhi, UBC, BREAD Stanford Meetings, Hong Kong University and Hong Kong University of Science andTechnology.
1
1 Introduction
Reserving political office for members of traditionally marginalized groups has sometimes been found
to tilt governance in the interests of those groups;1 as seems a priori reasonable, and as intended by
reservation advocates. Though there are fewer reasons to expect reservations to impact the overall quality
of governance, the evidence to date suggests either non-discernible effects, or negative ones.2 This might
be because reservations replace seasoned politicians with neophytes, or less well trained leaders, and such
leaders lack the skills required to shephard through good policies. Or it may be because reservations tend
to replace leaders drawn from groups that are numerous among constituents, with those from groups that
are thin on the ground; the latter, it is hypothesized, having less stake in ensuring the provision of the
public good that is good governance.3
We study the impact of reservations on governance quality here. In contrast to previous studies, our
focus in data collection was overall governance quality at the village level. And we accordingly obtained
1Effects have been found on policies, public goods, provision of targeted benefits and on measured poverty. Positive effectson the receipt of targeted benefits have been found for reserved groups in Besley, Pande and Rao (2008). Chattopadhyay andDuflo (2008) find that reserved women leaders seem to spend more on projects that are relatively highly prioritized by femalevillage members. Bardhan, Mookherjee and Torrado (2010) find easier access to credit results after a group based reservationto SC/ST. Pande (2003) finds benefits at the state legislature. Dunning and Nilekani (2013) find small (zero) distributiveeffects of reservations for Pradhan in Karnataka, Rajasthan and Bihar. This is for SC/ST reservations, which are allocatedbased on population frequencies. To overcome the confounding identification problem they run an RD and confirm with thatthere are no effects. This is in contrast to much of the previous literature – well discussed there. Their argument is based onthe saliency of political parties that are essential in providing resources for these clientelist structures. The parties allow longterm focused politicians to make cross-caste cutting alliances that overcome the quotas and allow the parties to smoothe outthe discontinuities that would arise through the allocation of quotas. Hence, there are no effects in terms of receiving targetedbenefits due to caste membership with a quota. But, interestingly, there are positive effects to political party membership.Sharing the party of the Pradhan does affect access. Gair and Naresh (2015) argue that the null finding is due to a lackof power in detecting a reasonably sized effect, and cautions against interpreting this as a precise zero. Chin and Prakash(2010) find mixed effects on poverty for reserved seats state assemblies. Zeigfeld and Auerbach (2016) find that quotas reducedelectoral competition in Indian contexts – villages and higher levels, (not surprisingly) fewer people contest. Mitra (2015)develops a theoretical model and provides support for considering heterogeneous effects of mandated political representation.The elites of such groups may benefit more than the rank-and-file, who may actually be made worse off. Jensensius (2015)finds very weak long term effects for SCs. Bhavnani (2016) finds no positive representation effect of SC quotas after the quotaexpires. It is possible that effects could extend far beyond the period of reservation. Beaman et. al (2009) showed that byexposing constituents to women leaders, negative stereotypes biased against women as leaders could be partially reversed.
2Villages with reserved Pradhans are less likely to win a “clean” village award, Lamba and Spears (2013). Leader “quality”usually measured by education, has been found to decline in many contexts – overall for both women and SC resevationsby Chattopadhyay and Duflo (2004) for most observables (wealth, education, experience) see also Deininger et. al. (2013).Also see Banerjee, Duflo, Imbert, Pande (2013) who report that after a female reservation there are more contested electionsbecause the leader is less likely to stand again. But such reservations, by inducing more inexperienced candidates to standand sometimes win seem to have direct negative effects on employment in public works programs. Gajwani and Zhang (2015)found negative effects of reserved female village presidents on the buidling of schools and roads with supporting evidencesuggesting it was due to their poorer connections with higher level officials, and systemic knowledge.
3See Munshi and Rosenzweig (2016) for a formal model of this process and evidence supportive of such effects for reservationof representation at the village neighbourhood level.
2
detailed information about such quality. The data we collected to do this features uniquely detailed measures
of governance outcomes in villages in the Indian state of Maharashtra. It was obtained from a three-fold
analysis comprising: household surveys, village government surveys, and the official accounts of villages.
We will argue here that in a divided society, like that of village India, where politics is organized
along identity lines such as ethnicity, tribe or caste as is the case there, there are reasons to expect that
reservations could improve overall governance quality.4 This depends on the pre-existence of a “politics of
fear” problem, as coined by Padro-i-Miquel (2007), which can be ameliorated by political reservations.
Padro-i-Miquel (2007) formally models the politics of fear to explain the pervasiveness of poor governance
in the divided societies of Sub-Saharan Africa. Such divisions also apply to the divided politics of Indian
villages. We extend and modify this model to allow for the institution of political reservations that restrict
the paramount village leadership position to individuals from a particular caste in a way that is randomly
allocated across villages, as mandated by Indian law.5
This model generates precise predictions as to when political reservations should be expected to improve
governance, and when not. It generates an overall pattern of effect (i.e., unconditional) that is consistent
with the zero or even mildly negative overall effects reported in the previous literature. It also generates a
conditional predicted pattern of effect that is non-monotonic in the size of the group from which the village
leader is drawn when leadership is reserved. If the group is small, so small that it ordinarily would not be
able to contest for power, then reservations have no effect. If it is large enough to contest power, but not
so large as to be guaranteed it, then reserving the leadership position for the group generates a positive
impact on overall governance. However, if the group is so large that it is almost certain to provide the
leadership position irrespective of reservations, then reserving the position for the group again has no effect
on governance quality. Such a non-monotonic pattern of the effects of reservations is an extremely robust
aspect of the data.
To our knowledge this is the first paper to demonstrate that “politics of fear” reasoning implies a
potentially beneficial (but non-monotonic) pattern of benefits to reservations. This is also the first paper to
explore such an effect empirically, and again to our knowledge, the first paper to show any positive impact
4The contrast is with polities where candidate contest is more programmatic in nature, such as over policy, economicinterests or even ideology for example.
5Though the precise way that such reservations are implemented varies by state.
3
of political reservations on overall governance quality (and not just distributionally for the targeted group)
in Indian villages.6
The politics of fear reasoning applies in divided societies – i.e., those where politics is organized along
identity lines, and where the distribution of benefits to groups organized along such lines is of paramount
interest to constituents. In such settings a type of “incumbency advantage” that a group’s existing leader
enjoys vis-a-vis a challenger from within the group, plays a key role. The group’s hold on power is hy-
pothesized to be more likely to persist if their current leader is able to re-contest power, i.e., remains the
supported candidate of the group, rather than being replaced by a challenger who will then contest. The
larger the chances of the group winning power with the current incumbent relative to a replacement chal-
lenger, the greater the incumbent’s hold on power. As Padro-i-Miquel (2007) points out, this creates a type
of kleptocratic rent for the incumbent, allowing her to govern poorly, up to a point, while still receiving the
support of group members. A similar logic underlies the support of leaders from all other groups, and poor
overall governance is the predicted outcome regardless of which groups ascend to power.
We extend this framework to show that politicial reservations in such a context are able to ameliorate
such effects and hence improve governance, but depend on the reserved group’s proportionate size in the
village. By reserving the leadership position for a representative of the group, the group no longer fears
losing the election to an outsider. The reserved group does not then need to rally behind a poorly governing
incumbent leader who will raise their chances of being in power, as power is assured. This allows the
leadership to be freely contested and raises – at least temporarily – governance quality.
Proportionate size matters for how reservations work because power depends on size. If a group is so
small that it has almost no capacity to retain the leadership, even when retaining an incumbent, then the
incumbency advantage is small. Reservations have little effect. However, as the group increases proportion,
so too does the incumbency advantage of the leader, and his kleptocratic rent. These are dissipated via the
contested leadership race that occurs when the group has the safety of reservations. But since effects of
proportionate size on kleptocratic rents are non-monotonic so too are the effects of reservations. A reserved
6As mentioned in the footnote above, many studies find null effects of reservations on the reserved group. We similarly findthat for overall governance quality too, not just with respect to effects reported by the reserved group. This changes when wecondition in a way that the theory predicts we should. An exception that also finds a positive overall effect is Besley et. al.(2016). They report, in the context of Swedish local politics, that gender quotas can increase the competence of the politicalclass by reducing the share of mediocre men in office.
4
leader drawn from a group that is larger still, so large as to be essentially guaranteed leadership even absent
reservations, will have no positive effect of governance. A group so large that it never fears losing the
leadership position in an open contest will not have a leader enjoying kleptocratic rents in the first place.
Reservations change nothing then.
This non-monotonicity of the effects of reservations with respect to group size is a not-previously hy-
pothesized, and not previously tested implication of the “politics of fear” reasoning, and it is confirmed in
the data. Reservations for groups that are almost guaranteed to provide the leader, and groups that are
so small as to rarely be able to attain leadership register no improvement in governance in Maharashtrian
villages. Only reservations for groups that are able to contest, but not guaranteed the leadership, raise
governance quality. This finding strongly suggests the pertinence of politics of fear reasoning in a setting
far afield from its original application.
Two recent papers have analyzed how group size affects leadership quality in the Indian context where
caste/jati based voting is the norm. Banerjee and Pande (2009) argue that larger groups (proportionately)
end up selecting worse leaders. Even a terrible representative can get elected to power when a group is large;
parochialism swamps competence because there are, in all groups, voters who simply prioritize identity over
competence, and the larger a group the greater the number of those voters. A small group, in contrast, has
to put someone forward of more broad appeal to have any chance of election. The model predicts that the
greater the degree of ethnic identification in determining voting, the worse will be governance. However,
such increases in ethnicitization should have less of an effect when groups are close in size – as competition
mitigates the effects of increased parochialism. However when the differences in group size are so large that
one group is almost guaranteed to win, then again increasing ethnicitization should have no effect. They
find support for this non-monotonicity using corruption as a measure of politician quality, for district level
representatives in Uttar Pradesh.
Munshi and Rosenzweig (2015) using India wide ward level data use political reservations to estimate
the effect on candidate quality of group size in village ward representatives. Similar to the politics of fear
model of Padro-i-Miquel (2007) that we will extend, there is a tension between competence and distribution
benefits for a group to consider when selecting a representative. They theoretically establish a threshold on
sub-caste (jati) size above which (locally) a group is able to discipline and commit their leader to a mix of
5
policies. They estimate this threshold to be at 50% of the ward population, and they empirically identify
this using reservations allocated within wards (over ward representatives) in contrast to Pradhans across
the village as we consider here. They use reservations to identify group size effects in a setting where there
is no efficiency rationale for reservations to interact with group size otherwise. They find that larger groups
do seem to select higher quality candidates.
In contrast, we only focus on Pradhan reservations in the state of Maharashtra. And we consider the
effect of reservations per se when interacted with group size. We find marked efficiency (governance quality)
gains due to reservations, in a way that is consistent with the politics of fear model. Particular institutional
features thus explain our contrasting findings and are in fact what allow us to explore the size based
predictions of the politics of fear model that we develop. Many of the caste based Pradhan reservations in
this state fall to OBC groups with Jatis that are frequently a large proportion of the village population;
unlike SCs or STs or other states where OBC reservationss are capped.7 The paper proceeds as follows:
Section 2 develops the model and its empirical predictions. Section 3 describes the data. Section 4 tests
the predictions of the model. Section 5 concludes.
2 The Model
2.1 Preliminaries
In terms of political organization in rural villages of Maharahstra the relevant organizing group is the
jati or sub-caste. Individual identities in village politics are strongly linked to their sub-caste identity. We
will thus use the terms “political group”, “jati” and “sub-caste” interchangeably here, and it will be used
analogously to “ethnic group” in the model of Padro-i-Miquel (2007).8
There are reasons to expect Pradhan reservations to have effects in our context. Firstly, unlike many
other states in India, Prahdans in Maharashtrian villages are powerful. They are the only paid members of
the Panchayat (village government), they wield considerable influence and autonomy, and villagers in our
7Although the law mandates reservations for local political office to traditionally disadvantaged groups, there is a largeamount of discretion by state in how these are implemented.
8This will create some difficulties when we turn to the empirical estimation as reservations are allocated at a broad castegrouping level that contains many sub-castes. We pay particular attention to this in Section 4 of the paper.
6
surveys typically reported the Pradhans to be the de facto as well as de jure village leaders. We collect
numerous measures that we will use to pick up the effects of Pradhan reservations in our villages. One
set of measures were designed to represent intra-group distributional effects of reservations. Did having a
Pradhan reserved to be from your own caste group (jati) affect the allocation of resources to your group vis
a vis the others?9 A second set of measures were designed to reflect the overall level of governance quality
in the villages. The key governance outcome variables that we use, in line with Anderson, Francois, Kotwal
(2015), are described in Section 3.
We first build a variant of Padro-i-Miquel’s (2007) politics of fear model. His model rests on three key
assumptions. 1. A ruler needs the support of his ethnic group in an ethnically divided society. 2. Ruler
replacement leads to political instability and increases the likelihood of a switch in power between groups.
3. Taxation can only vary by economic activity while transfers can directly target groups.
2.1.1 Distinct modeling assumptions for Maharashtra
Though we will utilize similar assumptions in our model here, as they are germane to the Maharashtrian
setting, most will be slightly modified.10 All funds are distributed from higher levels of governance, and jatis
tend to live in neighbourhoods that are geographically distinct. So the key form of inter-group discretionary
spending is over the allocation of expenditures across the differing groups – for example, the construction
and maintenance of local public goods, or the facilitation of own group member access to targeted federal
and state benefits. To capture this, we will allow for discretion over the allocation of benefits towards
members of a group.
The benefits to leaders from the “politics of fear” in Padro-i-Miquel (2007) are slightly different in our
setting too. In his model, a leader extracts resources from his supporter group, but extracts even more from
the opposition. In our villages, there is no opportunity for leaders to predate villagers via taxation. Instead,
a more likely consequence of leader moral hazard is reduced effort to improve village resource allocations
from higher levels of government, and fewer programs.11 So we assume all leaders obtain the same sized
9Table A2 in the appendix shows that individuals do indeed report benefiting disproportionately if their own jati memberis the Pradhan.
10The taxation part of Assumption 3 is entirely dispensed with. In Maharshtra the Panchayat has essentially no taxationdiscretion. Taxes levied are house taxes, water taxes and stamp duty, and transfers are not funded out of these but insteadcentrally provided.
11This is consistent with an overall perception on the part of villagers that they are poorly governed. On average, few of the
7
office rents, and instead of modeling the differential benefits to the powerful leaders via consumption, we
assume this can reduce their effort load. Having a leader who poorly governs implies less effort gets spent
working for constituents to obtain benefits, services, grants and public goods to which the village is entitled.
A key assumption of the politics of fear is that ruler replacement increases the likelihood of a switch
in power between groups. We shall maintain this. However, the replacement of a leader in Padro-i-Miquel
(2007) leads to a type of chaos, where government activity – taxes and transfers – are shut down for a while
and the leader receives zero payoffs from then on. The reason being that, in his setting, leaders can not
continue to govern without the support of the group; with this withdrawn, the government essentially stops
and the pre-announced policies of the leader are suspended. But in our setting, the village leader is in place
due to the outcome of an election, and he will remain in place until the next election when a successor will
be formally appointed. This is true whether the group has withdrawn support for the leader in the next
election or not. So we assume here that the removal of support for a leader only affects the probability that
the replacement candidate wins office relative to the probability that would have ensued for the incumbent
leader to win office had the support for him continued. It does not directly affect governance, but may
affect it through induced responses of leaders. After support is withdrawn, the leader returns back to being
a citizen of the village and remains a member of the same group.
2.2 Model Details
Time is discrete and each period represents a term of office. There are two groups (jatis) – denoted A
and B, and each group decides on a leader who will contest elections for office. If the incumbent is from
group A, and if this incumbent receives the “support” of his group, st = 1, he is reelected with probability
γA. However, the group need not support the current incumbent but may instead fall behind a replacement
candidate who is voluntarily drawn from the group.12 Doing this weakly increases the likelihood of a switch
of power to the other group. If the incumbent is “not supported”, st = 0, the group’s challenger candidate
externally mandated and funded programs are vailable. There is low program participation for villages with them, few fundscoming in to the village from higher levels of government, little effort expended by leaders to obtain funds via meeting wihthigher level officials, and few meetings with villagers themselves.
12As in Padro-i-Miquel (2007) we assume coordination within the group. Each member is small, but all act in the collectivebest interest of the group when deciding on the support decision. As in his framework, without such coordination the chancesof, and benefits to the leader from, kleptocratic rule are even greater than will be established in equilibrium.
8
wins the election with probability γa ≤ γA.13
The leader receives per period “office rents” measured as π in the utility metric. The leader in office
decides over two dimensions of policy that affect constituent (and own) welfare. The first is a distributional
component. The ruler can choose to allocate a component of spending/resources or services in a way that
can be targeted to a single caste/jati group. We denote this as being valued at η per group recipient member
in each village. Thus a member of group i in receipt of such distributional benefit from the leader receives
η in utility metric, a member of group j ̸= i receives 0.14
Leader effort determines the quality of village governance, and governance is a public good. We assume
G units of costly effort producesG units of public good. This is a “net of public good” cost of effort, implying
that the leader incurs total disutility of minus G when producing G units of public good.15 As mentioned
above, we suppress any possibility of differential citizen or group treatment for taxes. This implies that a
leader producing G = π/2 level of governance effort has the same per period utility from being in office as a
citizen (modulo distributional benefits being equivalent). This will be a useful benchmark in what follows.
Leaders can commit to their constituents the level of effort they will devote to public good creation
if elected.16 These commitments hold for the term of office; thus commitments made by a candidate in
an election held at t − 1 for office at t, hold for this candidate when becoming leader at t. If the leader
stands for reelection at t, they again promise policy that will hold for t+1 if reelected, but cannot promise
anything into future terms beyond that.17 Thus, at time t, GIt is the level of governance quality promised
by the time t incumbent when he was standing for office at time t − 1, for I = A,B or in the case of an
election that was reserved: R.13Incumbents often come from ruling families that are prominent within the sub-caste. Thus a change of incumbent means
more than a leader stepping aside for his son or brother to have a turn of leadership, or for one of his political clients to do so.In our setting this is more correclty thought of as a continuation of incumbency rule. Such a leadership group maintains thefull set of connections and power relations despite the change in leader identity. Leadership changes from a direct challengeare more pronounced than a mere change of leadership. Thus, in our empirical setting we will not attempt to discern theincumbency threatening effects via changes in the identity of the leader. Further, as will be seen, along the equilibrium path,leaders need not change under reservations for these to have large effects. The enhanced threat of leadership change, ratherthan the leadership change per se., induces improved governance with no necessary change in personnel.
14This shuts down the richer part of Padro-i-Miquel’s (2007) model concerning taxation and group specific activities, butallows us to focus on competition over the public good aspects of leadership, which our data addresses.
15So, in gross terms, the production function is such that 2 units of effort (valued linearly by the leader) produce 1 unit oflinearly valued public good.
16They can also commit to distributional transfers to their constituents, but since promised transfers always line up with expost transfer incentives, there is no need for this commitment.
17We describe what would happen with infinite commitment, or no commitment later.
9
Any citizen can challenge an incumbent at any time. If the challenger is favoured by the group, st = 0,
the challenger contests the election and the previous leader reverts back to becoming a citizen. Let 1-δ
denote the probability of death (which also acts as discounting).18
2.2.1 Reservations
With probability p a reservation occurs for the Pradhan position in a village. Assume that reservations
can only go to group A.19 Denote a reserved election at time t by RESt = 1. With probability 1 − p, the
village is not reserved; RESt = 0.
2.2.2 States and Transitions
The leader decides GI the level of governance to offer if re-elected. For notational simplicity and due
to the symmetry of agents in the model, we distinguish only between promises made by incumbents from
a group, GIt , and challengers to an incumbent GIC
t .
The economy is in one of three states: S ∈ {A,B,R} referring to the current incumbent’s leadership
position. Respectively the state is one in which either the leadership position is held by an A from an
unreserved election, a B from an unreserved election, or an A from a reserved election (state R).
The leader’s group’s strategy is denoted σI . The choice is binary, it either decides st = 1 or st = 0, after
seeing the leader’s promised GI and that of any challengers.
The probability of the leader winning again is γI if st = 1, and probability γi ≤ γI if st = 0; with
I = A or B, and i = a or b.20 Let T (σI , S, RES) denote the state transition function. Its arguments are
the support choice of the group in power, σI , the state, and the reservation status of the current election,
respectively. For example with “support”, T (1, A, 0) = γA, and without, T (0, A, 0) = γa. But if the state
is reserved then T (1, A, 1) = T (0, A, 1) = 1.
18If a leader elected at the time t election for office at t− 1 dies in the interim, we assume that he is replaced by a randomlyselected member of his own group who undertakes to provide the level of governance that the leader promised in his campaign.Groups are large so that the probability of any one individual being randomly selected is assumed to be negligible.
19Group B do not receive them; as in our data there is always an upper caste group (Marathas) who do not receivereservations.
20As in Padro-i-Miquel (2017) collective action within a group is assumed to be well organized in this model. We assumeunanimity within the group in case of ties (in favor of the incumbent). And where multiple challengers are equivalent in theiroffers, we assume the group coordinates around a single one.
10
2.2.3 Timing
Time is denoted by subscript t, and timing proceeds as follows.
0. The state is determined by the outcome of the election/reservation draw that was held the previous
period: St ∈ {A,B,R}. Nature then draws RESt = 1 with probability p and RESt = 0 with reciprocal
probability.
1. The incumbent leader chooses the level of governance they will campaign on. If St = A, or R, the
A leader announces a Gt+1. If St = B and RESt = 0, the B leader announces a Gt+1. If St = B and
RESt = 1, then the B leader cannot run again.
2. Citizens choose whether to stand to represent their group. If RESt = 1 then only an A can stand
and propose a policy Gt+1. If RESt = 0 then any A or B citizen can stand and propose a Gt+1.
3. If St = A then the A group members decide whether to “support”, st = 1, the incumbent or not,
st = 0. If St = B and RESt = 0, then B group members decide whether to support the incumbent or not.
If St = B and RESt = 1, the group does not have a support decision.
4. If RESt = 0, the incumbent is reelected with probability γI if st = 1, and probability γi ≤ γI if
st = 0; with I = A or B, and i = a or b. If RESt = 1, then the member of group A that stands is elected
leader with probability 1.
5. The winner of the election at t becomes the incumbent at t+ 1 and undertakes the Gt+1 promised
at t.
2.2.4 Markov Strategies
We solve for stationary Markov Perfect Equilibria of the game. The incumbent leader moves first
after observing the state and after nature draws reservations. The leader’s strategy maps from the pair
(St, RESt) to a policy level Gt+1 ≥ 0. For notational simplicity denote an incumbent leader of type I ′s
choice GI , I = A,B, when RES = 0. When RES = 1, only incumbent A leaders can stand again. Denote
their choice in that case by GR. Note that we dispense with time subscripts unless confusing to do so.
The challenger’s strategy maps from the state, nature’s reservation draw, and the incumbent leader’s
choice of promised governance, (S,RES,GI) to the challenger’s promised level of governance GIC .
The strategy of group I is denoted σI and its arguments are the state, nature’s reservation draw,
11
their leader’s announced policy, and the policy proposals of challengers to a support decision, respectively.
Formally for group I: σI!
(St, RESt, GI , GIC"
→ st ∈ {0, 1}.
Leader Value Functions
Let V AL (A) denote the value function for an A leader if the state is unreserved and V A
L (R), if reserved.
By the time an incumbent leader makes his policy decision for the upcoming election, the reservation
status applying to the current period election will be realized. For an A incumbent, holding power from a
previously unreserved election, the value function is computed under the optimal choices conditional upon
reservations:
V AL (A) = π −GA + η + δ
#
(1− p)maxGA
$
σA!
GA, GAC , GB, S" !
T (1, A, 0)V AL (A) + T (1, B)V A(B)
"
+!
1− σA" !
T (0, A, 0)!
GAC + η + δV A(A)"
+ T (0, B, 0)V A(B)"%
+pmaxGR
$
σA!
π −GR + η + δV AL (R)
"
+!
1− σA" !
GRC + η + δV A(R)"%
&
. (1)
The V A(I), V B(I) applying to citizens are defined below, and these are relevant here, in contrast with
Padro-i-Miquel (2007), because we assume that leaders revert back to citizenship when out of office, and
government continues to function despite a lack of support for incumbent reelections. These are both
precisely what happens in our sample villages. Note that the A leader choices anticipate the support
decision of his group, σA!
GA, GAC , GB , S"
, where we omit the arguments from σ in what follows. In
equilibrium, GA will also need to be a best response to the level of governance promised by challengers from
his own group, GAC , and from the other group, GB.
Similarly for a B leader:
V BL (B) = π −GB + η + δ (1− p)max
GB
$
σB!
T (1, B, 0)V BL (B) + T (1, A, 0)V B(A)
"
+!
1− σB" !
T (0, B, 0)!
GBC + η + δV B(B)"
+ T (0, A, 0)V B(A)"%
+ pV B(R). (2)
12
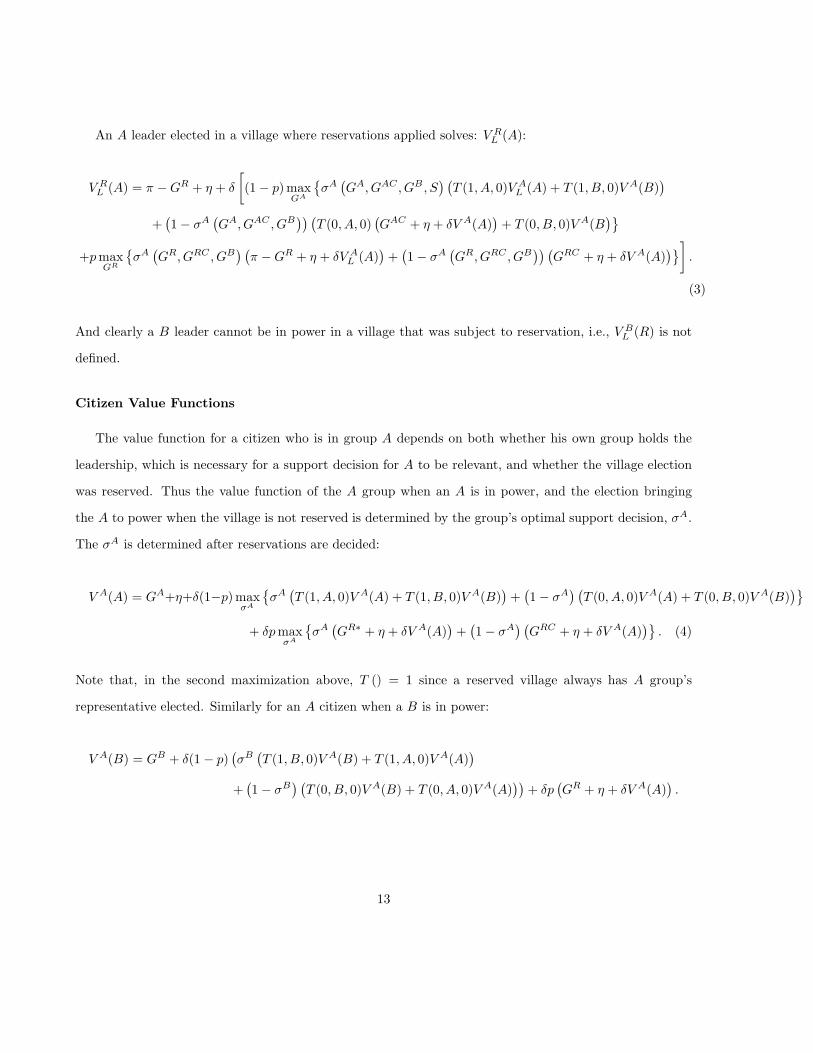
An A leader elected in a village where reservations applied solves: V RL (A):
V RL (A) = π −GR + η + δ
#
(1− p)maxGA
$
σA!
GA, GAC , GB , S" !
T (1, A, 0)V AL (A) + T (1, B, 0)V A(B)
"
+!
1− σA!
GA, GAC , GB"" !
T (0, A, 0)!
GAC + η + δV A(A)"
+ T (0, B, 0)V A(B"%
+pmaxGR
$
σA!
GR, GRC , GB" !
π −GR + η + δV AL (A)
"
+!
1− σA!
GR, GRC , GB"" !
GRC + η + δV A(A)"%
&
.
(3)
And clearly a B leader cannot be in power in a village that was subject to reservation, i.e., V BL (R) is not
defined.
Citizen Value Functions
The value function for a citizen who is in group A depends on both whether his own group holds the
leadership, which is necessary for a support decision for A to be relevant, and whether the village election
was reserved. Thus the value function of the A group when an A is in power, and the election bringing
the A to power when the village is not reserved is determined by the group’s optimal support decision, σA.
The σA is determined after reservations are decided:
V A(A) = GA+η+δ(1−p)maxσA
$
σA!
T (1, A, 0)V A(A) + T (1, B, 0)V A(B)"
+!
1− σA" !
T (0, A, 0)V A(A) + T (0, B, 0)V A(B)"%
+ δpmaxσA
$
σA!
GR∗ + η + δV A(A)"
+!
1− σA" !
GRC + η + δV A(A)"%
. (4)
Note that, in the second maximization above, T () = 1 since a reserved village always has A group’s
representative elected. Similarly for an A citizen when a B is in power:
V A(B) = GB + δ(1− p)!
σB!
T (1, B, 0)V A(B) + T (1, A, 0)V A(A)"
+!
1− σB" !
T (0, B, 0)V A(B) + T (0, A, 0)V A(A)""
+ δp!
GR + η + δV A(A)"
.
13

Note that, in this case, there are no choices for the A group since they do not have incumbency in the next
election. Reciprocally when an A is in power, B citizens have no upcoming choices and obtain:
V B(A) = GA + δ(1− p)!
σA!
T (1, A, 0)V B(A) + T (1, B, 0)V B(B)"
+!
1− σA" !
T (0, A, 0)V B(A) + T (0, B, 0)V B(B)""
+ δp!
GR + δV B(A)"
.
Finally, for a B citizen when the B group holds power we have:
V B(B) = GB + η + δ (1− p)maxσB
$
σB!
T (1, B, 0)V B(B) + T (1, A, 0)V B(A)"
+!
1− σB" !
T (0, B, 0)V B(B) + T (0, A, 0)V B(A)"%
+ δp!
GR + δV B(A)"
. (5)
We finally define V B(R) and V A(R), the value functions pertaining to citizens in already reserved villages.
These are the same as for citizens in an A controlled village except (potentially) for the current period
governance.
V A(R) = GR+η+δ(1−p)maxσA
$
σA!
T (1, A, 0)V A(A) + T (1, B, 0)V A(B)"
+!
1− σA" !
T (0, A, 0)V A(A) + T (0, B, 0)V A(B)"%
+ δpmaxσA
$
σA!
GR + η + δV A(A)"
+!
1− σA" !
GRC + η + δV A(A)"%
. (6)
V B(R) = GR + δ(1− p)!
σA!
T (1, A, 0)V B(A) + T (1, B, 0)V B(B)"
+!
1− σA" !
T (0, A, 0)V B(A) + T (0, B, 0)V B(B)""
+ δp!
GR + δV B(A)"
.
Challenger Value Functions
An A challenger in an unreserved village chooses GAC to maximize:
V AC (A) = max
GAC
$
σA!
T (1, A, 0)V A(A) + T (1, B, 0)V A(B)"
+!
1− σA" !
T (0, A, 0)!
GA −GAC + V AL (A)
"
+ T (0, B, 0)!
V A(B)""%
. (7)
14

In a reserved village he chooses GRC :
V AC (R) = max
GRC
$
σAV A(A) +!
1− σA" !
GA −GRC + V AL (A)
"%
. (8)
Similarly for a B challenger:
V BC (B) = max
GBC
$
σB!
T (1, B, 0)V B(B) + T (1, A, 0)V B(A)"
+!
1− σB" !
T (0, B, 0)!
GB −GBC + V BL (B)
"
+ T (0, A, 0)!
V B(A)""
.%
(9)
Value functions for challengers are undefined if the group does not hold the leadership:, i.e. V BC (A) and
V AC (B) are not defined.
2.2.5 Value Functions in Equilibrium
A pure strategyMPE for this game is a combination of strategies,!
GA∗, GR∗, GB∗,σA∗,σB∗, GAC∗, GBC∗, GRC∗"
where GA∗, GR∗ solve (1) and (3), GB∗ solves (2), σA∗ solves (4), σB∗ solves (5), GAC∗ solves (7), GBC∗
solves (9), and GRC∗ solves (8).
2.2.6 Challenger entry
Deposing an incumbent is costly to citizens as a non-incumbent is more likely to cede leadership to the
other group. So a challenger must offer improved governance, i.e., a challenger must offerGAC such that for an A group:
γa!
GAC∗ + η + δ!
pV A(R) + (1 − p)(γAV A(A) + (1− γA)V A(B)""
(10)
+ (1− γa)V A(B) ≥ γAV A(A) + (1 − γA)V A(B).
And GBC for a B group:
γb!
GBC∗ + η + δ!
pV B(R) + (1− p)(γBV B(B) + (1 − γB)V B(A)""
(11)
+!
1− γb"
V B(A) ≥ γBV B(B) + (1− γB)V B(A).
15

In each case, the probability of the group winning the leadership is weakly lower under the challenger: for
an A, due to γa ≤ γA. The amount γA − γa thus corresponds with what Padro-i-Miquel (2007) connotes
as due to “personal rule”; the increased stability of the group’s rule due to maintaining the incumbent.
The key feature of reservations is that since they assure that an A in the next election will win for sure,
there is no loss of stability to the group upon deposing the incumbent. This destroys personal rule. The
leader must at least offer governance quality that would obtain were they to hold the leadership for certain.
That is:
GR + η + δ!
pV R(A) + (1− p)(γAV A(A) + (1 − γA)V A(B)"
≥ V A(A). (12)
Note that this condition applies equivalently to both incumbents and challengers in reserved villages. Dif-
ferences between the two only arise due to their differences in γ, which become irrelevant under reservations.
As will be seen, condition (12) will not bind in equilibrium, so that citizens in reserved villages have strictly
higher continuation values than those having an incumbent leader who is not reserved.21
Next consider the entry condition from a challenger’s perspective. For a challenger to be willing to offer
an GAC , or GBC , he must prefer being a leader producing the respective amount to remaining a citizen.
In doing this, he internalizes the fact that by deposing an incumbent he will lower the group’s overall
probability of gaining the leadership position, and thus jeopardize his own consumption of η. For such a
challenger to enter in an unreserved election, necessarily:
γa!
π −GAC∗ + η + δ!
pV AL (R) + (1 − p)
!
γAV AL (A) + (1− γA)V A(B)
"""
(13)
+(1− γa)V A(B) ≥ γAV A(A) + (1− γA)V A(B)
γb!
π −GBC∗ + η + δ!
pV B(R) + (1− p)!
γBV BL (B) + (1− γB)V B(A)
"""
(14)
+(1− γb)V B(A) ≥ γBV B(B) + (1− γB)V B(A).
The left hand side of the expressions above are the value to the challenger when contesting for the village
21It can be seen from (24) that this holds immediately provided GR ≥ GA, which shall be proved.
16
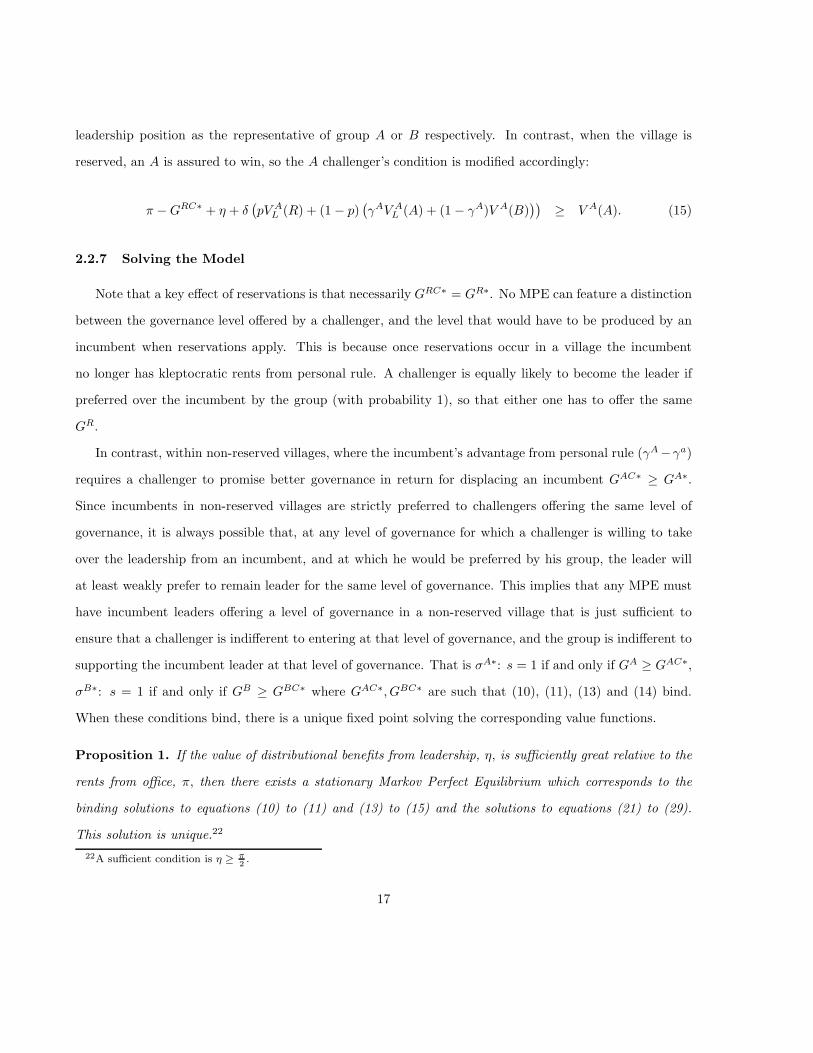
leadership position as the representative of group A or B respectively. In contrast, when the village is
reserved, an A is assured to win, so the A challenger’s condition is modified accordingly:
π −GRC∗ + η + δ!
pV AL (R) + (1 − p)
!
γAV AL (A) + (1 − γA)V A(B)
""
≥ V A(A). (15)
2.2.7 Solving the Model
Note that a key effect of reservations is that necessarily GRC∗ = GR∗. No MPE can feature a distinction
between the governance level offered by a challenger, and the level that would have to be produced by an
incumbent when reservations apply. This is because once reservations occur in a village the incumbent
no longer has kleptocratic rents from personal rule. A challenger is equally likely to become the leader if
preferred over the incumbent by the group (with probability 1), so that either one has to offer the same
GR.
In contrast, within non-reserved villages, where the incumbent’s advantage from personal rule (γA−γa)
requires a challenger to promise better governance in return for displacing an incumbent GAC∗ ≥ GA∗.
Since incumbents in non-reserved villages are strictly preferred to challengers offering the same level of
governance, it is always possible that, at any level of governance for which a challenger is willing to take
over the leadership from an incumbent, and at which he would be preferred by his group, the leader will
at least weakly prefer to remain leader for the same level of governance. This implies that any MPE must
have incumbent leaders offering a level of governance in a non-reserved village that is just sufficient to
ensure that a challenger is indifferent to entering at that level of governance, and the group is indifferent to
supporting the incumbent leader at that level of governance. That is σA∗: s = 1 if and only if GA ≥ GAC∗,
σB∗: s = 1 if and only if GB ≥ GBC∗ where GAC∗, GBC∗ are such that (10), (11), (13) and (14) bind.
When these conditions bind, there is a unique fixed point solving the corresponding value functions.
Proposition 1. If the value of distributional benefits from leadership, η, is sufficiently great relative to the
rents from office, π, then there exists a stationary Markov Perfect Equilibrium which corresponds to the
binding solutions to equations (10) to (11) and (13) to (15) and the solutions to equations (21) to (29).
This solution is unique.22
22A sufficient condition is η ≥ π
2.
17
Proof: See section 7.3 in the Appendix, which provides explicit solutions provided for GA∗GR∗.
In such an equilibrium, incumbents are never deposed by challengers. Group members always prefer
to vote for their own representative than the leader of another group, and as in Padro-i-Miquel (2007),
the existence of personal rule ensures that incumbents enjoy kleptocratic rents. Namely, provided that
γA − γa > 0 (similarly for B members) the net present value of being an incumbent leader strictly exceeds
the net present value of being a citizen. Another way of stating this is that the level of public good rendering
a citizen indifferent to the leadership position, which is GA = π/2, is not achieved by incumbent leaders
with kleptocratic rents. That is, for γA − γa > 0, GA∗ < π/2.
The reason why existence of such an equilibrium depends on the distributional benefits being sufficiently
large is that the persistence of group based voting depends on individuals valuing distributional benefits
sufficiently more than promised governance improvements. This stops a profitable deviation from a leader
that could attract out-group members by promising superior public good provision. A sufficient condition for
this is simply that even if the other group generates governance leaving its citizens indifferent to leadership,
i.e., G = π2 , and a citizen has a group leader providing zero governance, G = 0, this citizen will still prefer
a leader from his own group, that is η ≥ π2 .
23
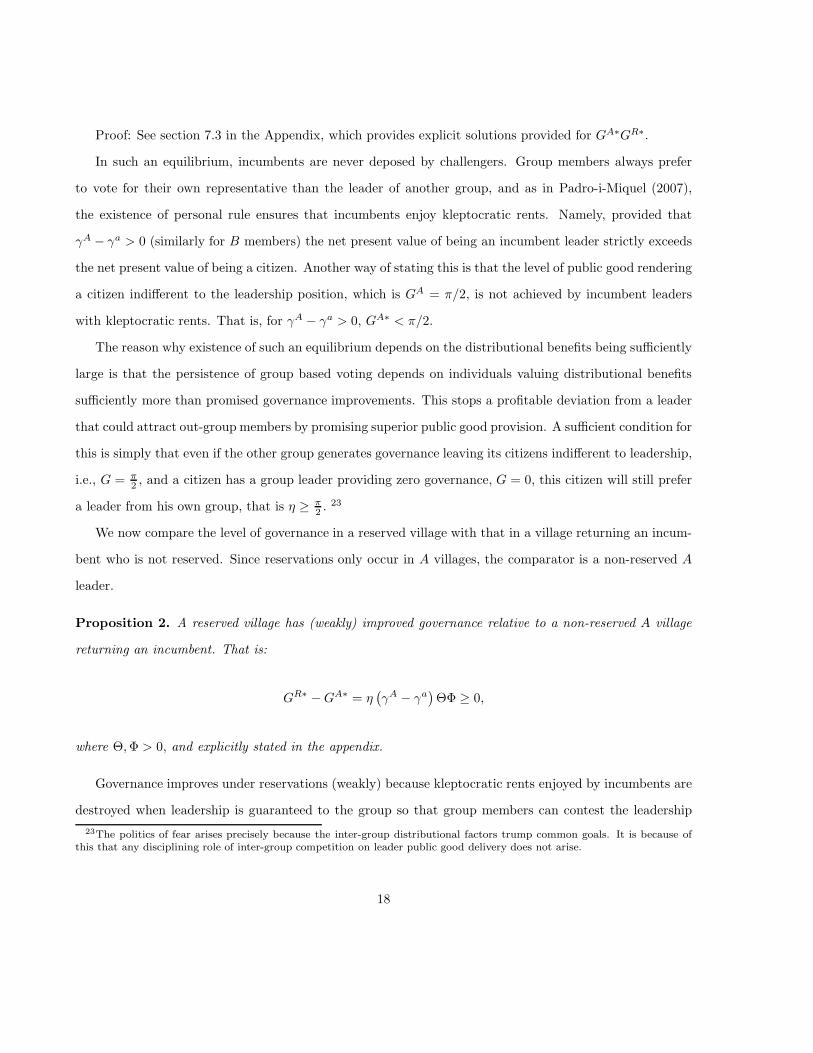
We now compare the level of governance in a reserved village with that in a village returning an incum-
bent who is not reserved. Since reservations only occur in A villages, the comparator is a non-reserved A
leader.
Proposition 2. A reserved village has (weakly) improved governance relative to a non-reserved A village
returning an incumbent. That is:
GR∗ −GA∗ = η!
γA − γa"
ΘΦ ≥ 0,
where Θ,Φ > 0, and explicitly stated in the appendix.
Governance improves under reservations (weakly) because kleptocratic rents enjoyed by incumbents are
destroyed when leadership is guaranteed to the group so that group members can contest the leadership
23The politics of fear arises precisely because the inter-group distributional factors trump common goals. It is because ofthis that any disciplining role of inter-group competition on leader public good delivery does not arise.
18
without the group fearing that it will lose leadership of the village. Consequently, as the expression in
the proposition shows, the size of the improvement in governance is proportional to the size of “personal
rule” γA − γa which is the source of kleptocratic rents. As the corollary below shows, this process of
contestation is so great that, under reservations, entrants are willing to offer levels of governance making
citizens (statically) better off than the entrants themselves.
Corollary 1.
GR∗ >π
2iff γA − γa > 0.
Recall that the benchmark level of governance offered by a leader making him indifferent to the leadership
position was G = π/2. The corollary shows that the supported candidate under reservations offers strictly
more than this when there is personal rule. The leader is thus worse off in his first period (commitment
period) of office as he produces a higher level of governance public good. He is willing to do this because
he is able to enjoy kleptocratic rents (probabilistically) from then on, and will receive strictly higher flow
utility values than citizens as long as he remains in office. We now consider the empirical implications of
the model:
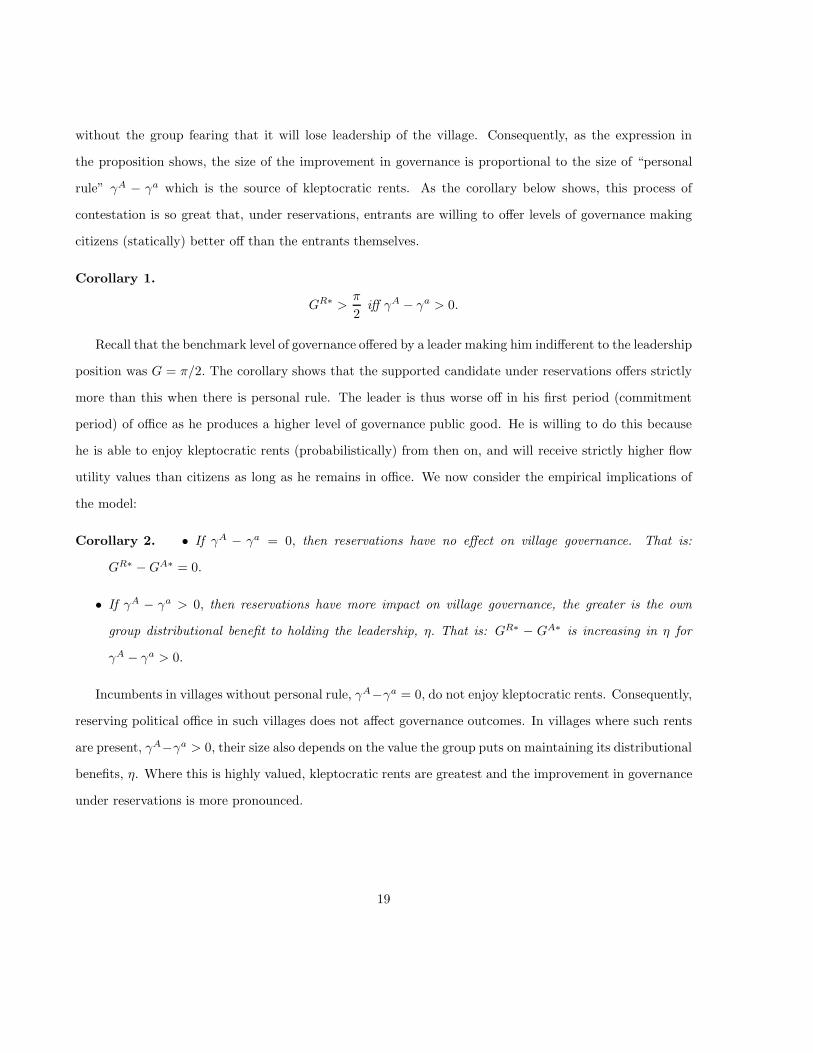
Corollary 2. • If γA − γa = 0, then reservations have no effect on village governance. That is:
GR∗ −GA∗ = 0.
• If γA − γa > 0, then reservations have more impact on village governance, the greater is the own
group distributional benefit to holding the leadership, η. That is: GR∗ − GA∗ is increasing in η for
γA − γa > 0.
Incumbents in villages without personal rule, γA−γa = 0, do not enjoy kleptocratic rents. Consequently,
reserving political office in such villages does not affect governance outcomes. In villages where such rents
are present, γA−γa > 0, their size also depends on the value the group puts on maintaining its distributional
benefits, η. Where this is highly valued, kleptocratic rents are greatest and the improvement in governance
under reservations is more pronounced.
19
2.3 Empirical Predictions
Unreserved villages have two types of leaders – a leader that was previously an incumbent and new
leaders, who are elected when the incumbent leader loses to the representative of another group. (Recall
that, along the equilibrium path, incumbents in unreserved villages are never successfully challenged by
own-group members). Only a previous incumbent leader in an unreserved village has the potential for
kleptocracy rents and hence for these to be challenged and reduced under reservations. A new leader in an
unreserved village does not have such rents and therefore provides governance quality similar to that in a
reserved village.
Without observing whether a leader in an unreserved village is an incumbent or not, we can only
attribute the expected value of governance to such villages. Since a sub-set of these villages are returning
incumbents, from Proposition 2 the predicted effects of reservations (i.e., GR∗ − GA∗) are still positive
provided γa < γA. We now discuss how we empirically determine a village’s differential: γA − γa.
Small groups: If a jati is such a small proportion of the village’s voters that it almost never wins the
Pradhan’s position, i.e., it only obtains the leadership via reservation, or through rare random events, then
reservations should have no impact on governance. That is, since γA → 0 , lowering relection probabilities
to γa < γA is not costly to this group. Thus γA − γa → 0, from Corollary 2 there should be no impact of
reservations on output.24
Large Groups: If a jati is so large a proportion of the village’s voters that it will almost always win
elections in non-reserved villages, then reserving a leadership position for this group will again have no
impact on governance. To see this, consider a group so powerful that even when an incumbent leader is
deposed by a challenger from within the group, it is likely to win the leadeship again anyway. This implies
that γa → 1. In that case, the increment to reelection probability gained by maintaining an incumbent
leader is small enough to provide only marginal benefits to the group, i.e., this again implies γA − γa → 0.
Once again, there will be no impact of reservations on output.
Medium Sized Groups: Reservations should have an effect on caste groups that are a large enough
24An alternative reason for small groups gaining power in unreserved villages may be that their leader has idiosyncraticqualities that make him particularly effective in seizing the leadership position. In Section 7.5 of the appendix we show thatallowing for individual leader heterogeneity in this way does not alter the model’s prediction that reservations for small groupshave no effect.
20
proportion of the population to contest for the leader’s position, but not so large as to be assured to win
it. Groups for whom γA − γa > 0. These groups have incumbents enjoying kleptocratic rents from the
fact that they are essential (or at least helpful) to the group’s maintaining power. Providing a guaranteed
reservation of the leadership to the group destroys those kleptocratic rents and improves governance.
We now turn to testing these predictions on the effects of reservations by village Pradhan size.
3 Data
From November 2006 to May 2007, we surveyed 9132 households from a sample of 300 villages in the
state of Maharashtra, which is located on the west coast of central India. Our data are from three main
regions: Western Maharashtra, Marathwada, and Vidarbha (we excluded only the Konkan coastal region
whose economic hub is Mumbai). To focus on villages which are primarily agricultural (as opposed to
factory based or small market towns), which are large enough to generally have their own Panchayat, and
where society is caste based, rather than tribal, our criteria for village selection was a total population of
1500-2500 with a tribal population representing less than 10%.25 From the universe of such villages within
the geographic area (a total of 22 565) 300 were randomly chosen and visited by our enumeration teams.
Within the villages, neighbourhoods were identified and their approximate population shares computed.
Surveying intensity within a neighbourhood was proportional to its population share and households within
neighbourhoods were randomly selected. Our sample ends up extremely poor; 42% are below the state
poverty line (household income, less than 4367 Rs/capita/year, i.e., less than $1.25 ppp/day/capita).
We administered questionnaires at the household level, village level, and to the Gram Panchayats (GPs)
directly. Some information, particularly the balance sheets of the GPs, were accessed from higher level state
government offices using the “Right to Information Act”.26 In Maharashtra, a given GP typically covers a
population of approximately 2000. As a result, in our data the GPs are generally village specific.
Our key governance outcomes are in line with Anderson, Francois, and Kotwal (2015). GPs implement
25Indigenous tribal society exists in a somewhat parallel relationship to the caste system in India. Tribal villages wereexcluded because their unique mode of social organization made them difficult to directly compare with the majority oftraditional caste based villages, where jati is the clear social identifier.
26The Panchayat Raj is a system of governance within a state which has three levels: village (Gram Panchayat), block(Panchayat Samiti), and district (Zilla Parishad).
21
centrally funded poverty alleviation programs, provide some public goods, represent village interests to
higher level administrative units, and obtain resources from centralized funds for village projects. There is
substantial variation in all of these performance indicators across our sample of villages.
An important GP activity is pro-poor policy delivery. There are a number of such policies supposed
to be available in the full universe of our sample villages. Firstly, there are programs directly targeted to
individuals below the poverty line (BPL). There are also non-targeted programs that are still primarily
intensively utilized by the poor but nominally available to all village residents. The mean number of
programs available in a village is 5.33 out of a possible 15 major programs that we asked about, and when
restricted to those directly targeted to BPL individuals it is 1.71 out of a total of 8. Another important
pro-poor policy is the state’s Employment Guarantee Scheme (EGS). The EGS is a legal guarantee for
365 days of employment to adult members of rural households willing to do public work-related unskilled
manual labour at the statutory minimum wage.27 To operate in a village, EGS projects must be activated
by the GP from a set of possible projects, after petitioning for particular project approval from a higher
level authority. The scheme is evident in only 20% of villages. This scheme, like all listed programs, is
funded externally and administered by the GP upon request for implementation. The GP draws up lists of
eligible recipients, and disburses entitlements to them.
4 Estimations
4.1 Effect of Reservations
Reservations for the Gram Pradhan position are randomly allocated across villages on a rotational basis.
Reservations in India for the SC/ST group are computed proportionally to the population of a particular
caste group at the district level, so the proportion of positions which are reserved can vary by district. This
is the case too in Maharashtra for the SC/ST group. However, for the OBC group, in Maharashtra a fixed
percentage 27% of the Gram Pradhans are reserved for a member of the OBC caste, and this number is
27It is a precursor to, and more generous version of, the current nationally administered Mahatma Ghandi National RuralEmployment Guarantee Act, MNREGA).
22
chosen randomly and administered by the state’s electoral commission.28
We run the following as our main estimating equations, which vary depending on whether the dependent
variable was measured at the village or household level. The household level regression is represented by
the following:
Yik = β0 + β1RESERV EDk + ψkXik + γkZk + ϵik. (16)
Yik is an outcome of household i, residing in village k. Xik includes household controls (education,
land ownership, and caste identity); Zk includes village level geographic, demographic, and climate controls
(latitude, longitude, elevation, distance to natural water sources, distance to railways and national roads,
soil quality measures, rainfall levels, as well as caste population proportions and whether the land ownership
is dominated by Marathas). RESERV EDk is our key variable of interest which is equal to 1 if the Gram
Pradhan is reserved for a lower caste (OBC, SC, ST) member in village k and equal to 0 otherwise.29
Therefore in these estimations, the comparison group is unreserved Gram Pradhans.30 ϵik is a regression
disturbance term clustered at the village level.
We also use village level data to explore the impact of reservations on Gram Panchayat performance
measures. We estimate the following:
Yk = β0 + β1RESERV EDk + φkZk + εk. (17)
Yk is a village level Gram Panchayat outcome measure in village k.
4.2 Baseline Estimations
Recall that the model predicts if the caste group (jati) of an incumbent is very small then he/she will be
unlikely to win re-election in an unreserved village, γA → 0, and hence there is no effect of reservations on
28Consequently, testing the model predictions is cleaner for OBC groups in reserved villages since reservations for them arenot confounded with any possible effects that could arise from population frequencies at the district level. All results persistwhen we just focus on reservations for OBCs and exclude the SC reservations from the analysis. Refer to tables A4 and A5in the appendix.
29We also include region fixed effects.30We include as an additional control whether the Gram Pradhan is reserved for a woman.
23
governance outcomes since kleptocratic rents are low: γA − γa → 0. On the other hand, if an incumbent is
from a jati that is very dominant, his group should always be able to win election even with a replacement
candidate, γa → 1, therefore there is again no effect of reservations as kleptocratic rents are similarly low:
γA − γa → 0. If instead, the candidate is from a jati which is large enough to contest elections, they are
more likely to win if persisting with the incumbent, hence generating kleptocratic rents, γA−γa > 0, so that
reservations, which allow such rents to be contested, should improve governance. Since these predictions
depend on the size of the γs, which are unobservable, we test these implications using a multitude of
different approaches. Our first test is to estimate (16) and (17) for different samples of villages, based on
the proportion of the village population that shares the same jati as the Pradhan. The reasoning here is
that this proportion corresponds to the electoral power of the jati, and hence its ability to have a candidate
win the Pradhan position.
We look to the sample of villages with unreserved Pradhans to inform us of the relevant cut-off popu-
lations, i.e., the γs. Table A1 in the Appendix lists the probability of winning the Pradhan position as a
function of the population share of the jati of the Pradhan in unreserved villages. We see that jati groups
with less than 25% of the village population are never the largest jati and are unlikely to provide the Prad-
han in unreserved villages (approximated 2% of the time); corresponding to our γA → 0 case. Jatis which
exceed 50% of the population are very likely to provide the Pradhan position (65%); corresponding to our
γa → 1 case.31 Whereas jatis between 25 and 50% are contesting jatis and provide the Pradhan 30% of
the time on average, corresponding to our γA − γa > 0 case where we expect reservations should improve
governance. We choose these cutoffs for our baseline specification and will explore robustness around these
cutoffs subsequently.
Our first estimations bundle the zero estimate groups together. That is, one group where the jati of the
Pradhan makes up between 25% and 50% of the village population - where the theory predicts effects – and
another group of villages, where the village population of the jati of the Pradhan is either small, i.e., less
than 25%, or very large, i.e., greater than 50%, and the theory does not expect reservations to significantly
impact governance. Table 1 reports the estimation results from (17) for these two samples of villages, and
31The problem with using a more stringent upper bound, i.e., an upper bound of say 70% is that this reduces the sampleof such villages to a very small number. Since our theory predicts that this is one of the regions where we should find a zeroeffect, this biases testing of our model strongly in our favour. So to preserve power we have used this relatively lenient cut-off.We attempt numerous robustness tests to relaxing this way of treating the γs in what folllows.
24
Table 2 are from (16).
***Insert Table 1.***
Our key outcome variables relate to the availability of government programs in the village and govern-
ment finances. Revenue includes taxes (land, house, and water), funds from upper level governments, and
stamp duty, collected in the last 24 months. Government expenses include all expenditure on public goods,
program provision, resource management, and festivals in the last 24 months. Committees refers to the
total number of Gram Panchayat committees out of a possible 12. They serve the purpose of overseeing
issues regarding: education, health, beneficiary selection, water usage, village development and the weekly
bazaar. We see that our key measures of governance are all significantly positively related to whether the
Prahdan is reserved only in villages where the jati or the Pradhan forms between 25 and 50% of the village
population.
***Insert Table 2.***
At the household level, our key outcome measures include the availability of government programs in
the village, as well as household participation in these programs, whether households perceive that the
needy obtain the benefits of the program, and whether households themselves received what they were
entitled to from the programs. Other outcome measures include whether households believe that villagers
are more likely to be beneficiaries of government schemes if they are personally connected to the Gram
Pradhan; whether households paid taxes in the past 12 months; and whether household voted on promises
(as opposed to personal connections with the candidate) in the last Gram Pradhan election. As per the
village level variables, the key household measures of governance are all significantly positively related to
whether the Prahdan is reserved. But that is the case only in villages where the jati or the Pradhan forms
between 25 and 50% of the village population.
4.3 Alternative Specifications
Below we report alternative estimation results from (17) (in Table 3) and from (16) (Table 4). In these
we instead separate out the two uncontested categories into one where the jati of the Pradhan is less than
25%, and another greater than 50%.
25
***Insert Table 3.***
The estimated effect of reservations in these uncontested villages is very small and statistically insignif-
icant in the lower group (<25%) for all of variables of interest. The same holds true in the upper group
(>50%), except for the provision of government programs, where the relationship is negative and significant;
as we will see, this is not a particularly robust finding. Similar results are found for our household measured
governance variables as seen in Table 4 below.
***Insert Table 4.***
This statistically significant negative effect of reservations in villages where the jati of the Pradhan
makes up more than 50% of the population is not robust to excluding villages where the Pradhan is a
Maratha, as seen in the two tables below. Our main reported effects of reservations in line with the model’s
predictions, however, are all robust to doing so.32
***Insert Table 5.***
From Table 5 and 6, we see that now, for both uncontested categories, there is no insignificant effect of
reservations in these types of villages on our key measures of governance at either the village or household
level.
***Insert Table 6.***
4.4 Robustness Checks
We now explore a series of robustness checks of our baseline estimates which continue to demonstrate
that reservations only have a positive and significant impact on governance in contested villages. The first
consideration is the determination of the population cutoffs. Below, we report the estimation results for
varying cutoffs. In Table 7 the two key dependent variables are the estimated average effect size (AES) of the
government program variables in the earlier specifications (Programs, BPL Programs, Income Programs,
32Marathas are a distinct and powerful upper caste whose effects on village politics can be pronounced. This is especiallythe case when they comprise the largest landowners in the village. Anderson, Francois and Kotwal (2015) explores this caste’sinfluence on village politics in detail.
26
Employment Guarantee Scheme) and the government finances (Revenue, Taxes, Funds, Expenses). We
report the estimated coefficient on Pradhan reservations using varying cut-off measures for the proportion
of the village sharing the jati of the Pradhan. The first panel is for the whole sample, the second panel
excludes villages with a Maratha Pradhan. We see that reservations have a significant and positive effect
on governance only in the middle category. The estimated coefficient is largest in the range between 25 and
45%, but remains significant in all specifications if we go as low as 20% and as high as 60%.
***Insert Table 7.***
Very similar results hold true in the household level data. In Table 8 below, the key dependent variables
are the estimated average effect size of the government program variables in the earlier specifications
(Programs, BPL Programs, Employment Guarantee Scheme, Program Participation, Needy get Benefits,
Received what Entitled to) and the government performance indicators (Receive more benefits if connected
to GP, Paid Taxes, Voted on Promises).
***Insert Table 8.***
We now consider more carefully how we might define a contested village by considering also the pop-
ulation proportion of the other main jati in the village, i.e. a prominent sub-caste group which does not
share the jati of the Pradhan. In this regard, we limit our contested villages to those where the other most
prominent jati forms at least 15% or 20% of the village population. It is first important to note, that under
this criterion, we are essentially always considering villages with two prominent jatis who do NOT share a
larger caste grouping. This is a potentially serious problem as the large caste groupings (OBC, SC) are the
ones at which reservations are defined. But since politics is organized around sub-castes or jatis, of which
there are multiple within each SC and OBC caste, this can potentially lead to problems with our definition
of a contested village. For example a village with a reservation for OBCs featuring two OBC jatis each of
which comprises 25-30% of the village’s population (and a number of other small non-OBC jatis) would not
be one in which either one of these OBC jatis would be guaranteed the leadership position. The reservation
excludes competition from a non OBC, but the relevant competing group for each jati in this case is the
other OBC group, so that this reservation does not alter competition, and therefore does not destroy the
27
kleptocratic rents of the incumbent (γA− γa). Since our theory implicitly assumes that reservations do not
include two competing jatis within the same caste from competing for the reserved position, such cases are
a clear violation of our theory and the predicted effect of reservations would not apply there. It turns out
that this particular violation almost never occurs in the data. More precisely, the proportion of villages
with two prominent OBC jatis (i.e., with population numbers of at least 15%) form only 5% of the sample
villages, and those with two prominent SC castes form only 3% of the sample. It makes no difference to
the results that we report if we include or exclude these very few villages from the estimations.33
In Table 9 below, we report the estimated coefficient on reservation status on our average effect size
dependent variables for governance, taking into consideration the population proportion of the other promi-
nent jati. We see that the positive effect of reservations in our middle category (when the jati of the Pradhan
forms 25 to 50% of the population) is robust to considering only villages where the other prominent jati
forms at least 15% of the population.
The final set of estimation results considers an alternative characterization of what is a contested village
by considering the size of the Pradhan’s jati relative to the main competitor jati, rather than just relative
to the village population as a whole. Our first definition is that a village is contested when the largest
non-Pradhan jati’s population falls between a half and twice of the size of the jati of the Pradhan. An
uncontested village is one where this is not true. We see that there is evidence of reservations having a
positive effect in our contested villages and not in our uncontested villages primarily only for one of our
measures of governance (finances). Our second measure widens this spread to a minimum of a third of the
population of the Pradhan jati to triple its size, and we see that similar results ensue.
***Insert Table 9.***
Table 10 below demonstrates that similar results hold for our governance measures from the household
level survey.
33This violation is so rare probably because of the traditional occupational distribution of villages, its correspondence withcaste, and the conjoined living decisions of jati members. For example, each village traditionally had a three part occupationalbreakdown: large land holders, small holding cultivators, and landless workers who undertook mostly menial tasks. Thelatter two categories make up the OBC and SC categories respectively. People tended to live in villages where their jatimembers reside, jatis are strongly endogamous, and live proximately for reasons to do with the strong forms of within groupcooperation and insurance that such groups provide; see for example Munshi and Rosenzweig (2016) for a recent analysis. So,in a particular village, one jati tends to numerically dominate the OBC group, and one tends to dominate the SC group. Aftermany years of (albeit limited) migration, there is some mixing, but the case of a single village with two large OBC groups ortwo large SC groups is extremely unusual.
28
***Insert Table 10.***
4.5 Quality of the Pradhan
Although reservations are randomly determined, it is conceivable that other variables are systematically
correlated with our key source of variation. One particular consideration is the quality of the Pradhan.
Suppose that, for some reason, Pradhans in reserved positions systematically differ in quality from those in
unreserved positions. This could potentially bias our results if the magnitude of the quality differences is
correlated with our jati population breakdowns. In the two tables below we demonstrate that results from
our baseline specification are robust to including other characteristics of the Pradhan such as education
and land ownership measures (second column). They are also robust to controlling for the Pradhan being
from the Maratha caste, which can only occur in the control group, (first column).
***Insert Table 11.***
Table 12 demonstrates that this robustness check also holds for our governancemeasures at the household
level.
***Insert Table 12.***
Another check to see if the characteristics of the Pradhan could be contributing to our results in some
manner is to use the quality of the Pradhan as a dependent variable in an analogous estimation of (17) in
contested and uncontested villages. That is, we would like to know if the estimated coefficient of reservation
status on the quality of the Pradhan similarly follows an inverted U-shape with regards to the population
share of the Pradhan’s jati, as do our measures of governance.
Figure 1 below depicts the estimated coefficient of the variable reserved on the education and landhold-
ings of the Pradhan respectively. We see that there is no evidence of an inverted U-shaped relationship for
either of these quality measures. Moreover, the estimated coefficient is never significant in the estimations of
Pradhan landholdings. The estimated coefficient is a negative determinant of the education of the Pradhan
for all population shares of their jati, and only significant if the share exceeds 50%.
***Insert Figure 1***
29
4.6 Placebo Tests
Our key results could also be biased if the population share of the jati of the Pradhan is systematically
correlated with some other variable affecting governance. If this were the case, then our key finding that
reservation status has a positive and significant effect on governance outcomes only in so-called contested
villages follows because our measure of what is a contested village is in fact correlated with this other
relevant variable. To this end, we consider a series of candidate variables measured at the village level, like
caste proportions, polarization and fractionalization measures, as well as village-level education levels and
landholdings. To look for evidence of this possibility, using (17) we estimate the average effect size (AES)
of the government program variables and of the government finance variables in a series of estimations that
vary by percentile measures of village types. That is, we first consider our village characteristic of interest,
the population share of the jati of the Pradhan. We break the population share of the jati of the Pradhan
into three percentile groupings (terciles) so that each estimation has a third of the villages; approximately
corresponding to the break-down in Tables 3 and 4. The figure below depicts the estimated coefficient
on reservation status in each of these terciles. Consistent with our baseline estimates being driven by a
data generating process like that of our theory, we see that reservation status is a positive and significant
determinant of governance only for the middle category.
***Insert Figure 2***
We now perform an analogous exercise for different village measures: proportion of the village which
is from an OBC caste, proportion SC, proportion which is Maratha; fractionalization index; polarization
index; proportion of the village which are large land owners (> 5 acres); proportion of the village adult
men which have at least some secondary education. These are all factors which, if exhibiting a pattern
of correlation like that predicted by our theory, could spuriously generate the pattern we see in the data.
Unlike Figure 2 we never see an inverted U-type relationship with regards to the different terciles of these
village-level measures and governance indicators.
***Insert Figures 3 and 4***
30
4.7 Test of η Prediction
Another prediction of the model is that the value of holding the Gram Pradhan position is higher if it
is easier for the Pradhan to target his own jati with distributional benefits. To test for this we construct
a type of Herfindahl index of jati concentration. As mentioned in section 3, villages were surveyed along
neighbourhood lines. Using the jati population numbers in each neighbourhood, we define sj to be the
number of households who share the same jati as the Gram Pradhan in neighbourhood j divided by the
number of households who share the same jati as the Gram Pradhan in the entire village. We then construct
an index H ='n
j=1 s2j which is higher the more concentrated is the jati in the village. If all of the Gram
Pradhan jati members are in a single neighbourhood, say j = 1, then s1 = 1, and sj = 0 for all of the other
neighbourhoods j and H = 1, which is the upper bound on H . In this case, the members of the Gram
Pradhan’s jati are very concentrated in a single neighbourhood and our reasoning here is that it will be
relatively easy for him to target his group members with local public goods. Alternatively, suppose instead
that the members of the Gram Pradhan’s jati are spread equally across all neighbourhoods, then sj =1n for
all j and H = 1n , which is the lower bound on H . Such a very diluted jati would be more difficult to single
out with targeted benefits. In the former case, holding the Pradhan position is more valuable to the group,
which corresponds to a high value of η, which Proposition 2 shows yields a larger effect of reservations,
ceteris parabus, in the case of contested villages.
Testing this prediction suggests that we estimate the following two equations including an interacted
measure of concentration. Specifically we run the household level regression represented by the following:
Yik = β0 + β1RESERV EDk + β2RESERV EDk ∗Hk + β3Hk + ψkXik + γkZk + ϵik, (18)
with Hk being our index of the degree of concentration of the Gram Pradhan’s jati village k. Our key
coefficient of interest is the interaction coefficient, β2, which the theory predicts to be positive. That is,
the impact of reservations (represented by RESERV EDk) is larger the easier it is to target the Gram
Pradhan’s jati members, as captured by a higher Hk. The analogous village level regression is:
Yk = β0 + β1RESERV EDk + β2RESERV EDk ∗Hk + β3Hk + φkZk + εk. (19)
31
Tables 13 and 14 report the results from estimating (19) and (18) respectively. The point estimates
suggest some support for the positive impact of reservations on governance outcomes being larger the easier
it is to target members of the jati of the Pradhan, i.e., a higher estimated β2, for program provision in
the village. We restrict our sample to those villages where reservations had an impact, that is, where the
members of the jati of the Gram Pradhan make up between 25% and 50% of the village population. Since,
when estimating GP level measures, this leaves us with quite a small sample, we see, from Table 13 below,
that though the estimated coefficient β2 is large and positive, it is only significant at about the 20% level
for all program outcomes, with the exception of the Employment Guarantee Scheme where significance is
found at the 10% level. Significance improves to about the 15% or 10% levels when moving to the household
level data with roughly 1800 observations, as seen in Table 14.
***Insert Table 13 and 14***
5 Conclusion
Political reservations for traditionally disadvantaged castes in Indian villages can improve the quality of
governance, not just with respect to that caste, but for the village as a whole. This is the first evidence of such
an effect to our knowledge. According to the theory proposed here, the reason it can improve governance
is due to the sclerotic nature of democracy when identity politics underlies the formation of political
groupings. The collectively beneficial activities that a government could be undertaking are sacrificed to
the group focused ones in such polities. We think this pertains to the rural Indian villages in our sample.
Citizens view their elected representative firstly as an in-group member whose primary job is to provide
benefits to the group and primarily assess him on that. Secondly, he is an overall village leader and, ceteris
parabus, it is better if he can do that well too. The ensuing organization of representatives and electors
leads to a situation where a leader doing the former task well will be tolerated by a group even when he
does the latter task poorly leading to a type of kleptocratic rent that accrues to a personalist leader. The
reasoning underlying such a “politics of fear” scenario has already been well formalized by Padro-i-Miquel
(2007) and explains the underlying dysfunction of politics in identity based systems.
By extension of this reasoning here, we show that political reservations – by allowing the incumbent’s
32
kleptocratic rent to be safely contested within the group – is a means via which this type of political
dysfunction can be ameliorated. The model we develop demonstrates that when personalistic politician
power is greatest – in villages where a group is neither overwhelmingly powerful, nor overwhelmingly weak
– reservations should have their greatest effect. And this is exactly what we find in the data. A natural
conclusion then is that a politics of fear scenario well describes the setting where our data is collected, and
some of its deleterious effects on governance can be offset by reserving political office for members of a
paritcular caste.
Taken to its logical conclusion, the experiment of caste based reservations suggests a broader message
about how government dysfunction can be overcome in identity based electoral systems. If politics of fear
factors are indeed the reason that democracy fails to function, and this happens because groups coalesce
around identity, an extreme implication would be that apportioning representation by identity, perhaps on
a rotational basis, and dispensing with democratic elections altogether may actually destroy political elites’
kleptocratic rents and improve governance. In our data, these reservations for traditionally disadvantaged
groups seem to have had effects in curtailing such dysfunction. But there is nothing necessary about
reservations being limited solely to the traditionally disadvantaged groups. The general message is that
since democracy doesn’t work well in identity based settings, governance could be improved by dispensing
with democratic contests altogether. Simply allowing groups to take leadership positions in turn – perhaps
stochastically – might lead to marked improvements.
There are reasons to stop well short of such a suggestion though. As Laitin (1986) and Posner (2004)
have argued in an African context, explicitly privileging group identity in the formal political process – here
it is caste sub-groups or jatis, but it could be tribes or religions – may further entrench any pre-existing
tendencies individuals had to coalesce upon such lines in the first place. The process of political reservations
in India has been argued to have done just that (see Osborne (2001) for example), the consequences of which
are not modeled or even considered here. Going a step further and deciding leadership eligibility solely via
group identity would go even further in solidifying such identities and undermining democratic functionality.
33
6 References
Anderson, S, P. Francois and A. Kotwal (2015) “Clientelism in Indian Villages,” American Economic
Review, 105(6), 1780-1816.
Auerbach, A. and Zeigfeld (2016) How Do Electoral Quotas Influence Political Competition? Evidence
from Municipal, State, and National Elections in India, George Washington University,WP 2016-16.
Banerjee, A., E. Duflo, C. Imbert and R. Pande (2013) “Entry, Exit and Candidate Selection: Evidence
from India”, working paper.
Banerjee, A. and R. Pande (2009) Parochial Politics: Ethnic Preferences and Politician Corruption,”
Harvard University, Kennedy School of Government working paper.
Bardhan, P., D. Mookherjee and M. Torrado (2010) Impact of Political Reservations in West Bengal
Local Governments on Anti-Poverty Targeting, Journal of Globalization and Development: Vol. 1,1.
Bates, R. (1983) Essays on the Political Economic of Rural Africa, Cambridge, Cambridge University
Press.
Beaman, L. R. Chattopadhyay, E. Duflo, R. Pande and P. Topolova (2009): “Powerful Women: Does
Exposure Reduce Bias?,” Quarterly Journal of Economics, 124(4), 1497 – 1540.
Besley, T., R. Pande and V. Rao (2008) “The Political Economy of Gram Panchayats in South India.”
In Development in Karnataka: Challenges of Governance, Equity and Empowerment, Eds., G Kadekodi,
R. Kanbur and V. Rao, Academic Foundation, New Delhi.
Besley, T., O. Folke, T. Persson, and J. Rickne (2016) “Gender Quotas and the Crisis of the Mediocre
Man: Theory and Evidence from Sweden,” mimeo IIES, Stockholm.
Bhavnani, R. (2016) “Do the Effects of Temporary Ethnic Group Quotas Persist? Evidence from India.”
American Economic Journal: Applied Economics, Forthcoming.
Chattopadhyay, R. and E. Duflo (2004) “Women as Policy Makers: Evidence from a Randomized Policy
Experiment in India,” Econometrica, 72(5), 1409–1443
Chin, A. and N. Prakash (011) “The Redistributive Effects of Political Reservation for Minorities:
Evidence from India,” Journal of Development Economics, 96(2), 265 – 277
Deininger, K. S. Jin, H. K. Nagarajan and F. Xia (2015) “Does Female Reservation Affect Long-Term
34
Political Outcomes? Evidence from Rural India,” Journal of Development Studies, 51(1), pages 32-49.
Dunning, T and J. Nilekani (APSR 2013) “Ethnic Quotas and Political Mobilization: Caste, Parties,
and Distribution in Indian Village Councils,” American Political Science Review, 107, 35– 56.
Gajwani, K. and X. Zhang (2015) “Gender and Public Goods Provision in Tamil Nadu’s Village Gov-
ernments” World Bank Economic Review, 29(2) 234-0261
Jensensius, F. R., (2015) “Development from Representation? A Study of Quotas for the Scheduled
Castes in India,” American Economic Journal: Applied Economics, 7(3), 196–220.
Laitin, D. (1986) Hegemony and Culture. Chicago: University of Chicago Press.
Lamba, S. and D. Spears (2013) “Caste, Cleanliness and Cash: Effects of Caste-Based Political Reser-
vations in Rajasthan on a Sanitation Prize,” Journal of Development Studies, 49(11) 1592-1606.
Mitra, A. (2015) “Mandated Political Representation and Redistribution,” University of Oslo, Working
Paper.
Munshi, K. and M. Rosenzweig (2016) “Insiders and Outsider: Local Ethnic Politics and Public Good
Provision” mimeo, Cambridge University.
Munshi, K. and M. Rosenzweig (2016) “Networks and Misallocation: Insurance, Migration, and the
Rural-Urban Wage Gap” American Economic Review, 106 (1) 46-98.
Osborne, E. (2001) “Culture, Development, and Government: Reservations in India” Economic Devel-
opment and Cultural Change, 49(3):659–685, 2001.
Padro-i-Miquel (2007) “The Control of Politicians in Divided Societies: The Politics of Fear,” Review
of Economic Studies 74(4): 1259-1274.
Pande, R. (2003) “Can Mandated Political Representation Provide Disadvantaged Minorities Policy
Influence? Theory and Evidence from India,” American Economic Review, 93(4): 1132-1151.
Posner, D. (2004) “The Political Salience of Cultural Difference: Why Chewas and Tumbukas Are Allies
in Zambia and Adversaries in Malawi,” American Political Science Review, 98(4), 529-545.
35
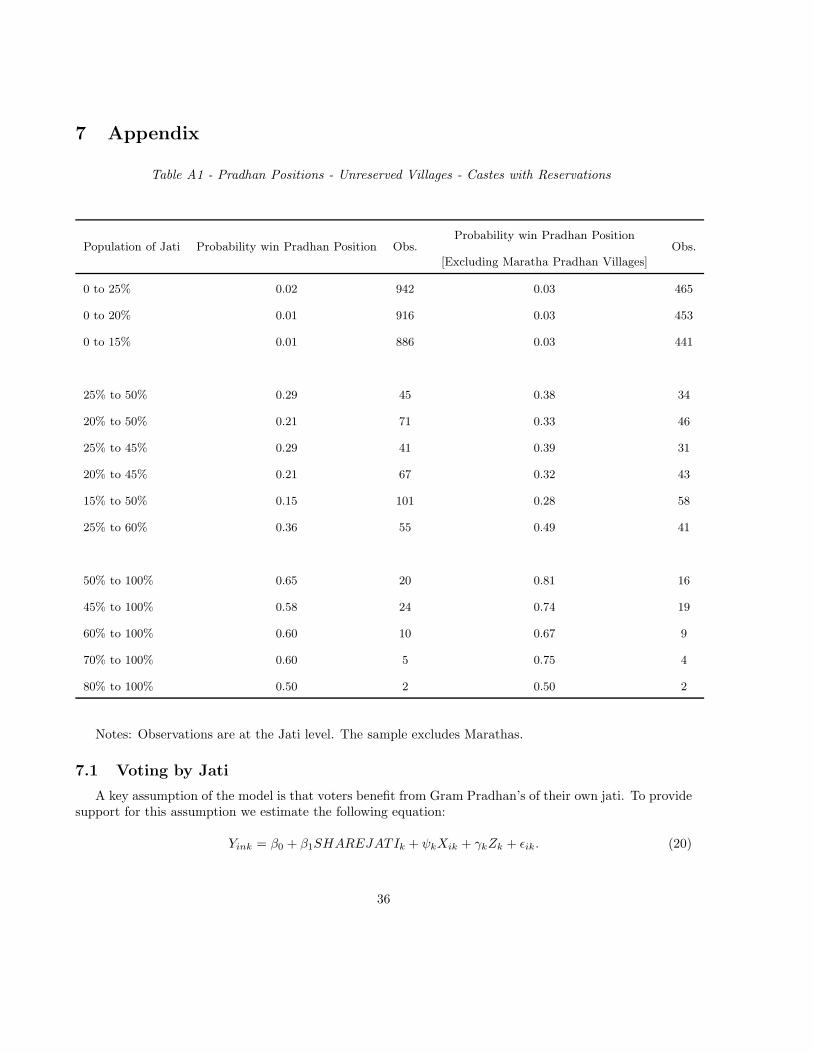
7 Appendix
Table A1 - Pradhan Positions - Unreserved Villages - Castes with Reservations
Population of Jati Probability win Pradhan Position Obs.Probability win Pradhan Position
[Excluding Maratha Pradhan Villages]Obs.
0 to 25% 0.02 942 0.03 465
0 to 20% 0.01 916 0.03 453
0 to 15% 0.01 886 0.03 441
25% to 50% 0.29 45 0.38 34
20% to 50% 0.21 71 0.33 46
25% to 45% 0.29 41 0.39 31
20% to 45% 0.21 67 0.32 43
15% to 50% 0.15 101 0.28 58
25% to 60% 0.36 55 0.49 41
50% to 100% 0.65 20 0.81 16
45% to 100% 0.58 24 0.74 19
60% to 100% 0.60 10 0.67 9
70% to 100% 0.60 5 0.75 4
80% to 100% 0.50 2 0.50 2
Notes: Observations are at the Jati level. The sample excludes Marathas.
7.1 Voting by Jati
A key assumption of the model is that voters benefit from Gram Pradhan’s of their own jati. To providesupport for this assumption we estimate the following equation:
Yink = β0 + β1SHAREJATIk + ψkXik + γkZk + ϵik. (20)
36
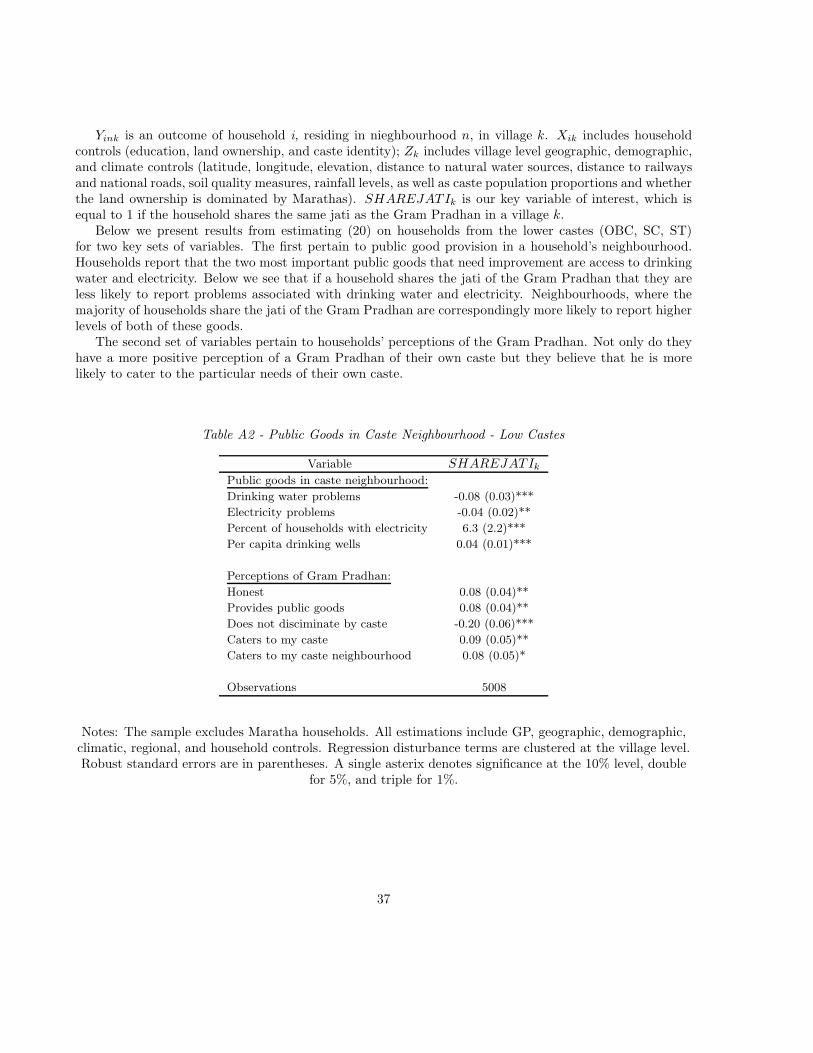
Yink is an outcome of household i, residing in nieghbourhood n, in village k. Xik includes householdcontrols (education, land ownership, and caste identity); Zk includes village level geographic, demographic,and climate controls (latitude, longitude, elevation, distance to natural water sources, distance to railwaysand national roads, soil quality measures, rainfall levels, as well as caste population proportions and whetherthe land ownership is dominated by Marathas). SHAREJATIk is our key variable of interest, which isequal to 1 if the household shares the same jati as the Gram Pradhan in a village k.
Below we present results from estimating (20) on households from the lower castes (OBC, SC, ST)for two key sets of variables. The first pertain to public good provision in a household’s neighbourhood.Households report that the two most important public goods that need improvement are access to drinkingwater and electricity. Below we see that if a household shares the jati of the Gram Pradhan that they areless likely to report problems associated with drinking water and electricity. Neighbourhoods, where themajority of households share the jati of the Gram Pradhan are correspondingly more likely to report higherlevels of both of these goods.
The second set of variables pertain to households’ perceptions of the Gram Pradhan. Not only do theyhave a more positive perception of a Gram Pradhan of their own caste but they believe that he is morelikely to cater to the particular needs of their own caste.
Table A2 - Public Goods in Caste Neighbourhood - Low Castes
Variable SHAREJATIkPublic goods in caste neighbourhood:
Drinking water problems -0.08 (0.03)***Electricity problems -0.04 (0.02)**
Percent of households with electricity 6.3 (2.2)***
Per capita drinking wells 0.04 (0.01)***
Perceptions of Gram Pradhan:
Honest 0.08 (0.04)**Provides public goods 0.08 (0.04)**
Does not disciminate by caste -0.20 (0.06)***
Caters to my caste 0.09 (0.05)**Caters to my caste neighbourhood 0.08 (0.05)*
Observations 5008
Notes: The sample excludes Maratha households. All estimations include GP, geographic, demographic,climatic, regional, and household controls. Regression disturbance terms are clustered at the village level.Robust standard errors are in parentheses. A single asterix denotes significance at the 10% level, double
for 5%, and triple for 1%.
37
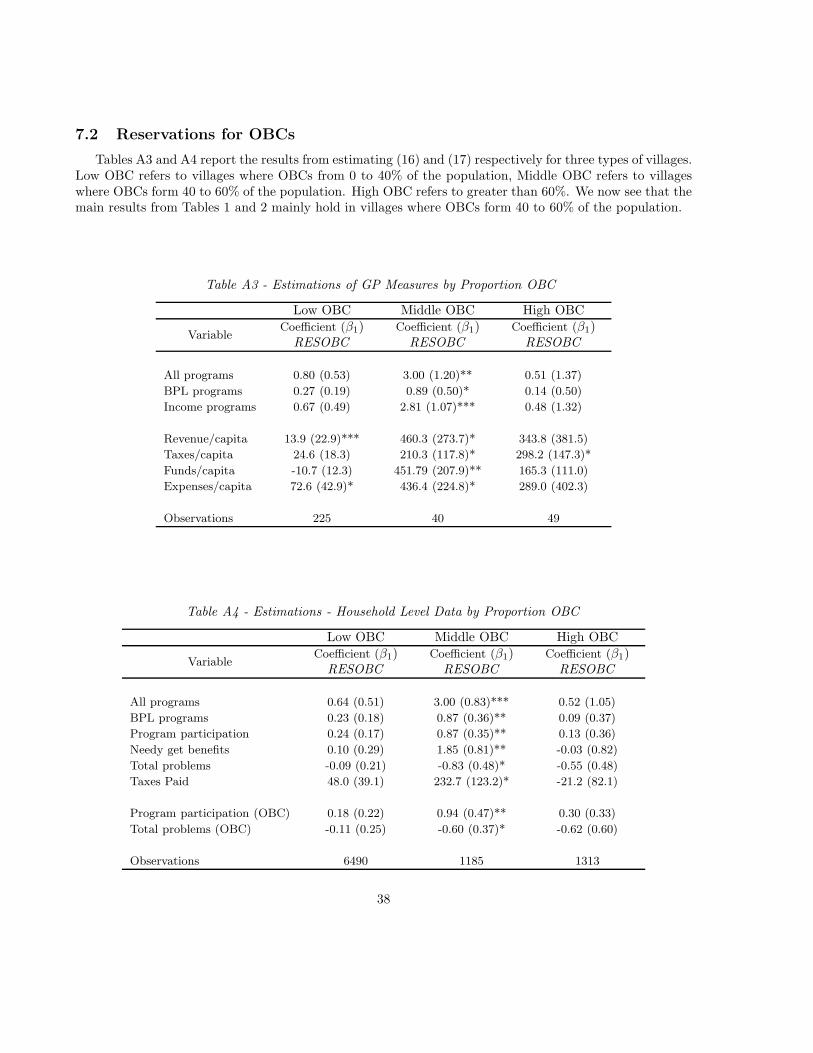
7.2 Reservations for OBCs
Tables A3 and A4 report the results from estimating (16) and (17) respectively for three types of villages.Low OBC refers to villages where OBCs from 0 to 40% of the population, Middle OBC refers to villageswhere OBCs form 40 to 60% of the population. High OBC refers to greater than 60%. We now see that themain results from Tables 1 and 2 mainly hold in villages where OBCs form 40 to 60% of the population.
Table A3 - Estimations of GP Measures by Proportion OBC
Low OBC Middle OBC High OBC
VariableCoefficient (β1)
RESOBCCoefficient (β1)
RESOBCCoefficient (β1)
RESOBC
All programs 0.80 (0.53) 3.00 (1.20)** 0.51 (1.37)
BPL programs 0.27 (0.19) 0.89 (0.50)* 0.14 (0.50)Income programs 0.67 (0.49) 2.81 (1.07)*** 0.48 (1.32)
Revenue/capita 13.9 (22.9)*** 460.3 (273.7)* 343.8 (381.5)Taxes/capita 24.6 (18.3) 210.3 (117.8)* 298.2 (147.3)*
Funds/capita -10.7 (12.3) 451.79 (207.9)** 165.3 (111.0)Expenses/capita 72.6 (42.9)* 436.4 (224.8)* 289.0 (402.3)
Observations 225 40 49
Table A4 - Estimations - Household Level Data by Proportion OBC
Low OBC Middle OBC High OBC
VariableCoefficient (β1)
RESOBCCoefficient (β1)
RESOBCCoefficient (β1)
RESOBC
All programs 0.64 (0.51) 3.00 (0.83)*** 0.52 (1.05)
BPL programs 0.23 (0.18) 0.87 (0.36)** 0.09 (0.37)Program participation 0.24 (0.17) 0.87 (0.35)** 0.13 (0.36)
Needy get benefits 0.10 (0.29) 1.85 (0.81)** -0.03 (0.82)
Total problems -0.09 (0.21) -0.83 (0.48)* -0.55 (0.48)Taxes Paid 48.0 (39.1) 232.7 (123.2)* -21.2 (82.1)
Program participation (OBC) 0.18 (0.22) 0.94 (0.47)** 0.30 (0.33)
Total problems (OBC) -0.11 (0.25) -0.60 (0.37)* -0.62 (0.60)
Observations 6490 1185 1313
38
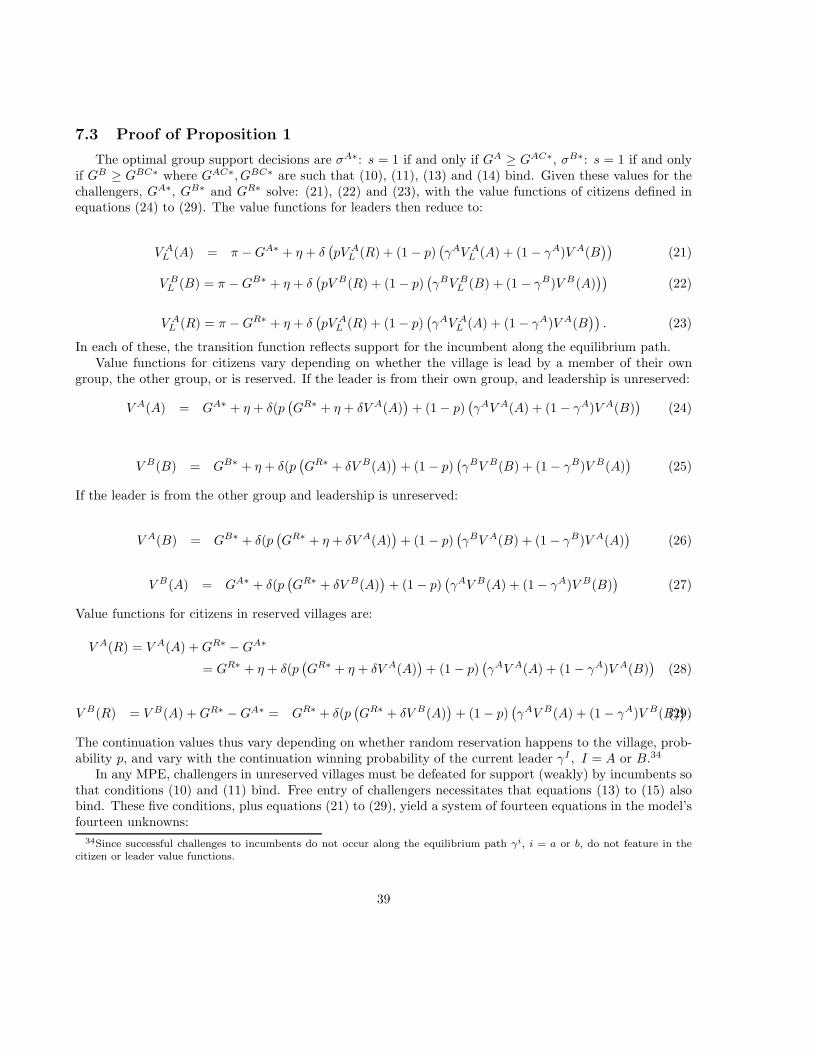
7.3 Proof of Proposition 1
The optimal group support decisions are σA∗: s = 1 if and only if GA ≥ GAC∗, σB∗: s = 1 if and onlyif GB ≥ GBC∗ where GAC∗, GBC∗ are such that (10), (11), (13) and (14) bind. Given these values for thechallengers, GA∗, GB∗ and GR∗ solve: (21), (22) and (23), with the value functions of citizens defined inequations (24) to (29). The value functions for leaders then reduce to:
V AL (A) = π −GA∗ + η + δ
!
pV AL (R) + (1 − p)
!
γAV AL (A) + (1 − γA)V A(B
""
(21)
V BL (B) = π −GB∗ + η + δ
!
pV B(R) + (1− p)!
γBV BL (B) + (1 − γB)V B(A)
""
(22)
V AL (R) = π −GR∗ + η + δ
!
pV AL (R) + (1− p)
!
γAV AL (A) + (1− γA)V A(B
""
. (23)
In each of these, the transition function reflects support for the incumbent along the equilibrium path.Value functions for citizens vary depending on whether the village is lead by a member of their own
group, the other group, or is reserved. If the leader is from their own group, and leadership is unreserved:
V A(A) = GA∗ + η + δ(p!
GR∗ + η + δV A(A)"
+ (1− p)!
γAV A(A) + (1 − γA)V A(B)"
(24)
V B(B) = GB∗ + η + δ(p!
GR∗ + δV B(A)"
+ (1 − p)!
γBV B(B) + (1 − γB)V B(A)"
(25)
If the leader is from the other group and leadership is unreserved:
V A(B) = GB∗ + δ(p!
GR∗ + η + δV A(A)"
+ (1 − p)!
γBV A(B) + (1 − γB)V A(A)"
(26)
V B(A) = GA∗ + δ(p!
GR∗ + δV B(A)"
+ (1− p)!
γAV B(A) + (1− γA)V B(B)"
(27)
Value functions for citizens in reserved villages are:
V A(R) = V A(A) +GR∗ −GA∗
= GR∗ + η + δ(p!
GR∗ + η + δV A(A)"
+ (1 − p)!
γAV A(A) + (1 − γA)V A(B)"
(28)
V B(R) = V B(A) +GR∗ −GA∗ = GR∗ + δ(p!
GR∗ + δV B(A)"
+ (1− p)!
γAV B(A) + (1− γA)V B(B)"
.(29)
The continuation values thus vary depending on whether random reservation happens to the village, prob-ability p, and vary with the continuation winning probability of the current leader γI , I = A or B.34
In any MPE, challengers in unreserved villages must be defeated for support (weakly) by incumbents sothat conditions (10) and (11) bind. Free entry of challengers necessitates that equations (13) to (15) alsobind. These five conditions, plus equations (21) to (29), yield a system of fourteen equations in the model’sfourteen unknowns:
34Since successful challenges to incumbents do not occur along the equilibrium path γi, i = a or b, do not feature in thecitizen or leader value functions.
39

{V AL (A), V B
L (B), V AL (R), V A(A), V B(B), V A(B), V B(A), V A(R), V B(R), GA∗, GAC∗, GB∗, GBC∗, GR∗}. This
system can be solved explicitly and yields:
GA∗
= π/2 +2(γa
−γA)(1+(p−1)γAδ)(2γB−γb+(p−1)(γb(γA
−γB−1)+2(γB)2)δ)η
(1+(p−1)(γA+γB−1)δ)((γAγb(2−2γAδ+p(2γA−1)δ)+γa(−γb(2+(p−2)δ)+2γB(1+(p−1)γBδ)))
GR∗ =π + 2GA (p− 1) γAδ
2 + 2(p− 1)γAδ
Where the terms Φ and Θ stated in the proposition are:
Φ =2!
2γB − γb + (p− 1)(γb(γA − 1− γB) + 2γB2)δ)"
(1 + (p− 1)(γA + γB − 1)δ
1/Θ = γAγb(2 − 2γAδ + p(2γA − 1)δ)− γa!
γb(2 + (p− 2)δ) + 2γB!
1 + (p− 1)γBδ""
.
Since these are the unique fixed points of this system, this is the unique MPE corresponding to this game.
7.4 Proof of Proposition 2
From the solutions stated in Proposition 1, we obtain the expression:
GR∗−GA∗ = −2!
γa − γA" !
+2γB + (p− 1)(γb(γA − 1− γB) + 2γB2)δ)η"
[(1 + (p− 1)(γA + γB − 1)δ] [γAγb(2− 2γAδ + p(2γA − 1)δ) + γa (−γb(2 + (p− 2)δ) + 2γB (1 + (p− 1)γBδ))].
Parameter restrictions are (p, δ, η, γA, γa, γB, γb) ∈ (0, 1). and γa ≤ γA, γb ≤ γB. We first show that thisexpression can be signed when setting p = 0. Under this assumption, R∗ −A∗ is given by:
!
γA − γa"
η(
γb!
1− δ!
1− γA + γB""
+ 2γB!
γBδ − 1")
[1 + (1− γA − γB) δ] [γAγb (γAδ − 1) + γa (γb (1− δ)− γB (1− γBδ))].
In the denominator, the term in the first square bracket: 1−!
1− γA − γB"
δ > 0 because!
1− γA − γB"
δ <1. The first term in the second square bracket on the denominator is -ve since γAδ < 1. The second termin the second square bracket is -ve because γb < γB and 1 − δ < 1 − γBδ. Hence the denominator is neg-ative. Consider the square bracketed term in the numerator. Necessarily γb
!
1− δγB"
+ 2γB!
γBδ − 1"
>γb
!
1− δ!
1− γA + γB""
+2γB!
γBδ − 1"
since 1−γA > 0.And γb!
1− δγB"
+2γB!
γBδ − 1"
≡!
1− δγB" !
γb − 2γB"
<0, so the numerator is also negative implying that GR∗ −GA∗ ≥ 0 when p = 0.
Now consider GR∗ −GA∗ when p = 1. The expression simplifies to:
2!
γA − γa"
η(
2γB − γb)
.
This is clearly non-negative also since γa < γA, γb < γB.For GR∗ − GA∗ to be non-negative when p = 0, and also non-negative when p = 1, but negative for
values of p between 0 and 1, necessarily GR∗ − GA∗ must equal zero at at least two points in the intervalp ∈ (0, 1). But explicitly solving for p such that GR∗ −GA∗ = 0, yields:
40

p = 1−2γB − γb
δ*
2 (γB)2 + γb (γA − 1− γB)+ .
Since this is a unique point, necessarily GR∗ −GA∗ ≥ 0 for all values of pin the interval 0 to 1.
7.5 Small groups obtaining power due to idiosyncratic leader quality
The reasons a small group winning the leadership may vary. One way of thinking about it is as arandom event which makes the group unlikely to win again, and this is how we have interpreted such eventsin the baseline model. But if the “random event” is that the leader of this group is particularly skilled,and therefore the group wins leadership only because of this leader’s idiosyncratic quality, then providingreservations for this group will not allow the kleptocratic rents (which the current leader holds and benefitsfrom) to be contested in the same way that it would for a group that wins by one off chance. Though areservation will imply that the group will hold the leadership, if the contesting applicant wins the leadershiphe will no longer enjoy the incumbency advantage of the original (high quality) incumbent beyond that.Thus the group will lose control (with very high likelihood) after the period of reservation, which theywould be much less likely to do if they persist with the current leader.
To calculate the effect of this in our model we modify the value functions so that if a leader is replaced,the group loses leadership in the period after reservations no longer take effect. The assumption is that thereplacement is a standard type, as in our baseline model, and does not share the incumbent’s idiosyncraticquality advantage. If such a challenger replaces the incumbent, then assuming she will not hold power againin an uncontested election (and her kleptocratic rents are zero), her entry condition requires her providingan GAC such that:
π −GAC + η + δ!
pV RL + (1− p)V AB
"
≥ GA + η + δ!
pV AR + (1− p)(γAV AA + (1− γA)V AB)"
. (30)
Solving for the GAC∗, which binds above, yields the level of effort that the incumbent would have to produceto stave off such a challenge. From the perspective of citizens, it must be the case that citizens would ratherhave the challenger at the best feasible governance level offered, GAC∗ above, instead of persisting with theincumbent under GA. Namely:
GAC∗ + η + δ!
pV AR + (1 − p)V AB"
> GA + η + δ!
pV AR + (1− p)!
γAV AA + (1 − γA)V AB""
.(31)
Using the binding GAC∗ from (30) and substituting into (31) yields:
GAC∗ + η + δ!
pV AR + (1− p)V AB"
> π −GAC∗ + η + δ!
pV RL + (1− p)V AB
"
.
But note that V AR = V RL , since this is a group for which γA − γa → 0, which implies that GA = π
2 fromthen on for this challenger (as there is no kleptocratic rent for such a leader). Imposing V AR = V R
L in thecondition above now reduces the inequality to:
GAC∗ >π
2.
This inequality implies that for a standard quality challenger under reservations to be preferred to theidiosyncratically high quality incumbent, this entrant must offer governance under the challenge that strictly
41

exceeds that which would leave them indifferent to taking the leadership position. So any feasible entrantwould not be chosen to displace an idiosyncratically high quality leader under reservations. Thus resevationshave no effect in such cases.
42
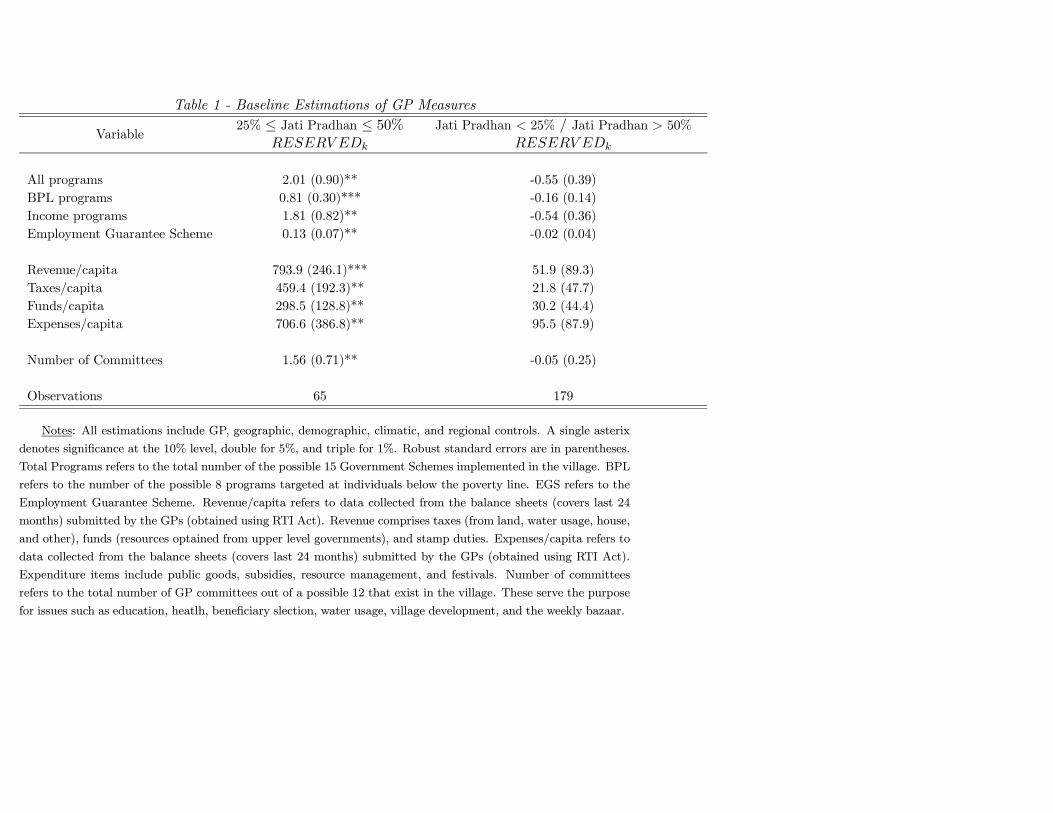
Table 1 - Baseline Estimations of GP Measures
Variable25% ≤ Jati Pradhan ≤ 50%
UHVHUY HGn
Jati Pradhan ? 25% / Jati Pradhan A 50%
UHVHUY HGn
All programs 2.01 (0.90)** -0.55 (0.39)
BPL programs 0.81 (0.30)*** -0.16 (0.14)
Income programs 1.81 (0.82)** -0.54 (0.36)
Employment Guarantee Scheme 0.13 (0.07)** -0.02 (0.04)
Revenue/capita 793.9 (246.1)*** 51.9 (89.3)
Taxes/capita 459.4 (192.3)** 21.8 (47.7)
Funds/capita 298.5 (128.8)** 30.2 (44.4)
Expenses/capita 706.6 (386.8)** 95.5 (87.9)
Number of Committees 1.56 (0.71)** -0.05 (0.25)
Observations 65 179
Notes: All estimations include GP, geographic, demographic, climatic, and regional controls. A single asterix
denotes significance at the 10% level, double for 5%, and triple for 1%. Robust standard errors are in parentheses.
Total Programs refers to the total number of the possible 15 Government Schemes implemented in the village. BPL
refers to the number of the possible 8 programs targeted at individuals below the poverty line. EGS refers to the
Employment Guarantee Scheme. Revenue/capita refers to data collected from the balance sheets (covers last 24
months) submitted by the GPs (obtained using RTI Act). Revenue comprises taxes (from land, water usage, house,
and other), funds (resources optained from upper level governments), and stamp duties. Expenses/capita refers to
data collected from the balance sheets (covers last 24 months) submitted by the GPs (obtained using RTI Act).
Expenditure items include public goods, subsidies, resource management, and festivals. Number of committees
refers to the total number of GP committees out of a possible 12 that exist in the village. These serve the purpose
for issues such as education, heatlh, beneficiary slection, water usage, village development, and the weekly bazaar.
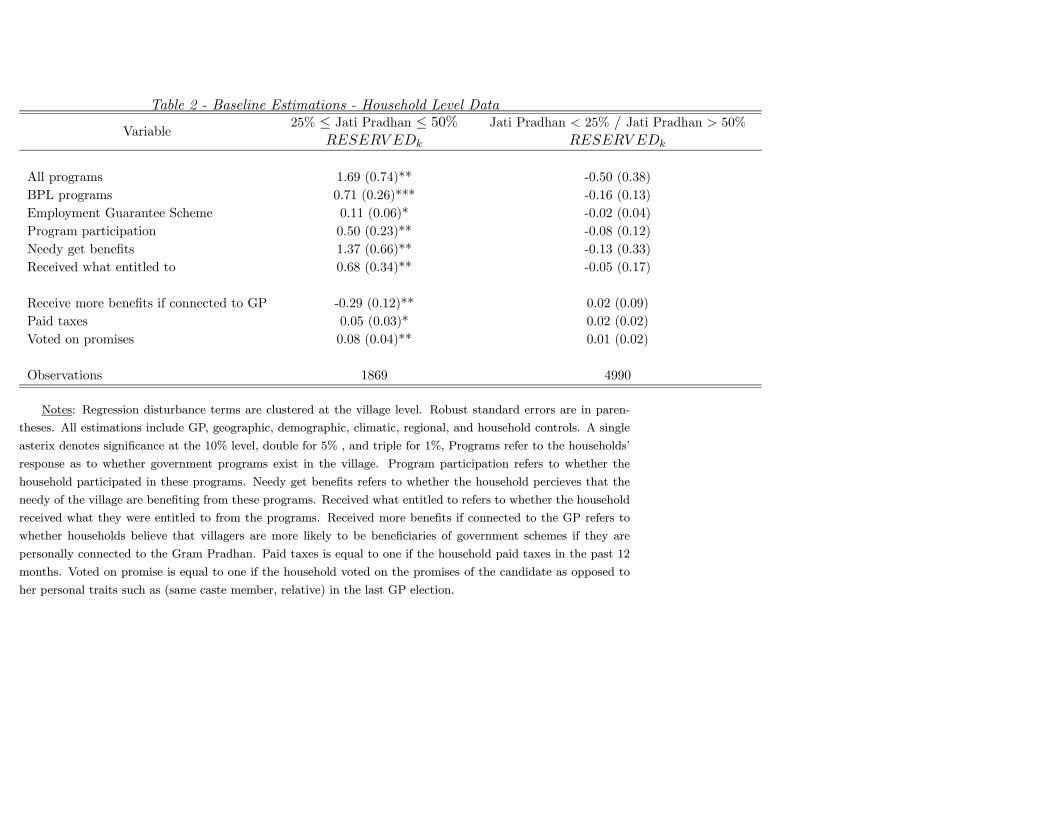
Table 2 - Baseline Estimations - Household Level Data
Variable25% ≤ Jati Pradhan ≤ 50%
UHVHUY HGn
Jati Pradhan ? 25% / Jati Pradhan A 50%
UHVHUY HGn
All programs 1.69 (0.74)** -0.50 (0.38)
BPL programs 0.71 (0.26)*** -0.16 (0.13)
Employment Guarantee Scheme 0.11 (0.06)* -0.02 (0.04)
Program participation 0.50 (0.23)** -0.08 (0.12)
Needy get benefits 1.37 (0.66)** -0.13 (0.33)
Received what entitled to 0.68 (0.34)** -0.05 (0.17)
Receive more benefits if connected to GP -0.29 (0.12)** 0.02 (0.09)
Paid taxes 0.05 (0.03)* 0.02 (0.02)
Voted on promises 0.08 (0.04)** 0.01 (0.02)
Observations 1869 4990
Notes: Regression disturbance terms are clustered at the village level. Robust standard errors are in paren-
theses. All estimations include GP, geographic, demographic, climatic, regional, and household controls. A single
asterix denotes significance at the 10% level, double for 5% , and triple for 1%, Programs refer to the households’
response as to whether government programs exist in the village. Program participation refers to whether the
household participated in these programs. Needy get benefits refers to whether the household percieves that the
needy of the village are benefiting from these programs. Received what entitled to refers to whether the household
received what they were entitled to from the programs. Received more benefits if connected to the GP refers to
whether households believe that villagers are more likely to be beneficiaries of government schemes if they are
personally connected to the Gram Pradhan. Paid taxes is equal to one if the household paid taxes in the past 12
months. Voted on promise is equal to one if the household voted on the promises of the candidate as opposed to
her personal traits such as (same caste member, relative) in the last GP election.
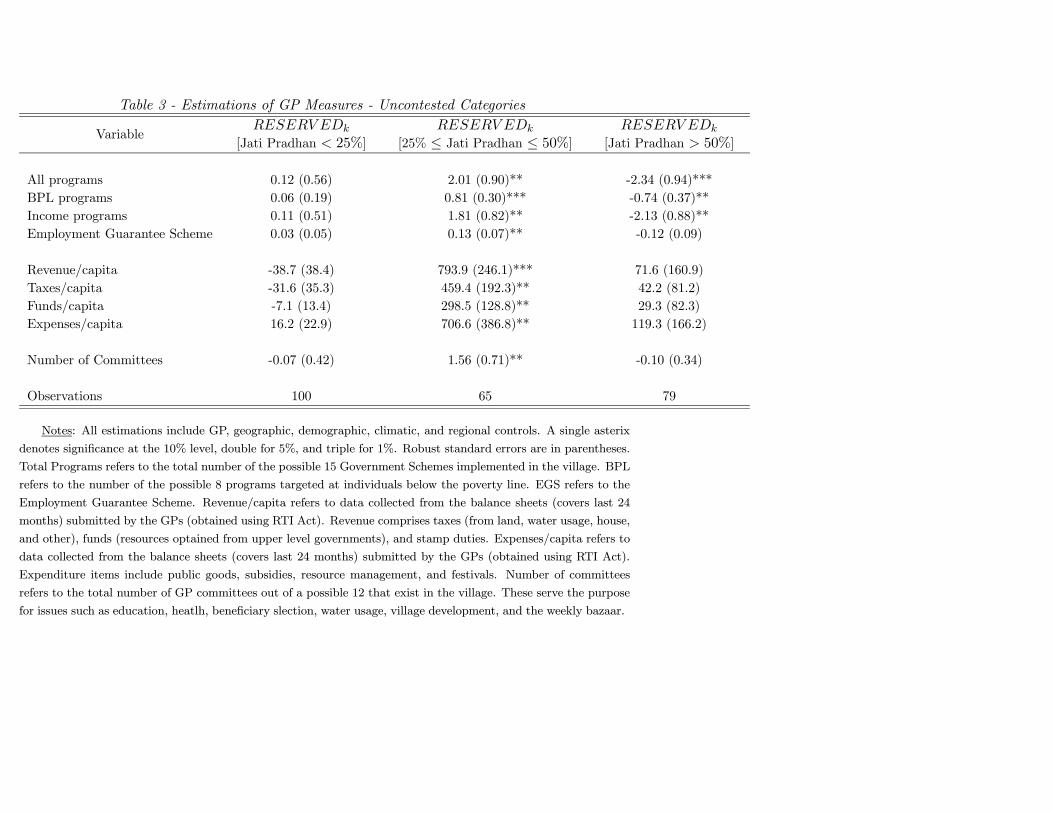
Table 3 - Estimations of GP Measures - Uncontested Categories
VariableUHVHUY HGn
[Jati Pradhan ? 25%]UHVHUY HGn
[25% ≤ Jati Pradhan ≤ 50%]UHVHUY HGn
[Jati Pradhan A 50%]
All programs 0.12 (0.56) 2.01 (0.90)** -2.34 (0.94)***
BPL programs 0.06 (0.19) 0.81 (0.30)*** -0.74 (0.37)**
Income programs 0.11 (0.51) 1.81 (0.82)** -2.13 (0.88)**
Employment Guarantee Scheme 0.03 (0.05) 0.13 (0.07)** -0.12 (0.09)
Revenue/capita -38.7 (38.4) 793.9 (246.1)*** 71.6 (160.9)
Taxes/capita -31.6 (35.3) 459.4 (192.3)** 42.2 (81.2)
Funds/capita -7.1 (13.4) 298.5 (128.8)** 29.3 (82.3)
Expenses/capita 16.2 (22.9) 706.6 (386.8)** 119.3 (166.2)
Number of Committees -0.07 (0.42) 1.56 (0.71)** -0.10 (0.34)
Observations 100 65 79
Notes: All estimations include GP, geographic, demographic, climatic, and regional controls. A single asterix
denotes significance at the 10% level, double for 5%, and triple for 1%. Robust standard errors are in parentheses.
Total Programs refers to the total number of the possible 15 Government Schemes implemented in the village. BPL
refers to the number of the possible 8 programs targeted at individuals below the poverty line. EGS refers to the
Employment Guarantee Scheme. Revenue/capita refers to data collected from the balance sheets (covers last 24
months) submitted by the GPs (obtained using RTI Act). Revenue comprises taxes (from land, water usage, house,
and other), funds (resources optained from upper level governments), and stamp duties. Expenses/capita refers to
data collected from the balance sheets (covers last 24 months) submitted by the GPs (obtained using RTI Act).
Expenditure items include public goods, subsidies, resource management, and festivals. Number of committees
refers to the total number of GP committees out of a possible 12 that exist in the village. These serve the purpose
for issues such as education, heatlh, beneficiary slection, water usage, village development, and the weekly bazaar.
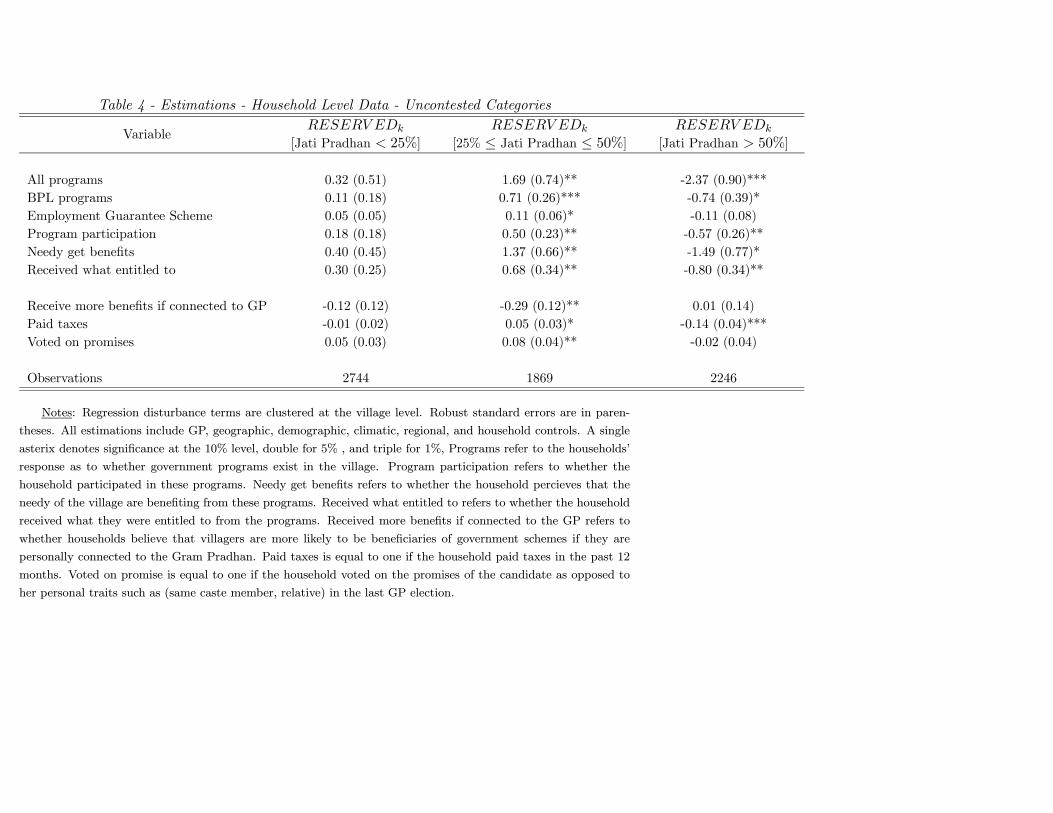
Table 4 - Estimations - Household Level Data - Uncontested Categories
VariableUHVHUY HGn
[Jati Pradhan ? 25%]UHVHUY HGn
[25% ≤ Jati Pradhan ≤ 50%]UHVHUY HGn
[Jati Pradhan A 50%]
All programs 0.32 (0.51) 1.69 (0.74)** -2.37 (0.90)***
BPL programs 0.11 (0.18) 0.71 (0.26)*** -0.74 (0.39)*
Employment Guarantee Scheme 0.05 (0.05) 0.11 (0.06)* -0.11 (0.08)
Program participation 0.18 (0.18) 0.50 (0.23)** -0.57 (0.26)**
Needy get benefits 0.40 (0.45) 1.37 (0.66)** -1.49 (0.77)*
Received what entitled to 0.30 (0.25) 0.68 (0.34)** -0.80 (0.34)**
Receive more benefits if connected to GP -0.12 (0.12) -0.29 (0.12)** 0.01 (0.14)
Paid taxes -0.01 (0.02) 0.05 (0.03)* -0.14 (0.04)***Voted on promises 0.05 (0.03) 0.08 (0.04)** -0.02 (0.04)
Observations 2744 1869 2246
Notes: Regression disturbance terms are clustered at the village level. Robust standard errors are in paren-
theses. All estimations include GP, geographic, demographic, climatic, regional, and household controls. A single
asterix denotes significance at the 10% level, double for 5% , and triple for 1%, Programs refer to the households’
response as to whether government programs exist in the village. Program participation refers to whether the
household participated in these programs. Needy get benefits refers to whether the household percieves that the
needy of the village are benefiting from these programs. Received what entitled to refers to whether the household
received what they were entitled to from the programs. Received more benefits if connected to the GP refers to
whether households believe that villagers are more likely to be beneficiaries of government schemes if they are
personally connected to the Gram Pradhan. Paid taxes is equal to one if the household paid taxes in the past 12
months. Voted on promise is equal to one if the household voted on the promises of the candidate as opposed to
her personal traits such as (same caste member, relative) in the last GP election.
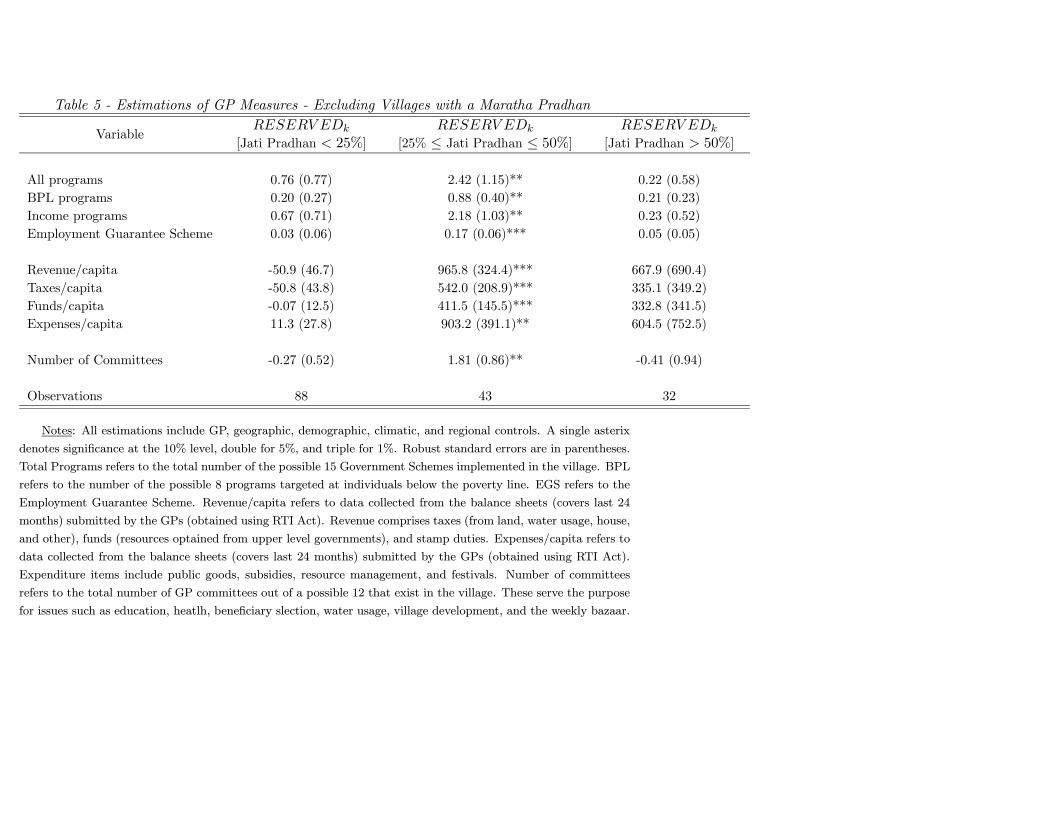
Table 5 - Estimations of GP Measures - Excluding Villages with a Maratha Pradhan
VariableUHVHUY HGn
[Jati Pradhan ? 25%]UHVHUY HGn
[25% ≤ Jati Pradhan ≤ 50%]UHVHUY HGn
[Jati Pradhan A 50%]
All programs 0.76 (0.77) 2.42 (1.15)** 0.22 (0.58)
BPL programs 0.20 (0.27) 0.88 (0.40)** 0.21 (0.23)
Income programs 0.67 (0.71) 2.18 (1.03)** 0.23 (0.52)
Employment Guarantee Scheme 0.03 (0.06) 0.17 (0.06)*** 0.05 (0.05)
Revenue/capita -50.9 (46.7) 965.8 (324.4)*** 667.9 (690.4)
Taxes/capita -50.8 (43.8) 542.0 (208.9)*** 335.1 (349.2)
Funds/capita -0.07 (12.5) 411.5 (145.5)*** 332.8 (341.5)
Expenses/capita 11.3 (27.8) 903.2 (391.1)** 604.5 (752.5)
Number of Committees -0.27 (0.52) 1.81 (0.86)** -0.41 (0.94)
Observations 88 43 32
Notes: All estimations include GP, geographic, demographic, climatic, and regional controls. A single asterix
denotes significance at the 10% level, double for 5%, and triple for 1%. Robust standard errors are in parentheses.
Total Programs refers to the total number of the possible 15 Government Schemes implemented in the village. BPL
refers to the number of the possible 8 programs targeted at individuals below the poverty line. EGS refers to the
Employment Guarantee Scheme. Revenue/capita refers to data collected from the balance sheets (covers last 24
months) submitted by the GPs (obtained using RTI Act). Revenue comprises taxes (from land, water usage, house,
and other), funds (resources optained from upper level governments), and stamp duties. Expenses/capita refers to
data collected from the balance sheets (covers last 24 months) submitted by the GPs (obtained using RTI Act).
Expenditure items include public goods, subsidies, resource management, and festivals. Number of committees
refers to the total number of GP committees out of a possible 12 that exist in the village. These serve the purpose
for issues such as education, heatlh, beneficiary slection, water usage, village development, and the weekly bazaar.
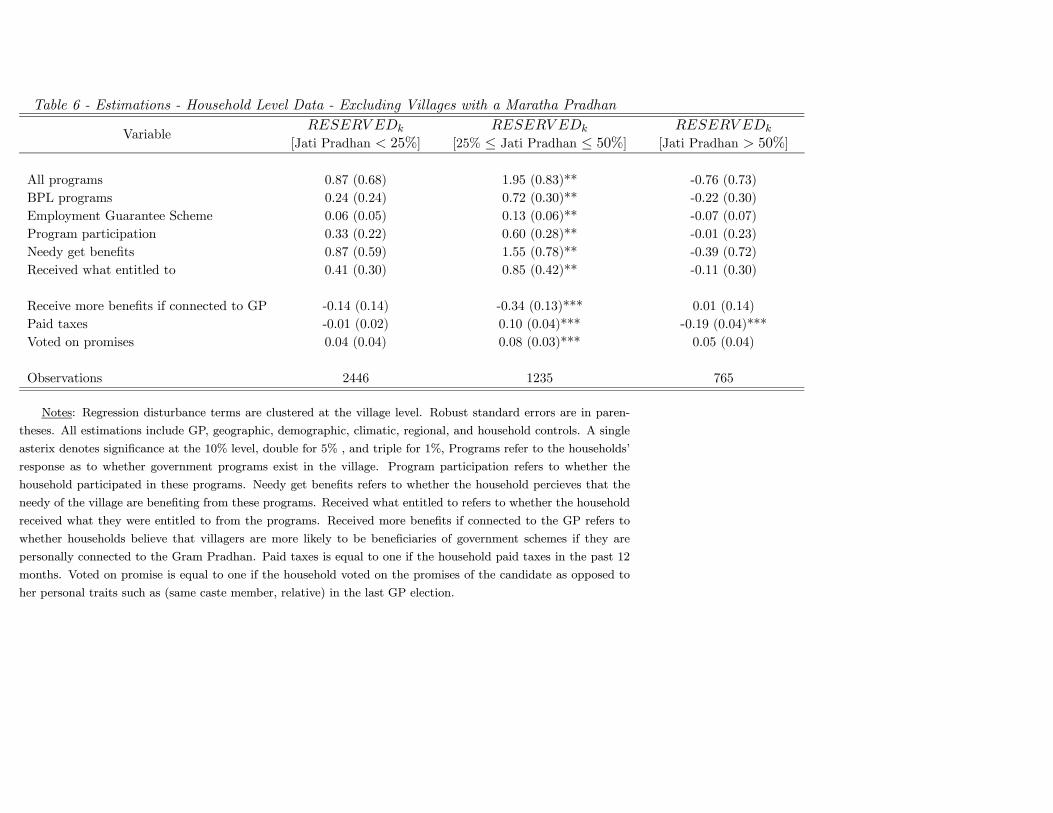
Table 6 - Estimations - Household Level Data - Excluding Villages with a Maratha Pradhan
VariableUHVHUY HGn
[Jati Pradhan ? 25%]UHVHUY HGn
[25% ≤ Jati Pradhan ≤ 50%]UHVHUY HGn
[Jati Pradhan A 50%]
All programs 0.87 (0.68) 1.95 (0.83)** -0.76 (0.73)
BPL programs 0.24 (0.24) 0.72 (0.30)** -0.22 (0.30)
Employment Guarantee Scheme 0.06 (0.05) 0.13 (0.06)** -0.07 (0.07)
Program participation 0.33 (0.22) 0.60 (0.28)** -0.01 (0.23)
Needy get benefits 0.87 (0.59) 1.55 (0.78)** -0.39 (0.72)
Received what entitled to 0.41 (0.30) 0.85 (0.42)** -0.11 (0.30)
Receive more benefits if connected to GP -0.14 (0.14) -0.34 (0.13)*** 0.01 (0.14)
Paid taxes -0.01 (0.02) 0.10 (0.04)*** -0.19 (0.04)***Voted on promises 0.04 (0.04) 0.08 (0.03)*** 0.05 (0.04)
Observations 2446 1235 765
Notes: Regression disturbance terms are clustered at the village level. Robust standard errors are in paren-
theses. All estimations include GP, geographic, demographic, climatic, regional, and household controls. A single
asterix denotes significance at the 10% level, double for 5% , and triple for 1%, Programs refer to the households’
response as to whether government programs exist in the village. Program participation refers to whether the
household participated in these programs. Needy get benefits refers to whether the household percieves that the
needy of the village are benefiting from these programs. Received what entitled to refers to whether the household
received what they were entitled to from the programs. Received more benefits if connected to the GP refers to
whether households believe that villagers are more likely to be beneficiaries of government schemes if they are
personally connected to the Gram Pradhan. Paid taxes is equal to one if the household paid taxes in the past 12
months. Voted on promise is equal to one if the household voted on the promises of the candidate as opposed to
her personal traits such as (same caste member, relative) in the last GP election.
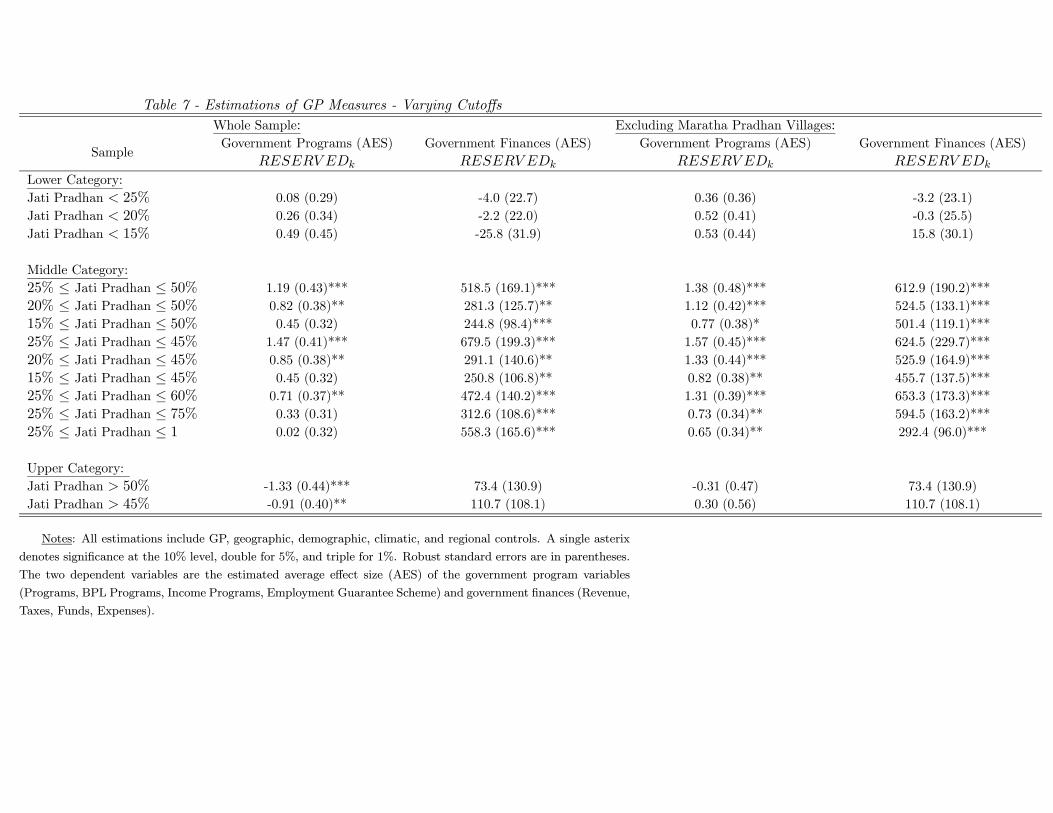
Table 7 - Estimations of GP Measures - Varying Cutoffs
Whole Sample: Excluding Maratha Pradhan Villages:
SampleGovernment Programs (AES)
UHVHUY HGn
Government Finances (AES)
UHVHUY HGn
Government Programs (AES)
UHVHUY HGn
Government Finances (AES)
UHVHUY HGn
Lower Category:
Jati Pradhan ? 25% 0.08 (0.29) -4.0 (22.7) 0.36 (0.36) -3.2 (23.1)
Jati Pradhan ? 20% 0.26 (0.34) -2.2 (22.0) 0.52 (0.41) -0.3 (25.5)
Jati Pradhan ? 15% 0.49 (0.45) -25.8 (31.9) 0.53 (0.44) 15.8 (30.1)
Middle Category:
25% ≤ Jati Pradhan ≤ 50% 1.19 (0.43)*** 518.5 (169.1)*** 1.38 (0.48)*** 612.9 (190.2)***
20% ≤ Jati Pradhan ≤ 50% 0.82 (0.38)** 281.3 (125.7)** 1.12 (0.42)*** 524.5 (133.1)***
15% ≤ Jati Pradhan ≤ 50% 0.45 (0.32) 244.8 (98.4)*** 0.77 (0.38)* 501.4 (119.1)***
25% ≤ Jati Pradhan ≤ 45% 1.47 (0.41)*** 679.5 (199.3)*** 1.57 (0.45)*** 624.5 (229.7)***
20% ≤ Jati Pradhan ≤ 45% 0.85 (0.38)** 291.1 (140.6)** 1.33 (0.44)*** 525.9 (164.9)***
15% ≤ Jati Pradhan ≤ 45% 0.45 (0.32) 250.8 (106.8)** 0.82 (0.38)** 455.7 (137.5)***
25% ≤ Jati Pradhan ≤ 60% 0.71 (0.37)** 472.4 (140.2)*** 1.31 (0.39)*** 653.3 (173.3)***
25% ≤ Jati Pradhan ≤ 75% 0.33 (0.31) 312.6 (108.6)*** 0.73 (0.34)** 594.5 (163.2)***
25% ≤ Jati Pradhan ≤ 1 0.02 (0.32) 558.3 (165.6)*** 0.65 (0.34)** 292.4 (96.0)***
Upper Category:
Jati Pradhan A 50% -1.33 (0.44)*** 73.4 (130.9) -0.31 (0.47) 73.4 (130.9)
Jati Pradhan A 45% -0.91 (0.40)** 110.7 (108.1) 0.30 (0.56) 110.7 (108.1)
Notes: All estimations include GP, geographic, demographic, climatic, and regional controls. A single asterix
denotes significance at the 10% level, double for 5%, and triple for 1%. Robust standard errors are in parentheses.
The two dependent variables are the estimated average effect size (AES) of the government program variables
(Programs, BPL Programs, Income Programs, Employment Guarantee Scheme) and government finances (Revenue,
Taxes, Funds, Expenses).
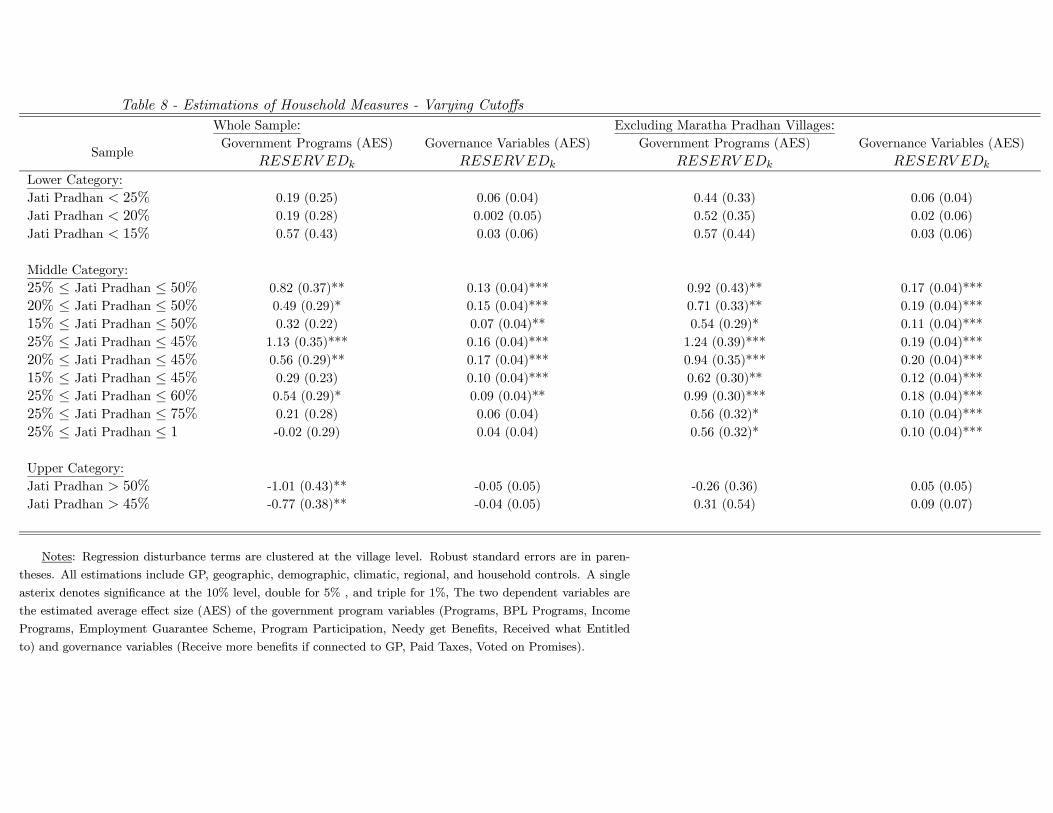
Table 8 - Estimations of Household Measures - Varying Cutoffs
Whole Sample: Excluding Maratha Pradhan Villages:
SampleGovernment Programs (AES)
UHVHUY HGn
Governance Variables (AES)
UHVHUY HGn
Government Programs (AES)
UHVHUY HGn
Governance Variables (AES)
UHVHUY HGn
Lower Category:
Jati Pradhan ? 25% 0.19 (0.25) 0.06 (0.04) 0.44 (0.33) 0.06 (0.04)
Jati Pradhan ? 20% 0.19 (0.28) 0.002 (0.05) 0.52 (0.35) 0.02 (0.06)
Jati Pradhan ? 15% 0.57 (0.43) 0.03 (0.06) 0.57 (0.44) 0.03 (0.06)
Middle Category:
25% ≤ Jati Pradhan ≤ 50% 0.82 (0.37)** 0.13 (0.04)*** 0.92 (0.43)** 0.17 (0.04)***
20% ≤ Jati Pradhan ≤ 50% 0.49 (0.29)* 0.15 (0.04)*** 0.71 (0.33)** 0.19 (0.04)***
15% ≤ Jati Pradhan ≤ 50% 0.32 (0.22) 0.07 (0.04)** 0.54 (0.29)* 0.11 (0.04)***
25% ≤ Jati Pradhan ≤ 45% 1.13 (0.35)*** 0.16 (0.04)*** 1.24 (0.39)*** 0.19 (0.04)***
20% ≤ Jati Pradhan ≤ 45% 0.56 (0.29)** 0.17 (0.04)*** 0.94 (0.35)*** 0.20 (0.04)***
15% ≤ Jati Pradhan ≤ 45% 0.29 (0.23) 0.10 (0.04)*** 0.62 (0.30)** 0.12 (0.04)***
25% ≤ Jati Pradhan ≤ 60% 0.54 (0.29)* 0.09 (0.04)** 0.99 (0.30)*** 0.18 (0.04)***
25% ≤ Jati Pradhan ≤ 75% 0.21 (0.28) 0.06 (0.04) 0.56 (0.32)* 0.10 (0.04)***
25% ≤ Jati Pradhan ≤ 1 -0.02 (0.29) 0.04 (0.04) 0.56 (0.32)* 0.10 (0.04)***
Upper Category:
Jati Pradhan A 50% -1.01 (0.43)** -0.05 (0.05) -0.26 (0.36) 0.05 (0.05)
Jati Pradhan A 45% -0.77 (0.38)** -0.04 (0.05) 0.31 (0.54) 0.09 (0.07)
Notes: Regression disturbance terms are clustered at the village level. Robust standard errors are in paren-
theses. All estimations include GP, geographic, demographic, climatic, regional, and household controls. A single
asterix denotes significance at the 10% level, double for 5% , and triple for 1%, The two dependent variables are
the estimated average effect size (AES) of the government program variables (Programs, BPL Programs, Income
Programs, Employment Guarantee Scheme, Program Participation, Needy get Benefits, Received what Entitled
to) and governance variables (Receive more benefits if connected to GP, Paid Taxes, Voted on Promises).
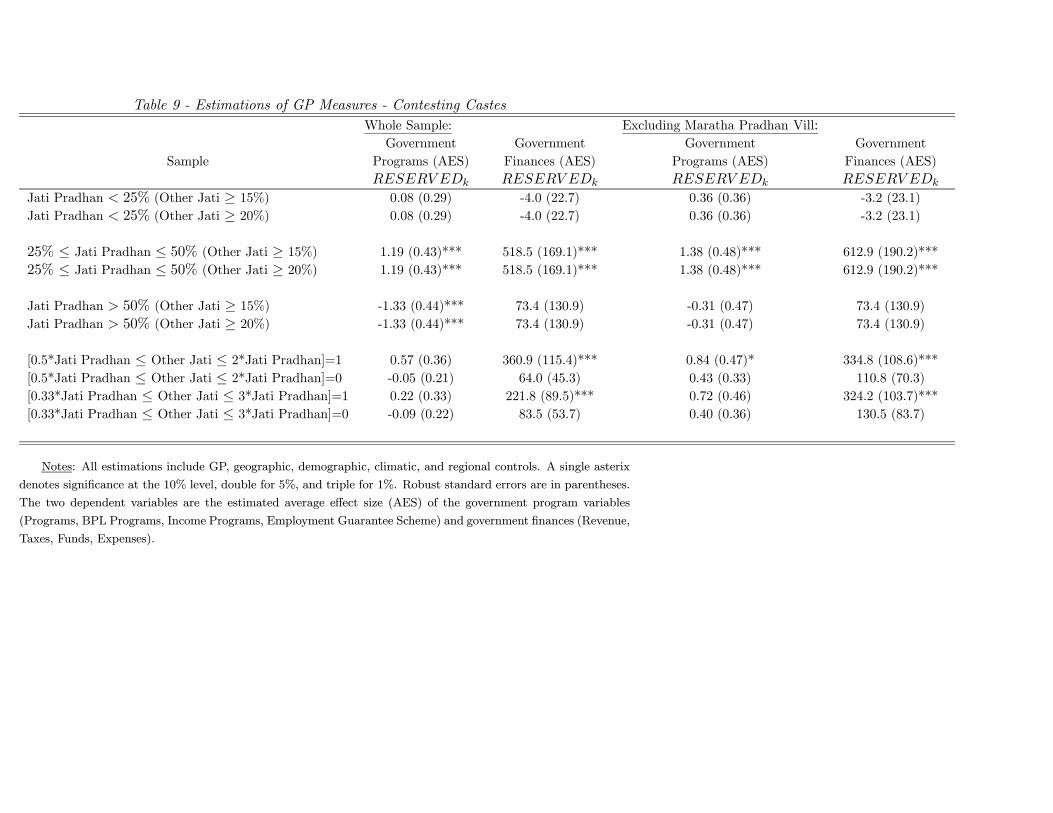
Table 9 - Estimations of GP Measures - Contesting Castes
Whole Sample: Excluding Maratha Pradhan Vill:
Sample
Government
Programs (AES)
UHVHUY HGn
Government
Finances (AES)
UHVHUY HGn
Government
Programs (AES)
UHVHUY HGn
Government
Finances (AES)
UHVHUY HGn
Jati Pradhan ? 25% (Other Jati ≥ 15%) 0.08 (0.29) -4.0 (22.7) 0.36 (0.36) -3.2 (23.1)
Jati Pradhan ? 25% (Other Jati ≥ 20%) 0.08 (0.29) -4.0 (22.7) 0.36 (0.36) -3.2 (23.1)
25% ≤ Jati Pradhan ≤ 50% (Other Jati ≥ 15%) 1.19 (0.43)*** 518.5 (169.1)*** 1.38 (0.48)*** 612.9 (190.2)***
25% ≤ Jati Pradhan ≤ 50% (Other Jati ≥ 20%) 1.19 (0.43)*** 518.5 (169.1)*** 1.38 (0.48)*** 612.9 (190.2)***
Jati Pradhan A 50% (Other Jati ≥ 15%) -1.33 (0.44)*** 73.4 (130.9) -0.31 (0.47) 73.4 (130.9)
Jati Pradhan A 50% (Other Jati ≥ 20%) -1.33 (0.44)*** 73.4 (130.9) -0.31 (0.47) 73.4 (130.9)
[0.5*Jati Pradhan ≤ Other Jati ≤ 2*Jati Pradhan]=1 0.57 (0.36) 360.9 (115.4)*** 0.84 (0.47)* 334.8 (108.6)***
[0.5*Jati Pradhan ≤ Other Jati ≤ 2*Jati Pradhan]=0 -0.05 (0.21) 64.0 (45.3) 0.43 (0.33) 110.8 (70.3)
[0.33*Jati Pradhan ≤ Other Jati ≤ 3*Jati Pradhan]=1 0.22 (0.33) 221.8 (89.5)*** 0.72 (0.46) 324.2 (103.7)***
[0.33*Jati Pradhan ≤ Other Jati ≤ 3*Jati Pradhan]=0 -0.09 (0.22) 83.5 (53.7) 0.40 (0.36) 130.5 (83.7)
Notes: All estimations include GP, geographic, demographic, climatic, and regional controls. A single asterix
denotes significance at the 10% level, double for 5%, and triple for 1%. Robust standard errors are in parentheses.
The two dependent variables are the estimated average effect size (AES) of the government program variables
(Programs, BPL Programs, Income Programs, Employment Guarantee Scheme) and government finances (Revenue,
Taxes, Funds, Expenses).
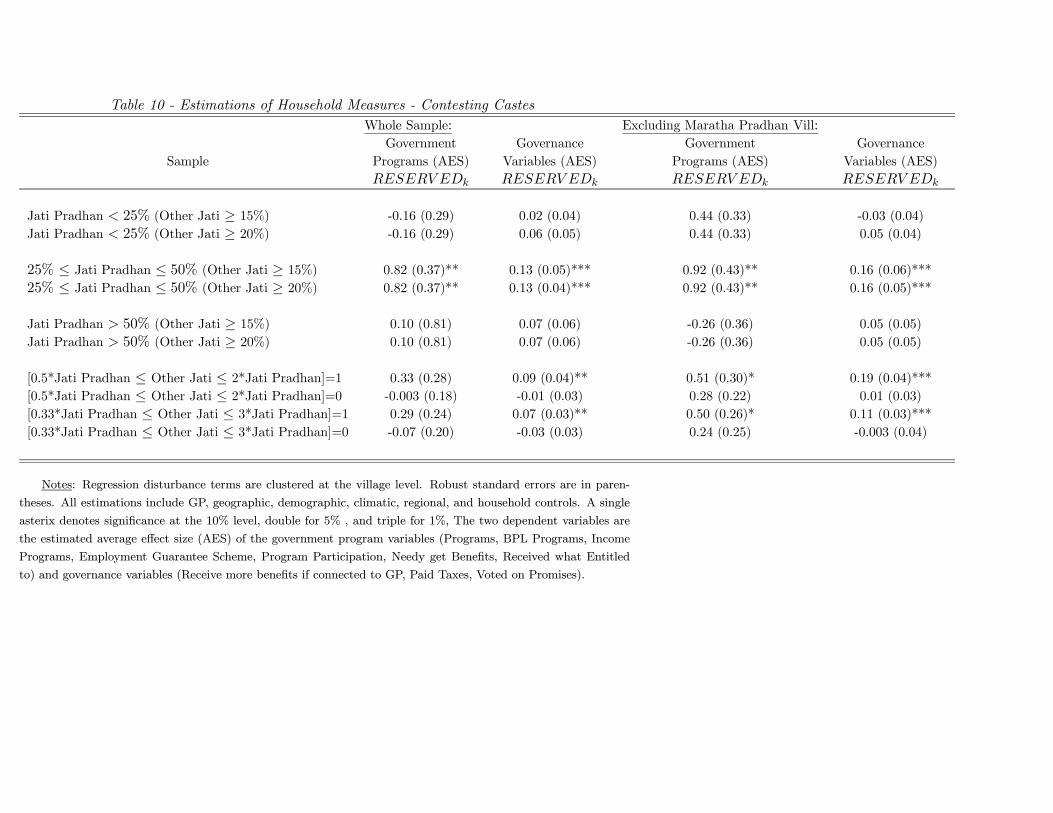
Table 10 - Estimations of Household Measures - Contesting Castes
Whole Sample: Excluding Maratha Pradhan Vill:
Sample
Government
Programs (AES)
UHVHUY HGn
Governance
Variables (AES)
UHVHUY HGn
Government
Programs (AES)
UHVHUY HGn
Governance
Variables (AES)
UHVHUY HGn
Jati Pradhan ? 25% (Other Jati ≥ 15%) -0.16 (0.29) 0.02 (0.04) 0.44 (0.33) -0.03 (0.04)
Jati Pradhan ? 25% (Other Jati ≥ 20%) -0.16 (0.29) 0.06 (0.05) 0.44 (0.33) 0.05 (0.04)
25% ≤ Jati Pradhan ≤ 50% (Other Jati ≥ 15%) 0.82 (0.37)** 0.13 (0.05)*** 0.92 (0.43)** 0.16 (0.06)***
25% ≤ Jati Pradhan ≤ 50% (Other Jati ≥ 20%) 0.82 (0.37)** 0.13 (0.04)*** 0.92 (0.43)** 0.16 (0.05)***
Jati Pradhan A 50% (Other Jati ≥ 15%) 0.10 (0.81) 0.07 (0.06) -0.26 (0.36) 0.05 (0.05)
Jati Pradhan A 50% (Other Jati ≥ 20%) 0.10 (0.81) 0.07 (0.06) -0.26 (0.36) 0.05 (0.05)
[0.5*Jati Pradhan ≤ Other Jati ≤ 2*Jati Pradhan]=1 0.33 (0.28) 0.09 (0.04)** 0.51 (0.30)* 0.19 (0.04)***
[0.5*Jati Pradhan ≤ Other Jati ≤ 2*Jati Pradhan]=0 -0.003 (0.18) -0.01 (0.03) 0.28 (0.22) 0.01 (0.03)
[0.33*Jati Pradhan ≤ Other Jati ≤ 3*Jati Pradhan]=1 0.29 (0.24) 0.07 (0.03)** 0.50 (0.26)* 0.11 (0.03)***
[0.33*Jati Pradhan ≤ Other Jati ≤ 3*Jati Pradhan]=0 -0.07 (0.20) -0.03 (0.03) 0.24 (0.25) -0.003 (0.04)
Notes: Regression disturbance terms are clustered at the village level. Robust standard errors are in paren-
theses. All estimations include GP, geographic, demographic, climatic, regional, and household controls. A single
asterix denotes significance at the 10% level, double for 5% , and triple for 1%, The two dependent variables are
the estimated average effect size (AES) of the government program variables (Programs, BPL Programs, Income
Programs, Employment Guarantee Scheme, Program Participation, Needy get Benefits, Received what Entitled
to) and governance variables (Receive more benefits if connected to GP, Paid Taxes, Voted on Promises).
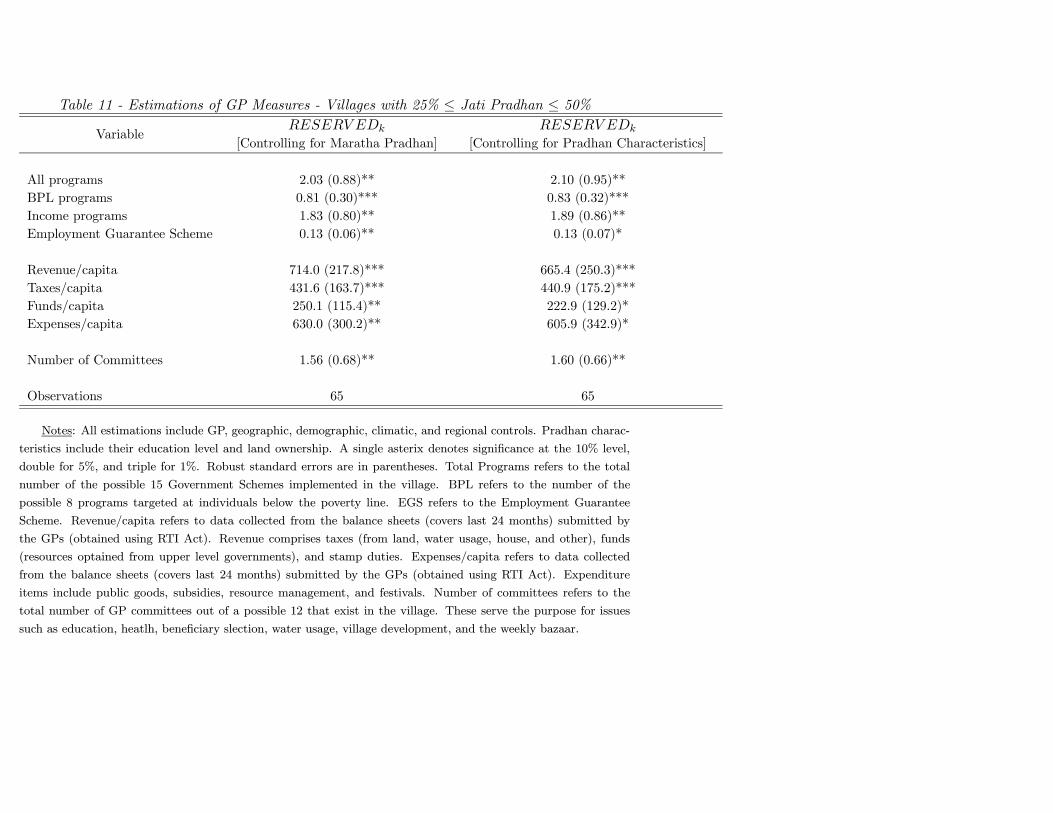
Table 11 - Estimations of GP Measures - Villages with 25% ≤ Jati Pradhan ≤ 50%
VariableUHVHUY HGn
[Controlling for Maratha Pradhan]
UHVHUY HGn
[Controlling for Pradhan Characteristics]
All programs 2.03 (0.88)** 2.10 (0.95)**
BPL programs 0.81 (0.30)*** 0.83 (0.32)***
Income programs 1.83 (0.80)** 1.89 (0.86)**
Employment Guarantee Scheme 0.13 (0.06)** 0.13 (0.07)*
Revenue/capita 714.0 (217.8)*** 665.4 (250.3)***
Taxes/capita 431.6 (163.7)*** 440.9 (175.2)***
Funds/capita 250.1 (115.4)** 222.9 (129.2)*
Expenses/capita 630.0 (300.2)** 605.9 (342.9)*
Number of Committees 1.56 (0.68)** 1.60 (0.66)**
Observations 65 65
Notes: All estimations include GP, geographic, demographic, climatic, and regional controls. Pradhan charac-
teristics include their education level and land ownership. A single asterix denotes significance at the 10% level,
double for 5%, and triple for 1%. Robust standard errors are in parentheses. Total Programs refers to the total
number of the possible 15 Government Schemes implemented in the village. BPL refers to the number of the
possible 8 programs targeted at individuals below the poverty line. EGS refers to the Employment Guarantee
Scheme. Revenue/capita refers to data collected from the balance sheets (covers last 24 months) submitted by
the GPs (obtained using RTI Act). Revenue comprises taxes (from land, water usage, house, and other), funds
(resources optained from upper level governments), and stamp duties. Expenses/capita refers to data collected
from the balance sheets (covers last 24 months) submitted by the GPs (obtained using RTI Act). Expenditure
items include public goods, subsidies, resource management, and festivals. Number of committees refers to the
total number of GP committees out of a possible 12 that exist in the village. These serve the purpose for issues
such as education, heatlh, beneficiary slection, water usage, village development, and the weekly bazaar.
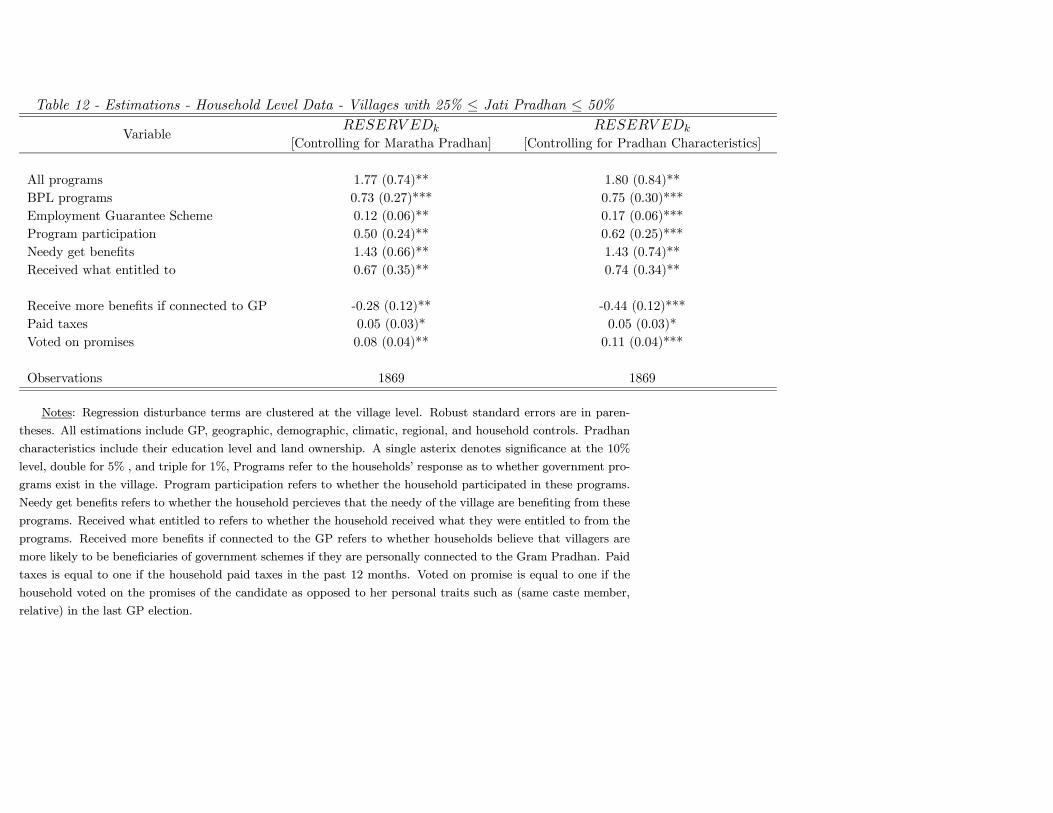
Table 12 - Estimations - Household Level Data - Villages with 25% ≤ Jati Pradhan ≤ 50%
VariableUHVHUY HGn
[Controlling for Maratha Pradhan]
UHVHUY HGn
[Controlling for Pradhan Characteristics]
All programs 1.77 (0.74)** 1.80 (0.84)**
BPL programs 0.73 (0.27)*** 0.75 (0.30)***
Employment Guarantee Scheme 0.12 (0.06)** 0.17 (0.06)***
Program participation 0.50 (0.24)** 0.62 (0.25)***
Needy get benefits 1.43 (0.66)** 1.43 (0.74)**
Received what entitled to 0.67 (0.35)** 0.74 (0.34)**
Receive more benefits if connected to GP -0.28 (0.12)** -0.44 (0.12)***
Paid taxes 0.05 (0.03)* 0.05 (0.03)*
Voted on promises 0.08 (0.04)** 0.11 (0.04)***
Observations 1869 1869
Notes: Regression disturbance terms are clustered at the village level. Robust standard errors are in paren-
theses. All estimations include GP, geographic, demographic, climatic, regional, and household controls. Pradhan
characteristics include their education level and land ownership. A single asterix denotes significance at the 10%
level, double for 5% , and triple for 1%, Programs refer to the households’ response as to whether government pro-
grams exist in the village. Program participation refers to whether the household participated in these programs.
Needy get benefits refers to whether the household percieves that the needy of the village are benefiting from these
programs. Received what entitled to refers to whether the household received what they were entitled to from the
programs. Received more benefits if connected to the GP refers to whether households believe that villagers are
more likely to be beneficiaries of government schemes if they are personally connected to the Gram Pradhan. Paid
taxes is equal to one if the household paid taxes in the past 12 months. Voted on promise is equal to one if the
household voted on the promises of the candidate as opposed to her personal traits such as (same caste member,
relative) in the last GP election.
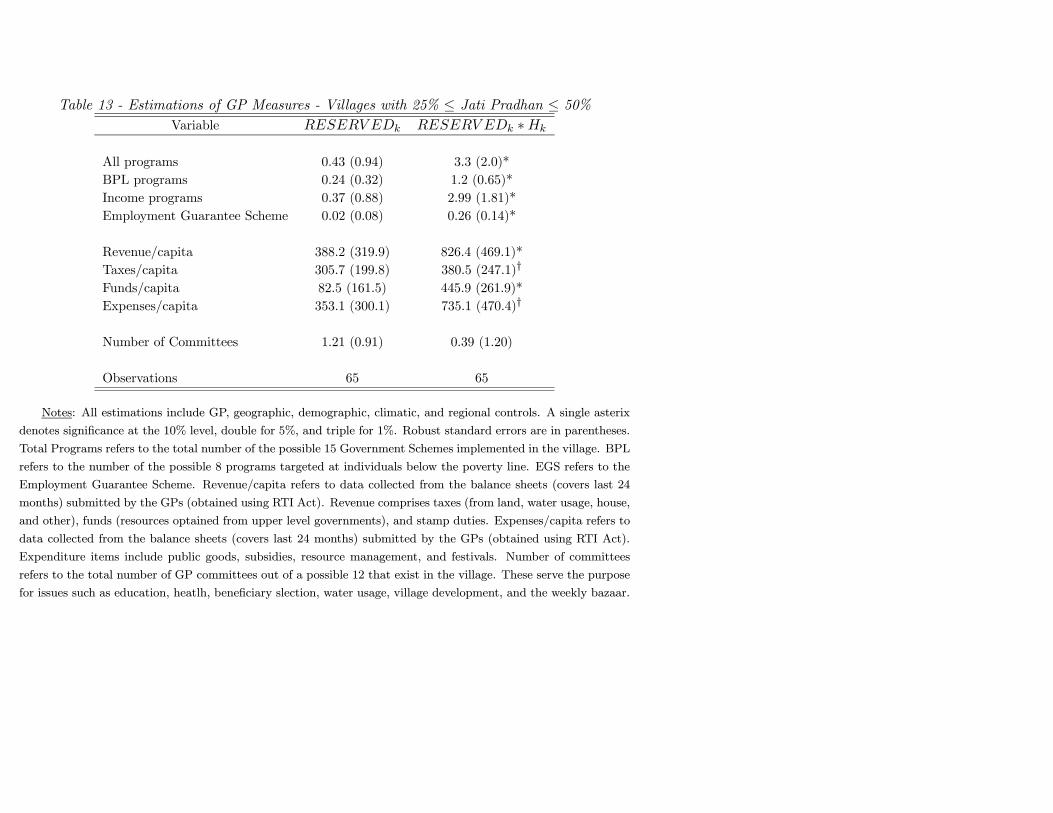
Table 13 - Estimations of GP Measures - Villages with 25% ≤ Jati Pradhan ≤ 50%Variable UHVHUY HGn UHVHUY HGn ∗Kn
All programs 0.43 (0.94) 3.3 (2.0)*
BPL programs 0.24 (0.32) 1.2 (0.65)*
Income programs 0.37 (0.88) 2.99 (1.81)*
Employment Guarantee Scheme 0.02 (0.08) 0.26 (0.14)*
Revenue/capita 388.2 (319.9) 826.4 (469.1)*
Taxes/capita 305.7 (199.8) 380.5 (247.1)†
Funds/capita 82.5 (161.5) 445.9 (261.9)*
Expenses/capita 353.1 (300.1) 735.1 (470.4)†
Number of Committees 1.21 (0.91) 0.39 (1.20)
Observations 65 65
Notes: All estimations include GP, geographic, demographic, climatic, and regional controls. A single asterix
denotes significance at the 10% level, double for 5%, and triple for 1%. Robust standard errors are in parentheses.
Total Programs refers to the total number of the possible 15 Government Schemes implemented in the village. BPL
refers to the number of the possible 8 programs targeted at individuals below the poverty line. EGS refers to the
Employment Guarantee Scheme. Revenue/capita refers to data collected from the balance sheets (covers last 24
months) submitted by the GPs (obtained using RTI Act). Revenue comprises taxes (from land, water usage, house,
and other), funds (resources optained from upper level governments), and stamp duties. Expenses/capita refers to
data collected from the balance sheets (covers last 24 months) submitted by the GPs (obtained using RTI Act).
Expenditure items include public goods, subsidies, resource management, and festivals. Number of committees
refers to the total number of GP committees out of a possible 12 that exist in the village. These serve the purpose
for issues such as education, heatlh, beneficiary slection, water usage, village development, and the weekly bazaar.
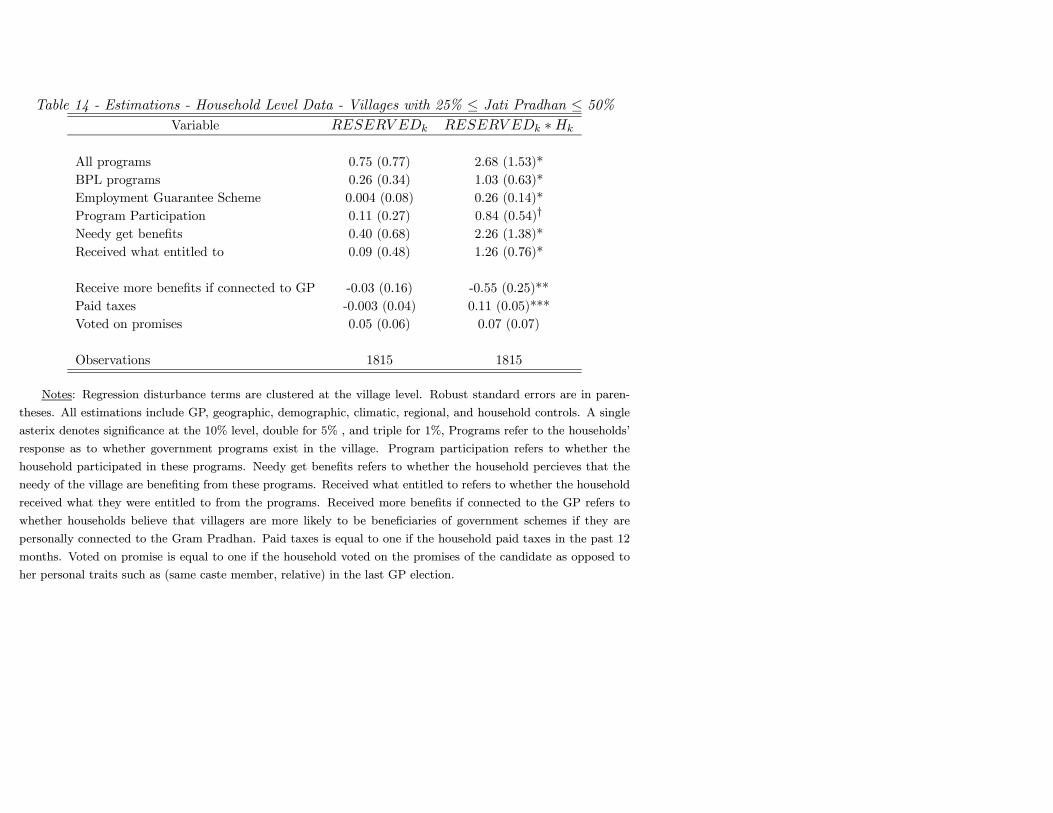
Table 14 - Estimations - Household Level Data - Villages with 25% ≤ Jati Pradhan ≤ 50%Variable UHVHUY HGn UHVHUY HGn ∗Kn
All programs 0.75 (0.77) 2.68 (1.53)*
BPL programs 0.26 (0.34) 1.03 (0.63)*
Employment Guarantee Scheme 0.004 (0.08) 0.26 (0.14)*
Program Participation 0.11 (0.27) 0.84 (0.54)†
Needy get benefits 0.40 (0.68) 2.26 (1.38)*
Received what entitled to 0.09 (0.48) 1.26 (0.76)*
Receive more benefits if connected to GP -0.03 (0.16) -0.55 (0.25)**
Paid taxes -0.003 (0.04) 0.11 (0.05)***
Voted on promises 0.05 (0.06) 0.07 (0.07)
Observations 1815 1815
Notes: Regression disturbance terms are clustered at the village level. Robust standard errors are in paren-
theses. All estimations include GP, geographic, demographic, climatic, regional, and household controls. A single
asterix denotes significance at the 10% level, double for 5% , and triple for 1%, Programs refer to the households’
response as to whether government programs exist in the village. Program participation refers to whether the
household participated in these programs. Needy get benefits refers to whether the household percieves that the
needy of the village are benefiting from these programs. Received what entitled to refers to whether the household
received what they were entitled to from the programs. Received more benefits if connected to the GP refers to
whether households believe that villagers are more likely to be beneficiaries of government schemes if they are
personally connected to the Gram Pradhan. Paid taxes is equal to one if the household paid taxes in the past 12
months. Voted on promise is equal to one if the household voted on the promises of the candidate as opposed to
her personal traits such as (same caste member, relative) in the last GP election.
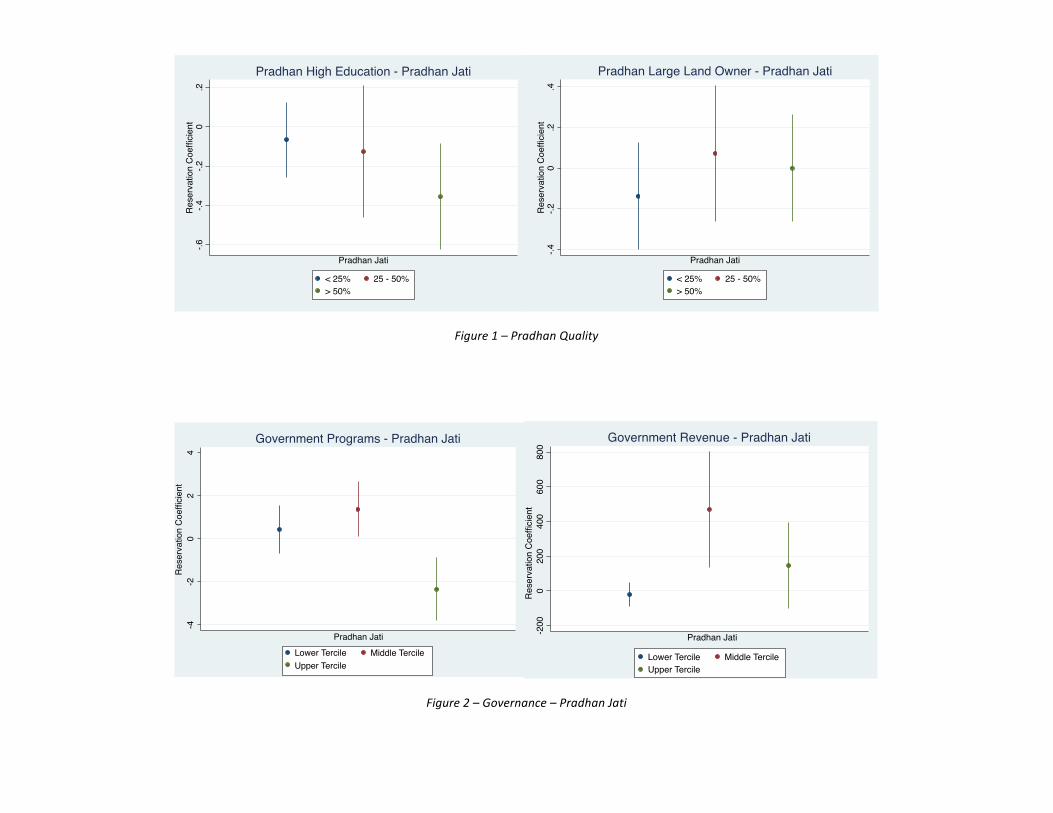
!!
!!
Figure!1!–!Pradhan!Quality!!!!!
!!
Figure!2!–!Governance!–!Pradhan!Jati!
-.6-.4
-.20
.2R
eser
vatio
n C
oeffi
cien
t
Pradhan Jati
< 25% 25 - 50%> 50%
Pradhan High Education - Pradhan Jati
-.4-.2
0.2
.4Re
serv
atio
n Co
effic
ient
Pradhan Jati
< 25% 25 - 50%> 50%
Pradhan Large Land Owner - Pradhan Jati
-4-2
02
4
Middle TercileUpper TercileLower Tercile
Government Programs - Pradhan Jati
Res
erva
tion
Coe
ffici
ent
Pradhan Jati -200
020
040
060
080
0
Lower Tercile Middle TercileUpper Tercile
Government Revenue - Pradhan Jati
Pradhan Jati
Res
erva
tion
Coe
ffici
ent
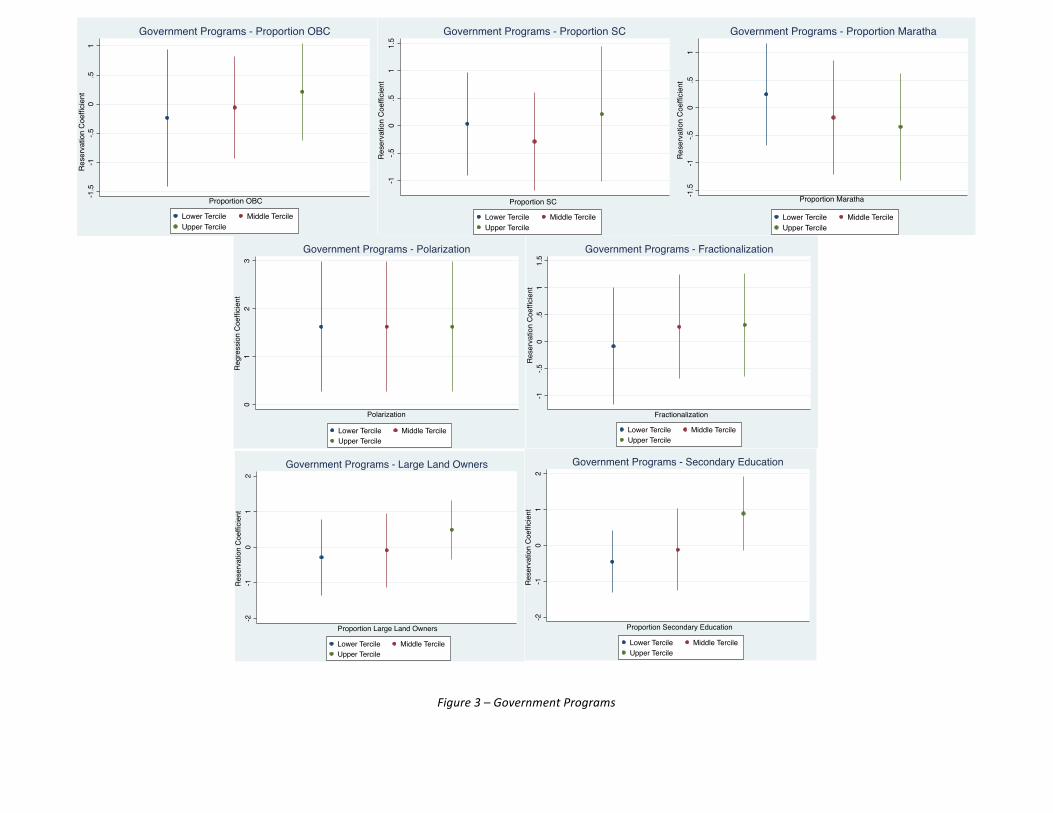
!
!
!!
!Figure!3!–!Government!Programs!
!!
! !
-1.5
-1-.5
0.5
1
Lower Tercile Middle TercileUpper Tercile
Government Programs - Proportion OBC
Proportion OBC
Rese
rvat
ion
Coef
ficie
nt
-1-.5
0.5
11.
5
Lower Tercile Middle TercileUpper Tercile
Government Programs - Proportion SC
Proportion SC
Res
erva
tion
Coe
ffici
ent
-1.5
-1-.5
0.5
1
Lower Tercile Middle TercileUpper Tercile
Government Programs - Proportion Maratha
Proportion Maratha
Res
erva
tion
Coe
ffici
ent
01
23
Lower Tercile Middle TercileUpper Tercile
Government Programs - Polarization
Polarization
Reg
ress
ion
Coe
ffici
ent
-1-.5
0.5
11.
5
Lower Tercile Middle TercileUpper Tercile
Government Programs - Fractionalization
Fractionalization
Res
erva
tion
Coe
ffici
ent
-2-1
01
2
Lower Tercile Middle TercileUpper Tercile
Government Programs - Large Land Owners
Proportion Large Land Owners
Rese
rvat
ion
Coef
ficie
nt
-2-1
01
2
Lower Tercile Middle TercileUpper Tercile
Government Programs - Secondary Education
Proportion Secondary Education
Res
erva
tion
Coe
ffici
ent
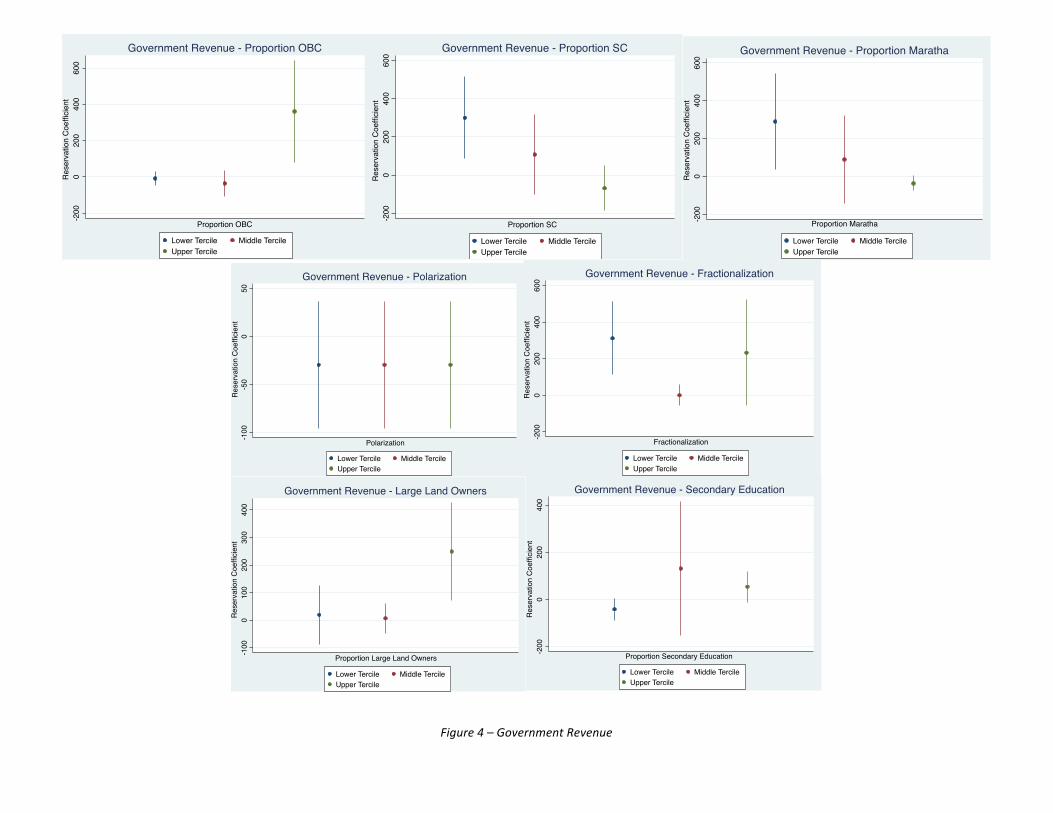
!
!
!
!!!
Figure!4!–!Government!Revenue!
-200
020
040
060
0
Lower Tercile Middle TercileUpper Tercile
Government Revenue - Proportion OBC
Proportion OBC
Rese
rvat
ion
Coef
ficie
nt
-200
020
040
060
0
Lower Tercile Middle TercileUpper Tercile
Government Revenue - Proportion SC
Proportion SC
Res
erva
tion
Coe
ffici
ent
-200
020
040
060
0
Lower Tercile Middle TercileUpper Tercile
Government Revenue - Proportion Maratha
Proportion Maratha
Res
erva
tion
Coe
ffici
ent
-100
-50
050
Lower Tercile Middle TercileUpper Tercile
Government Revenue - Polarization
Polarization
Res
erva
tion
Coe
ffici
ent
-200
020
040
060
0
Lower Tercile Middle TercileUpper Tercile
Government Revenue - Fractionalization
Fractionalization
Res
erva
tion
Coe
ffici
ent
-100
010
020
030
040
0
Lower Tercile Middle TercileUpper Tercile
Government Revenue - Large Land Owners
Proportion Large Land Owners
Rese
rvat
ion
Coef
ficie
nt
-200
020
040
0
Lower Tercile Middle TercileUpper Tercile
Government Revenue - Secondary Education
Proportion Secondary Education
Res
erva
tion
Coe
ffici
ent