RESEARCHARTICLE … MeasuretheQualityofFacility-BasedLabor andDeliveryCareProcessesinSub-Saharan ......
29
RESEARCH ARTICLE Development and Validation of an Index to Measure the Quality of Facility-Based Labor and Delivery Care Processes in Sub-Saharan Africa Vandana Tripathi 1¤ *, Cynthia Stanton 1 , Donna Strobino 1 , Linda Bartlett 2 1 Department of Population, Family Planning, and Reproductive Health, Johns Hopkins Bloomberg School of Public Health, Baltimore, Maryland, United States of America, 2 Department of International Health, Johns Hopkins Bloomberg School of Public Health, Baltimore, Maryland, United States of America ¤ Current address: EngenderHealth, New York, New York, United States of America. * [email protected] Abstract Background High quality care is crucial in ensuring that women and newborns receive interventions that may prevent and treat birth-related complications. As facility deliveries increase in develop- ing countries, there are concerns about service quality. Observation is the gold standard for clinical quality assessment, but existing observation-based measures of obstetric quality of care are lengthy and difficult to administer. There is a lack of consensus on quality indicators for routine intrapartum and immediate postpartum care, including essential newborn care. This study identified key dimensions of the quality of the process of intrapartum and immedi- ate postpartum care (QoPIIPC) in facility deliveries and developed a quality assessment measure representing these dimensions. Methods and Findings Global maternal and neonatal care experts identified key dimensions of QoPIIPC through a modified Delphi process. Experts also rated indicators of these dimensions from a compre- hensive delivery observation checklist used in quality surveys in sub-Saharan African coun- tries. Potential QoPIIPC indices were developed from combinations of highly-rated indicators. Face, content, and criterion validation of these indices was conducted using data from observations of 1,145 deliveries in Kenya, Madagascar, and Tanzania (including Zan- zibar). A best-performing index was selected, composed of 20 indicators of intrapartum/im- mediate postpartum care, including essential newborn care. This index represented most dimensions of QoPIIPC and effectively discriminated between poorly and well-performed deliveries. PLOS ONE | DOI:10.1371/journal.pone.0129491 June 24, 2015 1 / 29 a11111 OPEN ACCESS Citation: Tripathi V, Stanton C, Strobino D, Bartlett L (2015) Development and Validation of an Index to Measure the Quality of Facility-Based Labor and Delivery Care Processes in Sub-Saharan Africa. PLoS ONE 10(6): e0129491. doi:10.1371/journal. pone.0129491 Academic Editor: Tao(Tony) Duan, Shanghai 1st Maternity and Infant hospital of Tongji University, CHINA Received: August 16, 2014 Accepted: May 8, 2015 Published: June 24, 2015 Copyright: © 2015 Tripathi et al. This is an open access article distributed under the terms of the Creative Commons Attribution License, which permits unrestricted use, distribution, and reproduction in any medium, provided the original author and source are credited. Data Availability Statement: The data used in the secondary analysis described in this study were obtained from the Maternal and Child Integrated Program (MCHIP) implemented by Jhpiego and supported by the United States Agency for International Development (USAID). MCHIP conducted the Quality of Care (QoC) Assessment surveys described in the manuscript. The authors cannot make datasets available directly as manuscript supplemental files because the data were collected under an IRB-approved study protocol that
Transcript of RESEARCHARTICLE … MeasuretheQualityofFacility-BasedLabor andDeliveryCareProcessesinSub-Saharan ......

RESEARCH ARTICLE
Development and Validation of an Index toMeasure the Quality of Facility-Based Laborand Delivery Care Processes in Sub-SaharanAfricaVandana Tripathi1¤*, Cynthia Stanton1, Donna Strobino1, Linda Bartlett2
1 Department of Population, Family Planning, and Reproductive Health, Johns Hopkins Bloomberg Schoolof Public Health, Baltimore, Maryland, United States of America, 2 Department of International Health, JohnsHopkins Bloomberg School of Public Health, Baltimore, Maryland, United States of America
¤ Current address: EngenderHealth, New York, New York, United States of America.* [email protected]
Abstract
Background
High quality care is crucial in ensuring that women and newborns receive interventions that
may prevent and treat birth-related complications. As facility deliveries increase in develop-
ing countries, there are concerns about service quality. Observation is the gold standard for
clinical quality assessment, but existing observation-based measures of obstetric quality of
care are lengthy and difficult to administer. There is a lack of consensus on quality indicators
for routine intrapartum and immediate postpartum care, including essential newborn care.
This study identified key dimensions of the quality of the process of intrapartum and immedi-
ate postpartum care (QoPIIPC) in facility deliveries and developed a quality assessment
measure representing these dimensions.
Methods and Findings
Global maternal and neonatal care experts identified key dimensions of QoPIIPC through a
modified Delphi process. Experts also rated indicators of these dimensions from a compre-
hensive delivery observation checklist used in quality surveys in sub-Saharan African coun-
tries. Potential QoPIIPC indices were developed from combinations of highly-rated
indicators. Face, content, and criterion validation of these indices was conducted using data
from observations of 1,145 deliveries in Kenya, Madagascar, and Tanzania (including Zan-
zibar). A best-performing index was selected, composed of 20 indicators of intrapartum/im-
mediate postpartum care, including essential newborn care. This index represented most
dimensions of QoPIIPC and effectively discriminated between poorly and well-performed
deliveries.
PLOS ONE | DOI:10.1371/journal.pone.0129491 June 24, 2015 1 / 29
a11111
OPEN ACCESS
Citation: Tripathi V, Stanton C, Strobino D, Bartlett L(2015) Development and Validation of an Index toMeasure the Quality of Facility-Based Labor andDelivery Care Processes in Sub-Saharan Africa.PLoS ONE 10(6): e0129491. doi:10.1371/journal.pone.0129491
Academic Editor: Tao(Tony) Duan, Shanghai 1stMaternity and Infant hospital of Tongji University,CHINA
Received: August 16, 2014
Accepted: May 8, 2015
Published: June 24, 2015
Copyright: © 2015 Tripathi et al. This is an openaccess article distributed under the terms of theCreative Commons Attribution License, which permitsunrestricted use, distribution, and reproduction in anymedium, provided the original author and source arecredited.
Data Availability Statement: The data used in thesecondary analysis described in this study wereobtained from the Maternal and Child IntegratedProgram (MCHIP) implemented by Jhpiego andsupported by the United States Agency forInternational Development (USAID). MCHIPconducted the Quality of Care (QoC) Assessmentsurveys described in the manuscript. The authorscannot make datasets available directly asmanuscript supplemental files because the data werecollected under an IRB-approved study protocol that

Conclusions
As facility deliveries increase and the global community pays greater attention to the role of
care quality in achieving further maternal and newborn mortality reduction, the QoPIIPC
index may be a valuable measure. This index complements and addresses gaps in current-
ly used quality assessment tools. Further evaluation of index usability and reliability is need-
ed. The availability of a streamlined, comprehensive, and validated index may enable
ongoing and efficient observation-based assessment of care quality during labor and deliv-
ery in sub-Saharan Africa, facilitating targeted quality improvement.
IntroductionGlobal estimates show significant decreases in the number of maternal deaths in the past 15–25 years, with an estimated 289,000 deaths worldwide in 2013 [1]. However, only a minority ofcountries is on track to achieve the Millennium Development Goal (MDG) for reducing mater-nal mortality [1–3]. The lifetime risk of maternal mortality in sub-Saharan Africa remains 1 in38 compared to 1 in 3,700 in developed countries [1]. Similarly, despite reductions in the pasttwo decades, 3.3 to 3.6 million babies continue to die each year worldwide in the first month oflife [4–5]. It is estimated that there are 2 million intrapartum stillbirths and intrapartum event-related early neonatal deaths each year [6].
Because maternal mortality is a rare event and many related indicators are difficult to mea-sure at the population level, maternal health programs frequently evaluate progress throughservice utilization. The most common indicator is the skilled birth attendance rate, included inthe maternal health MDG [7]. Facility delivery and, consequently, the use of a skilled birth at-tendant (SBA), are increasing in many developing countries, particularly where free deliveryservices or financial incentives have been introduced [8–9]. The presence of an SBA during de-livery does not, however, guarantee the quality or content of care provided during labor & de-livery (L&D) and the immediate postpartum period, including essential newborn care (ENC)[10–12].
Evidence has emerged from diverse settings that increasing facility delivery may not reducemortality if quality of care (QoC) is poor [13–15]. There are also concerns about QoC in facili-ties facing increasing demand due to incentives for institutional delivery [14–16]. Past researchindicates that coverage with effective interventions that may prevent or manage maternal andneonatal complications is low in many developing countries [17–20]. A 2013 analysis of WHOMulti-country Survey data suggests that coverage with life-saving interventions may be insuffi-cient to reduce maternal deaths without overall improvements in the quality of maternal healthcare [21]. Improving QoC and increasing the provision of these interventions may decreasematernal and neonatal mortality [22–25].
Numerous criterion-based audits of maternal care suggest that failures in care processes areimplicated in a substantial proportion of obstetric complications that result in death. Moreover,several studies in developing countries suggest that health system factors (e.g., failure to identi-fy severity of condition, incomplete or inappropriate management, and lack of timely referral)contribute as much or more to severe maternal and perinatal morbidities or deaths as patientfactors [26–29]. Miller et al., using record reviews, provider and patient interviews, and careobservations, showed that poor quality of emergency obstetric and newborn care (EmONC)may underlie the persistence of high maternal mortality in the Dominican Republic despite
Labor & Delivery Quality of Care Index
PLOS ONE | DOI:10.1371/journal.pone.0129491 June 24, 2015 2 / 29
included protection of the confidentiality of studyfacilities and providers, as described in the informedconsent forms read and signed by facility in-charges.The datasets contain facility identifiers and names.However, datasets with facility names and otherconfidential information redacted can be madeavailable through direct communication with QoCAssessment study team. Interested readers cancontact Dr. Jim Ricca at [email protected].
Funding: This study was supported by USAID (www.usaid.gov), through the MCHIP project (www.mchip.net), USAID Award #GHS-A-00-08-00002-000. Thefunder had no role in study design, data collectionand analysis, or decision to publish. Representativesof the funder were provided with a draft of thismanuscript before submission for publication.
Competing Interests: The authors have declaredthat no competing interests exist.

high institutional delivery rates [13]. Other research suggests that inadequate QoC is implicat-ed in low demand for facility-based L&D services and bypassing of closer facilities in favor ofthose that are more distant [30–32].
This body of evidence suggests that improving QoC is crucial in strengthening maternaland neonatal health. Maternity services, however, present unique challenges in quality assess-ment. The vast majority of deliveries are uncomplicated, but complications that do occur canresult in serious morbidity or death for the mother and newborn [33]. Additionally, obstetriccomplications, such as postpartum hemorrhage (PPH), are unpredictable—they may occur inthe presence of good, evidence-based clinical care, and may not occur in the absence of suchcare [22, 34]. These characteristics of maternity care make it difficult to assess QoC throughclinical outcomes, particularly without large samples. It is also inadequate to base QoC assess-ment solely on provider knowledge or facility capacity to provide care; avoidable deaths mayoccur because available resources are not used [35].
The work of Avedis Donabedian provides a relevant framework, defining QoC by threecomponents—structure, process, and outcomes [36–37]. Structure is readiness to provide care;process is actual service delivery; and outcomes are endpoints experienced by patients, relatedeither to presenting health problems or care provided (e.g., iatrogenic infections) [36]. The pro-cess component may be the most useful to evaluate quality of maternal and newborn care(MNC), given the unpredictability of complications and relative rarity of maternal deaths. Sali-nas et al. found that process factors (provider and intervention) were associated with an80-fold increase in risk of avoidable perinatal death, relative to an 11-fold increase due to struc-tural factors (facility and context) [38].
QoC studies in sub-Saharan Africa have frequently assessed facility readiness to provide de-livery services (structural quality) or evaluated outcomes using case fatality rates and similar in-dicators. Some research has also evaluated quality in terms of women’s satisfaction with healthservices, identified by Donabedian as a care outcome, without assessing technical QoC [39–40]. Many studies have been limited to documenting whether or not EmONC interventions areavailable or were recently provided, without assessing the quality of these services [41–42].
Measurement of the quality of the process of intrapartum and immediate postpartum care(QoPIIPC) is complex. Innovative tools and job aids have been developed to promote adher-ence to clinical guidelines and other aspects of process quality, such as the Safe Birth Checklist[43]. However, no standard consensus indicators exist to measure QoPIIPC in facilities in de-veloping countries. A number of composite measures or summative checklists have been devel-oped through expert opinion, but few have been validated; research suggests that empiricalvalidation is important in strengthening quality measures [44].
While some studies have evaluated the technical aspects of care processes, for examplethrough criterion-based audits, they have generally relied on retrospective analysis of incom-plete data sources that were not intended to measure quality (e.g. maternity registers). Numer-ous studies have documented poor quality and limited sensitivity of obstetric facility recordsand databases for assessing the performance of care processes in both low- and high-resourcesettings [45–51].
Although observation is considered a gold standard in quality assessment, few studies haveobserved patient care to assess QoPIIPC. Service observation tools based on clinical guidelinesare often lengthy, at times including hundreds of indicators [52–53], introducing the possibilityof opportunities for measurement error. The large number of indicators also makes it difficultto assess QoPIIPC on an ongoing basis due to resource and time requirements.
Measurement of the quality of routine intrapartum and immediate postpartum services isessential in ensuring the delivery of appropriate interventions to reduce maternal and newbornmortality and morbidity. There is a need for valid and reliable measures as well as efficient
Labor & Delivery Quality of Care Index
PLOS ONE | DOI:10.1371/journal.pone.0129491 June 24, 2015 3 / 29

tools to comprehensively measure QoPIIPC. Accordingly, this paper describes a study to iden-tify the key dimensions of QoPIIPC in facility-based deliveries and to develop and evaluate ameasure of these dimensions for application in sub-Saharan Africa. The study focused on theintrapartum and immediate postpartum periods when most maternal deaths occur and whencare quality may have the greatest impact on both maternal and neonatal mortality [54–57]. Itemphasized indicators of care processes for several reasons: the unpredictability of adverse ma-ternal outcomes, the consequent difficulty of making inferences about QoC based on outcomesin small facilities or without adjusting for patient mix, and the importance of distinguishingthe actual content of care from provider or facility capacity to provide care. Finally, the studytargeted routine care—interventions or practices that should occur in all deliveries, rather thanthose that only apply to specific groups, for example multiparous women or neonates exhibit-ing danger signs.
Methods
OverviewTwo data sources were used in this study. The first source was feedback and ratings obtainedfrom global MNC experts. The second source was secondary data obtained from surveys ob-serving L&D care at health facilities in sub-Saharan Africa.
The study began with a modified Delphi process using an MNC expert group to identify theimportant dimensions of QoPIIPC. Experts were also surveyed to determine which items fromL&D care assessment tools characterize these dimensions and the importance of the items, re-gardless of dimension. Due to considerable heterogeneity in expert ratings, seven potentialQoPIIPC indices were developed from combinations of highly rated items and preliminaryanalysis of L&D observation data. The seven indices were evaluated for face, content, and crite-rion validity, and a best performing index was selected. Face validity was assessed through ex-pert feedback. Content and criterion validity were assessed across six domains, each withmultiple benchmarks, using secondary data from L&D observations.
Because the description of methods includes terms with multiple meanings in different re-search and practice contexts, it is useful to define key concepts. In this study, dimensions areaspects of QoPIIPC that are distinct from each other but related to the larger quality construct,for example, interpersonal communication and respectful care. Items are discrete, observableactions that providers perform and that indicate QoPIIPC. Indices are combinations of items,summed to create a single score reflecting QoPIIPC. Face validity refers to whether likely users,such as MNC experts and care providers, perceive an index to include important, feasible, andappropriate items for assessing QoPIIPC in sub-Saharan Africa. Content validity refers towhether an index represents all key dimensions of QoPIIPC, assessing the full range of impor-tant aspects of care. Criterion validity refers to the association of the index score with a relatedmeasure of QoPIIPC considered to be a reasonable standard for assessing this construct. In thiscase, the related measure is performance on a comprehensive L&D care assessment tool, de-scribed below. The ability of a shorter index of items to serve as a proxy for performance on thecomprehensive tool reflects its criterion validity.
In this study, the term validation domains refers to topics evaluating the degree to which anindex measures and is informative about QoPIIPC. Benchmarks are specific, quantifiable, andcomparable criteria within each validation domain.
Identification of the key dimensions of QoPIIPCAn a priorimodel of the dimensions of QoPIIPC was developed based on the DonabedianQoC framework, relevant theory, and empirical evidence. This model included three
Labor & Delivery Quality of Care Index
PLOS ONE | DOI:10.1371/journal.pone.0129491 June 24, 2015 4 / 29

dimensions: 1) use of evidence-based interventions adhering to global guidelines (technicalquality); 2) inter-personal communication and respectful care (interpersonal quality); and 3)ongoing monitoring of the patient and watchful supervision throughout the intrapartum andIP periods (monitoring quality).
Consensus on the dimensions of L&D QoC was developed through a modified version ofthe Delphi process, conducted with a group of U.S.-based experts in global MNC. Modifica-tions to the original Delphi process developed by the RAND Corporation included the use ofan in-person meeting and changes to the scoring systems [58–59]. Items assessing routine carefrom a structured L&D observation checklist applied in a series of maternal and newborn QoChealth facility surveys were used to facilitate consensus building. The surveys, known as theQoC Assessments, were conducted by the Maternal and Child Health Integrated Program(MCHIP), a USAID-funded global maternal and child health project directed by Jhpiego. Thesurveys are described further below and S1 Checklist provides the full QoC Assessment L&Dobservation checklist.
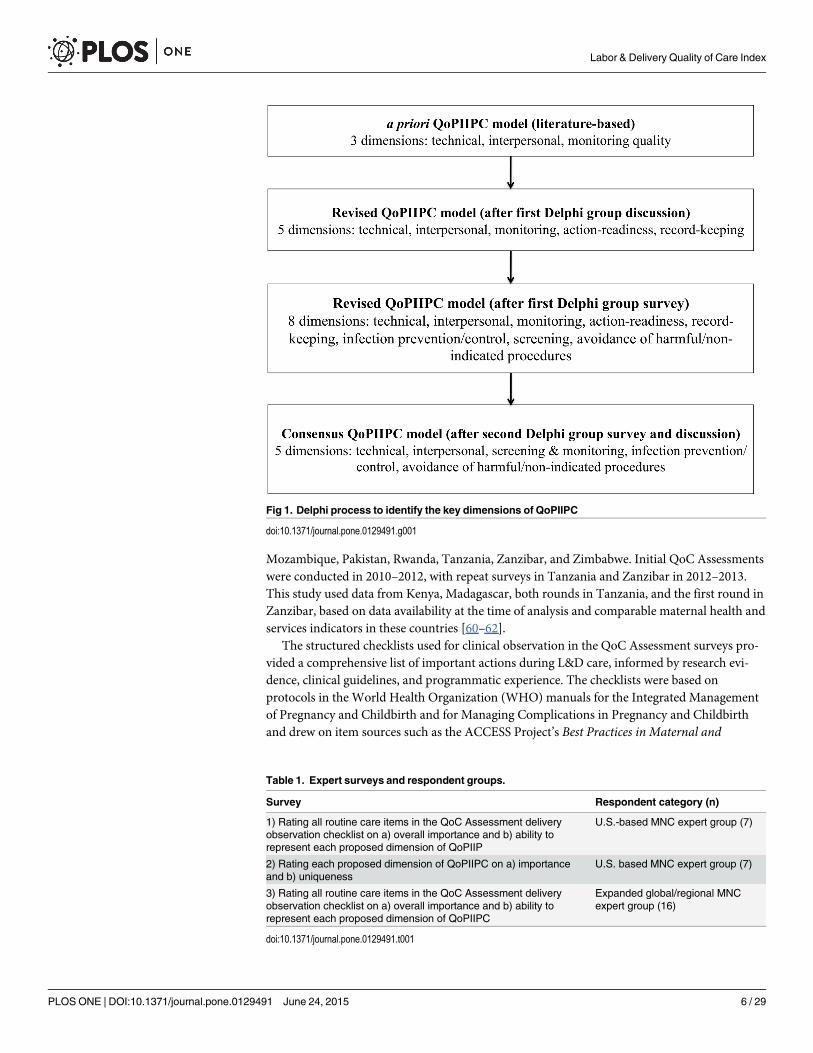
Fig 1 describes the iterative development of a consensus model of QoPIIPC. At the start ofthis process, the MNC expert group met to discuss potential dimensions of QoPIIPC. Expertsworked in small groups to categorize a sample of 15 items from the QoC Assessment L&D ob-servation checklist into potential dimensions of QoPIIPC. The sample represented provider ac-tions undertaken throughout the intrapartum and immediate postpartum periods, includingENC. The full group re-convened and discussed dimensions into which items could begrouped. The a priorimodel of QoPIIPC was revised based on expert feedback.
The experts were then surveyed to rate the 131 routine care items from the QoC AssessmentL&D observation checklist, scoring each item on two characteristics: how well it representedeach potential dimension of QoPIIPC and its overall importance, irrespective of dimension.Dimension representation was rated from 1, meaning that the item was not representative atall of a specific dimension, to 3, meaning that the item was very representative. Overall impor-tance was rated from 1, meaning that the item was unimportant, to 4, meaning that it wasessential. Mean ratings were calculated for each item. Experts also provided qualitative com-ments regarding dimensions and items. Because the QoC Assessment L&D observation check-list was based onWHO guidelines and the work of clinical and research experts, it is presumedto provide a comprehensive, evidence-based item pool for tasks, interventions, and proceduresthat indicate QoPIIPC. Further information about the sources of these items and the evidencefor their importance is provided below. At the recommendation of the original expert group,this survey was also administered to MNC experts based in sub-Saharan Africa and at globalhealth institutions, separately from the consensus process on QoPIIPC dimensions.
Following discussion of the results of the first survey, a second survey was undertaken. Ex-perts rated each proposed dimension on its importance, with 1 being not important and 3being essential; and its distinctness from other dimensions, with 1 being not distinct/mostlyoverlapping with other dimensions and 3, very distinct/mostly unique from other dimensions.Based on expert group ratings, a consensus model of QoPIIPC was defined. This model was ap-plied in subsequent analysis to develop a measure of QoPIIPC.
The surveys used to identify consensus QoPIIPC dimensions and rate potential index itemsare described in Table 1. In all, 32 individuals participated in consensus development meetingsand and/or item rating surveys.
Development of a measure of QoPIIPCSecondary data source. Secondary data were drawn from the MCHIP QoC Assessments.
These surveys have been carried out in Bangladesh, Ethiopia, Kenya, Madagascar, Malawi,
Labor & Delivery Quality of Care Index
PLOS ONE | DOI:10.1371/journal.pone.0129491 June 24, 2015 5 / 29
Mozambique, Pakistan, Rwanda, Tanzania, Zanzibar, and Zimbabwe. Initial QoC Assessmentswere conducted in 2010–2012, with repeat surveys in Tanzania and Zanzibar in 2012–2013.This study used data from Kenya, Madagascar, both rounds in Tanzania, and the first round inZanzibar, based on data availability at the time of analysis and comparable maternal health andservices indicators in these countries [60–62].
The structured checklists used for clinical observation in the QoC Assessment surveys pro-vided a comprehensive list of important actions during L&D care, informed by research evi-dence, clinical guidelines, and programmatic experience. The checklists were based onprotocols in the World Health Organization (WHO) manuals for the Integrated Managementof Pregnancy and Childbirth and for Managing Complications in Pregnancy and Childbirthand drew on item sources such as the ACCESS Project’s Best Practices in Maternal and
Fig 1. Delphi process to identify the key dimensions of QoPIIPC
doi:10.1371/journal.pone.0129491.g001
Table 1. Expert surveys and respondent groups.
Survey Respondent category (n)
1) Rating all routine care items in the QoC Assessment deliveryobservation checklist on a) overall importance and b) ability torepresent each proposed dimension of QoPIIP
U.S.-based MNC expert group (7)
2) Rating each proposed dimension of QoPIIPC on a) importanceand b) uniqueness
U.S. based MNC expert group (7)
3) Rating all routine care items in the QoC Assessment deliveryobservation checklist on a) overall importance and b) ability torepresent each proposed dimension of QoPIIPC
Expanded global/regional MNCexpert group (16)
doi:10.1371/journal.pone.0129491.t001
Labor & Delivery Quality of Care Index
PLOS ONE | DOI:10.1371/journal.pone.0129491 June 24, 2015 6 / 29

Newborn Care: Learning Resource Package; Stanton et al.’s international survey of the activemanagement of the third stage of labor (AMTSL), conducted through the Prevention of Post-partum Hemorrhage Initiative (POPPHI); and Jhpiego’s checklists for trainers to observe sim-ulated basic EmONC practices by trainees [11, 15, 33, 63–64]. Checklist items were alsoselected based on the major causes of maternal and neonatal mortality and reviewed by thestudy team.
The initial observation checklists resulting from this process were reviewed by a largergroup of trainers, clinicians, and monitoring and evaluation experts. The draft observation in-struments and training techniques were then field-tested as stand-alone tools in Ethiopia andembedded within the more comprehensive Service Provision Assessment (SPA) in Kenya. Inboth settings, national experts, trainers, and trainees who were all expert facility assessors orclinicians provided feedback on the tools in advance and after data collection. After these pi-lots, a final core set of QoC survey observation checklists was created. These core tools werealso pre-tested in every country where the QoC survey was implemented.
The final routine care checklist used in the MCHIP QoC surveys included items on essentialL&D care, such as partograph use, infection prevention, client-provider interactions, AMTSL,and immediate newborn care. Additional checklists contained items on management of com-plications, including postpartum hemorrhage (PPH), pre-eclampsia or eclampsia (PE/E), andnewborn resuscitation [65]. As indicated by the source documents above, the 131 items in theroutine care checklist (S1 Checklist) reflect evidence-informed guidelines and current globalconsensus on best practices.
The MCHIP surveys also collected information about health facilities and providers andsome background maternal characteristics [65]. While tools were revised between the first andsecond surveys, most variables are identical or have equivalents across QoC Assessments.
Data were collected by personnel trained specifically for the QoC Assessments. Observerswere already trained in MNC clinical skills. An 11-day training curriculum for data collectorsincluded clinical updates, review and mastery of the content of the data collection instrumentsand procedures for informed consent and confidentiality, and practice to ensure the validityand reliability of clinical observation [66–68]. Classroom training included exercises and prac-tice until inter-rater reliability for clinical observations was established at a level of 80% agree-ment or higher. Trainees observed the practice of key interventions on anatomic models using“flawed” clinical performances; their scores were compared to the correct responses as deter-mined by the designers of the training exercises. These exercises were followed by group discus-sion about observing and recording clinical data. Trainees then spent two days observingdeliveries and practicing using the data collection tools at health facilities. In most countries,data were collected on smartphones with customized data entry applications. Data from eachdevice was uploaded directly to a central online database or a secure digital card each day [66–67]. In Kenya the QoC Assessment was nested within the 2010 Service Provision Assessment(KSPA) Survey [69]. The KSPA used paper-based surveys and its own data collection team.However, additional observers were recruited, supported, and trained by MCHIP for L&D ob-servation. Similar training procedures were followed in Kenya as in other countries [68–69].
The QoC Assessments were designed to provide national estimates of routine facility-basedL&D practices, with samples of at least 250 deliveries in each country. Each country’s samplingplan was adapted to meet local needs. In Kenya the survey is nationally representative. In Mad-agascar the survey covered all facilities with two or more deliveries per day. In Tanzania andZanzibar the survey sampled facilities in regions participating in quality improvement projects.At each sampled health facility, all births (or as many as were feasible for data collectors to ob-serve) were to be sampled at each facility during the survey period, which was generally twodays per facility [66–68].
Labor & Delivery Quality of Care Index
PLOS ONE | DOI:10.1371/journal.pone.0129491 June 24, 2015 7 / 29

Additional information about survey development, sampling, and data collection proce-dures is available in country QoC Assessment reports and reported in publications describingkey findings in Madagascar and Tanzania [53, 65–70].
Exploratory analyses of survey data. Variables differing across country datasets weremodified as needed. Due to small numbers of deliveries observed in Zanzibar in the first surveyround, the sample was combined with the Round 1 Tanzania sample for analysis. Unweighteddata were used for analysis. Proportions or means (with 95% confidence intervals) were calcu-lated for all variables along with graphical exploration of data distributions. χ2 tests and t-testswere used to identify differences across variables between and within countries.
Because the study sought to develop a comprehensive QoPIIPC measure, data analysiswas restricted to L&D cases observed across initial intake, active labor, delivery, and the im-mediate postpartum period. The complete survey samples and samples included in analysiswere compared to identify any differences in available background variables (e.g., maternalcharacteristics).
Development and validation of QoPIIPC indices. The modified Delphi process was usedto reach consensus regarding key dimensions of QoPIIPC. However, review of expert surveyresponses showed substantial variation among different expert subgroups in the ratings of spe-cific items to represent these dimensions. Therefore, rather than selecting a QoPIIPC indexthrough a consensus or Delphi process, seven possible QoPIIPC indices containing combina-tions of highly rated items were evaluated according to specified validation domains, describedbelow. The indices ranged in length from 17 to 23 items. Index A, the preliminary QoPIIPCindex, contained items rated highly by the original US-based MNC expert group participatingin the modified Delphi process. Index B, referred to as the “3+ index”, contained items ratedhighest by at least three of the four surveyed groups (all experts, participants in the Delphi pro-cess, experts in sub-Saharan Africa, and experts at global health institutions). Index C con-tained the items with the highest mean importance ratings across all experts. Index Dcontained items with the highest mean ratings across global MNC experts. Finally, Index Econtained items with the highest mean ratings across regional experts in sub-Saharan Africa.
Two indices were constructed using additional information: qualitative feedback fromMNC experts and exploratory analysis of QoC Assessment survey data. The first constructedindex (Index F) combined the 3+ index with additional items considered to improve contentvalidity based on expert feedback, including two newborn care items and an item reflecting in-terpersonal care. The second constructed index (Index G) built on the first, but omitted 3 itemsthat were nearly universally performed or considered by the expert group to be difficult to ob-serve and, therefore less informative about care quality. The omitted items were replaced withothers considered easier to observe or performed less frequently.
QoPIIPC scores. Country data from QoC Assessments in Kenya, Madagascar, Tanzania,and Zanzibar were used to validate the potential QoPIIPC indices. Each observed, eligible de-livery was assigned index scores based on performance of items in each index. An item was as-signed a value of 1 if it was performed, and 0, otherwise. Item scores were summed to createQoPIIPC index scores for each delivery. Each delivery observation was also assigned a totalQoC performance score by summing performance of all routine care items in the full QoC As-sessment delivery checklist.
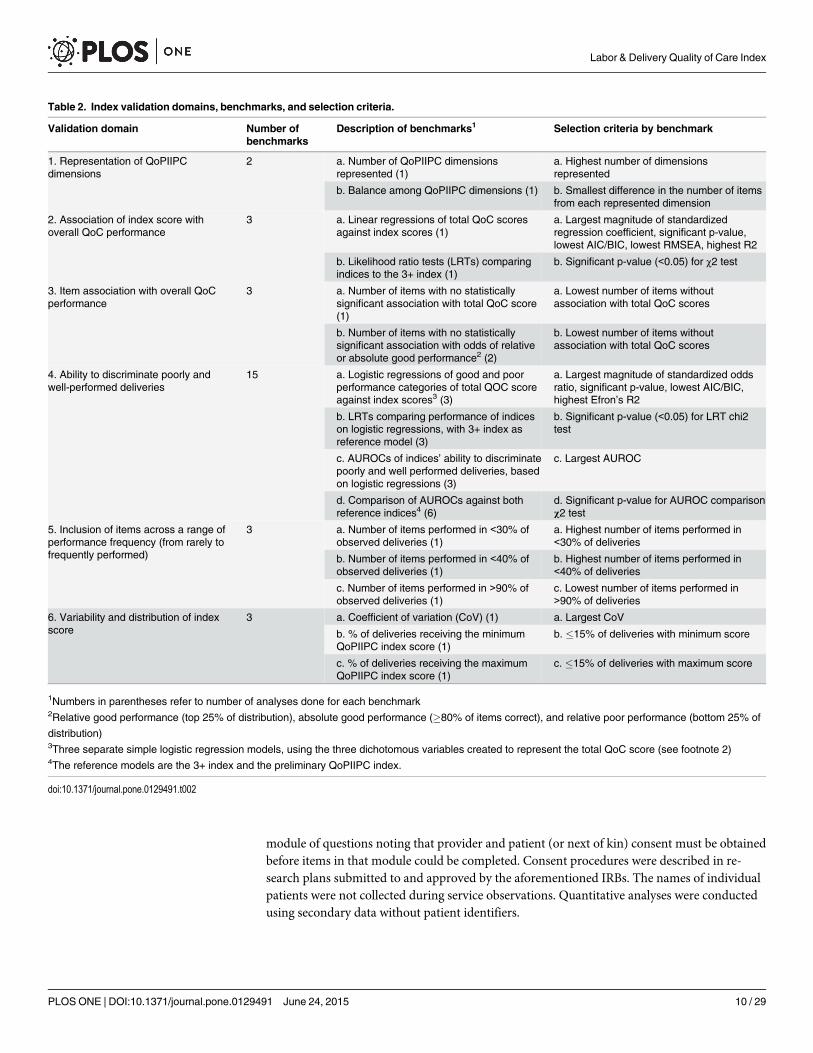
Validation domains and benchmarks. Six content and criterion validation domains wereused to assess the QoPIIPC indices: the degree to which an index included items representingall key QoPIIPC dimensions, association of the index score with the total QoC performancescore, association of each item in an index with the total QoC performance score, ability of anindex to discriminate between poorly and well-performed deliveries, inclusion of items in anindex across a range of performance frequency (from rarely to frequently performed), and the
Labor & Delivery Quality of Care Index
PLOS ONE | DOI:10.1371/journal.pone.0129491 June 24, 2015 8 / 29

variability and distribution of the index score. Benchmarks and selection criteria for each do-main are described in Table 2. A threshold of p = 0.05 was used for all benchmarks that includ-ed assessment of statistical significance. In addition to stand-alone assessments of each index,comparative analyses treated the preliminary QoPIIPC index (Index A) and the 3+ index(Index B) as reference models.
Ability to discriminate between poorly and well-performed deliveries is a key attribute of ameaningful quality measure for L&D care. Accordingly, this domain accounts for the majorityof validation benchmarks. Analyses associated with this domain are described further here.
To enable assessment of QoC discrimination, level of overall care quality was evaluated bythree dichotomous variables. First, relative good performance was defined as being in the top25% of the total QoC score distribution. Second, absolute good performance was defined asachieving at least 80% of the maximum possible total QoC score. Third, relative poor perfor-mance was defined as being in the bottom 25% of the total QoC score distribution. The threevariables were treated as dependent variables in separate analyses. A series of simple logisticalregressions estimated the relation between the index score and the odds of good or poor perfor-mance. Model fit for each index was compared to the two reference indices (Indices A and B)through likelihood ratio tests.
The area under the receiver operating characteristic (AUROC) curves based on the logisticregression results was assessed for each good/poor performance group. The AUROC indicatesthe ability of an index to correctly classify QoC: if two deliveries are drawn from the sample atrandom, the AUROC indicates the proportion of pairs in which the delivery with the higherQoPIIPC index score is in the good performance group (and vice versa, for poor performance).An AUROC of 0.7 to 0.9 is considered to show moderate discrimination, while over 0.9 showsexcellent discrimination [71–72]. AUROCs were also compared to assess the ability of eachindex to classify deliveries as poorly or well-performed relative to the reference indices.
Index scoring and selection. Indices were evaluated separately using delivery data foreach country. Comparisons involved creating and summing validation performance scores atthe benchmark, domain, and country level. The scoring system is described in Table 3. Thebest performing index was selected based on the validation performance scores within eachcountry and across countries. For the selected QoPIIPC index, predicted probabilities of beingin the good performance groups of the total QoC score were calculated for each value of theindex score based on logistic regressions.
Ethical considerationsThe protocol was reviewed and approved by ethical review boards in each country where theQoC Assessment was conducted. In the countries whose data are analyzed in this study, theseboards were: the Kenya Medical Research Institute Institutional Review Board (IRB) in Kenya;the Ministry of Health Ethical Committee in Madagascar; and the National Institute of MedicalResearch Institutional Review Board IRB in Tanzania. The Johns Hopkins Bloomberg Schoolof Public Health (JHSPH) IRB ruled the protocol exempt from review. During the QoC Assess-ments, written informed consent was obtained from facility directors, along with verbal in-formed consent of the providers and patients or patients’ next of kin. Written consent was notobtained from providers because they were encountered during the process of providing L&Dcare and an extensive discussion of benefits and burdens had been conducted with facility di-rectors in a non-service provision context. Written consent was not obtained from patients ornext of kin both because of literacy limitations and to reduce the burden on women being en-countered during L&D. Data collection team supervisors obtained facility-level written consentforms. Verbal consent was recorded in the QoC Assessment data entry applications, with each
Labor & Delivery Quality of Care Index
PLOS ONE | DOI:10.1371/journal.pone.0129491 June 24, 2015 9 / 29
module of questions noting that provider and patient (or next of kin) consent must be obtainedbefore items in that module could be completed. Consent procedures were described in re-search plans submitted to and approved by the aforementioned IRBs. The names of individualpatients were not collected during service observations. Quantitative analyses were conductedusing secondary data without patient identifiers.
Table 2. Index validation domains, benchmarks, and selection criteria.
Validation domain Number ofbenchmarks
Description of benchmarks1 Selection criteria by benchmark
1. Representation of QoPIIPCdimensions
2 a. Number of QoPIIPC dimensionsrepresented (1)
a. Highest number of dimensionsrepresented
b. Balance among QoPIIPC dimensions (1) b. Smallest difference in the number of itemsfrom each represented dimension
2. Association of index score withoverall QoC performance
3 a. Linear regressions of total QoC scoresagainst index scores (1)
a. Largest magnitude of standardizedregression coefficient, significant p-value,lowest AIC/BIC, lowest RMSEA, highest R2
b. Likelihood ratio tests (LRTs) comparingindices to the 3+ index (1)
b. Significant p-value (<0.05) for χ2 test
3. Item association with overall QoCperformance
3 a. Number of items with no statisticallysignificant association with total QoC score(1)
a. Lowest number of items withoutassociation with total QoC scores
b. Number of items with no statisticallysignificant association with odds of relativeor absolute good performance2 (2)
b. Lowest number of items withoutassociation with total QoC scores
4. Ability to discriminate poorly andwell-performed deliveries
15 a. Logistic regressions of good and poorperformance categories of total QOC scoreagainst index scores3 (3)
a. Largest magnitude of standardized oddsratio, significant p-value, lowest AIC/BIC,highest Efron’s R2
b. LRTs comparing performance of indiceson logistic regressions, with 3+ index asreference model (3)
b. Significant p-value (<0.05) for LRT chi2test
c. AUROCs of indices’ ability to discriminatepoorly and well performed deliveries, basedon logistic regressions (3)
c. Largest AUROC
d. Comparison of AUROCs against bothreference indices4 (6)
d. Significant p-value for AUROC comparisonχ2 test
5. Inclusion of items across a range ofperformance frequency (from rarely tofrequently performed)
3 a. Number of items performed in <30% ofobserved deliveries (1)
a. Highest number of items performed in<30% of deliveries
b. Number of items performed in <40% ofobserved deliveries (1)
b. Highest number of items performed in<40% of deliveries
c. Number of items performed in >90% ofobserved deliveries (1)
c. Lowest number of items performed in>90% of deliveries
6. Variability and distribution of indexscore
3 a. Coefficient of variation (CoV) (1) a. Largest CoV
b. % of deliveries receiving the minimumQoPIIPC index score (1)
b. �15% of deliveries with minimum score
c. % of deliveries receiving the maximumQoPIIPC index score (1)
c. �15% of deliveries with maximum score
1Numbers in parentheses refer to number of analyses done for each benchmark2Relative good performance (top 25% of distribution), absolute good performance (�80% of items correct), and relative poor performance (bottom 25% of
distribution)3Three separate simple logistic regression models, using the three dichotomous variables created to represent the total QoC score (see footnote 2)4The reference models are the 3+ index and the preliminary QoPIIPC index.
doi:10.1371/journal.pone.0129491.t002
Labor & Delivery Quality of Care Index
PLOS ONE | DOI:10.1371/journal.pone.0129491 June 24, 2015 10 / 29

Results
Key dimensions of QoPIIPCThe Delphi process results are shown in Fig 1. Initial feedback resulted in five proposed dimen-sions of QoPIIPC. Two dimensions proposed in addition to those initially hypothesized (techni-cal, interpersonal, and monitoring QoC) were: action-readiness, providers’ preparation andability to respond to signs of complication and action cues; and record-keeping, the completionof administrative and medical records. For technical QoC, 113 of the 131 routine L&D care itemswere deemed somewhat or very representative, suggesting that this concept was too broad to be ameaningful QoC dimension. Qualitative comments also suggested that three additional dimen-sions could be isolated from technical QoC: infection prevention/control, screening for dangersigns, and avoidance of harmful/non-indicated procedures. All 8 potential dimensions were in-cluded in the second expert survey (see Table 1). S1 Table summarizes the findings of this survey.
Ultimately, five dimensions were retained in the consensus QoPIIPC model: technical, in-terpersonal care, screening & monitoring, infection prevention/control, and avoidance ofharmful/non-indicated interventions. Table 4 summarizes this model and provides an example
Table 3. Steps in scoring QoPIIPC indices and comparing validation performance.
Benchmark level For each validation benchmark (see Table 2), the index that performed best received avalue of 2; the next best performing index received a value of 1. All other ranksreceived a value of zero, and ties were acceptable. The top two indices were ranked toavoid selection of one top performer based on small differences.
Domain level Performance on each benchmark (ranging from zero to 2) was summed within each ofthe six validation domains. 2 points were assigned to the index with the highest scorein each domain, and 1 point was assigned for the second-highest score.
Country level Domain scores were summed into validation performance scores for each index withineach country. These validation performance scores ranged from 0 to 12 (up to 2 pointsper domain). Validation performance scores were also summed across countries foreach index.
Index selection The best performing index was selected based on these validation performancescores, both within each country and across all countries.
Sensitivityanalysis
The primary scoring approach was designed to provide equal weight to each validationdomain in index selection. Each domain, however, had a different number of validationbenchmarks. More benchmarks were related to the index ability to discriminate poorlyand well-performed deliveries than to other domains (15 out of 28). The scoringsystem, therefore, results in less weight assigned to each benchmark in domains withmore benchmarks. An alternative score summation approach was also used toevaluate whether a different index would be selected if all benchmarks were givenequal weight. In this alternative approach, a total validation performance score wassummed directly across all benchmarks and across all countries, without first summingand ranking with each validation domain.
doi:10.1371/journal.pone.0129491.t003
Table 4. Consensus model of QoPIIPC and sample items.
Dimension Sample item
Technical quality Ties or clamps cord when pulsations stop, or by 2–3 minutes afterbirth (not immediately after birth)
Interpersonal At least once, explains what will happen in labor to the woman and/orher support person
Screening & monitoring Takes mother's vital signs 15 minutes after birth
Infection prevention/control Washes his/her hand before any examination
Avoidance of harmful/non-indicated practices
Was there use of episiotomy without appropriate indication?
doi:10.1371/journal.pone.0129491.t004
Labor & Delivery Quality of Care Index
PLOS ONE | DOI:10.1371/journal.pone.0129491 June 24, 2015 11 / 29

item for each dimension. The consensus dimensions were applied in assessment of the contentvalidity of potential QoPIIPC indices.
Development of a measure of QoPIIPCTable 5 provides sample sizes for the full QoC Assessment for each country and the number ofdeliveries included in the analysis. About two-thirds of deliveries in Kenya and Madagascarwere retained in the analysis. More women arrived later in the L&D process in facilities in Tan-zania and Zanzibar, resulting in the inclusion of 39–40% of observed deliveries in the analysis.An examination of available background characteristics (facility type; provider category; andmother’s HIV status, gravidity, and parity) found that there were almost no significant differ-ences between the full QoC Assessment samples and the deliveries included in analysis (seeTable 6) The analysis sub-sample in Tanzania Round 2 had fewer hospital deliveries and morehealth center deliveries.
Table 7 describes the seven potential QoPIIPC indices evaluated. Table 8 lists the items ineach index. Overall, 33 items were included across indices, with a high number of overlappingitems. S2 Table describes the proportion of deliveries in which these items were performed ineach country. While many processes assessed by survey items were performed at similar fre-quencies across countries, there was notable variation, particularly increases in performance ofseveral items between the first and second surveys in Tanzania.
Summary scores for index performance across the validation domains, based on the scoringsystem described in Table 3, are presented in Table 9. While all indices performed reasonablywell, three appeared to be the most informative about QoPIIPC. They were the index contain-ing items ranked most highly by the sub-Saharan African regional expert group (Index E) andthe two indices (Indices F and G) constructed based on expert group rating combined with in-formation from exploratory analysis of survey data and qualitative feedback fromMNC ex-perts. While Index E performed well in terms of validation benchmarks, there were concernsabout its content validity, such as a lack of items for the immediate postpartum period.Table 10 shows the performance of the constructed indices alongside the two reference models,the preliminary QoPIIPC index (Index A) and the 3+ index (Index B).
Validation results and recommended QoPIIPC indexBased on its relative performance on validation benchmarks, the second constructed index(Index G) was considered the optimal measure of QoPIIPC. The items in this index are listedin Table 11 and represent 4 of the 5 consensus QoPIIPC dimensions: technical quality, inter-personal care, screening and monitoring, and infection prevention/control. No items representthe avoidance of harmful/non-indicated interventions. This index covers intrapartum care, theimmediate postpartum period, and ENC.
Table 5. QoC Assessment sample sizes.
Country Facilities Deliveries—full sample Deliveries—included in analysis1 (%)
Tanzania (incl. Zanzibar) Round 1 56 706 282 (39.9%)
Tanzania Round 2 48 558 220 (39.4%)
Kenya 170 626 403 (64.4%)
Madagascar 36 347 210 (60.5%)
Total 506 2,238 1,145 (51.2%)
1Deliveries were included in analysis if observed at intake, during labor and delivery, and immediately postpartum.
doi:10.1371/journal.pone.0129491.t005
Labor & Delivery Quality of Care Index
PLOS ONE | DOI:10.1371/journal.pone.0129491 June 24, 2015 12 / 29
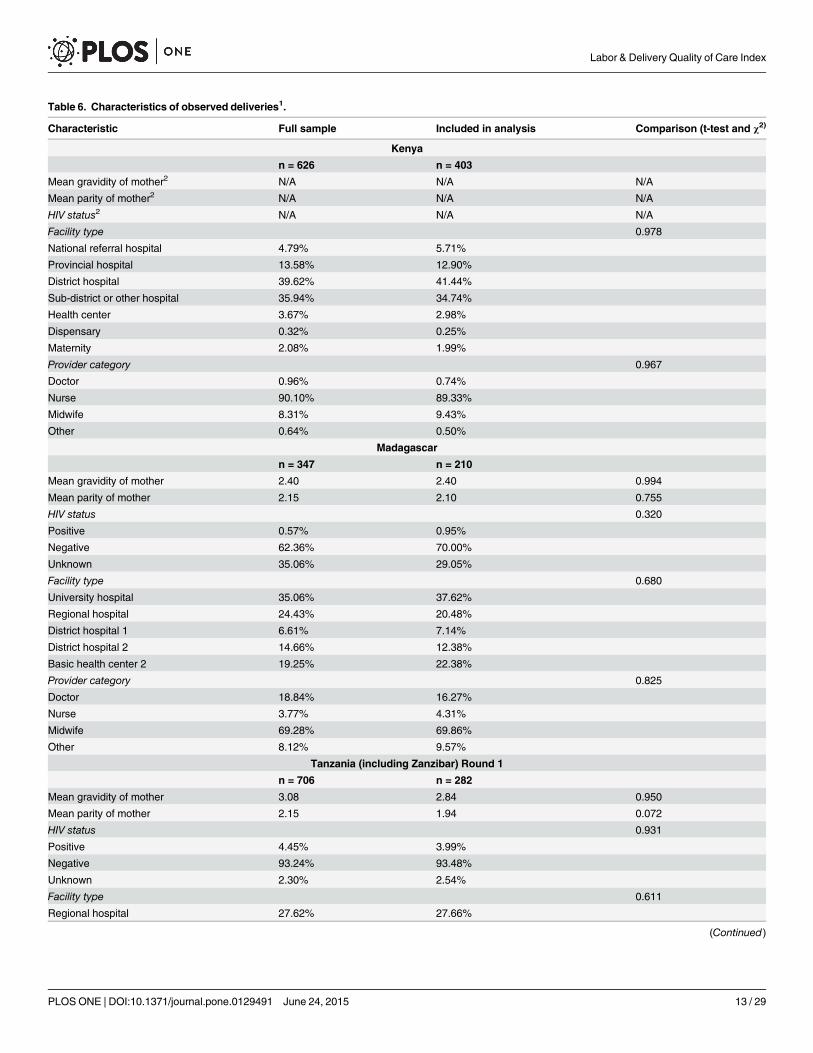
Table 6. Characteristics of observed deliveries1.
Characteristic Full sample Included in analysis Comparison (t-test and χ2)
Kenya
n = 626 n = 403
Mean gravidity of mother2 N/A N/A N/A
Mean parity of mother2 N/A N/A N/A
HIV status2 N/A N/A N/A
Facility type 0.978
National referral hospital 4.79% 5.71%
Provincial hospital 13.58% 12.90%
District hospital 39.62% 41.44%
Sub-district or other hospital 35.94% 34.74%
Health center 3.67% 2.98%
Dispensary 0.32% 0.25%
Maternity 2.08% 1.99%
Provider category 0.967
Doctor 0.96% 0.74%
Nurse 90.10% 89.33%
Midwife 8.31% 9.43%
Other 0.64% 0.50%
Madagascar
n = 347 n = 210
Mean gravidity of mother 2.40 2.40 0.994
Mean parity of mother 2.15 2.10 0.755
HIV status 0.320
Positive 0.57% 0.95%
Negative 62.36% 70.00%
Unknown 35.06% 29.05%
Facility type 0.680
University hospital 35.06% 37.62%
Regional hospital 24.43% 20.48%
District hospital 1 6.61% 7.14%
District hospital 2 14.66% 12.38%
Basic health center 2 19.25% 22.38%
Provider category 0.825
Doctor 18.84% 16.27%
Nurse 3.77% 4.31%
Midwife 69.28% 69.86%
Other 8.12% 9.57%
Tanzania (including Zanzibar) Round 1
n = 706 n = 282
Mean gravidity of mother 3.08 2.84 0.950
Mean parity of mother 2.15 1.94 0.072
HIV status 0.931
Positive 4.45% 3.99%
Negative 93.24% 93.48%
Unknown 2.30% 2.54%
Facility type 0.611
Regional hospital 27.62% 27.66%
(Continued)
Labor & Delivery Quality of Care Index
PLOS ONE | DOI:10.1371/journal.pone.0129491 June 24, 2015 13 / 29

The recommended QoPIIPC index score showed a statistically significant relation with thetotal QoC performance score across countries, with an increase of 2.24 to 2.77 points in thetotal QoC score for each one-point increase in the index score. This suggests that performingone additional intervention in the QoPIIPC index was associated with performance of multipleadditional evidence-informed interventions during L&D care.
An increase in the recommended QoPIIPC index score also showed a statistically significantincrease in the odds of being in the absolute and relative good performance categories for thetotal QoC score across countries. An increase in the recommended QoPIIPC index score wasassociated with a significant decrease in the odds of being in the poor performance category forthe total QoC score (see Table 10 for illustrative results from Tanzania Round 1).
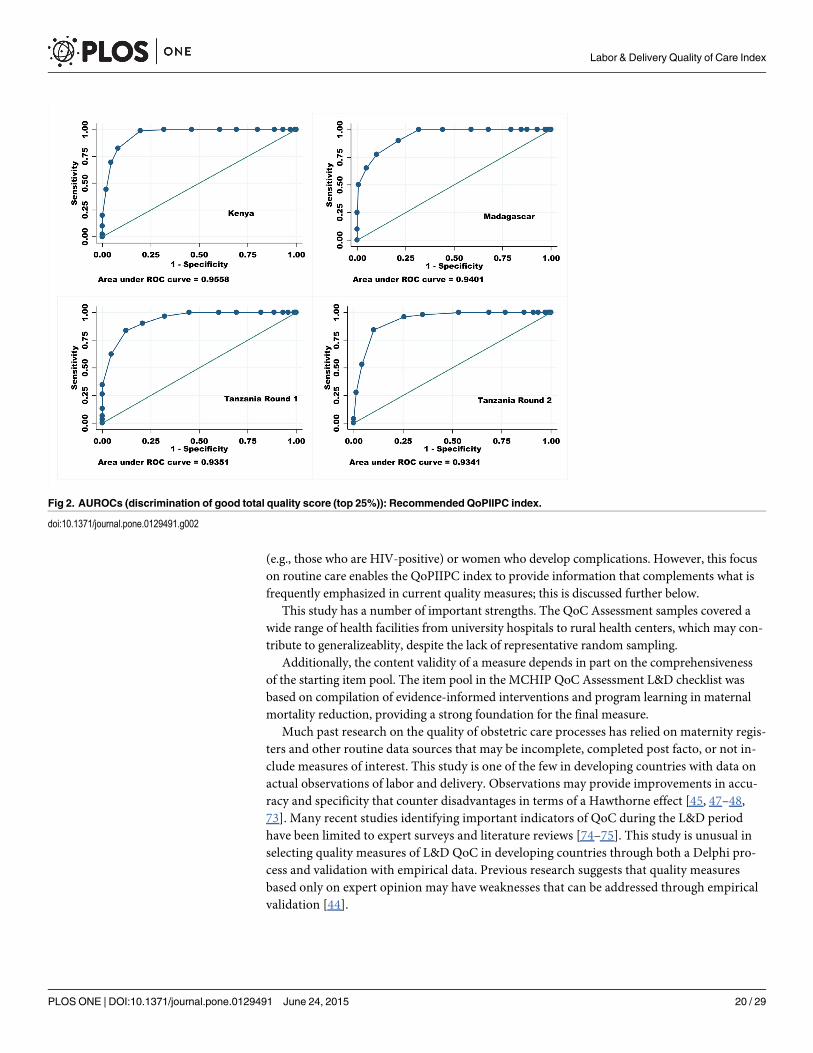
The recommended QoPIIPC index showed excellent ability to identify absolute and relativegood performance and relative poor performance across countries (Table 10). AUROCs rangedfrom 0.941 to 0.957 in Kenya, from 0.940 to 0.972 in Madagascar, from 0.935 to 0.976 in Tan-zania Round 1, and from 0.918 to 0.934 in Tanzania Round 2. Fig 2 illustrates the AUROCsacross countries for classification of delivery cases into the relative good performance group(the top 25% of total QoC scores). For example, if two deliveries were drawn from the sample
Table 6. (Continued)
Characteristic Full sample Included in analysis Comparison (t-test and χ2)
Hospital 29.32% 25.89%
Health center 40.80% 43.26%
Dispensary 2.27% 3.19%
Provider category 0.917
Doctor 1.85% 1.42%
Nurse 32.76% 34.52%
Midwife 55.70% 54.09%
Other 9.69% 9.96%
Tanzania (Round 2)
n = 558 n = 220
Mean gravidity of mother 2.58 2.61 0.810
Mean parity of mother 1.71 1.66 0.936
HIV status 0.508
Positive 91.81% 6.51%
Negative 4.48% 90.23%
Unknown 3.70% 3.26%
Provider category 0.996
Doctor 2.34% 1.82%
Nurse 46.76% 45.91%
Midwife 49.46% 50.45%
Other 1.44% 1.82%
Facility type 0.020
Regional hospital 0.54% 0.00%
Hospital 61.11% 52.28%
Health center 31.36% 42.48%
Dispensary 6.99% 5.45%
1Missing observations are excluded; <10% of observations in each sample; Yates correction applied due to low cell frequencies2These questions were not included in the delivery observation module in the Kenya survey.
doi:10.1371/journal.pone.0129491.t006
Labor & Delivery Quality of Care Index
PLOS ONE | DOI:10.1371/journal.pone.0129491 June 24, 2015 14 / 29

at random in Madagascar, the recommended QoPIIPC index would correctly classify QoC inover 94% of these pairs; the case with the higher index score would be in the relative goodperformance group.
Comparison of AUROCs indicated that the recommended QoPIIPC index was often betterable to classify deliveries into the poorly and well-performed delivery categories than the refer-ence indices. Comparisons to Index B (the 3+ index) are illustrated in Fig 3. Similarly, likeli-hood ratio tests suggested that the recommended index fit the total QoC score data better inlinear and logistic regressions than both reference indices (see Table 10 for illustrative results).
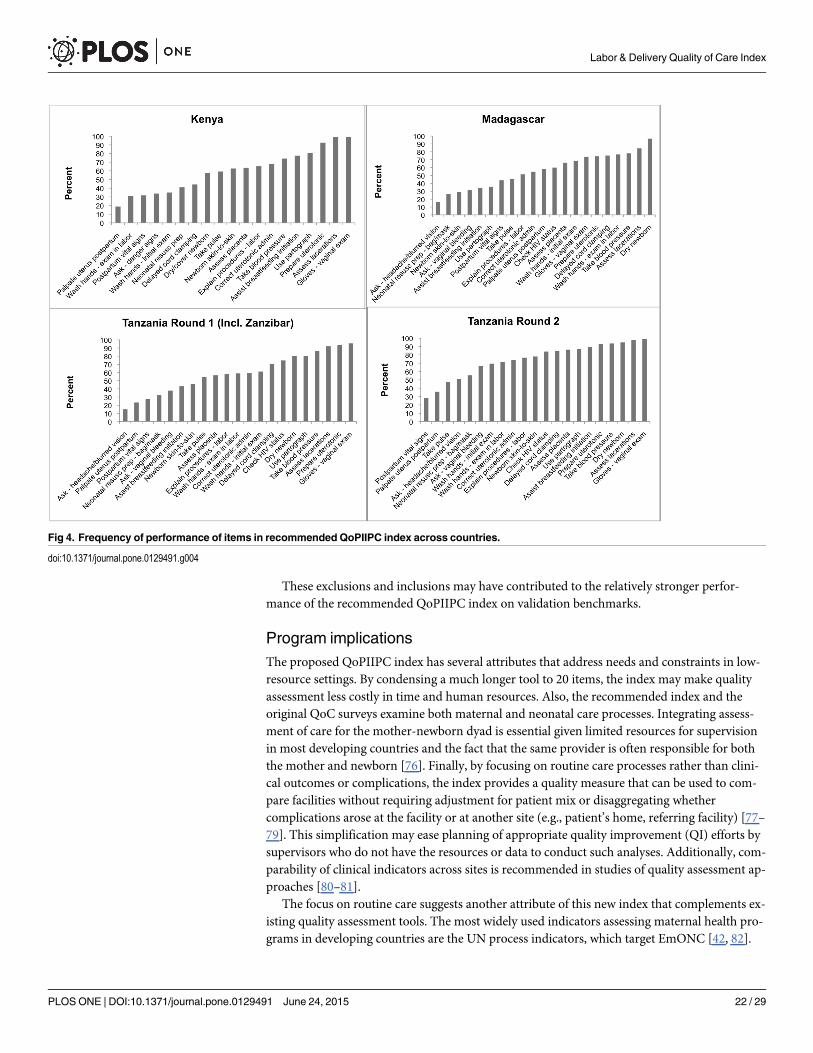
The frequency with which items in the recommended QoPIIPC index were performed var-ied across countries. The graphs in Fig 4 illustrate the spread of frequencies in each country,ranging from the least-performed to the most-performed item. The recommended index hadthe largest coefficient of variation relative to other potential QoPIIPC indices across all coun-tries. No QoPIIPC index showed evidence of ceiling or floor effects.
Table 12 provides the predicted probabilities of being in the relative (top 25% of the totalQoC score distribution) and absolute (�80% of possible indicators performed correctly) goodperformance categories at different levels of the recommended QoPIIPC index score, usingTanzania Round 1 data. At the mean index score (12.12), the probability of being in the relativegood performance group is only 4%. There is, however, a substantial increase in the likelihoodof good performance with each one-point increase in the index score above the mean. A similarpattern is evident in the predicted probability of absolute good performance; because few(<3%) deliveries were in this category, the probabilities at each level of the index score remainvery low.
Discussion and ConclusionsThrough consensus building with MNC experts, this study identified five key dimensions ofthe quality of the process of intrapartum/immediate postpartum care (QoPIIPC): technicalquality, interpersonal care, screening and monitoring, infection prevention/control, and avoid-ance of harmful/non-indicated interventions. Expert ratings of items representing these
Table 7. Description of 7 potential QoPIIPC indices evaluated across validation benchmarks.
Potential index Description Number ofitems
A. Preliminaryindex1
Items with a mean importance rating of �3.75 out of 4; rated byoriginal MNC expert group.
20
B. 3+ index1 Items rated highly by 3 or more expert subgroups. 17
C. All-surveyindex
Items with a mean importance rating of �3.5 out of 4; rated by allsurveyed experts.
21
D. Global index Items with a mean importance rating of �3.6 out of 4; rated by allexperts based at global health institutions.
23
E. Africa regionindex
Items with a mean importance rating of �3.8 out of 4; rated byexperts based in sub-Saharan Africa.
21
F. Constructedindex1
3+ group plus an additional 3 items recommended by MNC expertsduring initial face validity assessment.
20
G. Constructedindex2
Adapted from constructed index 1. Removed 3 items that wereuniversally performed or identified by expert group as difficult toobserve accurately. Replaced with 3 items that were less frequentlyperformed and/or recommended during expert group feedback.
20
1Indicates that this index served as a reference model in comparisons of AUROCs and/or likelihood
ratio tests.
doi:10.1371/journal.pone.0129491.t007
Labor & Delivery Quality of Care Index
PLOS ONE | DOI:10.1371/journal.pone.0129491 June 24, 2015 15 / 29
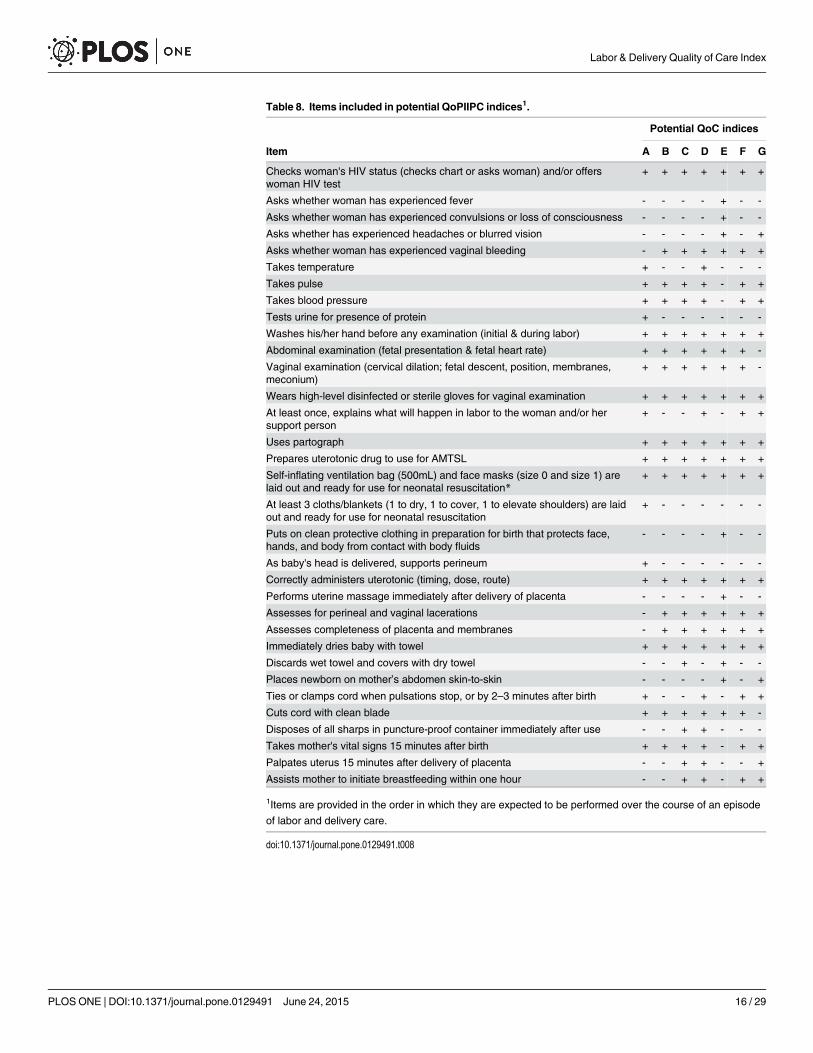
Table 8. Items included in potential QoPIIPC indices1.
Potential QoC indices
Item A B C D E F G
Checks woman's HIV status (checks chart or asks woman) and/or offerswoman HIV test
+ + + + + + +
Asks whether woman has experienced fever - - - - + - -
Asks whether woman has experienced convulsions or loss of consciousness - - - - + - -
Asks whether has experienced headaches or blurred vision - - - - + - +
Asks whether woman has experienced vaginal bleeding - + + + + + +
Takes temperature + - - + - - -
Takes pulse + + + + - + +
Takes blood pressure + + + + - + +
Tests urine for presence of protein + - - - - - -
Washes his/her hand before any examination (initial & during labor) + + + + + + +
Abdominal examination (fetal presentation & fetal heart rate) + + + + + + -
Vaginal examination (cervical dilation; fetal descent, position, membranes,meconium)
+ + + + + + -
Wears high-level disinfected or sterile gloves for vaginal examination + + + + + + +
At least once, explains what will happen in labor to the woman and/or hersupport person
+ - - + - + +
Uses partograph + + + + + + +
Prepares uterotonic drug to use for AMTSL + + + + + + +
Self-inflating ventilation bag (500mL) and face masks (size 0 and size 1) arelaid out and ready for use for neonatal resuscitation*
+ + + + + + +
At least 3 cloths/blankets (1 to dry, 1 to cover, 1 to elevate shoulders) are laidout and ready for use for neonatal resuscitation
+ - - - - - -
Puts on clean protective clothing in preparation for birth that protects face,hands, and body from contact with body fluids
- - - - + - -
As baby's head is delivered, supports perineum + - - - - - -
Correctly administers uterotonic (timing, dose, route) + + + + + + +
Performs uterine massage immediately after delivery of placenta - - - - + - -
Assesses for perineal and vaginal lacerations - + + + + + +
Assesses completeness of placenta and membranes - + + + + + +
Immediately dries baby with towel + + + + + + +
Discards wet towel and covers with dry towel - - + - + - -
Places newborn on mother’s abdomen skin-to-skin - - - - + - +
Ties or clamps cord when pulsations stop, or by 2–3 minutes after birth + - - + - + +
Cuts cord with clean blade + + + + + + -
Disposes of all sharps in puncture-proof container immediately after use - - + + - - -
Takes mother's vital signs 15 minutes after birth + + + + - + +
Palpates uterus 15 minutes after delivery of placenta - - + + - - +
Assists mother to initiate breastfeeding within one hour - - + + - + +
1Items are provided in the order in which they are expected to be performed over the course of an episode
of labor and delivery care.
doi:10.1371/journal.pone.0129491.t008
Labor & Delivery Quality of Care Index
PLOS ONE | DOI:10.1371/journal.pone.0129491 June 24, 2015 16 / 29

dimensions resulted in several potential indices to measure QoPIIPC. Comparative face, con-tent, and criterion validation of the candidates resulted in selection of a 20-item measure withgood ability to discriminate between poorly and well-performed deliveries. The recommendedindex includes items from 4 of the 5 consensus dimensions of QoPIIPC and covers intrapartumcare, immediate postpartum care, and ENC.
Table 9. Summary of index performance across validation domains1.
Potential QoC indices
A B C D E F G
Kenya
Dimension representation 0 0 0 2 0 1 0
Association with overall QoC 0 0 0 0 0 2 2
Discrimination of good/poor performance 0 0 0 0 0 2 1
Item association with overall QoC 2 2 0 0 2 2 1
Item performance range 1 0 0 0 0 0 2
Variability and distribution of index score 0 1 0 0 0 0 2
Total 3 3 0 2 2 7 8
Madagascar
Dimension representation 0 0 0 2 0 1 0
Association with overall QoC 0 0 0 0 2 0 2
Discrimination of good/poor performance 0 0 0 0 1 0 2
Item association with overall QoC 0 1 0 0 2 0 0
Item performance range 0 0 0 0 2 0 1
Variability and distribution of index score 0 0 0 0 1 0 2
Total 0 1 0 2 8 1 7
Tanzania R1 (incl. Zanzibar)
Dimension representation 0 0 0 2 0 1 0
Association with overall QoC 0 0 0 1 0 1 2
Discrimination of good/poor performance 0 0 0 0 1 0 2
Item association with overall QoC 1 1 0 1 0 1 2
Item performance range 0 0 0 0 1 0 2
Variability and distribution of index score 1 0 0 0 0 0 2
Total 2 1 0 4 2 3 10
Tanzania R2
Dimension representation 0 0 0 2 0 1 0
Association with overall QoC 0 0 0 0 2 0 1
Discrimination of good/poor performance 0 0 0 0 2 0 2
Item association with overall QoC 0 2 1 0 0 0 2
Item performance range 2 0 0 0 0 0 1
Variability and distribution of index score 0 0 0 0 2 0 1
Total 2 2 1 2 6 1 7
Total across countries 7 7 1 10 18 12 32
1Each index received 2 points if it was the best performing on the measures of a particular benchmark, and
1 point if it was the second best performing. All other ranks received 0 points and ties were acceptable. The
scoring system is described in Table 3.
doi:10.1371/journal.pone.0129491.t009
Labor & Delivery Quality of Care Index
PLOS ONE | DOI:10.1371/journal.pone.0129491 June 24, 2015 17 / 29
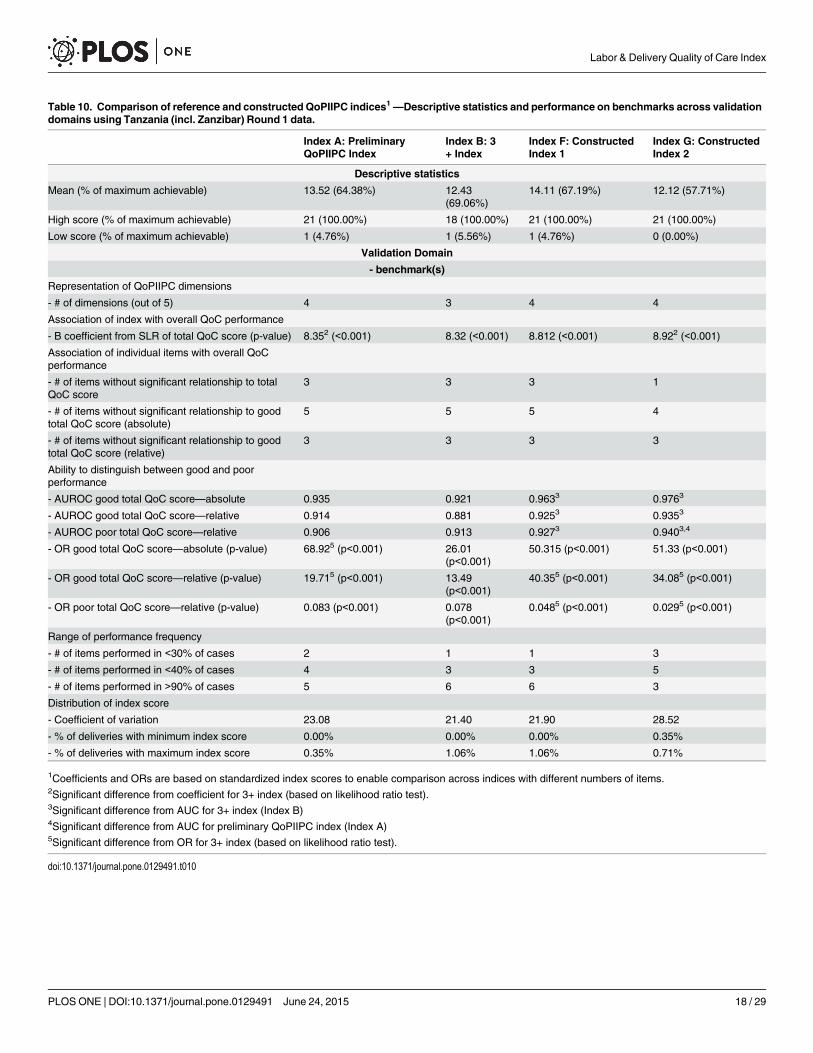
Table 10. Comparison of reference and constructed QoPIIPC indices1—Descriptive statistics and performance on benchmarks across validationdomains using Tanzania (incl. Zanzibar) Round 1 data.
Index A: PreliminaryQoPIIPC Index
Index B: 3+ Index
Index F: ConstructedIndex 1
Index G: ConstructedIndex 2
Descriptive statistics
Mean (% of maximum achievable) 13.52 (64.38%) 12.43(69.06%)
14.11 (67.19%) 12.12 (57.71%)
High score (% of maximum achievable) 21 (100.00%) 18 (100.00%) 21 (100.00%) 21 (100.00%)
Low score (% of maximum achievable) 1 (4.76%) 1 (5.56%) 1 (4.76%) 0 (0.00%)
Validation Domain
- benchmark(s)
Representation of QoPIIPC dimensions
- # of dimensions (out of 5) 4 3 4 4
Association of index with overall QoC performance
- B coefficient from SLR of total QoC score (p-value) 8.352 (<0.001) 8.32 (<0.001) 8.812 (<0.001) 8.922 (<0.001)
Association of individual items with overall QoCperformance
- # of items without significant relationship to totalQoC score
3 3 3 1
- # of items without significant relationship to goodtotal QoC score (absolute)
5 5 5 4
- # of items without significant relationship to goodtotal QoC score (relative)
3 3 3 3
Ability to distinguish between good and poorperformance
- AUROC good total QoC score—absolute 0.935 0.921 0.9633 0.9763
- AUROC good total QoC score—relative 0.914 0.881 0.9253 0.9353
- AUROC poor total QoC score—relative 0.906 0.913 0.9273 0.9403,4
- OR good total QoC score—absolute (p-value) 68.925 (p<0.001) 26.01(p<0.001)
50.315 (p<0.001) 51.33 (p<0.001)
- OR good total QoC score—relative (p-value) 19.715 (p<0.001) 13.49(p<0.001)
40.355 (p<0.001) 34.085 (p<0.001)
- OR poor total QoC score—relative (p-value) 0.083 (p<0.001) 0.078(p<0.001)
0.0485 (p<0.001) 0.0295 (p<0.001)
Range of performance frequency
- # of items performed in <30% of cases 2 1 1 3
- # of items performed in <40% of cases 4 3 3 5
- # of items performed in >90% of cases 5 6 6 3
Distribution of index score
- Coefficient of variation 23.08 21.40 21.90 28.52
- % of deliveries with minimum index score 0.00% 0.00% 0.00% 0.35%
- % of deliveries with maximum index score 0.35% 1.06% 1.06% 0.71%
1Coefficients and ORs are based on standardized index scores to enable comparison across indices with different numbers of items.2Significant difference from coefficient for 3+ index (based on likelihood ratio test).3Significant difference from AUC for 3+ index (Index B)4Significant difference from AUC for preliminary QoPIIPC index (Index A)5Significant difference from OR for 3+ index (based on likelihood ratio test).
doi:10.1371/journal.pone.0129491.t010
Labor & Delivery Quality of Care Index
PLOS ONE | DOI:10.1371/journal.pone.0129491 June 24, 2015 18 / 29

Limitations and strengthsThis study had several limitations. First, study samples were limited to relatively high-volumefacilities in each country and the lack of representative random sampling in each country mayaffect generalizability. However, given the effort involved in observing childbirth even with areduced set of indicators, it may be appropriate to limit use of the proposed index to higher-volume facilities, for example those with at least two deliveries per day. Therefore, the studysamples may adequately represent the likely context of future use of the QoPIIPC index.
An additional limitation is the limited number of respondents involved in the modified Del-phi process to identify consensus dimensions of QoPIIPC. This reflects resource and time con-straints; however, a larger and more diverse set of experts (n = 32) participated in the rating ofpotential items representing QoPIIPC, and indices combining highly-rated items were evaluat-ed through the specified validation domains rather than exclusively through an expert process.
Another study limitation is that delivery care could not be evaluated in the QoC Assess-ments or using the QoPIIPC index proposed here without providers being aware of the obser-vation. There is therefore the possibility of a Hawthorne effect, improving observed QoCbeyond what is normally provided. However, providers cannot deliver interventions they donot know, and the relative low performance of many essential interventions in the observed de-liveries indicates that any Hawthorne effect may be limited.
A final potential limitation is that the quality measure developed through this analysis islimited to assessment of routine care that should be provided to all women. As a result, it doesnot address important procedures and interventions that are required in subgroups of women
Table 11. Items in the recommended QoPIIPC index.
Initial client assessment and examination
Checks woman's HIV status (checks chart or asks woman) and/or offers woman HIV test
Asks whether woman has experienced headaches or blurred vision
Asks whether woman has experienced vaginal bleeding
Takes blood pressure
Takes pulse
Washes his/her hand before any examination
Wears high-level disinfected or sterile gloves for vaginal examination
First stage of labor
At least once, explains what will happen in labor to the woman and/or her support person
Prepares uterotonic drug to use for AMTSL
Uses partograph (during labor)
Self-inflating ventilation bag (500mL) and face masks (size 0 and size 1) are laid out and ready for use forneonatal resuscitation
Second and third stage of labor
Correctly administers uterotonic (timing, dose, route)
Assesses completeness of placenta and membranes
Assesses for perineal and vaginal lacerations
Immediate newborn and postpartum care
Immediately dries baby with towel
Places newborn on mother’s abdomen skin-to-skin
Ties or clamps cord when pulsations stop, or by 2–3 minutes after birth (not immediately after birth)
Takes mother's vital signs 15 minutes after birth
Palpates uterus 15 minutes after birth
Assists mother to initiate breastfeeding within one hour
doi:10.1371/journal.pone.0129491.t011
Labor & Delivery Quality of Care Index
PLOS ONE | DOI:10.1371/journal.pone.0129491 June 24, 2015 19 / 29
(e.g., those who are HIV-positive) or women who develop complications. However, this focuson routine care enables the QoPIIPC index to provide information that complements what isfrequently emphasized in current quality measures; this is discussed further below.
This study has a number of important strengths. The QoC Assessment samples covered awide range of health facilities from university hospitals to rural health centers, which may con-tribute to generalizeablity, despite the lack of representative random sampling.
Additionally, the content validity of a measure depends in part on the comprehensivenessof the starting item pool. The item pool in the MCHIP QoC Assessment L&D checklist wasbased on compilation of evidence-informed interventions and program learning in maternalmortality reduction, providing a strong foundation for the final measure.
Much past research on the quality of obstetric care processes has relied on maternity regis-ters and other routine data sources that may be incomplete, completed post facto, or not in-clude measures of interest. This study is one of the few in developing countries with data onactual observations of labor and delivery. Observations may provide improvements in accu-racy and specificity that counter disadvantages in terms of a Hawthorne effect [45, 47–48,73]. Many recent studies identifying important indicators of QoC during the L&D periodhave been limited to expert surveys and literature reviews [74–75]. This study is unusual inselecting quality measures of L&D QoC in developing countries through both a Delphi pro-cess and validation with empirical data. Previous research suggests that quality measuresbased only on expert opinion may have weaknesses that can be addressed through empiricalvalidation [44].
Fig 2. AUROCs (discrimination of good total quality score (top 25%)): Recommended QoPIIPC index.
doi:10.1371/journal.pone.0129491.g002
Labor & Delivery Quality of Care Index
PLOS ONE | DOI:10.1371/journal.pone.0129491 June 24, 2015 20 / 29

Excluded and included items in the recommended QoPIIPC indexThe recommended QoPIIPC index may be a robust quality measurement tool in a context ofrapid change in QoC. As care quality continues to improve in facilities in sub-Saharan Africa,it may be important to focus rapid assessment on care processes that are easy to observe, notfrequently performed (i.e., more useful in discriminating good care) and directly tied to adversematernal/neonatal outcomes. The recommended QoPIIPC index reflects these priorities.Three items included in the reference indices and first QoPIIPC index constructed with expertfeedback (index F), but removed from the recommended QoPIIPC index (Index G), are vaginalexamination, abdominal examination, and cutting the umbilical cord with a clean instrument.Each represents an important care process but has limitations as an indicator of quality. Vagi-nal examination and safe cord cutting were almost universally performed across observed de-liveries in the QoC Assessment surveys and may not be informative in distinguishing good andpoor care. Additionally, it can be difficult for an observer to determine whether examinationsinclude clinically important actions (such as assessment of cervical dilation and fetal presenta-tion in vaginal examinations).
The three items in the recommended QoPIIPC index replacing the omitted items are: askingthe woman whether she experienced headaches or blurred vision; palpating the uterus 15 min-utes after delivery, and placing the newborn on the mother’s abdomen skin-to-skin immediate-ly after birth. These items were performed less frequently in observed deliveries and judged bythe MNC expert group to be more relevant to preventing adverse outcomes or respondingquickly to danger signs.
Fig 3. AUROCs (discrimination of good total quality score (top 25%)): Comparison of the 3+ index and the recommended index.
doi:10.1371/journal.pone.0129491.g003
Labor & Delivery Quality of Care Index
PLOS ONE | DOI:10.1371/journal.pone.0129491 June 24, 2015 21 / 29
These exclusions and inclusions may have contributed to the relatively stronger perfor-mance of the recommended QoPIIPC index on validation benchmarks.
Program implicationsThe proposed QoPIIPC index has several attributes that address needs and constraints in low-resource settings. By condensing a much longer tool to 20 items, the index may make qualityassessment less costly in time and human resources. Also, the recommended index and theoriginal QoC surveys examine both maternal and neonatal care processes. Integrating assess-ment of care for the mother-newborn dyad is essential given limited resources for supervisionin most developing countries and the fact that the same provider is often responsible for boththe mother and newborn [76]. Finally, by focusing on routine care processes rather than clini-cal outcomes or complications, the index provides a quality measure that can be used to com-pare facilities without requiring adjustment for patient mix or disaggregating whethercomplications arose at the facility or at another site (e.g., patient’s home, referring facility) [77–79]. This simplification may ease planning of appropriate quality improvement (QI) efforts bysupervisors who do not have the resources or data to conduct such analyses. Additionally, com-parability of clinical indicators across sites is recommended in studies of quality assessment ap-proaches [80–81].
The focus on routine care suggests another attribute of this new index that complements ex-isting quality assessment tools. The most widely used indicators assessing maternal health pro-grams in developing countries are the UN process indicators, which target EmONC [42, 82].
Fig 4. Frequency of performance of items in recommended QoPIIPC index across countries.
doi:10.1371/journal.pone.0129491.g004
Labor & Delivery Quality of Care Index
PLOS ONE | DOI:10.1371/journal.pone.0129491 June 24, 2015 22 / 29

While there is no question of the importance of emergency care in preventing maternal andneonatal mortality, reliance on EmONCmeasures limits QoC assessment, particularly insmaller facilities where complications occur less frequently. Assessing quality exclusivelythrough EmONC may also distort perceptions about overall service quality, as it does not eval-uate provision of evidence-informed interventions shown to reduce the incidence of complica-tions or timely recognition and management of danger signs before serious complicationsarise.
Notably, most of the UN process indicators focus on availability, utilization, and recent per-formance of service rather than QoC. The authors of the UN process indicators identify thecase fatality rate as the sole quality indicator [42, 82]. The challenges of making inferencesabout quality based on case fatality rate, particularly without large sample sizes, have beennoted [83]. The QoPIIPC index may provide programs with useful information in tandemwith existing tools like the UN process indicators.
Many programs and implementation research studies continue to rely on service utilizationmeasures that are not informative about QoC or clinical outcomes. A recent review examiningMNC QI found that half of the included studies reported service utilization as their only out-come measure to assess the impact of QI strategies [84]. The application of tools like theQoPIIPC index may contribute to better information about MNC initiatives and the overall
Table 12. Predicted probabilities of good performance at different scores on recommendedQoPIIPC index using Tanzania Round 1 (incl. Zanzibar)data.
Recommended QoPIIPC index (%frequency) n = 282
Predicted probability (CI) of good performance—relative1
Predicted probability (CI) of good performance—absolute2
0 (0.35%) <0.001 <0.001
1 (0.00%) <0.001 <0.001
2 (0.00%) <0.001 <0.001
3 (0.35%) <0.001 <0.001
5 (2.48%) <0.001 <0.001
6 (2.13%) <0.001 [<0.001–0.001] <0.001
7 (3.55%) <0.001 [<0.001–0.002] <0.001 [<0.001–0.001]
8 (5.32%) 0.001 [<0.001–0.004] <0.001 [<0.001–0.001]
9 (9.93%) 0.002 [<0.001–0.001] <0.001 [<0.001–0.002]
10 (7.09%) 0.005 [0.001–0.020] <0.001 [<0.001–0.003]
11 (12.06%) 0.013 [0.004–0.040] <0.001 [<0.001–0.005]
12 (10.64%)3 0.036 [0.015–0.082] <0.001 [<0.001–0.009]
13 (10.28%) 0.093 [0.051–0.164] 0.001 [<0.001–0.016]
14 (8.16%) 0.222 [0.152–0.312] 0.002 [<0.001–0.029]
15 (10.64%) 0.441 [0.342–0.546] 0.008 [0.001–0.053]
16 (9.57%) 0.687 [0.559–0.792] 0.025 [0.006–0.099]
17 (1.77%) 0.859 [0.739–0.929] 0.075 [0.027–0.193]
18 (2.84%) 0.944 [0.859–0.979] 0.203 [0.089–0.397]
19 (1.42%) 0.979 [0.929–0.994] 0.443 [0.202–0.714]
20 (0.71%) 0.992 [0.965–0.998] 0.713 [0.348–0.920]
21 (0.71%) 0.997 [0.982–1.00] 0.886 [0.508–0.983]
1Relative good performance is defined as being in the top 25% of the total QoC score distribution.2 Absolute good performance is defined as performing �80% of all observed routine L&D actions correctly; 2.84% of deliveries demonstrated absolute
good performance3 Mean = 12.12, median = 12
doi:10.1371/journal.pone.0129491.t012
Labor & Delivery Quality of Care Index
PLOS ONE | DOI:10.1371/journal.pone.0129491 June 24, 2015 23 / 29

content of facility-based L&D care. The QoPIIPC index may have several potential program-matic uses, including baseline and ongoing assessments of QoPIIPC at the facility and districtlevel as well as verification for ongoing QI or performance-based financing processes [85–87].Rowe proposed the use of ongoing rapid assessments from household surveys and care obser-vation to complement record review in monitoring the quality of L&D care [88]. The QoPIIPCindex may be an appropriate tool for such repeated quality assessments.
It is important to note that the QoPIIPC index is not a job aid or tool to ensure that provid-ers implement all essential or appropriate interventions; it is, rather, a selection of highly infor-mative items to enable rapid QoC assessment. Tools such as the Safe Birth Checklist or theStandards-based Management and Recognition process may be more suited for clinical supportand comprehensive QI efforts [42, 85].
Research implicationsA valid measure of QoPIIPC may facilitate future research on the determinants of good qualityfacility-based MNC and the effectiveness of different QI approaches. Although the results re-ported here suggest that the proposed index can provide a meaningful measure of the qualityof intrapartum and immediate postpartum care, additional research is required about its feasi-bility, reliability, and perception by end users. Information can be gained through piloting theindex in sub-Saharan African facilities by district-level supervisors and experiencedclinical observers.
The strong performance of the QoPIIPC index on the validation domains, as a measure ofoverall QoC, is based on observation of all included items across the time from intake throughthe immediate postpartum period. While the index is substantially shorter than most existingtools for observation-based assessment of QoC in maternal and neonatal services, it continuesto face challenges common to all observation of L&D—the timing of an obstetric episode ofcare is unpredictable and the length of active labor is frequently very long. As a result, supervi-sors and other potential users outside the research setting may be discouraged from using theindex on an ongoing basis; potential users may wish to revert to records-based QoC assessmentof the QoPIIPC index items or to base QoC assessment on observation of just some items inthe index. While it may be possible to adapt the proposed index to retrospective, record-basedusage, the disadvantages are outlined above. Although the QoPIIPC index has been validatedonly in the context of observation of complete episodes of L&D care, alternatives should be ex-plored and may be necessary depending on the settings of use. Notably, 65% (13 of the 20) ofthe items comprising the proposed QoPIIPC index can be assessed at delivery or in the imme-diate intrapartum period. Using these items alone would reduce the content validity of theindex (e.g., excluding most indicators related to screening). A shortened index may, nonethe-less, be a useful alternative when there are limited resources for supervision. The relative validi-ty and performance of a shortened QoPIIPC index focusing on the time of delivery warrantsfurther evaluation.
ConclusionsCurrently, knowledge about the quality of L&D care processes in developing country settings isfar too limited. Assessment of these processes is difficult with current tools, and a focus onEmONC and adverse event reviews limits understanding about coverage of routine interven-tions that can prevent complications and promote their early recognition and management. Asfinancial incentives for women, performance-based financing for providers and facilities, re-moval of user fees, and other trends increase the proportion of women delivering in facilities, itis essential that these facilities provide quality care to women and newborns.
Labor & Delivery Quality of Care Index
PLOS ONE | DOI:10.1371/journal.pone.0129491 June 24, 2015 24 / 29

The global community has recognized the importance of QoC in achieving further reduc-tions in maternal and neonatal mortality and morbidity and the need for valid ways to assesscare quality. The index reported here provides a condensed, validated set of items that can beused to evaluate routine intrapartum and immediate postpartum care more easily using clinicalobservation. The availability of such a tool may improve knowledge about the quality of facili-ty-based care for mothers and newborns in sub-Saharan Africa and other developing countries,and help programs target their efforts to improve quality.
Supporting InformationS1 Checklist. MCHIP QOC Assessment Tool 5—Observation of labor and delivery andnewborn care checklist.(XLSX)
S1 Table. Delphi group ratings of potential QoPIIPC dimensions (listed alphabetically).(DOCX)
S2 Table. Performance of potential QoPIIPC index items across QoC Assessment coun-tries.(DOCX)
AcknowledgmentsThe authors wish to acknowledge the important contributions of the MCHIP QoC StudyGroup, whose members include: Gloriose Abayisenga, Paul Ametepi, Linda Bartlett, EvaBazant, Joseph de Graft-Johnson, Mary Drake, Ashebir Getachew, Patricia Gomez, FrankKagema, Pamela Lynam, Christina Lulu Makene, Marya Plotkin, Barbara Rawlins, JamesRicca, Heather Rosen, Jean Pierre Rakotovao, and Maria Vaz. These individuals conducted theQoC Assessment surveys described in the paper. The authors also wish thank DeborahArmbruster at USAID and Sheena Currie and Jeffrey Smith at MCHIP for their leadership andguidance, and for reviewing this manuscript. We would also like to thank Kitty Chan and LukeMullany at JHSPH for their review of the manuscript and contributions to the analysis plan. Fi-nally, we thank the MNC experts who provided their invaluable feedback to the Delphi processand surveys conducted through this study.
Author ContributionsConceived and designed the experiments: VT. Performed the experiments: VT. Analyzed thedata: VT. Contributed reagents/materials/analysis tools: LB. Wrote the paper: VT CS DS LB.provided substantive contributions to the study design: CS DS LB; oversaw data collection forthe secondary data source: LB.
References1. World Health Organization. Trends in maternal mortality: 1990 to 2013. Estimates developed byWHO,
UNICEF, UNFPA and the World Bank. Geneva: WHO; 2014. 56 p. doi: 10.1186/1471-2393-14-299PMID: 25174573
2. Lozano R, Wang H, Foreman KJ, Rajaratnam JK, Naghavi M, Marcus JR, et al. Progress towards Mil-lennium Development Goals 4 and 5 on maternal and child mortality: an updated systematic analysis.Lancet 2011; 378: 1139–65. doi: 10.1016/S0140-6736(11)61337-8 PMID: 21937100
3. Hogan MC, Foreman KJ, Naghavi M, Ahn SY, Wang M, Makela SM, et al. Maternal mortality for 181countries, 1980–2008: A systematic analysis of progress towards millennium development goal 5. Lan-cet 2010; 375: 1609–23. doi: 10.1016/S0140-6736(10)60518-1 PMID: 20382417
Labor & Delivery Quality of Care Index
PLOS ONE | DOI:10.1371/journal.pone.0129491 June 24, 2015 25 / 29

4. Lawn JE, Kerber K, Enweronu-Laryea C, Cousens S. 3.6 million neonatal deaths—what is progressingand what is not? Semin Perinatol 2010; 34: 371–86. doi: 10.1053/j.semperi.2010.09.011 PMID:21094412
5. Oestergaard MZ, Inoue M, Yoshida S, Mahanani WR, Gore FM, Cousens S, et al; United Nations Inter-Agency Group for Child Mortality Estimation and the Child Health Epidemiology Reference Group. Neo-natal mortality levels for 193 countries in 2009 with trends since 1990: a systematic analysis of prog-ress, projections, and priorities. PLoS Med 2011; 8: e1001080. doi: 10.1371/journal.pmed.1001080PMID: 21918640
6. Lawn JE, Lee AC, Kinney M, Sibley L, Carlo WA, Paul VK, et al. Two million intrapartum-related still-births and neonatal deaths: where, why, and what can be done? Int J Gynaecol Obstet 2009; 107Suppl 1: S5–18, S19. doi: 10.1016/j.ijgo.2009.07.016 PMID: 19815202
7. United Nations Statistics Division [Internet]. New York: United Nations; c2008. Millennium DevelopmentGoals Indicators. Available from: http://mdgs.un.org/unsd/mdg/Host.aspx?Content=Indicators/OfficialList.htm.
8. Dzakpasu S, Soremekun S, Manu A, Ten Asbroek G, Tawiah C, Hurt L, et al. Impact of free deliverycare on health facility delivery and insurance coverage in Ghana's Brong Ahafo Region. PLoS One2012; 7: e49430. doi: 10.1371/journal.pone.0049430 PMID: 23173061
9. Lim SS, Dandona L, Hoisington JA, James SL, Hogan MC, Gakidou E. India's Janani Suraksha Yojana,a conditional cash transfer programme to increase births in health facilities: an impact evaluation. Lan-cet 2010; 375: 2009–23. doi: 10.1016/S0140-6736(10)60744-1 PMID: 20569841
10. Hodgins S. Achieving better maternal and newborn outcomes: coherent strategy and pragmatic, tai-lored implementation. Glob Health Sci Pract 2013; 1: 146–153. doi: 10.9745/GHSP-D-13-00030 PMID:25276527
11. World Health Organization. Pregnancy, Childbirth, Postpartum and Newborn Care: A Guide for Essen-tial Practice, Integrated Management of Pregnancy and Childbirth Toolkit. Geneva: WHO; 2006. 180 p.
12. Shankar A, Bartlett L, Fauveau V, IslamM, Terreri N. Countdown to 2015 Maternal Health Group. Deliv-ery of MDG 5 by active management with data. Lancet 2008; 371: 1223–4. doi: 10.1016/S0140-6736(08)60536-X PMID: 18406844
13. Miller S, Cordero M, Coleman AL, Figueroa J, Brito-Anderson S, Dabagh R, et al. Quality of care in insti-tutionalized deliveries: The paradox of the Dominican Republic. Int J Gynaecol Obstet 2003; 82:89,103; discussion 87–8. PMID: 12834953
14. Randive B, Diwan V, De Costa A. India's Conditional Cash Transfer Programme (the JSY) to PromoteInstitutional Birth: Is There an Association between Institutional Birth Proportion and Maternal Mortality?PLoS One 2013; 8: e67452. PMID: 23826302
15. Powell-Jackson T, Neupane BD, Tiwari S, Tumbahangphe K, Manandhar D. The impact of Nepal's na-tional incentive programme to promote safe delivery in the district of Makwanpur. Adv Health EconHealth Serv Res 2009; 21: 221–49. PMID: 19791705
16. Baral G. An assessment of the safe delivery incentive program at a tertiary level hospital in Nepal. JNepal Health Res Counc 2012; 10: 118–24. PMID: 23034373
17. Firoz T, Sanghvi H, Merialdi M, von Dadelszen P. Pre-eclampsia in low and middle income countries.Best Pract Res Clin Obstet Gynaecol 2011; 25: 537–48. doi: 10.1016/j.bpobgyn.2011.04.002 PMID:21592865
18. Harvey SA, Blandón YC, McCaw-Binns A, Sandino I, Urbina L, Rodríguez C, et al. Nicaraguan Mater-nal and Neonatal Health Quality Improvement Group. Are skilled birth attendants really skilled? A mea-surement method, some disturbing results and a potential way forward. Bull World Health Organ 2007;85:783–90. PMID: 18038060
19. Stanton C, Armbruster D, Knight R, Ariawan I, Gbangbade S, Getachew A, et al. Use of active manage-ment of the third stage of labour in seven developing countries. Bull World Health Organ 2009; 87:207–15. PMID: 19377717
20. Wall SN, Lee AC, Niermeyer S, English M, KeenanWJ, Carlo W, et al. Neonatal resuscitation in low-re-source settings: what, who, and how to overcome challenges to scale up? Int J Gynaecol Obstet 2009;107: S47–62, S63–4. doi: 10.1016/j.ijgo.2009.07.013 PMID: 19815203
21. Souza JP, Gülmezoglu AM, Vogel J, Carroli G, Lumbiganon P, Qureshi Z, et al. Moving beyond essen-tial interventions for reduction of maternal mortality (the WHOMulti-country Survey on Maternal andNewborn Health): a cross-sectional study. Lancet 2013; 381: 1747–55. doi: 10.1016/S0140-6736(13)60686-8 PMID: 23683641
22. Campbell OM, GrahamWJ; Lancet Maternal Survival Series steering group. Strategies for reducingmaternal mortality: getting on with what works. Lancet 2006; 368: 1284–99. PMID: 17027735
Labor & Delivery Quality of Care Index
PLOS ONE | DOI:10.1371/journal.pone.0129491 June 24, 2015 26 / 29
23. Lawn JE, Kerber K, Enweronu-Laryea C, Massee Bateman O. Newborn survival in low resource set-tings—are we delivering? BJOG 2009; 116: 49–59. doi: 10.1111/j.1471-0528.2009.02328.x PMID:19740173
24. Ronsmans C, Campbell O. Quantifying the fall in mortality associated with interventions related to hy-pertensive diseases of pregnancy. BMC Public Health 2011; 11 Suppl 1: S8. doi: 10.1186/1471-2458-11-S1-S8 PMID: 21356137
25. Wall SN, Lee AC, Carlo W, Goldenberg R, Niermeyer S, Darmstadt GL, et al. Reducing intrapartum-re-lated neonatal deaths in low- and middle-income countries-what works? Semin Perinatol 2010;34:395–407. doi: 10.1053/j.semperi.2010.09.009 PMID: 21094414
26. Hinderaker SG, Olsen BE, Bergsjo PB, Gasheka P, Lie RT, Havnen J, et al. Avoidable stillbirths andneonatal deaths in rural Tanzania. BJOG 2003; 110: 616–23. PMID: 12798482
27. Kongnyuy EJ, Mlava G, van den Broek N. Facility-based maternal death review in three districts in thecentral region of Malawi: An analysis of causes and characteristics of maternal deaths. Womens HealthIssues 2009; 19: 14–20. doi: 10.1016/j.whi.2008.09.008 PMID: 19111783
28. Pattinson RC. Challenges in saving babies—avoidable factors, missed opportunities and substandardcare in perinatal deaths in South Africa. S Afr Med J 2003; 93: 450–5. PMID: 12916386
29. Abouchadi S, Alaoui AB, Meski FZ, Bezad R, De Brouwere V. Preventable maternal mortality in Moroc-co: the role of hospitals. Trop Med Int Health 2013; 18: 444–50. doi: 10.1111/tmi.12065 PMID:23360349
30. Kruk ME, Mbaruku G, McCord CW, Moran M, Rockers PC, Galea S. Bypassing primary care facilitiesfor childbirth: A population-based study in rural Tanzania. Health Policy Plan 2009; 24: 279–88. doi:10.1093/heapol/czp011 PMID: 19304785
31. Parkhurst JO, Ssengooba F. Assessing access barriers to maternal health care: Measuring bypassingto identify health centre needs in rural Uganda. Health Policy Plan 2009; 24: 377–84. doi: 10.1093/heapol/czp023 PMID: 19520736
32. Mselle LT, Moland KM, Mvungi A, Evjen-Olsen B, Kohi TW. Why give birth in health facility? Users' andproviders' accounts of poor quality of birth care in Tanzania. BMC Health Serv Res 2013; 13: 174. doi:10.1186/1472-6963-13-174 PMID: 23663299
33. World Health Organization. Managing Complications in Pregnancy and Childbirth: A Guide for Mid-wives and Doctors. Geneva, Switzerland: WHO; 2003. 19 p.
34. Maine D. What’s So Special About Maternal Mortality? In: Barzelatto J, Berer M, Sundari RTK, editors.Safe motherhood initiatives: critical issues. Oxford: Blackwell Science/Reproductive Health Matters;1999. p.175–182.
35. Granja AC, Machungo F, Bergstrom S. Avoidability of maternal death in Mozambique: audit and retro-spective risk assessment in 106 consecutive cases. Afr J Health Sci 2008; 7: 83–7.
36. Donabedian A. The Definition of Quality and Approaches to Its Management, Vol 1: Explorations inQuality Assessment and Monitoring. Ann Arbor: Health Administration Press; 1980. 163 p.
37. Donabedian A. The quality of care. How can it be assessed? JAMA 1988; 260: 1743–8. PMID:3045356
38. Salinas AM, Coria I, Reyes H, Zambrana M. Effect of quality of care on preventable perinatal mortality.Int J Qual Health Care 1997; 9: 93–9. PMID: 9154495
39. Anwar I. Perceptions of quality of care for serious illness at different levels of facilities in a rural area ofBangladesh. J Health Popul Nutr 2009; 27: 396–405. PMID: 19507755
40. Baltussen RM, Ye Y, Haddad S, Sauerborn RS. Perceived quality of care of primary health care ser-vices in Burkina Faso. Health Policy Plan 2002; 17: 42–8. PMID: 11861585
41. Admasu K, Haile-Mariam A, Bailey P. Indicators for availability, utilization, and quality of emergency ob-stetric care in Ethiopia, 2008. Int J Gynaecol Obstet 2011; 115: 101–5. doi: 10.1016/j.ijgo.2011.07.010PMID: 21855065
42. Bailey P, Paxton A, Lobis S, Fry D. The availability of life-saving obstetric services in developing coun-tries: an in-depth look at the signal functions for emergency obstetric care. Int J Gynaecol Obstet 2006;93: 285–91. PMID: 16687145
43. Spector JM, Agrawal P, Kodkany B, Lipsitz S, Lashoher A, Dziekan G, et al. Improving quality of carefor maternal and newborn health: prospective pilot study of the WHO safe childbirth checklist program.PLoS One 2012; 7:e35151. doi: 10.1371/journal.pone.0035151 PMID: 22615733
44. Gouws E, Bryce J, Pariyo G, Armstrong Schellenberg J, Amaral J, Habicht JP. Measuring the quality ofchild health care at first-level facilities. Soc Sci Med 2005; 61:613–25. PMID: 15899320
45. Broughton EI, Ikram AN, Sahak I. How accurate are medical record data in Afghanistan's maternalhealth facilities? An observational validity study. BMJ Open 2014; 3: 10.
Labor & Delivery Quality of Care Index
PLOS ONE | DOI:10.1371/journal.pone.0129491 June 24, 2015 27 / 29

46. Chiba Y, Oguttu MA, Nakayama T. Quantitative and qualitative verification of data quality in the child-birth registers of two rural district hospitals in Western Kenya. Midwifery 2012; 28: 329–39. doi: 10.1016/j.midw.2011.05.005 PMID: 21684639
47. Duffy S, Crangle M. Delivery room logbook—fact or fiction? Trop Doct 2009; 39: 145–9. doi: 10.1258/td.2009.080433 PMID: 19535748
48. Hermida J, Nicholas DD, Blumenfeld SN. Comparative validity of three methods for assessment of thequality of primary health care. Int J Qual Health Care 1999; 11: 429–33 PMID: 10561036
49. Flood M, Small R. Researching labour and birth events using health information records: methodologi-cal challenges. Midwifery 2009; 25: 701–10. doi: 10.1016/j.midw.2007.12.003 PMID: 18321619
50. Lain SJ, Hadfield RM, Raynes-Greenow CH, Ford JB, Mealing NM, Algert CS, et al. Quality of data inperinatal population health databases: a systematic review. Med Care 2012; 50: e7–20 doi: 10.1097/MLR.0b013e31821d2b1d PMID: 21617569
51. Yasmeen S, Romano PS, Schembri ME, Keyzer JM, Gilbert WM. Accuracy of obstetric diagnoses andprocedures in hospital discharge data. Am J Obstet Gynecol 2006; 194: 992–1001. PMID: 16580288
52. Hulton LA, Matthews Z, Stones RW. Applying a framework for assessing the quality of maternal healthservices in urban India. Soc Sci Med 2007; 64: 2083–95. PMID: 17374551
53. Bazant E, Rakotovao JP, Rasolofomanana JR, Tripathi V, Gomez P, Favero R, et al. [Quality of care toprevent and treat postpartum hemorrhage and pre-eclampsia/eclampsia: an observational assessmentin Madagascar's hospitals]. Med Sante Trop 2013; 23: 168–75. doi: 10.1684/mst.2013.0161 PMID:23694783
54. Geller SE, Cox SM, CallaghanWM, Berg CJ. Morbidity and mortality in pregnancy: laying the ground-work for safe motherhood. Women’s Health Issues 2006; 16: 176–88.
55. Holt J, Fagerli I, Holdø B, Vold IN. Audit of neonatal deaths of nonmalformed infants of 34 or moreweeks' gestation: unavoidable catastrophic events or suboptimal care? Acta Obstet Gynecol Scand2002; 81: 899–904. PMID: 12366478
56. Lawn JE, Cousens S, Zupan J; Lancet Neonatal Survival Steering Team. 4 million neonatal deaths:when?Where?Why? Lancet 2005; 365: 891–900. PMID: 15752534
57. Ronsmans C, GrahamWJ; Lancet Maternal Survival Series steering group. Maternal mortality: who,when, where, and why. Lancet 2006; 368:1189–200. PMID: 17011946
58. Boulkedid R, Abdoul H, Loustau M, Sibony O, Alberti C. Using and reporting the Delphi method for se-lecting healthcare quality indicators: a systematic review. PLoS One 2011; 6:e20476. doi: 10.1371/journal.pone.0020476 PMID: 21694759
59. Hsu C-C, Sandford BA. The Delphi technique: Making sense of consensus. Practical Assessment, Re-search and Evaluation [Internet]. 2007; 12. Available at: http://pareonline.net/getvn.asp?v=12&n=10.
60. UNICEF [Internet]. Info by Country. New York: UNICEF; c2012. Available at: http://www.unicef.org/infobycountry/.
61. UNICEF. Levels and Trends in Child Mortality; Report 2010. Estimates Developed by the UN Inter-Agency Group for Child Mortality Estimation. New York: 2010. 24p.
62. World Health Organization [Internet]. Geneva: WHO; c2011. Atlas of Health Statistics of the African Re-gion 2011. Available at: http://www.afro.who.int/index.php?option = com_docman&task = doc_download&gid=7011.
63. ACCESS Project. Best Practices in Maternal and Newborn Care: A Learning Resource Package for Es-sential and Basic Emergency Obstetric and Newborn Care. Baltimore: Jhpiego; 2008. 522 p.
64. Prevention of Postpartum Hemorrhage Initiative [Internet]. Seattle: PATH; c2006. AMTSL Survey: Toolsto Conduct a National Survey. Available at: https://www.k4health.org/toolkits/postpartumhemorrhage/amtsl-survey-tools-conduct-national-survey.
65. MCHIP [Internet]. Washington: MCHIP; c2012. Maternal and Newborn Quality of Care Surveys. Avail-able: http://www.mchip.net/node/968.
66. Plotkin M, Tibaijuka G, Makene CL, Currie S, Lacoste M. Quality of Care for Prevention and Manage-ment of CommonMaternal and Newborn Complications: A study of 12 regions in Tanzania. Baltimore:MCHIP/Jhpiego; 2011. 48 p.
67. Rasolofomanana JR, Rakotovao JP, Bazant E, Tripathi V. Quality of Care of the Prevention and Man-agement of CommonMaternal and Newborn Complications in Health Facilities in Madagascar. Balti-more: MCHIP/Jhpiego; 2011. 43 p.
68. Kagema F, Ricca J, Rawlins B, Rosen H, Lynam P, Kidula N. Quality of Care for Prevention and Man-agement of CommonMaternal and Newborn Complications: Findings from a National Health FacilitySurvey in Kenya: Are Services Provided According to International Standards? Baltimore: MCHIP/Jhpiego; 2011. 34 p.
Labor & Delivery Quality of Care Index
PLOS ONE | DOI:10.1371/journal.pone.0129491 June 24, 2015 28 / 29

69. Kenya National Coordinating Agency for Population and Development, Kenya Ministry of Medical Ser-vices, Kenya Ministry of Public Health and Sanitation, Kenya National Bureau of Statistics, ICF Macro.Kenya Service Provision Assessment Survey 2010. Nairobi: National Coordinating Agency for Popula-tion and Development, Ministry of Medical Services, Ministry of Public Health and Sanitation, KenyaNational Bureau of Statistics, and ICF Macro; 2011. 695 p.
70. Makene C, Plotkin M, Currie S, Bishanga D, Ugwi P, Louis H, et al. Improvements in newborn care andnewborn resuscitation following a quality improvement program at scale: results from a before and afterstudy in Tanzania. BMC Pregnancy Childbirth 2014; 14:381. doi: 10.1186/s12884-014-0381-3 PMID:25406496
71. Akobeng AK. Understanding diagnostic tests 3: Receiver operating characteristic curves. Acta Paediatr2007; 96: 644–7. PMID: 17376185
72. Hanley JA, McNeil BJ. The meaning and use of the area under a receiver operating characteristic(ROC) curve. Radiology 1982; 143: 29–36. PMID: 7063747
73. Leonard KL, Masatu MC. The use of direct clinician observation and vignettes for health services quali-ty evaluation in developing countries. Soc Sci Med 2005; 61: 1944–51. PMID: 15936863
74. Gabrysch S, Civitelli G, Edmond KM, Mathai M, Ali M, Bhutta ZA, et al. New signal functions to measurethe ability of health facilities to provide routine and emergency newborn care. PLoS Med 2012; 9:e1001340. doi: 10.1371/journal.pmed.1001340 PMID: 23152724
75. De Bruin-kooistra M, Amelink-Verburg M, Buitendijk SE, Westert GP. Finding the right indicators for as-sessing quality midwifery care. Int J Qual Health Care 2012; 24: 301–10. doi: 10.1093/intqhc/mzs006PMID: 22457241
76. Lawn JE, Cousens S, Darmstadt GL, Paul V, Martines J. Why are 4 million newborn babies dying everyyear? Lancet 2004; 364: 2020. PMID: 15582058
77. Althabe F, Sosa C, Belizán JM, Gibbons L, Jacquerioz F, Bergel E. Cesarean section rates and mater-nal and neonatal mortality in low-, medium-, and high-income countries: an ecological study. Birth2006; 33: 270–7. PMID: 17150064
78. Souza JP, Cecatti JG, Haddad SM, Parpinelli MA, Costa ML, Katz L, et al; Brazilian Network for Surveil-lance of Severe Maternal Morbidity Group; Brazilian Network for Surveillance of Severe Maternal Mor-bidity. TheWHOmaternal near-miss approach and the maternal severity index model (MSI): tools forassessing the management of severe maternal morbidity. PLoS One 2012; 7: e44129. doi: 10.1371/journal.pone.0044129 PMID: 22952897
79. Villar J, Valladares E, Wojdyla D, Zavaleta N, Carroli G, Velazco A, et al; WHO 2005 global survey onmaternal and perinatal health research group. Caesarean delivery rates and pregnancy outcomes: the2005WHO global survey on maternal and perinatal health in Latin America. Lancet 2006; 367: 1819–29. PMID: 16753484
80. Bailit JL. Measuring the quality of inpatient obstetrical care. Obstet Gynecol Surv 2007; 62: 207–13PMID: 17306043
81. Mainz J. Defining and classifying clinical indicators for quality improvement. Int J Qual Health Care2003; 15: 523–30. PMID: 14660535
82. Paxton A, Bailey P, Lobis S. The United Nations Process Indicators for emergency obstetric care: Re-flections based on a decade of experience. Int J Gynaecol Obstet 2006; 95: 192–208. PMID:17074557
83. Goodburn EA. Using process indicators to monitor and evaluate obstetric services in developing coun-tries. J AmMedWomens Assoc 2002; 57: 145–8. PMID: 12146605
84. Dettrick Z, Firth S, Jimenez Soto E. Do strategies to improve quality of maternal and child health care inlower and middle income countries lead to improved outcomes? A review of the evidence. PLoS One2013; 8: e83070. doi: 10.1371/journal.pone.0083070 PMID: 24349435
85. Nechochea E, Bossemeyer D. Standards-based management and recognition: A field guide. Balti-more: Jhpiego; 2003. 83 p.
86. Rusa L, Ngirabega Jde D, JanssenW, Van Bastelaere S, Porignon D, et al. Performance-based financ-ing for better quality of services in Rwandan health centres: 3-year experience. Trop Med Int Health2009; 14: 830–7. doi: 10.1111/j.1365-3156.2009.02292.x PMID: 19497081
87. Eichler R, Auxila P, Pollock J. Performance-based payment to improve the impact of health services: Evi-dence fromHaiti. World Bank Institute Online Journal: Flagship Program onHealth Sector Reform andSustainable Financing [Internet]. 2001. Available at: http://info.worldbank.org/etools/docs/library/122031/bangkokCD/BangkokMarch05/Week2/2Tuesday/S4GroupWork/performancebasedpayment.pdf.
88. Rowe AK. Potential of integrated continuous surveys and quality management to support monitoring,evaluation, and the scale-up of health interventions in developing countries. Am J Trop Med Hyg 2009;80:971–9. PMID: 19478260
Labor & Delivery Quality of Care Index
PLOS ONE | DOI:10.1371/journal.pone.0129491 June 24, 2015 29 / 29