Research Update International Partners Joe Folkman Zenger Folkman.
13
Research Update International Partners Joe Folkman Zenger Folkman
-
Upload
ruby-bruce -
Category
Documents
-
view
224 -
download
4
Transcript of Research Update International Partners Joe Folkman Zenger Folkman.
Research UpdateInternational Partners
Joe FolkmanZenger Folkman
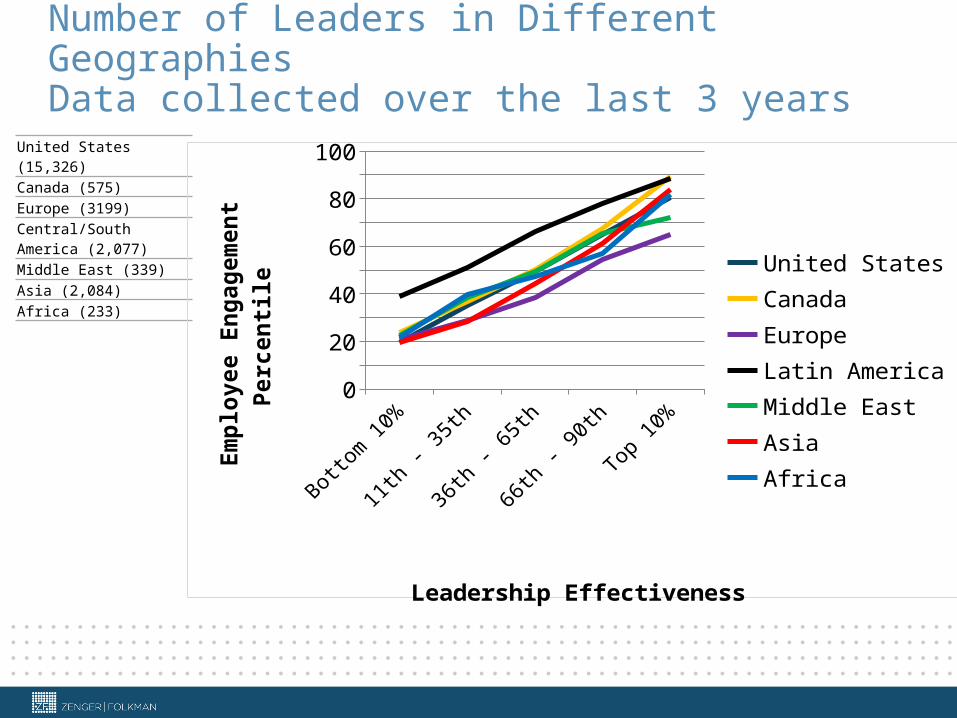
Number of Leaders in Different Geographies Data collected over the last 3 years
United States (15,326)Canada (575)Europe (3199)Central/South America (2,077)Middle East (339)Asia (2,084)Africa (233)
Bottom 10%
11th - 35th
36th - 65th
66th - 90th
Top 10%
0102030405060708090
100
United StatesCanadaEuropeLatin AmericaMiddle EastAsiaAfrica
Leadership Effectiveness
Em
plo
yee
En
gag
emen
t P
erce
nti
le

One of the biggest concerns of every CEO
Finding the Best and Brightest Talent
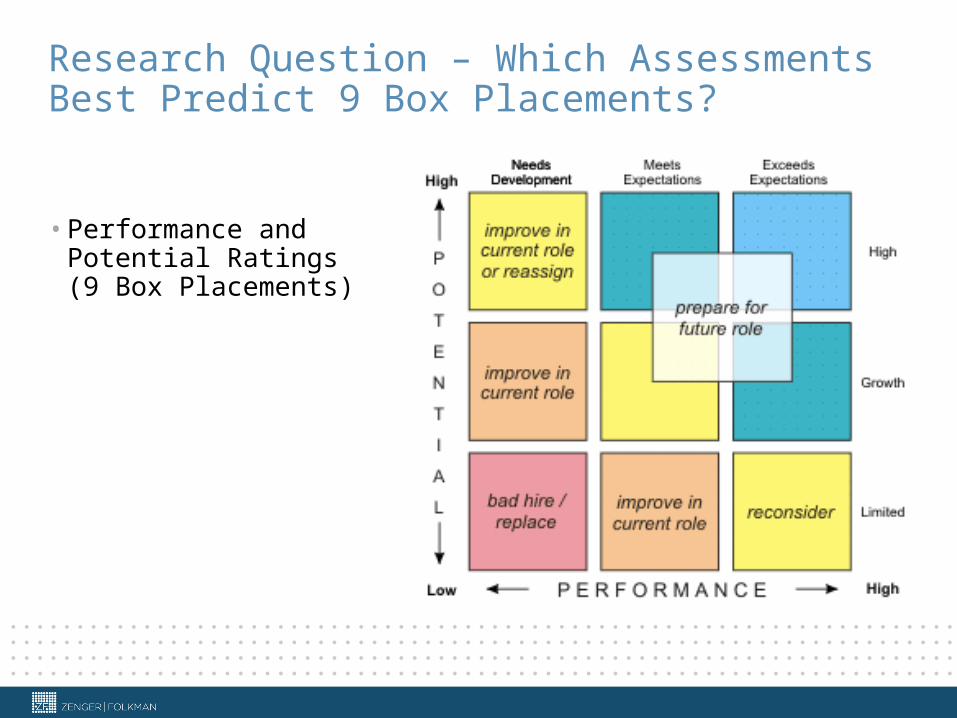
Research Question – Which Assessments Best Predict 9 Box Placements?
• Performance and Potential Ratings (9 Box Placements)
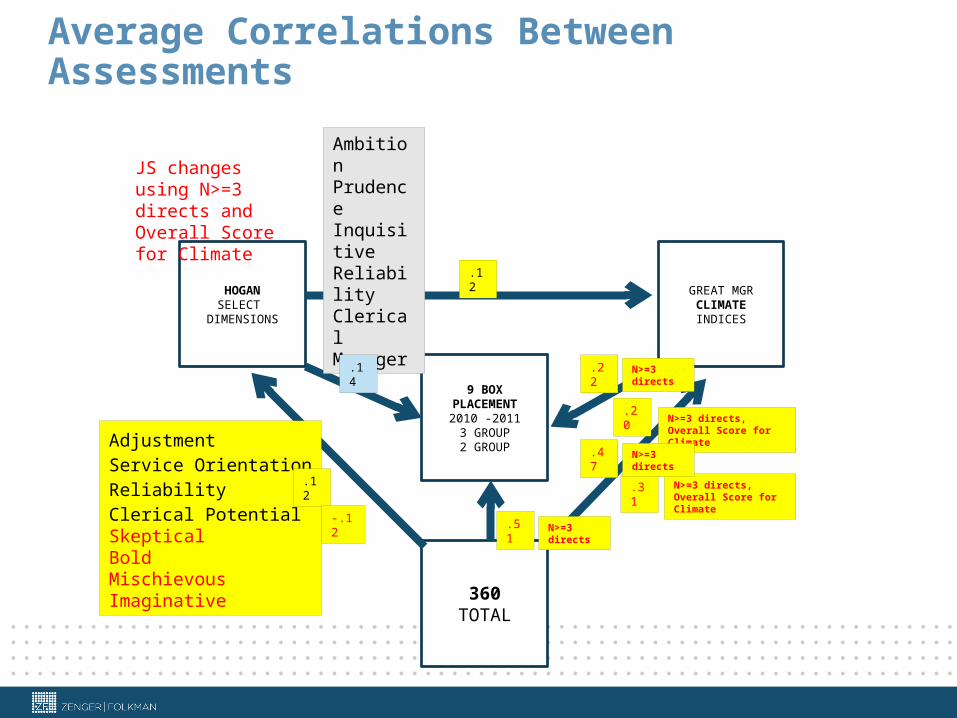
HOGANSELECT
DIMENSIONS
9 BOX PLACEMENT
2010 -20113 GROUP2 GROUP
360TOTAL
GREAT MGRCLIMATEINDICES
.51
.12
AdjustmentService OrientationReliabilityClerical PotentialSkepticalBoldMischievousImaginative
.12
.47
.31
AmbitionPrudenceInquisitiveReliabilityClericalManager
.14
.20
.22
JS changes using N>=3 directs and Overall Score for Climate
N>=3 directs, Overall Score for Climate
N>=3 directs, Overall Score for Climate
N>=3 directs
N>=3 directs
N>=3 directs
Average Correlations Between Assessments
-.12
© Zenger Folkman 2014
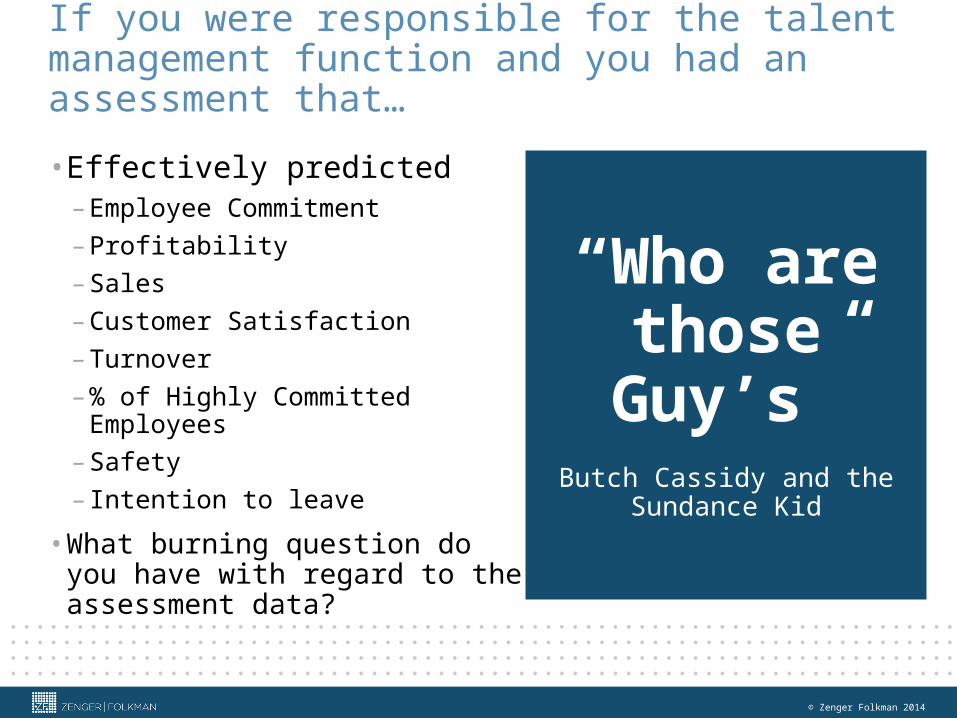
If you were responsible for the talent management function and you had an assessment that…
• Effectively predicted– Employee Commitment
– Profitability
– Sales
– Customer Satisfaction
– Turnover
– % of Highly Committed Employees
– Safety
– Intention to leave
• What burning question do you have with regard to the assessment data?
“Who are those
Guy’s”Butch Cassidy and the
Sundance Kid
© Zenger Folkman 2014
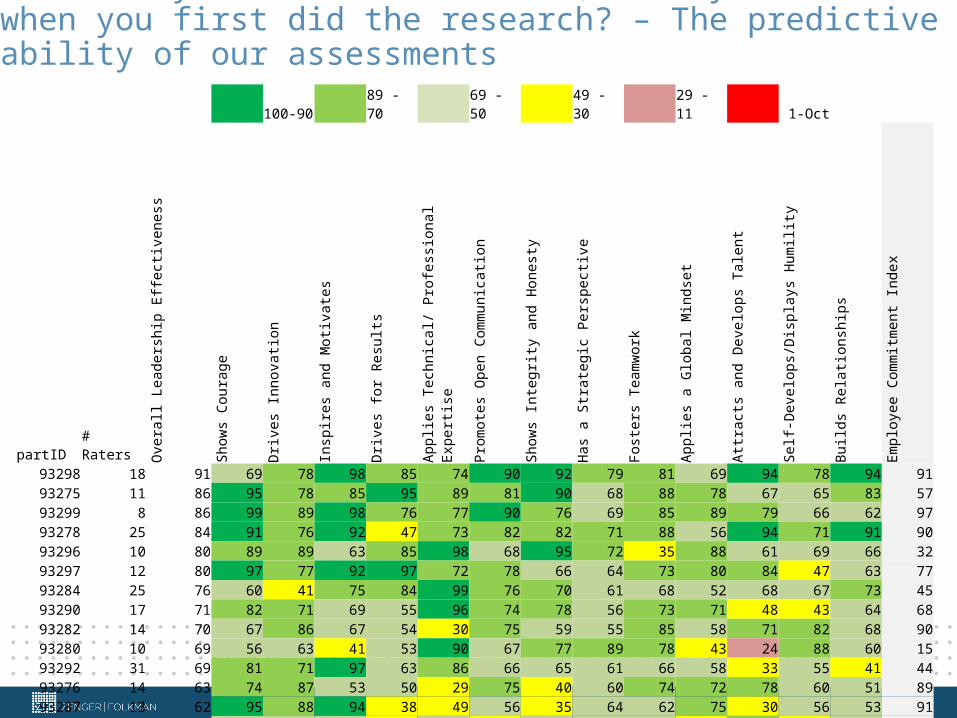
What are you clearer about now, than you were when you first did the research? – The predictive ability of our assessments
100-90 89 - 70 69 - 50 49 - 30 29 - 11 1-Oct
partID # Raters
Overall Leadership Effectiveness
Shows Courage
Drives Innovation
Inspires and Motivates
Drives for Results
Applies Technical/ Professional Expertise
Promotes Open Communication
Shows Integrity and Honesty
Has a Strategic Perspective
Fosters Teamwork
Applies a Global Mindset
Attracts and Develops Talent
Self-Develops/Displays Humility
Builds Relationships
Employee Commitment Index
93298 18 91 69 78 98 85 74 90 92 79 81 69 94 78 94 9193275 11 86 95 78 85 95 89 81 90 68 88 78 67 65 83 5793299 8 86 99 89 98 76 77 90 76 69 85 89 79 66 62 9793278 25 84 91 76 92 47 73 82 82 71 88 56 94 71 91 9093296 10 80 89 89 63 85 98 68 95 72 35 88 61 69 66 3293297 12 80 97 77 92 97 72 78 66 64 73 80 84 47 63 7793284 25 76 60 41 75 84 99 76 70 61 68 52 68 67 73 4593290 17 71 82 71 69 55 96 74 78 56 73 71 48 43 64 6893282 14 70 67 86 67 54 30 75 59 55 85 58 71 82 68 9093280 10 69 56 63 41 53 90 67 77 89 78 43 24 88 60 1593292 31 69 81 71 97 63 86 66 65 61 66 58 33 55 41 4493276 14 63 74 87 53 50 29 75 40 60 74 72 78 60 51 8993287 13 62 95 88 94 38 49 56 35 64 62 75 30 56 53 9193281 21 61 61 66 67 49 66 47 61 57 56 30 85 48 56 4493288 19 60 86 74 72 81 42 55 59 75 54 53 42 48 41 6893301 23 59 78 69 78 64 39 64 35 61 51 35 84 64 28 8393291 17 53 53 71 91 45 31 74 39 41 42 24 50 67 32 6893286 18 47 54 40 45 49 50 52 59 42 39 49 66 44 30 5793295 15 42 32 31 46 67 46 39 50 23 32 29 58 43 46 7793279 22 38 31 46 45 3 63 37 11 54 68 55 37 47 62 7193283 14 38 19 24 30 41 28 44 49 25 58 36 21 55 66 6793293 18 36 45 68 27 30 15 60 30 66 40 30 27 31 43 7493294 14 31 63 69 53 58 21 29 26 27 20 36 28 45 13 6493285 19 26 24 27 20 68 47 13 43 24 15 14 40 28 22 2293289 15 26 35 47 43 38 68 17 21 26 21 29 16 15 24 4393277 13 22 60 39 18 58 73 9 56 15 5 40 20 12 15 5793300 13 22 49 42 28 85 54 29 18 68 12 66 2 9 5 70
Average 64.63 63.22 62.48 59.93 59.44 57.30 54.89 54.56 54.41 52.41 52.11 51.96 50.07 64.85

Coaching and Feedback Self Assessments
• Who’s idea was it to have self assessments?
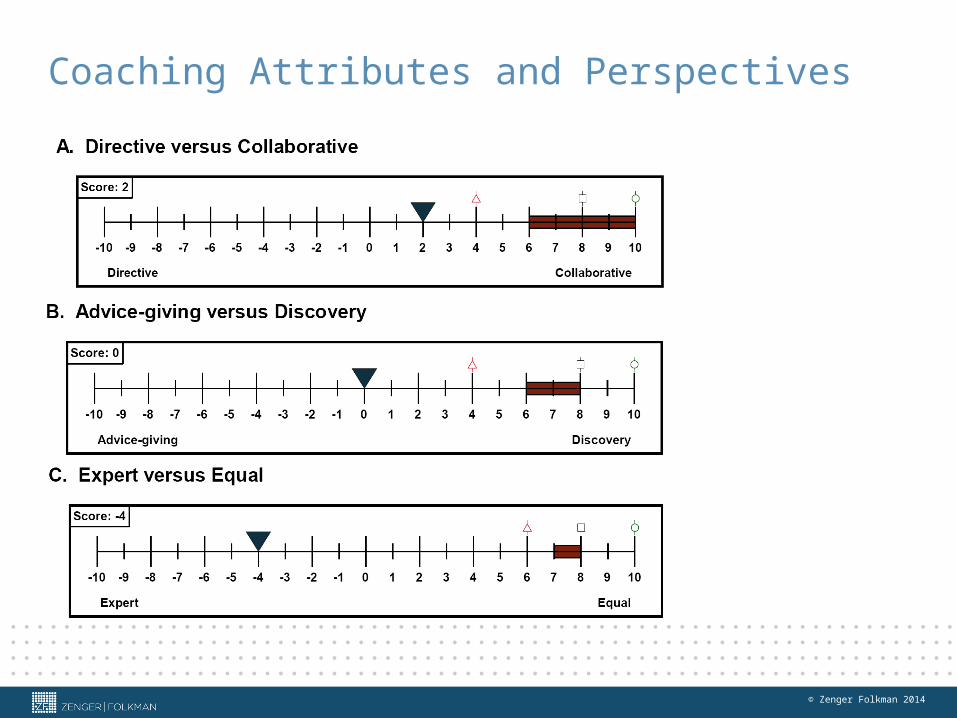
Coaching Attributes and Perspectives
© Zenger Folkman 2014
© Zenger Folkman 2014
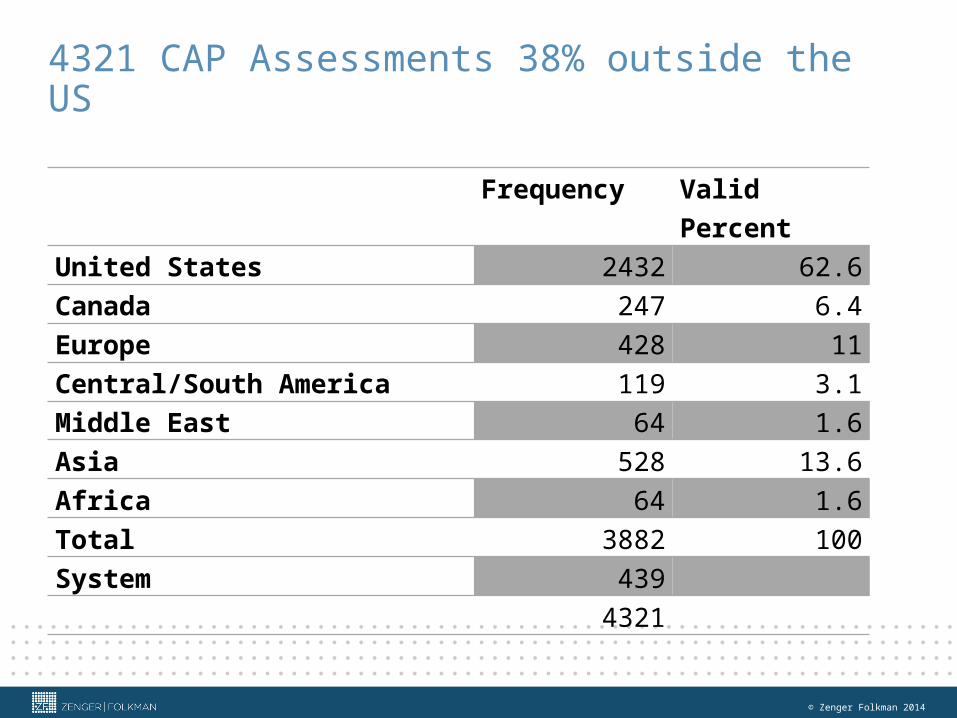
4321 CAP Assessments 38% outside the US
Frequency Valid PercentUnited States 2432 62.6Canada 247 6.4Europe 428 11Central/South America 119 3.1Middle East 64 1.6Asia 528 13.6Africa 64 1.6Total 3882 100System 439
4321
© Zenger Folkman 2014
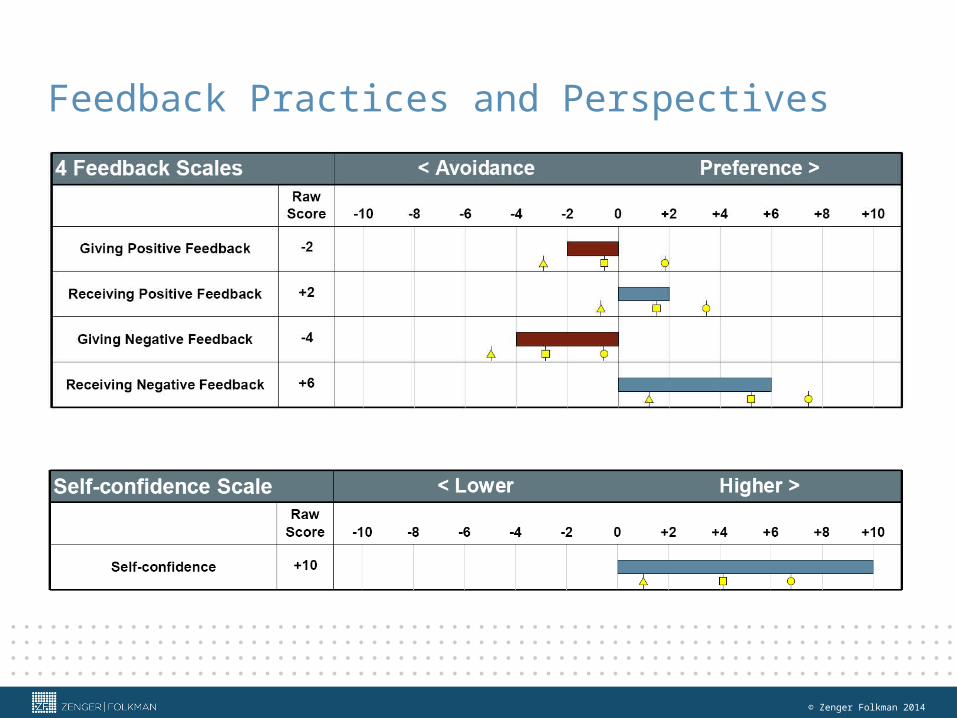
Feedback Practices and Perspectives
© Zenger Folkman 2014
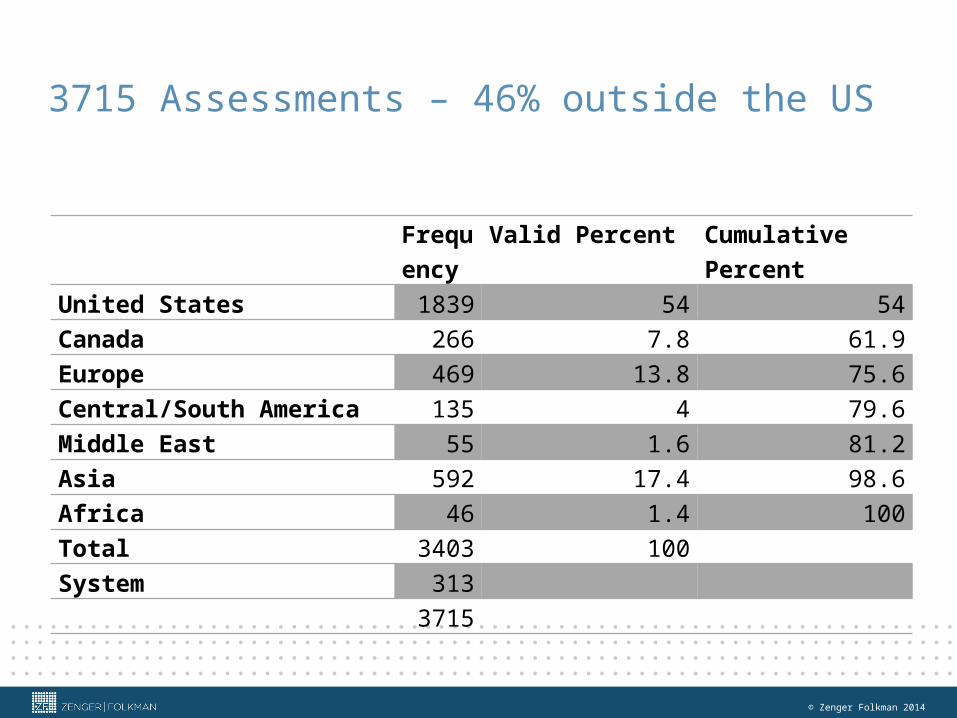
3715 Assessments – 46% outside the US
Frequency
Valid Percent Cumulative Percent
United States 1839 54 54Canada 266 7.8 61.9Europe 469 13.8 75.6Central/South America 135 4 79.6Middle East 55 1.6 81.2Asia 592 17.4 98.6Africa 46 1.4 100Total 3403 100System 313
3715
Thank youContact us at [email protected]
orwww.zengerfolkman.com
© Zenger Folkman 2014
Zenger Folkman helps organizations flourish by increasing the effectiveness of leaders at all levels. Our unique, strengths-based development methodology enables leaders to move faster and higher.
Each offering is solidly grounded in research, utilizing our extensive empirical database. The end results are statistically significant improvements in how leaders lead, how their employees engage and how their companies profit; allowing both leaders and organizations to soar to new heights.