Research potential of Warsaw in international scientific networks
20
Research potential of Warsaw in international scientific networks Agnieszka Olechnicka, Adam Płoszaj UNICA General Assembly 2016 University of Warsaw 18 November 2016
-
Upload
adam-ploszaj -
Category
Science
-
view
48 -
download
0
Transcript of Research potential of Warsaw in international scientific networks

Research potential of Warsawin international scientific networksAgnieszka Olechnicka, Adam Płoszaj
UNICA General Assembly 2016University of Warsaw
18 November 2016

Outlook
1. Dynamics of the geography of science
2. Collaborative turn
3. Warsaw position in networks of scientific collaboration
4. The role of international collaboration
5. Enabling factors

The share of articles affiliated to the given country; SCOPUS
1999-2003 2004-2008
Royal Society (2012), Knowledge, networks and nations: Global scientific collaboration in the 21st century, s. 17.

Number of articles; Web of Science
Source: own elaboration based on Web of Science.
0
1000
2000
3000
4000
5000
6000
7000
8000
1995
1996
1997
1998
1999
2000
2001
2002
2003
2004
2005
2006
2007
2008
2009
2010
2011
2012
2013
2014
2015
PragueWarsawBudapestLubljanaBucharestBratislavaSofia

Number of articles; Web of Science
Source: own elaboration based on Web of Science.
0
5000
10000
15000
20000
25000
30000
35000
1995
1996
1997
1998
1999
2000
2001
2002
2003
2004
2005
2006
2007
2008
2009
2010
2011
2012
2013
2014
2015
London
Paris
Berlin
Stockholm
Vienna
Warsaw

Citations per article2007‐2013, normalized by yearly average
119,0 - 156,9
103,8 - 118,9
91,2 - 103,7
77,5 - 91,1
61,6 - 77,4
42,2 - 61,5
21,4 - 42,1
Source: own elaborationbased on Web of Science.

Knowledge sources and knowledge sinks;world (2000‐2009)
Mazloumian, A., Helbing, D., Lozano, S., Light, R. P., & Börner, K. (2013). Global multi-level analysis of the ‘Scientific Food Web'. Scientific reports, 3; http://www.nature.com/articles/srep01167

Knowledge sources and knowledge sinks;Europe (2000‐2009)
Mazloumian, A., Helbing, D., Lozano, S., Light, R. P., & Börner, K. (2013). Global multi-level analysis of the ‘Scientific Food Web'. Scientific reports, 3; http://www.nature.com/articles/srep01167

Average number of authors per article(WoS, 36 European countries)
0
1
2
3
4
5
6
2000
2001
2002
2003
2004
2005
2006
2007
2008
2009
2010
Source: own elaboration based on Web of Science, articles from 36 European countries.

Average number of Nobel prizewinners in 1901‐2015 (20 years intervals)
Source: on elaboration based on http://www.nobelprize.org/.
0,0
0,5
1,0
1,5
2,0
2,5
3,0
3,5
1901-1920 1921-1940 1941-1960 1961-1980 1981-2000 2001-2015
Physics Chemistry Physiology or Medicine

Abbott, B. P. et al. (2016). Observation of gravitational waves from a binary black hole merger. Physical review letters, 116(6), 061102.

„Only a free individual canmake a discovery. Can you imagine an organization of scientists making the discoveries of Charles Darwin?”
A. Einstein
Will YOU be Nobel prizewinner?

The Fourth Age of Research (Adams 2013)International collaboration; 2007‐2013, per cent
Source: own elaboration based on Web of Science.

The Fourth Age of Research (Adams 2013)Collaboration with the USA; 2007‐2013, per cent
Source: own elaboration based on Web of Science.

Positive influence of collaboration
Collaboration
measured by:
- co-authorship (international)- number of authors,
- number of affiliations/institutions
- acknowledgements
- shared citations
Productivity
number of documents (Ponomariov and Boardman 2010)
number of documents and the number of citations (VanRaan1998; Glanzel 2001)
Visibilitynumber of citations
(Sooryamoorthy 2009)
Qualitypeer quality of the
contribution Franceschet and Costantini (2010)
Source: own elaboration

RegressionsDependent variable: normalised citations in two periods
2007‐2013 m1 m2 m3 m4 m5 m6 m7 m8
R2: ,413 ,480 ,737 ,583 ,489 ,765 ,610 ,772
Percent of international articles ,308 ,204
Percent of collaborations with the USA ,652 ,553 ,550
Closeness (Freeman) ,442 ,201 ,399 ,330
Betweenness (normalised) ,296 ,16
GDP per capita ,643 ,474 ,324 ,481 ,533 ,299 ,386 ,312
2000‐2006 m1 m2 m3 m4 m5 m6 m7 m8
R2: ,628 ,643 ,666 ,704 ,650 ,719 ,709 ,740
Percent of international articles ,125 ,078
Percent of collaborations with the USA ,209 ,137 ,143
Closeness (Freeman) ,308 ,268 ,292 ,509
Betweenness (normalised) ,163 ‐,29
GDP per capita ,792 ,774 ,719 ,654 ,728 ,624 ,650 ,627
Source: own elaboration based on Web of Science.

Enabling factors – accessibility
• Regions/cities with a major international airport are more likely to develop intensive international scientific collaboration.(Hoekman et al. 2010)
• US: After Southwest Airlines enters a new route (with lower fares), scientific collaboration increases by 50% (chemistry co‐publications, 1991‐2012).(Catalini et al. 2016)
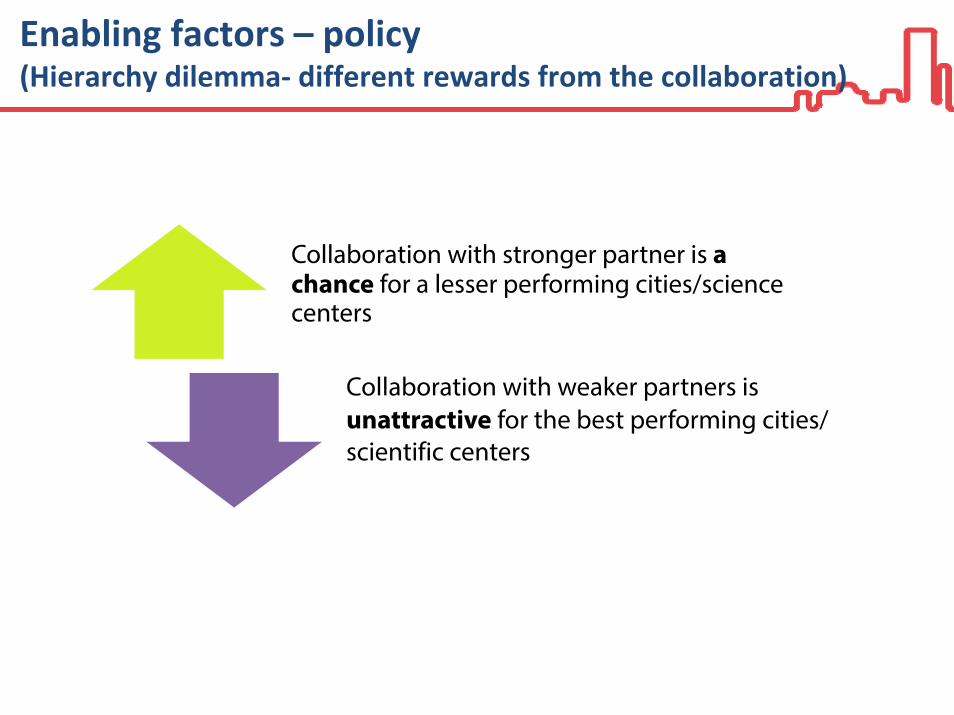
Enabling factors – policy(Hierarchy dilemma‐ different rewards from the collaboration)
Collaboration with stronger partner is a chance for a lesser performing cities/science centers
Collaboration with weaker partners is unattractive for the best performing cities/ scientific centers

Enabling factors – policy(Openness dilemma‐ conflicting aims of different policies)
Both EU scientific policy and national scientific policies aim at strengthening interregional collaboration
Innovation policy is enhancing intraregional collaboration (smart specialization approach)