
reseacrh
19
Journal of Educational Psychology 1998, Vol. 90, No. 1,37-55 Copyright 1998 by the American Psychological Association, Inc. 0022-0663/98/$3.00 The Role of Instruction in Learning to Read: Preventing Reading Failure in At-Risk Children Barbara R. Foorman University of Texas—Houston Medical School Jack M. Fletcher University of Texas—Houston Medical School David J. Francis University of Houston Christopher Schatschneider University of Houston Paras Mehta Arizona State University First and 2nd graders (N = 28?) receiving Title I services received 1 of 3 kinds of classroom reading programs: direct instruction in letter-sound correspondences practiced in decodable text (direct code); less direct instruction in systematic sound-spelling patterns embedded in connected text (embedded code); and implicit instruction in the alphabetic code while reading connected text (implicit code). Children receiving direct code instruction improved in word reading at a faster rate and had higher word-recognition skills than those receiving implicit code instruction. Effect s of instructional group on word recognition w ere moderated by initial levels of phonological processing and were most apparent in children with poorer initial phonological processing skills. Group differences in reading comprehension paralleled those for word recognition but were less robust. Groups did not differ in spelling achievement or in vocabulary growth. Results show advantages for reading instructional programs that emphasize explicit instruction in the alphabetic principle for at-risk children. Learning to speak one's native language is a natural process in that explicit teaching is not required. Reading, in contrast, has been called an "unnatural act" (Gough & Hillinger, 1980) to emphasize the fact that one's writing system relates to speech in an arbitrary way and, therefore, has to be taught (Liberman, Shankweiler, & Liberman, 1989). What needs to be taught is the alphabetic principle: that letters in a word relate to speech in a conventional and intentional way. For many children, insight into this principle will develop through informal instruction at home and nondirective activities at school. However, as many as one in five children have difficulty learning to read (Lyon, 1995; Shaywitz, Fletcher, & Shaywitz, 1994). There may always be a small Barbara R. Foorman and Jack M. Fletcher, Department of Pediatrics, University of Texas—Houston Medical School; David J. Francis and Christopher Schatschneider, Department of Psychol- ogy, University of Houston; Paras M ehta, Department of Psychol- ogy, Arizona State University. Portions of this article were presented at the meetings of the American Association for the Advancement of Science, Seattle, Washington, February 18, 1997, and the American Educational Research Association, Chicago, March 25,1997. This research was supported by National Institute of Child Health and Human Development Grants HD30995 and HD28172. Correspondence concerning this article should be addressed to Barbara R . Foorman, C enter for Academic and Reading Skills, Univer- sity of Texas—Houston Medical School, 7000 Fannin, UCT #860, Houston, Texas 77030. Electronic mail may be sent to bfborman@pedl. med.uth.tmc.edu. percentage of children who are at risk of reading failure for a variety of cognitive, linguistic, or social-emotional factors. However, in urban settings, there are entire schools in which reading failure is the norm, in part because of lack of home preparation in understanding the alphabetic principle (Ad- ams, 1990) and also because of inadequate instruction in the classroom (Slavin, Karweit, & Wasik, 1994). The impor- tance of learning to read in the early grades is clearly illustrated in a longitudinal study that addressed long-term development of reading skills from kindergarten to Grade 9 (Francis, Shaywitz, Stuebing, Shaywitz, & Fletcher, 1996). This study showed that, on average, children who were poor readers in Grade 3 did not "catch up" to their peers in their reading skills; the growth of reading skills fit a deficit, not a lag, model. Moreover, 74% of children who were poor readers in Grade 3 were poor readers in Grade 9 . In the last two decades, a sci enti fic body of evidence has accumulated pointing to a phonological processing deficit as the core cause of poor reading (Fletcher et aL, 1994; Foorman, Francis, Fletcher, & Lynn, 1996; Liberman et al., 1989; Stanovich & Siegel, 1994; Wagner, Torgesen, & Rashotte, 1994). Burgeoning evidence exists that deficits in this area can be ameliorated through appropriate training, particularly with younger children in kindergarten through Grade 2 (Ball & Blachman, 1991; Bradley & Bryant, 1983; Foorman, Francis, Shaywitz, Shaywitz, & Fletcher, 1997a; Torgesen, 1997; Vellutino et al., 1996) or as early as preschool (Byrne & Fielding-Barnsley, 1991, 1993, 1995). Ball and Blachman (1991) and Foorman et al. (1997a) supplemented kindergarten programs for children at risk for 37
-
Upload
anna-michael-abdullah -
Category
Documents
-
view
215 -
download
0
Transcript of reseacrh
7/26/2019 reseacrh
http://slidepdf.com/reader/full/reseacrh 1/19
Journal of Educational Psychology
1998, Vol. 90, No.
1,37-55
Copyright 1998 by the American Psychological Association, Inc.
0022-0663/98/$3.00
The R ole of Instruction in Learning to Read:
Preventing R eading Failure in At-Risk Children
Barbara R. Foorman
University of Texas—Houston Medical School
Jack M. Fletcher
University of Texas—Houston Medical School
David J. Francis
University of Houston
Christopher Schatschneider
University of Houston
Paras Mehta
Arizona State University
First and 2nd graders
(N
= 28?) receiving Title I services received
1
of
3
kinds of classroom
reading programs: direct instruction in letter-sound correspondences practiced in decodable
text (direct code); less direct instruction in systematic sound-spelling patterns embedded in
connected text (embedded code); and implicit instruction in the alphabetic code while reading
connected text (implicit code). Children receiving direct code instruction improved in word
reading at a faster rate and had higher word-recognition skills than those receiving implicit
code instruction. Effects of instructional group on word recognition w ere mo derated by initial
levels of phonological processing and were most apparent in children with poorer initial
phonological processing skills. Group differences in reading comprehension paralleled those
for word recognition but were less robust. Groups did not differ in spelling achievement or in
vocabulary growth. Results show advantages for reading instructional programs that
emphasize explicit instruction in the alphabetic principle for at-risk children.
Learning to speak one's native language is a natural process
in that explicit teaching is not required. Reading, in contrast,
has been called an "unnatural act" (Gough & Hillinger,
1980) to emphasize the fact that one's writing system relates
to speech in an arbitrary way and , therefore, has to be taught
(Liberman, Shankweiler, & Liberman, 1989). What needs to
be taught is the alphabetic principle: that letters in a word
relate to speech in a conventional and intentional way. For
many children, insight into this principle will develop
through informal instruction at home and nondirective
activities at school. However, as many as one in five children
have difficulty learning to read (Lyon, 1995; Shaywitz,
Fletcher, & Shaywitz, 1994). There may always be a small
Barbara R. Foorman and Jack M. Fletcher, Department of
Pediatrics, University of Texas—Houston Medical School; David
J. Francis and Christopher Schatschneider, Department of Psychol-
ogy, University of Houston; Paras M ehta, Department of Psychol-
ogy, Arizona State University.
Portions of this article were presented at the meetings of the
American Association for the Advancement of Science, Seattle,
Washington, February 18, 1997, and the American Educational
Research Association, Chicago, March 25,1 99 7. This research was
supported by National Institute of Child Health and Human
Development Grants HD30995 and HD28172.
Correspondence concerning this article should be addressed to
Barbara
R.
Foorman, C enter for
Academic
and Reading Skills, Univer-
sity of Texas—Houston Medical School, 7000 Fannin, UCT #860,
Houston, Texas
77030. Electronic mail
may be sent to
bfborman@pedl.
med.uth.tmc.edu.
percentage of ch ildren who are at risk of reading failure for a
variety of cognitive, linguistic, or social-emotional factors.
However, in urban settings, there are entire schools in which
reading failure is the norm , in part because of lack of hom e
preparation in understanding the alphabetic principle (Ad-
ams, 1990) and also because of inadequate instruction in the
classroom (Slavin, Karweit, & Wasik, 1994). The impor-
tance of learning to read in the early grades is clearly
illustrated in a longitudinal study that addressed long-term
development of reading skills from kindergarten to Grade 9
(Francis, Shaywitz, Stuebing, Shaywitz, & Fletcher, 1996).
This study showed that, on average, children who w ere poor
readers in Grade 3 did not "catch up" to their peers in their
reading skills; the growth of reading skills fit a deficit, not a
lag, model. Moreover, 74% of children who were poor
readers in Grade 3 were poor readers in Grade 9 .
In the last two d ecades, a scientific body of evidence has
accumulated pointing to a phonological processing deficit as
the core cause of poor reading (Fletcher et aL, 1994;
Foorman, Francis, Fletcher, & Lynn, 1996; Liberman et al.,
1989; Stanovich & Siegel, 1994; Wagner, Torgesen, &
Rashotte, 1994). Burgeoning evidence exists that deficits in
this area can be ameliorated through appropriate training,
particularly with younger children in kindergarten through
Grade 2 (Ball & Blachman, 1991; Bradley & Bryant, 1983;
Foorman, Francis, Shaywitz, Shaywitz, & Fletcher, 1997a;
Torgesen, 1997; Vellutino et al., 1996) or as early as
preschool (Byrne & Fielding-Barnsley, 1991, 1993, 1995).
Ball and Blachman (1991) and Foorman et al. (1997a)
supplemented kindergarten program s for children at risk for
37

7/26/2019 reseacrh
http://slidepdf.com/reader/full/reseacrh 2/19
38
FOORMAN, FRANCIS, FLETCHER, SCHATSCHNEIDER, AND MEHTA
reading problems w ith activities and tasks involving phono -
logical awareness skills. Both studies showed clearly that
the supplementation of standard kindergarten curriculums
with activities involving phonological awareness skills re-
sulted in growth in phono logical aw areness skills relative to
children who received the standard curriculum without
phonological awareness skills. The studies also showed that
these gains continued and were also manifested in areas
involving word reading in the first and second grades (see
Foorman, Francis, Beeler, Winikates, & Fletcher, 1997).
Vellutino et al. (1996) provided either one or two semes-
ters (depending on progress) of 30 min daily, one-on-one
tutoring to poor readers in Grade 1. The tutoring in letter
identification, ph oneme awareness, word-reading skills, and
practice in connected text helped the majority of these
children become average readers. Torgesen (1997) found
that 20 min a day for 80 hr of one-on-one tutoring in
phonological decoding strategies (with or without training in
articulatory gestures) and practice in reading and writing
enabled approximately 75 % of first graders who had been in
the bottom 10th percentile in phonological skills in kinder-
garten to move to national averages in timed and untimed
decoding. Similar results were achieved w ith older, severely
disabled readers (age 10 years on average); however, the
one-on-one tutoring was much more intensive—2 hr daily
for 80 hr—and decoding accuracy but not speed reached
national averages. Olson, Wise, Ring, and Johnson (1997)
had similar results with third to sixth graders below the 10th
percentile in word recognition who were tutored individu-
ally in phonological decoding strategies (with or without
training in articulatory gestures).
The efficacy of the interventions in these studies, which
emphasized tutorial interventions, is interesting in relation to
older studies that also focus on early intervention. In
summarizing these programs, Slavin and his colleagues
(Slavin, Karweit, & Madden, 1989; Slavin et al., 1994)
noted that the most widely used supplementary-remedial
programs, diagnostic-prescriptive pullout programs pro-
vided under Title 1 programs for economically disadvan-
taged children, showed little evidence of effectiveness
unless they involved one-on-one tutoring. Moreover, the
attempt to mainstream at-risk children by having Title 1 or
special education aides work in the regular classroom has
been no more effective than the pullout model (Archam-
bault, 19 89; Puma, Jones, Rock, & Fernandez, 1 993).
In contrast, kindergarten or first-grade prevention pro-
grams and classroom change models have proved effective.
The only prevention programs for which data are available
on long-term effects of intensive reading instruction in the
early grades are Reading Recovery (Pinnell, Lyons, DeFord,
Bryk, & Seltzer, 1994; Shanahan & Barr, 1995) and Success
for All (Slavin, Madden, Dolan & Wasik, 1996). In evalua-
tions of Reading Recovery, first graders tutored daily for 30
min by a trained Reading Recovery tutor exceeded matched
control children's reading performance with an effect size of
.87.
This effect size fell to .45 and .29 one and two years
later, respectively, without additional intervention. More
recent analysis of the effects of Read ing Recovery continue
to show large effect sizes that diminish over time. Reading
Recovery can more quickly recover children to middle
reading group levels if it is modified to include direct
instruction in the alphabetic code (Iverson & Tunmer, 1993),
and other programs may provide equally large effects
without the tutorial component (Shanahan & Barr, 1995).
Classroom change models are based on the assumption
that the best way to minim ize the need for remedial services
is to provide the best possible classroom instruction in the
first place. A more traditional kind of classroom change
model is what Slavin et
a l.
(1989) referred to as "continuou s
progress models.'* Students in these classrooms proceed at
their own pace through a sequence of well-defined instruc-
tional objectives. They are taught in small groups on the
basis of skill level and are frequently assessed and regrouped
on the basis of these assessments. The best known of these
programs is DISTAR (Engelmann & Bruner, 1995; now
SRA Reading Mastery), a highly structured and scripted
program that has produced positive results in many large-
scale studies (see Aukerm an, 1984; Shanahan & Barr, 1995).
Although programs such as Reading Recovery, SRA
Reading Mastery, and Success for All show good efficacy,
they have not attempted to isolate the components of
effective reading instruction. Current research suggests that
a necessary skill to be mastered in learning to read in the
early grades is decoding. Decoding typically refers to the
application of the letter-sound correspondences taught in
phonics. Although decoding is more accurately described as
deciphering the printed word, and phonic rules may simply
play an attentional role in the weightings of connections
between orthographic and phonological units (Adams, 1990;
Foorman, 1994), decoding accuracy is the single best
predictor of reading comprehension (Stanovich, 1990; Vel-
lutino, 1991). Thus, an instructional focus on developing
decoding skills early in school is consistent with the
relationship of decoding skills and comprehension, espe-
cially for children whose only chance to learn to read is in
school. An important question is how explicit decoding
instruction needs to be, whether highly explicit through
decontextualized letter-sound correspondence rules prac-
ticed in controlled vocabulary text or implicit through
incidental learning gained by feedback on reading literature.
"The Great Debate" over code-emphasis versus meaning-
emphasis approaches to reading captures the extremes of
this continuum of explicitness (Chall, 1983; Foorman,
1995a, 1995b). However, there is the middle ground of
embedded-phonics approaches in which instruction in lette r-
sounds and spelling patterns is contextualized within litera-
ture selections.
In the present article, we investigated questions involving
the degree of explicitness in alphabetic code instruction and
effects of phonological processing on growth in word
reading in children at risk for reading failure traditionally
served in Title 1 programs. In a large sample of children
receiving Title 1 services, we hypothesized that children
who received explicit instruction in the alphabetic principle
with an emphasis on letter-sound correspondences would
show greater growth over 1 school year of classroom
instruction relative to children receiving less explicit instruc-
tion focusing on spelling patterns or children receiving

7/26/2019 reseacrh
http://slidepdf.com/reader/full/reseacrh 3/19
ROLE OF INSTRUCTION IN LEARNING TO READ
39
implicit instruction
in the
alphabetic principle.
We
also
hypothesized that this growth in reading skills would be
moderated by initial phonological processing skills.
Table
1
Study Design and School Characteristics
Method
Participants
Participants were 285 of the 375 children in first and second
grades eligible for services under Title 1 funding in an urban
district with 19 elementary schools. The 90 children were excluded
from the present analyses because they had been placed
on a
wait
list
and
never
did
receive Title
1
services during
the
study. Thus,
analyses are restricted to those eligible students who actually
received tutoring during the year.
Title
1
refers
to
federal funding provided
for
economically
disadvantaged children with low achievement. Economic disadvan-
tage is usually denned in terms of the percentage of children
participating
in the
federal lunch program,
as it
w as
in
this study.
Low achievement was defined by school district officials
as
scores
on the district's emergent literacy survey
in the
bottom quartile
in
first- and second-grade classrooms
at
each Title
1
school. H ence,
although all children in the lowest quartile received the classroom
interventions, the present sample represented the lowest 18
because
of
lack
of
funds
for
tutoring.
The participating children attended 8 of the 10 Title 1-eligible
elementary schools
in
this district. (The Title
1
program was
in its
2nd year
of
implementation
in the
district.)
The
percentage
participation
in the
federal lunch program ranged from 32.3 %
to
71.4% at
the
8
schools. Thus ,
the
participating children were only
those 3 to 8 children in each regular education classroom who were
served through Title 1 in the participating schools. The non-Title 1
children
in
the classrooms were not participants
in
the study,
at the
request
of
district officials; however, they received
the
same
classroom curricula as the participating children.
School participation
was
determined
by the
willingness
of the
principal and teachers to participate. The design called for some
schools to have only one instructional approach and for others to
have two a pproaches in an attem pt to control for school effects. T he
design
is
described
in
Table
1,
which provides information
on the
number
of
classrooms
per
grade receiving each
of the
four
curricula. No second-grade classrooms are listed for Schools 4 an d
5 because Title 1 funds were available only to serve first graders.
Also,
it is important to note that the school selected by district
officials
to be the
unseen comparison
had the
largest total enroll-
ment,
the
largest percentage
of
children participating
in
the federal
lunch program (71.4%),
and the
lowest achievement scores
on the
statewide test in Grade 3. To deal with what was w idely perceived
as a "tough" school, district officials placed a well-respected
principal and Title 1 teachers at the school; nonetheless, the school
was not regarded
as a
desirable teaching assignment by classroom
teachers.
The ethnic composition
of the
sample
was as
follows:
60
African American,
20
Hispanic,
and 20
White.
The
ethnic
composition
of
the district
at
large was approximately 20% Asian,
26 % African American, 2 3% Hispanic, and 31% W hite. Sixty-one
percent of the sample was male. Instructional groups did not differ
in age, gender, or ethnicity.
Instructional Methods
During the 90-min daily language arts period, the children were
instructed in one of three classroom reading methods, all of which
existed within a literature-rich en vironment in the classroom: direct
School
1
2
3
4
5
6
7
8
Enrollment
1,208
1,009
1,232
90 8
88 7
1,137
85 3
839
Federal
lunch
program
(%)
71.4
49.5
64.2
43.2
41.8
39.9
64.5
32.3
Grade
1
2
1
2
1
2
1
1
1
1
2
2
2
1
1
2
2
1
1
2
2
No.
classrooms
5
5
6
4
6
6
3
2
2
2
2
2
3
2
2
2
2
3
3
2
1
Curriculum
IC-S
IC-S
IC-R
IC-R
EC
IC-R
DC
DC
IC-R
DC
DC
IC-R
IC-S
EC
DC
EC
DC
IC-R
EC
IC-R
EC
Note. IC-S =
implicit code-standard;
IC-R =
implicit code-
research; EC = em bedded code; DC = direct code.
instruction in letter-sound correspondences practiced in decodable
text (direct code [DC]); less direct instruction in systematic
spelling patterns (onset rimes) embedded in connected text (embed-
ded code [EC]);
and
indirect, incidental instruction
in the
alpha-
betic code embedded in connected text (implicit code
[IC]).
The
IC
condition
was
either
the
district standard curriculum (IC-S)
or a
research implementation developed to ensure comparability of
training across instructional approaches (IC-R). Each condition
was directed
by an
advanced graduate student
who had
been
a
teacher
and who had
expertise
in
professional development,
and
did not include the authors
of
this study.
In DC the emphasis was on a balance of phonemic awareness,
phonics (with blending
as the key
strategy),
and
literature activi-
ties,
using Open Court Reading's (1995)
Collections for Young
Scholars. Phonemic awareness activities dominate
the
first
30
lessons of Open Court. The 42 phonic rules are introduced in
Lessons II through 100, using soun d-spe lling c ards, alliterative
stories, and controlled vocabulary text that practice the rule just
taught.
At
the same time decodable texts are used,
a
parallel strand
of
Big
Book reading occurs
so
that skills
in
oral language
comprehension
and
love
of
story
can be
developed. Spelling
dictation exercises move students from phonetic spellings toward
conventional spelling based on phonics knowledge and spelling
conventions. Writing workshop activities and anthologies of fic-
tion, nonfiction, and poetry are introduced by mid Grade
1.
In
EC the
emphasis
was on
phonemic awareness
and
spelling
patterns
in
predictable books, using
an
adaptation
of
Hiebert, Colt,
Catto, and Gary's (1992) program. Teachers providing EC instruc-
tion used a common list of sequenced spelling patterns and a guide
prepared
by
participating teachers that listed library books that
contained
the
spelling patterns
(see
Appendix
A for the
list
of
spelling patterns). Whole-class activities such
as
shared writing,
shared reading, choral
or
echo reading,
and
guided reading
7/26/2019 reseacrh
http://slidepdf.com/reader/full/reseacrh 4/19
40
FOORMAN, FRANCIS, FLETCHER, SCHATSCHNEIDER, AND MEHTA
provided the context for EC instruction. In addition to a general
emphasis on a variety of comprehension strategies, EC teachers
used the following format in providing strategic guidance about
patterns of words: Initially, the teacher would frame a word
containing the target spelling pattern during a literacy activity (e.g.,
bat). By deleting the initial phonem e (e.g., b), the pattern would be
extracted from the word (e.g., at). By substituting alternative
beginning sounds, students could extend the pattern to new words
(e.g.,
ma t
f
cat, hat).
Then students were to identify the target
pattern as they encountered it in additional shared and indepe ndent
reading and writing activities. Finally, patterns were reviewed in
the context of reading and writing activities and were incorporated
into spelling
lists.
When the children were working in small group s,
they were able to practice these "m ake-and-brea k" activities with
magnetic letters and acetate boards, always writing down their
constructed words and reading their written constructions back to
the teacher.
At the time of this study, the staff development in this school
district emphasized an IC approach to reading instruction. Central
to this IC approach was the emphasis on a print-rich environment
with the following characteristics: teacher as facilitator rather than
director of learning; children's construction of meaning as central;
the integration of reading, spelling, and writing into literary
activities that provide a context for phonics; emphasis on class-
room interaction and on respone to literature; learning centers; and
assessment based on portfolios rather than norm-referenced tests
(see Routman,
1991;
Weaver, 1994), The 19 teachers who partici-
pated in the research version of IC worked with the project
director—an experienced doctoral-level teacher-trainer who es-
poused whole-lanaguage methods—to define the whole-language
philosophy behind their approach:
Whole language is a child centered philosophy of learning and
instruction, the implementation of which results in a risk-free,
supportive, language-rich environment. This environment is
ever-changing; changing to meet the needs of all participants,
teachers and students alike. Within this whole language
philosophy, students are given a wide variety of opportunities
to read, write, learn, and construct meaning within a meaning-
ful context. In this interactive, student-friendly learning
atmosphere, learning is not only active and meaningful, but
also fun, with the ultimate goal being to instill the desire for
life-long learn ing.
Because of the IC belief in children as readers and writers, even
at this "em ergent" phase of first and second grades, the emphasis
was on learning to foster a competence rather than on learning to
perform a skill (see, e.g., Dahl & Freppon, 1995). The use of
predictable books and emphasis on writing in this IC approach
appear similar to those in the EC approach described previously.
How ever, in the EC approach , the teachers used a systematic list of
spelling patterns to teach an analogy strategy for decoding words.
In the IC approach, in contrast, the teacher used shared- and
guided-reading activities to draw children's attention to specific
words or word forms, letters, sounds, patterns, meanings, making
predictions, listening for rhymes, and exploring the use of strate-
gies,
grammar, language use, spellings, or key ideas in the text.
Thu s, the opportunity to learn the alphabetic code w as incidental to
the act of making meaning from print.
In this study, there were 19 IC-R teachers, 20 EC teachers, 14
DC teachers, and 13 IC-S teachers, all of whom volunteered to
participate. The IC-S teachers delivered the district's standard
instructional method and were trained and supervised by district
personnel. Teachers delivering IC-R, EC, and DC were trained
during
1
week of summer in-service (30 hr) followed by retraining
and demonstration lessons 1 month into the school year. Training
was conducted by mem bers of the research staff, all of whom had
previous elementary school teaching experience and were strong
proponents of the approach for which they were responsible.
During summer in-service, the staff members provided background
for the research, discussed instructional strategies relevant to then-
approach, and worked with teachers to develop a monitoring
checklist of the components of the curriculum being implemented.
To ensure adequacy of monitoring and control of time on task, all
primary reading instruction occurred in 30-min block s as part of the
90-min language arts block mandated by the state. Because DC
used basal materials that were new to the teachers, a representative
from the publisher spent 1 day orienting the teachers to the
materials. The EC materials were also new , but the project director
for this component had considerable experience with onset-rime
approaches. During the school year, the research staff visited each
teacher's classroom every other week or more frequently, if
necessary, to monitor implementation of instruction and to provide
feedback on the quality of implementation. Instructional supervi-
sors from the district were available at each sch ool to help teachers
with basic issues of classroom management, a resource that was
called on infrequently. Research staff members met with the
teachers of a particular grade level at each school during their
planning time to discuss instructional issues. Finally, to share
instructional strategies across sites, teachers implementing a com-
mon program in different schools came together after school three
times during the school year.
In addition to these 66 classroom teachers, 28 Title 1 teachers
delivered one-to-one or small-group tutorials with 3 to 5 students
for 30 min each day. In these tutorials, the instructional method
either matched that of the classroom or was the district's standard
tutorial based on Clay's (1991) method. Because the standard
tutorial was an IC approach, there was no mismatch condition for
children in the IC-S and IC-R groups.
Measures and Procedures
Teacher compliance and attitudes.
During summ er training,
the teachers in each instructional group and the research staff
developed a list of instructional components to be used for
bimonthly m onitoring of instruction (see Appendix B for the list of
each instructional group). The teachers agreed that the monitoring
would take place during the 30-min section of the 90-min language
arts block, when the focus would be on the reading lesson (which
addressed at least the first four components of each instructional
approach listed in Appendix B). Occasional visits were made
during other times in the language arts block to see how w riting an d
spelling activities progressed and, in the case of the IC-R group,
were integrated with reading.
In addition to the checklist used for monitoring, lesson plans
were copied, kept, and reviewed as part of compliance. For the
monitoring checklist, independent raters were used, with extremely
high interrater reliability (^.80 for all raters). At the end of the
year, we asked the teachers to respond to five questions about their
instructional program (see Appendix C for the actual questions).
Using a scale ranging from 1 (definitely yes) to 5 (definitely no),
teachers responded to the first four questions asking whether they
would recommend the continued use of this approach to instruc-
tion. The fifth question asked about the match between the
instructional approach delivered and the teacher's beliefs about
how to teach children to read; response options ranged from
an
exact match to not similar at all.
Measures given to estimate growth. Change s in vocabulary,
phonological processing, and word-reading skills were assessed
four times during the year, in October, December, February, and
April. To assess growth in receptive vocabulary, we administered
7/26/2019 reseacrh
http://slidepdf.com/reader/full/reseacrh 5/19
ROLE OF INSTRUCTION IN LEARNING TO RE AD
41
the Peabody Picture Vocabulary Test-Revised (PPVT-R; Dunn &
Dunn, 1981) four times a year. Both forms (L an dM ) were used and
were alternated in two different sequences. To assess changes in
reading skills over the course of the intervention, we asked the
children individually to read 50 words aloud that were presented
one at a time on 4 X 6-in. cards. The words were matched for
frequency of occurrence (Carroll, Davies, & Richman, 1971), were
representative of a diversity of linguistic features, and spanned
first- through third-grade level of difficulty. Scores were based on
the number of words read aloud correctly out of 50 . Reliability for
the word list was excellent (internal consistency estimate of .9).
Concurrent and predictive validities for the word list were also
high, as evidenced by correlations exceeding .8 with the Letter
Word and Word Attack subtests of the Woodcock-Johnson Psycho-
educational Battery-Revised (WJ-R; Woodcock & Johnson, 1989)
collected at the end of the year in our normative sample (Foorman
etal . ,1996) .
Phonological processing was measured by the synthesis and
analysis tests in the Torgesen-Wagner battery (Wagner, Torgesen,
& Rashotte, 1994; see also Foorman et al., 1996, 1997b). The
synthesis tests consisted of blending onset rime (m-ouse), blending
phonemes in real words
(f-a-t),
and blending phonemes in non-
words (m-i-b). The analysis tests consisted of (a) first sound
comparison (in which children were asked to point to the one
picture of three that started with the same sound as
a
target picture);
(b) elision (dropping the initial, final, or middle sound of a spoken
word); (c) sound categorization (naming the nonrhyming word
from a set of four spoken w ords); and (d) segmentation of
a
spoken
word into phonemes. Each test consisted of demonstration items
and 15 test
items.
In this report we used es timated factor scores that
ranged continuously from 0 to
4.
Factor score weights were derived
from data on a large normative sample from the same school
district (Foorman et al., 1996).
End-of-year achievement and intellectual tests. At the end of
the year, we individually administered the Wechsler Intelligence
Scale for Children-Revised (Wechsler, 1974) and standardized
reading and spelling tests. For the reading tests, we used the WJ-R
(Woodcock & Johnson, 1989) to measure decoding (using the
Letter-Word Identification and Word Attack subtests) and reading
comprehension (using the Passage Comprehension subtest). We
used the Formal Reading Inventory (FRI; Wiederholt, 1986) to
measure comprehension of narrative and expository text. For
spelling we used the Spelling Dictation subtest from the Kaufman
Test of Educational Achievement (KTEA; Kaufman & Kaufman,
1985). We did not administer a standardized reading test at the
beginning of the year because tests such as the WJ-R lack a
sufficient num ber of items to discriminate initial reading levels for
beginning readers and are not adequately sensitive to change over
short time intervals.
Attitude—experience. In addition to these measures of growth
in cognitive skills, academic outcomes, and intellectual abilities,
we also collected school attendance data and measures of
self-
esteem, reading attitudes and
experience,
behavior, and environme n-
tal information in the spring. We assessed self-esteem with a
pictorial version of Harter's (1982) Perceived Competence Scale
(Harter & Pike, 1984). The five domains of self-esteem assessed
were scholastic competence, athletic competence, social accep-
tance, physical appearance, and behavior or conduct. Children's
attitude toward reading was assessed with 11 questions about the
extent to which the child enjoyed reading (drawn from the work of
Juel, 1988) and 8 questions about whether the child engaged in a
variety of literacy experiences. Both the Harter scales and this
reading attitude-experience measure use a structure alternative
format to minimize the likelihood of the child making the socially
desirable response. For each item, children first decide whether the
statement is true or not true about themselves and then decide
whether the statement is sort of true or very true. For example, the
first item on the reading attitudes measure is "This child [pointing
to figure on examiner's left] likes people to read to him/her. This
child [pointing to figure on examiner's right] doesn't like people to
read to him/her. Which child is most like you? [Child chooses.] Is
this child a lot like you or just sort of like you?" Orientation of
positive and negative stems of questions and accompanying stick
figures varies randomly across items. Items on both the Harter and
the reading attitude measures are scored from
1
to 4.
Teacher evaluations.
The Mu ltigrade Inventory for Teachers
(MIT; Agronin, Holahan, Shaywitz, & Shayw itz, 1992) provided a
mechanism for the ch ild's classroom teacher to record observations
on a rating scale that includes precise de scriptions of a full ran ge of
behavioral styles reflecting the child's processing capabilities,
adaptability, behavior, language, fine motor, and academic profi-
ciency. At the same time, the teacher is able to provide an overall
impression of that child's academic strengths and weaknesses and
also indicate concerns. The MIT includes 60 items coded by the
teacher on a scale ranging from 0
{never
to 4 {often). There are six
scales: Academic, Activity, Language, Dexterity, Behavior, and
Attention.
The teacher also completed an end-of-year evaluation, recording
the results of pupil placement team meetings and indicating any
special services received by the child, recommendations for the
next class placement, and recommendations for special services.
Grades, absences, tardiness, and results of hearing and visual
screening were also recorded. The teacher identified children
thought to have emotional, behavioral, or family problems.
Analysis
We used individual growth curves methodology to analyze
changes in phonological processing, word reading, and vocabulary.
These methods permit the estimation of (a) the mean rate of change
and an estimate of the extent to which the individual's growth
differs from this mean rate, and (b) correlates of change, which in
this investigation focused on effects resulting from the four
instructional groups but also included covariates of verbal IQ, age,
and ethnicity. In the analysis of growth in word reading, we also
exam ined the effects of initial level of phonological proce ssing as a
correlate of growth and a moderator of instructional effects.
Individual growth parameters and correlates of change were
estimated using Hierarchical Linear Models-3 (HLM-3; Bryk &
Raudenbush, 1987, 1992; see Francis, Fletcher, Stuebing, David-
son, & Thompson, 1991 ; Francis et al., 1996; Rogosa, Brandt, &
Zimowski, 1982, for information on the application of individual
growth models in psychology and education). In addition to time
being nested within individuals, students were nested within
teacher, providing for a three-level model (time, student, teacher).
Although teachers are also nested within school, there was an
insufficient num ber of schools to mode l school-level variability, so
this factor was ignored in the analyses.
In analyzing instructional effects, we were first interested in
knowing whether IC-R (representing research-trained and moni-
tored instruction) differed from the d istrict's standard (representing
district-trained and supervised instruction), tested atp <
.05.
Then,
to control for Type I error, we conducted Bonferroni-adjusted
pairwise com parisons among the three experimental approaches to
instruction with an alpha level of .0167 (or .05/3). In modeling
academic outcomes, we have ignored differences between IC-S and
DC and between IC-S and EC, because these curricula differ from
IC-S both in the explicitness of code instruction and in the training
of teachers to deliver the instruction. Comparison of IC-S to IC-R
provides information about the importance of the teacher-training
7/26/2019 reseacrh
http://slidepdf.com/reader/full/reseacrh 6/19
42
FOORMAN, FRANCIS, FLETCHER, SCHATSCHNEIDER, AND MEHTA
component of the study, whereas comparisons among IC-R, DC,
and EC provide the critical information about instructional differ-
ences controlling for teacher training. In modeling changes over
time, we centered age around the last occasion of measurement for
each child so that the intercept represented expected performance in
April. Because we expected older children to outperform younger
children, age differences between children at the final assessment
were measured as deviations from mean age and were used to
predict expected performance and change in performance.
To characterize the pattern of chang e over time , we fit mod els to
determine (a) whether growth was linear or curvilinear and (b)
which of the growth parameters varied across children. This
process involved fitting at least the following models: (a) straight
line growth with random intercepts and fixed slopes; (b) straight
line growth with random intercepts and slopes; (c) curvilinear
growth with random intercepts and fixed slopes and quadratic
terms; (d) curvilinear growth with random intercepts and slopes
and fixed quadratic terms; and (e) curvilinear growth with random
intercepts, slopes, and quadratic terms. In all models, errors are
assumed to be independently and normally distributed with equal
variance over
time.
A fixed param eter has a value that does not vary
across participants, whereas a random parameter has a value that
differs across participants. If the mean value for a parameter was
not different from zero, and there was no evidence that the
parameter differed across participants, then the parameter was
dropped from the model. Growth curve analyses for reading,
vocabulary, and phonolog ical processing showed that change could
be best modeled with linear and quadratic effects and random
slopes and intercepts.
Results
Tutoring Effects
We examined the size of the tutoring unit (one-to-one or
small group, i.e., 3-5 students with one teacher) and the
nature of the content of the tutorial (whether it matched or
did not match classroom instruction). The mismatch condi-
tion was available only for the two code-emphasis groups
because the district's standard tutorial—Reading Empower-
ment based on Clay's (1991) method—was matched with
the IC approach. Unfortunately, it was impossible to retain
the initial assignment to ratios of one-to-one or one-to-many
because the teachers needed to rearrange groupings to deal
with behavioral and learning problem s. Thus, we calculated
the average number of days a student was in a 1:1 or 1 :many
ratio condition. This variable did not significantly predict
reading growth or outcomes. There was also no significant
effect of matched or mism atched tutorial content. Because of
the lack of tutoring effects, tutoring was ignored in subse-
quent analyses.
Comp liance and Attitudes
Com pliance data consisted of each teacher's total percent-
age of compliance in delivering the instructional practices
appropriate to her instructional group, as determined from
the research staff's monitoring data. Among the 53 class-
room teachers monitored (excluding the 13 IC-S teachers,
who were not monitored), compliance was generally very
high, a median of 80%, with a significant negative skew to
the distribution of scores. Four teachers had 0% comp liance:
2 were in IC-R, 1 in DC, and 1 in EC . In all four cases, the
teachers were teaching reading but were not using the
research approach for which they had been trained. The DC
and EC teachers were doing the district standard IC-S, as
they had been doing for years. The two IC-R teachers were
decontextualizing phonics and spelling instruction with
work sheets they had purchased. Attempts to retrain and
redirect these four teachers met w ith repeated resistance. We
retained these teachers and their students' data in our
analyses because they are representative of the range of
teaching behaviors encountered in a study of this sort In
short, compliance of 49 of 53 classroom teachers was
excellent.
In addition to high compliance w ith instructional practice,
teachers also had positive atttitudes toward their instruc-
tional method. The distribution of responses for the teacher
attitude data for 48 of the 53 research-trained teachers are
presented in Table 2 (2 DC, 2 EC, and 1 IC-R teachers did
not return the survey). An alysis of variance (ANOVA) using
the Kruskal-Wallis test showed significant instructional
group differences on the following two questions: "If you
were responsible for curriculum decisions in your district,
would you recom mend that resources (materials, staff devel-
opment, etc.) be provided for this instructional approach in
the future?", F( 2, 44) - 3.58, p - .036; and "Wou ld you
recommend the instructional approach you are using to a
colleague?", F(2, 44) = 5.23, p = 009. Pairwise contrasts
Table 2
Frequency D istributions for Teacher Attitude
Survey Data ( )
Question
1. Recommend to district
DC
EC
IC-R
2. Recommend to colleague
DC
EC
IC-R
3. Recommend for all children
DC
EC
IC-R
4. Recommend for special needs
DC
EC
tC-R
Exactly
match
5. Matches my beliefs
DC 9
EC —
IC-R 22
Frequency distributions
Definitely Endorse
ye s
1
64
22
44
73
22
28
55
28
33
45
50
17
Very
similar
82
61
50
—
2 3 4
36
50 17 11
39 17 —
27
50 11 17
50 17 —
27 18 —
39 17 11
39 28 —
27 27 —
28 11 11
44 28 11
Definitely
no
5
—
—
—
—
—
—
—
6
—
—
—
Somewhat Not similar
similar
9
39
28
at all
0
0
0
Note. DC = direct code; EC = em bedded code; IC-R = implicit
code-research.

7/26/2019 reseacrh
http://slidepdf.com/reader/full/reseacrh 7/19
ROLE OF INSTRUCTION IN LEARNING TO READ
43
revealed that DC teachers were more likely than EC teachers to
recommend their instruction to tiie district, F(l, 44) = 6.95,/? <
.012.
Additionally, DC teachers were more likely than either EC
or IC-R teachers to recommend their instruction to a colleague,
F( l , 44 ) = 9 .71 ,
p <
.003 and F(l , 44) = 6.80,
p =
.012,
respectively. Teachers in the DC, E C, and IC-R groups did not
differ in their attitude about recommending their approaches for
all children or for children with special needs or in the degree to
which the instruction they delivered matched their beliefs about
how to teach children to read.
Analyses of Baseline Differences in October
Means and standard deviations for phonological process-
ing and word-reading scores at each wave of data collection
are presented in Tables 3 and 4, respectively, for each
instructional group according to grade. Correlations between
phonological analysis and synthesis factors were greater
than .9 at each of the four time points. Therefore, we have
elected to present only the results for phonological analysis
here (subsequently to be referred to as phonological p rocess-
ing). ANOVA on October baseline scores in word reading
and in phonological processing (with age as a covariate)
showed no significant differences between instructional
groups, F(3 , 272) = .33, p = .81, for word reading; and F(3 ,
271) = 1.87, p = .14, for phonological processing.
Growth
Curve
Analyses
The second graders had m inimal reading skills, necessita-
ting the use of first-grade instructional materials with them.
Because all children were receiving the same grade-level
curriculum, analyses were conducted with age rather than
grade as a factor. Exploratory analyses showed that there
was no remaining variability in outcomes resulting from
grade once age effects w ere con trolled.
Growth curve analyses were conducted using a three-level
model: time within child within classroom. All growth curve
analyses were conducted using HLM-3 software (Bryk &
Raudenbush, 1992). HLM-3 reports tests of fixed effects
using a t statistic and p value derived from the unit normal
distribution. As a measure of the effect of the instructional
group variable, we report A/?
2
, which is the proportion of
true, between-teacher v ariance (Level 3) in a growth param-
eter that is accounted for by the instructional group variable
after controlling for all covariates (Bryk & Raudenbush,
1987; Francis et al., 1991). This measure indicates how
much of the true, between-teacher variance in slopes and
intercepts is uniquely attributable to the instructional meth-
ods employed by the teachers. In addition, Cohen 's standard-
ized effect size, / (Maxwell & D elaney, 19 90), was com -
puted for curriculum effects as follows. For overall effects of
the instructional group variable, we computed the effect (ay)
for each group, where a; is the difference between the mean
value of a parameter (e.g., slope or intercept) in that
instructional group and the overall grand m ean value for that
parameter, taking into account all covariates. The average
squared effect was then expressed relative to the HLM-3
estimated error variability in that parameter. This estimate is
not printed directly by HLM-3 but can be computed from
HLM-3's estimate of the reliability of the parameter and of
the systematic variance in the parameter. To estimate the
error variance in the instructional group mean growth
parameters, we calculated [(1
—
R)T]/R, where R is the
estimated reliability of the random parameter and T is the
estimated systematic variability in the parameter. These two
estimates were taken from the growth curve models that
included all covariates but did not include the instructional
group variable. The square root of this ratio (average
squared effect/error variance) gives the standardized effect
size,/. Effect sizes are also reported for differences in growth
parameters between specific curricula. These were com-
puted by taking the mean parameter difference between the
two curricula and dividing by the square root of the error
variability, as just described. Effect sizes for end-of-year
outcomes were derived from SAS PROC MIXED (SAS
Institute, 1997) two-level random-effects models using a
similar approach. However, in these cases, error variability
was estimated as the residual variance in an unconditional
model divided by the average sample size per classroom.
Table 3
Factor Sco re Means, Standard Deviations, and Sample Sizes for Phonological Processing
at Each Wave of Data Collection
Instructional
group
Direct code
Grade 1
Grade2
Embedded code
Grade 1
Grade 2
Implicit code-research
Grade 1
Grade 2
Implicit code-standard
Grade 1
Grade 2
October
M
0.68
1.74
0.37
1.38
0.51
1.58
0.43
1.48
SD
0.54
0.80
0.36
0.74
0.55
0.62
0.50
0.70
n
44
14
49
36
57
28
24
24
December
M
1.34
2.06
0/72
1.61
0.93
1.89
0.90
1.76
SD
0.69
0.47
0.60
0.62
0.74
0.72
0.84
0.79
n
42
14
46
35
57
28
24
24
February
M
1.87
2.25
1.07
1.89
1.23
2.17
1.02
1.72
SD
0.74
0.69
0.69
0.71
0.87
0.79
0.75
0.63
n
39
14
41
29
55
27
23
23
M
2.16
2.51
1.59
2.18
1.53
2.21
1.22
1.90
April
SD
0.83
0.60
0.77
0.71
0.88
0.73
0.86
0.64
n
41
14
39
28
53
25
23
22

7/26/2019 reseacrh
http://slidepdf.com/reader/full/reseacrh 8/19
44
FOORMAN, FRANCIS, FLETCHER, SCHATSCHNEIDER, AND MEHTA
Table 4
Raw Score Means, Standard Deviation, and Sample Sizes for Word Reading at Each Wave
of Data Collection
Instructional
group
Direct code
Grade 1
Grade 2
Embedded code
Grade 1
Grade 2
Implicit code-research
Grade 1
Grade 2
Implicit code-standard
Grade 1
Grade 2
October
M
0.20
5.73
0.18
4.75
0.07
5.12
0.13
3.17
SD
0.51
6.66
0.88
4.92
0.32
5.24
0.61
4.90
n
15
49
36
57
28
24
24
December
M
2.17
8.57
0.72
7.46
0.57
7.96
0.21
5.36
SD
2.95
7.69
1.61
6.77
1.20
6.97
1.02
7.31
n
42
14
46
35
58
28
24
24
February
M
6.44
12.71
1.90
12.86
1.20
10.93
0.57
9.13
SD
7.13
9.60
2.77
11.04
2,30
9.83
1.59
7.87
n
39
14
41
29
55
38
23
23
M
12.68
19.43
5.00
18.29
5.23
16.16
1.91
14.27
April
SD
10.21
10.03
8.15
12.02
7.20
14.32
2.81
9.35
n
41
14
39
28
53
25
23
22
Analysis of growth in phonological processing. In the
analysis of phonological processing, there were significant
differences between ethnic groups and individual differences
in age and verbal IQ. African American children had
significantly lower expected scores in April than the sample
average (t = 2.90, p = .004) but did not differ in slope or in
the quadratic trend (p > .05). Age at the final assessment
was a significant predictor of expected score in April
(/ = 4.75, p < .001) and slope (t = 3.01, p = .003). This
means that older children had higher April scores but
improved at a slower rate compared with younger children.
Verbal IQ was a significant predictor of expected score in
April, slope, and the quadratic effect (t = 6.86, p < .001;
t =
2 .81,
p
= .005; and
t =
4.05,
p <
.001, respectively).
Thus, higher IQ children tended to have higher pho nological
processing scores in April, but their rate of learning tended
to taper off in the latter part of the school year.
There were significant differences in growth in phonologi-
cal processing among the four instructional groups, con trol-
ling for ethnicity and for individual differences in age and
verbal IQ. The overall effect of instructional group was large
on both intercepts (& R
2
= . 8 8 ,/ = 0.69) and slopes (A/?
2
=
. 8 6 , / = 1.13). More specifically, children receiving DC had
significantly higher scores in April than EC students
(t = 2.99, p < . 0 0 3 , / = 1.06), and students receiving IC-R
(t = 4.58, p < . 0 0 1 , / = 1.61). Instructional groups differed
significantly in their learning curves. These differences are
shown in Figure 1 both for raw scores in the top panel (i.e.,
observed data) and predicted scores in the bottom panel (i.e.,
estimates based on the fitted growth model). As is apparent
from the predicted scores (panel b), the rate of change in
phonological processing scores for the EC group differed
significantly from that of the IC-R group and DC groups
(t - 3.35, p = .001, / = 2.64, and t = 1.99, p = .045,
/ = 1.06, respectively), although the EC -D C difference is
not significant at the Bonferroni-adjusted critical value. In
general, the EC group was characterized by a relatively
constant rate of change, whereas the IC-R group showed a
slowing of growth at the end of the year.
Analysis of growth in word reading. Growth in word
reading was best described by a quadratic model. In the
conditional models, there were no significant effects of
ethnicity (p > .05), and the effects of age and verbal IQ
were similar to those found for phonological processing.
Specifically, age at last assessment was a significant predic-
tor of expected performance in April (i.e., the intercept)
(t = 4 .41, p < .001) and the rate of cha nge (i.e., slope;
t = 2.49, p = .013). Verbal IQ was also a significant predic-
tor of intercept and slope (t = 3.70, p < .001 and t = 4.15,
p < .001).
Differences between the IC-R and IC-S groups on April
performance (p > .05,/= 0.16) and growth in word read-
ing {p > .05,/= 0.01) were neither statistically nor practi-
cally significant. However, there were clear differences
among the instructional groups (overall A/?
2
= .3 5 , /= 0 .46
for intercepts and Ai?
2
= .54,/= 0.24 for slopes). Control-
ling for individual differences in age and verbal IQ as well as
for ethnicity, DC children improved in word reading at a
faster rate than IC-R children (t = 2.80, p = .006, /= 0 .58)
and EC children (f =
2.25,
p = .0 24 ,/ = 0.46), although the
DC-EC difference is not significant at the Bonferroni-
adjusted criterion. Relative to the DC group, the IC-R
group's rate of improvement in April was 10.7 fewer words
per year on the 50-word list, whereas the EC grou p's rate of
improvement was 8.6 fewer words per year. The shape of the
growth curves depicted in Figure 2 indicates a pattern of
increasing differences over time, and is evidenced by the
higher rate of change in April for the DC gro up. DC children
also had higher expected word-reading scores (mean inter-
cept) in April than IC-R children (t = 2.26, p = .024,
/ = 1.03), although this difference is slightly above the
Bonferroni-adjusted level of alpha (i.e., .024
vs .
.0167). This
was a 5.1-word difference betw een the DC and IC-R groups
in April. Thes e differences are shown in the raw and
predicted scores plotted in Figure 2.
To further examine possible group differences in word
reading at the end of the school year, a two-level random-
effects model was run on April word-reading scores using

7/26/2019 reseacrh
http://slidepdf.com/reader/full/reseacrh 9/19
ROLE OF INSTRU TION IN LEARNING TO READ
45
Growth
in
Phonological Processing
Raw Scores By
urriculum
j
3.5--
3 - •
2 . 5 -
1.5
1
0.5 +
- - Dime ode hetrucfon
- * -
Embedded
Code hstnetlon
- a - knplcil ode Research instruction
— -
Impficit ode
•
Standard Instruction
0
October
December February April
B Predicted Growth In Phonological Processing By
urriculum
- Direct ode hstouctkm
- Embedded Code kvtrucHon
-
Implicit ode Research Instruction
-
Implicit ode Standard Instructor
ctober
ecember
February
School
Year
Figure 1. Growth in phonological processing raw scores by curriculum (panel a) and predicted
growth in phonological processing by curriculum (panel b).
HLM-2 (Bryk & Raudenbush, 1992). We included covari-
ates of age, verbal IQ, ethnicity, and October word-reading
scores. This analysis revealed that the DC group outper-
formed the IC-R group, F(l, 165) = 10.06, p = .002,/ =
1.53, as well as the EC group, F( l, 165) = 5.34, p = .022,
f - 1.12, with no differences between the IC-R and EC
groups (p = .37, / =0.41).
The practical significance of the slope and intercept
differences is clearly apparent when examining individual
cases. A relatively large percentage of children in the IC-R,
IC-S, and EC curricula did not exhibit growth. As can be
seen in the frequency distributions of growth estimates in
word reading shown in Figure 3, approximately 46 of the
IC-R children, 44 of the EC children, and 38 % of the IC-S
children learned at a rate of 2.5 words or less per school year
on the 50-word list compared with only 16 in the DC
group. For DC children, growth in word reading does not
have a large positive skew, indicating small amounts of
growth characteristic of the other instructional groups.
To evaluate these patterns further, we used logistic
regression to calculate the probability of a child having a
predicted word-reading score in April greater than one.
7/26/2019 reseacrh
http://slidepdf.com/reader/full/reseacrh 10/19
46
I
• s
z
FOORMAN, FRANCIS, FLETCHER, SCHATSCHNEEDER, AND MEHTA
A Growth In Word Reading Raw Scores By Curr icu lum
16
T
- • - Direct Code Instmction
- * - Embedded CodB hstnrHon
- s - implc it Code - Researc h Instruction
-m- krvldt Code - Standard hetruclon
December February
School Year
E
z
B Predicted Growth In Wo rd Reading Scores By Curr icu lum
16
14 --
12 -
10
- D l red Co de Instruction
- Embedded Code hBtnrHon
-implci tCo dB-Re search hsfcuction
-ImpScitCode-StandBKlhstRictton
October
December February
School Year
Figure 2.
Growth in word reading raw scores by curriculum (panel a) and predicted growth in
word-reading scores by curriculum (panel b).
given that in October they read zero words. Included in the
analysis were covariates of age and ethnicity. The results
showed that DC children were 3.6 times more likely to be
reading more than on e word at the end of the year than IC-R
children,
X
Hh N = 182) - 6.48 ,p = .011 (95% confidence
interval [CI] = 1.34, 9.49), and 5.2 times more likely than
EC children,
X
2
0> # = 182) = 10.79, p = .001 (95%
CI — 1.94, 13.80). If the criterion was two words read
accurately at the end of the year, then D C children were 5.6
times more likely to be reading at that level than IC-R
children, x
2
d» N ** 182) = 12.74,.p < .001 (95% CI = 2.17,
14.33), and 5.2 times more likely than EC children, x
2
(l»
N = 182) = 11.60,/? = .0007 (95% CI = 2.014,13.45 ).
To evaluate the possible role of initial status in pho nologi-
cal processing in growth in word reading, October scores in
phonological processing were included in a three-level
analysis of word reading using HLM-3. Controlling for
effects resulting from ethnicity, the phonological covariate

7/26/2019 reseacrh
http://slidepdf.com/reader/full/reseacrh 11/19
ROLE OF INSTRUCTION IN LEARNING TO READ
47
_c
c
CO
CD
DC
"S
c
sz
I
2
o
• o
CL
o
CO
c
,g
• - »
00
b
u
e
n
a-
CD
X—
LL
u
3
1
o
O
S
5
o
35
O
c
u
s
e
t
o
"3
a
n p in o io a
N
Si
I-
i-
dnaig |o weojvd
•s
8
o
.3
3
1*1
dnaig io i iKawd

7/26/2019 reseacrh
http://slidepdf.com/reader/full/reseacrh 12/19
8
FOORMAN, FRANCIS, FLETCHER, SCHATSCHNEIDER, AND MEHTA
significantly predicted rate of grow th as well as April scores
in word reading (t = 6.41 and 8.54, respectively, p < .001).
The effects of initial phonological processing differed
across instructional grou ps. Nevertheless, instructional group
differences were similar to the model of word reading
without the phonological covariate. IC-R and IC-S groups
did not differ in slope or intercept
(p >
.05, / = 0.40 for
intercepts,/= 0.09 for slopes); however, there were differ-
ences among the three experimental groups. With respect to
the intercept, DC children continued to have significantly
higher expected scores in April than the IC-R children
(t = 2.38, p = .017, / = 0.92). With respect to slope, DC
children continued to improve in word-reading skills at a
faster rate than the IC-R children (t = 2.93, p = .004,
/ = 0.54), whereas the difference between D C and EC ,
which was previously not significant at the Bonferroni-
adjusted criterion, now failed to reach significance at
conventional levels (t = 1.13 p = .261, /= 0 .33) .
The differential effect of initial phonological skill on
individual differences in g rowth of word reading is depicted
in Figure 4 in which individual October scores in phonologi-
cal processing are plotted separately for each group against
predicted growth estimates in word reading. Generally,
higher initial scores in phonological processing coincide
with higher growth in word reading, and this pattern holds
for all groups. More importantly, Figure 4 shows that
children who start the year with the lowest levels of
phonological processing skill exhibit the lowest growth in
word reading in all groups except the DC group. Indeed,
some children who start the year with low phonological
scores still manag e to exhibit considerable growth in reading
words. These children were largely in the DC instructional
group, as evidenced by the vertical spread in the data points
in the left side of the panel for DC and the lack of spread in
the left side of the remaining three panels. The lines in the
panels depict the least squares regression line relating
reading growth to initial phonological processing. Although
the overall test of slope differences among instructional
groups was statistically significant, x
2
(3 , N = 252) = 7.90,
p = .048, none of th e pairwise comparisons met the Bonfer-
roni-adjusted critical value. Nevertheless, the generally
flatter line for the DC group is precisely what one would
expect if phonological processing is a determinant of growth
in word reading and DC is effective in improving phonologi-
cal processing. We would expect
initial
phonological process-
ing to be less related to outcome in DC because more
explicit instruction in the alphabetic code is more effective
in developing phonological processing skill in all children,
which thereby minimizes the importance of the level of this
skill that children bring to the classroom in the fall.
en
o
o
en
CD
0.5 1.0 1.5 2.0 2.5 3.0
I N I T I L P H O N O L O G I C L P R O C E S S I N G S C O R E
Figure 4. Plots of individual growth estimates in word reading by initial phonologica l processing
scores and instructional group.

7/26/2019 reseacrh
http://slidepdf.com/reader/full/reseacrh 13/19
ROLE OF INSTRUCTION IN LEARNING TO READ
49
Analysis of growth in vocabulary. In the anlaysis of
growth in vocabulary using the PPVT-R, there w as no evidence
for quadratic change. Rather, growth was linear (t = 11.22,
p < .001). In addition, there were significant effects of age
(t = 8.13, p < .001) on expected vocabulary in April, and
Hispanic children had lower expected vocabulary scores in April
compared with the sample average
(t =
4.86,
p <
.001). Most
important, there were no effects as a result of instructional group
(overall effect size/= 0.16, A/?
2
-
.01).
Thu s, 1C-R, IC-S, E C,
and DC children all developed to the same level and at the same
rate in vocabulary (i.e., about 6.5 items on the PFVT-R per
school year), which shows that the effect of DC on cognitive
skills was specific to reading and did not reflect a generic effect
of intervention. This growth in vocabulary is depicted in Figure 5
in terms of raw (panel a) and predicted (panel b) scores.
End-of- Year Achievement
Standard score means and standard deviations for the May
achievement tests of reading and spelling are provided in
Table 5 for each instructional group. The WJ-R Basic
|
82
80
78
76
74
70
68
66
64
4
62
60
58
56
54
52
Growth in PPVT Raw Scores By Cu rriculum
- D irect Code Instructor)
- Embedded Code totiuctlon
- Implcit Code - Research M u t t o n
-impieitCode - Standard Instruction
October
December February
April
Schoo l
Year
B Predicted Growth in PPVT Raw Scores By Curriculum
82
8 0
78
76
74
- Direct Code Instruction
- E mbedded C ode Instruction
- Im pidt Co de - Research Instruction
- Implicit Cod e - Standard Instruction
October
December February
Schoo l
Year
Figure 5. Growth in Peabod y Picture Vocabulary Test—R evised
PPVT-R)
raw scores by
curriculum (panel a) and predicted growth in PPVT-R scores by curriculum (panel b).

7/26/2019 reseacrh
http://slidepdf.com/reader/full/reseacrh 14/19
50
FOORMAN, FRANCIS, FLETCHER, SCHATSCHNEIDER, AND MEHTA
Table 5
Standard Score Means, Standard Deviation, and Sample
Sizes on M ay Achievement Tests of Reading and Spelling
for Four Instructional Groups
Instructional group
Direct code
M
SD
n
Embedded code
M
SD
n
Implicit code-research
M
SD
n
Implicit code-standard
M
SD
n
WJ-R Reading
Basic
96.1
14.6
58
88.6
11.2
82
89.6
12.7
78
84.5
9.7
45
Passage
compre-
hension
96.7
15.9
58
91.4
12.7
82
92.0
14.8
78
89.0
12.1
45
KTEA
spelling
85.7
12.2
58
82.0
8.2
82
81.6
9.1
77
81.7
7.6
45
FRI
compre-
hension
81.8
9.4
50
80.8
8.3
62
81.5
8.7
61
83.1
6.9
34
Note. WJ-R - Woodcock-Johnson Psychoeducational Battery-
Revised (Woodcock Johnson, 1989); KTEA - Kaufman Test of
Educational Achievement (Kaufinan
&
Kaufman, 1985); FRI
-
Formal Reading Inventory (WIederholt, 1986). The FRI was not
administered to children who scored less than 5 points on the WJ-R
Passage Comprehension.
Reading cluster is the average of the Letter-Word Identifica-
tion and Word Attack (pseudoword) subtests and represents
a measure of decoding. Passage Comprehension is a cloze
test at the sentence level, and the FRI is a multiple-choice
test based on silent narrative and expository text reading. On
the basis of our previous research (Foorman et al., 199 6), we
did not administer the FRI to children who scored less than 5
raw score points on the WJ-R Passage Comprehension to
avoid frustrating the children on the more difficult FRI.
A two-level hierarchical linear models approach using
SAS PROC MIXED (SAS Institute, 1997), nesting student
within teacher, was utilized to investigate instructional
group differences in the May achievement scores. Signifi-
cant effects of instructional group were followed up with the
three post hoc con trasts of interest, using Bonferroni correc-
tions to control the alpha level at p < .0167. Significant
instructional group effects were found for the WJ-R Basic
Reading cluster, F(3, 197) * 6.03, p = .008, / = 0.67,
M
2
= .48 and the WJ-R Passage Comprehension subtest,
F(3 , 197) = 2.15, p = .044 , /= 0 .40 , AR
2
= .64. Post hoc
tests of the instructional effect revealed that the DC group
had higher mean decoding scores than either the EC group,
F(h 197) = 9.41, p = . 0 0 3 , / = 1.17, or the IC-R group,
F(l, 197) = 7.00,/? = . 0 0 9 , / " 1.22, respectively. Likewise,
the DC group had higher mean Passage Comprehension
scores than the EC group, F (l , 197) - 4.76, p = .03 0 , / =
0.72, but
this
difference was not significant at the Bon feironi-
adjusted criterion. The difference between the D C and IC-R
groups was not significant, F(l, 197) =
3.68,/?
= .056, / =
0.76. Although these differences on Passage C omprehension
did not meet critical alpha values, the direction of the
differences is clear and the magnitude of the effects is large
by typical standards. There were no instructional group
differences on the KTEA Spelling or on the FRI (p > .05,
overall fo = 0.38 and 0.20, A/?
2
- .22 and undefined,
respectively). The FR I was too difficult for these children, as
is apparent from the low m eans of Table 6 and the fact that a
sizable number of children in each group (i.e., 14% of DC
and about 24% of the other groups) were not administered
the FRI because they did not meet the criterion of scoring at least
5 raw score points on the W J-R Passage Comprehension.
We used logistic regression to calculate the probability of
a child having a May WJ-R decoding score below the 25th
percentile, a usual d iagnostic criteria for a reading disability
(Fletcher et al., 1994). IC-S and IC-R children did not differ
from each other. However, IC-R children were 2.4 times as
likely as DC children to score below the 25th percentile,
X
2
<1,
N « 262) - 5.21, p = .02 (95% CI - 1.3, 4.1), and
EC c hildren were 3.1 times as likely as DC children to score
below the 25th percentile, xHh N « 262) = 10.09,/? = .002
(95% Q =
1.5,6.4).
Analyses ofAttendance, Perceived Self-Competence,
Attitudes, B ehavior, and Environmental Variables
Instructional groups did not differ in school attendance, in
perceived self-competence on the Harter scales, or in teacher
identification of emotional, behavioral, or family problems
on the end-of-year evaluation. However, instructional groups
significantly differed in reading attitudes (but not experi-
ence), F{3,257) = 4.29, p = .006. The IC-R group had more
positive attitudes toward reading than the DC group, F(l,
257) = 6.29,
p =
.013, and the IC-S group, F(l , 257) =
11.12,/? = .001. Questions related to the degree to which the
child likes people to read to him or her, likes or does not like
to read books by him or herself, thinks learning to read is
hard or easy, likes or does not like school, likes or does not
like to watch television, and has a parent, grandparent,
guardian, or sibling who likes or does not like to read.
Means and standard deviations are provided in Table 6 for
the six scales of the MIT, ANOVAs on the six scales
revealed instructional group differences on all scales but the
Attention scale. Using Bonferroni adjustment for alpha
(.05/6
scales = .0083), pairwise post hoc contrasts revealed
the IC-S group to be significantly different from the other
groups. With respect to the activity sca le, the IC-S group had
significantly higher activity ratings (e.g., out of chair,
restless, distractible) than the IC-R group, F (l , 271) - 8.81,
p = .003, and the DC group, F(l, 271) = 7.95, p = .005.
The IC-S group had significantly poo rer Adaptability scores
(e.g., gets upset and cannot tolerate changes, transition
problems, long time to settle down) compared w ith the IC-R
group, F( l , 271) = 14.05,p = .0002, and the EC group, F( l,
271) - 8.66,/? = .004. The IC-S group also had significantly
poorer Social scores (e.g., calls out in class, easily frus-
trated) relative to the IC-R group, F ( l , 271) = 11.08, p <
.001. On the Academic scale, the IC-S group had signifi-
cantly lower academic ratings relative to the EC group, F(l,

7/26/2019 reseacrh
http://slidepdf.com/reader/full/reseacrh 15/19
ROLE OF INSTRUCTION IN LEARNING TO READ
51
Table 6
Means, Standard Deviations, andp Values for the Six Scales of the Multi-Grade
Inventory for Teachers for Four Instructional Groups
Scales
Academic
Activity
Adaptability
Attention
Language
Social
Direct code
M SD
3.26 0.41
2.96 1.51
2,89 0.77
3.58 0.85
2.86 0.78
3.27 0.47
n
60
60
60
60
60
60
Embedded code
M
3.11
3.14
2.82
3.59
2.85
3.25
SD
0.41
1.48
0.93
0.79
0.72
0.54
n
86
86
86
86
86
86
Implicit code-research
M
3.26
2.97
2.70
3.38
2.68
3.14
SD
0.42
1.47
0.80
0.84
0.67
0.59
n
85
85
85
85
85
85
Implicit code-standard
M
3.39
3.77
3.28
3.65
3.09
3.47
SD
0.33
1.42
0.89
0.77
0.56
0.56
n
47
47
47
47
47
47
P
.002
.020
.003
.189
.020
.010
271) = 14.49,
p =
.0002. With respect to the Language
scale, the IC-S group had significantly more problem s (e.g.,
trouble expressing thought, difficult to understand) com-
pared with the IC-R group, F(l, 271) =
10.43, p <
.001,
respectively. Thus, the IC-S teachers perceived that their
students had significantly more behavioral and academic
problems compared with the IC-R, DC, and EC teachers.
Discuss ion
The results of this research clearly indicate that early
instructional intervention mak es
a
difference for the develop-
ment and outcomes of reading skills in first- and second-
grade children at risk for reading failure. However, the
results also demonstrate that not all instructional approaches
have the same impact. Children w ho were directly instructed
in the alphabetic principle improved in word-reading skill at
a significantly faster rate than children indirectly instructed
in the alphabetic principle through exposure to literature.
Furthermore, 46% of the children in the IC research group
and 44% of the EC group exhibited no demonstrable growth
in word reading compared with only 16% in the DC group.
These performance differences were due to instruction,
not to behavioral or affective differences among these
groups. The only differences on the behavioral measures
involved the IC-S condition, not a surprising finding given
that the vast majority of IC-S children came from one school
described as 'Hough." Because this school was the "unseen
control," we did not monitor classroom reading instruction
and, therefore, cannot determine the extent to which these
perceived behavioral and academic problems may have been
a consequence of poor classroom instruction. There were n o
behavioral differences among the three research conditions.
Similarly, although outcomes varied across classrooms,
measured characteristics of the teachers did not relate
significantly to outcome. Generally, teachers' attitude to-
ward and compliance with instructional practices were very
good across instructional groups, and the amount of time
devoted to reading and language arts instruction was
comparable.
Children in all instructional groups with higher initial
status in phonological processing skills in October exhibited
growth in word-reading skills. However, children in the DC
group who had low initial status in phonological processing
skills also appeared to show more growth in word-reading
skills than children with low p honological processing scores
in the other instructional g roups. Hence, the fact that the DC
approach used in this study included explicit instruction in
phonemic awareness appeared to facilitate word-reading
development for children who started the year with low
scores in this crucial precursor skill to reading. This shows
not only that problems with phonological processing are
related to p oor reading skills in these culturally and linguisti-
cally diverse children, but that greater changes in p honologi-
cal processing skills and word-reading ability occurred wh en
these children were provided a curriculum that included
explicit instruction in the alphabetic principle. The finding
that phonological processing moderated growth in word
reading suggests that the changes were due to the nature of
the instruction and not to the greater scripting of the DC
approach. Nevertheless, future studies should compare the
DC program used in this study with other DC programs that
vary in the degree of scriptedness to evaluate this possibility.
Also, the onset-rime component of the EC intervention was
scripted in the sense that spelling patterns were systemati-
cally presented. Hence, it is not surprising that performance
of the EC group tended to fall between that of the DC and IC
groups.
Instructional group differences in end-of-year achieve-
ment after the first year were clearly apparent: The direct
instruction group approached national average on decoding
(43rd percentile) and passage comprehension (45th percen-
tile) compared with the IC-R group's means of 29th
percentile and 35th percentile, respectively. (EC group
means were 27th percentile and 33rd percentile, respec-
tively). Although the differences in decoding skills were
robust, mean differences on the Passage Comprehension test
did not meet the critical value of alpha adopted for this study.
However, our approach was designed to minimize Type I
errors and was conservative. The mean differences on this
measure of reading comprehension were large; effect sizes
were also large, favoring the DC group. Furthermore,
logistic regression revealed that children in the IC-R and EC
groups were much more likely to score below the 25th
percentile on the standardized decoding test than children in
the DC instruction group. Scores below the 25th percentile
are often used to indicate reading disability on the basis of
traditional diagnostic criteria (Fletcher et al., 1994).
In this study, there were no effects of student-teac her ra tio

7/26/2019 reseacrh
http://slidepdf.com/reader/full/reseacrh 16/19
52 FOORMAN, FRANCIS, FLETCHER, SCHATSCHNEIDER, AND MEHTA
or nature of content in the tutoring com ponent. However, the
student-teacher ratio was not a constant 1:1 or small group
variable because of teachers' need to reconstitute groups to
adjust for behavioral or learning differences. Therefore, we
do not see our results as inconsistent with the research
supporting the benefits of one-on-one tutoring (e.g., Wasik
& Slavin, 1993). Future research should continue to study
the benefits of having tutorial content match or not match
classroom instruction. Having the content of tutorial match
the curriculum facilitates communication between class-
room teacher and tutor and ensures continuity of treatment
for the child (see Slavin et al., 1996). However, many
tutoring programs are springing up around the United States
in response to the America Reads challenge, and these
programs entail training that is divorced from classroom
instruction. Disconnected instructional programs have been
shown to be ineffective for high-risk students (Allington,
1991).
As with any other intervention study, longer term fol-
low-up with these children is clearly indicated to assess
whether the gains in decoding skills continue to accelerate in
DC instruction and whether there are longer term effects in
other aspects of the reading process. For exam ple, in spite of
differences in decoding skills, the IC group had more
positive attitudes toward reading, a finding consistent with
other research (e.g., Stahl, McKenna, & Pagnuc co, 1994). It
is possible that these positive attitudes toward reading,
although not associated with higher reading performance in
beginning reading, may sustain motivation to improve
reading skill as the student matures. Another interesting
question is whether the sequence of instructional method
makes a difference in growth and outcomes in reading. For
example, do children who receive explicit instruction in the
alphabetic principle in Grade 1 and subsequent implicit
instruction show greater gains than children who continue in
explicit instruction? Similarly, can direct instruction in
alphabetic and orthographic rules in Grade 2 ameliorate the
lack of growth in reading experienced in Grade 1 by children
who received either of the IC ap proaches? The effects of EC
instruction m ay require a longer period of time for benefits
to be realized. The large individual differences in the EC
group support findings from previous research (e.g., Ehri &
Robbing, 1992; Foorman, 1995a) that some dec oding skill is
needed before known orthographic rimes are spontaneously
used to read unknown words by analogy. At the same tim e, it
may take more time for children to use the spelling patterns
taught in the EC program. Hence, DC instruction may be
more efficient and lead to more rapid initial rates of growth,
but it is possible that the effects of an EC approach are
cumulative so that longer term outcomes are not different.
The critical issue is the extent to which the earlier develop-
ment of decoding skills achieved with exp licit instruction is
associated w ith improvement in reading comprehension and
spelling, which remains an open issue.
The positive effects of DC instruction did not generalize
to all academic areas. Instructional groups did not differ in
spelling achievement, and the average spelling scores were
not impressive. The measure of text reading had a floor
effect. Subsequent assessments will, it is hoped, show
greater transfer of word-reading skills to the text reading in
measures such as the FRI as well as measures such as the
WJ-R Passage Comprehension. Finally, 90 children who
were eligible for Title 1 and who received the classroom
intervention were not included in these analyses because
they did not receive tutorial services. These children were
better readers than the children in these analyses at baseline.
Analyses that included these 90 children did not alter the
pattern of results.
It is also important to keep in mind that the classroom
curricula used in this study took place in a print-rich
environment with a significant literature base. Instructional
programs that provided only phonological awareness or
phonics lessions were no t used because it was not likely that
such training would generalize to actual reading and spelling
skills. In the DC condition, as in other intervention studies
with demonstrable efficacy with poor readers (Torgesen,
1997; Vellutino et al., 1996), explicit instruction in the
alphabetic principle was separated from the literature comp o-
nent, but both components were provided. The opportunity
to apply what is learned in this component is most likely
critical for ensuring that the instruction ge neralizes.
The results of this study underscore the value of research
informed by contemporary hypotheses regarding the intercon-
nection between language and reading. Previous research
has demonstrated the effectiveness of direct instruction in
the alphabetic principle with beginning readers from m iddle-
class schools (Foorman, 1995a, 1995b; Foorman, Francis,
Novy, & Liberm an, 199 1; Vellutino et al., 1996) as well as
with disabled readers (Torgesen, 1997; Vellutino et al.,
1996).
Although the effects of tutorial interventions in this
study were overshadowed by the strong effects of classroom
instruction, other research with severely disabled readers
indicates the merits of intensive one-to-one intervention
with students (Torgesen, 1997; Vellutino et al., 1996). Future
studies should also evaluate entire classroom s, not just T itle
1 children, and compare the DC program in this study with
other curricula providing DC. Depending on the results, it
may well be possible to prevent reading failure for large
numbers of children if beginning instruction explicitly
teaches the alphabetic principle.
References
Adams, M. J. (1990).
Beginning to read.
Cambridge, MA : M IT
Press.
Agronin, M. E., Holahan, J. M., Shaywitz,
B .
A., & Shaywitz, S. E.
(1992).
The Multi-Grade Inventory for Teachers. In S. E.
Shaywitz & B. A. Shaywitz (Eds.),
Attention deficit disorder
comes of age
(pp. 29-67 ). Austin, TX: PRO-E D.
Allington, R. L. (1991). Children who find learning to read
difficult: School responses to diversity. In E. H. Hiebert (Ed.),
Literacy for a diverse society (pp. 237-252). New York:
Teachers C ollege Press.
Archambault, R. X. (1989). Instructional setting and other design
features of compensatory education programs. In R. E. Slavin,
N. L. K arweit, & N. A. Madden (Eds.), Effective programs for
students at risk (pp. 220-263 ). Needham H eights, MA : Allyn &
Bacon.
7/26/2019 reseacrh
http://slidepdf.com/reader/full/reseacrh 17/19
ROLE OF INSTRUCTION IN LEARNING TO READ 53
Aukerman, R. C.
(1984).
Approaches to reading. New York: Wiley.
Ball, E. W., & Blachman, B. A. (1991). Does phoneme awareness
training in kindergarten make a difference in early word
recognition and developmental spelling? Reading Research
Quarterly, 26, 49-66 .
Bradley, L., & Bryant, P. E. (1983). Categorizing sounds and
learning to read—A causal c onnection. Nature, 301, 419-421.
Bryk, A. S., & Raudenbush, S. W. (1987). Application of hierarchi-
cal linear models to assessing change. Psychological Bulletin,
101, 147-158.
Bryk, A. S., & Raudenbush, S. W. (1992). Hierarchical linear
models. Newbury Park, CA: Sage.
Bryne,
B.,
& Fielding-Barasley, R. (1991 ). Evaluation of
a
program
to teach phonemic awareness to young children. Journal of
Educational
Psychology,
83 , 451-455.
Byrne, B. , & Fielding-Barnsley, R. (1993). Evaluation of aprogram
to teach phonemic awareness to young children: A
1-year
follow-up. Journal of Educational Psychology, 85 , 104-111.
Byrne,
B. ,
& F ielding-Barnsley, R. (1995). Evaluation of aprog ram
to teach phonemic aw areness to young children: A 2- an d 3-year
follow-up and a new preschool trial. Journal of Educational
Psychology, 87,
488-503 .
Carroll, I , Davies, P., & Richman, B. (1971). The American
heritage w ord frequency book.
Boston, MA: Houghton Mifflin.
Chall, J. S. (1983). Learning to
read:
The great deb ate (2nd ed.).
New York: McGraw -Hill.
Clay, M. (1991).
Reading recovery: A guidebo ok for teachers in
training
Portsmouth, NH : Heinemann.
Dahl, K. L., & Freppon, P. A. (1995). A comparison of innercity
children's interpretations of reading and writing instruction in
the early grades in skills-based and whole language classrooms.
Reading R esearch Quarterly, 30,
50-75.
Dunn, L. M., & Dunn, L. M. (1981). Peabody Picture Vocabulary
Test-Revised. C ircle Pines, MN: American Guidance Service.
Ehri, L. C , & Robbins, C. (1992). Beginners need some decoding
skill to read by analogy.
Reading Research
Q uarterly,
2 7,
13-26.
Englemann, S., & Bruner, E. C. (1995).
SRA Reading Mastery
Rainbow Edition. Chicago, IL: SRA/McGraw-H ill.
Fletcher, J. M., Shaywitz, S. E., Shankweiler, D. P., Katz, L.,
Liberm an, I. Y., Stuebing, K. K., Fra ncis, D. J., Fowler, A. E., &
Shaywitz, B. A. (1994). Cognitive profiles of reading disability:
Comparisons of discrepancy and low achievement definitions.
Journal of Educational
Psychology,
86, 6 -23 .
Foorman, B . R. (1994). The relevance of a connectionist model of
reading for "th e great debate." Educational Psychology Review,
6, 25-47.
Foorman, B . R. (1995a). Practiced connections of orthographic and
phonological processing. In V. W. Berninger (Ed.), The varieties
of orthographic knowledge: II. Relationships to phonology,
reading and writing (pp. 377 -419 ). Dordrecht, the Netherlands:
Kluwer Academic.
Foorman, B. R. (1995b). Research on "the great debate": Code-
oriented versus whole language approaches to reading instruc-
tion. School Psychology
Review,
24 , 376-392.
Foorman, B. R., Francis, D. J., Beeler, T., Winikates, D., &
Fletcher, J. M. (1997). Early interventions for children with
reading problems: Study designs and preliminary findings.
Learning Disabilities: A M ulti-Disciplinary
Journal
8,
63 -71 .
Foorman, B. R., Francis, D. J., Fletcher, J. M., & Lynn, A. (1996).
Relation of phonological and orthographic processing to early
reading: Comparing two ap proaches to regression-based, reading-
level-match design.
Journal of Educational Psychology, 88,
639-652.
Foorman, B. R., Francis, D. J., Novy, D. M., & Liberman, D.
(1991). How letter-sound instruction mediates progress in first-
grade readin gand spelling. Journal of Educational Psychology,
83 ,
456-469.
Foorman, B . R., Francis, D. J., Shaywitz, S. E., Shayw itz,
B .
A., &
Fletcher, J. M. (1997a). The case for early reading interventions.
In
B. A.
Blachman
(Ed.), Foundations of reading acquisition and
dyslexia: Implications for early intervention (pp. 243-264).
Hillsdale, NJ: Erlbaum.
Foorman, B. R., Francis, D. J., Winikates, D., Mehta, P.,
Schatschneider, C , & Fletcher, J. M . (1997b). Early intervention
for children with reading disabilities. Scientific Studies of
Reading 1 , 255-276.
Francis, D. J., Fletcher, J. M., Stuebing, K. K., Davidson, K. C , &
Thompson, N. M. (1991). Analysis of change: Modeling indi-
vidual growth. Journal of Consulting and Clinical Psychology,
59 ,
27-37.
Francis, D . J., Shayw itz, S. E., Stuebing, K. K., Shay witz, B. A,, &
Fletcher, J. M. (1996). Developmental lag versus deficit models
of reading disability: A longitudinal, individual growth curves
analysis. Journal of Educational
Psychology,
88, 3-17.
Gough, P. B., & HilKnger, M. L. (1980). Learning to read: An
unnatural act. Bulletin of the Orton
Society,
30, 179-196.
Harter, S. (1982). The Perceived Competence Scale for Children.
Child Development 53 , 87-97.
Harter, S., & Pike, R. (1984). The Pictorial Scale of Perceived
Competence and Social Acceptance for young children.
Child
Development, 55, 1969-1982.
Hiebert, E. H., Colt, J. M., Catto, S. L,, & Gary, E. C. (1992).
Reading and writing of first-grade students in a restructured
chapter 1 program. American Ed ucational Research
Journal
29 ,
545-572.
Iversen, S., & Tunmer, W. (1993). Phonological processing skills
and the reading recovery program. Journal of Educational
Psychology, 85, 112-126.
Juel, C. (198 8). Learning to read a nd write: A longitudinal study of
54 children from first through fourth grades.
Journal of Educa-
tional
Psychology,
80 ,
437-447.
Kaufman, A. S., & Kaufman, N. L. (1985). Kaufman Test of
Educational Achievement. Circle Pines, MN: American Guid-
ance Service.
Liberman, I. Y , S hankweiler, D., & Liberman, A. M. (198 9). The
alphabetic principle and learning to read. In D. Shankweiler &
I. Y. Liberman (Eds.), Phonology and reading disability: Solving
the reading puzzle (pp.
1-33).
Ann Arbor, MI: University of
Michigan Press.
Lyon, G. R. (1995). Towards a definition of dyslexia. Annals of
Dyslexia, 45, 3-27.
Maxwell, S. E., & Delaney, H. D. (1990). Designing experiments
and analyzing
data:
A model com parisons perspective.
Belmont,
CA: W adsworth.
Olson, R. K., Wise, B., Ring, J., & Johnson, M . (199 7). Computer-
based remedial training in phoneme awareness and phonological
decoding: Effects on the post-training development of word
recognition. Scientific Studies of
Reading 1
235-254.
Open Court Reading. (1995).
Collections for young scholars.
Chicago and Peru, IL: SRA/McG raw-Hill.
Pinnell, G. S., Lyons, C. A., DeFord, D. E., Bryk, A. S., & Selzer,
M. (1994). Comparing instructional models for the literacy
education of high-risk first graders.
Reading Research Quarterly,
29 , £ -38 .
Puma, M. J., Jones, C. C , Rock, D., & Fernandez, R. (1993).
Prospects: The congressionally mandated study of educational
growth and opportunity (interim report). Bethesda, MD: ABT
Associates.

7/26/2019 reseacrh
http://slidepdf.com/reader/full/reseacrh 18/19
54
FOORMAN, FRANCIS, FLETCHER, SCHATSCHNEIDER, AND MEHTA
Rogosa, D. R. , Brandt D., & Zimow ski, M. (1982). A growth curve
approach to the measurement of change.
Psychological Bulletin,
90 , 726-748.
Routman, R. (1991). Invitations: Changing as teachers and
learners: K-J2.
Portsmouth, NH: Heinemann.
SAS Institute. (1997). SAS/STAT
software:
Changes and enhance-
ments though release
6.12.
Cary,
NC:
Author.
Shanahan, T., & B ait, R. (199 5). Reading Recovery: An indepen-
dent evaluation of the effects of an early instructional interven-
tion for at-risk learners.
Reading Research Quarterly, 30,
958-996.
Shaywitz, S. E,, Fletcher, J. M , & Shayw itz, B . A. (1994). Issues in
the definition and classification of attention deficit disorder.
Topics
in Language Disabititiess, 14, 1-25.
Slavin, R. E., Karweit, N. L., & Madden, N. A. (1989). Effective
programs for students at
risk. B oston: Allyn & Bacon.
Slavin, R. E., Karwe it, N. U & Wasilc, B.A. (1994 ). Preventing
early school failure: Research on effective strategies, Boston:
Allyn & Bacon.
Slavin, R. E., Madden, N. A., Dolan, L. J., & Wasik, B. A. (1996).
Every
child
every
school:
Success for all. Thousand Oaks, CA:
Corwin Press.
Stahl, S. A., McKenna, M . C , & Pagnucco, J. R. (1994). The
effects of whole-language instruction: An update and a reap-
praisal. Educational
Psychologist
29 ,275-186.
Stanovich, K. E. (1990). Concepts in developmental theories of
reading skill: Cognitive resources, automaticity, and modularity.
Developmental
Review,
10 , 72-100.
Stanovich, K. E., & Siegel, L. (1994). Phenotypic performance
profile of children with reading disabilities: A regression-based
test of the phonological-core variable-difference model. Journal
of Educational
Psychology,
86 , 24-53.
Torgesen, J. K. (1997). The prevention and remediation of reading
disabilities: Evaluating what we know from research. Journal of
Academic Language
Therapy,
1, 11-47.
Veilutino, F. R. (1991). Introduction to three studies on reading
acquisition: Convergent findings on theoretical foundations of
code-oriented versus whole-language approaches to reading
instruction. Journal of Educational
Psychology,
83 ,437-443.
Veilutino, F. R., Scanlon, D. M , Sipay, E., Small, S., Pratt, A.,
Chen, R., & Denckla, M. (1996). Cognitive profiles of difficult-
to-remediate and readily remediated poor readers: Early interven-
tion as a vehicle for distinguishing between cognitive and
experiential deficits
as
basic causes of specific reading disability.
Journal of Educational Psychology, 88, 601-638.
Wagner, R., Torgesen, J. K., & Rashotte, C. A. (1994). Develop-
ment of reading-related phonological processing abilities: New
evidence of bidirectional c ausality from a latent variable longitu-
dinal study. Developmental
Psychology,
30 ,73-87.
Wasik, B., & Slavis, R. E. (1993). Preventing early reading failure
with one-to-one tutoring: A review of five programs.
Reading
Research
Q uarterly,
28 ,
178-200.
Weaver, C. (1994). Understanding whole language: From prin-
ciples
to
practice.
Portsmouth, NH: Heinemann.
Wechsler, D. (1974).
W echsler Intelligence Scale for Children-
Revised. San Antonio, TX: Psychological Corporation.
Wiederholt, L. J. (1986). Formal Reading Inventory, Austin, TX:
PRO-ED.
Woodcock, R. W , & Johnson, M. B. (1989). Woodcock-Johnson
Psychoeducational
Battery-Revised.
Allen, TX: DLM Teaching
Resources.
Appendix A
Spelling Patterns for Embedded Code Instruction (Sequenced From Left to Right)
_a t
_on
-*g
_u g
_en
_ait
_ate
_me
_ean
_csl
_each
_ive
_ome
Jght
_oad
_ad
-o p
J t
_a t
-e p
_ay
_ale
_m y
ease
eel
_aU
_ice
_oke
_oat
Sequence for Grade 1
_an
_ot
_in
_a d
_go, no
_ame
_ave
_ee
_eet
_een
J t e
_jme
ose
_old
_ie
_o g
_a p
_e t
_ain
_ake
_ane
_eed
_ea
^ p
ile
_ike
_ope
_ue
_ow
_a p
J d
_a n
-e d
_aint
_ade
-.ace
_eam
_ead
-.cat
Jn e
Jd e
J g h
_o a
_own
ath
JU
_and
_ang
_oft
oo t
Jf t
J s t
_ump
_uag
_ench
_ent
_arm
Jc
uff
_ell
_amp
_ank
_ond
_oom
_ink
_isp
_BSt
_unk
es t
_oil
_arn
_ird
Sequence for Grade 2
- O S S
_ax
_anf
_ask
~ong
_ood
^int
J n g
_imt
_ept
-.elp
~.eive
_orm
_urn
_ess
_act
_ast
_atch
_onk
oon
_ilt
_irst
_ulp
end
eft
_idf
_orn
-al l
_alt
_anch
_ox
_ook
ix
J l k
_itch
unch
_elt
_elf
_ar
_ern
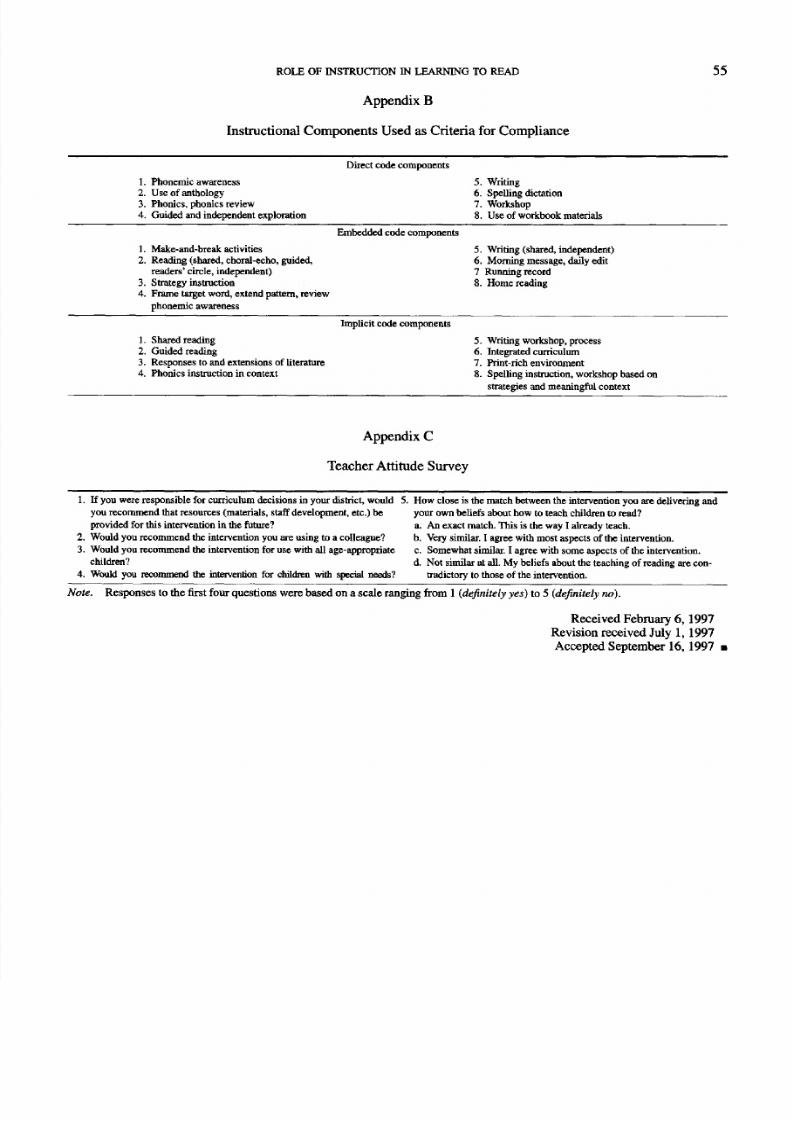
7/26/2019 reseacrh
http://slidepdf.com/reader/full/reseacrh 19/19
ROLE OF INSTRUCTION IN LEARNING TO READ
Appendix B
Instructional Com ponents Used as Criteria for Com pliance
55
Direct code components
1.
Phonemic awareness
2. Use of anthology
3.
Phonics, phonics review
4.
Guided and independent exploration
5.
Writing
6. Spelling dictation
7 .
Workshop
8. Use of workbook materials
Embedded code components
1.
Make-and-break activities
2.
Reading (shared, choral-echo, guided,
readers' circle, independent)
3.
Strategy instruction
4. Frame target word, extend pattern, review
phonemic awareness
5.
Writing (shared, independent)
6. Morning message, daily edit
7 Running record
8. Home reading
Implicit code components
1.
Shared reading
2.
Guided reading
3.
Responses to and extensions of literature
4. Phonics instruction in context
5.
Writing workshop, process
6. Integrated curriculum
7.
Print-rich environment
8. Spelling instruction, workshop based on
strategies and meaningful context
Appendix C
Teacher Attitude Survey
1.
If you were responsible for curriculum decisions in your district, would 5. How close is the match between the intervention you are delivering and
you recommend that resources (materials, staff development, etc.) be
provided for this intervention in the future?
2.
Would you recommend the intervention you are using to a colleague?
3.
Would you recommend the intervention for use with all age-appropriate
children?
4. Would you recommend die intervention for children with special needs?
your own beliefs about how to teach children to read?
a. An exact match. This is the way I already teach.
b. Very similar. I agree with most aspects of the interven tion.
c. Somewhat similar. I agree with some aspects of the intervention.
d. Not sim ilar at all. My beliefs about the teaching of reading are con-
tradictory to those of the intervention.
Note. Response s to the first four questions were based on a scale ranging from 1
{definitely
yes) to 5 (definitely no).
Received February 6,1997
Revision received July
1,1997
Accepted September 16,1997