REQUEST FOR CORRECTION OF INFORMATION … · 2016-05-02 · REQUEST FOR CORRECTION OF INFORMATION...
15
1 REQUEST FOR CORRECTION OF INFORMATION submitted by: Steffen Mueller, PhD Principal Economist Energy Resources Center The University of Illinois at Chicago 1309 South Halsted Street Chicago, IL 60607 (312) 316-3498 [email protected] Concerning the U.S. Environmental Protection Agency’s LIFECYCLE ANALYSIS OF ETHANOL AND GASOLINE UNDER THE RENEWABLE FUEL STANDARD April 11, 2016
Transcript of REQUEST FOR CORRECTION OF INFORMATION … · 2016-05-02 · REQUEST FOR CORRECTION OF INFORMATION...

1
REQUEST FOR CORRECTION OF INFORMATION
submitted by:
Steffen Mueller, PhD
Principal Economist
Energy Resources Center
The University of Illinois at Chicago
1309 South Halsted Street
Chicago, IL 60607
(312) 316-3498
Concerning the U.S. Environmental Protection Agency’s
LIFECYCLE ANALYSIS OF ETHANOL AND GASOLINE UNDER
THE RENEWABLE FUEL STANDARD
April 11, 2016

2
EXECUTIVE SUMMARY
Steffen Mueller, Principal Economist with the Energy Resources Center at the University of Illinois at
Chicago would like to recommend to the United States Environmental Protection Agency (EPA) to
update information concerning ethanol’s greenhouse gas life cycle emissions.
Significant progress in scientific research as well as technological advancements have shaped
the corn ethanol industry since EPA published its greenhouse gas emissions analysis in the
Regulatory Impact Analysis accompanying EPA’s 2010 Renewable Fuel Standard (RFS) Rule.
Progress in science has left EPA’s life cycle modeling efforts outdated and in need to be
revisited. In particular, outdated modeling runs may adversely impact export markets for US
produced corn ethanol which often require sustainability analyses.
Some of the key research institutions that have furthered the science include Purdue
University, Iowa State, University of Illinois, North Carolina State, South Dakota State, and
others while the US Department of Energy, the US Department of Agriculture, and Argonne
National Laboratory provided substantial research resources. We have reviewed the current,
peer-reviewed literature published since 2010, after the finalization of the RFS2 modeling
efforts. Model updates with the latest scientific findings and technological advances must be
encouraged in order to document the continuous potential of selected biofuels including corn
ethanol to reduce greenhouse gas emissions and to ensure the availability of export markets for
this fuel.
Since the RFS2 modeling efforts emissions from land use change associated with an expansion
of biofuels production have
been continuously
reexamined and are now in
the range of 4-10 gCO2e/MJ
(down from >30 gCO2e/MJ
in the original RFS2 model)
according to Argonne’s
GREET life cycle emissions
model. Better databases
and elasticity values in
economic models that
assess land use area
changes and better carbon
stock factors have
significantly reduced the
original emissions
estimates.

3
Based on historic,
surveyed trends, thermal
energy consumption at
2015 corn ethanol plants
are currently estimated to
be (on average) 42% less
than energy needs of 2001
plants. Better heat
integration, co-product
diversification, new
enzyme technologies, and
new grinding technologies
have contributed to this
trend.
Also, water consumption has been
dramatically reduced since the
early model dry grind plants were
installed.
Total life cycle emissions from corn
ethanol have also been
reexamined in the context of land
management practices and diverse
fuel and feed coproducts
associated with the pathway.
GREET now also includes a
combined stover and grain ethanol
pathway. This latest data shows that ethanol produced at a combined grain and stover ethanol
plant emits life cycle emissions of 50 gCO2e/MJ. In a further refinement, GREET shows that
ethanol produced on acres with either cover crops or manure as land management changes will
produce emissions of 48 or 47 gCO2e/MJ, respectively. This is a 50% reduction over gasoline.
4
Introduction
The COP21 meeting in Paris showcased the role that agriculture, biofuels, and soils can play in
mitigating climate change.1,2 Policy instruments are already in place at the domestic and
international level that take advantage of biofuels’ potential to reduce global warming. In the
US the implementation of the California, and now Oregon, Low Carbon Fuel Standards (LCFS)
and the expanded Renewable Fuels Standard (RFS2) have in fact prompted the implementation
of low carbon technologies across biofuels production pathways and resulted in a significant
increase in scientific studies and model updates related to corn ethanol greenhouse gas (GHG)
assessments.
While both programs aim to replace gasoline with lower carbon fuels, the RFS2 specifically
provides volumetric blending requirements for biofuels whereas fuel suppliers under the LCFS
need to meet performance based GHG reduction targets from a fuel mix of their choice.3 The
RFS2 creates GHG reduction categories for four types of fuels: biomass-based diesel, cellulosic
biofuel, advanced biofuel, and renewable/conventional fuel. For example, corn ethanol must
meet a 20% lifecycle GHG reduction threshold, while advanced biofuels produced from
qualifying biomass must meet a 50% reduction in GHG emissions. The LCFS in California
requires a 10% reduction in the carbon intensity of transportation fuels by 2020.
Both the LCFS and RFS2 in the US rely on life cycle emissions analysis to ensure their policy
objectives are met. Both programs employ different versions and parameterizations of the
Greenhouse Gases, Regulated Emissions, and Energy Use in Transportation (GREET) model
developed by Argonne National Laboratory. The latest version of Argonne’s GREET emissions
model released in September 2015 provides updated data for many fuel pathways including
corn ethanol produced from grain and stover. GREET is the principal model used in the US for
emissions assessments along a fuel’s full production life cycle, which includes emissions from
land use change (LUC), feedstock production, conversion, and combustion in the vehicle.4 Both
the RFS2 and the LCFS require the inclusion of emissions from LUC (both direct land use and
indirect supply adjustments) as part of their regulatory structure.
European efforts under the “Fuel Quality Directive” are similar to the LCFS approach albeit with
different GHG reduction targets, whereas Japanese efforts under the “Act on the Promotion of
the Use of Nonfossil Energy Sources” are more in line with the RFS2 approach of volumetric
blending requirements.
1 http://25x25blog.org/cop21-agreement-opens-the-door-for-solutions-from-the-land/ 2 http://newsroom.unfccc.int/lpaa/agriculture/join-the-41000-initiative-soils-for-food-security-and-climate/ 3 Transportation Research Board; “Policy Options for Reducing Energy Use and Greenhouse Gas Emissions from Transportation”; Special Report 307; 2011; available at www.trb.org 4 GREET’s parameterization flexibility provides substantial support to conduct life cycle assessments in compliance with international LCA standards includng “ISO 14040:2006 – Environmental management – Life cycle assessment – Principles and framework.”

5
In Europe, due to the evolving science and uncertainties associated with quantifying emissions
from land use change, the Fuel Quality Directive (which requires blending of biofuels with
petroleum based fuels) does track but does not include emission from LUC in a fuel’s GHG
assessment. Corn ethanol must achieve a GHG reduction of 35% over gasoline (with an
increasing threshold to 50% starting in 2018). However, biofuels must be certified for
sustainable production based on an EU-approved certification protocol such as the one
developed by International Sustainability and Carbon Certification (ISCC).5
Japan is increasing its biofuels blending volumes for gasoline over the next years.6 Imported
ethanol and ethyl tertiary butyl ether (ETBE) additives must meet a 50% reduction threshold of
biofuels over gasoline set by the “Act on special accounts and the measures for the
enhancement of the energy supply-demand structure.” Emissions from LUC are considered but
only those associated with direct LUC have to be included in the life cycle modeling effort.7
GHG assessments from life cycle models generally quantify emissions in terms of carbon dioxide
equivalent emitted per mega joule of fuel produced, which allows a consistent comparison
across pathways regardless of differing heating contents. The following sections of this report
will detail some of the key scientific publications related to GHG emissions and sequestration
effects from corn ethanol production with a focus on LUC and land demands, corn conversion,
life cycle model boundary and accounting structures, as well as current life cycle emissions
values for corn ethanol.
Many academic and government institutions including Purdue University, South Dakota State
University, North Carolina State University, Iowa State University, US Department of
Agriculture, Argonne National Laboratory/US Department of Energy have separately and
collaboratively produced substantial research progress in this field. Throughout this report
emphasis is placed on the most current, peer-reviewed literature published since 2010, after
the finalization of the RFS2 modeling efforts.
The US Environmental Protection Agency during the RFS2 rulemaking process detailed the GHG
emissions for its baseline dry grind ethanol plant. Figure 1 shows the pathway emissions by life
cycle stage.8 We will detail the latest scientific findings for each major life cycle stage that have
occurred since then. Model updates with the latest scientific findings must be encouraged in
order to document the continuous potential of selected biofuels including corn ethanol to
reduce greenhouse gas emissions and to ensure the availability of export markets for this fuel.
5 http://iscc-system.org/en/ 6 http://www.platts.com/latest-news/oil/tokyo/japan-refiners-must-consume-500000-kl-biofuels-8206931 7 Note that different gasoline baseline values and co-product allocation methods apply for Europe and Japan. 8 Coordinating Research Council Inc, Transportation Fuel Life Cycle Analysis, A Review of Indirect Land Use Change and Agricultural N2O Emissions; CRC Report No. E-88-2, 2012, http://www.crcao.com/reports/recentstudies2012/E-88-2/CRC%20E-88-2%20Final%20Report.pdf

6
Figure 1: RFS2 GHG Emissions of Dry Grind Ethanol Plant by Life Cycle Stage
Domestic Soil Carbon and International Land Use Change
GREET has an interface called the CCLUB model that allows quantification of emissions from
LUC associated with biofuels production. In CCLUB global land area changes are multiplied by
carbon stock factors for different ecosystems and regions to derive total emissions associated
with land use change. The first version of the CCLUB model was released in 2010. In this early
version model land use area changes relied on Argonne-commissioned economic model runs
based on the Global Trade and Analysis Project (GTAP) model and its 2001 database and carbon
stock factors derived from Woods Hole for domestic and international LUC. The early CCLUB
version only focused on corn ethanol production, but it did include options to assess carbon
adjustments from different tillage practices and different biofuels production periods. Over the
years CCLUB has been continuously refined to use updated land area data including new GTAP
LUC results based on the 2013 Taheripour and Tyner publication with region-specific land
transformation elasticities. This key effort by Purdue University resulted in much lower
domestic land area changes than the older versions of CCLUB. This evolvement in domestic
predicted land area changes has been independently confirmed by other modeling
approaches.9 Importantly, in a recent study by Iowa State University Babcock and Zabid provide
9 Elliott, J., Sharma, B., Best N., Glotter., M., Dunn, J., Foster, I., Miguez, F., Mueller, S., Wang, M., A Spatial Modeling Framework to Evaluate Domestic Biofuel-Induced Potential Land Use Changes and Emissions, Environ. Sci. Technol., 2014, 48 (4), pp 2488–2496 DOI: 10.1021/es404546r

7
compelling evidence that land use intensification has been widely underestimated in land use
modeling resulting in overstated native land conversions by earlier land use models. 10
Domestic carbon adjustments in the most recent GREET CCLUB version are modeled based on a
surrogate Century biophysical soil carbon model at county level resolution. CCLUB now
accommodates many biofuels feedstocks including biofuels produced from corn ethanol, stover
ethanol, switchgrass, miscanthus, poplar and willow; introduction of expanded land
management change scenarios for stover ethanol at 30% and 60% removal rates; carbon
adjustments from cover cropping and manure application; display of national, AEZ and county-
level soil carbon changes; and the use of different life cycle assessment (LCA) allocation
methods (energy vs. mass allocation). Research at South Dakota State University, USDA, and
elsewhere has shown that carbon sequestration effects from high rotation corn can
significant.11;12
Figure 2 shows the different emissions results obtained over the years with different
parameterization options. The graph shows that depending on the parameterization of the
model the LUC values range from 4-10 gCO2e/MJ. The Oregon Low Carbon Fuel Standard has
adopted the CCLUB emissions factors associated with LUC from biofuels production. Table 1
shows the latest LUC research compared to the original RFS2 modeling efforts.
10 Bruce A. Babcock and Zabid Iqbal; “Using Recent Land Use Changes to Validate Land Use Change Models”; Staff Report 14-SR 109; Center for Agricultural and Rural Development; Iowa State University; 2014; available at http://www.card.iastate.edu/publications/dbs/pdffiles/14sr109.pdf 11 Clay, David et al. “Tillage and Corn (Zea mays) Residue Harvesting Impact Surface and Subsurface Carbon Sequestration” Journal of Environmental Quality; Manuscript ID: JEQ-2014-07-0322-TR.R1; 2014 12 Varvel and Wilhelm. “Long-Term Soil Organic Carbon as Affected by Tillage and Cropping Systems”; Soil Sci. Soc. Am. J. 74:915–921; 2010

8
Figure 2: Emissions from Land Use Change in the CCLUB land use change interface to the GREET Model. Emissions from
international and domestic land use change combined range from 4-10 gCO2e/MJ depending on the parametrization of the
model. Depending on the modeling assumptions (including the use of different conservation practices) domestic land use
emissions are negative indicating carbon sequestration.
Table 1: Advances in LUC Research
EPA RFS2 Values
Latest Research
gCO2e/MJ
Domestic Soil Carbon -3.8
Domestic Rice Methane -0.2
Domestic -4 -2 to +2
International Rice Methane 2.0
International Land Use Change 30.2
International 32.2 +6 to +8
Land Demands
A big debate is the extent to which cropland is expanding or contracting internationally as well
as domestically and to what degree any movement along the agricultural frontier is related to
biofuels production. Two recent reports attribute cropland expansion in sensitive regions like

9
the Prairie Pothole Region to increased land demands from biofuels production.13,14 The paper
by Lark et al. calls into question the United States Environmental Protection Agency’s (USEPA)
aggregate compliance approach that aims to limit cropland expansion. This mechanism requires
USEPA to check the amount of US cropland against a 2007 baseline annually and work with
USDA to identify underlying causes of LUC should the cropland acres in any year exceed that
2007 baseline (i.e., 402 million acres). Lark et al. conclude that 5.7 million acres of cropland has
been converted from grasslands and an additional 1.6 million acres of cropland has been
converted from long-standing prairie and range-like locations. While the Lark paper provides
some key scientific insights into the use of geospatial tools for LUC assessments, a subsequent
review of the paper and ongoing research by Lark and others will likely further refine these
findings. 15
In fact, some advanced tools that can provide further evidence that LUC has or has not taken
place have recently become available, benefitted by significant advances in imaging data
processing over the last 5 years. An imagery tool developed by Global Risk Assessment Services
(GRAS) and Genscape, Inc. was recently released to the public.16 The tool utilizes high
resolution current and historic pictures from the National Agricultural Imaging program (NAIP)
for US LUC assessments and satellite-derived enhanced vegetation index imagery for global
land area changes. Use of this tool showed that while certain native conversions have taken
place in the Prairie Pothole Region the extent is unknown and further research is needed.17
Confirming cropland expansion and reversion is important. However, establishing causality
between conversion and expanded biofuels production proves more difficult. Mumm et al.
point out that although 40.5% of corn grain was used in ethanol processing in 2011, only 25% of
US corn acreage was attributable to ethanol when accounting for feed and co-product
utilization.18 To put this into perspective: the current net acre use for corn ethanol is less than
25 million acres compared to 310 million acres in principal crops and additional millions of acres
in rangeland, grassland, and pastureland.
13 Lark T J, Meghan Salmon J and Gibbs H K; 2015; “Cropland expansion outpaces agricultural and biofuel policies in the United States”; Environ. Res. Lett. 10 044003 14 Environmental Working Group; “Ethanol’s Broken Promise: Using Less Corn Ethanol Reduces Greenhouse Gas Emissions”; March 2014; Available at http://www.ewg.org/research/ethanols-broken-promise 15 https://www.gras-system.org/nc/gras-tool/genscape/ 16 https://www.gras-system.org/ 17 Jennifer B. Dunn, Steffen Mueller, Laurence Eaton, “Comments on Cropland expansion outpaces agricultural and biofuel policies in the United States”; April 29, 2015; available at https://greet.es.anl.gov/publication-comments-cropland-expansion 18 Mumm et al. “Land usage attributed to corn ethanol production in the United States: sensitivity to technological advances in corn grain yield, ethanol conversion, and co-product utilization”; Biotechnology for Biofuels 2014, 7:61.

10
While biofuels production likely causes land area changes and therefore emissions adjustments,
vast areas of other lands exist that can be used to maximize sequestration.19 The low hanging
fruit would not be to focus on the current net acres going into biofuels production but rather a
conversion of abundant low carbon marginal lands to more effective carbon-sequestering
biomass vegetation20. The productivity of marginal lands for that purpose has been
documented and further research is underway.21
Yield Price Elasticity
A key variable in economic land use models that greatly affects the predicted global land area
changes in response to a biofuels policy is called yield price elasticity. This variable describes the
response of farmers to price signals. The economic land use change models used in LUC analyses
indicate that higher demand for corn due to biofuels production will stabilize or at times increase
corn prices. However, recent research conducted by North Carolina State University, University
of Illinois at Urbana Champaign, and Purdue University confirms that higher commodity prices
actually mitigate land use impacts because growers (in response to higher corn prices) invest in
more productive technologies.22,23,24
Conversion Efficiencies
While land demands for biofuels production and the emissions associated with LUC oftentimes
take center stage in the public discourse surrounding biofuels, the recent technical advances in
feedstock production and conversion are frequently overlooked. Over the last 15 years ethanol
production has seen significant efficiency improvements.25 Modern energy and processing
technologies such as sophisticated heat integration, combined heat and power technologies,
variable frequency drives, advanced grinding technologies, various combinations of front and
back end oil separation, and innovative ethanol and dried distillers grains (DDG) recovery have
reduced the energy footprint of the corn ethanol production process.
19 Mueller, S., Ken Copenhaver, and Dan Begert “An Assessment of Available Lands for Biofuels Production in the United States Using USDA Cropland Data Layers”; Journal of Agricultural Extension and Rural Development Vol. 4(18), pp. 465-470, October 2012 20 https://www.youtube.com/watch?v=91ks0GRQb4I 21 Cai X., Zhang X., Wang D. (2011) Land availability for biofuel production. Environmental Science & Technology, 45, 334-339. 22 Is Yield Endogenous to Price? An Empirical Evaluation of Inter and IntraSeasonal Corn Yield Response; Barry K. Goodwin, Michele Marra, Nicholas Piggott and Steffen Mueller; June 3, 2012. Available at: http://www.erc.uic.edu/PDF/mueller/2012_corn_ethanol_draft4_10_2013.pdf 23 Taheripour and Tyner.”GTAP Data Update, Forecasting and Backcasting in GTAP, and CRC Work on CARB Results”; Purdue University; October 27-28, 2015 http://www.wrh.crcao.com/workshops/LCA%20October%202015/Session%203/Tyner,%20Wally.pdf 24 Ruiqing Miao, Madhu Khanna, and Haixiao Huang; “Responsiveness of Crop Yield and Acreage to Prices and Climate”; Am. J. Agr. Econ. first published online May 29, 2015 doi:10.1093/ajae/aav025 25 Shapouri, H. and James Duffield , Michael Wang. “The Energy Balance of Corn Ethanol: An Update”; USDA Office of Energy Policy and New Uses, AER-814, 2001.
11
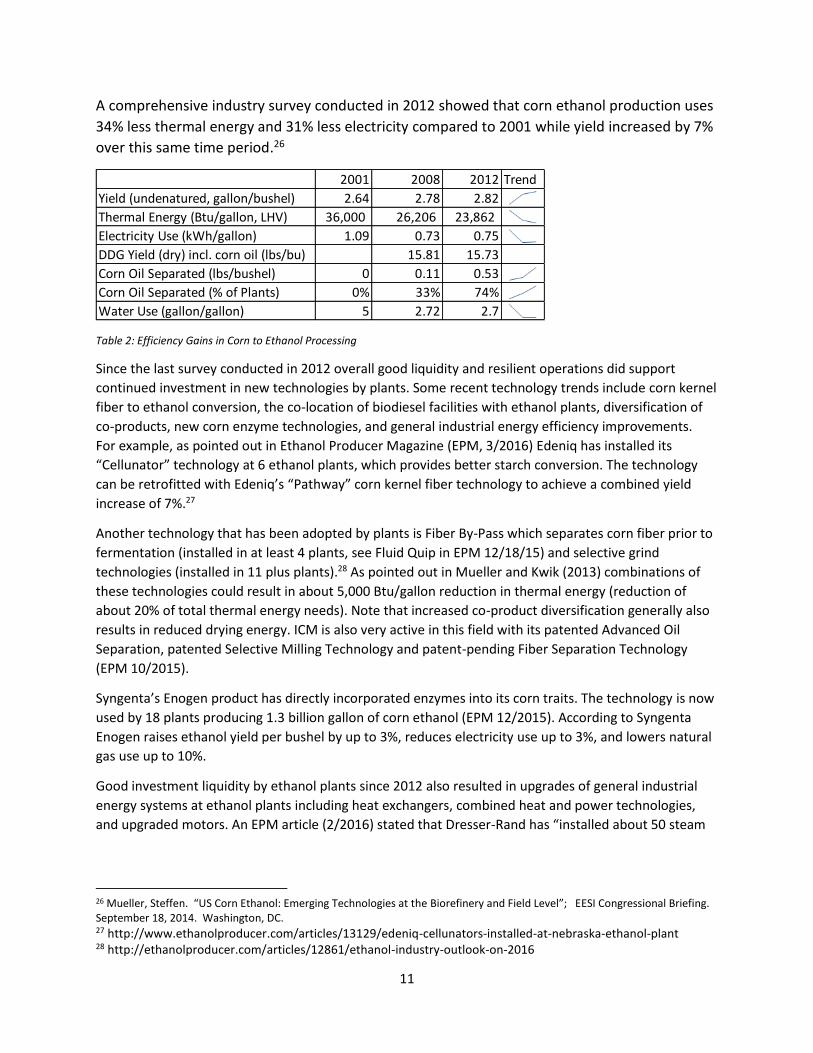
A comprehensive industry survey conducted in 2012 showed that corn ethanol production uses
34% less thermal energy and 31% less electricity compared to 2001 while yield increased by 7%
over this same time period.26
Table 2: Efficiency Gains in Corn to Ethanol Processing
Since the last survey conducted in 2012 overall good liquidity and resilient operations did support
continued investment in new technologies by plants. Some recent technology trends include corn kernel
fiber to ethanol conversion, the co-location of biodiesel facilities with ethanol plants, diversification of
co-products, new corn enzyme technologies, and general industrial energy efficiency improvements.
For example, as pointed out in Ethanol Producer Magazine (EPM, 3/2016) Edeniq has installed its
“Cellunator” technology at 6 ethanol plants, which provides better starch conversion. The technology
can be retrofitted with Edeniq’s “Pathway” corn kernel fiber technology to achieve a combined yield
increase of 7%.27
Another technology that has been adopted by plants is Fiber By-Pass which separates corn fiber prior to
fermentation (installed in at least 4 plants, see Fluid Quip in EPM 12/18/15) and selective grind
technologies (installed in 11 plus plants).28 As pointed out in Mueller and Kwik (2013) combinations of
these technologies could result in about 5,000 Btu/gallon reduction in thermal energy (reduction of
about 20% of total thermal energy needs). Note that increased co-product diversification generally also
results in reduced drying energy. ICM is also very active in this field with its patented Advanced Oil
Separation, patented Selective Milling Technology and patent-pending Fiber Separation Technology
(EPM 10/2015).
Syngenta’s Enogen product has directly incorporated enzymes into its corn traits. The technology is now
used by 18 plants producing 1.3 billion gallon of corn ethanol (EPM 12/2015). According to Syngenta
Enogen raises ethanol yield per bushel by up to 3%, reduces electricity use up to 3%, and lowers natural
gas use up to 10%.
Good investment liquidity by ethanol plants since 2012 also resulted in upgrades of general industrial
energy systems at ethanol plants including heat exchangers, combined heat and power technologies,
and upgraded motors. An EPM article (2/2016) stated that Dresser-Rand has “installed about 50 steam
26 Mueller, Steffen. “US Corn Ethanol: Emerging Technologies at the Biorefinery and Field Level”; EESI Congressional Briefing. September 18, 2014. Washington, DC. 27 http://www.ethanolproducer.com/articles/13129/edeniq-cellunators-installed-at-nebraska-ethanol-plant 28 http://ethanolproducer.com/articles/12861/ethanol-industry-outlook-on-2016
2001 2008 2012 Trend
Yield (undenatured, gallon/bushel) 2.64 2.78 2.82
Thermal Energy (Btu/gallon, LHV) 36,000 26,206 23,862
Electricity Use (kWh/gallon) 1.09 0.73 0.75
DDG Yield (dry) incl. corn oil (lbs/bu) 15.81 15.73
Corn Oil Separated (lbs/bushel) 0 0.11 0.53
Corn Oil Separated (% of Plants) 0% 33% 74%
Water Use (gallon/gallon) 5 2.72 2.7

12
turbine generator sets in various corn-to-ethanol plants in the U.S. and a few in other countries with
“interest building again.”
Results from the last three surveys (Figure 3) of the ethanol industry produced a close to linear trend in
energy efficiency improvements at plants. Given the good liquidity in the industry over the last three
years and the energy savings associated with many new technologies installed at plants a close to linear
interpolation of plant efficiencies seems appropriate (note regression shows small, exponential
characteristics of learning curves). This would indicate that the US corn ethanol industry of today, on
average, consumes about 21,000 Btu/gallon of thermal energy (a 12% reduction over 2012 and a 42%
reduction over 2001). Note that this is an average of all processes and plant types and includes facilities
that sell wet DDGS. Financially, reduced energy costs and increased value from co-product
diversification serves to stabilize and even increase margins. Table 3 shows the impact of plant efficiency
improvements on the GHG profile compared to the original RFS2 modeling efforts.
Efficiency improvements during the corn production phase have also been documented. These include
more accurate and targeted delivery of chemicals and agricultural inputs as well as modern high-yielding
corn hybrids.
Figure 3: Projected Energy Efficiency Improvements based on Historic Trends
Table 3: Advances in Plant Efficiencies
EPA RFS2 Values
Latest Research
gCO2e/MJ
Domestic Soil Carbon 29.4 15-30* *energy efficiency improvements and coproduct diversification have lead to a multitude of different plant pathways. Corn oil
separation technology if sold into the biodiesel markets can generate significant co-product credits.

13
Baseline Time Accounting
Another recent debate that has the potential to significantly influence the impact from LUC
centers around the accounting method used for emissions over time. Researchers and
regulatory agencies, including USEPA, have been assuming that biofuels production facilities
will only exist up to 30 years and therefore the LUC models have “amortized” emissions over
this time period. However, much longer operational periods for these facilities are likely.
Separately, recent peer-reviewed research by Kloverpris and Mueller have suggested the use of
a different emissions accounting method altogether. That method shows that increased
biofuels production in an environment of future land use needs for food simply accelerates
anticipated land use needs and by quantifying these effects avoids the use of an arbitrary
amortization period. This alternate “baseline time accounting method” substantially reduces
emissions (by up to 50%) associated with biofuels production.29
An attempt was made to refute the peer reviewed paper’s findings in a letter to the editor.30
The comments were refuted again by the authors in the same journal. Importantly, a recent
peer reviewed paper by European researchers Schmidt, Weidema, and Brandao strongly but
independently supported the key findings of the original publication, including the avoidance of
an arbitrary amortization period.31
Current Life Cycle Modeling Results for Corn-based Ethanol
Life cycle methodologies have been refined to allow for proper treatment of the latest
feedstock production and conversion practices.32 Expansion of the model boundaries allows for
proper accounting of co-products produced from an acre going into biofuels production,
including stover removal for animal feed or cellulosic ethanol production. Corn oil separated at
the front end or back end at an ethanol plant is often used as animal feed or as feedstock for
biodiesel production. Finally, permanent soil carbon sequestration effects on high rotation corn
acres have been considered in life cycle modeling efforts.
GREET shows that ethanol produced from corn grain and corn stover provides substantial GHG
benefits over gasoline. The latest version of GREET benefits from updated soil carbon modeling
results that provide more refined predictions of carbon stock changes from biofuels production
as well as updated economic models that show reduced land area requirements for corn
29 Jesper Hedal Kløverpris and Steffen Mueller; “Baseline time accounting: Considering global land use dynamics when estimating the climate impact of indirect land use change caused by biofuels”; Int J Life Cycle Assess DOI 10.1007/s11367-012-0488-6; published September 2012. 30 Jeremy Martin; “Regarding your article “Baseline time accounting: considering global land use dynamics when estimating the climate impact of indirect land use change caused by biofuels.” Int J Life Cycle Assess (2013) 18:1279 doi: 10.1007/s11367-012-0488-6 31 Jannick H. Schmidt` Bo P. Weidema, Miguel Brandao; “A framework for modelling indirect land use changes in Life Cycle Assessment”; Journal of Cleaner Production xxx (2015) 1e9 32 Steffen Mueller, Stefan Unnasch, Wallace E. Tyner, Jennifer Pont and Jane M-F Johnson; “Handling of co-products in life cycle analysis in an evolving co-product market: A case study with corn stover removal”; Advances in Applied Agricultural Science, Volume 03 (2015), Issue 05, 08-21

14
ethanol production.33,34, 35 As a result, the latest version of GREET shows life cycle emissions for
average US produced corn ethanol in the range of 63.5‒66.4 gCO2e/MJ, which is over 30% less
than the 94 gCO2e/MJ value for gasoline.
GREET now also includes a combined stover and grain ethanol pathway.36 This latest data
shows that ethanol produced at a combined grain and stover ethanol plant emits life cycle
emissions of 50 gCO2e/MJ. In a further refinement, GREET shows that ethanol produced on
acres with either cover crops or manure as land management changes (LMC) will produce
emissions of 48 or 47 gCO2e/MJ, respectively.37 This is a 50% reduction over gasoline. A
marginal allocation of emissions emphasizes the low GHG impact associated with stover
removal.
Table 4: Life cycle emissions of combined grain and stover ethanol production
LMC with LUC (g CO
2e MJ
-1
)
LMC without LUC (g CO2e MJ
-1
)
Baseline Cover crop Manure Baseline Cover crop Manure
Combined Gallon
50 48 47 44 42 42
Marginal Allocation
Grain Ethanol 55 55 55 47 47 47
Stover Ethanol 30 17 12 31 18 12
Energy Allocation
Grain Ethanol 52 50 50 44 41 42
Stover Ethanol 50 49 46 51 50 47
As mentioned in the introduction of this report, domestic policy instruments such as the RFS2
have helped reduce GHG emissions by fostering the use of biofuels. GREET has also been
parameterized by researchers to document the overall savings. A recent study issued by the
33 Steffen Mueller and Jennifer Dunn; ”Soil Carbon Sequestration and Land Use Change Associated with Biofuels Production”; presented at the CRC Workshop on Life Cycle Analysis of Transportation Fuels; Argonne National Laboratory, October 28, 2015 34 Qin, Z., Dunn, J. B., Kwon, H., Mueller, S. and Wander, M. M. (2015;, “Soil carbon sequestration and land use change associated with biofuel production: empirical evidence”; GCB Bioenergy. doi: 10.1111/gcbb.12237 35 Qin, Z., Dunn, J. B., Kwon, H., Mueller, S. and Wander, M. M. (2016); “Influence of spatially-dependent, modeled soil carbon emission factors on life-cycle greenhouse gas emissions of corn and cellulosic ethanol”; GCB Bioenergy. Accepted Author Manuscript. doi:10.1111/gcbb.12333 36 Zhangcai Qin, Christina E. Canter, Jennifer B. Dunn, Steffen Mueller, Ho-young Kwon, Jeongwoo Han, Michelle Wander, and Michael Wang; “Incorporating Agricultural Management Practices into the Assessment of Soil Carbon Change and Life-Cycle Greenhouse Gas Emissions of Corn Stover Ethanol Production”; Argonne National Laboratory, September 2015, ANL/ESD-15/26 37 Steffen Mueller and Jennifer Dunn. “CCLUB Evolution”; GREET User Workshop, Argonne National Laboratory, October 15-16

15
Renewable Fuels Association estimates biofuels consumed under the RFS2 have reduced U.S.
GHG emissions by 354 million metric tons of CO2e since 2008, which that study equates to the
annual emissions from 74 million passenger cars.38
Water Use
Figure 4 below shows the water use at ethanol plants (gallons of water per gallon of ethanol produced). Water use has decreased by half since the early dry grind plant installations39,40,41,42. Cooling water recycling, reverse osmosis, and reuse of filter backwash water are cited as technologies that contribute to this trend.43
Figure 4: Trends in water use within ethanol plants (1998 – 2012). Source: Richard Nelson, KS State University
38 http://www.ethanolrfa.org/2015/11/analysis-rfs2-implementation-has-reduced-ghg-emissions-by-354-million-metric-tons/ 39 University of Illinois Extension. March 2009. Water Use for Ethanol Production 40 Aden, Andy. September/October 2007. Water Usage for Current and Future Ethanol Production. Southwest Hydrology. 41 http://ethanolrfa.org/page/-/PDFs/RFA%202013%20Ethanol%20Industry%20Outlook.pdf?nocdn=1 42 Mueller, Steffen and Kwik, John. (2013). 2012 Corn Ethanol: Emerging Plant Energy and Environmental Technologies. University of Illinois – Chicago Energy Resources Center. Available online: http://www.erc.uic.edu/PDF/mueller/2012_corn_ethanol_draft4_10_2013.pdf. 43 Ethanol Producer Magazine (6/2012); Dropping Water Use - Ethanol producers balance cost and conservation when reducing consumption, http://www.ethanolproducer.com/articles/8860/dropping-water-use