Representation of Geometric Borders in the Developing Rat · in the Developing Rat Tale L....
8
Neuron Report Representation of Geometric Borders in the Developing Rat Tale L. Bjerknes, 1 Edvard I. Moser, 1 and May-Britt Moser 1, * 1 Kavli Institute for Systems Neuroscience, Norwegian University of Science and Technology, NO-7489 Trondheim, Norway *Correspondence: [email protected] http://dx.doi.org/10.1016/j.neuron.2014.02.014 SUMMARY Local space is represented by a number of function- ally specific cell types, including place cells in the hippocampus and grid cells, head direction cells, and border cells in the medial entorhinal cortex (MEC). These cells form a functional map of external space already at the time when rat pups leave the nest for the first time in their life, at the age of 2.5 weeks. However, while place cells have adult- like firing fields from the outset, grid cells have irreg- ular and variable fields until the fourth week, raising doubts about their contribution to place cell firing at young age. Recording in MEC of juvenile rats, we show that, unlike grid cells, border cells express adult-like firing fields from the first days of exposure to an open environment, at postnatal days 16–18. Thus, spatial signals from border cells may be suffi- cient to maintain spatially localized firing in juvenile hippocampal place cells. INTRODUCTION An animal’s position in the local environment is monitored by a spectrum of functionally specific cell types in the hippocampus and the adjacent parahippocampal areas, particularly the MEC. In the hippocampus, place cells fire selectively when the animal visits one or a few specific locations of the local environment (O’Keefe and Dostrovsky, 1971). In the MEC, grid cells fire at mul- tiple locations that, for each cell, define a hexagonal grid that tes- sellates the entire space available to the animal (Hafting et al., 2005). Although the majority of cells in superficial MEC layers are grid cells (Sargolini et al., 2006), these cells intermingle with border cells, which fire whenever the animal comes close to one or several local geometric boundaries, such as the walls of the recording enclosure (Savelli et al., 2008; Solstad et al., 2008). In layer III and deeper MEC layers, grid cells (Sargolini et al., 2006) also mix with head direction cells, which fire only when the animal faces a given direction (Ranck, 1985; Taube et al., 1990). The presence of multiple spatial cell types within the same brain system raises questions about their interrelationships. Place cells are probably generated from spatial inputs from the entorhinal cortex, the main cortical source of input to the hippo- campus. The abundance of grid cells in the superficial layers of MEC points to grid cells as a likely source for the place cell signal. In several early models, place cell formation was explained by a Fourier mechanism in which periodic firing fields from grid cells with different grid spacing were linearly combined to generate single fields in hippocampal target neurons (O’Keefe and Burgess, 2005; Fuhs and Touretzky, 2006; McNaughton et al., 2006; Solstad et al., 2006). This possibility has been challenged, however, by the observation that place cells mature faster than grid cells in young animals (Langston et al., 2010; Wills et al., 2010). When rat pups leave the nest for the first time at postnatal day 16 or 17 (P16–P17), many place cells already have sharply confined firing fields similar to those of adult animals. In contrast, grid cells are far from fully developed. Firing fields are irregular and variable in size and shape and although some spatial period- icity can be observed in some neurons, adult-like patterns do not appear until approximately 1.5 weeks later, near the age of 4 weeks. The lack of sharply confined grid outputs in the 2.5- to 4-week-old nervous system has raised the possibility that juvenile place cells receive spatial information from other func- tional cell populations, such as the border cells of the MEC. The present study was designed to test whether functional border cells are present at this developmental stage. We find that border cells have adult-like firing fields from the very first days of outbound navigation, at 2.5 weeks of age. RESULTS Neural activity was recorded from the MEC of nine female and 11 male juvenile Long-Evans rats and from four adult male rats (Table S1 available online). The pups were implanted with tetrodes from P14, around the time when the eyelids unseal. On the subsequent day, the tetrodes were moved toward the superficial layers of MEC (Figures 1A and S1). Once single neurons could be isolated at appropriate depths, the pups were placed in a 70 cm 3 70 cm arena with 50 cm high walls and spike activity was recorded. One rat was introduced to the box already on P15, 11 rats started on P16, and one on P17. Seven rats started at P24–P26. MEC cells could be recorded from P16 in three rats, from P17 in five rats, from P18 in three rats, and from P19 in two rats. The rats explored the entire box by the end of the first age block (P16–P18). There was little change in running pattern during sub- sequent age blocks (speed: P16–P18: 9.6 ± 0.3 cm/s; P34–P36: 11.0 ± 0.7 cm/s; adult: 12.2 ± 0.2 cm/s, ANOVA: F(7,75) = 2.41, p < 0.05; coverage: 90.5% ± 0.3%, 92.4% ± 1.6%, and 91.6% ± 0.6%, respectively, F(7,75) = 0.61, p = 0.80). Average firing rate for all cells increased significantly with age (P16–P18: 1.17 ± 0.08 Hz; P34–36: 1.29 ± 0.11 Hz; adults: 1.72 ± 0.10 Hz; F(7(1,105) = 3.12, p < 0.005)). Neuron 82, 71–78, April 2, 2014 ª2014 Elsevier Inc. 71
Transcript of Representation of Geometric Borders in the Developing Rat · in the Developing Rat Tale L....

Neuron
Report
Representation of Geometric Bordersin the Developing RatTale L. Bjerknes,1 Edvard I. Moser,1 and May-Britt Moser1,*1Kavli Institute for Systems Neuroscience, Norwegian University of Science and Technology, NO-7489 Trondheim, Norway
*Correspondence: [email protected]
http://dx.doi.org/10.1016/j.neuron.2014.02.014
SUMMARY
Local space is represented by a number of function-ally specific cell types, including place cells in thehippocampus and grid cells, head direction cells,and border cells in the medial entorhinal cortex(MEC). These cells form a functional map of externalspace already at the time when rat pups leave thenest for the first time in their life, at the age of2.5 weeks. However, while place cells have adult-like firing fields from the outset, grid cells have irreg-ular and variable fields until the fourth week, raisingdoubts about their contribution to place cell firingat young age. Recording in MEC of juvenile rats, weshow that, unlike grid cells, border cells expressadult-like firing fields from the first days of exposureto an open environment, at postnatal days 16–18.Thus, spatial signals from border cells may be suffi-cient to maintain spatially localized firing in juvenilehippocampal place cells.
INTRODUCTION
An animal’s position in the local environment is monitored by
a spectrum of functionally specific cell types in the hippocampus
and theadjacentparahippocampal areas, particularly theMEC. In
the hippocampus, place cells fire selectively when the animal
visits one or a few specific locations of the local environment
(O’Keefe andDostrovsky, 1971). In theMEC, grid cells fire atmul-
tiple locations that, for each cell, define a hexagonal grid that tes-
sellates the entire space available to the animal (Hafting et al.,
2005). Although the majority of cells in superficial MEC layers
are grid cells (Sargolini et al., 2006), these cells intermingle with
border cells, which fire whenever the animal comes close to one
or several local geometric boundaries, such as the walls of the
recording enclosure (Savelli et al., 2008; Solstad et al., 2008). In
layer III and deeper MEC layers, grid cells (Sargolini et al., 2006)
alsomix with head direction cells, which fire onlywhen the animal
faces a given direction (Ranck, 1985; Taube et al., 1990).
The presence of multiple spatial cell types within the same
brain system raises questions about their interrelationships.
Place cells are probably generated from spatial inputs from the
entorhinal cortex, the main cortical source of input to the hippo-
campus. The abundance of grid cells in the superficial layers of
MECpoints to grid cells as a likely source for the place cell signal.
In several early models, place cell formation was explained by a
Fourier mechanism in which periodic firing fields from grid cells
with different grid spacing were linearly combined to generate
single fields in hippocampal target neurons (O’Keefe and
Burgess, 2005; Fuhs and Touretzky, 2006; McNaughton et al.,
2006; Solstad et al., 2006). This possibility has been challenged,
however, by the observation that place cells mature faster than
grid cells in young animals (Langston et al., 2010; Wills et al.,
2010). When rat pups leave the nest for the first time at postnatal
day 16 or 17 (P16–P17), many place cells already have sharply
confined firing fields similar to those of adult animals. In contrast,
grid cells are far from fully developed. Firing fields are irregular
and variable in size and shape and although some spatial period-
icity can be observed in some neurons, adult-like patterns do not
appear until approximately 1.5 weeks later, near the age of
4 weeks. The lack of sharply confined grid outputs in the 2.5-
to 4-week-old nervous system has raised the possibility that
juvenile place cells receive spatial information from other func-
tional cell populations, such as the border cells of the MEC.
The present study was designed to test whether functional
border cells are present at this developmental stage. We find
that border cells have adult-like firing fields from the very first
days of outbound navigation, at 2.5 weeks of age.
RESULTS
Neural activity was recorded from the MEC of nine female and 11
male juvenile Long-Evans rats and from four adultmale rats (Table
S1 available online). The pups were implanted with tetrodes from
P14, around the timewhen the eyelids unseal. On the subsequent
day, the tetrodesweremoved toward thesuperficial layersofMEC
(Figures 1A and S1). Once single neurons could be isolated at
appropriate depths, the pups were placed in a 70 cm 3 70 cm
arena with 50 cm high walls and spike activity was recorded.
One rat was introduced to the box already on P15, 11 rats started
on P16, and one on P17. Seven rats started at P24–P26.
MEC cells could be recorded from P16 in three rats, from P17
in five rats, from P18 in three rats, and from P19 in two rats. The
rats explored the entire box by the end of the first age block
(P16–P18). There was little change in running pattern during sub-
sequent age blocks (speed: P16–P18: 9.6 ± 0.3 cm/s; P34–P36:
11.0 ± 0.7 cm/s; adult: 12.2 ± 0.2 cm/s, ANOVA: F(7,75) = 2.41,
p < 0.05; coverage: 90.5% ± 0.3%, 92.4% ± 1.6%, and 91.6% ±
0.6%, respectively, F(7,75) = 0.61, p = 0.80). Average firing rate
for all cells increased significantly with age (P16–P18: 1.17 ±
0.08 Hz; P34–36: 1.29 ± 0.11 Hz; adults: 1.72 ± 0.10 Hz;
F(7(1,105) = 3.12, p < 0.005)).
Neuron 82, 71–78, April 2, 2014 ª2014 Elsevier Inc. 71
A B
C
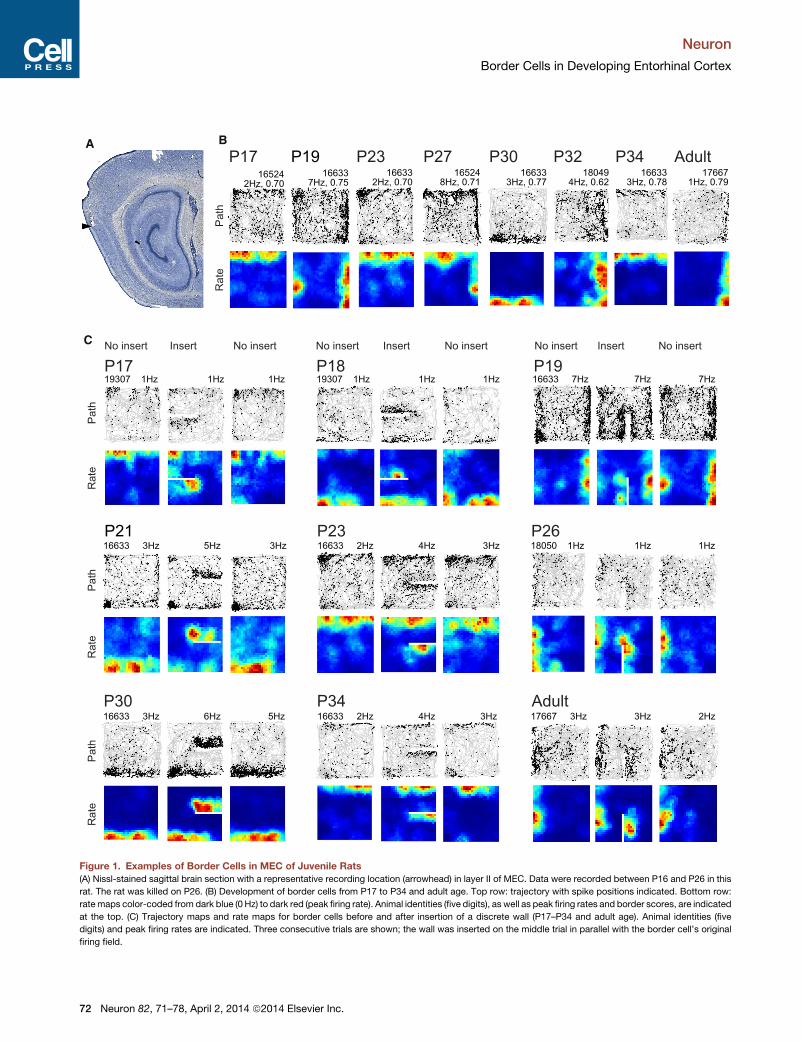
Figure 1. Examples of Border Cells in MEC of Juvenile Rats
(A) Nissl-stained sagittal brain section with a representative recording location (arrowhead) in layer II of MEC. Data were recorded between P16 and P26 in this
rat. The rat was killed on P26. (B) Development of border cells from P17 to P34 and adult age. Top row: trajectory with spike positions indicated. Bottom row:
rate maps color-coded from dark blue (0 Hz) to dark red (peak firing rate). Animal identities (five digits), as well as peak firing rates and border scores, are indicated
at the top. (C) Trajectory maps and rate maps for border cells before and after insertion of a discrete wall (P17–P34 and adult age). Animal identities (five
digits) and peak firing rates are indicated. Three consecutive trials are shown; the wall was inserted on the middle trial in parallel with the border cell’s original
firing field.
Neuron
Border Cells in Developing Entorhinal Cortex
72 Neuron 82, 71–78, April 2, 2014 ª2014 Elsevier Inc.
A B C
D E
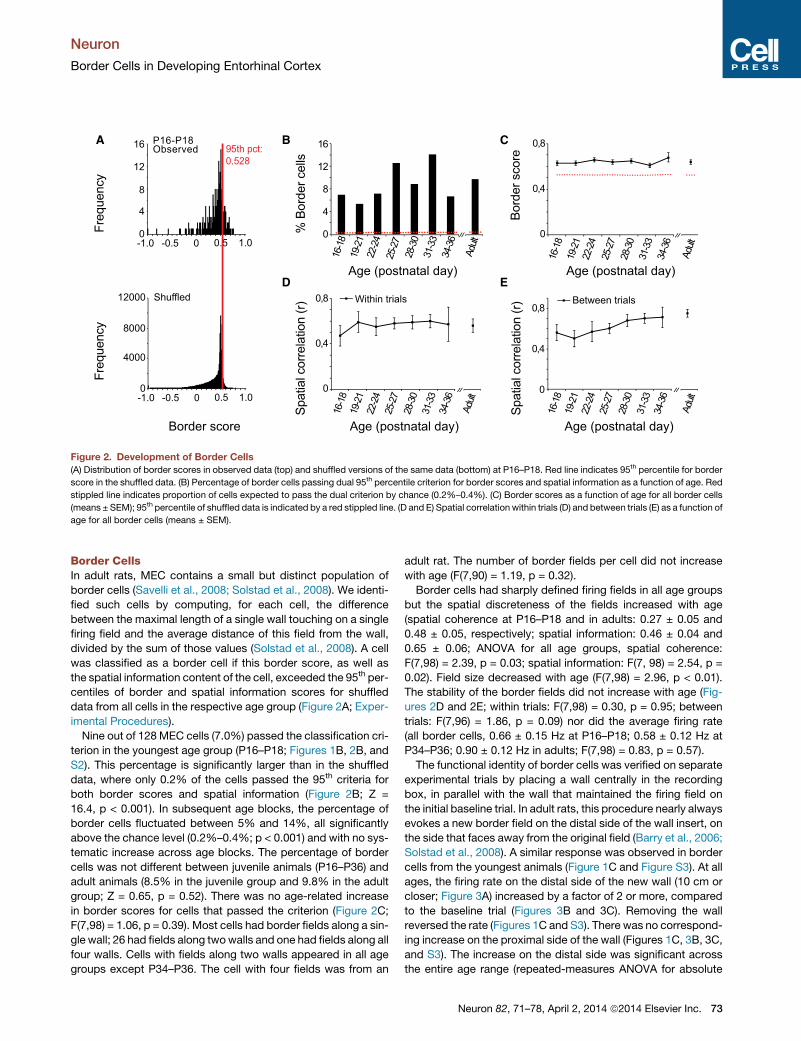
Figure 2. Development of Border Cells
(A) Distribution of border scores in observed data (top) and shuffled versions of the same data (bottom) at P16–P18. Red line indicates 95th percentile for border
score in the shuffled data. (B) Percentage of border cells passing dual 95th percentile criterion for border scores and spatial information as a function of age. Red
stippled line indicates proportion of cells expected to pass the dual criterion by chance (0.2%–0.4%). (C) Border scores as a function of age for all border cells
(means ± SEM); 95th percentile of shuffled data is indicated by a red stippled line. (D and E) Spatial correlation within trials (D) and between trials (E) as a function of
age for all border cells (means ± SEM).
Neuron
Border Cells in Developing Entorhinal Cortex
Border CellsIn adult rats, MEC contains a small but distinct population of
border cells (Savelli et al., 2008; Solstad et al., 2008). We identi-
fied such cells by computing, for each cell, the difference
between the maximal length of a single wall touching on a single
firing field and the average distance of this field from the wall,
divided by the sum of those values (Solstad et al., 2008). A cell
was classified as a border cell if this border score, as well as
the spatial information content of the cell, exceeded the 95th per-
centiles of border and spatial information scores for shuffled
data from all cells in the respective age group (Figure 2A; Exper-
imental Procedures).
Nine out of 128 MEC cells (7.0%) passed the classification cri-
terion in the youngest age group (P16–P18; Figures 1B, 2B, and
S2). This percentage is significantly larger than in the shuffled
data, where only 0.2% of the cells passed the 95th criteria for
both border scores and spatial information (Figure 2B; Z =
16.4, p < 0.001). In subsequent age blocks, the percentage of
border cells fluctuated between 5% and 14%, all significantly
above the chance level (0.2%–0.4%; p < 0.001) and with no sys-
tematic increase across age blocks. The percentage of border
cells was not different between juvenile animals (P16–P36) and
adult animals (8.5% in the juvenile group and 9.8% in the adult
group; Z = 0.65, p = 0.52). There was no age-related increase
in border scores for cells that passed the criterion (Figure 2C;
F(7,98) = 1.06, p = 0.39). Most cells had border fields along a sin-
gle wall; 26 had fields along twowalls and one had fields along all
four walls. Cells with fields along two walls appeared in all age
groups except P34–P36. The cell with four fields was from an
adult rat. The number of border fields per cell did not increase
with age (F(7,90) = 1.19, p = 0.32).
Border cells had sharply defined firing fields in all age groups
but the spatial discreteness of the fields increased with age
(spatial coherence at P16–P18 and in adults: 0.27 ± 0.05 and
0.48 ± 0.05, respectively; spatial information: 0.46 ± 0.04 and
0.65 ± 0.06; ANOVA for all age groups, spatial coherence:
F(7,98) = 2.39, p = 0.03; spatial information: F(7, 98) = 2.54, p =
0.02). Field size decreased with age (F(7,98) = 2.96, p < 0.01).
The stability of the border fields did not increase with age (Fig-
ures 2D and 2E; within trials: F(7,98) = 0.30, p = 0.95; between
trials: F(7,96) = 1.86, p = 0.09) nor did the average firing rate
(all border cells, 0.66 ± 0.15 Hz at P16–P18; 0.58 ± 0.12 Hz at
P34–P36; 0.90 ± 0.12 Hz in adults; F(7,98) = 0.83, p = 0.57).
The functional identity of border cells was verified on separate
experimental trials by placing a wall centrally in the recording
box, in parallel with the wall that maintained the firing field on
the initial baseline trial. In adult rats, this procedure nearly always
evokes a new border field on the distal side of the wall insert, on
the side that faces away from the original field (Barry et al., 2006;
Solstad et al., 2008). A similar response was observed in border
cells from the youngest animals (Figure 1C and Figure S3). At all
ages, the firing rate on the distal side of the new wall (10 cm or
closer; Figure 3A) increased by a factor of 2 or more, compared
to the baseline trial (Figures 3B and 3C). Removing the wall
reversed the rate (Figures 1C and S3). There was no correspond-
ing increase on the proximal side of the wall (Figures 1C, 3B, 3C,
and S3). The increase on the distal side was significant across
the entire age range (repeated-measures ANOVA for absolute
Neuron 82, 71–78, April 2, 2014 ª2014 Elsevier Inc. 73
A B C
Normalized
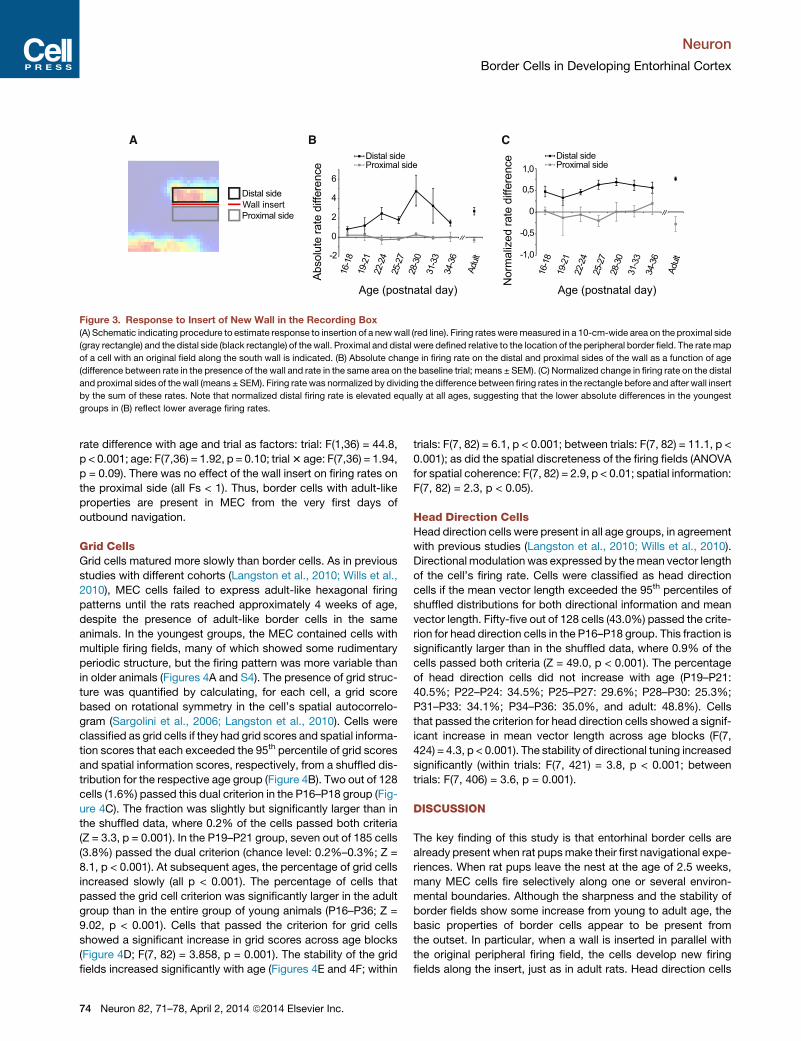
Figure 3. Response to Insert of New Wall in the Recording Box
(A) Schematic indicating procedure to estimate response to insertion of a newwall (red line). Firing rates weremeasured in a 10-cm-wide area on the proximal side
(gray rectangle) and the distal side (black rectangle) of the wall. Proximal and distal were defined relative to the location of the peripheral border field. The ratemap
of a cell with an original field along the south wall is indicated. (B) Absolute change in firing rate on the distal and proximal sides of the wall as a function of age
(difference between rate in the presence of the wall and rate in the same area on the baseline trial; means ± SEM). (C) Normalized change in firing rate on the distal
and proximal sides of thewall (means ± SEM). Firing rate was normalized by dividing the difference between firing rates in the rectangle before and after wall insert
by the sum of these rates. Note that normalized distal firing rate is elevated equally at all ages, suggesting that the lower absolute differences in the youngest
groups in (B) reflect lower average firing rates.
Neuron
Border Cells in Developing Entorhinal Cortex
rate difference with age and trial as factors: trial: F(1,36) = 44.8,
p < 0.001; age: F(7,36) = 1.92, p = 0.10; trial3 age: F(7,36) = 1.94,
p = 0.09). There was no effect of the wall insert on firing rates on
the proximal side (all Fs < 1). Thus, border cells with adult-like
properties are present in MEC from the very first days of
outbound navigation.
Grid CellsGrid cells matured more slowly than border cells. As in previous
studies with different cohorts (Langston et al., 2010; Wills et al.,
2010), MEC cells failed to express adult-like hexagonal firing
patterns until the rats reached approximately 4 weeks of age,
despite the presence of adult-like border cells in the same
animals. In the youngest groups, the MEC contained cells with
multiple firing fields, many of which showed some rudimentary
periodic structure, but the firing pattern was more variable than
in older animals (Figures 4A and S4). The presence of grid struc-
ture was quantified by calculating, for each cell, a grid score
based on rotational symmetry in the cell’s spatial autocorrelo-
gram (Sargolini et al., 2006; Langston et al., 2010). Cells were
classified as grid cells if they had grid scores and spatial informa-
tion scores that each exceeded the 95th percentile of grid scores
and spatial information scores, respectively, from a shuffled dis-
tribution for the respective age group (Figure 4B). Two out of 128
cells (1.6%) passed this dual criterion in the P16–P18 group (Fig-
ure 4C). The fraction was slightly but significantly larger than in
the shuffled data, where 0.2% of the cells passed both criteria
(Z = 3.3, p = 0.001). In the P19–P21 group, seven out of 185 cells
(3.8%) passed the dual criterion (chance level: 0.2%–0.3%; Z =
8.1, p < 0.001). At subsequent ages, the percentage of grid cells
increased slowly (all p < 0.001). The percentage of cells that
passed the grid cell criterion was significantly larger in the adult
group than in the entire group of young animals (P16–P36; Z =
9.02, p < 0.001). Cells that passed the criterion for grid cells
showed a significant increase in grid scores across age blocks
(Figure 4D; F(7, 82) = 3.858, p = 0.001). The stability of the grid
fields increased significantly with age (Figures 4E and 4F; within
74 Neuron 82, 71–78, April 2, 2014 ª2014 Elsevier Inc.
trials: F(7, 82) = 6.1, p < 0.001; between trials: F(7, 82) = 11.1, p <
0.001); as did the spatial discreteness of the firing fields (ANOVA
for spatial coherence: F(7, 82) = 2.9, p < 0.01; spatial information:
F(7, 82) = 2.3, p < 0.05).
Head Direction CellsHead direction cells were present in all age groups, in agreement
with previous studies (Langston et al., 2010; Wills et al., 2010).
Directional modulation was expressed by themean vector length
of the cell’s firing rate. Cells were classified as head direction
cells if the mean vector length exceeded the 95th percentiles of
shuffled distributions for both directional information and mean
vector length. Fifty-five out of 128 cells (43.0%) passed the crite-
rion for head direction cells in the P16–P18 group. This fraction is
significantly larger than in the shuffled data, where 0.9% of the
cells passed both criteria (Z = 49.0, p < 0.001). The percentage
of head direction cells did not increase with age (P19–P21:
40.5%; P22–P24: 34.5%; P25–P27: 29.6%; P28–P30: 25.3%;
P31–P33: 34.1%; P34–P36: 35.0%, and adult: 48.8%). Cells
that passed the criterion for head direction cells showed a signif-
icant increase in mean vector length across age blocks (F(7,
424) = 4.3, p < 0.001). The stability of directional tuning increased
significantly (within trials: F(7, 421) = 3.8, p < 0.001; between
trials: F(7, 406) = 3.6, p = 0.001).
DISCUSSION
The key finding of this study is that entorhinal border cells are
already present when rat pupsmake their first navigational expe-
riences. When rat pups leave the nest at the age of 2.5 weeks,
many MEC cells fire selectively along one or several environ-
mental boundaries. Although the sharpness and the stability of
border fields show some increase from young to adult age, the
basic properties of border cells appear to be present from
the outset. In particular, when a wall is inserted in parallel with
the original peripheral firing field, the cells develop new firing
fields along the insert, just as in adult rats. Head direction cells

A
B C D
E F
Figure 4. Development of Grid Cells
(A) Development of grid cells. Animal identities, peak firing rates, and grid scores are indicated at the top. Top row: trajectory with spike positions. Middle row:
color-coded rate maps (as in Figure 1B). Bottom row: color-coded spatial autocorrelograms (dark blue is�1, dark red is +1). (B) Distribution of grid scores in the
observed data at P16-P18 (top) and in shuffled versions of the same data; 95th percentile of the shuffled data is indicated by a red line. (C) Percentage of grid cells
passing dual 95th percentile criterion for grid scores and spatial information as a function of age. Red stippled line indicates proportion of cells expected to pass
the dual criterion by chance (0.2%–0.3%). (D) Grid scores as a function of age for all grid cells (means ± SEM; 95th percentile of shuffled data indicated by red
stippled line). (E)Within-trial spatial correlations as a function of age for all grid cells (means ± SEM). (F) Between-trial spatial correlations as a function of age for all
grid cells (means ± SEM).
Neuron
Border Cells in Developing Entorhinal Cortex
were also present from the outset. In contrast, grid cells,
recorded in the same animals, matured slowly, showing only
minimal spatial periodicity during the first week of outbound
exploration. The slow maturation of the grid cells and the fast
expression of directional modulation confirm previous observa-
tions (Langston et al., 2010; Wills et al., 2010).
The presence of border cells in the immature MEC has impli-
cations for mechanisms of place cells. Place cells receive the
majority of their cortical inputs from the entorhinal cortex (Witter
and Amaral, 2004). Spatial signals are thought to originate pri-
marily in the medial part of the entorhinal cortex (Fyhn et al.,
2004; Hafting et al., 2005; Hargreaves et al., 2005). The fact
that the majority of hippocampus-projecting spatially modulated
cells in this area are grid cells (Sargolini et al., 2006; Zhang et al.,
2013) has raised the possibility that place cells emerge by trans-
formation of inputs from grid cells. One class of models relies
on linear summation of impulses from cells with different grid
spacing but similar grid phase and grid orientation (O’Keefe
Neuron 82, 71–78, April 2, 2014 ª2014 Elsevier Inc. 75

Neuron
Border Cells in Developing Entorhinal Cortex
and Burgess, 2005; Fuhs and Touretzky, 2006; McNaughton
et al., 2006; Solstad et al., 2006). However, these models cannot
readily account for the fact that place cells mature faster than
grid cells in developing animals (Langston et al., 2010; Wills
et al., 2010), although with the addition of local circuit mecha-
nisms and Hebbian plasticity, weakly modulated and irregular
spatial inputs would in principle be sufficient to generate discrete
and stable place fields (Rolls et al., 2006; de Almeida et al., 2009;
Savelli and Knierim, 2010; Monaco and Abbott, 2011). The
present findings point to border cells as an alternative source
of spatial information to the hippocampus of young animals,
possibly with head direction cells as an additional source of
modulation. Only a small fraction of the entorhinal cell population
has properties defining them as border cells but retrograde
labeling suggests that the hippocampal projections of these cells
may be as dense as those of the more slowly developing grid
cells (Zhang et al., 2013). The present study, in conjunction
with the retrograde labeling study, suggests that these projec-
tions may be present from young age. Place cells may thus be
formed by inputs from both grid cells and border cells but in
the immature nervous system the border cells may provide the
most reliable spatial inputs. In adult animals, border cells may
provide sufficient spatial input to generate spatial firing fields in
hippocampal neurons under conditions when the periodicity of
the grid cells is compromised (Koenig et al., 2011).
Our observations revitalize the idea that spatially localized firing
is generated in place cells based on inputs fromcortical cells with
firing fields defined by their proximity to geometric boundaries
(O’Keefe andBurgess, 1996). Computationalmodels have shown
that such cells may be sufficient to generate place fields of any
shape and size at any location of the environment (Barry et al.,
2006; Hartley et al., 2000). One caveat, however, is that while
these models rely on inputs from cells with fields at a continuum
of distances from the geometric boundaries of the environment
(‘‘boundary vector cells’’), recordings in the MEC have so far
only identified cells with fields that line up along the walls of
the environment or very close to them (‘‘border/boundary’’ cells;
Savelli et al., 2008; Solstad et al., 2008; Zhang et al., 2013). Cells
with more extended fields have been reported in the subiculum
(Barry et al., 2006; Lever et al., 2009), but the subiculum has
only very limited projections back to the hippocampus (Witter
and Amaral, 2004). Border cells may thus contribute to localized
firing in place cells with fields at or near the periphery of the envi-
ronment, whereas central place fieldsmay rely more on other cell
types, such as grid cells, which fire with high spatial precision
throughout the arena. An implication of this possibility would be
that in young animals with immature grid cells, place cells may
be less discrete and less stable in the center of an open field
than along the boundaries. Preliminary data support this predic-
tion (Cacucci et al., 2013, Soc. Neurosci., abstract) but definite
tests may require larger open spaces than the ones used to esti-
mate spatial firing in rat pups in the present study.
EXPERIMENTAL PROCEDURES
Subjects
Neural activity was recorded from MEC in 24 Long-Evans rats (9 female, 15
male). Twenty of the rats were implanted between P13 and P25 and tested
76 Neuron 82, 71–78, April 2, 2014 ª2014 Elsevier Inc.
between P16 and P36. Individual rats were tested across multiple days
(P16–P36: 3–12 recording days, adult: 5–29 days). Four male rats were im-
planted as adults (3–4 months of age). All young animals were bred in-house;
two adults were imported from Charles River Laboratories. All experiments
were approved by the National Animal Research Authorities in Norway.
Postnatal day 0 (P0) was defined as the first day a new litter was observed.
Pregnant mothers were checked several times per day (8 a.m.–8 p.m.). Rat
pups lived with mother and siblings in transparent Plexiglas cages (55 3
45 3 35 cm), enriched with plastic toys, small fabric houses, and paper. At
P21, they were weaned from their mother and housed in same-sex groups in
transparent plastic cages (46 cm 3 40 cm 3 40 cm). A maximum of four ani-
mals from each litter were used for experiments. Litter sizes did not exceed
eight. Juvenile animals had free access to food and water; adults were mildly
food deprived. All rats were held on a 12 hr light/12 hr dark schedule. Testing
occurred in the dark phase.
Surgery
The rats were anesthetized in an induction chamber with 5% isoflurane and
2,000 ml/min room air, reduced to 3% with 1,200 to 1,400 ml/min room air
at the start of surgery. The animal received subcutaneous injections of bupiva-
caine (Marcaine) and carprofen (Rimadyl; in pups) or buprenorphine (Temge-
sic; in adults). The concentration of isoflurane was gradually reduced to 1%.
Depth of anesthesia was monitored by testing tail and pinch reflexes as well
as breathing.
Anesthetized rats were implanted with a single microdrive with four tetrodes
cut flat to the same level. Each tetrode was made of a 17 mmpolyimide-coated
platinum-iridium wire. The tetrodes were platinum plated to reduce imped-
ances to �200 kU at 1 kHz. A jeweler’s screw served as a ground electrode.
Tetrodes were implanted in MEC at an angle of 7�–9� in the posterior-to-ante-
rior direction in the sagittal plane, starting 0.3–0.4 mm in front of the transverse
sinus and 4.5–4.7 mm lateral to the midline. Initial tetrode depth was 1.8 mm
ventral to the dura. The implant was secured to the skull with jeweller’s screws
and dental cement. After the rat woke up from the anesthesia, the pup was
placed back tomother and siblings. The implant was wrapped in surgical tape.
Data Collection
Data collection started the day after surgery. The rat rested on a flower pot
covered by towels while signals were checked. The animal was connected
to the recording system via an AC-coupled unity-gain operational amplifier
close to the head, using a light-weight counterbalanced 16-channel cable
from the implant to the amplifier. In all age groups, including adults, tetrodes
were lowered in steps of 50 mm (maximum 200 mmper day) until single neurons
were isolated. The rat was then placed inside the recording arena. After
recording, the tetrodes were moved further. Each session lasted a maximum
of 2 hr.
Recorded signals were amplified 6,000 to 14,000 times and band-pass
filtered between 0.8 and 6.7 kHz. Triggered spikes were stored to disk at 48
kHz with a 32 bits time stamp. An overhead camera recorded the position of
one large and one small light-emitting-diode (LED) on the head stage. The
diodes were positioned 6 cm apart and aligned with the body axis.
Apparatus and Training Procedures
Data were recorded in a square enclosure (70 cm3 70 cm3 50 cm) with walls
covered by black adhesive plastic and a white plastic cue card (35 cm 3
50 cm) at a constant location. The box was in a constant location. Running
was maintained by crumbs of chocolate or vanilla biscuits. Each session con-
sisted of two to four 15 min trials. Between trials, the pups rested 2–20 min in
the flower pot and occasionally 20 additional min in a small cage with bedding
and water. The cable was not unplugged between trials. When a putative
border cell was identified on the first trial, a wall (35 cm 3 1 cm 3 50 cm)
was inserted centrally in the box on the next trial. The wall was placed in par-
allel with the peripheral wall along which the cell had its initial border field. Floor
and walls were washed with soapy water between trials.
Analysis of Spike and Position Data
Cell classification was performed manually using graphical cluster cutting
tools as described previously (Langston et al., 2010). Putative interneurons

Neuron
Border Cells in Developing Entorhinal Cortex
(identified by average rate and spike amplitude width) were not included in any
analysis. The rat’s position was tracked via LEDs on the rat’s headstage. All
data were speed filtered (epochs with speed lower than 2.5 cm/s or higher
than 100 cm/s were deleted). Position data were smoothed using a 21-sample
boxcar window filter (400 ms, 10 samples on each side). If the rat visited less
than 80% of the total number of position bins (each 2.5 cm3 2.5 cm), the trial
was excluded.
Rate Maps
Firing rate distributionswere determined by counting the number of spikes and
time spent in each 2.5 cm 3 2.5 cm bin, using a boxcar average over the sur-
rounding 5 3 5 bins (Langston et al., 2010). To improve the tradeoff between
blurring error and sampling error, an adaptive smoothing method was used
on the rate maps before field size and border scores were estimated (Skaggs
et al., 1996; Langston et al., 2010).
Spatial information content for the rate map, in bits per spike, was
calculated as
information content=X
i
pi
li
llog2
li
l
where li is themean firing rate of a unit in the i-th bin, l is the overall mean firing
rate, and pi is the probability of the animal being in the i-th bin (occupancy in the
i-th bin/total recording time) (Skaggs et al., 1993). Spatial coherence was esti-
mated as the mean correlation between firing rate of each bin and mean firing
rate in the eight adjacent bins (Muller and Kubie, 1989).
Analysis of Border Cells
Border cells were identified by computing, for each cell with an average rate
above 0.2 Hz, the difference between the maximal length of a wall touching
on any single firing field of the cell and the average distance of the field from
the nearest wall, divided by the sum of those values. Border scores thus
ranged from –1 for cells with infinitely small central fields to +1 for cells with infi-
nitely narrow fields that lined up perfectly along the entire wall. Firing fields
were defined as collections of neighboring pixels with firing rates higher than
20% of the cell’s peak firing rate and a size of at least 200 cm2.
Border cells were defined as cells with border scores exceeding chance
level, determined for each age group by a shuffling procedure. For each per-
mutation trial, the entire sequence of spikes fired by the cell was time shifted
along the animal’s path by a random interval between 20 s and the total trial
length minus 20 s, with the end of the trial wrapped to the beginning. A rate
map was then constructed, and spatial information content and border score
were determined. Distributions of spatial information and border scores were
generated for the entire set of permutations from all cells in the sample (400
permutations per cell), and 95th percentiles were determined for spatial infor-
mation as well as border scores. Cells were defined as border cells if (1) the
spatial information content in the recorded data was higher than the corre-
sponding 95th percentile in the shuffled data, and (2) the border score from
the recorded data was higher than the 95th percentile for border scores in
the shuffled data. Border cell stability was estimated by calculating the spatial
correlation between first and second half of the trial and between consecutive
trials in the same session.
Analysis of Grid Cells
The periodicity of the rate maps was evaluated for all cells with average rates
above 0.2 Hz by calculating a spatial autocorrelation map for each smoothed
rate map (Sargolini et al., 2006). The degree of spatial periodicity was deter-
mined for each recorded cell by taking a central circular sample of the autocor-
relogram, with the central peak excluded, and comparing rotated versions of
this sample (Sargolini et al., 2006; Langston et al., 2010). The Pearson correla-
tion of the circular sample with its rotation in a degrees was obtained for angles
of 60� and 120� on one side and 30�, 90�, and 150� on the other. The cell’s grid
score was defined as the minimum difference between any of the elements in
the first group and any of the elements in the second.
Grid cells were identified as cells in which (1) spatial information content and
(2) rotational-symmetry-based grid scores exceeded the 95th percentiles of
distributions of spatial information content and grid scores, respectively, in
shuffled versions of the same data. Shuffling was performed as for border
cells, with 400 permutation trials per recorded cell. Grid cell stability was esti-
mated by calculating the spatial correlation between the first and the second
half of individual trials or between consecutive trials.
Analysis of Head Direction Cells
The rat’s head direction was calculated for each tracker sample from the pro-
jection of the relative position of the two LEDs onto the horizontal plane. The
directional tuning function for each cell was obtained by plotting the firing
rate as a function of the rat’s directional heading. Maps for number of spikes
and time were smoothed individually with 14.5� mean window filter (14 bins
on each side). Directional information was calculated for each cell as for spatial
information content, with li as the mean firing rate of a unit in the i-th bin, l as
the overall mean firing rate, and pi as the frequency at which the animal’s head
pointed in the i-th directional bin. Directional stability was estimated by corre-
lating firing rates between the first and second half of the trial or between
consecutive trials.
Directional tuning was estimated by computing the length of the mean vec-
tor for the circular distribution of firing rate. Head direction cells were identified
as cells in which (1) directional information content and (2) mean vector length
exceeded the 95th percentiles of distributions of directional information con-
tent and mean vector lengths, respectively, in shuffled versions of the same
data. Shuffling was performed as for border cells, with 400 permutation trials
per recorded cell.
Histology and Reconstruction of Recording Positions
The tetrodes were not moved after the last recording day. The rat received an
overdose of Pentobarbital and was perfused with an intracardial injection of
9% saline, followed by 4% formaldehyde. The brain was stored in 4% formal-
dehyde, after which it was quickly frozen and cut in 30 mm sagittal slices,
mounted on glass, and stained with cresyl violet. The final position of the tip
of each tetrode was identified on digital pictures of the brain sections.
SUPPLEMENTAL INFORMATION
Supplemental Information includes four figures and one table and can
be found with this article online at http://dx.doi.org/10.1016/j.neuron.2014.
02.014.
ACKNOWLEDGMENTS
We thank N. Dagslott for help with experiments; V. Frolov and R. Skjerpeng for
programming; M.P. Witter for advice on histology; N.K. Eikeland for help with
figures; and A.M. Amundsgard, K. Haugen, E. Henriksen, K. Jenssen, E. Krak-
vik, and H. Waade for technical assistance. Supported by the Kavli Founda-
tion, a student research grant from the Faculty of Medicine at the Norwegian
University of Science and Technology, an Advanced Investigator Grant from
the European Research Council (‘‘ENSEMBLE’’–grant agreement 268598),
and a Centre of Excellence grant and a FRIPRO grant from the Research
Council of Norway.
Accepted: February 6, 2014
Published: March 6, 2014
REFERENCES
Barry, C., Lever, C., Hayman, R., Hartley, T., Burton, S., O’Keefe, J., Jeffery, K.,
and Burgess, N. (2006). The boundary vector cell model of place cell firing and
spatial memory. Rev. Neurosci. 17, 71–97.
de Almeida, L., Idiart, M., and Lisman, J.E. (2009). The input-output transfor-
mation of the hippocampal granule cells: from grid cells to place fields.
J. Neurosci. 29, 7504–7512.
Fuhs, M.C., and Touretzky, D.S. (2006). A spin glass model of path integration
in rat medial entorhinal cortex. J. Neurosci. 26, 4266–4276.
Fyhn, M., Molden, S., Witter, M.P., Moser, E.I., andMoser, M.B. (2004). Spatial
representation in the entorhinal cortex. Science 305, 1258–1264.
Neuron 82, 71–78, April 2, 2014 ª2014 Elsevier Inc. 77
Neuron
Border Cells in Developing Entorhinal Cortex
Hafting, T., Fyhn, M., Molden, S., Moser, M.B., and Moser, E.I. (2005).
Microstructure of a spatial map in the entorhinal cortex. Nature 436, 801–806.
Hargreaves, E.L., Rao, G., Lee, I., and Knierim, J.J. (2005). Major dissociation
between medial and lateral entorhinal input to dorsal hippocampus. Science
308, 1792–1794.
Hartley, T., Burgess, N., Lever, C., Cacucci, F., and O’Keefe, J. (2000).
Modeling place fields in terms of the cortical inputs to the hippocampus.
Hippocampus 10, 369–379.
Koenig, J., Linder, A.N., Leutgeb, J.K., and Leutgeb, S. (2011). The spatial peri-
odicity of grid cells is not sustained during reduced theta oscillations. Science
332, 592–595.
Langston, R.F., Ainge, J.A., Couey, J.J., Canto, C.B., Bjerknes, T.L., Witter,
M.P., Moser, E.I., and Moser, M.B. (2010). Development of the spatial repre-
sentation system in the rat. Science 328, 1576–1580.
Lever, C., Burton, S., Jeewajee, A., O’Keefe, J., and Burgess, N. (2009).
Boundary vector cells in the subiculum of the hippocampal formation.
J. Neurosci. 29, 9771–9777.
McNaughton, B.L., Battaglia, F.P., Jensen, O., Moser, E.I., and Moser, M.B.
(2006). Path integration and the neural basis of the ‘cognitive map’. Nat.
Rev. Neurosci. 7, 663–678.
Monaco, J.D., and Abbott, L.F. (2011). Modular realignment of entorhinal grid
cell activity as a basis for hippocampal remapping. J. Neurosci. 31, 9414–
9425.
Muller, R.U., and Kubie, J.L. (1989). The firing of hippocampal place cells pre-
dicts the future position of freely moving rats. J. Neurosci. 9, 4101–4110.
O’Keefe, J., and Burgess, N. (1996). Geometric determinants of the place
fields of hippocampal neurons. Nature 381, 425–428.
O’Keefe, J., and Burgess, N. (2005). Dual phase and rate coding in hippocam-
pal place cells: theoretical significance and relationship to entorhinal grid cells.
Hippocampus 15, 853–866.
O’Keefe, J., and Dostrovsky, J. (1971). The hippocampus as a spatial map.
Preliminary evidence from unit activity in the freely-moving rat. Brain Res.
34, 171–175.
Ranck, J.B. (1985). Head direction cells in the deep cell layer of dorsal
presubiculum in freely moving rats. In Electrical Activity of the Archicortex,
G. Buzsaki and C.H. Vanderwolf, eds. (Budapest: Akademiai Kiado),
pp. 217–220.
78 Neuron 82, 71–78, April 2, 2014 ª2014 Elsevier Inc.
Rolls, E.T., Stringer, S.M., and Elliot, T. (2006). Entorhinal cortex grid cells
can map to hippocampal place cells by competitive learning. Network 17,
447–465.
Sargolini, F., Fyhn, M., Hafting, T., McNaughton, B.L., Witter, M.P., Moser,
M.-B., andMoser, E.I. (2006). Conjunctive representation of position, direction,
and velocity in entorhinal cortex. Science 312, 758–762.
Savelli, F., and Knierim, J.J. (2010). Hebbian analysis of the transformation of
medial entorhinal grid-cell inputs to hippocampal place fields. J. Neurophysiol.
103, 3167–3183.
Savelli, F., Yoganarasimha, D., and Knierim, J.J. (2008). Influence of boundary
removal on the spatial representations of the medial entorhinal cortex.
Hippocampus 18, 1270–1282.
Skaggs, W.E., McNaughton, B.L., Gothard, K.M., and Markus, E.J. (1993). An
information-theoretic approach to deciphering the hippocampal code. In
Advances in Neural Processing Systems, Volume 5, S.J. Hanson, J.D.
Cowan, and C.L. Giles, eds. (San Mateo: Morgan Kaufmann), pp. 1030–1037.
Skaggs,W.E.,McNaughton, B.L.,Wilson, M.A., andBarnes, C.A. (1996). Theta
phase precession in hippocampal neuronal populations and the compression
of temporal sequences. Hippocampus 6, 149–172.
Solstad, T., Moser, E.I., and Einevoll, G.T. (2006). From grid cells to place cells:
a mathematical model. Hippocampus 16, 1026–1031.
Solstad, T., Boccara, C.N., Kropff, E., Moser, M.B., and Moser, E.I. (2008).
Representation of geometric borders in the entorhinal cortex. Science 322,
1865–1868.
Taube, J.S., Muller, R.U., and Ranck, J.B., Jr. (1990). Head-direction cells
recorded from the postsubiculum in freely moving rats. I. Description and
quantitative analysis. J. Neurosci. 10, 420–435.
Wills, T.J., Cacucci, F., Burgess, N., and O’Keefe, J. (2010). Development of
the hippocampal cognitive map in preweanling rats. Science 328, 1573–1576.
Witter, M.P., and Amaral, D.G. (2004). Hippocampal formation. In The
Rat Nervous System, Third Edition, G. Paxinos, ed. (San Diego: Elsevier
Academic Press), pp. 635–704.
Zhang, S.J., Ye, J., Miao, C.L., Tsao, A., Cerniauskas, I., Ledergerber, D.,
Moser, M.B., and Moser, E.I. (2013). Optogenetic dissection of entorhinal-hip-
pocampal functional connectivity. Science 340, 1232627.