REPORTING NEXT LEVEL EASY REPORTS WITH XCP · xCP Reporting overview From its first release, xCP...
26
Doina Derevciuc [email protected] Serghei Derevciuc [email protected] REPORTING NEXT LEVEL EASY REPORTS WITH XCP
Transcript of REPORTING NEXT LEVEL EASY REPORTS WITH XCP · xCP Reporting overview From its first release, xCP...

Doina Derevciuc [email protected]
Serghei Derevciuc [email protected]
REPORTING NEXT LEVEL
EASY REPORTS WITH XCP

2016 EMC Proven Professional Knowledge Sharing 2
Table of Contents Assets .............................................................................................................................................. 4
xCP Reporting overview .................................................................................................................. 7
Easy Reports solution overview ..................................................................................................... 10
Use Easy Reports .......................................................................................................................... 12
xCP Easy Report technical details ................................................................................................. 16
Deploy Easy Report for first time usage ......................................................................................... 18
Easy Reports Communication Pattern ........................................................................................... 20
Known issues ................................................................................................................................ 23
Future development ....................................................................................................................... 23
Conclusion ..................................................................................................................................... 24
Bonus ............................................................................................................................................ 25
Annexes......................................................................................................................................... 26
Bibliography ............................................................................................................................... 26
xCP Easy Reports Source Code ................................................................................................ 26

2016 EMC Proven Professional Knowledge Sharing 3
Table of Figures
Figure 1: xCP default visual Reports ................................................................................................ 7
Figure 2: xCP Report definition using Crystal Reports ..................................................................... 8
Figure 3: xCP Easy report High level ............................................................................................. 10
Figure 4: Report UI/Filters example ............................................................................................... 13
Figure 5: Export button definition ................................................................................................... 14
Figure 6: Report template desing ................................................................................................... 15
Figure 7: Report Execution UI ........................................................................................................ 17
Figure 8: Report result ................................................................................................................... 17
Figure 9: Report template and report result .................................................................................... 18
Figure 10: Import Report Widget .................................................................................................... 18
Figure 11: Export Report Button on page ....................................................................................... 20
Figure 12: Export Report in Synchronous mode ............................................................................. 21
Figure 13: Export Report in asynchronous mode ........................................................................... 22
Disclaimer: The views, processes or methodologies published in this article are those of the
authors. They do not necessarily reflect Dell EMC’s views, processes or methodologies.
Dell, EMC and other trademarks are trademarks of Dell Inc. or its subsidiaries.
2016 EMC Proven Professional Knowledge Sharing 4
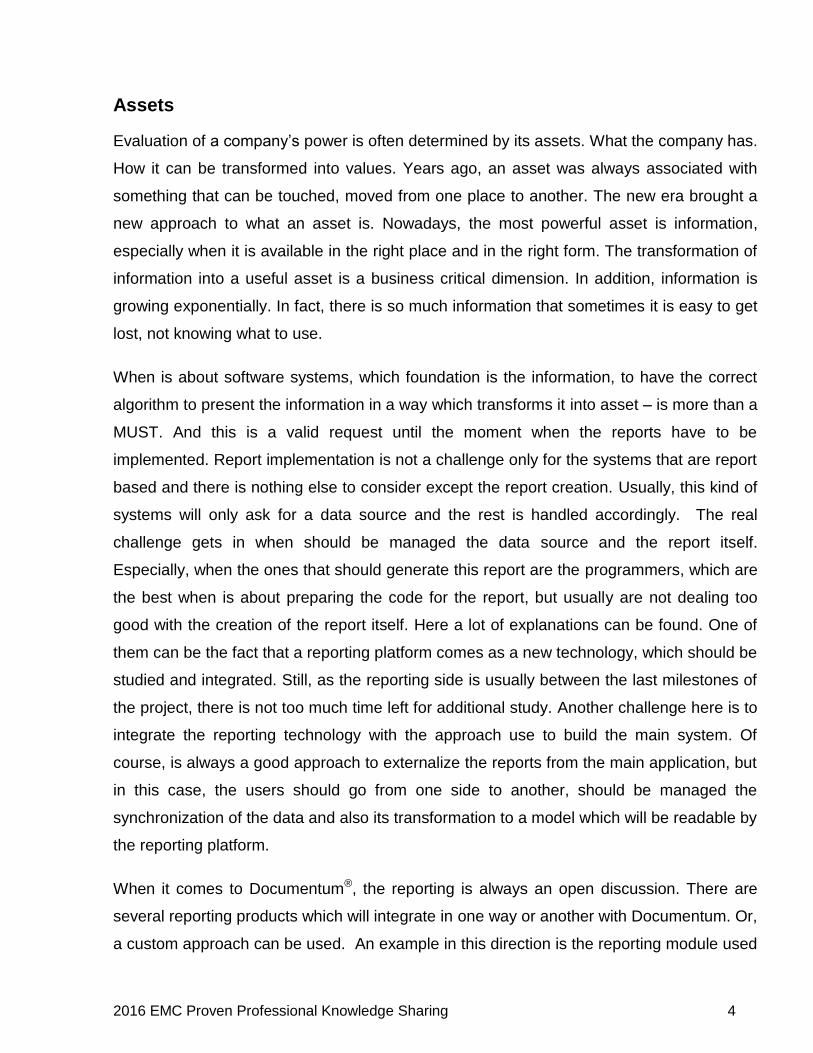
Assets
Evaluation of a company’s power is often determined by its assets. What the company has.
How it can be transformed into values. Years ago, an asset was always associated with
something that can be touched, moved from one place to another. The new era brought a
new approach to what an asset is. Nowadays, the most powerful asset is information,
especially when it is available in the right place and in the right form. The transformation of
information into a useful asset is a business critical dimension. In addition, information is
growing exponentially. In fact, there is so much information that sometimes it is easy to get
lost, not knowing what to use.
When is about software systems, which foundation is the information, to have the correct
algorithm to present the information in a way which transforms it into asset – is more than a
MUST. And this is a valid request until the moment when the reports have to be
implemented. Report implementation is not a challenge only for the systems that are report
based and there is nothing else to consider except the report creation. Usually, this kind of
systems will only ask for a data source and the rest is handled accordingly. The real
challenge gets in when should be managed the data source and the report itself.
Especially, when the ones that should generate this report are the programmers, which are
the best when is about preparing the code for the report, but usually are not dealing too
good with the creation of the report itself. Here a lot of explanations can be found. One of
them can be the fact that a reporting platform comes as a new technology, which should be
studied and integrated. Still, as the reporting side is usually between the last milestones of
the project, there is not too much time left for additional study. Another challenge here is to
integrate the reporting technology with the approach use to build the main system. Of
course, is always a good approach to externalize the reports from the main application, but
in this case, the users should go from one side to another, should be managed the
synchronization of the data and also its transformation to a model which will be readable by
the reporting platform.
When it comes to Documentum®, the reporting is always an open discussion. There are
several reporting products which will integrate in one way or another with Documentum. Or,
a custom approach can be used. An example in this direction is the reporting module used

2016 EMC Proven Professional Knowledge Sharing 5
by EPFM CP (Enterprise Plant and Facilities Management – Capital Projects) system. The
default reports set is based on a custom platform, which, in turn, is implemented using
Jasper Report. Even if the creation of the new reports is easy, if complexity exceeds what
one query may do requires intervention of an Engineer. This person will build the required
back-end code to provide the information / data model for the report to the front end and,
after the required transformation, to the user.
When is about systems based on xCP, the reporting gets to a completely new level. First,
xCP is popular for the fact that the applications are easy to build here. Being a next
generation solution development platform, an xCP application will generate lots of
information. The flexibility of a system built on xCP will allow the generation of modules for
any enterprise level, those, from the once that are generating the information to the ones
that need this information in an aggregated way and available for printing in a format that
was predefined and which is in place for a long time.
This article will present a specific approach on reporting when is about xCP and how the
report generation part of the software creation lifecycle can be shorter. There is no magic
here, the tool being only the result of the experience with xCP based systems creation and
the processing of users requirements. Because, at the end, the most important task for the
system is to give to the user what the user wants and in the way the users expects to get
this result. One important thing to mention here is the fact that the most of the tools used
for reporting will ignore usually one of the most required functionalities when is about
reporting – data preview before save/download. The classic way of receiving the reports is
to insert the filter and send for execution. Still, the question received with this approach all
the times is: “What if the generated report is not what I need?” And most probably, the user
is right. Is a valid request to see the data beforehand. Is this technically possible? Yes, it is.
Of course, limitations would apply, but this is possible. In addition, with xCP, this is even
easier. You build once and use many times. And this time, the reuse will be explained from
Easy Reports Perspective.
The intended audience for this article are the xCP system architects, Business Analyst and
xCP programmers and Users. The programmers will understand how to do the things, the

2016 EMC Proven Professional Knowledge Sharing 6
Architect – what should be done and the business analyst – this can be done, because is
EASY. The users? The users will just be happy that the report they need is ready in hours.

2016 EMC Proven Professional Knowledge Sharing 7
xCP Reporting overview
From its first release, xCP was featured as a platform that can do everything. One of its
main innovations was the Business Activity Monitor (BAM), which enabled users to go
inside the processes and get aggregated information as per their need. The data generated
by BAM can be queried afterward as per the imagination of the programmer.
xCP will offers three kinds of reporting out of the box:
1. Visual Reporting
2. Query based reports
3. Crystal Reports
VISUAL REPORTS
The Visual Reports bundle includes the dashboard and charts (column, bar, gauge, and
pie) which may used for any query based on the requirements. The visual reports are
highly appreciated for their data aggregation possibilities and the way they are able to
present a lot of data in a small space. Figure 1 depicts how information in visual reports
look in an xCP Application:
FIGURE 1: XCP DEFAULT VISUAL REPORTS

2016 EMC Proven Professional Knowledge Sharing 8
The good part for this kind of report is their visual impact. The bad part is that it is not
possible to export them or integrate them in other kinds of reports and, if required, to print
or share them via mail.
CRYSTAL REPORTS
Crystal Reports is the classic reports generation tool for xCP. It allows the creation of easy,
medium, and complex reports, with a wide variety of export formats. The tool as is required
medium technical knowledge and allows the definition of how the report will look with
reasonable effort.
Figure 2 shoes the full flow of xCP report creation based on Crystal Reports.
Once the report design phase is completed, the developer can go back in xCP designer to
complete the activities related to the report, i.e. define the filters, assign the report to a
specific page, and so on.
At the execution phase, the user will select the needed report and send it for execution. All
the user sees at this point are the filters. Once the report is ready, the user can preview the
result – if such a functionality is available – or export the generated report.
Updating existing reports can only be done using Crystal Reports application. The
generated .rpt files cannot be edited with a text editor, as are binary files. In addition, the
update requires technical knowledge and the specific software installed. One other thing to
•Prepare your Application for Crystal Reports usage
•Add the required libraries and Environment properties
•Generate the .rpt file
Create the Crystal Report artifact in xCP
Designer
•Connect to xCP to use as datasource
•Design Report
Crystal Reports •Set as widget on a
specific Page
•Deploy the App
xCP Designer
•Flash player plugin enabled in browser
•Set filters
•View report results
User Interface
FIGURE 2: XCP REPORT DEFINITION USING CRYSTAL REPORTS

2016 EMC Proven Professional Knowledge Sharing 9
consider about Crystal Reports is licensing. Up to xCP 2.1, Crystal Reports was part of the
xCP bundle with one Developer license. Starting with xCP 2.2, Crystal Reports in no longer
included. An additional license should be bought in order to use this technology for reports
implementation.
The advantage of Crystal Reports is the flexibility to create the report result. Disadvantages
include the need for additional licenses, integration complexity, and report design requires
knowledge of additional technologies.
QUERY-BASED REPORTS
The third reports creation possible inside xCP is query-based reports. To this category can
be assigned any report that generated by the out of the box xCP functionalities: Historical
Query, Alert, Task List, Stateless Process, Full Text, and Real-Time Query. Each of these
artifacts, with the imagination of the programmer and the requirements from the business
side, can cover the requirement of transforming the information that exists in the system in
the asset. The main advantage of query-based reports is their visible results and flexibility
when using the filters. These are default xCP functionalities with no additional technology
knowledge required. Actually, most everything in an xCP system can be considered a
query-based report. In order to have an ergonomic and useful User Interface, the
information will be displayed on the page based on one of the listed above functionalities.
The creation of a query-based report involves a few easy steps:
Data Model Definition
Input Variables
Output variables
Visualization (Result List or Result List + Charts)
The main disadvantage of this kind of report is that there is no predefined way to export the
results or to use them afterward. These are runtime reports and once the page is
refreshed, the information is new. Also such reports cannot be cannot sent via mail or
printed. Is everything there and in the same timeframe? You cannot have them as reports!

2016 EMC Proven Professional Knowledge Sharing 10
Easy Reports solution overview
Everything appears fine when looking at project management on paper. Milestones, plan,
deadlines, and modules. Perfection. But often there remains some module that is always
ignored until the deadline for the project is getting close. This is the best place for
innovations. There would be no xCP Easy Reports if there were no need to complete the
project on time. Once the project got to the milestone where the reports were due, Project
Management figured out that going the way the things were planned at the beginning was
not a choice. And, as miracles do happen, especially in the programmer’s world soon after
coming out the idea of a Reporting Custom module which would do even more than
expected in the first place. It was a good idea and mature enough in order to complete all
the 40 Reports required by the client by the end of next week. Once this behind, the
approach was adopted by another project also. Of course, that during its usage come out
issues and were added improvements. And there is still a lot of functionality that may be
added in order to cover all the dimensions of a reporting platform, but this will come with
the time. For now and in the context of this article we will share what was done so far,
howit was done and.future scheduled developments!
The goal of xCP Easy Reports is to transform the way the reports are managed in xCP and
to move reporting to the next level. The idea is pretty simple: use everything that is already
defined and integrate the missing part in order to give to the users what they want. And
along with this – consider how to simplify the process as much as possible.
Here is how everything looks at a high level:
Query Based Reports are defined inside the xCP
Application
Define the Easy Report Structure and assign it to the
Download/Export Button
User Gets the missing piece and is happy
FIGURE 3: XCP EASY REPORT HIGH LEVEL

2016 EMC Proven Professional Knowledge Sharing 11
Imagine the xCP reporting functionality as a puzzle and consider the OOTB functionality for
reporting existing in xCP. The missing piece is the possibility to export/download/save the
results of the executed queries. This was the start point when building the xCP Easy
Reports.
To have a clear idea of what this means, we will take it from the end – the Users:
What the user gets:
1. A button for Export/Download/Save Report Results 2. The report itself in Excel or PDF Format
What the Programmer gets:
1. The possibility to assign the already predefined search pages/query results pages with a Report template.
2. Short implementation time
What the report designer gets?
1. Actually, nothing. It is not required to have a Report Designer.
The available export formats are the most common ones: Excel and PDF. Since no other
export formats were requested, there is no other implementation. Still, the way the core for
the ER is built, additional functionality can be added as per the need.
From a technical point of view, the solution is based on a mix of Excel, Documentum, and
Apache POI for result generation. The template of the report is defined in Excel. It can be
used as the exact report used by the users so far. Next, the template is associated with a
specific page inside xCP application. When the user clicks on the specific button, the report
is downloaded accordingly.
The solution has no special requirements when it is about the browser. The possibility to
have big reports was considered, which should require a lot of resources – in this case, the
execution being sent from Front End to Back End. As additional functionality was added
the synchronous/asynchronous report generation and the possibility to schedule reports
generation using a specific configuration.

2016 EMC Proven Professional Knowledge Sharing 12
Use Easy Reports
In order to have a report available to the users, there are 3 main stages to pass:
The way the request arrives at the programmer is outside the scope of this article. Still, in
order to be able to implement the report, the following requirements apply:
What data should you report on?
Is it possible to report on the specific data using a query (more or less complex)? Or
is additional implementation required?
What do the users expect to see as filters?
Which is the report name?
What should be the output structure?
The questions above should be asked. This does not assure that there will be a clear
answer, but will be at least something. So – as said before – for xCPER, the following data
sources can be used:
Real-time query: if you can use a query and you need use a lot of filters. And, if you
need performance, a real-time query will give you the fastest result;
Historical Query: If you need information from BAM.
Full-Text Query (is not common, but may happen) – in case users need all the
occurrence of a specific information. Still, be aware that the information displayed is
not guaranteed to be 100% accurate this kind of report.
Task List Query: When the requested report needs to contain the information about
what happens with the current processes.
Stateless Process: When none of the sources above match with the requirements –
or if you like coding – use a stateless process. Everything may go inside.
Once you know your entry point, create your data service, which will be used later for the
report export. With this part, STEP 1 – Define your report, is complete!
Define Implement Use

2016 EMC Proven Professional Knowledge Sharing 13
Once the definition is complete, move on to implementation. You know what you have and
you know (more or less) what the user wants – so you can implement the query or the
process. You define your output. Keep in mind that before the user will see the report itself,
what the user sees is the User interface. How clever the UI is built depends more than 50%
of the overall success of your application. You may have the best Big Data analysis in the
back end, but if the UI overlooks ergonomic considerations, there is a very little chance to
get your application accepted. Why all this argument? Because now is the time to create
the page/UI for your report. As xCPER is integrating by default with the platform, it is
required to create a page where you will add the result list widget. While you can go
without a result list widget, the most required feature of reporting module is to see the
results of any report before extracting it from the system. So – if you have the choice – opt
for the widget result list. Keep in mind if you have a lot of data you limit the result to a
certain communicated value. You care about performance, don’t you?
Here is the definition of our page, which would extract us the information we need for the
Invoice list by Vendor.
FIGURE 4: REPORT UI/FILTERS EXAMPLE
In this UI, the most important part is the Export Button, which associates all the logic for
report creation. As said at the beginning, it is the part that was missing in the already
existing functionality for xCP. Though It may have different names, it is always the same –
it gives to the user the report he needs.

2016 EMC Proven Professional Knowledge Sharing 14
FIGURE 5: EXPORT BUTTON DEFINITION
Keep in mind, once new functionality is required, this configuration may be extended in
order to gain additional functionality (ex: to have or not have displayed the scheduling UI);
The following attributes are important here:
Placeholder Row position: The row on which starts the part that should be managed
by the system to insert the values
Maximum result: The report may be limited to a certain amount of data.
Template path: indicated the template to be used (Full Qualified path).
Data Service name – the name of the data service created before.
Once all of these parts defined the report is ready for use. Of course, we did not define the
template. For details on the template, see below.
As output will be considered all the fields need to be filled in the resulting report. For
example, the request is to have all the information about the invoices issued for a specific
vendor. The report should contain details about Vendor, Invoice ID, amount, issue date,
signer, status, and the sum of all invoices. In addition, it should have a header with certain
cumulative information. Make sure that your data source returns this attributes. Once you
have them, design your template.

2016 EMC Proven Professional Knowledge Sharing 15
As mentioned in the first place, the templates (for now!) are based on Excel. Those – the
user requesting the report can provide it to you. In our case – we will design one ourselves.
In addition, here is our report template ready:
FIGURE 6: REPORT TEMPLATE DESIGN
The structure of the report depends a lot on the imagination. However, you can define
header, footer (we are missing one in this report), repetitive data, and one single use date.
The important thing to mention is that you can use anything that Excel may offer you –
including formulas (7D, 8D, and 9D are formulas for the sum and sumif), charts, filters, and
other data processing information.
Now we just need to deploy our application. Yes, I know, deployment is not the best
moment of your day. However, if you are still using xCP 2.1, refer to the Bonus area of this
article. Otherwise, if you use xCP 2.2, you should have no problem with the deployment.
Once the template is ready, you can go to next stage and use the report.
Well, you can say that you cannot use yet the report. In fact, you are right. We are missing
some technical details here. Before sharing the last steps on how you can use the report,

2016 EMC Proven Professional Knowledge Sharing 16
please find below the way the template, the data source, and the button interact with each
other. Moreover, how all of this is possible, technically speaking.
xCP Easy Report technical details
The report is one click away – Everything starts from the
javascript “Onclick” function overwrite, where the data service
input values are collected. In the previous section (see Figure
4) we defined the input form (a real-time query, in our case). On
it, we have the “Export” button, on which properties is defined
the data service, which, once invoked, will call all the custom
logic. One thing to mention here: mapping between UI filters
and what is inserted in the report template at design time should be done.
When the user clicks on the button, all the information on the form is processed and sent to
a servlet using a link as the one below:
http://nkxcp21:8000/Contract_Management/exportreportservlet?dataservice_url=http
%3A%2F%2Fnkxcp21%3A8000%2FContract_Management%2Frealtime-
queries%2Fcm_datic_invoices%3Finline%3Dtrue%26items-per-
page%3D100%26input_invoice_id%3D%26input_ammount%3D%26input_signer%3D&placeholde
r_row_pos=12&template_path=%2FTemp%2FDatik_Invoices_2016&is_stateless_process=fa
lse&stateless_vars=}
This case simulates the default xCP mechanism of reading the input, even if done via a
custom implementation.
Containing the following:
- The full path to the report (full qualified path to the report on the docbase)
- Name of the data service (ex: Stateless Process, Realtime query, etc.)
- User name (under which user is executed the query)
- All the inputs and their values
Servlet extends standard Spring security. Those, as long as the user is not authenticated in
the application – the user cannot export the report. That is, you cannot have a link to the
servlet itself, those are preserved all application security. The dataservice is executed and
the results are collected in a key/value map; Key being the name of the attribute inside the
template and value being the specific value, which should be replaced.

2016 EMC Proven Professional Knowledge Sharing 17
Details on the implementation can be reviewed in the source code, attached in this article.
Once the processing is over, the user gets the report in the requested format.
The template has to be imported inside the repository in any path; Template format: xlsx;
ACL on the template: Read for the users which will use the reports; the servlet is called as
a “GET” in another tab. Those, while the report is generated in synchronous way, the user
can continue to work. Still, the tab where the request is processing should not be closed.
Here is our Report, generated from the application:
FIGURE 7: REPORT EXECUTION UI
FIGURE 8: REPORT RESULT

2016 EMC Proven Professional Knowledge Sharing 18
For a cross check: Template and Result
Datik_Invoices_2016.xl
sx
Datik_Invoices_20161
455135345106.xlsx
FIGURE 9: REPORT TEMPLATE AND REPORT RESULT
Deploy Easy Report for first time usage
The following steps should be followed to use Easy Reports inside an existing xCP
Application:
1) Import widget to your xCP project.
FIGURE 10: IMPORT REPORT WIDGET
2) Register ExportReport in following files
a. <project_name>\src\main\webapp\WEB-INF\web.xml
b. <project_name>\src\main\resources\com\emc\xcp\config\app\applicationCont
ext-ui-app.xml

2016 EMC Proven Professional Knowledge Sharing 19
a) web.xml
<servlet>
<servlet-name>ExportReportServlet</servlet-name>
<servlet-class>
org.springframework.web.context.support.HttpRequestHandlerServlet
</servlet-class>
</servlet>
<servlet-mapping>
<servlet-name>ExportReportServlet</servlet-name>
<url-pattern>/exportreportservlet</url-pattern>
</servlet-mapping>
b) applicationContext-ui-app.xml
<bean id="ExportReportServlet"
class="ro.planet.widgets.web.servlets.ExportReportServlet"/>
3) Copy the jar xPlanetWidgetsWeb.jar to the <project_name>\src\main\webapp\WEB-
INF\lib path.
4) Restart xCP Designer.
5) Create Excel templates with optional header and mandatory row with placeholders
(name of the output attribute from dataservice) – as per the instructions in the “Use
Easy Reports” section.
6) Design your query report and add widget to the page with associated dataservice
and template. Configure the widgets as follows, using its Properties tab:
a. ID – widget id.
b. Label – widget display text.
c. Placeholder row position – the row in template Excel file that contains name
of attributes of associated dataservice output.
d. Template Path – full path of the template on the repository.
e. Data service instance – the dataservice used for export data to the report,
can be same as for search page.

2016 EMC Proven Professional Knowledge Sharing 20
FIGURE 11: EXPORT REPORT BUTTON ON PAGE
7) Deploy your application and enjoy Easy Reports.
Easy Reports Communication Pattern
As mentioned earlier, xCP Easy Reports comes in two flavors: Synchronous and
Asynchronous. When Synchronous, the communication is done as per the diagram
displayed below:

2016 EMC Proven Professional Knowledge Sharing 21
FIGURE 12: EXPORT REPORT IN SYNCHRONOUS MODE
Still, when there is a large amount of data or if data processing is required (ex: project
progress calculation or other financial data) a synchronous report may significantly impact
system performance. In those cases, the asynchronous mechanism is preferable. It allows
a laod to be moved to a back end content server, those having a concentrated load and, in
addition, a load that can be controlled. The diagram below depicts the asynchronous
communication mechanism.

2016 EMC Proven Professional Knowledge Sharing 22
FIGURE 13: EXPORT REPORT IN ASYNCHRONOUS MODE
The advantages of the asynchronous mode is the notification which may be issued to the
client and also the possibility to configure report result saving.
Is also possible to send report results via mail. This should be used with caution as it may
go outside the organization. If there is no IRM in place, sending reports via mail should be
the last option to be implemented. It is better to send the link to the report and let the user
authenticate again if he wants to see the result.

2016 EMC Proven Professional Knowledge Sharing 23
Known issues
When you are young, you can do a lot, you have a lot of power, but you miss the
experience. The same refers to xCP Easy Reports. This is a solution that can (and has) to
grow. For now, these are the known issues on using this tool:
Asynchronous Scheduling User Interface: A final cumulative design for
asynchronous running the reports not yet defined;
Bypass the default 1000 results limit for xCP 2.1; In xCP 2.2, the issue no longer
exists;
Execution time: users are not forbidden to run big reports in synchronous mode.
Should be implemented a better way for the reports management if a big result is
known anticipated (to notify the user that the report will go in asynchronous mode?);
Using stateless processes: Take care on the implementation as you may go
OutOfMemory while processing the result. This is more a “keep in mind” than a
known issue.
Future development
What’s next? Well, first is to test how xCP Easy Report will behave for large amounts of
data. Implementation of this kind of report for a project where the docbase has about 10
millions documents is now in progress.
Another “nice to have” feature – which is on the TO DO list – is extension of the
functionality to have information about the inserted filters in the result report. The idea is to
display this as an image. Still, it is not the best idea when you get an image in Excel.
There is always room for doing things better. The more this functionality is used, the more
are required functionalities improving it. So, what’s next? Next should be a complete
custom solution which will transform the way the reporting in done in xCP. And the
reporting in xCP will become EASY!

2016 EMC Proven Professional Knowledge Sharing 24
Conclusion
Sometimes it is enough to transform what you already know in order to get what you really
need. This is called innovation. It may seem easy and it really is. However, the
transformation of a hard task into an easy result is an art. xCP Easy Reports is an example
in this sense. A simple idea which grew into something that can be used and reused and is
an approach that solves not only local problems, but is also something that can transform
the reporting when it is about xCP. Integrates natively with any xCP application, handles
any Query types, including the full text ones. Easy to use, deploy, and can reinvent itself
whenever something changes in xCP. We take content seriously! And this is not only
because we want to quote ECD. In fact – the content is a serious thing. It is an asset.
Maybe the most important asset of any company. We have to care about how all the
information is shared to the users. We must think of how users will get their information and
we must think fast. Something that today is actual must be given to the users today. xCP
Easy Reports transforms this “Today” in the right away.
What should be next? A good idea would be to integrate Easy Reports as a default widget
available for all the developers. This will bring value to all levels in the software lifecycle.
Sales and presales people will use this during presentations. Engineers will develop easier
reporting modules. The application maintenance team will learn fast what should be done
in order to add new reports along with how existing ones are done. And the users? Well,
the users will not even notice. Because they will just use their reports and when they need
a new one will just ask, because they will know that it is Easy.
I dedicate this article to the users, which, with their requests, are motivating us, the
programmers, to work better and to create better and better software. Thanks to the users
we transform their requests into value. Together with the users we create value!

2016 EMC Proven Professional Knowledge Sharing 25
Bonus
And there is something else. This time for the developers only. Working with xCP is always
a challenge. Here are some tips on how to transform challenges in interesting experiences.
Developers will understand me if I say Bundle – the old bundles are huge space and time
consumers. And, in order to get rid of them – you must do a complete application re-install,
delete all your test data, and spend time recreating the app from scratch. Well, this can be
managed. All you have to do is create a custom class, connect to the docbase, and remove
old bundles. A bundle is a sysobject. Knowing how to remove not current versions for a
sysobject is fundamental. I manage to save 15 GB on my first of this class. And the
remaining current application version worked just fine.
One other thing to consider: Custom Jars (ex: Localization, Jars, Servlets, etc.) – which
need to be packaged in your application – can be automatically deployed. To do this, copy
them inside project_name>\src\main\webapp\WEB-INF\lib and during the packaging stage
it will be automatically managed by the system.
Custom Modules: There are 2 ways; use full deployment method – a time consuming
activity – or use a trick – add a new description to the artefact and the system will consider
it as an updated one and will deploy only for the new artefacts. Or – even better – create a
custom class that works as follows: Finds the updated jars (related to the modules to be
updated) and invokes a “Save as new” + set file from the new content + delete the old jar.
This way you avoid jars versioning and no deployment required. Wait a maximum of 1
minute and BOF will reload the new jars. Actually, this is more or less the way xCP
Designed works during each deployment.
And last, but not the least – for big projects, in xCP 2.1, any data model change will bring a
long coffee break while saving the artifacts. How to avoid this? Add a controlled error –
somewhere where you know – and save this in order to have xCP Designer see that there
is a problem in the project. Next – save all. This way you get time only for an expresso. Or
– if you don’t like coffee – use xCP 2.2 which offers the Disable Auto build button. Still,
always keep in mind, Programmers transform coffee in good software! Enjoy a coffee.
Build quality and useful software.

2016 EMC Proven Professional Knowledge Sharing 26
Annexes
Bibliography
1. xCP 2.1/2.2 Developer Guide
2. xCP 2.1/2.2 xCP REST Services Developer Guide
3. xCP 2.1/2.2 xCP Deployment Guide
4. xCP 2.1/2.2 xCP Release Notes
5. xCP 2.1/2.2 xCP Designer Help
xCP Easy Reports Source Code
src.zip
Dell EMC believes the information in this publication is accurate as of its publication date. The
information is subject to change without notice.
THE INFORMATION IN THIS PUBLICATION IS PROVIDED “AS IS.” DELL EMC MAKES NO
RESPRESENTATIONS OR WARRANTIES OF ANY KIND WITH RESPECT TO THE
INFORMATION IN THIS PUBLICATION, AND SPECIFICALLY DISCLAIMS IMPLIED
WARRANTIES OF MERCHANTABILITY OR FITNESS FOR A PARTICULAR PURPOSE.
Use, copying and distribution of any Dell EMC software described in this publication requires an
applicable software license.
Dell, EMC and other trademarks are trademarks of Dell Inc. or its subsidiaries.