Report q4-2016 mercom healthtech funding
11
1 Copyright 2010-2016 | Mercom Capital Group | www.mercomcapital.com | [email protected] Executive Summary Healthcare IT Funding and M&A 2016 Fourth Quarter and Annual Report Funding and merger & acquisition activity for the Healthcare IT / Digital Health sector http://www.mercomcapital.com
-
Upload
galen-growth-asia -
Category
Healthcare
-
view
18 -
download
4
Transcript of Report q4-2016 mercom healthtech funding

1 Copyright 2010-2016 | Mercom Capital Group | www.mercomcapital.com | [email protected]
Executive Summary
Healthcare IT Funding and M&A 2016 Fourth Quarter and Annual Report
Funding and merger & acquisition activity for the
Healthcare IT / Digital Health sector
http://www.mercomcapital.com

2016 Fourth Quarter and Annual Healthcare IT Funding and M&A Executive Summary
2 Copyright 2010-2017 | Mercom Capital Group | www.mercomcapital.com | [email protected]
About Mercom’s Healthcare IT Funding and M&A Report
Mercom was one of the first research firms to track funding and M&A activity in the Healthcare IT
sector, starting in 2010.
Here is how our report is different: Our report includes deals of all sizes, globally, to present a
complete picture of Healthcare IT funding and technology trends. As an independent research
firm, we have no conflicts of interest with companies covered in this report.
• This is the most comprehensive report covering funding and M&A deals of all sizes,
globally. The trends revealed in this report give a more complete picture of the industry.
• This report does not cover bioinformatics and medical devices.
• All charts, graphs, and trends are clearly categorized and defined by technology and sub-
technology groups.
• This report includes concise deal information for every transaction.
• This report covers historical trends.
• As the industry evolves, our report evolves with it and we continuously improve the
information, analysis, charts, and trends covered every quarter.
Our subscribers include companies and executives from venture capital, private equity,
investment banking, healthcare, healthcare IT (aka digital health and eHealth), insurance,
healthcare associations, universities, tech firms, and more.
Audience Why they like our reports
Venture Capital/Private Equity leads from early-stage deals, technology trends
Investment bankers leads for funding and M&A deals, investor leads
Healthcare IT, Digital health sector trends, investor targets (by funding behavior, including
technology, technology partnership targets, and more)
Insurance companies acquisition leads, investment leads, technology partnerships
Large healthcare & Tech firms acquisition leads, R&D partnerships, investment leads
The report covers the technologies listed below and the sub-technologies under them.
2016 Fourth Quarter and Annual Healthcare IT Funding and M&A Executive Summary
3 Copyright 2010-2017 | Mercom Capital Group | www.mercomcapital.com | [email protected]
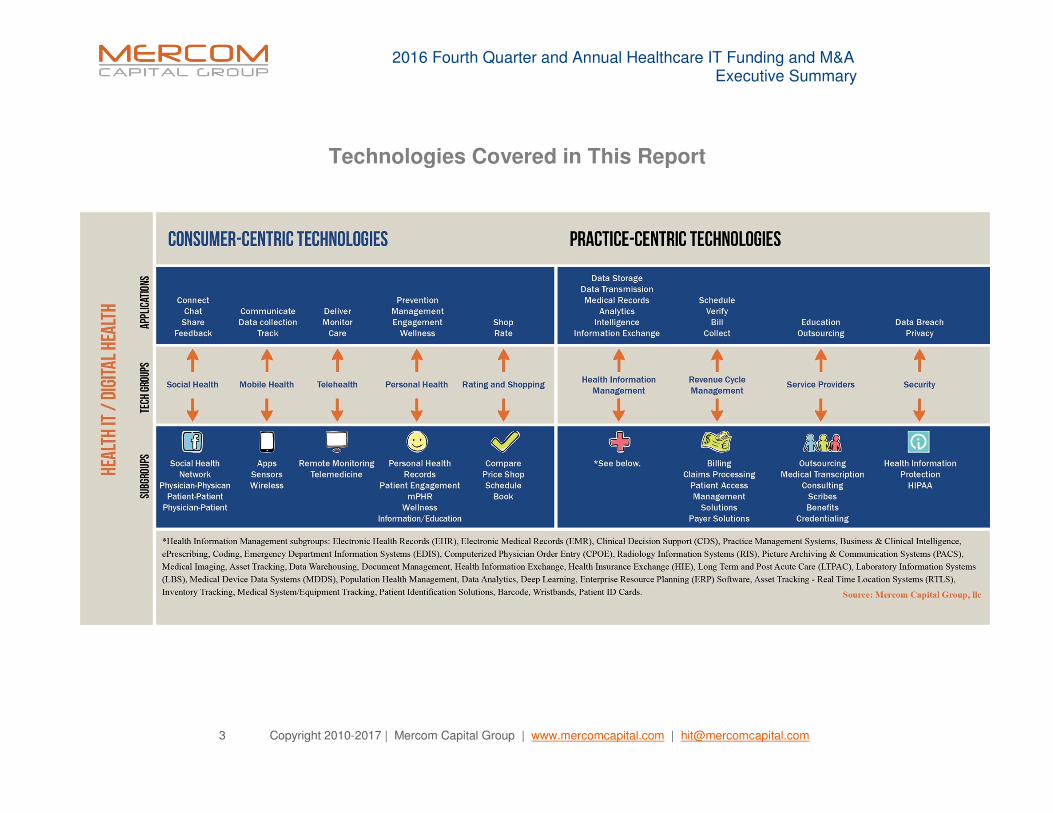
Technologies Covered in This Report

2016 Fourth Quarter and Annual Healthcare IT Funding and M&A Executive Summary
4 Copyright 2010-2017 | Mercom Capital Group | www.mercomcapital.com | [email protected]
• Global Healthcare IT/Digital Health venture capital funding grew nine percent YoY
with more than $5 billion in 622 deals in 2016, compared to $4.6 billion in 574 deals
in 2015.
• Total corporate funding into Healthcare IT - including VC funding, debt and public
market funding - came to $5.6 billion in 2016 compared to $8 billion in 2015.
• VC funding for Healthcare IT companies in Q4 was $845 million in 159 deals
compared to the $1.25 billion in 177 deals in Q3 2016.
• Healthcare practice-focused companies raised $1.6 billion in 185 deals, accounting
for about 32 percent of the total funding.
• Consumer-focused companies received about $3.5 billion in 437 deals, accounting
for 68 percent of the total funding raised.
• The top funded Healthcare IT areas in 2016 included Mobile Apps, which received
almost $1.3 billion, Wearable Sensors with $592 million, Data Analytics with $574
million, Telemedicine companies with $528 million, Mobile Wireless companies with
$228 million, and Wellness with $218 million.
1,071 1,365 1,591 1,254 845
145 146140
177
159
0
50
100
150
200
0
300
600
900
1,200
1,500
1,800
Q4'15 Q1'16 Q2'16 Q3'16 Q4'16
Source: Mercom Capital Group
Healthcare IT VC Funding Q4 2015-Q4 2016
Disclosed Amount (US$M) No. of Deals
SELECT KEY
FINDINGS

2016 Fourth Quarter and Annual Healthcare IT Funding and M&A Executive Summary
5 Copyright 2010-2017 | Mercom Capital Group | www.mercomcapital.com | [email protected]
• The top VC rounds in 2016 were the $500 million round by Ping An Good Doctor,
Chunyu Yisheng’s $183 million, Flatiron Health’s $175 million, Jawbone’s $165
million, and Meet You with $151 million.
• The average deal size in 2016 was $8.1 million, similar to 2015.
• There were 35 countries that recorded Healthcare IT VC funding activity in 2016.
Most of the funding was logged in the United States with over $3.4 billion in 431
deals. Countries other than the United States accounted for 33 percent of the total
funding with more than $1.6 billion.
0
1,000
2,000
3,000
4,000
5,000
6,000
2010 2011 2012 2013 2014 2015 2016
US
$ in
Mill
ion
Source: Mercom Capital Group
Healthcare IT VC Funding 2010-2016 (By Technology)
Security
Revenue Cycle Management
Social Health
Service Providers
Personal Health
Telehealth
Scheduling, Rating & Shopping
Mobile Health
Health Information Management
$211M
$1,173M
$480M
$2,192M
$4,743M $4,637M
$5,055M

2016 Fourth Quarter and Annual Healthcare IT Funding and M&A Executive Summary
6 Copyright 2010-2017 | Mercom Capital Group | www.mercomcapital.com | [email protected]
• Within the United States, California companies continued to receive the most funding
with $1.3 billion in 143 deals. New York was second with $440 million in 49 deals.
• For the first time, Health IT investors crossed 1,000. A total of 1,115 investors
(including accelerator/incubators) participated in VC funding rounds for Healthcare IT
companies in 2016 compared to 923 in 2015.
• There were 22 accelerators and incubators who participated in 83 deals in 2016,
compared to 2015 which had 55 deals involving 14 accelerators and incubators.
• Announced debt and public market financing for Healthcare IT companies fell to $533
million in 18 deals in 2016, compared to $3.4 billion in 29 deals in 2015.
• There were four IPOs in 2016 raising a combined $234 million compared to seven
IPOs in 2015 raising a total of $2.2 billion.

2016 Fourth Quarter and Annual Healthcare IT Funding and M&A Executive Summary
7 Copyright 2010-2017 | Mercom Capital Group | www.mercomcapital.com | [email protected]
…….
…… ……………………
13
7
13
0
11
7
98
83
60
51
37
32
22
17
10
8 7 7 6 6 5 4 3 2 2 0.5
0.2
0
20
40
60
80
100
120
140
160
Ap
ps
We
ara
ble
Se
ns
ors
Da
ta A
na
lyti
cs
Tele
me
dic
ine
We
lln
es
s
Bo
ok
ing
Mo
bil
e W
ire
les
s
He
alt
h I
nfo
rma
tio
n E
xch
an
ge
Ele
ctr
on
ic H
ea
lth
Re
co
rds
Ele
ctr
on
ic D
ata
Ca
ptu
re S
ys
tem
s
Med
ical
Imag
ing
As
se
t T
rac
kin
g
Sh
op
pin
g
Pa
tien
t E
ng
ag
em
en
t
Pa
ye
r S
olu
tio
ns
Cli
nic
al
De
cis
ion
Su
pp
ort
Info
rmati
on
/Ed
uc
ati
on
Co
ns
ult
ing
Pra
cti
ce
Ma
na
ge
me
nt
So
luti
on
s
Ra
tin
g
Ele
ctr
on
ic M
ed
ica
l R
eco
rds
Mark
eti
ng
Co
mp
ari
so
n
Re
mo
te M
on
ito
rin
g
Source: Mercom Capital Group
Healthcare IT VC Funding By Amount in Q4 2016 (US$ in Million)
2016 Fourth Quarter and Annual Healthcare IT Funding and M&A Executive Summary
8 Copyright 2010-2017 | Mercom Capital Group | www.mercomcapital.com | [email protected]
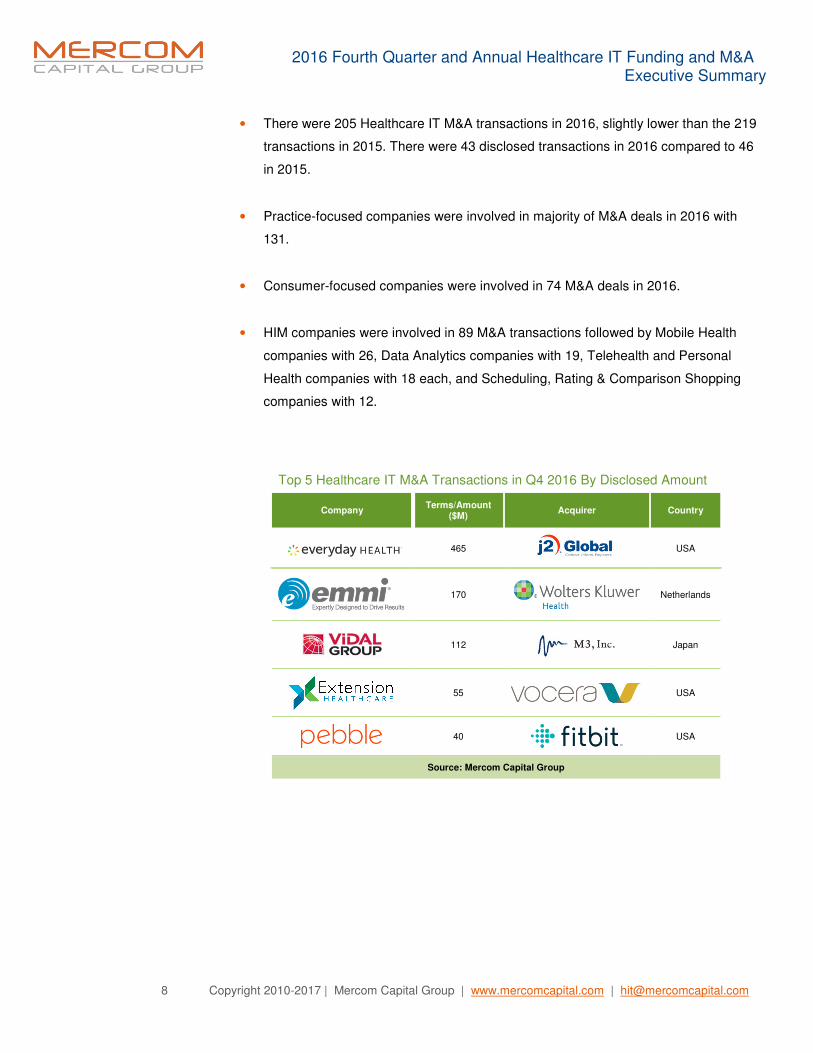
• There were 205 Healthcare IT M&A transactions in 2016, slightly lower than the 219
transactions in 2015. There were 43 disclosed transactions in 2016 compared to 46
in 2015.
• Practice-focused companies were involved in majority of M&A deals in 2016 with
131.
• Consumer-focused companies were involved in 74 M&A deals in 2016.
• HIM companies were involved in 89 M&A transactions followed by Mobile Health
companies with 26, Data Analytics companies with 19, Telehealth and Personal
Health companies with 18 each, and Scheduling, Rating & Comparison Shopping
companies with 12.
Top 5 Healthcare IT M&A Transactions in Q4 2016 By Disclosed Amount
Company Terms/Amount
($M) Acquirer Country
465
USA
170
Netherlands
112
Japan
55
USA
40
USA
Source: Mercom Capital Group

2016 Fourth Quarter and Annual Healthcare IT Funding and M&A Executive Summary
9 Copyright 2010-2017 | Mercom Capital Group | www.mercomcapital.com | [email protected]
Introduction……………………………………………………………………….……...……….… 4
Key Findings……………………………………………………………………….……… 6
2016 Healthcare IT Funding and M&A ……………………………….……………….. 11
VC Funding 2010-2016………………………………………………………….….……………… 11
VC Funding …………………………………………………………………..….….……………… 12
Q4 - VC Funding………………………………………………..………….………..…… 12
VC - Funding by Technology…………………………………………….……………… 13
VC - Funding by Technology 2010-16………………………………………….……… 14
VC - Funding by Sub-Technology…………….……………………………..….……… 18
Health Information Management…………….……………..….……………. 19
Mobile Health…………….……………..….………………………………….. 25
Telehealth…………….……………..….…………………………………..…. 32
Personal Health…………….…………………………………..…..…………. 35
Scheduling, Rating & Shopping…………….………………...….…………. 37
Social Health…………….……………..….…………………………..………. 39
Q4 - VC Funding by Technology…………………………………….……….…..…….. 40
Q4 - Health Information Management…………….……………..…….……. 43
Q4 - Mobile Health…………….……………..….…………………………….. 48
Q4 - Telehealth…………….……………..….……………………………..…. 56
Q4 - Personal Health…………….…………………………………..….……. 58
Q4 - Scheduling, Rating & Shopping…………….…………..….……….…. 59
Q4 - Social Health…………….……………..….…………………….………. 60
VC Funding by Stage……………..………………………………..…….….……..….…. 61
Q4 - VC Funding by Stage………………………………………………...….………..... 63
VC - Activity by Country…………..………………………………................................. 65
2016 VC Funding Amount by U.S. State…………………….…..……………….......... 66
Q4 - VC Activity by Country…..………………………………………..….……….......... 68
Q4 - VC Funding Amount by U.S. State…………………….……….…..……….......... 70
Q4 - Trends in VC Funding Large vs Smaller Deals ……………..…....................... 72
Top VC Funding Rounds….………………………………….……………................... 73
Q4 - Top VC Funding Deals …..…………………...…………….….……...………….. 75
2010 – 2016 Top VC Investors……..………….….……….…...…………………..…… 77
2016 Top VC Investors……..………….….……….…...……………..…………..…….. 78
Q4 - Top VC Investors….……………………..…………...….…………………………. 79
Q4 - VC Deals………………………..……………………………….………..….….…… 80
Q4 - VC Investors by Technology Areas….………………..……...………...….……… 95
Top Accelerators/Incubators…………..………….……………………………………… 110
Q4 - Top Accelerators/Incubators……………………….………….…………………… 111
Debt and Public Market Financing……………………….………………….…………………… 112
Top 5 Debt and Public Market Financing Deals……….………….…………………… 113
Q4 - Debt and Public Market Financing Activity………….…………………………… 114
Q4 - Debt and Public Market Financing Investors…………………..………………… 114
Initial Public Offering (IPO)…………………………….……………….…………..………..…… 115
TABLE of
CONTENTS

2016 Fourth Quarter and Annual Healthcare IT Funding and M&A Executive Summary
10 Copyright 2010-2017 | Mercom Capital Group | www.mercomcapital.com | [email protected]
Merger and Acquisition (M&A)…………………………….………………………………...…… 119
Q4 - M&A by Quarter……………………………………………………………………… 120
M&A by Technology………..…………………………………………….…….…….…… 121
M&A by Sub-Technology………..…………………………………………….…….…… 123
Q4 - M&A by Technology………..……………………………………….…….…….…… 126
Active Acquirers………..……………………………………….…….…….…….............. 128
M&A - Activity by Country…………..………………………………................................ 133
Top M&A Transactions….……………………………………….…………….................. 134
Q4 - Top M&A Transactions….……………………………………………….................. 135
M&A Transactions….………………….…………………………………………………… 136
New Healthcare Funds….………………….……………………………………………… 141
Q4 - Restructuring and Downsizing….………………….………………………………… 142

2016 Fourth Quarter and Annual Healthcare IT Funding and M&A Executive Summary
11 Copyright 2010-2017 | Mercom Capital Group | www.mercomcapital.com | [email protected]
Get the Full Report including
Transaction Tables
Click here to purchase
Mercom’s Q4 and Annual 2016 Healthcare IT
Funding and M&A Report
Includes Q4 2016 transactions and investor
lists
Subscribe to Mercom’s weekly
Healthcare IT market intelligence report.
Visit:
MercomCapital.com
to purchase past reports
DISCLAIMER: © 2017 by Mercom Capital Group, llc. All rights reserved. Mercom hereby grants user a personal, non-exclusive, non-refundable, non-transferable license to use the Report for research purposes only. Mercom retains exclusive and sole ownership of all its Reports. When quoting from this report, please cite “Mercom Capital Group, llc”. Information contained in this publication is derived from carefully selected sources we believe to be reliable. Mercom, its employees, affiliates, agents, and licensors do not warrant the accuracy, completeness, currentness, non-infringement, merchantability, or fitness for a particular purpose of this report. Nothing in this report constitutes or should be taken as investment advice. For information about this document, please contact us at 512-215-4452 or via email at: [email protected].