REPORT PREPARED FOR
44
Page: 0 of 43 COVER PAGE: WAIMEA PLAINS NITRATE ISSUES – SCIENCE SUMMARY 2020 REPORT PREPARED BY: Andrew Fenemor, catchment management consultant, Nelson REPORT PREPARED FOR: Tasman District Council, Natural Resources Policy Team VERSION DATE: September 2020 This report summarises the science information available to Tasman District Council, concerning the topic of nitrates in Waimea aquifers, as at September 2020. It may be subject to updates, if and when further information is made available. STATUS: Public
Transcript of REPORT PREPARED FOR

Page: 0 of 43
COVER PAGE:
WAIMEA PLAINS NITRATE ISSUES – SCIENCE SUMMARY 2020
REPORT PREPARED BY:
Andrew Fenemor, catchment management consultant, Nelson
REPORT PREPARED FOR:
Tasman District Council, Natural Resources Policy Team
VERSION DATE: September 2020
This report summarises the science information available to
Tasman District Council, concerning the topic of nitrates in Waimea
aquifers, as at September 2020. It may be subject to updates, if and
when further information is made available.
STATUS: Public
Page: 1 of 43
WAIMEA PLAINS NITRATE ISSUES – SCIENCE SUMMARY 2020
Andrew Fenemor, catchment management consultant, Nelson
TABLE OF CONTENTS
1. Purpose of Report ........................................................................................................................................................ 1
2. The Nitrate Management Challenge ..................................................................................................................... 2
3. Waimea Conceptual System Model ...................................................................................................................... 3
4. Synthesis of Existing Science Knowledge ......................................................................................................... 4
a. Sources .................................................................................................................................................................. 4
b. Pathways ............................................................................................................................................................. 14
c. Receiving Waters ............................................................................................................................................. 26
d. Whole system science ................................................................................................................................... 30
e. Datasets not reported above ....................................................................................................................... 36
5. Conclusions ................................................................................................................................................................... 38
6. Acknowledgements .................................................................................................................................................... 39
7. Bibliography .................................................................................................................................................................. 39
8. General References relevant to Nitrate Loss and Fate (courtesy A Becher, TDC) ........................ 43
1. Purpose of Report
Tasman District Council wishes to develop a policy response to the high nitrate-nitrogen concentrations
measured in some Waimea Plains aquifers and surface water bodies. This work will build on the
deliberations of the Waimea Freshwater and Land Advisory Group (Waimea FLAG) which during 2014-
15 reviewed water quality management in the Waimea catchment but whose work was deferred due to
Council giving priority to similar work with the Takaka FLAG.
A policy response has become more urgent with the requirement in Government’s National Policy
Statement for Freshwater Management (NPSFM 2020) to set water body limits which maintain or
improve water quality, alongside the recognition that nitrate concentrations in parts of the Waimea
basin exceed some standards for drinking water quality and for protecting some ecological values.
Council’s Tasman Resource Management Plan (TRMP) Change 48 has also committed Council to
working with stakeholders and land users to examine the water quality issues in the Plains in more detail
and to develop management objectives and associated limits to manage water quality in the Plains.
The current workstream comprises two parts: (1) a summary of the present state of science knowledge
about the nitrate issue in the Waimea, and (2) options assessment for policy responses. This report
addresses workstream (1).
Page: 2 of 43
2. The Nitrate Management Challenge
Nitrate-nitrogen (hereafter labelled nitrate) is the most stable and dominant form of nitrogen
compound found in water environments globally. It is highly soluble so is easily flushed through
landscapes. At moderate concentrations it is needed, along with phosphate and trace elements to
stimulate plant growth; this is one reason the use of nitrogen fertilizers has increased markedly over
recent decades, especially for dairy, arable and horticulture land uses. Increased use of nitrogen and
other fertilizers allows intensification of agricultural production, whether that be more dairy cows per
hectare or more vegetable production especially during the shoulder growing seasons in spring and
autumn. Importantly, losses of nitrogen do not originate solely from leaching of fertilizer but from soil
nutrient conversion processes and, in the case of livestock farming, from deposition of animal urine and
faeces from increased livestock densities.
Nitrogen losses are a more significant problem in the environment than phosphate because nitrogen is
easily leached whereas phosphate is readily – although not totally – absorbed on to soil and sediment
particles. Oxidation of forms of nitrogen such as ammonium creates nitrate-nitrogen which is more
stable and difficult to remove by water treatment processes. Natural processes of denitrification can
reverse the oxidation process converting nitrate to nitrite and then to nitrogen gas, which is benign in
the environment, however many water bodies have reasonable levels of dissolved oxygen which does
not allow denitrification to occur.
Excessive concentrations of nitrate in surface waters will stimulate growth of aquatic plants and algae,
leading at higher concentrations to eutrophication, including loss of oxygen from the water and die-off
of aquatic life including fish and macroinvertebrates. In recreational waters, these conditions make the
water unpleasant for swimming, boating and in its appearance. Higher concentrations of nitrate are
directly toxic to some aquatic species. At higher concentrations still, the water poses a risk for drinking,
especially by bottle-fed infants who may develop methaemoglobanaemia (blue baby syndrome, similar
to the bends experienced by divers); the NZ Drinking Water Standards have a limit of 11.3 mg/l nitrate-
nitrogen because of this risk A recent Danish study (Schullehner at al, 2018) also suggests that nitrate-
nitrogen concentrations in drinking water exceeding 0.9 mg/l over the long term may increase people’s
risk of colorectal cancer.
Management of nitrogen losses into water bodies (along with phosphorus, pathogens and sediments)
has become a major focus of water quality management. The potential inclusion of a national ‘bottom
line’ limit of 1 mg/l Dissolved Inorganic Nitrogen (DIN)1 among the compulsory attributes in the NPSFM
prompted thousands of submissions on the government’s 2020 Essential Freshwater reforms. A decision
on including DIN in the national framework has been deferred for a year2 due to concerns both about
the efficacy of national limits on a single attribute, and what any limit should be. There were many
submissions advocating for limits to be tailored to local catchment conditions and community values,
determined locally.
The NPSFM continues to prescribe regional planning processes to set water quality limits alongside
nationally mandated targets and limits for attributes including periphyton, and ammonia and nitrate
toxicity. Thus, it is up to Tasman District Council - via the TRMP - to decide its own water quality limits,
provided they comply with NPSFM bottom lines.
1 Dissolved Inorganic Nitrogen comprises nitrate and ammonia and is the attribute which best
represents the nitrogen supply readily available to aquatic primary producers, i.e. potentially causing
eutrophication. Ammonia is generally low in groundwaters. DIN = NO3-N + NH4-N 2 https://www.mfe.govt.nz/publications/fresh-water/decision-national-direction-freshwater-glance-
summary
Page: 3 of 43
3. Waimea Conceptual System Model
In order to structure this science review, it is helpful to use a ‘cause and effect’ conceptual model
because the policy responses, and ongoing science and monitoring, will likely need to focus on
interventions at both the source (land management and discharges) and in the various receiving waters
(groundwater, streams and the estuary).
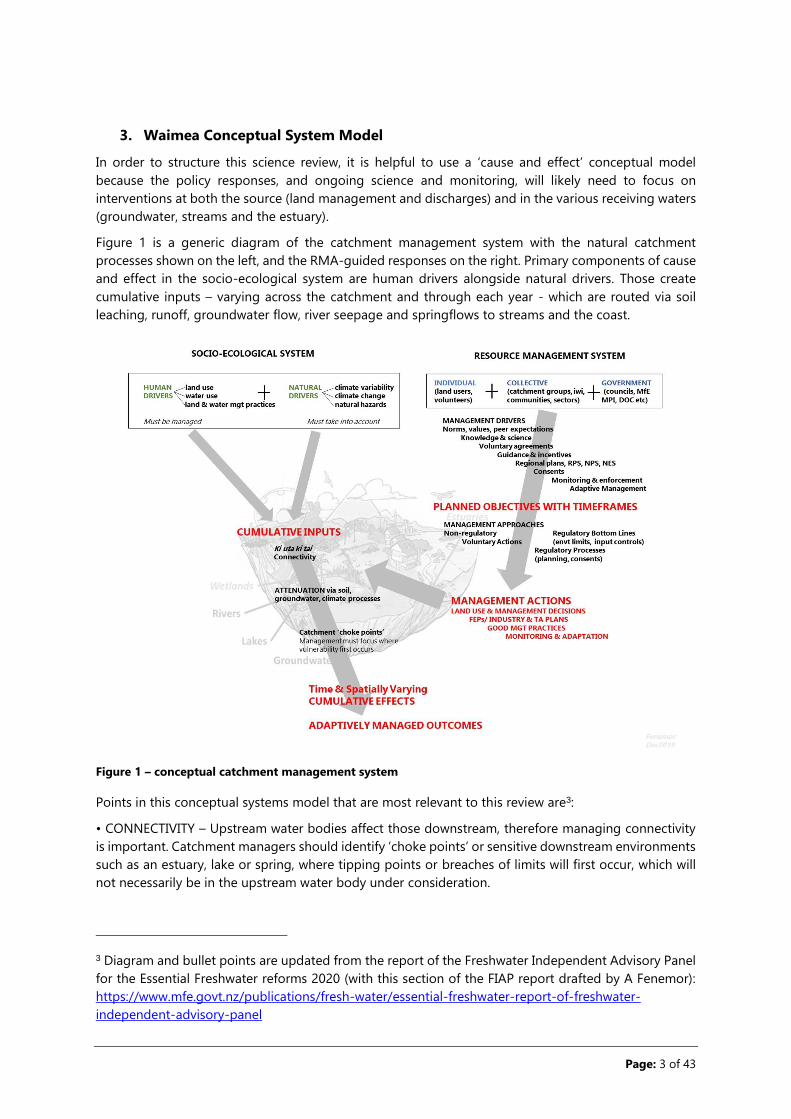
Figure 1 is a generic diagram of the catchment management system with the natural catchment
processes shown on the left, and the RMA-guided responses on the right. Primary components of cause
and effect in the socio-ecological system are human drivers alongside natural drivers. Those create
cumulative inputs – varying across the catchment and through each year - which are routed via soil
leaching, runoff, groundwater flow, river seepage and springflows to streams and the coast.
Figure 1 – conceptual catchment management system
Points in this conceptual systems model that are most relevant to this review are3:
• CONNECTIVITY – Upstream water bodies affect those downstream, therefore managing connectivity
is important. Catchment managers should identify ‘choke points’ or sensitive downstream environments
such as an estuary, lake or spring, where tipping points or breaches of limits will first occur, which will
not necessarily be in the upstream water body under consideration.
3 Diagram and bullet points are updated from the report of the Freshwater Independent Advisory Panel
for the Essential Freshwater reforms 2020 (with this section of the FIAP report drafted by A Fenemor):
https://www.mfe.govt.nz/publications/fresh-water/essential-freshwater-report-of-freshwater-
independent-advisory-panel
Page: 4 of 43
• SCALE – Freshwater management should focus at the catchment scale, ki uta ki tai (from the mountains
to the sea). Although Freshwater Management Units (FMUs) may be defined for catchments or sub-
catchments, planning will also need to account for differences at other scales including among water
bodies and freshwater ecosystems.
• HUMAN IMPACTS – Human activities (land and water use and their management) are amenable to
policy/rules/action, while natural events (mainly climate) can only be factored into management.
• CUMULATIVE EFFECTS – Collective management will be needed to achieve catchment scale outcomes
because of the cumulative effects of a mosaic of land uses and practices. The same land uses applied in
two different patterns will produce different downstream flows and water quality.
• ENGAGEMENT – Decisions should encourage land user engagement yet recognise the need for
regulatory vs non-regulatory action, depending on the catchment and stakeholder setting. Buy-in by
land users into sometimes difficult decisions requires a level of trust.
For the purpose of this review, and drawing on this system characterisation, the science knowledge is
categorised into:
Sources: human drivers, including land use, water use, land and water management practices
Pathways: characterising flowpaths to receiving waters and their contaminant attenuation
processes, including soil filtering, plant uptake, groundwater and river recharge dilution,
geochemical processes
Receiving waters: groundwaters, streams and surface waters where nitrate concentrations may
breach ecological or water use limits, including eutrophication or drinking water limits
Whole system science: integrative studies unable to be easily separated into the three
categories above.
Science knowledge reviewed comprises scientific reports, journal papers, reports to Council, informal
reports and datasets. Where datasets exist but have not been analysed, their existence is simply noted.
For each body of knowledge, a summary of key points relevant to potential policy responses for nitrate
management is provided (implications), plus commentary on outstanding issues which may require
further investigations or analysis (gaps). References are listed in date order as some build on previous
work.
4. Synthesis of Existing Science Knowledge
a. Sources
Sources means the drivers of water contamination ‘downstream’, in this case focusing on nitrate, but at
the same time recognizing that other contaminants including E.Coli as an indicator of pathogen
contamination, phosphorus as another indicator of nutrient enrichment, sediment as an indicator of
erosion processes, and potentially synthetic chemicals require monitoring and management.
The primary sources of nitrate contamination in the Waimea catchment are agricultural and livestock
land uses, and associated management practices. Secondary sources are human wastewater discharges
from septic tanks, as most other sewage discharges are reticulated for treatment and discharge beyond
the Plains (e.g. the Regional Sewerage Scheme discharge from Bells Island to Waimea Inlet on the
outgoing tide).

Page: 5 of 43
Dryden, G; Hosie, C; Fenemor, A; Price, R; Green, S. 2017. Land use viability, Waimea Plains. Fruition
Horticulture consultancy report for Crown Irrigation Investments Limited (CIIL) and Waimea Irrigators
Limited (WIL). 67p.
This work identifies opportunity for land use change to irrigation, based on current land use, soils and
climate, building on the approach developed in Fenemor et al (2015). It provides guidance on the types
and limits of future land uses, and hence potential future nutrient losses, which may arise following
provision of water from the Waimea Community Dam, and without it.
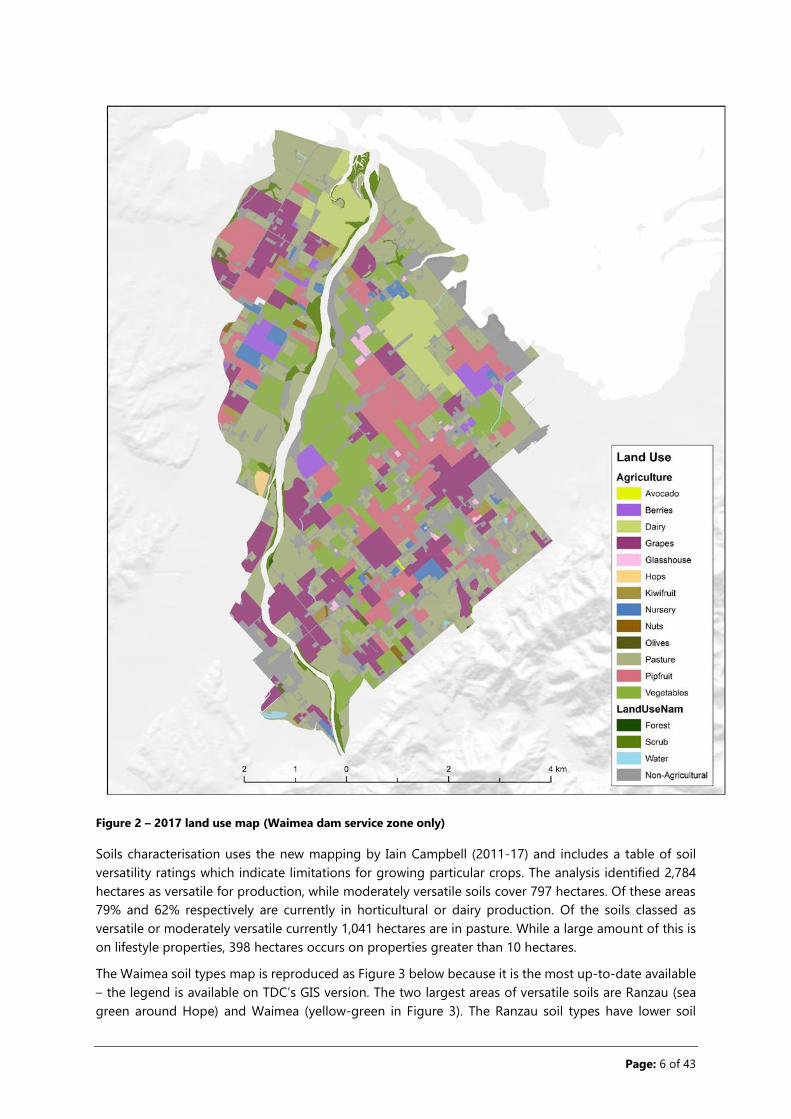
Currently within the Scheme Area of around 5000 hectares there are 2,616 hectares in horticultural or
dairy production and a further 1,359 hectares identified as pasture. The 2017 land use map is reproduced
as Figure 2 as this is the most recent.
Page: 6 of 43
Figure 2 – 2017 land use map (Waimea dam service zone only)
Soils characterisation uses the new mapping by Iain Campbell (2011-17) and includes a table of soil
versatility ratings which indicate limitations for growing particular crops. The analysis identified 2,784
hectares as versatile for production, while moderately versatile soils cover 797 hectares. Of these areas
79% and 62% respectively are currently in horticultural or dairy production. Of the soils classed as
versatile or moderately versatile currently 1,041 hectares are in pasture. While a large amount of this is
on lifestyle properties, 398 hectares occurs on properties greater than 10 hectares.
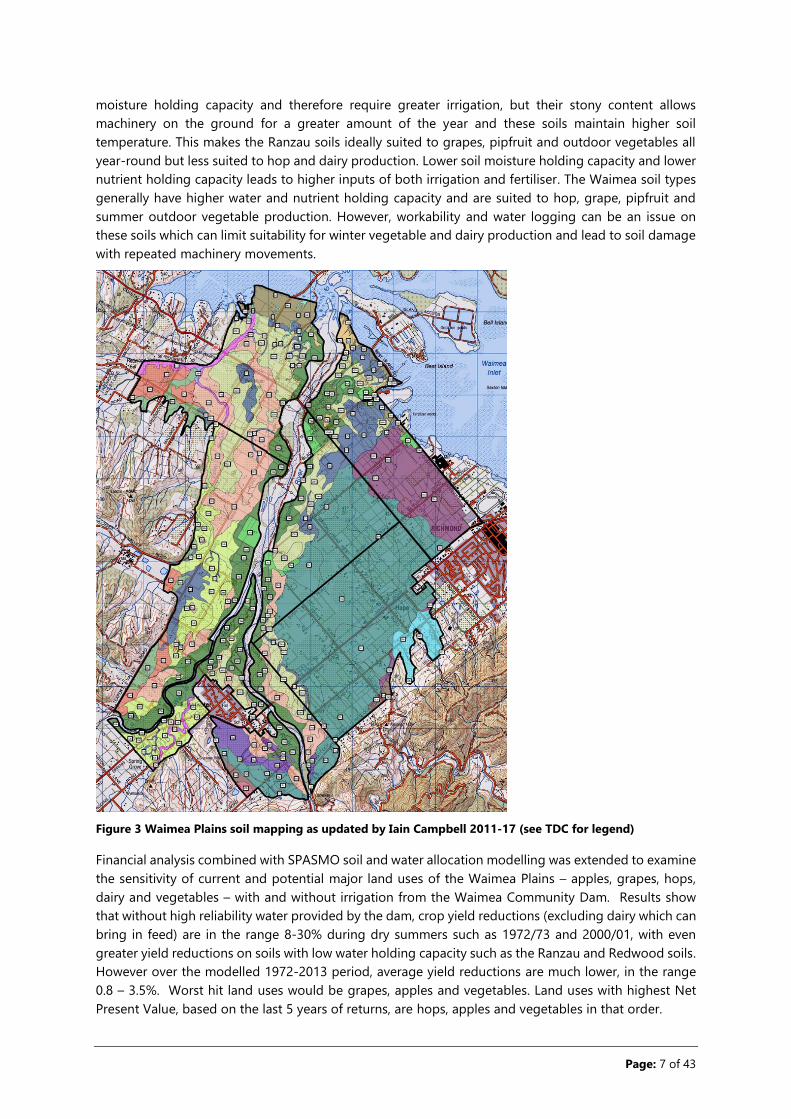
The Waimea soil types map is reproduced as Figure 3 below because it is the most up-to-date available
– the legend is available on TDC’s GIS version. The two largest areas of versatile soils are Ranzau (sea
green around Hope) and Waimea (yellow-green in Figure 3). The Ranzau soil types have lower soil
Page: 7 of 43
moisture holding capacity and therefore require greater irrigation, but their stony content allows
machinery on the ground for a greater amount of the year and these soils maintain higher soil
temperature. This makes the Ranzau soils ideally suited to grapes, pipfruit and outdoor vegetables all
year-round but less suited to hop and dairy production. Lower soil moisture holding capacity and lower
nutrient holding capacity leads to higher inputs of both irrigation and fertiliser. The Waimea soil types
generally have higher water and nutrient holding capacity and are suited to hop, grape, pipfruit and
summer outdoor vegetable production. However, workability and water logging can be an issue on
these soils which can limit suitability for winter vegetable and dairy production and lead to soil damage
with repeated machinery movements.
Figure 3 Waimea Plains soil mapping as updated by Iain Campbell 2011-17 (see TDC for legend)
Financial analysis combined with SPASMO soil and water allocation modelling was extended to examine
the sensitivity of current and potential major land uses of the Waimea Plains – apples, grapes, hops,
dairy and vegetables – with and without irrigation from the Waimea Community Dam. Results show
that without high reliability water provided by the dam, crop yield reductions (excluding dairy which can
bring in feed) are in the range 8-30% during dry summers such as 1972/73 and 2000/01, with even
greater yield reductions on soils with low water holding capacity such as the Ranzau and Redwood soils.
However over the modelled 1972-2013 period, average yield reductions are much lower, in the range
0.8 – 3.5%. Worst hit land uses would be grapes, apples and vegetables. Land uses with highest Net
Present Value, based on the last 5 years of returns, are hops, apples and vegetables in that order.
Page: 8 of 43
Implications: Despite the higher N losses modelled and reported in Fenemor et al (2015) for vegetables
using SPASMO, this financial analysis suggests that favoured land uses for expansion post-dam would
be hops, apples and vegetables. Expansion of these land uses is constrained by the amount of versatile
land in small lifestyle blocks and the relatively small area of currently unirrigated land in economic
blocks. There has been some expansion of hops on Waimea, Dovedale and Motupiko soils but generally
the Waimea Plains are considered too windy for hop growing (Greg Dryden, pers. comm).
Gaps: When updated SPASMO or other nutrient modelling is undertaken, other potentially dominant or
leaky land use/soil combinations should be included.
This report contains the most recent land use and soils maps, available as GIS layers at TDC. It is
suggested that Council instigate a programme of 5-yearly land cover mapping to maintain datasets
available for the types of N-loss and financial modelling contained in this report, which would inform
ongoing policy development and implementation.
Agribusiness Group 2015. Nutrient Performance and Financial Analysis of Horticultural Systems in the
Waimea Catchment. Report by S.Ford for Horticulture NZ and Waimea FLAG. 23p.
https://www.hortnz.co.nz/assets/Natural-Resources-Documents/Nutrient-Performance-and-Financial-
Analysis-of-Horticultural-Systems-on-the-Waimea-Plains-Final-May-2015.pdf
The objective of the study was to collect primary physical, financial and environmental data from
growers in the Waimea Catchment and to provide representative models of horticultural systems and
to analyse the impact of mitigation practices on the environmental and economic performance of the
farms. Twelve growers were interviewed across vege growing, pipfruit, kiwifruit and vineyard land uses.
Preliminary results were presented to the Waimea FLAG in 2015 as a contribution to understanding what
changes in land management may be possible to reduce nutrient losses in the Waimea Plains.
The report includes the following useful excerpt from an Environment BOP report (Meneer et al ND) on
vegetable growing as a source of leached N:
The main factors responsible for nitrate leaching in these systems are: high N use (fertiliser and
manure), frequent cultivation, relatively short periods of plant growth, low nutrient use
efficiency by many vegetable crops, and crop residues remaining after harvest (Di and Cameron,
2002a).
Compared to other agricultural systems, market gardens are the most intensively fertilised and
cultivated production systems - hence their propensity to leach N. N application rates used in
vegetable crops can be as high as 600 kg N ha-1 yr-1 (Wood, 1997). Large application rates are
used to ensure maximum growth because vegetable crops have sparse root systems that are
inefficient at recovering applied fertiliser. Also, vegetables typically have short growing periods
and are also grown over winter when plant growth and N uptake is slow (Haynes and Francis,
1996; Haynes, 1997). Therefore, the recovery of applied N by vegetable crops is often less than
50%, and can be as low as 20% (Di and Cameron, 2002a). Consequently, a large quantity of
fertiliser N remains in the soil surface layers and is susceptible to leaching during rainfall or
irrigation. Additionally, following crop harvest large amounts of plant residues are usually
incorporated into the soil which, following decomposition, release mineral N into soil. The
amount of mineral N derived from fertiliser and crop residue that is present in the soil after
harvest can be as high as 200-300 kg N ha-1, and is the major source of leached N, indicating
that fertiliser N management strategies are the key to nitrate leaching intervention in these
systems.

Page: 9 of 43
Pipfruit systems are relatively high users of Nitrogen (175 kg N / ha) in the growing years of the crop
(years 1 to 3). Once the crop reaches its mature size then very little Nitrogen fertiliser (40 kg N / yr) is
used, although this small amount used is critical for the next year’s yield.
Kiwifruit has a relatively high requirement for Nitrogen fertiliser annually (120 kg N / ha), primarily during
the growth phase of the vines in spring.
Grapes use a relatively small amount of Nitrogen fertiliser during the growing of the young vines (65 kg
N / ha ) then once the vine is mature very little (14 kg N / ha).
In this study, three mitigation techniques to reduce N losses were modelled using OVERSEER on either
Ranzau or Waimea soils (as appropriate for the crop) and produced the N losses of Table 1:
Mitigation M1 – Limiting N application so that no application of N exceeds 80 kg N / ha per month
(with status quo irrigation).
Mitigation M2 – Reduce the amount of N applied to the crop in 10% increments from 0 to 30% (with
status quo irrigation).
Mitigation M3 – Apply only the amount of water which is required by the crop as determined from the
OVERSEER 6.1.3 model (with status quo N applications).
Table 1: Whole Orchard N leaching results (kg N / ha / annum)
Status
Quo
M1 M2
-
10%
M2
-
20%
M2
-
30%
M3
Vegetables (Onions > Cabbage > Lettuce >
Squash)
24 24 22 21 19 23
Pipfruit (40ha apples, 34 is mature orchard) 24 24 23 23 22 17
Kiwifruit (15ha with 12 ha mature orchard) 37 37 35 34 32 35
Vineyard (50ha with 42ha mature vines) 6 6 6 5 5 5
Capping N applications to 80 kg/ha/month (M1) had no effect on the total amount of N leaching
because no grower was applying more than that anyway. Reducing the amount of N applied in
increments of 10% (M2) had more effect on N losses for vegetables [2-5 kg/ha/yr less] and kiwifruit [2-
5 kg/ha/yr less] but little or no impact on pipfruit [1-2 kg/ha/yr less] and grapes [0-1 kg/ha/yr less].
Vegetables and kiwifruit are relatively high users of Nitrogen fertilisers while pipfruit and grapes are
relatively low. Reducing irrigation to only that required (M3) has a significant impact for pipfruit –
modelled on Ranzau soils - but little impact otherwise.
Gross margins ($/ha) are presented in the report. Of the three mitigations, only M2 impacts farm
financial results but the reductions are severe. For vegetable production, a 50% loss for the 10%
reduction in N application increasing to 134% at the 30% reduction. For pipfruit, the losses are 18%
increasing to 83%. For kiwifruit, 21% increasing to 118%, and for vineyard production, 9% increasing to
28% at the 30% fertilizer reduction.
Implications: Results indicate that reducing N applied will reduce losses but is a blunt tool with financial
consequences for all crops modelled. The modelling is based on various assumptions in OVERSEER 6.1.3

Page: 10 of 43
which average and simplify actual farm practice, e.g. monthly data inputs only, assumptions about
whether only the crop or entire area is being fertilised, assumptions about monthly irrigation water
applied, and no ability to model slow release fertilizers or more organic approaches. Until OVERSEER is
better tailored and validated for horticultural crops, these results should be used only in a relative sense
rather than believing the absolute N losses modelled.
Gaps: There would be value in more refined modelling of N losses from the Waimea land uses which
are seen as higher N leachers, using either SPASMO, APSIM or improved versions of OVERSEER. Gross
margin analysis is a useful but blunt tool for evaluating financial consequences of potential mitigations.
Rainham, D. 2015. Investigating Soil nitrate movement under intensive vegetable production on the
Waimea Plains, Tasman. Agfirst Consultants report for R Conning and M O’Connor. December. 18p.
[permission given by Robbie Conning and Mark O’Connor to cite this report]
This small trial monitored nitrate movement based on 8-9 samples each from suction cup soil water
samplers under a cauliflower crop at one site each on Ranzau stoney clay loam (Rz) and Waimea clay
loam (Y). Sampling occurred over the 160 day autumn to spring growing period after planting in March
and April 2015 respectively. A control plot at each site had no fertilizer applied while normal fertilizer
practices applied at the adjacent plot. Nitrate loss was calculated as the difference between N
concentrations in soil water for the standard plot compared with the control.
Results showed that N leached past the root zone whether fertilizer N was applied or not: 62 kg/ha on
Ranzau soil and 72 kg/ha on Waimea soil. Adding N fertilizer increased leaching losses with an additional
59 kg/ha leached from Ranzau but only an additional 18 kg/ha from the heavier Waimea soils. Fig 7
indicates for the Ranzau trial, fertilizer applications of 155 kg/ha at planting and side dressing of 80
kg/ha 45 days after planting with most leaching occurring in the first half of the growing cycle late
March-early May. Fig 8 indicates for the Waimea trial fertilizer applications of 80 kg/ha 6 days after
planting then 2 dressings of 250 kg/ha 32 and 60 days after planting with the small amount of leaching
occurring late in the growing cycle August-September. Despite less than half the amount of N being
applied on Ranzau soil than on Waimea in this trial, two thirds more N was leached from the Ranzau
plot.
Implications: The study shows that despite N being regarded as highly mobile in soil because of its
solubility, market gardening leaves considerable N in the soil over winter, which results in ongoing N
losses even if no more fertilizer is applied. However the residual soil N is insufficient to produce a
marketable cauliflower crop without further fertilizer. Reducing N losses especially from light stoney
soils like the Ranzau requires smaller fertilizer applications early in the growing cycle.
Gaps: The influence of rainfall on leaching rates is not clear from the report despite rainfall having been
measured as well as irrigation. Because the methodology estimates N losses from difference in soil N
concentrations between control and treatment plots, it is possible that heavy rainfalls may have leached
slugs of N past the suction cups without detection. Some form of continuous soil moisture sampling
would overcome this.
However, these types of field trials are relatively inexpensive compared with full-scale lysimeter trials
collecting leachate from the base of the soil profile. Trials that continue through a full hydrological year,
and linked to modelling of leachate losses using SPASMO, APSIM or OVERSEER would provide better
knowledge of leaching processes and enable improved N loss estimation across major land uses of the
Waimea Plains.
In November 2014 it was reported to FLAG that Dean Rainham was carrying out a benchmarking project
surveying a much wider group of growers to gathering information on practices pertaining to nutrient
Page: 11 of 43
use and irrigation (11 growers, 14 crops (7 vege, 7 fruit), 6 soil types), but I understand the Agribusiness
report for HortNZ summarised above is the outcome – at smaller scale - of that work.
Shaw, J. 1997. Land use survey – Hope/Ranzau area of the Waimea Plains. Tasman District Council report,
November. 47p.
This is a well crafted and extensive student project for TDC which surveyed and interviewed 244 land
users across 2089ha [1981ha effective] of the eastern Waimea Plains (mostly the area of the Ranzau
soils). One aim was to map land use in 9 categories: dairy (13% by area), horticulture (31%), market
gardening (10%), agriculture (25%), forestry (7%), lifestyle block (4%), cropping (5%), uncultivated
(buildings, driveways etc; 4%) and other (1%). Previous land use(s) are also recorded, indicating a decline
in cropping from 13 to 5%, a decline in agriculture from 34 to 25%, a decline in market gardening from
12 to 10%, an increase in horticulture from 15 to 31% and in lifestyle blocks (including septic tanks) from
1 to 4%.
The study also determined patterns of fertilizer use, crop management practices which may affect N
loss, water source and use of irrigation, sewage disposal, and animal grazing systems. 188 of 244
respondents used fertilizer, most applying twice a year in spring and autumn and many basing
applications on soil tests from Ravensdown. Page 13 is a pie chart of total fertilizer by type, totalling
262 t/yr of which most include N. Fig 2 of the report maps fertilizer usage as <1 t/ha, 1-2 t/ha and
>2t/ha with 33% of the area using >2t/ha (dairy, horticulture and market gardening). Market gardening
uses by far the most substantial amounts of fertilizer at 493 kg/ha compared with horticulture at 155
kg/ha and the rest lower. One nursery with plants in planter bags was calculated as applying the
equivalent of 40 t/ha.
Land used for crops was mainly in continuous use with little fallowing. At this time, most irrigators had
little idea how much water they were using but irrigated ‘when needed’ within their allocations. The
report suggests – without any detail - an allocation system for fertilizer similar to that for water, and
guidance on land management activities which should be promoted and discouraged.
Implications: This is a useful snapshot from 23 years ago of changing land use and fertilizer practices. It
highlights the intensification of land use in the eastern Waimea Plains and the large amounts of fertilizer
used by market gardening (vege growing) compared to all other land uses.
Gaps: There is no substitute for interviews using a well-defined set of questions to map actual activities.
With some additional rigour in the survey design, this approach could be repeated say every 10 years
alongside land cover mapping in order to link land use with management practices, for use in modelling
and policy refinement. It would also be a way to raise awareness and provide information on good
management practices (GMPs). The complete spreadsheet of interview responses in Appendix 2 is a
useful data source against which future surveys could be compared. Any repeat survey should ideally
cover the whole plains, but with limited resources could be tailored to areas upstream of the most
vulnerable receiving waters including the confined aquifers and spring-fed streams.
Simmonds B and M Westley. 2020. Waimea Plains nitrate supplementary data: land-use, soil and
groundwater. TDC Operations committee report, summary report ROCCCC20-02-4 and presentation.
February. 26p, 9p & 20p. [soils component]
Council staff completed soil sampling and analysis at 80 sites during winter 2017 and 2018 on the
eastern Waimea Plains to analyse soil properties beneath four main land uses (market garden, pasture,
pipfruit and viticulture) and to link these with locations of high nitrate groundwater such as the
Ranzau/Bartlett Road area [groundwater commentary is provided below under Pathways].

Page: 12 of 43
Soil samples were taken at near-surface (7-17.5cm) and subsurface depths (30-40cm) to measure soil
nitrate, other soil fertility indicators (e.g. Olsen P, sulphate-S), soil carbon, total nitrogen and estimates
of mineralisable organic nitrogen. Only N results are mentioned here.
In topsoil samples, market garden sites had higher soil nitrate (and other nutrient) levels and lower soil
organic matter levels, nitrogen storage and potentially mineralisable nitrogen compared to pasture,
pipfruit and viticulture.
In subsoil samples, mean nitrate levels were three to four times higher under market gardens compared
to pasture, pipfruit and viticulture (Figure 4). Subsoils were stony and permeable making them prone to
excessive drainage and leaching. The subsoil depth is also close to the rooting depths of some vegetable
types grown on the Waimea Plains and therefore potentially represents a depth limit for vegetable
nutrient uptake. This makes high subsoil nitrate levels a concern as plants will not be able to take up
this nitrate which increases the risk of it leaching to groundwater.
Figure 4 – mean soil nitrate, topsoil and subsoil for 4 land uses
Soil sampling results indicate that the risk for nitrate leaching in the study area is likely to be elevated
under market gardening. Market gardens appeared to receive more frequent and/or higher fertiliser
nitrogen inputs compared to the other systems. The lack of soil organic matter, coupled with well-
drained soil properties and high nitrate levels (particularly at subsoil depths) makes market gardening
a higher risk land use for nitrate leaching on the Waimea Plains, when compared to pipfruit, pasture
and viticulture.
Implications: Market gardening is identified as needing particular attention for N-loss reduction. The
report outlines some N-loss mitigations useful for policy consideration. These include efficient use of
irrigation to reduce soil drainage losses, avoidance of fertilizing before rain, slow-release fertilizers,
matching fertilizer to crop needs, allowing for crop residues and soil N when N budgeting, use of deep-
rooted cover crops, use of soil carbon amendments such as biochar and increased organic matter.
Gaps: This method appears useful for identifying N-loss risk. It could be expanded to a wider range of
soil-crop combinations. For example, the question has been asked why groundwater N concentrations
west of the Waimea River are lower than on the eastern side, down-gradient of market gardening.

Page: 13 of 43
Factors causing this would likely include the heavier soils (more retentive of N), the shorter duration of
market gardening in some western areas, and the greater dilution provided by higher flow rates though
the underlying Appleby Gravel Unconfined Aquifer.
At the September 2014 FLAG meeting, HortNZ acknowledged that managing soil organic carbon/matter
is one of the key things to consider in managing nitrate. The comment was made that for vegetable
growing the main source of modelled nitrogen leaching is from cultivation, and consequential N-
mineralisation, rather than fertilizer use. This points to methods such as biochar, organics, compost, and
no-till to improve N retention through carbon adsorption. HortNZ had a network of lysimeters in
Canterbury, Pukekohe, Pukekawa, and Hawkes Bay to measure nitrate leaching over 4 years, so any
information from those studies should be obtained to provide input data for modelling and policy
development.
Page: 14 of 43
b. Pathways
Stanton DJ and J L Martin. 1975 Nitrate levels in subsurface waters of the Waimea Plain, Nelson. NZ
Journal of Marine and Freshwater Research, 9:3, 305-309, DOI: 10.1080/00288330.1975.9515570
This is the first published evidence for high nitrate concentrations in groundwaters of the Waimea Plains,
dating back to 1969-72. 122 wells were sampled ranging in depth from 2.5 to 35m. Four had nitrate
exceeding 30 mg/l (with 50 mg/l occurring in one well), fifteen in the range 30-20 mg/l, 46 between 20
and 10 mg/l, 57 below 10 mg/l and only four below 1 mg/l. In comparison the Wairoa River at the gorge
had 0.07 and the Wai-iti 0.5-2 mg/l.
The authors’ Fig 1 shows a nitrate plume directed northwards and centred on Main Road Hope between
Edens and Ranzau Roads (>30 mg/l), with no results west of the Waimea River included within the 10
mg/l contour
Implications: This work was carried out prior to characterisation of the separate aquifers underlying the
Plains (see Dicker et al 1992) so the plume mapped in the authors’ Fig 1 combines data from all well
depths but many wells in the shallower Hope aquifers. The high concentrations mapped at this early
date would suggest sources not solely linked to the historic piggery at Aniseed Valley Road/Haycock
Road.
Gaps: This work was the genesis of ongoing nitrate surveys summarised below.
NMRC, NCC and TDC. 1990. Waimea Basin – water resource and water supplies. Summary report on
reticulated supplies by J Wareing, P Dougherty, N Tyson & A Fenemor. July. 12p.
This regional council report provided a summary of Waimea water resources and water reticulation
schemes existing in 1990. Reticulations schemes comprised the Maitai Dam (1987), the upper Roding
River (1940), the decommissioned Reservoir Creek supply to Richmond (1886-1968?), the lower Queen
Street wellfield (Lower Confined Aquifer; 1968), the Waimea supply (Appleby Gravel Unconfined Aquifer;
1976), Hope/Brightwater supply (AGUA;1976), Wakefield water supply (AGUA; 1973) and Neimann Creek
supply (surface water; 1970).
On water quality, the report notes that the lower Queen St supply has nitrate exceeding 10 mg/l and
has shown an upward trend for the previous 10 years (1980-90). A single water quality analysis for each
supply is included in s8.2 and shows a May 1986 concentration in the Richmond supply of 14 mg/l
nitrate-nitrogen [which exceeds the current drinking water standard of 11.3 mg/l].
Implications: Dilution of Richmond’s lower Queen St supply with Waimea supply water is mentioned as
a potential solution [this has now happened].
Gaps: ?
Dicker, M.J.I.; Fenemor, A.D.; Johnston, M.R. 1992. Geology and Groundwater Resources of the Waimea
Plains, Nelson. Geological Bulletin, DSIR Geology and Geophysics, 59 pp.
Fenemor, A.D. 1988. A Three-dimensional Model for Management of the Waimea Plains Aquifers,
Nelson. Publication No. 18 of DSIR Hydrology Centre, 133 pp.
Fenemor, A.D. 1989. Groundwater modelling as a tool for water management: Waimea Plains, Nelson.
Journal of Hydrology (New Zealand) 28(1):17-31.

Page: 15 of 43
Taken together, these three publications provide the seminal hydrogeological and geohydrological
understanding of the water resources of the Waimea Plains. Dicker et al summarises and extends the
thesis work of Michael Dicker from 1980 and the Fenemor publications summarise the first groundwater
flow model developed for the Waimea basin. The MODFLOW 3D model was used in management
simulations to predict the aquifer response to three irrigation schemes, two of which (Waimea East and
Redwood Valley) were subsequently built. It was also used to set allocation limits for water extraction
from the aquifers in the first comprehensive Waimea Basin Water Management Plan (Nelson Catchment
Board 1986) based on system response modelled for the 1982/83 drought (about a 30 year drought).
Versions 2 and 3 of the Waimea flow model by Timothy Hong (GNS) and now Julian Weir (Aqualinc) are
not referenced further here, but update the flow modelling using more recent data, and providing
simulations of river and aquifer responses to water rationing, and with and without the Waimea
Community dam water releases.
The publications above describe the major aquifers of the plains as the Appleby Gravel unconfined
aquifer (AGUA), the Upper Confined Aquifer and the Lower Confined Aquifer (LCA) with the Hope Minor
Confined and Unconfined Aquifers (HMCUA) occurring on fans along the Barnicoat Range. The AGUA
which is up to 15m deep at the coast is fed from river recharge and rainfall infiltration with recharge
calculated for the 1977-78 year as around 1200 l/sec. In comparison the UCA winter throughflow was
110 l/sec and LCA 58 l/sec. Recharge to the UCA and LCA is from river infiltration in the reach around
Brightwater Bridge and about 50% from rainfall recharge in the eastern Waimea Plains via the Hope fan
gravels. The UCA depth ranges from 18m deep near Wairoa Gorge to 32m deep near Bartlett Road
where its upper confining layer is ruptured providing a hydraulic connection there with the AGUA. The
LCA ranges from 30m near Wairoa Gorge to 50m deep extending an unknown distance beyond the end
of Rabbit Island.
Dicker et al contain a summary and contour maps of nitrate in each aquifer in 1978 and 1986. Neimann
Creek had 6.3+ 0.7 mg/l compared with Pearl Creek at 1.4+1.5 mg/l indicating the predominant UCA
source for Neimann compared with AGUA water in Pearl Creek. The AGUA had mean N concentrations
in 1978 and 1986 from 8 wells of 2.7 and 5.7 mg/l respectively. In the HMCUA mean nitrate was 11.1
and 10.5 mg/l respectively between 1978 and 1986. In the UCA the respective averages were 10.5 and
12.2 and in the LCA 9.5 and 9.6 mg/l. The average seepage velocity in the LCA was calculated as
0.92m/day while the movement of nitrate in this aquifer gave about 0.7 m/day, providing validation for
the flow modelling in Fenemor (1988). Dicker et al also discuss oxygen isotope and tritium results as
indicators of rainfall versus river recharge.
Implications: The sources, pathways and discharge of water from each aquifer are important to
understand as carriers of contaminants including nitrate.
Gaps: More detailed work to differentiate the HMCUA from the UCA may help understanding of nitrate
pathways into the aquifers – methods could include geophysics, more detailed well logging, isotope
and geochemical analyses. Although of less concern for nitrogen management, better understanding
of the coastal connection of the LCA to the sea, including seawards of Rabbit Island, would allow better
risk management for seawater intrusion, especially with sea level rise.
Stewart, M.K., Stevens, G., Thomas, J.T., van der Raaij, R. and Trompetter, V., 2011. Nitrate sources and
residence times of groundwater in the Waimea Plains, Nelson. Journal of Hydrology (New Zealand),
pp.313-338.
Stewart, M.K. 2011. Improved understanding of groundwater movement and age in the aquifers of the
Waimea Plains. GNS Science Consultancy Envirolink Report 2011/55. 10p.

Page: 16 of 43
Isotope research by C Taylor and M Stewart utilising tritium and oxygen isotopes assisted in defining
the aquifers reported in Dicker et al 1992. These two more recent publications by M Stewart cover similar
ground and use 15N, 18O and 3H (tritium) isotopes, CFC and SF6 contamination to help define the sources
of nitrate-contaminated groundwaters.
Tritium measurements in well water give mean residence times for groundwaters, with the youngest
waters in the area south of Hope, where nitrate concentrations are highest, and increasing ages to the
south, west and north. Fitting a piston flow model to the isotope and CFC data suggest that well waters
comprise mixes of water with wide variability in age. The CFC data cannot be relied upon as the authors
consider the samples are contaminated from agrichemical sources.
The age distributions produce a nitrate input history for the Upper and Lower Confined Aquifers
suggesting inputs starting from the 1940s. The contamination is carried northwards, affecting wells on
the scale of decades.
Tritium sampled between 1972
and 2005 gives well-defined mean
residence times for the LCA of 8
months at Ranzau Road, 33 years
at Lower Queen St, 110 years at
Bells Island and >150 years at
Rabbit Island (Figure 5). Further
west in the LCA the river-source
water is up to 70 years old,
confirming that the nitrate in the
LCA is arriving via the Hope fan
gravels.
Water in two Hope aquifer bores
was recent at 0.5 and 0.1 years old,
and in two AGUA wells was 2 and
1.1 years old. UCA water was 36
years old in an upstream bore but
only 4.5 years old in monitoring
bore WWD37 indicating a Hope
aquifer source of more recent
water between the two.
Interestingly, the paper models
future nitrate concentrations
based on an assumed history of
inputs and continuing inputs at
current levels. In the UCA WWD37
is projected to level off at about 10
mg/l after 2020 while in the LCA
WWD208 at Ranzau Road is
projected to level off at 9 mg/l after
2018, and the Richmond LCA water supply to fall to 11 mg/l in 2020 and decline slowly thereafter.
Implications: The wide age distributions found in single well samples confirms that in some wells the
groundwater originates from a combination of rainfall recharge (via the Hope Aquifers along the
Barnicoat Range when water tables are high) and river recharge from further south. This applies
Figure 5 – Groundwater age UCA and LCA (Fig 7 from Stewart et al
2011)
Page: 17 of 43
especially to long-term monitoring bores WWD37 for the UCA and WWD208 for the LCA both in Ranzau
Road.
The ability of the isotope results (e.g. Fig 5a-c in the Stewart paper) to identify contaminant sources as
from animal wastes versus fertilizer, or water sources as rainfall or rivers is not particularly convincing,
perhaps confirming the mixed sources in many wells.
Gaps: The modelled future nitrate concentrations should be compared over coming years with
measured data from ongoing nitrate surveys. This would allow the reliability of the model assumptions
to be checked or adjusted.
Spencer M J. 1981. Waimea Plains nitrate survey – summer 1981. Nelson Catchment Board internal
report.
Fenemor, A.D. 1987. Water quality of the Waimea Plains aquifers 1971-1986. Nelson Regional Water
Board. December. 40p.
Edie, N. 1995. Groundwater quality survey Waimea Plains (1986-1994). Tasman District Council report.
January. 30p.
Ware, P. 2000. The Spatial and Temporal Distribution of Nitrate Within the Groundwater System of the
Waimea Plains: Submitted in Partial Fulfilment of the Degree of Bachelor of Science, with Honours at
the University of Otago, Dunedin, New Zealand.
Stevens G. Groundwater Quality in Tasman District 2010. TDC State of the environment report R10003.
October. 53p.
http://www.tasman.govt.nz/document/serve/State%20of%20the%20Environment%20Report%20-
%20Groundwater%20Quality%20in%20Tasman%20District%202010.pdf?path=/EDMS/Public/Other/En
vironment/EnvironmentalMonitoring/WaterMonitoring/Groundwater/000000186335
Stevens, G. 2017. Waimea groundwater nitrate synoptic survey. TDC Environment & Planning
committee report 17-06-05. June. 24p.
Simmonds B and M Westley. 2020. Waimea Plains nitrate supplementary data: land-use, soil and
groundwater. TDC Operations committee report, summary report ROCCCC20-02-4 and presentation.
February. 26p, 9p & 20p. [Groundwater component]
Westley, M. 2020. Proposal for increased monthly monitoring, Waimea Plains. Note for TDC. 9p. June
2020.
Nitrate surveys have been systematically carried out across the Waimea Plains since 1986, although
surveys by Stanton and Martin (1975) and Spencer (1981) provided unstructured data on high nitrates
in wells even earlier. Alongside the geohydrological understanding of the aquifers, the surveys provide
a time series of nitrogen movement from land uses to wells and receiving waters down the plains. The
surveys were undertaken in 1986 (63 sites), 1994 (64 sites), 1999 (82 sites), 2005 (93 sites) and 2016 (130
sites). These synoptic surveys are typically undertaken during the summer months and are in addition
to the Council’s quarterly State of the Environment (SoE) monitoring programme for groundwater.
Groundwater nitrate concentrations below 1.6 mg/l are most likely a result of natural processes.
Concentrations higher than 3.5 mg/l are almost certainly indicative of human influence (Daughney and
Reeves 2005). Concentrations exceeding 11.3 mg/l do not meet the New Zealand Drinking Water
Standard for nitrate. Treatment options for the removal of nitrate from groundwater are very expensive.
Comparison of the 1978 and 1986 surveys found steady concentrations of nitrate in the LCA (averaging
9.6 mg/l in 1986), increasing levels in the UCA (12.6 mg/l), decreasing levels in the HMCUA (10.5) and

Page: 18 of 43
increasing levels in the AGUA and spring-fed streams (5.6). The 1994 survey noted no decrease in
groundwater nitrate concentrations apart from within the Appleby Gravel Unconfined Aquifer. In the
other aquifers nitrate concentrations remained elevated and in numerous instances exceeded the New
Zealand Drinking Water Standard. The 1999 survey concluded that elevated nitrate concentrations
continue to occur along flow paths in the Lower Confined Aquifer and Upper Confined Aquifer,
confirming that the principal source of nitrate to the aquifer systems occurs in the Hope area where
groundwater recharge to both the confined aquifers occurs. The 2005 survey noted the persistence of
high nitrates in some areas over the past 30 years; 35% of bores sampled in 2005 had nitrate exceeding
11.3 mg/l, however, apart from the LCA near the coast and AGUA near SH60 between Bartlett and
Blackbyre roads, concentrations overall were either decreasing or showing no appreciable change.
Much of the Waimea Plains continues to have low nitrate concentrations in the groundwater. However,
the 2016 monitoring confirmed elevated nitrate concentrations (up to 24 mg/l) particularly where the
UCA discharges into the AGUA (Bartlett Road/Blackbyre Road/State Highway 60 and Ranzau/Bartlett
Road areas) and these have increased since the 2005 survey when the highest concentrations occurred
in the Aniseed Valley/Paton Road area of the UCA.
Monthly nitrate sampling has also been undertaken since 2017 in response to landowner concerns
about the elevated nitrate concentrations present in an area where the UCA merges with the AGUA
(Bartlett and Ranzau road area). This is an area that has seen land use changes to market gardening in
recent years.
The surveys confirm the presence of a plume of elevated nitrate concentration in the UCA which is
moving northward toward the Waimea Estuary. In 1986 elevated nitrate concentrations were highest in
the recharge areas near the piggery location. Elevated nitrate concentrations have progressed
northwards throughout the years, with the highest concentration of nitrates in 2005 located in the
Aniseed Valley and Patons Road area in the UCA. High nitrate concentrations were also noticed in 2005
in the AGUA between State Highway 60 and Swamp Road. In 2016 the elevated nitrate concentrations
had further progressed northwards; the highest concentrations located at Blackbyre Road and State
Highway 60 where the UCA and AGUA merge together (Figure 6). Elevated nitrate concentrations were
also present between Ranzau Road and the Waimea Estuary where the UCA passes over the top of the
LCA.
.
Page: 19 of 43
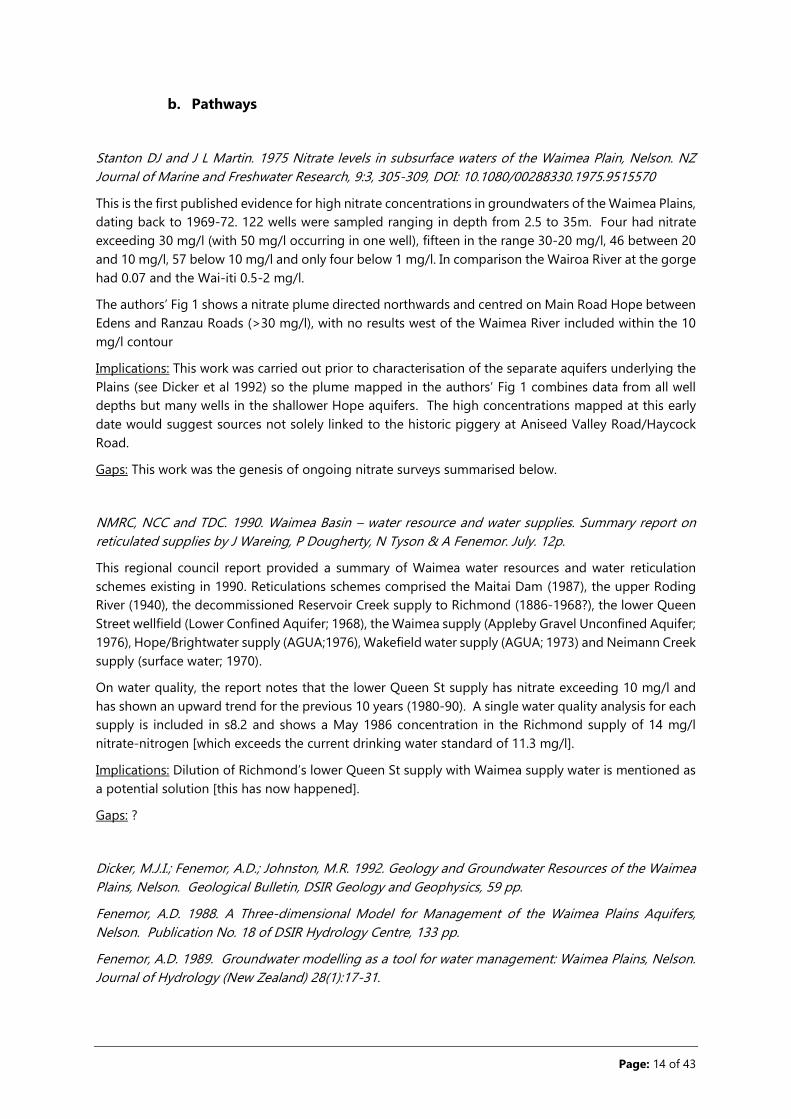
Figure 6 – 2016 nitrate results by water body
The plume of elevated nitrate concentrations has decreased over time due to its movement through
the aquifer as well as the closure of the piggery in the 1980s. The highest nitrate concentrations in the
Waimea Plains are currently where the UCA and AGUA merge together downstream of the piggery
plume. The UCA (and dispersed historic piggery plume) merges into the AGUA near Bartlett Road and
Ranzau Road. Some leakage from the UCA to the underlying LCA also occurs (around Ranzau Road)
when the UCA passes over the LCA resulting in elevated nitrate concentrations observed in the LCA
down gradient of this location (Figure 7).
Elsewhere in the AGUA, river leakage and direct infiltration from the surface (rainfall and irrigation)
dominate recharge, meaning that elevated nitrate concentrations are most likely resulting from surface
interactions as the river has very low nitrate concentrations. However, in locations where aquifers merge,
there is an additional source of nitrates (from the UCA resulting from the historic plume and the AGUA

Page: 20 of 43
resulting from the leakage), which can contribute to the elevated nitrate concentrations experienced at
these sites. This makes it difficult to separate the historic plume from current inputs, particularly in the
Bartlett Road and Ranzau Road area where the UCA merges with the AGUA and LCA. Elsewhere in the
AGUA, nitrate concentrations are a result of river leakage and direct infiltration from the surface.
There have been some isolated ‘hot spots’ in nitrate concentrations identified across the Waimea Plains
throughout the synoptic surveys which are located outside of the plume trajectory. These ‘hot spots’
can sometimes be traced to a localised source of contamination nearby, such as fertilizer storage.
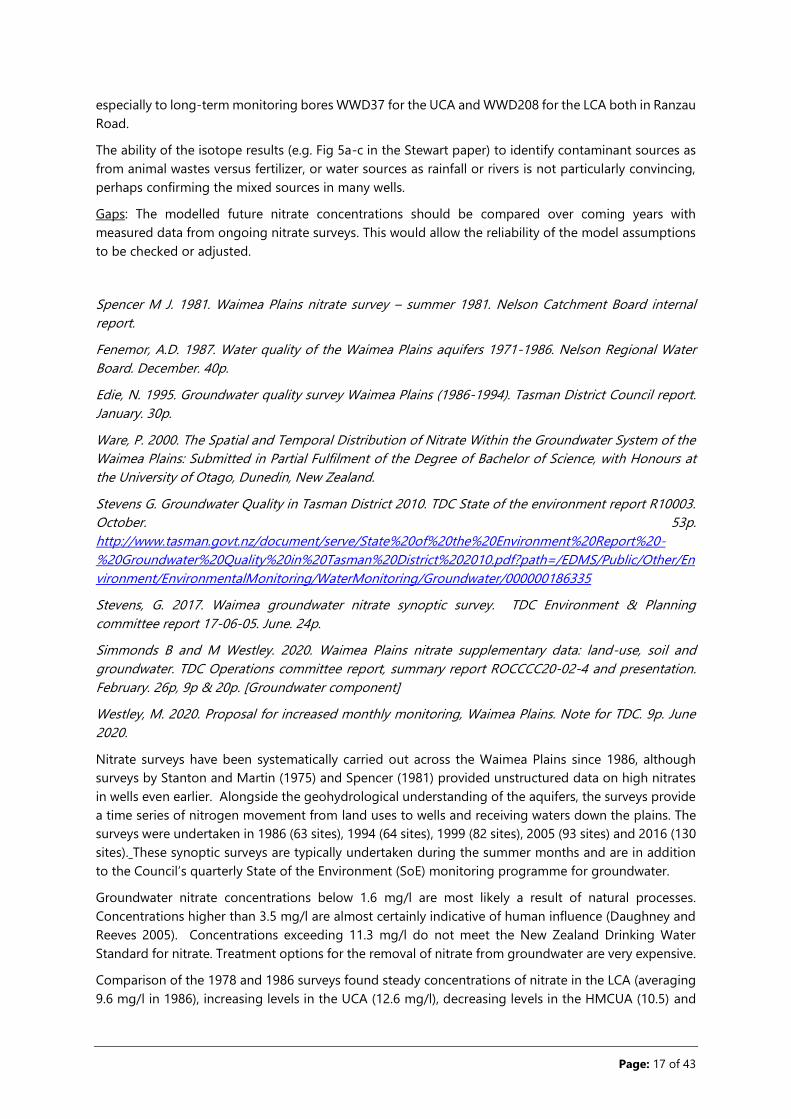
The monthly data (Figure 8, M Westley TDC,
pers comm; well locations and aquifers
shown in Figure 7 from Simmonds &
Westley) shows that nitrates in the long-
term SoE UCA bore WWD37 are stable, and
earlier data there (Fig 7 in Simmonds &
Westley) show a decline in nitrate from ~25
mg/l in the late 1980s to a steady
concentration of ~11 mg/l since 2012. It is
possible this represents the last of the
historic piggery leachate reaching Ranzau
Road (WWD37) in 2012. WWD802 in the
AGUA downstream is dominated by river
recharge, and surrounded by market
gardening since the early 2000s. Its nitrate is
reasonably stable averaging 2.7 mg/l since
monitoring began in 1996 but showed some
higher concentrations (up to 10 mg/l) in
2012-14.
The other 3 wells with nitrate shown in
Figure 8 show much more fluctuation with
higher levels corresponding to rainfall
events during winter and generally lower
concentrations particularly during the dry
summers of 2018/19 and 2019/20. These
AGUA wells are surrounded by market
gardening, and these data confirm that larger
rainfall events are flushing soil nitrate into the unconfined aquifer.
Figure 7 – Aquifer boundaries and well locations
Page: 21 of 43
Figure 8 – Quarterly and monthly nitrate concentrations vs cumulative rainfall near Bartlett/Blackbyre roads
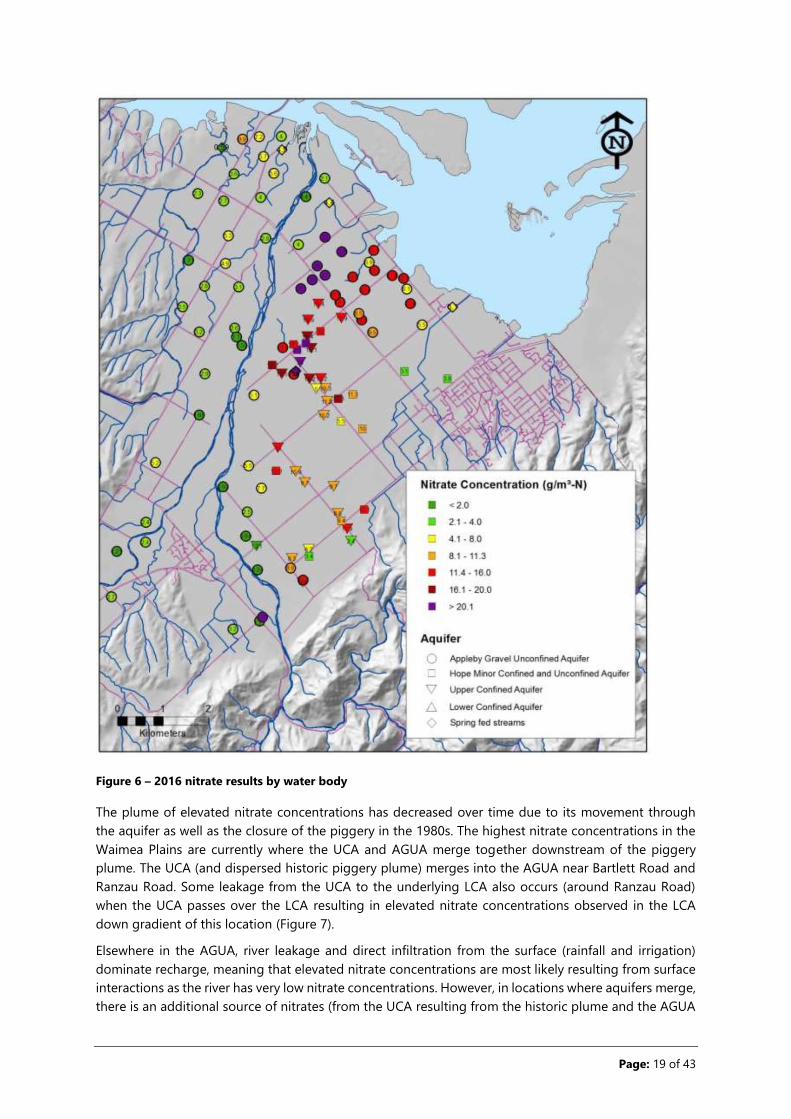
Eight months of data from a continuous nitrate sensor trialled in WWD163 from April 2018 to January
2019 has also been collected by TDC (M Westley, pers comm; Figure 9 below) , however comparison
with lab analyses of nitrate suggests that more work is needed to ensure its accuracy and utility. There
does not appear to be a strong relationship between rainfall (as a source of leached N) and either sensor
or lab-measured nitrate levels.
Figure 9 – continuous N from trial sensor in WWD163 compared with lab-measure N and rainfall April 2018-
March 2020
Implications: Recent data confirm the leaching of nitrogen from highly fertilised land uses affecting the
recharge areas of the UCA and LCA and directly affecting water quality in the unconfined AGUA. As
concentrations exceed the drinking water limit, policy should be directed towards reducing them and/or
ensure availability of alternative potable supplies especially for any households with bottle-fed infants.
Page: 22 of 43
The monthly data suggest that the connectivity between the AGUA and underlying UCA in the
Ranzau/Bartletts/Blackbyre/SH60 area is more widespread than earlier hydrogeological interpretation
would have suggested. The data suggest that the historic contamination has likely passed and this is
supported by the fact that pig effluent is highly mineralizable so that after 30+ years from the time of
discharge, it should have substantially degraded. Therefore, what we see as the nitrate signature in
these wells is caused by local and upstream intensive land uses, particularly market gardening (vege
growing). The lack of fluctuation in WWD37 nitrate concentrations will be due to the mixing of multiple
sources of nitrate and variable transit times for recharge water – a blend of rainfall and river sources -
to reach this confined part of the aquifer. Higher nitrate levels will exist in the top of the aquifer with
mixing down the depth of the aquifer occurring gradually as groundwater flows down-gradient;
pumping water from a fully screened well will mix stratified water as it is sampled.
Gaps: It has been proposed that piezometers be installed up-gradient and down-gradient of the historic
piggery to check whether high nitrates are still coming from that area, potentially from residual buried
waste. Before that is considered further, it would be useful to carry out more intensive (monthly)
sampling of existing wells in the vicinity, and to evaluate the geochemistry (following up on the
suggestion of Selva Selvarajah (email to B Simmonds 20 Feb 2020) that Magnesium may be an indicator
of the historic contaminant source, and that its similar pattern in WWD37 to nitrate suggests the historic
plume has largely dissipated). The difficulty with piezometer installation is the high variability of aquifer
geology especially upgradient of the old piggery where clay-bound outwash from the hill could
complicate interpretation of groundwater sampling results – this would likely mean that more than 2
piezometers (upstream/downstream) would be needed to find sites representative of aquifer conditions.
I have spoken with Tony Zwart who owned the Stratford piggery property after it ceased being a piggery.
While the piggery was in operation he also made compost for market gardening on Aniseed Valley Road
by combining sawdust with the pig effluent (a 2:1 mix) in the effluent collection pit at the NW corner of
the property. When the piggery closed, he reports the empty compost pit was returned to its original
contour by filling it in with soil. As this pit does not appear to be directly upgradient of the well on the
property with high nitrate, this lends weight to the notion that the nitrate plume originates from
broader-scale land use.
Regarding the monthly monitoring, it may help inform understanding of the leaching loss mechanisms
locally to develop a water balance model relating AGUA water level and nitrate responses to land use
and effective rainfall (rain minus ET). This would require data on the land use activities (crop locations,
fertilizer and irrigation use), some of which is provided by the Rainham survey summarised earlier and
may also be available via Craig Hornblow (Agfirst). The model could then be used to investigate what
management practices might achieve nitrate concentrations less than NZDWS limit of 11.3 mg/l. This
work could also be carried out on a larger scale with the proposed linking of a nutrient loss model (eg
SPASMO or OVERSEER) with the existing groundwater flow model, discussed below – the advantage of
that is that upstream land use effects on nitrates can be better accounted for. If the nitrate sensor can
be confidently calibrated, its redeployment in the same area would provide useful fine-scale data for
improving understanding of the processes and lags in N leaching, and for the modelling.
The mapped plots of progress of the nitrate plumes for each aquifer as shown in the 2005 survey (G
Stevens) are a useful visualisation. It would be informative to see overlaid plots using exactly the same
wells available in all surveys to better judge the plume movement without the distortions caused by
adding new wells into the contouring. Overall, the surveys suggest that migration of nitrate through
the aquifers is happening more slowly than flow modelling has suggested.
BioGro who certify organic produce have indicated (B Simmonds, pers.comm) that having high N levels
in groundwater has the potential to compromise the certifiable organic status of the crop, which limits
access to high value domestic and overseas markets. If BioGro became aware of contaminant issues in
Page: 23 of 43
groundwater used for irrigation, they would be duty bound to test the irrigation and impose any relevant
limits for contaminants. They would be looking to UK, US, EU for guidance on those permitted limits, as
these are the key markets.
Former orchardist David Easton who takes irrigation water from a well with high nitrates next to
WWD163 (Figure 9) has indicated that high nitrate delays apple colouring despite it maturing. Dean
Rainham and Craig Hornblow, AgFirst, have commented that especially during dry years with more
irrigation required, the high N in irrigation water equates to 60-80 kgN/ha/yr being applied at a time
when the crop does not need nitrogen. Higher N appears to mobilise Mg in the soil, affecting fruit
maturity and storage quality. Mitigations include addition of K fertilizer and use of bark mulch to absorb
N. Neither has been particularly effective, so an alternative water supply might be required. Thus, high
N in irrigation water adds to the monitoring and mitigation required on orchards in that area.
Fenemor A, Weir J 2016. Waimea Community Dam: Peer Review of Waimea Plains Hydrology
underpinning the proposal. Landcare Research contract report LC2659 for Tasman District Council.
September. 53p. https://www.tasman.govt.nz/my-council/projects/waimea-community-
dam/document-
library/?path=/EDMS/Public/Other/Tasman/Projects/WaterAugmentationProjects/Water_for_Waimea_
Basin/LandcareResearchGroundwaterHydrologyPeerReview2016
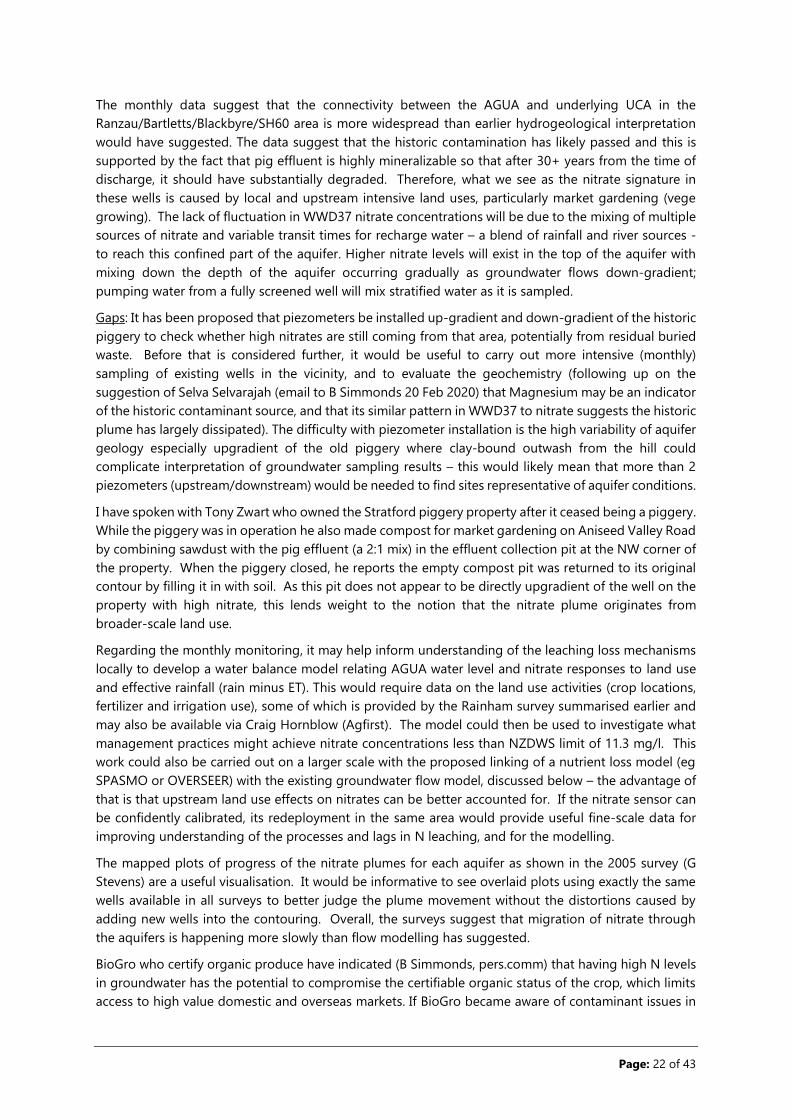
While not addressing water quality, this report (along with the GNS modelling report of Hong and
Zemansky 2009) summarises the hydrological basis for river flows and aquifer water levels with and
without the Waimea Community Dam. Flow releases from the dam maintaining a 1100 l/sec minimum
flow in the lower Waimea River every summer combined with increased groundwater pumping and
improved reliability (freedom from rationing) will modify the contributions of river infiltration to the
aquifers, particularly the AGUA and spring-fed streams in the lower catchment. Generally, as river flows
increase, river recharge to groundwater increases (Figure 10). Similarly, as groundwater levels drop,
river recharge to groundwater increases. Dam releases will improve water quality during summer in the
lower Waimea River and potentially in the spring-fed streams as well, through dilution from the
increased with river flow.
Figure 10 – Modelled increased groundwater recharge from Wairoa-Waimea river with dam releases
Page: 24 of 43
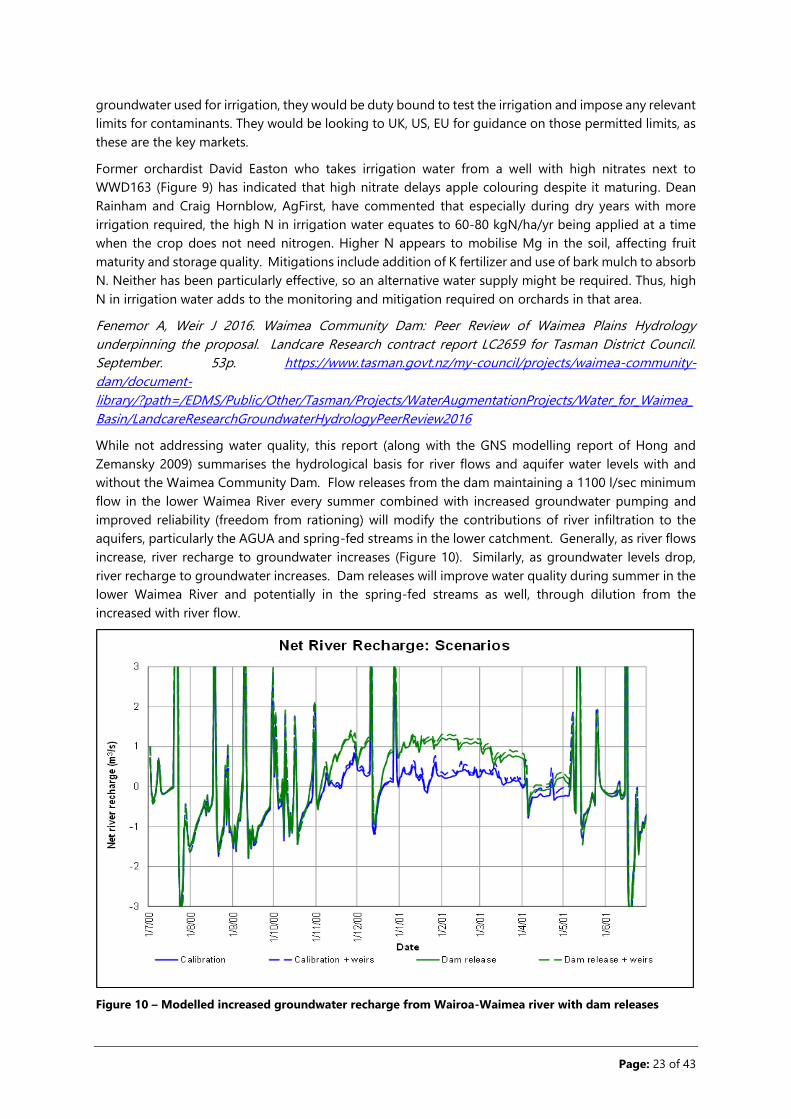
The report also summarises the projected effects of climate change to 2090 which, among other effects,
will likely change the range of crops able to be grown, and also the nutrient losses. For 1990–2040,
annual mean air temperatures may rise by 0.9oC; for 1990–2090 mean temperatures could increase by
2oC. The days of frost are expected to decline markedly which may affect fruit set for some horticultural
crops. Sea level rise of 0.8m is expected by 2090; in the absence of tidegates, this would modify the
aquatic ecosystems of the lower reaches of Pearl, Neimann and Borck creeks to more saline-tolerant for
some 500-1000m inland (Figure 11).
Figure 11 - Waimea river mouth showing three locations for freshwater–seawater interface: average summer
currently (green), during 2001/01 drought (red) and during 2000/01 drought conditions as a worst case if
they occurred in 2090 after 0.8-m rise in sea level (blue).
The report notes that given the types of farming systems currently on the Waimea Plains, there is limited
scope for technology improvements in irrigation efficiency, given the already widespread use of
microsprinklers and drippers (see the commentary on the SPASMO modelling later which concludes
that for current crops the addition of irrigation creates little increased N leaching, and in the case of
apples, less).
Implications: This report and modelling reports from Aqualinc (2013) and GNS (e.g. Hong and Zemansky
2009) document modelled changes in Waimea Plains hydrology expected after commissioning of the
Waimea Community dam. Increased groundwater pumping combined with increased Waimea river
flows especially during dry summers may change the attenuation (N reducing) characteristics of the
aquifers primarily through increased local dilution, although these effects are expected to be small. The
report points to the need to consider longer term effects of climate change on the crops able to be
grown on the Plains alongside expected sea level rise effects on coastal receiving waters (spring-fed
streams, lower Waimea River and Waimea Inlet).
Gaps: The Waimea groundwater model is proposed to be developed in future years to include modelling
of nitrate transport, not as an integrated water quality process model, but more likely through a loose

Page: 25 of 43
linkage with N inputs generated by SPASMO, APSIM or OVERSEER for various land use and land
management scenarios. This should be a priority in Council’s LTP starting in the year 2021/22 as it will
enable more informed modelling of various land use and management scenarios which can in turn
inform policy development. However there is sufficient knowledge from existing approaches (see
commentary below on the SPASMO modelling) not to delay policy development while awaiting linked
modelling.
Lovett, A. and Rissmann, C. 2018. Evaluation of the physiographic method for the Tasman Region. Land
and Water Science Report 2018/01. 26p.
The physiographic method, developed in Southland recently, seeks to explain ‘how’ and ‘why’ water
quality varies across a region by identifying the gradients driving key landscape processes that govern
water quality outcomes and risk (Rissmann et al., 2016). While land use is a prerequisite for poor water
quality outcomes, it is the inherent physical, chemical and biological characteristics (attributes) of a
landscape that are often responsible for a larger proportion of the variation in water quality outcomes.
Such attributes include soil drainage class affecting denitrification, soil permeability gradients affecting
transmission pathways, and hydrological gradients affecting flowpaths. The fundamental premise of the
physiographic approach is that spatial variation in water composition (quality and hydrochemistry) can
be understood by identifying and mapping the spatial coupling between process signals in water and
landscape attributes. TDC has stated an interest in the potential for the physiographic approach to
determine the origin of non-point source contaminants at a paddock scale.
This report is a scoping exercise focused on data needs and potential of the method for the Waimea
catchment. In addition to existing flow, water quality, soil and land use datasets, the authors
recommend collection of headwater quality data from hill and alpine catchments of varying geology
and soils, plus 6 surface water and 6 shallow groundwater quality samples.
Implications: The value of the physiographic approach appears to be for characterising cause and effect
for flows and water quality across broad-scale relatively uncharacterised catchments. It lends itself to
regional scale mapping where hydrochemical signatures can be differentiated and attributed to
landscape characteristics including soils and underlying geology. I have doubts of its value in an already
highly researched catchment such as the Waimea but would see some worth in trialling it in a data-
poor catchment such as the Aorere.
Gaps: The physiographic approach draws heavily on geochemistry for linking landscape attributes with
water quality. Hydrogeochemistry is an area of investigation which should be looked at for its potential
to better refine knowledge of aquifer connectivity and N attenuation, for example via denitrification. As
a start, mining existing data such as from the NGMP and SOE sites and from earlier research may help
improve our conceptual model of cause and effect, which will in turn improve modelling and policy
development. This work could potentially be carried out by GNS in an Envirolink-funded project.
Page: 26 of 43
c. Receiving Waters
TDC and Tasman Environmental Trust. 2004. Pearl Creek, Tasman District. Booklet on history, ecology
and restoration by Ann Sheridan. 7p.
This information booklet describes the history of use of Pearl Creek for access to the Waimea pa near
the present-day Appleby School, the aquatic species in the creek (which then included giant kokopu),
and the restoration project which started with a planting project in the mid 1980s.
Implications: A useful information source on the history and values of Pearl Creek.
Gaps: -
Hickey C. 2013. Updating nitrate toxicity effects on freshwater aquatic species. NIWA Envirolink report
HAM2013-009. 34p. https://envirolink.govt.nz/assets/Envirolink/1207-ESRC255-Updating-nitrate-
toxcity-effects-on-freshwater-aquatic-species-.pdf
Hickey, C.W. (2015). Hardness and Nitrate toxicity – site-specific guidelines for spring-fed streams in the
Waimea and Motupipi river catchments and Waikoropupū Springs. No. HSJ15201. NIWA report to
Tasman District Council, pp. 7.
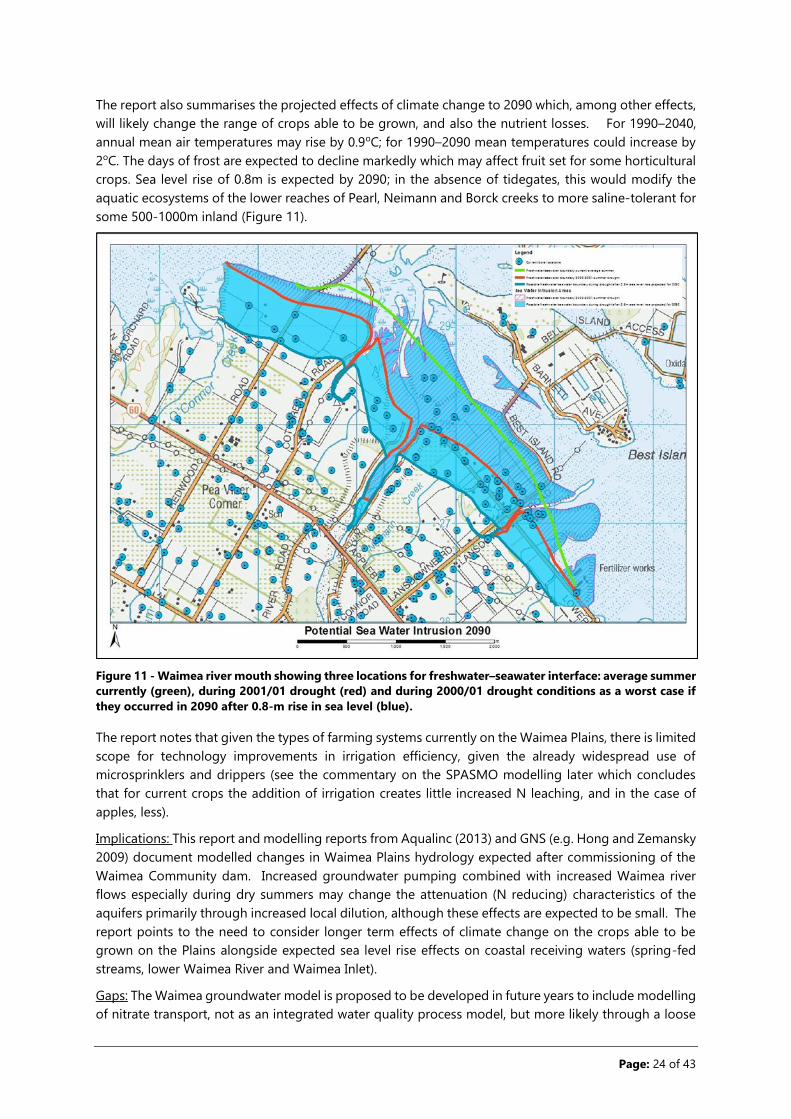
Dr Hickey has updated the ANZECC guidelines and the 2009 ECan guidelines for nitrate concentrations
which would cause acute or chronic toxicity effects on freshwater species, but including only 2 NZ native
species, juvenile inanga and mayflies. “Grading” concentrations are median values equivalent to ANZECC
trigger values and “Surveillance” values are 95th percentile concentrations; gradings are NOEC (no
observed effect) concentrations for all relevant species.
Of relevance to Waimea spring-fed streams is the observation that the original nitrate toxicity guidelines
are for low hardness water, which has toxic effects at lower concentrations than high hardness water.
However there was insufficient information to modify the recommended toxicity thresholds at the time
of this report.
The recommended toxicity guidelines were those included in the 2017 NPSFM:

Page: 27 of 43
In his 2015 memo for TDC, Dr Hickey calculates hardness-specific nitrate guidelines for Borck, Neimann
and Pearl creeks at which time (2015) their median nitrate concentrations were 5.6, 3.3 and 2.9 mg/l
respectively.
In the decisions gazetted in the NPSFM 2020, the national bottom line is raised from the current 80%
protection level to 95% protection.
If it were permissible to adjust the NOF guidelines for hardness, Hickey (2015) calculates that the median
limits for 95% protection would be 16, 21 and 16 mg/l respectively.
Implications: Neimann Creek and Borck Creek have the highest nitrate concentrations, and in relation
to nitrate toxicity are currently subject to the NPSFM bottom line of 6.9 mg/l, however under the NPSFM
2020 this will reduce to 2.4 mg/l, below the cited median concentration for all 3 spring-fed streams. This
means that rather than simply focussing on managing these streams for periphyton and algae, the new
toxicity (species protection) limits must also be complied with. Neimann Creek water is relatively hard
but there is no ability yet discussed for Council to be able to adjust the national bottom line limit to
allow for the effect of water hardness in reducing toxicity.
Gaps: Council may wish to advocate to MfE to allow adjustments to toxicity based on water hardness,
as indicated in Hickey (2015)
Young RG, Doehring K, James T 2010. River Water Quality in Tasman District 2010. State of the
environment report for Tasman District Council. Cawthron report 1893. 165 p. plus appendices.
James, T. and Kroos, T. 2011. The Health of Freshwater Fish Communities in Tasman District 2011.
Tasman District Council State of the Environment Report #11001. September. 145p.
http://www.tasman.govt.nz/document/serve/State%20of%20the%20Environment%20Report2011.pdf?
path=/EDMS/Public/Other/Environment/EnvironmentalMonitoring/WaterMonitoring/Fish/000000204
290
Maps:
http://www.tasman.govt.nz/document/serve/State%20of%20the%20Environment%20Report%202011
%20-
%20Appendix.pdf?path=/EDMS/Public/Other/Environment/EnvironmentalMonitoring/WaterMonitorin
g/Fish/000000204291
James T. 2011. Tasman’s Natural Swimming Holes and Beaches - Popularity and Effects on the
Recreational Experience. TDC state of the environment report #11002.
http://www.tasman.govt.nz/document/serve/TasmanSwimmingAreaSurveyReport2011.pdf?path=/ED
MS/Public/Other/Environment/EnvironmentalMonitoring/WaterMonitoring/SurfaceWater/Recreationa
lSwimmingWater/000000191956
James, T and McCallum. 2015. State of the environment report – River water quality in Tasman District
2015. Tasman District Council report. 383p.
Young R, Wagenhoff A, Holmes R, Newton M, Clapcott J. 2018. What is a healthy river? Prepared for
Cawthron Foundation. Cawthron report 3035. 45p.
These SoE reports summarise water quality data, including for the Wairoa, Wai-iti, Waimea rivers and
spring-fed streams, and including nitrogen concentrations. As stream water quality in the lower Waimea
catchment during baseflow conditions is heavily governed by groundwater return flow, the water quality
and freshwater ecosystem health of these water bodies is dependent on groundwater quality and in
turn on upstream land use activities.
Page: 28 of 43
The reports also review the values associated with surface water bodies, including recreational uses,
which will affect the limits and targets to be set.
The Cawthron report outlines the definition for freshwater ecosystem health now modified and adopted
as a fundamental tenet governing the 22 attributes to be prescribed for use by the NPSFM 2020. In
summary FEH comprises:
1. Water quality – the physical and chemical measures of the water, such as temperature,
dissolved oxygen, pH, suspended sediment, nutrients and toxicants.
2. Water quantity – the extent and variability in the level or flow of water.
3. Habitat - the physical form, structure and extent of the waterbody, its bed, banks and margins,
riparian vegetation and connections to the floodplain.
4. Aquatic life – the abundance and diversity of biota including microbes, invertebrates, plants,
fish and birds.
5. Ecological processes – the interactions among biota and their physical and chemical
environment such as primary production, decomposition, nutrient cycling and trophic
connectivity.
In addition, limits may be set through regional plans to maintain or enhance other values including
cultural values, recreation, landscape and production values.
Implications: Nitrate is but one parameter affecting both freshwater ecosystem health and other water
body values. From a science perspective, it is desirable to prioritise as far as possible, attributes which
are integrative measures of the chosen values. For example, parameters such as Macroinvertebrate
Community Index (MCI), Fish Index of Biotic Integrity (IBI) and periphyton. The NPSFM mandates the
use of particular attributes and prescribes national bottom lines for most. Those include nitrate toxicity
as discussed above and potentially in future Dissolved Inorganic Nitrogen (DIN) of which nitrate is a
primary component. DIN and Dissolved Reactive Phosphorus (DRP) together affect periphyton growth
and should be considered together. Existing water quality data and expected national regulations
together suggest the need for policy to reduce nitrates especially in spring-fed streams.
Gaps: -
James, T 2020. Neimann Creek Restoration Work. Summary report, May 2020. Tasman District Council,
8p.
This report is a summary of riparian and instream restoration work carried out during January-May 2020
to improve the environment along Neimann Creek. The work included sediment and aquatic weed
removal by dredging, fish recovery during dredging, poisoning of willow regrowth, planting of Carex
secta, removal of flow restrictions including an upstream culvert and aquatic habitat enhancement
including anchoring logs to the banks, placing of straw bales to create eddies and a floating wetland.
The report also summarises continuous monitoring of dissolved oxygen in January 2020 for comparison
with 2019 data. Of surprise were the lower daily minima downstream of the spring source of the creek,
when it was expected the spring source would have lower D/O. This may be due to rotting vegetation
in the creek and/or inflow of low D/O groundwater along the upper stream reach. Lack of shading
exacerbates low D/O.
Among the recommendations, author Trevor James suggests a tide gate be reinstalled at lower Queen
St, a sediment trap to allow further sediment removal, and oxygenation near the source. A SLMACC
funding application has been made by ESR to test the efficacy of woodchip denitrification walls (WDWs)

Page: 29 of 43
in gravel aquifers with a trial proposed at the springhead of Neimann Creek however this has been
unsuccessful in 2020. Estimated construction cost is $150,000 and expected life 30 years.
Implications: This work highlights the importance of a whole-stream approach to improving the values
of spring-fed streams such as Neimann, Borck and Pearl Creeks. Riparian improvement is needed
alongside water quality improvement to improve freshwater ecosystem health.
Gaps: The denitrification wall project will be hugely valuable as both a research opportunity and actual
mitigation if it can be installed in such a way that it filters most of the high-N springflow. Constructing
a woodwaste bund in a form of wetland may be one way to do this. Given the lack of SLMACC funding
in 2020, other funding sources are needed for its construction, as a priority.
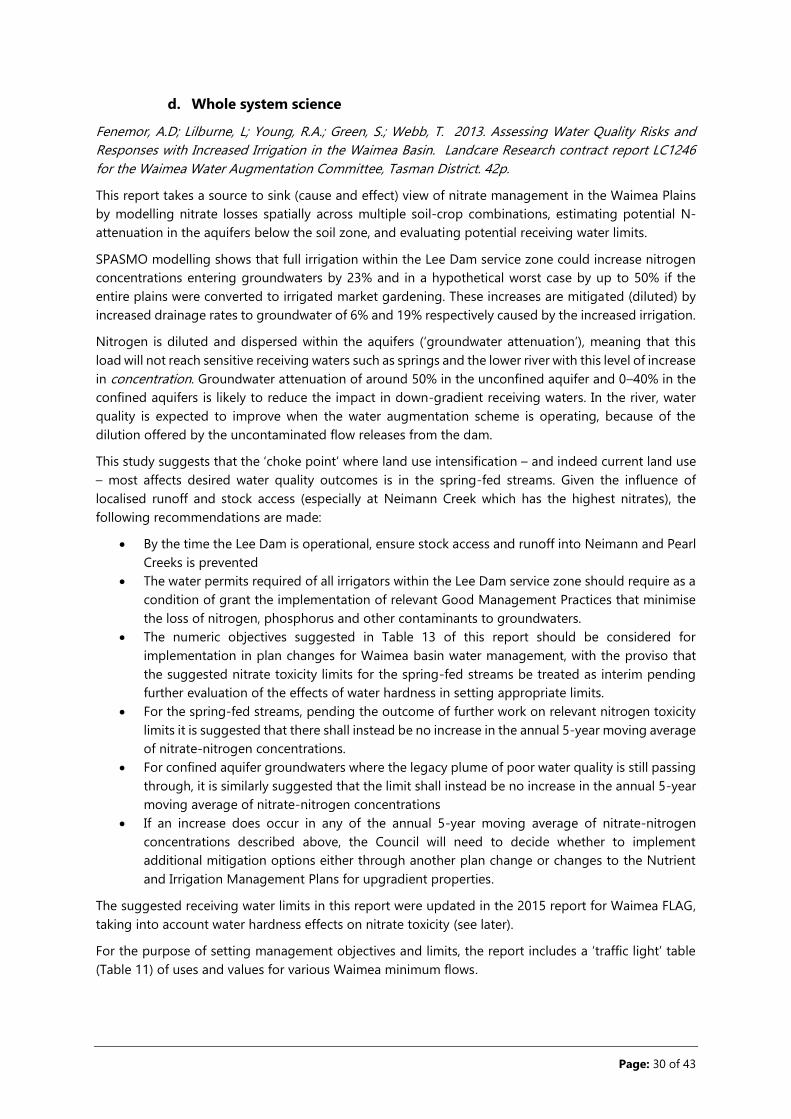
Page: 30 of 43
d. Whole system science
Fenemor, A.D; Lilburne, L; Young, R.A.; Green, S.; Webb, T. 2013. Assessing Water Quality Risks and
Responses with Increased Irrigation in the Waimea Basin. Landcare Research contract report LC1246
for the Waimea Water Augmentation Committee, Tasman District. 42p.
This report takes a source to sink (cause and effect) view of nitrate management in the Waimea Plains
by modelling nitrate losses spatially across multiple soil-crop combinations, estimating potential N-
attenuation in the aquifers below the soil zone, and evaluating potential receiving water limits.
SPASMO modelling shows that full irrigation within the Lee Dam service zone could increase nitrogen
concentrations entering groundwaters by 23% and in a hypothetical worst case by up to 50% if the
entire plains were converted to irrigated market gardening. These increases are mitigated (diluted) by
increased drainage rates to groundwater of 6% and 19% respectively caused by the increased irrigation.
Nitrogen is diluted and dispersed within the aquifers (‘groundwater attenuation’), meaning that this
load will not reach sensitive receiving waters such as springs and the lower river with this level of increase
in concentration. Groundwater attenuation of around 50% in the unconfined aquifer and 0–40% in the
confined aquifers is likely to reduce the impact in down-gradient receiving waters. In the river, water
quality is expected to improve when the water augmentation scheme is operating, because of the
dilution offered by the uncontaminated flow releases from the dam.
This study suggests that the ‘choke point’ where land use intensification – and indeed current land use
– most affects desired water quality outcomes is in the spring-fed streams. Given the influence of
localised runoff and stock access (especially at Neimann Creek which has the highest nitrates), the
following recommendations are made:
By the time the Lee Dam is operational, ensure stock access and runoff into Neimann and Pearl
Creeks is prevented
The water permits required of all irrigators within the Lee Dam service zone should require as a
condition of grant the implementation of relevant Good Management Practices that minimise
the loss of nitrogen, phosphorus and other contaminants to groundwaters.
The numeric objectives suggested in Table 13 of this report should be considered for
implementation in plan changes for Waimea basin water management, with the proviso that
the suggested nitrate toxicity limits for the spring-fed streams be treated as interim pending
further evaluation of the effects of water hardness in setting appropriate limits.
For the spring-fed streams, pending the outcome of further work on relevant nitrogen toxicity
limits it is suggested that there shall instead be no increase in the annual 5-year moving average
of nitrate-nitrogen concentrations.
For confined aquifer groundwaters where the legacy plume of poor water quality is still passing
through, it is similarly suggested that the limit shall instead be no increase in the annual 5-year
moving average of nitrate-nitrogen concentrations
If an increase does occur in any of the annual 5-year moving average of nitrate-nitrogen
concentrations described above, the Council will need to decide whether to implement
additional mitigation options either through another plan change or changes to the Nutrient
and Irrigation Management Plans for upgradient properties.
The suggested receiving water limits in this report were updated in the 2015 report for Waimea FLAG,
taking into account water hardness effects on nitrate toxicity (see later).
For the purpose of setting management objectives and limits, the report includes a ‘traffic light’ table
(Table 11) of uses and values for various Waimea minimum flows.

Page: 31 of 43
Implications: This document was presented to Waimea FLAG and forms a useful systems view of the
science and policy components needing consideration for future management of Waimea nitrates. The
uses and values assessment of Table 11 may be a useful starting point for deciding management
objectives now that the 1100 l/sec minimum flow for the river is a commitment.
Gaps: Work to refine N-loss modelling using SPASMO, OVERSEER or APSIM would be improved with
better validation of leaching losses and better definition of soil parameters, as would further information
on geochemistry to assess denitrification potential in the aquifers (both recommended above). However,
in my opinion, this systems modelling already forms an adequate basis for policy development.
Fenemor A, Green S, Dryden G, Samarasinghe O, Newsome P, Price R, Betts H, Lilburne L 2015. Crop
production, profit and nutrient losses in relation to irrigation water allocation and reliability - Waimea
Plains, Tasman District: final report. MPI Technical Paper No: 2015/36. Landcare Research. 65 p.
http://www.mpi.govt.nz/document-vault/9899
This project for MPI compiles and interprets modelled data to understand how different irrigation water
allocations and reliabilities of supply affect production, profit, and nutrient leaching responses for
irrigated apples, grapes, outdoor vegetables (market gardening) and dairy land uses of the Waimea
Plains. The production and profit assessments are not discussed further in this summary.
Of relevance to nitrogen leaching, the modelling examines the effects of varied weekly irrigation
allocation limits but with full reliability of supply up to those weekly limits (0, 7, 14, 21, 28, 35 mm/week
and unlimited) for both a ‘with dam’ (i.e. no water rationing) scenario as well as a ‘no dam’ scenario
(with major water use restrictions during dry summers).
Because nitrate leaching is more sensitive to soil type than to whether or not a crop is irrigated, there is
little difference in leaching rates for the ‘no rationing’ vs ‘with rationing’ scenarios. Perhaps surprisingly,
for some irrigated crops, leaching is lower than for the dryland equivalent because of the efficiency of
plant uptake of nutrients in a fully watered situation. The example of apples is shown in Figure 12.
Figure 12 - Year to year variation in N leaching from apples for Ranzau and Waimea soils 1974-2013 with
no irrigation, rationed irrigation and full (no rationing) irrigation (Fig 26 in source report)
0.0
5.0
10.0
15.0
20.0
25.0
30.0
35.0
19
74
19
77
19
80
19
83
19
86
19
89
19
92
19
95
19
98
20
01
20
04
20
07
20
10
20
13
Nit
rate
-N L
eac
he
d k
gN/h
a
Year
Between Year Variability in N Leached -Apples
Ranzau 35mm/wk Rationed
Ranzau 35mm/wk FullAllocation
Waimea 35mm/wk Rationed
Waimea 35mm/wk FullAllocation
Ranzau No Irrigation
Waimea No Irrigation

Page: 32 of 43
The report concludes that management of irrigation water allocation and nitrate losses on Ranzau soils
needs to be a focus when setting catchment limits.
It also includes a more detailed review of mitigation options for reducing N losses than that referred to
in the report for Waimea FLAG which follows.
Implications: The report is useful for evaluating the effects of improved water availability on N losses
after the Waimea Community Dam is operational. Results should be considered alongside those in the
following report for Waimea FLAG.
Gaps: -
Fenemor AD, Price R, Green, S. 2015. Modelling the Source and Fate of Nitrate-Nitrogen Losses from
Waimea Plains Land Uses. Landcare Research report LC2459 for the Waimea Freshwater and Land
Advisory Group, Tasman District Council, 32p.
http://www.tasman.govt.nz/document/serve/LC2459_Waimea_Nitrate_Modelling_FINAL.pdf?path=/ED
MS/Public/Meetings/FreshwaterLandAdvisoryGroups/WaimeaFLAG/2015/2015-07-19/000000459971
This project extended the previous (2013 and 2015) research to assess nitrate leaching losses using the
SPASMO model for 40 years to 2013 for more specific farm system and soil combinations, informed by
the Waimea FLAG, i.e. for apples, grapes, outdoor vegetables, and dairy farm systems on the four major
soil series of the Waimea Plains. Results were discussed with Waimea FLAG at their 18 June 2015
meeting and 19 August 2015 meetings. Note that this is not modelling of what actually happened over
40 years (as practices have changed over that time); rather, it is an average of 40 years of simulated data
based on current practices and aggregated for current land use pattern.
The report includes at Fig 1 the following map (Figure 13) which shows the likely spatial limits to further
market gardening expansion because of the breeze from Wairoa Gorge (which mitigates frost risk),
lower frosts and suitable soils:
Figure 13 – Potential market gardening area (dappled green)(Pierre Gargiulo, pers comm 2015)

Page: 33 of 43
Averaged SPASMO-modelled nitrate losses summarised for six Waimea catchment land uses and four
soil groups in kgN/ha/yr (assuming irrigation where needed, with no water rationing) are summarised
in the table below. Since this work was completed, SPASMO simulations have been completed for hops.
Results for hops have been inserted into the table below (italicised); they indicate nitrate losses between
those for apples and outdoor vegetable growing.
Land Use/ Farm System Ranzau soil Waimea & Motupiko soils
Wakatu & Dovedale soils
Richmond & Heslington soils
Proxy soil for S&Beef includes all other soils
Proxy soil for Forest & scrub†
Dairy pasture 68.8 63.4 65.6 24.0
Hops 32 18 23 8
Apples (also applied here to berries, kiwifruit, avocados)
18.3 6.6 9.3 3.1
Grapes (also applied to olives, small nuts)
18.3 9.8 13.6 4.3
Outdoor vegetables (also applied to nurseries, non-sealed glasshouses)
51.4 33.0 31.9 16.0
Other pasture/lifestyle block/non-agricultural (assumes extensive sheep & beef land use)
10.7
Forest, scrub 2.5
† an adopted average value from literature
Highest loss rates according to the SPASMO modelling are dairy, outdoor vegetables, hops, grapes, and
then apples. The table shows that the most sensitive plains soils for nitrate leaching are Ranzau, followed
by Waimea and Wakatu, which are similar, then Richmond soils.
Soil water-holding capacity is a much greater determinant of nitrogen losses than irrigation. As an
example, Figure 14 shows leaching from the assumed market gardening system in which fully irrigated
average losses are 51 for Ranzau soils compared with 33 kgN/ha/yr on Waimea soils.

Page: 34 of 43
Figure 14 – Year to year variation in N leaching from overall market garden, irrigated and non-irrigated, for
Ranzau and Waimea soils (Fig 5 in Fenemor et al 2015)
The report shows that looking at the individual market garden crops comprising the overall market
garden farm system, the Lettuce/Lettuce combination has particularly high nitrate losses compared with
the Cabbage/Lettuce and the Pumpkin/Lettuce combination.
The modelling shows there is little difference between nitrate losses for the same land use with or
without irrigation; however, irrigation allows more intensive land use, which may produce higher
nutrient loads overall depending on the land uses being intensified.
Total modelled nitrate loss from the 40600 ha of the lowland Waimea catchments for 2014 land uses is
287 tonnes per year.
Below the crop root zone, N losses may be attenuated (lowered) as the contaminant plume is carried
through the aquifer(s). The 2013 report evaluated potential attenuation between the root zone and
down-gradient surface water, suggesting possible attenuation of 60% in the unconfined aquifer,
negligible attenuation in the Hope Aquifers and UCA, and around 40% for the LCA. This report proposes
assuming attenuation in the confined aquifers is negligible, and in the unconfined aquifer attenuation
is caused only by dilution of river water recharging the adjoining aquifer.
Assuming no attenuation – a conservative assumption - groundwater flow tube analysis for various
scenarios of converting pasture to outdoor vegetable production (market gardening) predicted that
nitrate concentrations in the spring-fed Pearl Creek could increase by 0.44-0.48 g/m3 for 200–562
hectares converted. For the spring-fed Neimann Creek, equivalent increases in nitrate concentration
would be 0.54-1.06 g/m3, increasing the risk of exceeding acceptable aquatic ecosystem limits,
depending on what values those limits are ultimately based. For example, Figure 15 shows relative
spatial N losses for a scenario of 200ha more market gardening than in 2014 (note units are kg/yr for
each flownet block, not kg/yr for each ha which are shown in the table above)
0
10
20
30
40
50
60
70
80
90
19
74
19
76
19
78
19
80
19
82
19
84
19
86
19
88
19
90
19
92
19
94
19
96
19
98
20
00
20
02
20
04
20
06
20
08
20
10
20
12
Nit
rate
-N L
eac
he
d k
gN/h
a
Year
Between Year Variability in N Leached - Ranzau & Waimea 0 and 35mm/wk - Market Garden
Ranzau 35mm/wkFull Allocation
Waimea 35mm/wkFull Allocation
Ranzau No Irrigation
Waimea NoIrrigation

Page: 35 of 43
Figure 15 - Nitrate losses for every groundwater flow net cell for current land use plus 200 ha outdoor
vegetable growing (with all vegetable growing shaded). Blue boundary is potential market garden area
from Fig 10.
In relation to possible receiving water limits, the report builds on recommendations in the 2013 report,
this time including nitrate toxicity limits adjusted for water hardness based on the recommendation of
Hickey reviewed above (table below)

Page: 36 of 43
Recommended numeric objectives associated with maintaining various values within the Waimea Catchment and
Waimea Inlet (updated from Fenemor et al. 2013)
Waterbodies
Objectives
Safe for
swimming
Safe drinking
water
Limit risk of
nitrate toxicity
Control freshwater
periphyton growth
Limit macroalgal
blooms in the
Waimea Inlet
Waimea River
95th percentile
values of E.
coli shall be
<260 /100mL
N/A
Annual average
NO3-N shall be
<2.4 mgN/L and
annual 95th
percentile shall
be <3.5 mg/L
Dissolved reactive
phosphorus
concentrations
<0.026 mg/L
Spring-fed
streams N/A N/A
Annual average
NO3-N shall be
<7 mgN/L and
annual 95th
percentile shall
be <10 mg/L**
Dissolved reactive
phosphorus
concentrations
<0.026 mg/L
Total N load to
Waimea Inlet from
all sources <610
tonnes/year
(equivalent to <50
mgN/m2/day)
Groundwater N/A
No E. coli
detected;
Nitrate-nitrogen
concentration
<11.3 mg/L
* *
* Concentrations in groundwater need to be considered in relation to limits on the spring-fed streams
** Nitrate toxicity guideline limits shown are the more conservative levels calculated from Pearl and Borck
Creeks measured water hardness and calculated in Hickey (2015) as Hardness-specific nitrate-N guideline =
e0.9518*Ln(Hardness) - Constant, where 0.9518 is the slope of the hardness relationship (from Rescan 2012), hardness is
the measured value, and the Constant is a factor to adjust from the “NOF nitrate standards” reference hardness
value of 13 mg CaCO3/L for annual median and 95th percentile concentrations.
Finally, the report includes a brief summary of actions which could be undertaken on pastoral and
horticultural farm systems to reduce N losses, to help inform policy development.
Implications: This report is a useful source to sink conceptualisation of the causes and effects of N losses
across the Plains.
Gaps: This work applies to land uses in 2014, since which there has been further market garden and
some hop development. The NPSFM 2020 will also impose more stringent limits than proposed in the
report for nitrate toxicity as water hardness is not a mitigating factor in the proposed toxicity bottom
lines. With the recent and forthcoming soils data, and with updated land use mapping, the modelling
could be updated, however this need not delay policy development. If OVERSEER is adequately
improved to model horticultural systems, it would be useful to be able, in due course, to model the
effects of mitigations to determine whether changes in land management would enable achievement
of receiving water limits or whether more stringent land use controls may be necessary.
e. Datasets not reported above
Current TDC Waimea water quality monitoring sites (J McCallum, TDC, pers.comm.)

Page: 37 of 43
Site_name Easting Northing Programme Frequency
GW 32 - TDC 1613959 5425351 GNS NGMP Quarterly
GW 802 - Waiwest 1611246 5426481 GNS NGMP Quarterly
GW 114 - TDC Roadside 1610324 5419792 SOE Groundwater Quarterly
GW 1392 - Spring Grove 1605907 5417667 SOE Groundwater Quarterly
GW 37 - Gardner 1611852 5423288 SOE Groundwater Quarterly
GW 997 - McCliskies 1609013 5427614 SOE Groundwater Quarterly
GW 127 1610671 5423814 Waimea Plains Nitrate
Supplementary Data
Monthly
GW 163 1611537 5424174 Waimea Plains Nitrate
Supplementary Data
Monthly
GW 274 1611269 5425658 Waimea Plains Nitrate
Supplementary Data
Monthly
RW Borck @ 400m ds Queen St 1614660 5425096 SOE River Water Monthly
RW Neimann Ck @ 600m us
Lansdowne Rd
1611931 5427410 SOE River Water Monthly
RW Pearl Ck 1610884 5428577 Quarterly
2013-2016
RW Reservoir Ck @ 20m d-s
Salisbury Rd
1616813 5424118 SOE River Water Monthly
RW Wai-iti @ 400m d-s
Waimea W Rd
1608584 5420756 SOE River Water Monthly
RW Waimea @ SH60 Appleby 1610882 5426854 SOE River Water Monthly
RW Wairoa @ SH6 1610100 5419408 SOE River Water Monthly
Nutsford D. 2020. Tasman District Stream Delineation. GIS delineation of Tasman District streams for
which LiDAR data exists. Morphum Environmental advisory note #1 and GIS layers, January to Trevor
James. 7p
TDC GIS layers: full or partial land use maps for 2001/2002, 2005/2006, 2010/2011, 2013/2014 and
2015/2016 plus from A.Becher a ‘heatmap’ of Waimea Farm Types (>10) from AgriBase 2019 to indicate
Nitrate leaching by farm system and septic tanks, and an infiltration susceptibility map.
TDC Microbial Source Tracking data register from T.James describing faecal data origins as human or
ruminant or wildfowl or gull (or not)
TDC holds soils data and GIS maps for each of the 5 zones mapped by I Campbell and shown in Figure
3 with a report available for each zone: Redwood Valley, Waimea West, Brightwater, Waimea East and
Lower Queen Street. I have been advised by Landcare Research soil scientists (G Grealish, pers.comm.)
that further soil mapping is proposed to increase S-Map coverage on versatile lands. In the Waimea this
will comprise approximately 1,400 ha from Spring Grove inland to Belgrove, including Wakefield. The
work is a south-ward continuation of Waimea Plains survey area for which results have not yet been
reported.
Page: 38 of 43
On-site wastewater systems: Most on-site wastewater systems are permitted activities so Council only
holds limited information. FLAG July 2014 notes report potentially up to 789 on-site wastewater systems
within the water management Zones. Using on-site wastewater nitrate removal and leaching data from
Environment Waikato, Bay of Plenty and the US, the onsite systems are estimated to contribute up to
2kg/ha/yr, which can be compared to the current TRMP permitted activity level for bird and animal
effluent of 200kg/ha/yr. They may cause localised impacts but their contribution compared with land
use diffuse sources is small.
5. Conclusions
What does existing science knowledge tell us to inform an effective policy response to the high nitrate
concentrations in Waimea Plains waters? What further science is needed?
These conclusions can be drawn from this review:
It is helpful to use a ‘cause and effect’ conceptual model because the policy responses, and
ongoing science and monitoring, will likely need to focus on interventions at both the source
(land management and discharges) and in the various receiving waters (groundwater, streams
and the estuary).
The primary sources of nitrate contamination in the Waimea catchment are agricultural and
livestock land uses, and associated management practices. Secondary sources are human
wastewater discharges from septic tanks, likely only 1-2% of primary loads
Financial analyses based on returns over the past 5 years suggest that favoured land uses for
expansion post-dam would be hops, apples and vegetables, but N loss monitoring and
modelling show that the land uses with highest N losses are (from highest to lowest) dairy,
outdoor vegetables, hops, grapes, and then apples.
The most sensitive plains soils for nitrate leaching are the stony soils with lower water-holding
capacity, i.e. Ranzau, followed by Waimea and Wakatu, which are similar, then Richmond soils.
Soil water-holding capacity is a much greater determinant of nitrogen losses than presence or
absence of irrigation.
Water quality surveys since 1975 confirm the movement of a plume in groundwater of elevated
nitrate from the confined aquifer recharge areas near the closed piggery in the Aniseed Valley
Road/Patons Road area progressing northwards. Overall concentrations are slowly declining,
however high concentrations were found since 2016 around Blackbyre Road and State Highway
60 where the Upper Confined Aquifer (UCA) and Appleby Gravels Unconfined Aquifer (AGUA)
merge. Elevated nitrate concentrations were also present between Ranzau Road and the
Waimea Estuary where the UCA passes over the top of the LCA. These elevated concentrations
exceed the NZ Drinking Water Standard, and are affecting apple maturation when used for
orchard irrigation.
Monthly groundwater nitrate data suggest that the connectivity between the shallow AGUA and
underlying UCA in the Ranzau/Bartletts/Blackbyre/SH60 area is more widespread than earlier
hydrogeological interpretation would have suggested. The data suggest that the historic
contamination from the piggery closed in the 1980s has likely passed and that the nitrate
signature in these wells is caused by local and upstream intensive land uses, particularly market
gardening (vege growing).
Spring-fed streams Pearl Creek, Neimann Creek and Borck Creek are receiving waters for high
N groundwaters. Neimann and Borck creeks have the highest nitrate concentrations, but all

Page: 39 of 43
three streams have median concentrations exceeding the nitrate toxicity limit of 2.4 mg/l of the
NPSFM 2020, despite their high water hardness being a recognised mitigating factor which may
have justified a higher local toxicity limit. This means that rather than simply focussing on
managing these streams for periphyton and algae, nitrate concentrations will need to be
reduced to achieve compliance with the new toxicity (species protection) limits.
Modelling various scenarios of converting pasture to outdoor vegetable production (market
gardening) predicted that nitrate concentrations in Pearl Creek could increase by 0.44-0.48 g/m3
for 200–562 hectares converted. For Neimann Creek, equivalent increases in nitrate
concentration would be 0.54-1.06 g/m3, which would increase the exceedance of NPSFM
aquatic ecosystem limits.
The review concludes that there is already sufficient science information to adequately inform
development of a policy response for managing nitrates on the Waimea Plains. Development
of the Council’s Nutrient Management Approach should be the priority now rather than
awaiting additional information collection and research
Continuing monitoring and rerunning a N-loss Model (SPASMO or APSIM) based on present-
day land use mapping and further potential land use scenarios after the Waimea Community
Dam is commissioned would help to support and refine policy interventions and management.
6. Acknowledgements
Thanks to Joseph Thomas, Trevor James, Bernard Simmonds, Glenn Stevens, Melanie Westley, Anette
Becher for providing information, data and feedback, and to Lisa McGlinchey and Rochelle Selby-Neal
for their extensive reviews of the draft report.
7. Bibliography
Agribusiness Group 2015. Nutrient Performance and Financial Analysis of Horticultural Systems in the
Waimea Catchment. Report by S.Ford for Horticulture NZ and Waimea FLAG. 23p.
Aqualinc 2013. Waimea Plains groundwater flow model – results. Memorandum to Tasman District
Council by J Weir dated 26 June 2013.
Dicker, M.J.I.; Fenemor, A.D.; Johnston, M.R. 1992. Geology and Groundwater Resources of the Waimea
Plains, Nelson. Geological Bulletin, DSIR Geology and Geophysics, 59 pp.
Dryden, G; Hosie, C; Fenemor, A; Price, R; Green, S. 2017. Land use viability, Waimea Plains. Fruition
Horticulture consultancy report for Crown Irrigation Investments Limited (CIIL) and Waimea Irrigators
Limited (WIL) - commercial in confidence. 69p.
Edie, N. 1995. Groundwater quality survey Waimea Plains (1986-1994). Tasman District Council report.
January. 30p.
Fenemor A. 2017. Drawdown effects of increasing groundwater pumping from TDC’s Richmond
Borefield: Water Permit Renewal NN970213 > RM160099. Report for Tasman District Council
Engineering Dept, March, 9p.
Fenemor A, Weir J 2016. Waimea Community Dam: Peer Review of Waimea Plains Hydrology
underpinning the proposal. Landcare Research contract report LC2659 for Tasman District Council.
September. 53p. https://www.tasman.govt.nz/my-council/projects/waimea-community-
dam/document-

Page: 40 of 43
library/?path=/EDMS/Public/Other/Tasman/Projects/WaterAugmentationProjects/Water_for_Waimea_
Basin/LandcareResearchGroundwaterHydrologyPeerReview2016
Fenemor AD, Price R, Green, S. 2015. Modelling the Source and Fate of Nitrate-Nitrogen Losses from
Waimea Plains Land Uses. Landcare Research report LC2459 for the Waimea Freshwater and Land
Advisory Group, Tasman District Council, 32p.
http://www.tasman.govt.nz/document/serve/LC2459_Waimea_Nitrate_Modelling_FINAL.pdf?path=/ED
MS/Public/Meetings/FreshwaterLandAdvisoryGroups/WaimeaFLAG/2015/2015-07-19/000000459971
Fenemor A, Green S, Dryden G, Samarasinghe O, Newsome P, Price R, Betts H, Lilburne L 2015. Crop
production, profit and nutrient losses in relation to irrigation water allocation and reliability - Waimea
Plains, Tasman District: final report. MPI Technical Paper No: 2015/36. Landcare Research. 65 p.
http://www.mpi.govt.nz/document-vault/9899
Fenemor AD 2013. Summary of hydrology and water management bases for decisions on Waimea water
management, with and without water augmentation. Landcare Research report LC1647 to inform
Tasman District Council plan change C47, 25p.
Fenemor, A.D; Lilburne, L; Young, R.A.; Green, S.; Webb, T. 2013. Assessing Water Quality Risks and
Responses with Increased Irrigation in the Waimea Basin. Landcare Research contract report LC1246
for the Waimea Water Augmentation Committee, Tasman District. 42p.
Fenemor AD 2012. Proposed Changes to the Tasman Resource Management Plan for Implementing
Community Water Augmentation. Landcare Research contract report LC1101 for the Waimea Water
Augmentation Committee. 43p.
Fenemor AD. 2012. Water Allocation and Water Quality Management Plan Changes Assessment -
Options Report for decisions by the Waimea Water Augmentation Committee (WWAC). Water
augmentation policy proposals for discussion with WWAC water allocation group 23 May 2012 and full
WWAC 28 June 2012, 28p.
Fenemor, A.D. and Grace, E. 2009. Water Allocation Options and Resource Consent Requirements for
the Waimea Water Augmentation Project. Landcare Research contract report LC0910/059 for the
Waimea Water Augmentation Committee. 49pp.
Fenemor, A.D., M.A. Baker and J.T. Thomas. 1999. Water Resource Summary, Issues and Options – Part
II Waimea Water Management Area. Discussion document prepared for drafting of Part V of the Tasman
Resource Management Plan. 16p.
Fenemor, A.D. 1988. A Three-dimensional Model for Management of the Waimea Plains Aquifers,
Nelson. Publication No. 18 of DSIR Hydrology Centre, 133 pp.
Fenemor, A.D. 1987. Water quality of the Waimea Plains aquifers 1971-1986. Nelson Regional Water
Board. December. 40p.
Hickey C. 2013. Updating nitrate toxicity effects on freshwater aquatic species. NIWA Envirolink report
HAM2013-009. 34p. https://envirolink.govt.nz/assets/Envirolink/1207-ESRC255-Updating-nitrate-
toxcity-effects-on-freshwater-aquatic-species-.pdf
Hong T, Zemansky G 2009. Waimea water augmentation project feasibility study: phase 2 modelling
report. GNS Science Consultancy Report 2008/185 for the Waimea Water Augmentation Committee.
James, T 2020. Neimann Creek Restoration Work. Summary report, May 2020. Tasman District Council,
8p.
James, T and McCallum. 2015. State of the environment report – River water quality in Tasman District
2015. Tasman District Council report. 383p.

Page: 41 of 43
James, T. and Kroos, T. 2011. The Health of Freshwater Fish Communities in Tasman District 2011.
Tasman District Council State of the Environment Report #11001. September. 145p.
http://www.tasman.govt.nz/document/serve/State%20of%20the%20Environment%20Report2011.pdf?
path=/EDMS/Public/Other/Environment/EnvironmentalMonitoring/WaterMonitoring/Fish/000000204
290
Maps:
http://www.tasman.govt.nz/document/serve/State%20of%20the%20Environment%20Report%202011
%20-
%20Appendix.pdf?path=/EDMS/Public/Other/Environment/EnvironmentalMonitoring/WaterMonitorin
g/Fish/000000204291
James T. 2011. Tasman’s Natural Swimming Holes and Beaches - Popularity and Effects on the
Recreational Experience. TDC state of the environment report #11002.
http://www.tasman.govt.nz/document/serve/TasmanSwimmingAreaSurveyReport2011.pdf?path=/ED
MS/Public/Other/Environment/EnvironmentalMonitoring/WaterMonitoring/SurfaceWater/Recreationa
lSwimmingWater/000000191956
Lovett, A. and Rissmann, C. 2018. Evaluation of the physiographic method for the Tasman Region. Land
and Water Science Report 2018/01. 26p.
McGlinchey, L; James, T; Thomas, J; Fenemor, A; Selby-Neal, R. 2016. Nitrate in Freshwater: Science and
Management. Tasman District Council background paper for Takaka Freshwater and Land Advisory
Group, 27 January 2016. 18p.
NMRC, NCC and TDC. 1990. Waimea Basin – water resource and water supplies. Summary report on
reticulated supplies by J Wareing, P Dougherty, N Tyson & A Fenemor. July. 12p.
Rainham, D. 2015. Investigating Soil nitrate movement under intensive vegetable production on the
Waimea Plains, Tasman. Agfirst Consultants report for R Conning and M O’Connor. December. 18p.
Shaw, J. 1997. Land use survey – Hope/Ranzau area of the Waimea Plains. Tasman District Council report,
November. 47p.
Simmonds B and M Westley. 2020. Waimea Plains nitrate supplementary data: land-use, soil and
groundwater. TDC Operations committee report, summary report ROCCCC20-02-4 and presentation.
February. 26p, 9p & 20p.
Spencer M J. 1981. Waimea Plains nitrate survey – summer 1981. Nelson Catchment Board internal
report.
Stanton DJ and J L Martin. 1975 Nitrate levels in subsurface waters of the Waimea Plain, Nelson. NZ
Journal of Marine and Freshwater Research, 9:3, 305-309, DOI: 10.1080/00288330.1975.9515570
Stevens, G. 2017. Waimea groundwater nitrate synoptic survey. TDC Environment & Planning
committee report 17-06-05. June. 24p.
Stevens G. Groundwater Quality in Tasman District 2010. TDC State of the environment report R10003.
October. 53p.
http://www.tasman.govt.nz/document/serve/State%20of%20the%20Environment%20Report%20-
%20Groundwater%20Quality%20in%20Tasman%20District%202010.pdf?path=/EDMS/Public/Other/En
vironment/EnvironmentalMonitoring/WaterMonitoring/Groundwater/000000186335
Stewart MK, Stevens G, Thomas JT, Van der Raaij R, Trompetter V (2011) Nitrate Sources and residence
times of groundwater in the Waimea Plains, Nelson. Journal of Hydrology (NZ), 50(2):313-338

Page: 42 of 43
Stewart M K 2011. Improved understanding of groundwater movement and age in the aquifers of the
Waimea Plains. GNS Science consultancy Envirolink report 2011/55. 10p.
TDC and Tasman Environmental Trust. 2004. Pearl Creek, Tasman District. Booklet on history, ecology
and restoration by Ann Sheridan. 7p.
Westley, M. 2020. Proposal for increased monthly monitoring, Waimea Plains. Note for TDC. 9p. June
2020.
White PA, Reeves RR (1999) Waimea Plains aquifer structure as determined by three-dimensional
computer modelling. Journal of Hydrology (NZ), 38(1):49-75
Young R, Wagenhoff A, Holmes R, Newton M, Clapcott J. 2018. What is a healthy river? Prepared for
Cawthron Foundation. Cawthron report 3035. 45p.
Young RG, Doehring K, James T 2010. River Water Quality in Tasman District 2010. State of the
environment report for Tasman District Council. Cawthron report 1893. 165 p. plus appendices.

Page: 43 of 43
8. General References relevant to Nitrate Loss and Fate (courtesy A Becher, TDC)
Chrystal JM, Monaghan RM, Dalley D, Styles T (2012) Assessment of N Leaching losses from six case
study dairy farms using contrasting approaches to cow wintering. Proceedings of the New Zealand
Grasslands Association 74: 51-56
Crush JR, Cathcart, SN, Singleton P, Longhurst RD (1997) Potential for nitrate leaching from different
land uses in the Pukekohe area. Proceedings of the New Zealand Grasslands Association 59: 55-58
Dymond JR, Ausseil A-GE, Herzig A, McDowell RW (2013) New Zealand Journal of Agricultural Research,
56:49-59
Francis G, Trimmer LA, Tregurtha CS, Williams PH Butler RC (2003). Winter nitrate leaching losses from
three land uses in the Pukekohe area of New Zealand. New Zealand Journal of Agricultural Research,
46:215-224
Hudson N, Elliott S, Robinson B, Wadhwa S (2015) Review of historical land use and nitrogen leaching:
Waikato and Waipa catchments. Technical Leaders Group of the Healthy Rivers/Wai Ora Project Waikato
Regional Council Technical Report 2018/35
Ledgard G (2014) An inventory of nitrogen and phosphorous losses from rural land uses in the
Southland region. Environment Southland
Ledgard G (2013) Nitrogen, Phosphorus and Sediment losses from rural land uses in Southland.
Technical Report. Environment Southland Publication No 2013-7
McLay CDA, Dragten R, Sparling G, Selvarahja N (2001) Predicting groundwater nitrate concentrations
in a region of mixed agricultural land use: a comparison of three approaches. Environmental Pollution,
115:191-204
Monaghan R (2014) The influence of land use, soil properties and seasonal factors on contaminant
accumulation and loss from farming systems to water. Report prepared for Environment Southland.
AgResearch Ltd. RE500/2014/106
Schullehner, J., Hansen, B., Thygesen, M., Pedersen, C.B. and Sigsgaard, T., 2018. Nitrate in drinking water
and colorectal cancer risk: A nationwide population‐based cohort study. International journal of
cancer, 143(1), pp.73-79.
Stevenson BA, Parfitt RL, SChipper LA, Baisden WT, Mudge P (2010) Relationship between soil 15 N,
C/N and N losses across land uses in New Zealand. Agriculture, Ecosystems, and Environment, 139:736-
741