Research report prepared for ACTU
44
Research report prepared for ACTU Work and Welfare Perceptions Survey March, 2013
Transcript of Research report prepared for ACTU

Research report prepared for ACTU
Work and Welfare Perceptions Survey March, 2013

Background to the research Methodology and research design
2

3 Background to the project
Introduction The ACTU’s Wealth Inequality research in 2011 uncovered some fascinating misperceptions among the Australian public around the distribution of wealth. Understanding these misperceptions helps us understand how policy discussions may be re-framed to have more of an impact on Australians. It may also be the case that similar misperceptions exist around welfare payments and insecure employment. The current research will explore these misperceptions and specifically examine Australians’ attitudes and perceptions towards: • The make up of the Australian workforce – what percentage do they assume are
employed under casual employment arrangements? What industries do they think are more or less likely to have high proportions of casual workers?
• Access to benefits – what percentage do they assume have access to benefits such as paid sick leave, paid annual leave, OHS, Superannuation, etc.
• Attitudes to welfare payments – do Australians think that the welfare system is fair? Is this attitude based on inaccurate knowledge of the payments made to welfare recipients (i.e., do people overestimate how much someone on unemployment benefits actually receives?)
• The future of Australian industry – are people worried about issues such as income inequality? How do people think our industry landscape will change over the next 20 years – and does this make them concerned for job security?
We surveyed 1,013 Australians for this project – each participant took approximately 20-25 minutes to complete the survey. Fieldwork was completed via our online survey portal from 11-17th February 2013.
In the report we highlight any statistically significant differences as a function of age, gender, voting preferences, and whether the participants had ever received any welfare payments. Only statistically significant differences are described.
Sections of this report will be released in stages by the ACTU throughout 2013.

Summary
4

Summary 5
Workforce Perceptions
Workforce perceptions When asked to estimate the percentage of various types of employment in the Australian workforce, participants In the survey suggested: • Full and part-time (permanent) 62% • Casual 16% • Contractor 10% • Fixed term 7% • Other 5% As shown in the chart at right, these estimates correspond closely with the actual distribution of employee types. Source for ‘actual’: ABS, Forms of Employment, November 2011 (Released April 2012), Cat. 6359.0
Australian*workforce*
Q.*Thinking*the*Australian*workforce,*please*type*in*the*%*that*you*think*make*up*these*types*of*workers…*
62%*
16%*
10%*
7%*
5%*
59%*
19%*
9%*
3%*
9%*
Full*and*partFGme*employee*(permanent)*
Casual*employee*
Contractor*
Fixed*Term*Employee*
Other*
EsGmated* Actual*

Summary 6
Workforce Perceptions continued Australian vs. UK workforce Australians are quite split on whether they think our workforce composition is similar or different to that of the UK. A large proportion (41%) think that the two nations would be quite similar in their workforce composition. However. 30% think that Australia would have a higher proportion of permanent employees than the UK, and 29% think that Australian would have a higher proportion of temporary employees than the UK. In fact, the rate of temporary employment in Australia is much higher than in the UK – 28% compared to 6%. Source for ‘actual’: ABS, Forms of Employment, November 2011 (Released April 2012), Cat. 6359.0 OECD (2012) ‘Statistical Annex’ in OECD Employment Outlook 2012, Table F
Australia*and*the*UK*would*have*
similar*proporGons*of*permanent*and*temporary*(casual/fixed*
term)*employees*41%*
Australia*would*have*a*higher*proporton*of*permanent*
employees*than*the*UK*30%*
Australia*would*have*a*higher*proporGon*of*temporary*
employees*than*the*UK*29%*
Australian*vs.*UK*workforce*
Q.*Thinking*about*permanent*(full*Gme/part*Gme)*and*temporary*(casual/fixed*term)*workers*–*do*you*think…**

Summary 7
Workforce Perceptions continued Access to benefits As shown in the chart, for every employee benefit (paid annual leave, paid sick leave, OH&S, etc), there was a disparity between the estimated and the ideal levels with participants suggesting that more of the workforce should have access to each benefit than the estimate. In all instances, the actual proportions with access to benefits was higher than the estimated proportion of the total Australian workforce. For OHS protections, penalty rates, and working hours protections, actual access is higher than ideal access. Source for ‘actual’: ABS, Forms of Employment, November 2011 (Released April 2012), Cat. 6359.0
EsGmated*and*ideal*access*to*benefits*
Q.*Thinking*about*the*total*Australian*workforce,*please*type*in*the*%*of*the*workforce*who*you*think*HAS*ACCESS/SHOULD*HAVE*ACCESS*to*the*following*
benefits*as*part*of*their*employment*
55%*
55%*
68%*
69%*
38%*
43%*
50%*
62%*
62%*
82%*
91%*
62%*
82%*
82%*
79%*
79%*
85%*
89%*
68%*
73%*
81%*
Paid*annual*leave**
Paid*sick*leave**
Employer*contribuGons*to*super***
OccupaGonal*Health*and*Safety*protecGons*
Paid*carer's*leave**
Penalty*rates*(e.g.,*overGme,*weekend/public*holiday)***
ProtecGons*around*minimmum*and*maximum*working*hours***
EsGmated*access*(total*workforce)* Actual*access* Ideal*access*(total*workforce)*
* Actual access - % of permanent employees, including fixed-term
** Actual access - % of permanent and casual employees

Summary 8
Workforce Perceptions continued
Perception of casual employee access to benefits Participants were asked which employment benefits casual workers are entitled to in Australia. Almost all respondents thought casuals are entitled to OHS protections (90%). Agreement was also high for superannuation contributions (79% said yes), penalty rates (72%) and working hours protections (59%). Under Australian law, casual workers are in fact entitled to all four benefits, indicating that there is a marked level of misunderstanding of casual entitlements, particularly around penalty rates and working hours.
ProporGon*of*respondents*who*believe*casuals*are*enGtled*to…*
Q.*Thinking*about*casual*workers*in*Australia…Are*casual*workers*in*Australia*enGtled*to…*(Yes/No)*Chart&displays&%&saying&yes&
90%*
79%*
72%*
59%*
15%*
13%*
11%*
OccupaGonal*Health*and*Safety*protecGons*
Employer*contribuGons*to*superanuaGon*
Penalty*rates*(e.g.,*overGme,*weekend/public*holiday)*
ProtecGons*around*minimmum*and*maximum*working*hours*
Paid*sick*leave*
Paid*annual*leave*
Paid*carer's*leave*

Summary 9
Workforce Perceptions continued
Perceived change in proportion of casual workers over time Most participants (87%) thought that there would be a higher proportion of causal workers in the Australian workforce today compared to 20 years ago
The stereotyped view of the casual employee Participants were asked to estimate the percentage of employees who fit into certain demographic categories. The stereotyped view of the casual employee is someone who is female, aged under 25 years, without a post-school qualification and in their current job for more than a year. Casual workers were most likely thought to work in hospitality and retail. The industry estimates are provided in the chart on this page. The proportion of the hospitality industry made up of casual workers was underestimated; the presence of casuals in the remaining industries was substantially overestimated. Just over 50% of the respondents (51%) thought that causal workers hope to transition into permanent roles, but that this rarely happens. It was thought to be the “trap of the casual” rather than the bridge to permanent work. Source for ‘actual’: ABS, Forms of Employment, November 2011 (Released April 2012), Cat. 6359.0
Industry*percepGons**
Q.*Thinking*about*casual*workers*in*Australia*–*What*percentage*of*the*[insert]*industry*is*made*up*of*casual*workers?**
57%*
54%*
37%*
33%*
25%*
64%*
40%*
23%*
18%*
19%*
Hospitality*
Retail*
Transport/postal/warehousing*
Health*care/social*assistance*
EducaGon*
EsGmated* Actual*

Summary 10
Workforce Perceptions continued
Employee vs. employer control When asked where the balance of power lies in today’s workplaces, 69% of Australians thought that employers have the upper hand and that this power has increased over the last 20 years.

Summary 11
Welfare Perceptions
New Start perceptions Australians overestimated the actual amount of New Start and think that it should be raised by almost $70 per week. • Actual: $246.30 • Estimated: $259.74 • Ideal: $315.19
Welfare fraud perceptions It was estimated that 17% of welfare recipients are prosecuted for welfare fraud in Australia. However, in 2009-10, only 3,461 cases of fraud were prosecuted – a prosecution rate of less than 1% of over 7 million customers. Source for ‘actual’: Australian Institute of Criminology, Welfare fraud in Australia: Dimensions and issues, June 2011 Accessed at: http://aic.gov.au/publications/current%20series/tandi/421-440/tandi421.html Welfare comparisons When asked how Australia compares to the US and the UK in terms of government welfare payments (as a proportion of total government budgets), 61% of Australians think we spend more than the US, and 31% think we spend more than the UK. In 2009 (the last year for which there is complete data) Australian public spending on cash benefits accounted for 22% of total government expenditure – marginally less than the UK and the USA (both 23%). Source for ‘actual’: OECD Social Expenditure Database

Summary 12
Societal and Industry Perceptions
Industry perceptions When asked what proportion of Australia’s GDP comes from mining, the average estimate was 38%. While there was some talk of the burst of the mining bubble, this proportion was expected to persist for the next 20 years (with an estimate of 39% of our GDP coming from mining in 20 years). Other industries were also thought to remain relatively stable over the next 20 years: • Manufacturing: 23% today, 20% in 20 years • Services: 33% today, 35% in 20 years • Construction: 24% today, 25% in 20 years
These were large overestimates of the share of Australia’s GDP coming from mining, manufacturing and construction today. In 2011-12, the mining industry directly accounted for 10% of GDP, and manufacturing and construction for 7% each. The services industry (defined as all industries other than agriculture, mining, manufacturing and construction), contributed to 60% of GDP. Source: ABS Australian System of National Accounts, 2011-12, Cat 5204.0 Concerns of Australians A list of industry issues and challenges were given to survey participants and they were asked to rate the extent to which they were concerned about each. One of the items of highest concern was Kids of today not having access to good jobs here in Australia when they grow up (55% very/extremely concerned), followed by the Growing number of ‘working poor’ (American style working poor who are stuck in low paid, insecure jobs) (54% very/extremely concerned).

Demographics
13

We surveyed 1013 people across Australia…
Demographic profile of survey respondents 14
Gender&(n=1013)* N* %*
Male* 518* 51%*
Female* 495* 49%*
Age&(n=1013)* N* %*
18*–*24* 127* 12%*
25*–*34** 230* 23%*
35*–*44* 198* 20%*
45*–*54* 203* 20%*
55*–*64* 206* 20%*
65*and*over* 49* 5%*
Loca5on&(n=1013)* N* %*
Queensland* 207* 20%*
New*South*Wales* 201* 20%*
Victoria* 217* 21%*
South*Australia* 153* 15%*
Western*Australia* 102* 10%*
ACT* 54* 5%*
Tasmania* 51* 5%*
Northern*Territory* 28* 3%*
Employment&(n=1013)* N* %*Employed*full*Gme*(permanent)* 380* 38%*
Employed*part*Gme*(permanent)* 110* 11%*
Employed*as*a*casual* 110* 11%*
Employed*as*a*contractor* 40* 4%*Employed*as*a*Fixed*Term*Employee* 8* 1%*
Not*employed*but*looking*for*work* 58* 6%*
A*home*maker* 83* 8%*
ReGred* 116* 12%*
Other* 108* 11%*
Vo5ng&preference&(n=1013)* N* %*
Typically*vote*Labor* 297* 29%*
Typically*vote*Liberal* 279* 28%*
Typically*vote*Greens* 75* 7%*
Typically*vote*for*another*party* 53* 5%*
I*would*prefer*not*to*say* 309* 31%*
Welfare&ever&received&(n=1013)* N* %*
Austudy* 141* 14%*
Abstudy* 18* 2%*
Youth*Allowance* 123* 12%*
New*Start/Unemployment*benefits* 249* 25%*
Family*Payments* 270* 27%*
Single*parent*payments* 75* 7%*
Disability*pension* 96* 10%*
Age*pension* 52* 5%*
Other*(please*specify)* 78* 8%*
Ever*received*any*welfare*payment* 741* 73%*

Detailed results Detailed breakdown of results and differences between demographic groups.
15

Workforce perceptions
16

Australian workforce perceptions 17
n=1013*
Gender Females predicted that there were less full time employees (M=39.45%) than males (M=44.30%). Conversely, males predicted that there were less casual (M=15.31%) and fixed-term (M=6.03%) employees in the Australian workforce than females (M=17.01% and M=7.40% respectively) Age There was also a significant age difference, with those in the 45-54 and 55-64 age brackets predicting less people employed in fixed term employment (M=6.09% and M=5.95%) to those in the 18-24 and 25-34 age brackets (M=7.93% and M=7.58%). Participants aged 18-24 predicted a significantly lower percentage of employees in full-time employment (M=34.61%) compared to all other age brackets (25-34 M=40.46%, 35-44 M=43.2%, 45-54 M=44.48%, 55-64 M=43.05%, 65+ M=47.45%) Voting preference The only difference to emerge as a function of voting preference was that participants who typically vote Liberal predicted there were fewer employees in fixed-term positions in the Australian workforce (M=5.47%) compared to Labor, other, and not disclosed (Labor M=6.89%, other M=7.75%, not disclosed M=7.55%). Welfare Payments Participants who had never received any type of welfare payments predicted there were more full-time employees in the work force (M=44.54%), less casual (M=16.73%), and fewer people employed in other types of work (M=3.5%) than those who had received at least one type of welfare payment (M=40.97%, M=16.73% and M=4.94% respectively).
Australian*workforce*
Q.*Thinking*the*Australian*workforce,*please*type*in*the*%*that*you*think*make*up*these*types*of*workers…*
42%*
20%*
16%*
10%*
7%*
5%*
Full*Gme*employee*(permanent)*
Part*Gme*employee*(permanent)*
Casual*employee*
Contractor*
Fixed*Term*Employee*
Other*

Australia*and*the*UK*would*have*
similar*proporGons*of*permanent*and*temporary*(casual/fixed*
term)*employees*41%*
Australia*would*have*a*higher*proporton*of*permanent*
employees*than*the*UK*30%*
Australia*would*have*a*higher*proporGon*of*temporary*
employees*than*the*UK*29%*
Australian versus UK workforce 18
n=1013*
There were no significant gender, voting preference, or
welfare payment status differences in how people thought
the Australian workforce compared to the UK.
However, there was a generational difference, with those in
the 65+ age bracket thinking that Australia had a much
higher proportion of temporary employment (47%)
compared to those is the 18-24 (22%) and 25-34 age
brackets (23%).
Australian*vs.*UK*workforce*
Q.*Thinking*about*permanent*(full*Gme/part*Gme)*and*temporary*(casual/fixed*term)*workers*–*do*you*think…**

Australian versus UK workforce 19
Respondents who said there would be higher number of
permanent or casual employees in the Australian workforce
were then asked to estimate by how much. There were no
significant differences by age, gender, or voting preferences
in these responses.
For comparison, the estimated figures for the Australian
workforce (from our earlier question) are:
• Permanent (full and part time): 62%
• Temporary (casual and fixed combined): 23% (16% for
casual; 7% for fixed contractor).
Australian*vs.*UK*workforce*
40%*
23%*
EsGmated*%*of*permanent*workers*in*the*UK*(n=300)*
EsGmated*%*of*temporary*workers*in*the*UK*(n=295)*
Q.*What*proporGon*of*the*UK*workforce*do*you*think*is*made*up*of*permanent/temporary*workers…?*

Access to benefits: estimated and ideal 20
Gender Female participants believed that less of the Australian workforce had access to paid annual leave (M=53.69%), paid sick leave (M=52.26%), occupational health and safety protections (M=65.63%), and protections around minimum and maximum working hours (M=45.48%) than males (M=56.94%, M=56.83%, M=71.92% and M=53.71% respectively). On the other hand, when asked what percentage should have access, females reported a higher percentage than males on all aspects except for occupational health and safety protections (which was similar between males M=87.64%, and females M=89.41%) Age Participants aged 18-24 provided lower estimates of the proportion of employees with access to paid annual leave than any other age bracket, and also gave lower estimates for access to paid sick leave (than 35-44, 45-54, 55-64, and 65+), employer contributions to superannuation (than 45-54 and 55-64), and occupational health and safety protections (45-54, 55-64, and 65+). When asked what percentage should have access, a similar pattern appeared. Participants aged 65+ felt that a smaller proportion of the workforce have access to paid carer’s leave than those aged 25-34, 35-44, 45-54, and 55-64. When asked what proportion should have access, this result is reversed with those in the 65+age bracket suggesting a significantly larger portion that those in the 35-44 and 45-54 brackets. Voting preference Participants who typically voted for Liberal tended to estimate a higher percentage of the workforce with access to various benefits than other voting types. There were no significant differences when asked what proportion should have access. Welfare payments Participants who had never accessed welfare payments predicted significantly higher access to all benefits (other than occupational health and safety protections and penalty rates) compared to those who had received at least one welfare payment. When asked what percentage should have access, no significant differences were found.
EsGmated*and*ideal*access*to*benefits*
Q.*Thinking*about*the*total*Australian*workforce,*please*type*in*the*%*of*the*workforce*who*you*think*HAS*ACCESS/SHOULD*HAVE*ACCESS*to*the*following*
benefits*as*part*of*their*employment*
55%*
55%*
68%*
69%*
38%*
43%*
50%*
62%*
62%*
82%*
91%*
62%*
82%*
82%*
79%*
79%*
85%*
89%*
68%*
73%*
81%*
Paid*annual*leave**
Paid*sick*leave**
Employer*contribuGons*to*super***
OccupaGonal*Health*and*Safety*protecGons*
Paid*carer's*leave**
Penalty*rates*(e.g.,*overGme,*weekend/public*holiday)***
ProtecGons*around*minimmum*and*maximum*working*hours***
EsGmated*access*(total*workforce)* Actual*access* Ideal*access*(total*workforce)*
* Actual access - % of permanent employees, including fixed-term
** Actual access - % of permanent and casual employees

Casuals entitlements 21
n=1013*
There were no significant differences found in the estimation
of casual employee entitlements between gender or political
preferences.
However, age and welfare access played a significant role in
the perception of some entitlements. Participants aged
55-64 were less likely to think that casual workers were
entitled to penalty rates (58% yes) than those in the younger
age brackets. In addition, participants in the 45-54 and
55-64 age brackets were more likely to say that casual
workers were entitled to occupational health and safety
protections (92% and 93% respectively), compared to those
in the 18-23 (81%) and 25-34 (89%) age brackets.
Another significant difference occurred between those who
have received at least one form of welfare payment and
those who have not. Participants who have never received
welfare payments were more inclined to believe that more
casual workers are entitled to occupational health and safety
protections (95%) than those who have (88%).
ProporGon*of*respondents*who*believe*casuals*are*enGtled*to…*
Q.*Thinking*about*casual*workers*in*Australia…Are*casual*workers*in*Australia*enGtled*to…*(Yes/No)*
90%*
79%*
72%*
59%*
15%*
13%*
11%*
OccupaGonal*Health*and*Safety*protecGons*
Employer*contribuGons*to*superanuaGon*
Penalty*rates*(e.g.,*overGme,*weekend/public*holiday)*
ProtecGons*around*minimmum*and*maximum*working*hours*
Paid*sick*leave*
Paid*annual*leave*
Paid*carer's*leave*

Higher*proporGon*87%*
Lower*proporGon*6%*
Similar*proporGon*7%*
Estimated change in casual workers over time 22
n=1013*
Although the majority of respondents answered that they
thought there is now a higher proportion of casual workers
in the Australian workforce compared to 20 years ago, there
were some generational differences in the responses.
Respondents in the younger age brackets (18-24, 25-34)
were less likely to say that there was a higher proportion of
casual workers in the workforce today than 20 years ago
(80% and 81% respectively) compared to those in the 55-64
age bracket (93%).
Similarly, respondents in the younger age brackets (18-24,
25-34) were more likely to say that there were less casual
workers in the workforce today (11%, 12%) than those aged
45-54 (4%) and 55-64 (1%).
EsGmated*change*in*casual*workers*over*Gme*
Q.*Thinking*about*casual*workers*in*Australia…Do*you*think*the*proporGon*of*casual*workers*has*changed*over*the*last*20*years?**
Higher/lower/similar&propor6on&of&casual&workers&in&the&workforce&today&compared&to&20&years&ago&

47%*
28%*
56%*
33%*
48%*
36%*
35%*
In*current*job*for*1*year*or*more*
In*current*job*for*5*years*or*more*
Are*female*
Are*aged*40*years*or*over*
Are*aged*25*years*or*younger*
Have*a*postFschool*qualificaGon*
Prefer*casual*over*permanent*employment*
Casual worker perceptions 23
n=1013*
Males seem to consistently suggest that a lower proportion
of the casual worker population fit into the various
categories. Females gave higher estimates than males of the
proportion of casual workers who have been in their current
job for more than 5 years (females M=30.43%, males
M=25.70%), are female (females M=58.07%, males
M=53.29%), are 40 years or older (females M=35.00%, males
M=30.19%), and have a post-school qualification (females
M=38.42%, males M= 34.12%).
An interesting age divide was depicted in the results. The
younger age brackets (18-24 and 25-34) estimated a higher
proportion of the casual workforce aged 25 and under, whilst
the older age brackets (35-44, 45-54, 55-64, 65+) estimated
a higher percentage over the age of 40.
In general, respondents thought that there were more female
than male casual workers (M=55.63%) in the Australian
workforce. As well as females suggesting a significantly
higher proportion of females in casual work than males,
those in the age brackets 35-44 (M=57.39%), 45-54
(M=57.78%), and 55-64 (M=59.52%) estimated a higher
proportion of females than those in the 18-24 (M=51.8%) and
25-34 (M=50.50%) age bracket.
The*casual*worker*is*perceived*to*be…*
Q.*Thinking*about*casual*workers*in*Australia*–*what*%*do*you*think…*

Casual worker industry perceptions 24
There were significant gender differences for every industry,
with males estimating a significantly lower representation of
casual workers in each industry than did females.
There were also differences between the age brackets. Those
aged 18-24 (M=47.42%), 24-34 (M=53.77%), and 35-44
(M=55.21%) all estimated a lower proportion of casual
workers in the hospitality industry compared to those in the
55-64 age bracket (M=66.10%). Moreover, those in the 18-24
(M=30.21%) and 25-34 (M=30.87%) age brackets estimated a
lower percentage than those in the 55-64 age bracket
(M=37.58%) in the health care/social assistance industry.
No significant differences were associated with political
preference or welfare payments.
Industry*percepGons**
Q.*Thinking*about*casual*workers*in*Australia*–*What*percentage*of*the*[insert]*industry*is*made*up*of*casual*workers?**
57%*
54%*
37%*
33%*
25%*
64%*
40%*
23%*
18%*
19%*
Hospitality*
Retail*
Transport/postal/warehousing*
Health*care/social*assistance*
EducaGon*
EsGmated* Actual*

28%*
51%*
21%*
People*accept*casual*work*in*the*hope*of*it*turning*into*permanent*work*F*which*it*olen*
does*
People*accept*casual*work*in*the*hope*of*it*turning*into*permanent*work*F*but*it*rarely*
does*and*they*become*stuck*as*a*casual*
People*accept*casual*work*without*expecGng*to*turn*it*into*permanent*work*
Casual worker perceptions 25
n=1013*
Respondents who have received one or more types of
welfare payments were less likely to agree that those people
in casual work are there because they prefer that type of
work (34%) than were those who have never received
welfare payment (39%).
A quarter of typical Liberal voters (26%) agreed that casual
workers accept work without expecting it to become
permanent, compared to 17% of those who did not disclose
their voting preference.
Interestingly, males seem to have a more positive approach
towards casual employment than females: 31% of males
agreed that casual work often turns into permanent work,
while a significantly smaller percentage of females (25%) felt
the same.
A difference in age was also found, with respondents aged
35-44 significantly less likely to think that people accept
casual work without expecting it to turn into permanent
work (16%) compared to the 18-24 age bracket (31%)
Casual*worker*percepGons**
Q.*Thinking*about*casual*workers*in*Australia?**

Employer vs. employee control 26
n=1013*
Results across the demographics tended to be quite similar,
however there was a significant difference between
respondents who voted Labor or Liberal.
Typical Labor voters were more likely than those who voted
Liberal to say that employers have more control over the
employee arrangements now that they did 20 years ago
(72% compared to 60%).
In addition, respondents who voted Labor were less likely to
say that employees now have access to more secure work
than they did 20 years ago (28%), compared to those who
voted Liberal (40%).
Employer*vs.*employee*control*
EMPLOYERS*have*even*more*control*
over*the*employment*arrangements*
now*than*they*did*20*years*ago*
69%*
EMPLOYEES*now*have*access*to*
more*secure*work*than*they*did*20*
years*ago*31%*
Q.*Thinking*about*the*total*workforce*in*Australia…*there*are*two*sides*to*employment*arrangements*–*more*flexible*employment*arrangements*are*good*for*businesses,*but*more*secure*employment*
arrangements*are*good*for*workers*–*it*is*olen*difficult*to*balance*both*needs.*Which*of*the*following*statements*best*captures*your*views*when*it*comes*to*employment*arrangements*over*the*last*20*years*

Welfare perceptions
27

“New Start” allowance perceptions 28
Actual: $246.30
Estimated: $259.74
Ideal: $315.19
When asked to identify the weekly monetary amount paid by
the “New Start” allowance, the overall estimate was slightly
higher than the actual amount, while the overall ideal value
of the weekly allowance was substantially higher than the
actual value.
Differences in perceptions of the “New Start” allowance were
generally associated with age. Those aged 25-35 provided a
higher estimate of the allowance than those aged 35-44 or
45-54, and also provided a higher ideal estimate than those
aged 45-54.
Experience of the welfare system also influenced estimates
of the “New Start” allowance, with those who had ever
received welfare making a significantly lower estimate than
those who had not, bringing their estimate closer to the
actual amount.
Newstart*payment*esGmate/ideal*
Thinking*about*a*single*person*(no*dependents)*in*Australia*who*is*receiving*the*“New*Start”*allowance*(this*is*the*name*of*the*federal*unemployment*benefit*payments*–*other*names*you*might*know*it*by*are*the*unemployment*payment,*the*dole,*etc…but*it*is*the*payment*made*to*an*unemployed*person*looking*
for*work*in*Australia).**How*much*do*you*think*this*payment*IS/SHOULD*BE*per*week?**
*$259.74**
*$259.64**
*$259.85**
*$250.66**
*$284.67**
*$251.32**
*$244.40**
*$260.81**
*$261.29**
*$255.40**
*$263.82**
*$268.46**
*$266.41**
*$256.10**
*$255.29**
*$271.74**
$315.19*
308.75*
$321.69*
$314.30*
$334.31*
$306.51*
$292.93*
$329.22*
$300.71*
$317.86*
$300.04*
$330.97*
$329.02*
$317.62*
$317.47*
$308.93*
Total*(n=986/966)*
Male*(n=502/485)*
Female*(n=484/481)*
18F24*(n=115/112)*
25F34*(n=220/211)*
35F44*(n=196/191)*
45F54*(n=201/199)*
55F64*(n=205/204)*
65+*(n=49/49)*
Labor*(n=291/287)*
Liberal*(n=273/264)*
Green*(n=71/72)*
Other*party*(n=51/49)*
Won't*say*(n=292/286)*
Have*received*welfare*(n=719/709)*
Never*received*welfare*(n=267/257)*
Payment*is*(mean)* Payment*should*be*(mean)*

“New Start” allowance perceptions 29
Respondents were then told that the actual weekly amount
of the “New Start” allowance is $246.30 per week, and asked
if this value was too high, too low or about right. Differences
in welfare payment status were found, with those never
having received any kind of welfare payment more likely to
indicate that $246.30 was “too generous”, and those who
had ever received any kind of welfare payment more likely to
indicate this amount was “not high enough”.
The younger age bracket (18-24), when compared to the
55-64 age bracket, were more likely to say that the payment
was “too generous” (23%, 10%).
New*Start*percepGons*
Q.*The*actual*amount*they*get*per*week*is*$246.30.*Do*you*think*this*is…?**
15%*
20%*
13%*
31%*
36%*
30%*
54%*
44%*
57%*
Total*(n=1013)*
Never*received*welfare*payments*(n=272)*
Ever*received*welfare*payments*(n=741)*
Too*generous* About*right* Not*high*enough*

23%* 34%* 16%* 8%* 18%*Length*of*Gme*on*welfare*payment*
Less*than*6*months* 6*F*12*months* 12*F*18*months* 18*F*24*months* 2*years*or*longer*
“New Start” allowance perceptions 30
n=1013*
When asked how long they thought people typically stayed
on the “New Start” allowance, there was a significant
difference between those who had never received any kind
of welfare payment and those who had.
People who had never received welfare payments were more
likely to believe that people only stayed on the payment for
less than 6 months (28%) compared to 21% of those who had
received welfare.
Those who had received welfare payment were more likely to
predict that people would stay on the allowance for two or
more years (20%) compared to those who have never
received welfare (14%).
EsGmated*length*on*New*Start*
Q.*Thinking*about*a*single*person*(no*dependents)*in*Australia*who*is*receiving*the*“New*Start”*allowance.*How*long*do*you*think*they*would*typically*stay*on*this*welfare*payment?**
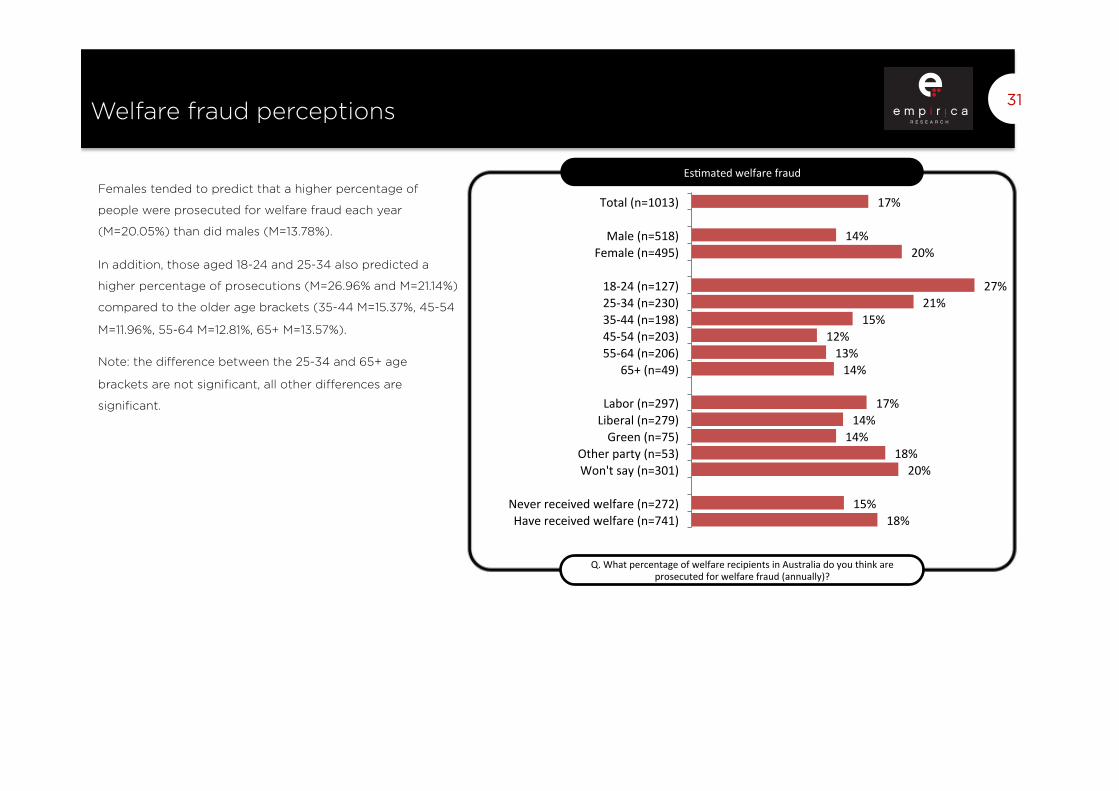
Welfare fraud perceptions 31
Females tended to predict that a higher percentage of
people were prosecuted for welfare fraud each year
(M=20.05%) than did males (M=13.78%).
In addition, those aged 18-24 and 25-34 also predicted a
higher percentage of prosecutions (M=26.96% and M=21.14%)
compared to the older age brackets (35-44 M=15.37%, 45-54
M=11.96%, 55-64 M=12.81%, 65+ M=13.57%).
Note: the difference between the 25-34 and 65+ age
brackets are not significant, all other differences are
significant.
EsGmated*welfare*fraud*
Q.*What*percentage*of*welfare*recipients*in*Australia*do*you*think*are*prosecuted*for*welfare*fraud*(annually)?**
17%*
14%*20%*
27%*21%*
15%*12%*13%*14%*
17%*14%*
14%*18%*20%*
15%*18%*
Total*(n=1013)*
Male*(n=518)*Female*(n=495)*
18F24*(n=127)*25F34*(n=230)*35F44*(n=198)*45F54*(n=203)*55F64*(n=206)*
65+*(n=49)*
Labor*(n=297)*Liberal*(n=279)*Green*(n=75)*
Other*party*(n=53)*Won't*say*(n=301)*
Never*received*welfare*(n=272)*Have*received*welfare*(n=741)*

Australian welfare spend: comparisons to US and UK 32
n=1013*
When asked to compare the amount that the Australian
Government spends on welfare to that of the UK, no
significant differences were found across the demographics.
However, when compared to the US, differences in
perceptions appeared between gender and age.
Males were less likely to respond that the US and Australian
Governments spent the same proportion on welfare (18%)
than were females (23%).
Moreover, those aged 45-54 and 55-64 were also less likely
to respond that they spend the same proportion (16% and
15% respectively) than the 18-24 age bracket (32%).
Another age difference was observed between those aged
35-44 and 45-54 and those aged 55-64. Respondents aged
35-44 (22%) and 45-54 (23%) were more likely than those
aged 55-64 (11%) to believe that the Australian government
spent a lower proportion on welfare than the US
government.
Welfare*spend*comparisons*
Q.*Thinking*about*the*amount*of*money*the*Australian*Federal*Government*spends*on*welfare*payments,*how*do*you*think*this*compares*to*the*United*Kingdom/United*States*(as*a*proporGon*of*total*government*
budget)**
31%*
61%*
43%*
20%*
26%*
19%*
UK*
US*
Australia*spends*more* Australia*spends*the*same* Australia*spends*less*

Australian industry perceptions
33

23%*
20%*
22%*
38%*
39%*
28%*
33%*
35%*
40%*
24%*
25%*
24%*
Today's*economy*
Twenty*years*from*now*
Share*of*employment*
Manufacturing* Mining* Services* ConstrucGon*
Perceived % of GDP (now/20 years) and perceived share of employment 34
N=1013*
Males predicted a significantly lower share of employment by each
industry compared to females, and also predicted that each industry
made up a lower portion of Australia’s GDP today than females.
When asked about 20 years from now, they continued to predict a
lower proportion than females in manufacturing (males: M=17.89%,
females: M=22.35%), services (males: M=32.20%, females: M=37.82%),
and construction (males: M=21.74%, females: M=28.05%) in the
make-up of Australia’s GDP.
Respondents aged 18-24 tended to estimate a higher proportion of
Australia’s GDP and share of employment from the manufacturing
industry (M=27.87% and M=29.46%) than the older age groups:
25-34 (M=23.16% and M=27.07%), 35-44 (M=20.98% and M=17.90%),
45-54 (M=21.58% and M=17.52%), 55-64 (M=21.55% and M=16.79%),
65+ (M=20.78% and M=14.71%).
Those who had received at least one type of welfare payment
tended to estimate a larger proportion GDP coming from the
construction industry today (M=24.89%), in 20 years (M=25.85%),
and share of employment (M=24.71%), compared to those never
having received welfare (M=20.92%, M=22.03% and M=22.22%
respectively). Those who had received welfare also estimated a
larger proportion of Australia’s GDP coming from manufacturing
today (M=23.47%) and in 20 years (M=21.03%) than those not having
received welfare (M=20.11% and M=17.45% respectively).
Industry*percepGons*
Q.*We*would*like*to*know*what*percentage*of*Australia’s*GDP*comes*from*these*industries*in*today’s*economy/twenty*years*from*now:*(note,*this*is*not*a*full*industry*list,*so*your*numbers*do*
not*need*to*add*to*100).**Q.*What*share*of*employment*do*you*think*each*of*these*industries*has*in*Australia*(i.e.,*what*
percentage*of*the*workforce*do*you*think*is*employed*in*each*of*these*industries)?**

Australians’ concerns… 35
Significant differences in Australians’ concerns appeared across all
demographics. Typically, men were less likely to be extremely
concerned than females. The only items where this did not hold true
were “smart industries” (males: 21% extremely concerned, females:
19% extremely concerned), the end of the mining boom (males, 11%,
females: 10%) and the future of the manufacturing industry (males:
24%, females: 21%) – note that none of these differences were
significant.
Younger generations tended to be less concerned than older
generations across the board: significant differences included “smart
industries” (18-24 very concerned 17%, 55-64 40%), kids not having
good jobs in Australia when they grow up (18-24 extremely
concerned 16%, 55-64 31%), and the future of the manufacturing
industry (18-24 extremely concerned 12%, 55-64 37%).
Interestingly, those who typically vote Labor were significantly less
likely to be “not at all concerned” with the possible end of our
mining boom (9%) compared to those who voted for the Greens
(21%).
Respondents who had never received welfare payments were less
likely to be extremely concerned on all items, this difference was
significant for all items except the future of the manufacturing
industry.
Australians’*level*of*concern*
Q.*How*concerned*are*you*about*the*following*issues*in*Australia?**
n=1013*
7%*
6%*
7%*
7%*
7%*
11%*
11%*
14%*
14%*
14%*
15%*
16%*
18%*
20%*
24%*
26%*
28%*
27%*
28%*
28%*
33%*
31%*
31%*
31%*
28%*
29%*
26%*
25%*
24%*
23%*
21%*
23%*
20%*
17%*
11%*
Kids*of*today*not*having*access*to*good*jobs*here*in*Australia*when*they*grow*up*
Growing*number*of*"working*poor"*("American*style"*working*poor*who*are*
stuck*in*low*paid,*insecure*jobs)*
Rising*inequality*of*incomes*in*Australia*
Future*of*Australian*manufacturing*industry*
Australia*falling*behind*not*invesGng*in*"smart"*industries*
Technology*advances*that*replace*need*for*"human"*workers*
That*our*mining*boom*ends*
Not*at*all*concerned* Somewhat*concerned* Moderately*concerned*
Very*concerned* Extremely*concerned*

Free response items… 36
In the final part of the survey, participants were randomly assigned to receive one of six free response questions:
• Do you think Australian workplaces reflect "Australian values"? What are these values and why do you think our workplaces do or don’t reflect these
values.
• How do you think the Australian workforce will change over the next 20 years? Does this worry you or excite you
• What do you worry about in your job? What’s the one thing that would make your job better?
• What will our mix of industries/jobs look like in 20 years?
• Sometimes you hear politicians or employers talking about “productivity” – what do you think of when you hear this term?
• It is sometimes said that Australia just follows in the footsteps of the USA. Do you think this is true when it comes to our workplaces and work lives? And
does this worry/excite you? Should we be trying to be like the US or trying to avoid being like the US?
• What do employers/politicians mean by the term “flexibility”?
On the following pages we summarise the responses to these questions.

Australian work and Australian values 37
It is clear that Australians value fairness and teamwork. At the core of
Australian culture is a willingness to lend a helping hand to those in
need. This teamwork and respect for the underdog is represented by
the power of work unions and the critical role they have played in
establishing fair pay and hour regulations for workers throughout
Australian history.
Australians expressed an importance of hard work, a value system that
is juxtaposed to their appreciation for holidays and life enjoyment. This
paradigm of work and holiday values is in line with the Australian value
of balance.
For an employer, the ideal employee is a good-hearted team player
that works for the betterment of their workplace. The over-achiever,
motivated by individual pursuits of success, does not thrive in the
Australian workforce. These values are reciprocated from the employee
side, where employees expect a supportive workplace that facilitates
fair practices and security.
Diversity is an on-going issue as Australians adjust to the ever-
diversifying workplace and evolve out of discriminatory practices.
Hard*Work*
“Compromises will have to be made to sustain the
more important Australian values.”
Fairness*
“Employees have relatively secure jobs and high paid
entitlements, including sick, careers and annual leave.”&&Racism*
“To me Australian values are fairness, equality of opportunities and low
discrimination. Australian workplaces generally reflect these values but there is an
underlying current of discrimination against other races and cultures which is
hidden and not openly expressed.”&
Family*
“We are also taking away the public holidays by opening shops and making people work on days that were set aside for spending time with family and friends and
relieving stress from the everyday grind. I don't think that either of
these issues reflect Australian Values.”
OverFAchievers*are*not*Rewarded**
“Reward for hard work, investment and innovation -
generally yes although there is an element of the politics of
envy at play”
People*are*Lazy*
“People feel they are "entitled" to a job and all the benefits without the
need to earn it.”
OffFshoring*Work*
“Failure to adapt (to an increased work schedule) will mean the loss of more jobs in manufacturing and services to
overseas workers who will work for less when required.“

Australian workforce change over the next 20 years? 38
Australians express skepticism in the longevity of of Australia’s economic
stability and booming market. Australians were left feeling concerned after
witnessing the decline in manufacturing during the GFC, and remain wary
of Australia’s ability to be a self-sufficient economy. A shared concern was
that businesses aspire to be global and therefore more reliant on foreign
countries for success.
A second concern was directed at the off shoring of labour. Many see the
departure of Australian jobs to countries with cheaper labour as a major
threat to Australian employment in the future. A related issue was that of
imported goods from abroad. Respondents voiced their concern with fair-
trade practices and expressed uncertainty with the delegation of import
taxes and tariffs on behalf of the government.
Australians are fearful that technological advances may dislodge
employees and expressed doubt with Australians ability to cope with the
new advances of innovation and worldly demands of an international
market. Some Aussies foresee a weakening of the mining and
manufacturing industries and express unease with the world market’s
instability and the impact it may have on Australia. The issue of most
concern is the aging population, as the baby boomers leave the workforce
in great numbers; fewer younger workers are entering the workforce to
replace them.
These issues of technological advances and foreign influence have raised
questions regarding Australia’s ability to cope and evolve as a nation, as
well as to address domestic issues of superannuation and diversity.
Technology*Jobs* “Technology is slowly
eliminating jobs in Industry. Prefab
products in building and construction… How long before you get served your beer by a robot?”
OffCshore&investment&“There will be fewer jobs in manufacturing as our $ remains high and 3rd world costs
remain low.”
Tariffs/imported*goods*
“Australia will ultimately become
susceptible to cheaper global suppliers unless we do something drastic like re-impose tariffs.”
InternaGonal*influence*“locals can't pay and can't get jobs in field
because too many foreign recruitment
agencies have the foot in the door.” Aging*Workforce**
“unfortunately the baby boomers will have to work longer to support the welfare society we are creating by
paying unemployed and welfare families to have children who may grow to have the same values as their parent that
welfare is the way to go”
Decline*of*mining*&*manufacturing*&“Manufacturing will die a natural
death as Australia cannot compete effectively.”
Job*Security*“As a parent I am very worried
that my children will not be able to get a permanent job in the field that they choose and that they will not be able to save for a house or become
financially independent”
EducaGon*“The workforce will
become better educated/trained and any young
person who does not have a good education will find
it hard to get a job”
Evolve*&*Educate**“Mining, if
properly managed can become the new 'sheep's
back’”

What do you worry about in your job? 39
Respondents’ concerns tended to
revolve around job security. Whether
it was security from offshoring, injury,
the nature of casual work, sexual
discrimination, technological
advances, or something else.
“the best thing that would make jobs better
would be equality for women. It does not
exist yet”
“threat of being off-shored.”
“Increases in cost of living and interest rates meaning less
money circulating in the population.
Decreased spending and a flat economy”
“Insecurity of work and lack of monetary
reward. The ability to sue for unpaid work would make my job
better as I would then be paid for work actually done.”
“That I will get bored out of my brains and quit or
go crazy! Keeping me involved, busy and
interested”
“I work in retail and have fears that due to the ridiculous amount of importing cheap crap products Australian
manufacturing and retail is about to crumble”
“Being Casual is a concern, Not knowing when your time is up and not able to redundancy holiday pay etc.”
“It's a small engineering firm relying on many sectors that if
the economy slumps will significantly impact my hours”
“Government regulatory burden. Unions should be outlawed and their
officials and past officials all sent to jail unless they can show they have not been
involved in corruption.”
“The lack of confidence in Australia and
not buying Australian products.”
“security but it does not really exist
anymore in any job”
“We are manipulated by the elite families that own the corporations
that rule us. People are not stupid, just ignorant of what is really going
on.”
“I worry about losing penalty rates in my job. I
work permanent part-time and rely heavily on penalty rates as i am a
single parent”
“I am in agriculture and the worry is that a lot of farms are becoming too
large and been taken over by other countries
interests”
The prospect of being privatised.
Job security without
compromise to safety and benefits.

What will our mix of industries/jobs look like in 20 years? 40
The loudest concern for Australia’s mix in 20 years was the manufacturing industry
shrinking dramatically to the point where the employees have very low confidence
in future job sustainability (despite the survey results showing only an estimate 3%
difference in manufacturing now and in 20 years). This concern was extended to
fear for foreign companies buying out our businesses and more of our production
being outsourced as well as our high dependency on foreign trade. There was both
concern and confidence in the mining sector as the industry was perceived as
stable in 20 years for most, but not inexhaustible and one that we can’t rely on. The
issue of slowing of industry within Australia was expressed mostly with reference to
a large influx of people into universities met by a bottleneck of jobs available to
support them when finishing their studies. In line with this, more spending on
education was a solution to support our future to keep up with other nations. It was
suggested that skilled and educated people will have a “far better chance” at
finding jobs than those who are unskilled. It was suggested that trade work will see
much less demand. A shared concern was that jobs will become more temporary
and casual as industries will look to “increase their profits”. Population control was
raised as an issue by some, and disparity in pay in 20 years time.
Both a concern and an excitement was the build up of technology. The fear factor
was that “machines will do more than humans” and the pull factor was that there
will be many new innovative and often technical job opportunities. Further
excitement in the mix of industries and jobs in 20 years include job flexibility such
as working from home and “internet type businesses”, the hope for Australia to
switch to more renewable energies and the jobs created around this. But mostly,
the positive responses came down to ‘Australia knuckling down’, with our leaders
helping to keep job employment rates high, working conditions high, and remaining
adaptable and open to change as a nation.
New*innovaGve*job*opportuniGes* “In 20 years there will be jobs that are not in existence today
(like the internet and associated jobs in the 90s)”
Moving*away*from*manufacturing* “Fair Trade is what we need NOT
Free Trade.”
Australia*knuckling*down* “Hopefully, we will be less dependent on mining and
agriculture, and have a stronger foothold in R+D, manufacturing, education and services. If this happens, it bodes well for the
Australian economy.”
Trades*falling*behind* “We need to have more
labourers, tradies and 'real' workers instead of paper
pushers. There are too many decisions made by people in
offices about issues they only have a theoretical knowledge
of.”
PopulaGon*growth/control**“Parents should have only
minimum children and not over populate Australia. Immigration should be cut, as there are too
many people here. I am struggling in my 40's to obtain
full time employment, yet foreigners can get employed. It's not fair to Australians”
Dependency*on*other*naGons**“We are basically China's
quarry.”
Industry/market*slowing**“Other industries will continue to
slow, there will be a higher percentage of young adults
completing uni looking for work, than there are available jobs in
chosen industries over the next 5 years…slow market, not much job availability, platter of prospective candidates - employers will have
more choice/employees less choice”
Disparity*of*wages/salaries* “Pay gap between rich and poor and men and women will
also increase” Switch*to*renewable*energy* “We will have more jobs to do with
environmental things, and that would be good for the economy and
the environment”
Job*flexibility* “More working from home, internet
type businesses. Less travel to city type areas for work”

What does “productivity” mean? 41
How much “bang for your buck” is the best phrase to summarise the
responses. However, unique responses of interest can be divided into
various umbrella angles.
Dictionary definition responses were those that contained no opinion
and revolved around the core meaning of “producing more at less cost”.
Some responses reflected a feeling of being jaded such as “more work
for same money”.
The responses with the most emotion came under the label of political
sceptic and expressed their disapproval of the government to whom
they connect the word “productivity” as a political “buzz word”.
Some respondents went for the comparative and competitive approach
whereby productivity is a measure against others of “efficient and
effective use of materials”.
Much of the responses were referring to the material production such as
“making the best of what resources you have available” while other
responses were referring to the lack of productivity “slowed by red tape
and short-sighted decisions by federal and state decision mater”.
The finance umbrella was also a common angle response that
highlighted profit, growing investment and the economic benefit in
Australia of productivity.
Achievement was another umbrella term where “working hard” was a
common theme, and “best results” was the outcome.
ProducGon*(Physical)*
“Increased output for the same
input. ie more efficient use of human and
other resources.”
Achievement* “The amount of hours
put into a job, the output in those hours - what a worker is
able to achieve in his/her working day”
Finance*“Our workforce being able to produce goods
and services that we can sell to ourselves and other countries for a profit. Not pricing
ourselves out of the international markets by labour costs becoming too high so that jobs
and manufacturing continue to be sent offshore.”
Lack*of*producGvity* “There are numbers that can be
created to suit a situation, and then there is reality. Too often productivity is slowed by red tape and short sighted decisions by federal and state decision
makers.”
ComparaGve/compeGGve*angle*
“I think of what a company produces, and what an how it measures against
others.”
The*poliGcal*skepGc* “Buzz words. “Politicians know very little that has
nothing to do with anything except being
elected”
Feeling*Jaded*“How to make people work more for less and how to justify sacking people - this usually results in well educated people also do the mundane, trivial administration work as well as their professional
work in order to cut costs.”
DicGonary*definiGons*“Producing
more at less cost”

Is/should Australia follow in US footsteps? 42
Yes – is/should
No – isn’t/shouldn’t
“We are following USA footsteps, it does worry me and we should avoid doing this”
“Manufacturing should, where possible, be kept in Australia.”
“Australia should create its own methods and standards when it comes to our workplaces and work lives”
“I think we learn a lot and use the good and the bad to mould ourselves on”
“The USA is a place of great technical innovation we should follow that.”
“It’s also a place where workers are poorly treated and that should be avoided. Likewise the hopelessly inept bureaucracy of US management and government.“
“Since the US economy has crashed I think we really should stop trying to follow in their footsteps”
“We have a better health & welfare system” “They are the world leader but a lot of the time we should take our own path” “We should be influenced more by our close
neighbors in the Asia Pacific region.” “As far as workplace issues go we should be more like the USA, less union influence, less welfare,
greater willingness of workers to relocate for jobs, less government red tape, greater workplace
flexibility.”
“We might as well be just another state of the USA the way the politicians are toadying up to them.”
There was a strong push towards avoiding becoming like the USA due to the
beliefs that Australia has a better welfare system, more benefits, better wages,
Australia should be liaising more with our Asian neighbours rather than the
USA, and that the USA is in serious financial trouble.
Respondents who were positive about following the USA suggested that
Australia should follow their lead in terms of technological innovation and
workplace flexibility.

What do employers/politicians mean by “flexibility”? 43
There was some consensus on the definition of “flexibility” being the
flexibility of working hours that benefits both the employer and the
employee. It allows the employee to choose their hours, as long as
they make up their minimum, benefits the employers through
greater productivity. Most respondents were very positive towards
“flexibility” saying that it benefited both the employer and employee.
However, there were a similar number of participants who thought
that it only benefited the employer, only the employee, or neither. Of
those who did support the idea, most said that although it was of
benefit to both, it could also be harmful to both if not implemented
with care.
“I believe this to be a benefit to both employee and employer, as this allows people such as
working parents to work in a place of employment and look after children. For
employers, flexibility in employment should see more productivity from employees as they see it as a fair deal and will more likely stay with
the same employer.”
“It’s always good for the employer not actually the
employee”
“Flexibility can be good for both, but probably is of greater advantage to workers. Workers gain advantage in being able to work
more around their family needs. Employers may gain happier workers and workers that
take less time off and "sickies" to cover family needs and therefore productivity may
increase.”
“Political spin to achieve a political
outcome, of no benefit to anyone but themselves”
“there is so much going on in the political arena that we do not know. They are trying to keep the people confident while the world situation has crept up to
our door”
“They are making up excuses why this county is failing big time??????” “They are talking about giving
workers more flexible hours. It can be very good for couples with
children as it can allow both to work and take care of the kids. It can be good for them and the employer as the employer is not obliged to pay full time wages. I think it is a bit of a double edge
sword personally.”
“I think it is rubbish, the only flexibility that is available is to create jobs for those who are from overseas rather than helping those who need it here”
“it means giving corporations the right to treat people like cattle. Nobody is buying this
anymore!”
“they are expecting both employer and employee to make sacrifices in order
for business to proceed”
“The word is used when either side needs an excuse”
“I never listen to what politicians say”

Thank you
44