REPORT ON THE IMPLEMENTATION OF THE P.A. 295 …
58
REPORT ON THE IMPLEMENTATION OF THE P.A. 295 RENEWABLE ENERGY STANDARD AND THE COST-EFFECTIVENESS OF THE ENERGY STANDARDS Sally A. Talberg, Chairman John D. Quackenbush, Commissioner Norman J. Saari, Commissioner MICHIGAN PUBLIC SERVICE COMMISSION Department of Licensing and Regulatory Affairs In compliance with Public Act 295 of 2008 February 12, 2016
Transcript of REPORT ON THE IMPLEMENTATION OF THE P.A. 295 …

REPORT ON THE IMPLEMENTATION OF THE P.A. 295 RENEWABLE ENERGY STANDARD AND THE COST-EFFECTIVENESS
OF THE ENERGY STANDARDS
Sally A. Talberg, Chairman John D. Quackenbush, Commissioner
Norman J. Saari, Commissioner
MICHIGAN PUBLIC SERVICE COMMISSION Department of Licensing and Regulatory Affairs
In compliance with Public Act 295 of 2008
February 12, 2016

i
Table of Contents
Page
Introduction .................................................................................................................................... 1
Report Criteria ......................................................................................................................... 1
Renewable Energy Plans and Commission Approval ............................................................. 2
Renewable Energy Cost Reconciliation Cases and Commission Approval ............................ 4
Summary of Renewable Energy Data Collected ........................................................................... 4
Renewable Energy Credit Requirements – 2014 Compliance ................................................. 4
Status of Renewable Energy .......................................................................................................... 9
Michigan Renewable Energy Certification System (MIRECS) .............................................13
Competition in Areas Served by Multiple Providers .....................................................................15
Cost-Effectiveness of Power Purchase Agreements and Owned Generation ................................17
Impact of the Renewable Energy Standard on Employment .........................................................21
Impact of Percentage Limits on the Use of Advanced Cleaner Energy Credits ............................25
The Cost of Renewable Energy Compared to the Cost of New Coal Energy ...............................26
Cost-Effectiveness of Renewable Energy and Energy Optimization Standards ...........................29
Effect of the Renewable Energy and Energy Optimization Standard on Electricity Prices ..........32
Recommendations ..........................................................................................................................34
Appendices
A: Renewable Energy Filings: Case Numbers, Companies, Plan Approval Dates and Reconciliation Approval Dates ...............................................................................................36
B: Estimate of Renewable Energy Credit Requirements and Renewable Energy Plan Summary ..................................................................................................................................38 C: Electric Provider Renewable Energy Annual Report Data Summary .....................................40 D: Michigan’s Solar Programs......................................................................................................41 E: MIRECS Energy Credit Summary ...........................................................................................44 F: Contract Summary ...................................................................................................................48 G: Requests for Proposals Summary - DTE Electric and Consumers Energy .............................51 H: PA 295 Contract Renewable Energy Projects .........................................................................54 I: Michigan Utility Scale Wind Farms .........................................................................................55

1
Introduction
Report Criteria
In October 2008, Public Act 295 of 2008 (PA 295 or the Act) was enacted. Section 51(5)
(MCL 460.1051(5)) requires that by February 15, 2011, and each year thereafter, the Michigan Public
Service Commission (MPSC or Commission) submit to the standing committees of the Senate and
House of Representatives with primary responsibility for energy and environmental issues a report that
does all of the following:
a) Summarizes data collected under this section.
b) Discusses the status of renewable energy and advanced cleaner energy in this state and the effect of Subparts A and B on electricity prices.1
c) For each of the different types of renewable energy sold at retail in this state, specifies the difference between the cost of the renewable energy and the cost of electricity generated from new conventional coal-fired electric generating facilities.
d) Discusses how the Commission is ensuring that actions taken under this Act by electric providers serving customers in the same distribution territory do not create an unfair competitive advantage for any of those electric providers.
e) Evaluates whether Subpart A has been cost-effective.
f) Provides a comparison of the cost effectiveness of the methods of an electric utility with one million or more retail customers in this state as of January 1, 2008, obtaining renewable energy credits from renewable energy systems owned by the electric provider and from contracts that do not require the transfer of ownership of the renewable energy system.
g) Describes the impact of Subpart A on employment in this state. The Commission shall consult with other appropriate agencies of the department of labor and economic growth in the development of this information.2
h) Describes the effect of the 10 percent limit on using energy optimization credits or advanced cleaner energy credits to meet the renewable energy credit standards.
i) Makes any recommendations the Commission may have concerning amendments to Subpart A, including changes in the 10 percent limits described in (h) or changes in the definition of
1 Subpart A (MCL 460.1021-1053) deals with renewable energy standards. Subpart B (MCL 460.1071-1097) deals with energy optimization standards. 2 A State government reorganization took place in 2011 that moved employment-related agencies outside the newly-formed Department of Licensing and Regulatory Affairs (LARA). Consultation with the appropriate agencies is continuing.

2
renewable energy resource or renewable energy system to reflect environmentally preferable technology.
Additionally, Section 97 of the Act (MCL 460.1097) requires the following:
(6) By February 15, 2011 and each year thereafter and by September 30, 2015, the Commission shall submit to the standing committees described above a report that evaluates and determines whether Subpart B and Subpart A have each been cost-effective and makes recommendations to the legislature. The report shall be combined with any concurrent report by the Commission under section 51. This sixth annual report provides information on the Commission’s renewable energy activities
related to the Act through calendar year 2015 and summarizes data from the electric provider annual
reports through the 2014 calendar year.3 This report also includes 2014 renewable energy credit
compliance data for the last interim compliance step that builds up to the full 10 percent requirement
for the 2015 compliance year.
Renewable Energy Plans and Commission Approval
Subpart A of the Act requires electric providers to meet a 10 percent renewable energy standard
based on retail sales by the end of 2015. The Act includes interim compliance steps for 2012, 2013
and 2014. For 2016 and each year thereafter, the Act requires electric providers to maintain the same
amount of renewable energy credits (RECs) needed to meet the standard in 2015.
The renewable energy standard is applicable to Michigan’s investor-owned electric utilities,
cooperative electric utilities, municipal electric utilities and alternative electric suppliers (AESs). The
Act directed electric providers to file initial renewable energy plans (REPs) in 2009.4 The 74 initial
REPs described how each electric provider intended to meet the renewable energy standard
requirements. The Act also directs electric providers to file REPs biennially for Commission review.
3 See: the Commission’s February 13, 2015 report: http://www.michigan.gov/documents/mpsc/PA_295_Renewable_Energy_481423_7.pdf?20160119101320 4 There are currently a total of 84 electric providers. Of those 84, 15 are AESs not serving customers and therefore are not required to file annual reports or register in MIRECS, the REC tracking system. Sixty-nine electric providers are required to meet the REC standard in the Act.
3
A listing of case numbers, electric provider names, and dates for upcoming biennial renewable energy
plan filings can be found in Appendix A. Commission Staff created a web page with links to each
electric provider’s renewable energy plan case docket.
The Act allows providers to recover the incremental costs of compliance with the renewable
energy standard requirements through a renewable energy surcharge on customer bills. Commission
approval is only required for rate-regulated electric providers. Section 45 of the Act limits the retail
rate impact (surcharge amount) of the renewable energy standard to the following:
(a) $3.00 per month per residential customer meter.
(b) $16.58 per month per commercial secondary customer meter.
(c) $187.50 per month per commercial primary or industrial customer meter.
At the end of 2015, two rate-regulated providers, Indiana Michigan Power Company and
Wisconsin Electric Power Company, are collecting renewable energy surcharges on customer bills.
Additionally, there are seven non-rate-regulated electric providers with revenue recovery mechanisms.
In July 2014, Consumers Energy Company (Consumers Energy) reduced its renewable energy
surcharge to zero for all customers. Alpena Power Company and DTE Electric reduced renewable
energy surcharges to zero for all customers effective July 2015 and December 2015, respectively.
Forty-nine non-AES providers do not collect surcharges. Details about the surcharges can be found in
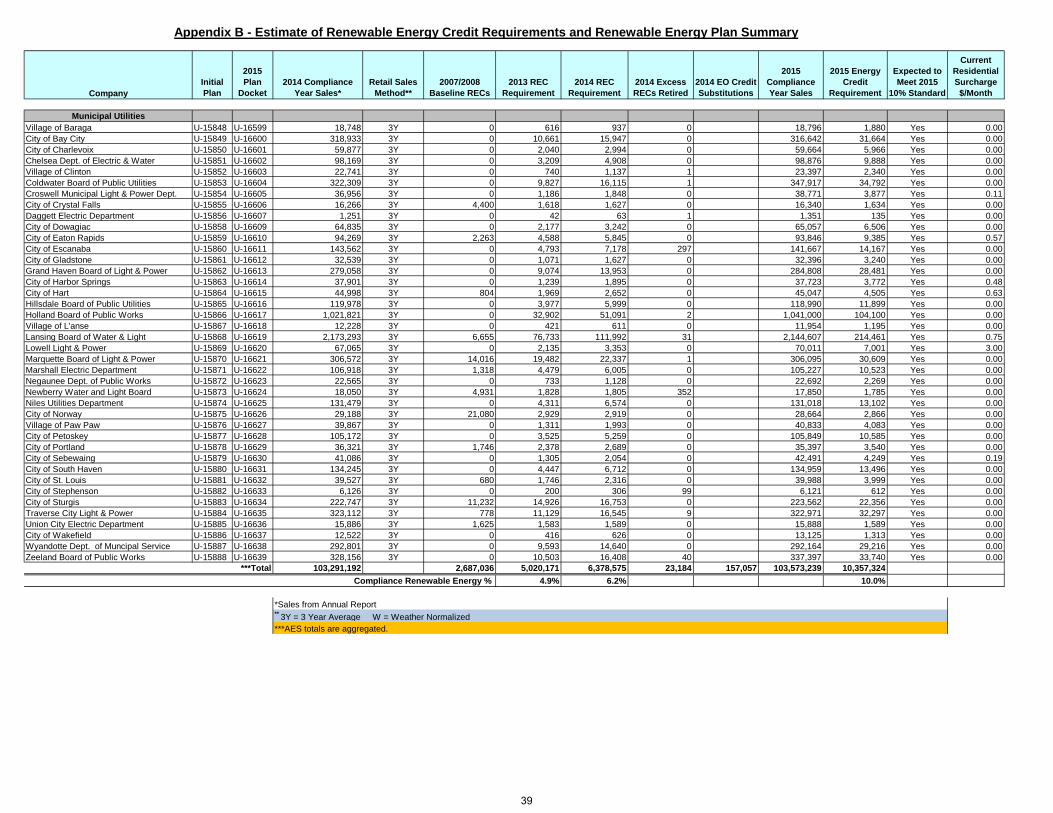
Appendix B.
Based upon a review of REPs filed with the Commission, all providers are expected to be able
to meet the 10 percent renewable energy standard in 2015.5
5It was previously reported that Detroit Public Lighting (DPL) was not expected to meet the 10 percent renewable energy standard in 2015, however, all of DPL’s customers became DTE electric customers effective July 1, 2014 and a five- to seven-year system conversion is in process that will transition former DPL customers to the DTE Electric distribution system. DTE Electric is expected to meet the 10 percent renewable energy standard in 2015.

4
Renewable Energy Cost Reconciliation Cases and Commission Approval
Per Section 49(1) of PA 295, the 11 MPSC rate-regulated electric providers filed annual
renewable energy cost reconciliation cases for 2014.6 Midwest Energy Cooperative’s reconciliation
filing was dismissed on September 23, 2015 because the cooperative became member-regulated. After
Staff review, settlement agreements are expected in all cases. Case numbers and order dates for each
renewable energy cost reconciliation case for the reporting period can be found in Appendix A.
Commission Staff created a web page with links to each electric provider’s reconciliation case docket.
Summary of Renewable Energy Data Collected
Electric providers are directed by Section 51(1) of PA 295 to file annual reports for each plan
year beginning with 2009. Michigan electric provider annual reports for 2009 through 2014 are
available on the Commission’s website.7 Commission Staff worked with electric providers to develop
an annual report template based on Section 51 of the Act. A summary of data from annual reports is
shown in Appendix C.
Renewable Energy Credit Requirements – 2014 Compliance
For 2014, electric providers were required to meet the last interim compliance step on the path
to the full 10 percent standard which averaged 6.2 percent based on statewide data. The number of
renewable energy credits required for 2014 compliance varies by electric provider and is calculated by
“closing the gap” between the full 10 percent compliance level and each electric provider’s pre-Act
295 baseline renewable energy credits by 50 percent.8 All of Michigan’s 69 electric providers
(alternative electric suppliers not serving customers are not included in this total) met the 2014
6 Commission Staff audits the pertinent revenues and expenses, determines the electric provider’s compliance with its filed REP and assesses whether the provider has met its compliance targets. 7See: http://www.michigan.gov/mpsc/0,1607,7-159-16393_53570-240179--,00.html. 8 The number of baseline renewable energy credits is the sum of the number of renewable energy credits that would have been transferred to the electric provider plus the number of credits that would have been generated by the electric provider during the year preceding the effective date of the Act.

5
requirements and retired9 a total of 6,400,548 energy credits. Figure 1 shows the different renewable
energy technology types used to generate the credits used for compliance by all electric providers in
2013 and 2014 as well as separately for both Consumers Energy’s and DTE Electric’s 2014
compliance.
9 Energy credits are “retired” when used for compliance.

6
Figure 1: Compliance Energy Credit Breakdown

7
Figure 1: Compliance Energy Credit Breakdown (continued) Consumers Energy – 2014 Compliance
2,440,174 Total Energy Credits
DTE Electric – 2014 Compliance 2,409,028 Total Energy Credits

8
Section 29 of the Act includes provisions for determining whether the location of a renewable
energy system is eligible for Michigan’s RPS. Ninety-four percent of the energy credits used for 2014
compliance were from renewable energy generated in Michigan. Wisconsin was the source for over
three percent and the remaining credits came from renewable energy generated in Indiana, Iowa, and
Minnesota. Michigan’s multi-state utilities and electric providers with out-of-state wholesale suppliers
are most likely to use energy credits from states other than Michigan.
Section 39 of the Act includes a provision that allows energy credits to be “banked” up to 36
months. Figure 2 shows a breakdown of energy credits retired for compliance by vintage year of
generation. The data shows that providers are utilizing the 36-month energy credit banking provision
in the Act. Approximately 60% of the energy credits used to comply in 2014 were from renewable
energy generated in 2011. Michigan Renewable Energy Certification System (MIRECS) data shows
that, to date, approximately 2.4 million energy credits to date have expired without being used for
compliance.
Figure 2: 2014 Compliance Energy Credits – Year of Generation

9
Status of Renewable Energy
Based on the number of energy credits generated or acquired during 2014 as reported by
electric providers, Michigan’s 2014 estimated energy credit percentage is 9.1 percent of retail sales as
shown in Appendix C. Based on the projected credit generation from Figure 3, Michigan’s 2015
estimated renewable energy credit percentage will exceed the 10 percent of retail sales requirement.
A projection of Michigan’s energy credits for 2015 is shown in Figure 3 along with the annual
REC compliance requirement and accumulated RECs. In order to reflect only renewable energy
generated or acquired in each year, accumulated RECs from previous years are not included in the
yearly renewable energy totals but are shown separately in the line called accumulated REC inventory.
The projected renewable energy includes: i) baseline renewable energy (renewable energy that was
operational prior to the passage of PA 295); ii) a projection of other RECs from non-rate regulated
providers and contracts that do not require Commission approval under PA 295; iii) an estimate of
RECs from PA 295 approved contracts for company-owned renewable energy projects; and iv) power
purchase agreements (PPA) and REC-only contracts.
The accumulated REC inventory for 2014 reflects the deduction of energy credits that were
retired for 2014 compliance, voluntary retirements, and 2011 energy credits that expired, due to the 36-
month banking provision, without being used.
Figure 3 incorporates Michigan’s current renewable energy status and forecasts that renewable
energy credit amounts will reach 10 percent of total retail sales in 2015. The renewable energy
projections clearly indicate that providers are on track to exceed the 10 percent renewable energy
standard in 2015.

10
Figure 3: Michigan Renewable Energy Projection, 2015
Figure 4 provides the technology type of total renewable energy generators operating in Michigan.
Approximately 2,500 MW of renewable energy generators are operating in Michigan. Additional
renewable energy generators exist within Michigan that are not used to meet the energy credit nor
capacity requirements of the RPS. Such renewable generators may be used for green pricing programs
or for compliance with another state’s RPS. Additionally, since the MIRECS registration process
usually begins at the time of commercial operations, there are renewable energy generators currently
under development and/or contracted for, which are not yet operational, that are not included within
this figure. Further, renewable energy generators that are outside of Michigan are also not included
within Figure 4.
Source: Electric provider annual reports, PA 295 contracts, MIRECS and Commission Staff projections.

11
Figure 4: Renewable Energy Generators in Michigan, by Technology Type Source: MIRECS Project Registrations & Electric Provider Annual Reports
Approximately 2,500 MW
As of January 2016, 64 renewable contracts and amendments have been approved by the
Commission pursuant to PA 295. Figure 5 shows the expected commercial operation dates for
renewable energy projects through 2016 based on the contracts and solar programs approved by the
Commission.10 Renewable projects developed by non-rate-regulated electric providers, where
contracts are not filed for approval with the MPSC, are not reflected in Figure 5.
10 Assumes all of DTE Electric Company’s 22 MW SolarCurrents program and Consumers Energy’s 6 MW Experimental Advanced Renewable Programs will be commercially operational by the end of 2016.

12
Figure 5: Cumulative PA 295 Renewable Energy Capacity by Commercial Operation Date
Consumers Energy and DTE Electric both implemented solar photovoltaic (PV) programs.
During 2015, Consumers Energy completed awarding the final capacity of its approximately 6 MW
solar program. In 2015, Consumers Energy implemented a Community Solar program named Solar
Gardens that is expected to result in 5 MW by the end of 2016 and could grow to a total of 10 MW in
future years. DTE Electric is continuing development under its 15 MW Company-owned
SolarCurrents program. These PV programs are discussed in more detail in Appendix D. In addition,
DTE Electric filed an application for approval of up to 50 MW of company-owned solar which was
approved by the Commission in December 2015.

13
Electric providers have secured all of the renewable energy necessary for compliance with the
Act.11 Electric providers are on pace to exceed the capacity and 10 percent requirement for 2015 and
beyond.
Michigan Renewable Energy Certification System (MIRECS)
Compliance with the renewable energy standard is demonstrated through the use of energy
credits. One renewable energy credit is created for each megawatt-hour (MWh) of renewable energy
generated. Additionally, the Act provides for Michigan incentive renewable energy credits (IRECs)
and the substitution of energy optimization credits (EOCs)12 and advanced cleaner energy credits
(ACECs) for RECs. RECs may be sold separately from energy as shown in Figure 6.
Figure 6: Renewable Energy Credits
Section 41 of PA 295 directed the Commission to “establish a renewable energy credit
certification and tracking program.” On August 11, 2009, the Commission approved the contract
between the Department of Energy, Labor and Economic Growth (now Licensing and Regulatory
Affairs or LARA) and APX, Inc., that designates APX, Inc. as the State of Michigan Administrator of
11 Nearly all AESs are purchasing unbundled renewable energy credits to meet the renewable energy credit portfolio requirements. The terms and conditions of these purchases are unknown. 12 At this time, energy optimization credits are not transferable from one electric provider to another, meaning that they cannot be sold or otherwise traded.
(if applicable)

14
the renewable energy credit and tracking program.13 MIRECS was launched on October 30, 2009.14
As of January 21, 2016, a total of 46,517,008 energy credits have been created in MIRECS
from 2009 through 2015. Figure 7 shows the categorization of Michigan’s energy credits by
technology type. A yearly breakout of energy credits is available in Appendix E. Analysis of these
breakouts shows the significant growth of wind in Michigan’s REC portfolio, from 7 percent in 2009
to 44 percent in 2014. The 30 percent wind figure shown in Figure 7 represents total credits created
over the 2009 – 2015 period. This data differs from Figure 1 because all energy credits created in
MIRECS since its inception are reflected, while Figure 1 shows only energy credits used for 2014
compliance.
Figure 7: MIRECS 2009-2015 Vintage Energy Credits – 46,517,008 Total Credits
13 The initial contract between the State of Michigan and APX was extended for another 2 years in July 2014. 14 MIRECS may be accessed at http://www.mirecs.org.

15
The number of generating units within MIRECS continues to grow. As of January 2016, there
were 300 registered projects (generators) in MIRECS. MIRECS has 141 account holders which
include electric service providers, generator owners, and others.
MIRECS is able to fully integrate with other tracking systems such as the Midwest Renewable
Energy Tracking System (M-RETS), North American Renewables Registry (NAR) and, to a lesser
extent, the North Carolina Renewable Energy Tracking System (NC-RETS) and PJM-Generation
Attribute Tracking System (PJM-GATS) which allow energy credit imports from and exports to
MIRECS. This integration allows both businesses and individual citizens to sell their product to a
wider market. Generators registered with other tracking systems have, as of January 2016, registered
58 projects for the purpose of importing energy credits into MIRECS. Commission Staff assists
electric providers with the compliance process and will continue to hold training/information meetings.
Competition in Areas Served by Multiple Providers
Consumers Energy and DTE Electric have made substantial progress toward complying with
the renewable energy standard. Consumers Energy has filed renewable energy contracts with the
Commission totaling 604 MW, and DTE Electric totaling 990 MW, as shown in Appendix F. In
addition to meeting the requirement in PA 295 for RECs that is applicable to all electric providers,
both Consumers Energy and DTE Electric have renewable capacity requirements pursuant to Section
27 of PA 295. By the end of 2013, Consumers Energy was required to obtain 200 MW of nameplate
capacity that was not in commercial operation before the effective date of the Act. Similarly, DTE
Electric’s capacity portfolio requirement for 2013 was 300 MW. By the end of 2015, Consumers
Energy’s and DTE Electric’s total capacity portfolio requirement increased to 500 MW and 600 MW,
respectively. Both companies have obtained Commission approval of power purchase agreement and
company-owned renewable energy projects to provide the necessary capacity to exceed the 2015

16
legislative capacity requirements. Planned new cumulative capacity and capacity portfolio
requirements are shown for each company in Figure 8.
Figure 8: Planned New Cumulative Capacity through 2015 for Consumers Energy and
DTE Electric15
AESs are required to meet the energy credit requirement contained in the Act. Almost all
AESs have indicated through REPs and 2014 annual reports that they will purchase energy credits
instead of building and owning renewable energy projects or signing long term renewable energy
purchase agreements to meet the renewable energy standard requirement. Customer choice
participation levels for DTE Electric and Consumers Energy are at the maximum amount allowed by
law and both electric providers currently have customers waiting to switch providers. Through
15 Data shows planned capacity that will become operational through 2015. Both companies expect to build or acquire additional capacity after 2015. Consumers Energy source data is from biennial REP Case No. U-17792. DTE Electric source data is from biennial REP Case No. U-17793.

17
building or contracting to purchase energy, capacity, and RECs from new renewable energy projects,
the two largest utilities in Michigan have driven the expansion of renewable energy.
Cost-Effectiveness of Power Purchase Agreements and Owned Generation
Section 33 of PA 295 includes a provision relating to competitive bidding and unsolicited
contracts for electric providers who served more than 1,000,000 electric customers in this state as of
January 1, 2008. Consumers Energy and DTE Electric fall under this provision.
Pursuant to Section 33, the companies are required to obtain RECs necessary to meet the REC
standard in 2015 by one or more of the following methods:
(i) Renewable energy systems that were developed by and are owned by the electric provider. An electric provider shall competitively bid any contracts for engineering, procurement, or construction of any new renewable energy systems… (ii) Renewable energy systems that were developed by 1 or more third parties pursuant to a contract with the electric provider under which the ownership of the renewable energy system may be transferred to the electric provider, but only after the renewable energy system begins commercial operation. Any such contract shall be executed after a competitive bidding process conducted pursuant to guidelines issued by the commission.
Additionally:
(b) At least 50 percent of the renewable energy credits shall be from renewable energy contracts that do not require transfer of ownership of the applicable renewable energy system to the electric provider or from contracts for the purchase of RECs without the associated renewable energy. A renewable energy contract or contract for the purchase of RECs under this subdivision shall be executed after a competitive bidding process conducted pursuant to guidelines issued by the commission. However, an electric provider may consider unsolicited proposals presented to it outside of a competitive bid process by a renewable energy system developer that is not affiliated with the electric provider. If the provider determines that such an unsolicited proposal provides opportunities that may not otherwise be available or commercially practical, the provider may enter into a contract with the developer. The companies have conducted 27 requests for proposals (RFPs) in total. Consumers Energy
has conducted eight RFPs and three requests for qualifications. DTE Electric has conducted 19 RFPs,
two pre-qualification events, one solar solicitation of interest, a request for information, and an auction

18
for 2009 and 2010 vintage RECs. In response to the majority of the companies’ RFPs, Commission
Staff has reviewed competitive bidding activities through process audits. The purpose and design of
the audits was to ensure that the companies followed the processes and procedures outlined in the
Commission’s December 4, 2008 Temporary Order in MPSC Case No. U-15800, Attachment D16 and
pursuant to Section 33 of PA 295. Details about each company’s competitive bidding activities are
shown in Appendix G.
Pursuant to Section 37 of the Act, renewable energy power purchase and REC-only agreements
entered into by any electric provider whose rates are regulated by the Commission must be submitted
to the Commission for determination of whether the terms are reasonable and prudent. Appendix F
lists all renewable energy contracts that have been approved by the MPSC under PA 295 to date.
There has been significant renewable energy development as a result of PA 295. Appendix H
lists all of the renewable energy projects that have approved PA 295 contracts. The Appendix F and
Appendix H map key corresponds to the map in Figure 9. Wind energy has been the primary source
of new renewable energy in Michigan. At the end of 2015, including wind projects developed shortly
before Act 295 and wind projects developed under the PA 295 contract approval and cost recovery
mechanisms, there were over 1,500 MW (total includes 127 MW of utility scale projects that began
operating prior to the Act) of utility scale wind projects in operation in Michigan as indicated in
Appendix I. A total of 484 MW of new wind generation (333 MW will be developed by non-MPSC
rate-regulated providers) is expected to begin operating by the end of 2016. All known wind farms in
Michigan are listed on Appendix I.
16 See: http://efile.mpsc.state.mi.us/efile/docs/15800/0001.pdf.

19
Figure 9: Locations of Renewable Energy Projects
*Numbers shown on map correspond to the Map Key Column provided on Appendices F and H.

20
The MWh contract prices represented in Appendix F are levelized cost calculations and
reflect the prices over the contract term for all power purchase agreements or, in the case of a
company-owned project, the depreciable composite life.17 The levelized cost value is used to
compare multiple contracts with varying terms and conditions. Of the 64 contracts and
amendments from five electric providers approved by the Commission to date, all but four have
been from Consumers Energy or DTE Electric and 16 have been unsolicited. With the exception
of several early contracts for small renewable energy projects, the contract prices have been
much lower than expected and have continued to decline.
Pricing for wind farms has declined rapidly in Michigan which makes the timing of wind
farm development a major factor in the price. A comparison of the actual costs of the renewable
energy resource acquired through power purchase agreements using the methods described in
Section 33 of the Act to company-owned projects, shows that company-owned projects and
power purchase agreements have been competitive when costs are compared. Many of the
power purchase agreements were entered into in the first few years of implementation of the
renewable energy standard, whereas many of the company-owned projects became operational
later and benefited from the decline in prices over time. Consumers Energy filed two
applications for approval of company-owned wind farms totaling 206.2 MW. DTE Electric has
six Company-owned wind farms totaling up to 375.8 MW, applications for 15 MW of company-
owned solar through its SolarCurrents program and up to 50 MW of company-owned solar
outside of the SolarCurrents program. Since no large scale solar installations have been
contracted through power purchase agreements (only Company-owned facilities have been
17 MPSC Staff performed audits of the companies’ levelized cost calculations starting in the early part of 2011. Additionally, through RFP process audits, Staff reviewed actual costs of contracts obtained through most of the companies’ competitive solicitations. Staff reviewed the actual costs of all contracts listed in Appendix F.

21
proposed), only the above-mentioned wind contracts are compared for purposes of this section of
the report.
An annual comparison of the weighted-average levelized cost (dollars per MWh) of
commission-approved company-owned project costs to power purchase agreements is tabulated
below.
Commission Approval Company Owned Power Purchase 2015 $50.00 $45.002014 N/A N/A2013 $55.95 $50.042012 $52.50 $49.252011 $67.16 $60.902010 $104.00 $97.332009 N/A $115.00
Total $74.49 $73.58
Weighted Average Cost Comparison
In aggregate, over the 2009-2015 time period, the weighted average cost of power purchase
agreements has been slightly lower than the weighted average of company owned projects.
Impact of the Renewable Energy Standard on Employment
One purpose of PA 295 is to “provide improved air quality and other benefits to energy
consumers and citizens of this state.” The clean and renewable energy sector continues to
contribute to employment opportunities in Michigan. During 2016, the following utility scale
wind farms are expected to become commercially operational in Michigan:
• Apple Blossom – 100 MW, Huron County
• Big Turtle II – 30 MW, Huron County
• Deerfield – 150 MW, Huron County
• Michigan Wind III – 153 MW, Sanilac County
• Pinnebog – 51 MW, Huron County
22
These projects will result in 484 MW of new, utility scale wind generation. Several large solar
projects are under development in Michigan and planned to begin commercial operation during
2016.18
• DTE Electric’s 50 MW, Lapeer and Wayne Counties
• Consumers Energy’s 5 MW Solar Gardens Project, Ottawa and Kalamazoo
Counties
• Indiana Michigan’s 4.6 MW Clean Energy Solar Pilot Project, Berrien County
Section 39 of PA 295 provides for Michigan Incentive Renewable Energy Credits for
renewable energy systems that meet certain criteria. For renewable energy systems constructed
using a threshold level of Michigan labor, the amount of the incentive is one-tenth of a REC for
each MWh generated during the first three years of commercial operation. The incentive for
Michigan equipment is calculated in a similar manner. The Michigan specific incentive credits
are shown in Figures 10 and 11 below.
18 The Solar Investment Tax Credit was extended at 30% through 2019 with a gradual stepdown beginning in 2020. See http://programs.dsireusa.org/system/program/detail/658.

23
Figure 10: Michigan Equipment Incentive Credits 2009-2015
Figure 11: Michigan Labor Incentive Credits 2009-2015
24
Statewide, there has been significant investment in the renewable energy sector since the
passage of PA 295 in 2008. Assuming an installed cost of $2,000 per kW19 for new renewable
energy projects, $2.9 billion has been invested to bring approximately 1,470 MW20 of new
renewable energy projects on-line through 2015 in Michigan. The $2.9 billion includes both
incremental cost of compliance and the portion of costs recovered as energy costs.
In September 2014, the Michigan Workforce Development Agency in partnership with the
Bureau of Labor Market Information and Strategic Initiatives issued a 2014 Energy Cluster
Workforce Updates report. The 2014 report is an update to the 2013 Cluster Workforce Analysis
which tracked eight detailed industry sectors as a proxy for employment trends in the Renewable
and Alternative Energy cluster. That analysis found the cluster grew from 6,775 jobs in 2005 to
8,200 jobs in 2013.21 The 2014 Cluster Workforce Update found that overall, the Energy Cluster
is expected to grow 7.1 percent between 2010 and 2020.22 An additional update for the second
quarter of 2015 showed 8,750 jobs among Michigan industries related to the Renewable and
Alternative Energy cluster.23 The employment information presented in this report is not
intended to serve as a complete analysis of the impact of PA 295 on employment, but instead
provides perspective given the available data.
Michigan is continuing to build on its position as a regional leader in the development
and manufacturing of renewable energy systems, drawing on the state’s engineering expertise,
19 DTE Electric reported an installed cost of $2,225 to $2,438 per kW for its Echo Wind Park contract approval application filed on August 10, 2012. 20 Reflects the projects developed under Act 295 by MPSC rate-regulated electric providers. This number does not include 67.5 MW of wind generation attributable to contracts filed by Indiana Michigan Power Company as these projects are outside of Michigan or 1.05 MW of hydro and anaerobic bio-digestion projects that were commercially operational prior to PA 295. 21 The report’s author provided additional information to MPSC staff showing job data for 2005 and 2013. Data presented in the report is for 2011. See http://milmi.org/admin/uploadedPublications/1992_WDA_EnergyFINAL.pdf. 22 See 2014 Cluster Workforce Updates – Energy: http://milmi.org/admin/uploadedPublications/2227_Energy.pdf 23 The report’s author provided additional information to MPSC staff showing job data for 2015.

25
modernized machining, and RPS compliance efforts. It appears that Michigan’s incentive REC
provision is meeting its intended purpose to encourage developers to maximize utilization of
Michigan equipment and labor. The Commission will continue to monitor data on the impact of
the renewable energy standard on employment in Michigan.
Impact of Percentage Limits on the Use of Advanced Cleaner Energy Credits
Advanced cleaner energy (ACE) is defined in PA 295 as any of the four following
facilities: 1) gasification, 2) industrial cogeneration, 3) coal-fired electric generating if at least 85
percent of the carbon dioxide emissions are captured and permanently geologically sequestered,
or 4) electric generating that uses technologies not in commercial operation on the effective date
of PA 295. Energy produced from these facilities is eligible for ACE credits (ACEC); the credits
are tracked within MIRECS. Electric providers may substitute ACECs for RECs to meet the
renewable energy standard. However, there are conditions on the substitution and there is a
statutorily imposed limit on the percentage of ACECs eligible to be used each year for the
renewable energy standard.
Section 27(7) of PA 295 describes the conditions and substitution limits. ACECs from
industrial cogeneration may be substituted for RECs without Commission approval. For other
types of ACECs, substitution may only be made with Commission approval and if the advanced
cleaner energy is both cost effective and provides a carbon dioxide emission benefit. The
combination of energy optimization credits and ACECs may not account for more than 10
percent of the total energy credits used to meet the standard in a given year. Older non-plasma
arc gasification advanced cleaner energy systems (in existence on January 1, 2008) cannot be
used to meet more than 70 percent of the 10 percent limit. The substitution ratio of plasma arc

26
gasification or industrial cogeneration is one ACEC to one REC while the ratio for other forms
of advanced cleaner energy is 10 ACECs to one REC.
The Commission has found no negative impact on advanced cleaner energy development
based on the above-described percentage limits. To better answer this question, the MPSC Staff
asked the question “Did the percentage limits in Section 27(7) affect development of advanced
cleaner energy by the electric provider? How so?” in the annual reports required under Section
51. No electric provider indicated the percentage limits in Section 27(7) affected development of
advanced cleaner energy. Three electric providers utilized a total of 110,920 ACECs for 2014
compliance which is less than two percent of the total energy credits used for 2014 compliance.
In addition, there has been no advanced cleaner energy generation for 2015 registered yet within
MIRECS. This figure is down from 166,359 MWh in 2014 when three facilities generated
advanced cleaner energy. The percentage limits do not appear to be affecting the development of
advanced cleaner energy in Michigan.
The Cost of Renewable Energy Compared to the Cost of New Coal Energy
Pursuant to Section 21(6)(b) of the Act, rate-regulated electric providers’ REPs were
required to show that the life cycle cost of renewable energy acquired, less the life cycle net
savings associated with Energy Optimization Plans, did not exceed the life cycle cost of
electricity generated by a new conventional coal-fired facility. The Commission Staff filed a
letter in MPSC Case No. U-15800 to provide the required life cycle cost of electricity generated
by a new conventional coal plant:
The Commission’s temporary order implementing 2008 PA 295, Case Number U-15800, directed the Staff to work with the providers to develop the required life cycle cost of electricity generated by a new conventional coal-fired facility in terms of a guidepost consisting of a levelized busbar rate, in $/MWh, of an advanced-supercritical

27
pulverized coal plant with a life cycle of 40 years. The Commission directed the Staff to submit the number to the Commission by January 30, 2009. The Staff has diligently worked with the providers to develop the guidepost rate and finds that the number is $133 per MWh.24
This guidepost rate was derived from data provided to Consumers Energy as a result of
the Company’s inquiry into building a new 830 MW coal fired power facility, and was adopted
by all electric providers. The Commission continues to find that the $133 per MWh guidepost is
reasonable.
By comparing the levelized cost of $133 per MWh for a new conventional coal-fired
power facility with the combined weighted average levelized contract prices in Table 1, the cost
of all renewable energy projects using multiple renewable energy technologies is less than the
coal guidepost rate with the exception of two anaerobic digester contracts representing less than
4 MW of capacity. These contracts were the result of Consumers Energy’s first solicitation for
small (under 5 MW) facilities. Consumers Energy and DTE Electric have since seen much lower
prices for renewable energy.
24 Source: Excerpt from Commission Staff January 30, 2009 Guidepost Rate Letter,
http://efile.mpsc.state.mi.us/efile/docs/15800/0023.pdf.

28
Table 1: Weighted Average Levelized Renewable Energy Contract Prices
Consumers Energy
Technology Wind Digester Biomass Landfill Hydro Solar
Weighted Average $90.60 $137.77 NA $106.21 $121.31 NA
Detroit Edison
Technology Wind Digester Biomass Landfill Hydro Solar
Weighted Average $64.59 NA $98.94 $98.97 NA $113.52
Combined Weighted Average $74.52 $137.02 $98.94 $104.05 $121.31 $113.52
While the Commission is required to make a determination about the cost effectiveness
of the renewable energy standard as compared to the life- cycle cost of electricity of coal-fired
generation, it should be noted that renewable energy wind resources are not equivalent on a
capacity basis when compared to coal-fired or other base load generation. The differences in
energy availability during peak loads can be significant. For example, regional transmission
organizations such as Midcontinent Independent System Operator (MISO) discounted the
capacity value of wind resources during the peak load to as low as 14.7 percent for the 2015 –
2016 planning year,25 compared to an availability ranging as high, or higher than 80 percent for
base load generation plants.26 Comparing per unit energy costs of different generation types may
not reflect the true value of the resource to the reliability of the electric system as a whole.
25 https://www.misoenergy.org/Library/Repository/Report/2015%20Wind%20Capacity%20Report.pdf 26 The availability on-peak for base load generators is unit-specific. Older units may have capacity values significantly lower than 80 percent, however, newer units, especially newer nuclear units may have capacity values on-peak above 90 percent.
29
Cost-Effectiveness of Renewable Energy and Energy Optimization
Standards
Section 51(5)(e) of PA 295 requires an evaluation of the cost-effectiveness of the
renewable energy standard. In a similar vein, Section 97 of PA 295 requires the Commission to
evaluate and determine whether the energy optimization and renewable energy standards have
been cost-effective. The actual cost of renewable energy contracts submitted to the Commission
to date continues to show a downward pricing trend. A recent contract approved by the
Commission for new wind capacity has levelized costs lower than $45 per MWh, which is about
10 percent less than the least expensive levelized contract prices from 2011 and half of the
levelized cost of the first few renewable energy contracts approved in 2009 and 2010. Contracts
submitted to the Commission through 2015 total approximately 1,670 MW27 of renewable
capacity. Weighting the levelized costs of these contracts by the generation in MWh results in
an average cost of $76.42 per MWh. Almost all renewable energy contract prices are lower than
the $133 per MWh coal guidepost rate as shown in Figure 12. This calculation does not include
DTE Electric’s SolarCurrents or Consumers Energy’s Experimental Advanced Renewable
Program as these are considered pilot programs and make up less than two percent of the REC
and IREC creation from contracts and projects approved by the Commission to date.
27 This includes DTE Electric Company’s 22 MW SolarCurrents program and Consumers Energy Company’s 6 MW EARP programs. Additionally, this only accounts for Michigan’s allocation (67.5 MW) of Indiana Michigan Power Company’s two wind contracts.

30
Figure 12: Levelized Cost of MPSC Approved Contracts Over Time
Factoring in the cost per MWh of energy optimization programs, as required by Section
21(6)(b) of PA 295, Table 2 demonstrates the cost-effectiveness of the renewable energy and
energy optimization standards on a combined basis using the state’s two largest electric
providers. The levelized cost of conserved energy of the energy optimization programs was
weighted by the life cycle energy savings, through 2029, expected from the companies’ Energy
Optimization Programs. For renewable energy, the levelized costs of all DTE Electric and
Consumers Energy contracts approved by the Commission were weighted by the generation

31
anticipated over the term of the contract.28 To determine the anticipated generation for the
company-owned projects, the depreciable composite life of the project was used. For Consumers
Energy’s company-owned projects, the present value of the generation based on a 31.2-year life
was used. For DTE Electric Company-owned projects, the present value of the generation based
on a 22-year life was used. IRECs were not factored into the weighting of any of the renewable
energy projects; however, doing so would increase the cost effectiveness of renewable energy.
The combined cost of $37.43 per MWh for both Subpart A (Renewable Energy Standard) and
Subpart B (Energy Optimization Standard) of 2008 PA 295 is approximately 25 percent of the
cost of a new conventional coal plant, using $133 per MWh as the coal plant cost. On a stand-
alone basis, the $76.42 per MWh cost of the renewable energy standard is substantially lower
than the cost of a new coal-fired plant, but the combined cost of $37.43 per MWh, is less than
any new generation, including new natural gas combined cycle plants, when compared to the
Energy Information Administration levelized plant costs for 2014.29 In the middle of December
2014, the Federal Production Tax Credit (PTC) was extended through year-end 2014.
Additionally, in December 2015, the PTC was extended yet again, with ramp downs through
2019.30 This may lead to the development of additional renewable projects that will supplement
electric providers’ Renewable Energy Plans and result in development above and beyond the 10
percent standard.
28 Solar pilot programs were excluded because levelized cost data is not available and the solar pilot programs would contribute minimally to the weighted average because they are very small compared to the total. DTE Electric’s 50 MW solar project is included. 29 See: http://www.eia.gov/forecasts/aeo/electricity_generation.cfm 30 See: https://www.gpo.gov/fdsys/pkg/BILLS-114hr2029enr/pdf/BILLS-114hr2029enr.pdf

32
Table 2: Cost Effectiveness of Energy Optimization and Renewable Energy Standards
Energy Optimization Cost of Conserved Energy Weighted Average ($/MWh) $20.0031
Renewable Energy Weighted Average Cost ($/MWh) $76.42
Combined Weighted Average Cost of Energy Optimization and Renewable Energy ($/MWh) $37.43
Source: EO cost data assumes EO plans renew similar measures on a yearly basis through 2029 (corresponding to the 20 year period of the initial 2009 renewable energy plans) Renewable energy cost data is based on levelized costs provided as part of the renewable energy contract approval process.
Effect of the Renewable Energy and Energy Optimization Standard on Electricity Prices
PA 295 provides for the recovery of costs associated with complying with both the
renewable energy standard and the energy optimization standard. As described in the 2013 report
on renewable energy released as part of the Readying Michigan to Make Good Energy Decisions
information gathering process:
Act 295 renewable energy costs are recovered in two ways: the energy and capacity portion of the renewable energy is recovered pursuant to Sections 47 and 49 of the Act through the Power Supply Cost Recovery (PSCR) mechanism utilizing a transfer price schedule while the remaining or incremental portion of the renewable generation costs is recovered through a surcharge. The incremental cost of compliance represents the cost of renewable energy above and beyond the costs defined by transfer price schedules and recovered through the PSCR process. PSCR recovery is generally reserved for power purchase agreement recovery, fuel purchases and some Environmental Protection Agency regulation compliance costs. Sections 47 and 49 of the Act expanded the use of the PSCR mechanism to include the projected capacity, energy, and maintenance and operation costs, which is now called the transfer price. Transfer price schedules are representative of what a Michigan electric provider would pay had it obtained the energy and capacity (the non-renewable market price component) through a new long term power purchase agreement for traditional fossil fuel electric
31 On a lifecycle cost basis, over a 20 year period, the energy optimization cost of conserved energy weighted average is $13.33 per MWh.

33
generation. To best determine the value of the non-renewable component of Act 295 compliant generation, Commission Staff determined, for purposes of developing a uniform Transfer Price Schedule, that the levelized cost of a new natural gas combined cycle (NGCC) plant would likely be analogous to the market price mentioned above.32
In 2014, the average annual transfer price for DTE Electric was $63.70 per MWh and the
average annual transfer price for Consumers Energy was $80.23 per MWh. At the beginning of
2015, Michigan had four rate-regulated electric providers collecting revenue through a renewable
energy surcharge: Alpena Power, DTE Electric, Indiana Michigan Power Company and
Wisconsin Electric Power Company, although Alpena and DTE have since reduced their
surcharges to $0 across all rate classes during the year. Renewable energy surcharge amounts are
listed in Appendix B.
In addition, all investor-owned, cooperative and municipal electric providers (as well as
Commission-regulated natural gas utilities) implement energy optimization programs, and are
able to recover costs associated with running those programs in a cost-effective manner through
energy optimization surcharges. Specific surcharge amounts are detailed in the Commission’s
2015 Report on the Implementation of the P.A. 295 Utility Energy Optimization Programs,
issued on September 30, 2015.33
Spending on renewable energy and energy optimization has had an impact on electric
rates, but should be considered in context of other rate drivers as well. Information submitted as
part of the Readying Michigan to Make Good Energy Decisions process indicates that several
factors, including load loss, fuel costs, environmental investment, and base system investment,
have contributed to electric rate increases since 2008, most more significantly than spending on
32 For more detailed information on the Staff Transfer Price Schedule see: http://efile.mpsc.state.mi.us/efile/docs/15800/0042.pdf 33 See: http://www.michigan.gov/documents/mpsc/2015_Energy_Optimization_Report_501851_7.pdf

34
renewable energy or energy optimization.34 There are also benefits attributable to an increase in
renewable energy generation sources and improved energy efficiency. Wind and solar generation
have zero fuel costs and the integration of zero fuel-cost generation into the regional market
results in lower locational marginal prices in the energy market. In addition, the Commission's
2015 Report on the Implementation of the P.A. 295 Utility Energy Optimization Programs found
that for every dollar spent on energy optimization, customers realize a cost benefit of $4.38.35
And, as noted in previous sections, the cost of energy generated by renewable sources continues
to decline and is cheaper than new coal-fired generation. Using the most recent cost of service
data available for Consumers Energy and DTE Electric, Commission Staff calculated $64 per
MWh36 as the combined weighted average of all existing power supply costs (conventional,
renewable and other), including purchased power, which is higher than the combined cost of the
renewable energy and energy efficiency standards of $37.43 per MWh.
Conclusion and Recommendations
The compliance requirements were accomplished successfully by all of Michigan’s
electric providers for the 2014 compliance year, and all providers are expected to meet the 10
percent renewable energy target in 2015. The renewable energy standard has resulted in the
development of new renewable capacity and can be credited with over 1,668 MW of new
renewable energy projects. The weighted average price of existing renewable energy contracts is
$76.42 per MWh, which is less than forecasted in REPs, and is continuing to trend
downward. The combined weighted average cost of the companies’ energy optimization and
34 See: http://michigan.gov/documents/energy/Additional_Areas_final_440032_7.pdf, Figures 6 and 7, pp. 24-25. 35 See: http://www.michigan.gov/documents/mpsc/2015_Energy_Optimization_Report_501851_7.pdf 36 The $64 per MWh weighted average is based on 2012 filings and excludes transmission costs.

35
renewable energy is $37.43 per MWh, significantly lower than the cost of all types of new fossil
fuel generation plants.
The Commission has no recommendation for legislation at this time. In 2016, the
Commission stands ready to assist policymakers as they consider Michigan’s future energy
policy.

Appendix A - RE Filings: Case Numbers, Companies, Plan Filing Dates and Reconcilation Approval Dates
COMPANY
2009 Initial RE Plan Case
#
Next RE Biennial
Plan Case #
Next RE Plan Filing Date
2014 Reconciliation
Case #
2014 Reconciliation Approval Date
1 Alpena Power Company U-15804 5/12/2017 U-17802 2/11/20162 Consumers Energy Company U-15805 5/26/2017 U-17803 Pending3 DTE Electric Company U-15806 6/2/2017 U-17804 Pending4 Indiana Michigan Power Company U-15808 5/12/2017 U-17805 12/11/20155 Northern States Power Company-Wisconsin U-15809 5/12/2017 U-17806 10/27/20156 Upper Peninsula Power Company U-15810 5/26/2017 U-17807 10/27/20157 Wisconsin Public Service Corporation U-15811 5/26/2017 U-17808 11/5/20158 Wisconsin Electric Power Company U-15812 5/26/2017 U-17809 2/11/2016
9 Cloverland Electric Cooperative/Edison Sault U-15816 5/12/2017 U-17810 11/19/201510 Thumb Electric Cooperative U-15821 5/12/2017 U-17812 10/27/2015
11 Alger Delta Cooperative Electric Association U-15813 5/12/201712 Bayfield Electric Cooperative U-15814 6/2/201713 Cherryland Electric Cooperative U-15815 5/12/201714 Great Lakes Energy Cooperative (2012) U-15817 5/12/201715 Midwest Energy Cooperative U-15818 5/12/201716 Ontonagon Co. Rural Electricification Assoc. (2012) U-15819 5/12/201717 Presque Isle Electric and Gas Co-op (2012) U-15820 9/24/201718 Tri-County Electric Cooperative U-15822 8/13/2017
19 Village of Baraga U-15848 7/1/201720 City of Bay City U-15849 7/1/201721 City of Charlevoix U-15850 7/1/201722 Chelsea Department of Electric and Water U-15851 7/1/201723 Village of Clinton U-15852 7/1/201724 Coldwater Board of Public Utilities U-15853 7/1/201725 Croswell Municipal Light & Power Department U-15854 7/1/201726 City of Crystal Falls U-15855 7/1/201727 Daggett Electric Department U-15856 10/13/201728 City of Dowagiac U-15858 7/1/201729 City of Eaton Rapids U-15859 7/1/201730 City of Escanaba U-15860 7/1/201731 City of Gladstone U-15861 7/1/201732 Grand Haven Board of Light and Power U-15862 7/1/201733 City of Harbor Springs U-15863 7/1/201734 City of Hart Hydro U-15864 7/1/201735 Hillsdale Board of Public Utilities U-15865 7/1/201736 Holland Board of Public Works U-15866 7/1/201737 Village of L'Anse U-15867 7/1/201738 Lansing Board of Water & Light U-15868 7/1/201539 Lowell Light and Power U-15869 7/1/201740 Marquette Board of Light and Power U-15870 7/1/201741 Marshall Electric Department U-15871 7/1/201742 Negaunee Department of Public Works U-15872 7/1/201743 Newberry Water and Light Board U-15873 7/1/201744 Niles Utility Department U-15874 7/1/201745 City of Norway U-15875 7/1/201746 City of Paw Paw U-15876 7/1/201747 City of Petoskey U-15877 7/1/201748 City of Portland U-15878 7/1/201749 City of Sebewaing U-15879 7/1/201750 City of South Haven U-15880 7/1/201751 City of St. Louis U-15881 7/1/201752 City of Stephenson U-15882 7/1/201753 City of Sturgis U-15883 7/1/201754 Traverse City Light & Power U-15884 7/1/201755 Union City Electric Department U-15885 7/1/201756 City of Wakefield U-15886 7/1/201757 Wyandotte Department of Municipal Service U-15887 7/1/201758 Zeeland Board of Public Works U-15888 7/1/2017
IOUs
Cooperatives - Rate Regulated
Municipals
Cooperatives - Member Regulated
Not Required
Not Required
NL = New LicenseLVR = License Voluntarily RelinquishedLR = License Revoked
36

Appendix A - RE Filings: Case Numbers, Companies, Plan Filing Dates and Reconcilation Approval Dates
COMPANY
2009 Initial RE Plan Case
#
Next RE Biennial
Plan Case #
Next RE Plan Filing Date
2014 Reconciliation
Case #
2014 Reconciliation Approval Date
59 CMS ERM Michigan LLC U-15826 U-16640 4/16/201760 Commerce Energy Inc U-15828 U-16641 4/16/201761 Constellation Energy Services, Inc (formally Integrys) U-15833 U-16646 4/16/201762 Constellation NewEnergy Inc U-15829 U-16642 4/16/201763 Direct Energy Business LLC U-15845 U-16643 4/16/201764 FirstEnergy Solutions Corp U-15832 U-16644 4/16/201765 MidAmerican Energy Services U-17934 1/11/201666 Noble Americas Energy Solutions LLC U-15843 U-16650 4/16/201767 Spartan Renewable Energy Inc U-15844 U-16651 4/16/201768 U.P. Power Marketing LLC U-16586 U-16652 5/26/201769 Wolverine Power Marketing Cooperative Inc U-15847 U-16653 4/16/2017
70 AEP Energy, Inc U-15825 U-15825 4/16/201771 Dillon Power, LLC U-17769 4/15/201772 Direct Energy Services LLC U-15830 U-15830 4/16/201773 Dynegy Energy Services (East), LLC (Formally Duke Energy) U-16767 10/20/201774 Eligo Energy MI, LLC U-17885 9/14/201775 Energy Int'l Power Marketing d/b/a PowerOne U-15831 U-15831 5/26/201776 Energy Services Providers, Inc. d/b/a Michigan Gas & Electric U-17010 9/11/201677 Interstate Gas Supply, Inc d/b/a IGS Energy U-17338 2/20/201678 Lakeshore Energy Services, LLC U-16979 9/11/201679 Liberty Power Delaware U-15834 U-15834 5/26/201780 Libery Power Holdings LLC U-15835 U-15835 5/26/201781 Plymouth Rock Energy LLC U-17549 4/15/201682 Premier Energy Marketing LLC U-15841 U-16648 5/26/201783 Santana Energy Services U-17254 6/28/201784 Texas Retail Energy, LLC U-17168 5/29/2017
Not RequiredAlternative Electric Suppliers (AES) Not Serving Customers
Not RequiredAlternative Electric Suppliers (AES) Serving Customers
NL = New LicenseLVR = License Voluntarily RelinquishedLR = License Revoked
37

CompanyInitial Plan
2015 Plan
Docket2014 Compliance
Year Sales*Retail Sales
Method**2007/2008
Baseline RECs2013 REC
Requirement2014 REC
Requirement2014 Excess RECs Retired
2014 EO Credit Substitutions
2015 Compliance Year Sales
2015 Energy Credit
Requirement
Expected to Meet 2015
10% Standard
Current Residential Surcharge $/Month
Rate Regulated UtilitiesAlpena Power U-15804 U-17791 330,445 3Y 0 10,881 16,522 1,518 339,929 33,993 Yes 0.00
Consumers Energy U-15805 U-17792 33,305,088 3Y 1,549,840 2,145,536 2,440,174 0 25,989 33,188,734 3,318,873 Yes 0.00DTE Electric U-15806 U-17793 42,512,369 W 566,819 1,756,567 2,409,028 0 131,068 42,448,318 4,244,832 Yes 0.00Indiana Michigan U-15808 U-17794 2,810,444 W 17,450 104,542 149,247 0 2,828,387 282,839 Yes 0.86NSP-Wisc (Xcel) U-15809 U-17795 140,736 3Y 12,679 13,142 13,376 0 141,190 14,119 Yes 0.00Upper Peninsula Power U-15810 U-17796 847,104 3Y 98,521 84,671 84,710 1,173 838,610 83,861 Yes 0.00Wisc. PSC U-15811 U-17797 285,363 3Y 11,145 16,814 19,841 10,540 277,498 27,750 Yes 0.00Wisc. Elec Co U-15812 U-17798 1,683,135 W 53,196 127,144 110,755 0 384,001 38,400 Yes 1.20
Rate Regulated CooperativesCloverland Electric Coop U-15816 U-17799 800,275 3Y 301,126 80,231 80,028 1,972 809,610 80,961 Yes 0.00Thumb Elec. Coop U-15821 U-17801 160,684 3Y 1,562 6,206 8,815 0 165,979 16,598 Yes 0.00
Member Regulated CooperativesAlger Delta Coop Elec U-15813 U-16589 64,912 3Y 920 2,626 3,706 0 69,691 6,969 Yes 0.00Bayfield Elec. Coop U-15814 U-16590 177 3Y 4 9 11 0 167 17 Yes 0.00Cherryland Elec Coop U-15815 U-16591 378,464 3Y 0 12,272 18,923 0 383,527 38,353 Yes 0.00Great Lakes Energy Coop U-15817 U-16593 1,379,627 3Y 0 44,820 68,981 0 1,399,433 139,943 Yes 0.00Homeworks Tri-County Elec. Coop U-15822 U-16598 330,945 3Y 0 10,746 16,547 0 334,324 33,432 Yes 0.00Midwest Energy Coop U-15818 U-17800 586,247 3Y 0 19,354 29,312 0 592,064 59,206 Yes 0.00Ontonagon Co. Rural Elec. U-15819 U-16595 25,321 3Y 2,246 2,329 2,389 0 25,402 2,540 Yes 0.00Presque Isle Elec & Coop U-15820 U-16596 237,008 3Y 0 7,798 11,850 1 238,663 23,866 Yes 0.00
Alternative Electric SuppliersCMS ERM Michigan U-15826 U-16640 176,468 3Y 0 6,270 8,823 49 152,956 15,296 Yes 0.00Commerce Energy U-15828 U-16641 12,869 W 0 475 643 0 11,490 1,149 Yes 0.00Constellation Energy Services, Inc (Formally Integrys) U-15833 U-16646 2,099,121
W 0 34,678 104,956 3,4544,156,038 415,604
Yes 0.00
Constellation NewEnergy U-15829 U-16642 1,905,378 W 0 67,985 95,269 0 1,817,091 181,709 Yes 0.00Direct Energy Business U-15845 U-16643 330,174 W 0 9,672 16,509 0 434,817 43,482 Yes 0.00First Energy Solutions U-15832 U-16644 2,942,221 W 0 73,489 147,111 0 2,874,835 287,484 Yes 0.00Glacial Energy of Illinois U-16007 U-16645 131,148 W 0 8,612 6,557 3,642 68,317 6,832 Yes 0.00MidAmerican Energy Company U-15837 U-16647 97,646 W 0 2,913 4,882 0 86,254 8,625 Yes 0.00Noble Americas Energy Solutions f/k/a Sempra Energy Solutions U-15843 U-16650 1,359,749 W 0 60,994 67,987 1 1,179,882 117,988 Yes 0.00Spartan Renewable Energy U-15844 U-16651 66,362 3Y 0 2,174 3,318 0 68,017 6,802 Yes 0.00U.P. Power Marketing U-15846 U-16652 35,429 W 0 864 1,771 0 39,714 3,971 Yes 0.00Wolverine Power Marketing Cooperative U-15847 U-16653 1,057,146 3Y 0 38,515 52,857 0 987,150 98,715 Yes 0.00
10,213,711 0 306,641 337,052 7,146 11,876,561 1,187,656
Appendix B - Estimate of Renewable Energy Credit Requirements and Renewable Energy Plan Summary
Aggregated Totals***
38
CompanyInitial Plan
2015 Plan
Docket2014 Compliance
Year Sales*Retail Sales
Method**2007/2008
Baseline RECs2013 REC
Requirement2014 REC
Requirement2014 Excess RECs Retired
2014 EO Credit Substitutions
2015 Compliance Year Sales
2015 Energy Credit
Requirement
Expected to Meet 2015
10% Standard
Current Residential Surcharge $/Month
Appendix B - Estimate of Renewable Energy Credit Requirements and Renewable Energy Plan Summary
Municipal UtilitiesVillage of Baraga U-15848 U-16599 18,748 3Y 0 616 937 0 18,796 1,880 Yes 0.00City of Bay City U-15849 U-16600 318,933 3Y 0 10,661 15,947 0 316,642 31,664 Yes 0.00City of Charlevoix U-15850 U-16601 59,877 3Y 0 2,040 2,994 0 59,664 5,966 Yes 0.00Chelsea Dept. of Electric & Water U-15851 U-16602 98,169 3Y 0 3,209 4,908 0 98,876 9,888 Yes 0.00Village of Clinton U-15852 U-16603 22,741 3Y 0 740 1,137 1 23,397 2,340 Yes 0.00Coldwater Board of Public Utilities U-15853 U-16604 322,309 3Y 0 9,827 16,115 1 347,917 34,792 Yes 0.00Croswell Municipal Light & Power Dept. U-15854 U-16605 36,956 3Y 0 1,186 1,848 0 38,771 3,877 Yes 0.11City of Crystal Falls U-15855 U-16606 16,266 3Y 4,400 1,618 1,627 0 16,340 1,634 Yes 0.00Daggett Electric Department U-15856 U-16607 1,251 3Y 0 42 63 1 1,351 135 Yes 0.00City of Dowagiac U-15858 U-16609 64,835 3Y 0 2,177 3,242 0 65,057 6,506 Yes 0.00City of Eaton Rapids U-15859 U-16610 94,269 3Y 2,263 4,588 5,845 0 93,846 9,385 Yes 0.57City of Escanaba U-15860 U-16611 143,562 3Y 0 4,793 7,178 297 141,667 14,167 Yes 0.00City of Gladstone U-15861 U-16612 32,539 3Y 0 1,071 1,627 0 32,396 3,240 Yes 0.00Grand Haven Board of Light & Power U-15862 U-16613 279,058 3Y 0 9,074 13,953 0 284,808 28,481 Yes 0.00City of Harbor Springs U-15863 U-16614 37,901 3Y 0 1,239 1,895 0 37,723 3,772 Yes 0.48City of Hart U-15864 U-16615 44,998 3Y 804 1,969 2,652 0 45,047 4,505 Yes 0.63Hillsdale Board of Public Utilities U-15865 U-16616 119,978 3Y 0 3,977 5,999 0 118,990 11,899 Yes 0.00Holland Board of Public Works U-15866 U-16617 1,021,821 3Y 0 32,902 51,091 2 1,041,000 104,100 Yes 0.00Village of L'anse U-15867 U-16618 12,228 3Y 0 421 611 0 11,954 1,195 Yes 0.00Lansing Board of Water & Light U-15868 U-16619 2,173,293 3Y 6,655 76,733 111,992 31 2,144,607 214,461 Yes 0.75Lowell Light & Power U-15869 U-16620 67,065 3Y 0 2,135 3,353 0 70,011 7,001 Yes 3.00Marquette Board of Light & Power U-15870 U-16621 306,572 3Y 14,016 19,482 22,337 1 306,095 30,609 Yes 0.00Marshall Electric Department U-15871 U-16622 106,918 3Y 1,318 4,479 6,005 0 105,227 10,523 Yes 0.00Negaunee Dept. of Public Works U-15872 U-16623 22,565 3Y 0 733 1,128 0 22,692 2,269 Yes 0.00Newberry Water and Light Board U-15873 U-16624 18,050 3Y 4,931 1,828 1,805 352 17,850 1,785 Yes 0.00Niles Utilities Department U-15874 U-16625 131,479 3Y 0 4,311 6,574 0 131,018 13,102 Yes 0.00City of Norway U-15875 U-16626 29,188 3Y 21,080 2,929 2,919 0 28,664 2,866 Yes 0.00Village of Paw Paw U-15876 U-16627 39,867 3Y 0 1,311 1,993 0 40,833 4,083 Yes 0.00City of Petoskey U-15877 U-16628 105,172 3Y 0 3,525 5,259 0 105,849 10,585 Yes 0.00City of Portland U-15878 U-16629 36,321 3Y 1,746 2,378 2,689 0 35,397 3,540 Yes 0.00City of Sebewaing U-15879 U-16630 41,086 3Y 0 1,305 2,054 0 42,491 4,249 Yes 0.19City of South Haven U-15880 U-16631 134,245 3Y 0 4,447 6,712 0 134,959 13,496 Yes 0.00City of St. Louis U-15881 U-16632 39,527 3Y 680 1,746 2,316 0 39,988 3,999 Yes 0.00City of Stephenson U-15882 U-16633 6,126 3Y 0 200 306 99 6,121 612 Yes 0.00City of Sturgis U-15883 U-16634 222,747 3Y 11,232 14,926 16,753 0 223,562 22,356 Yes 0.00Traverse City Light & Power U-15884 U-16635 323,112 3Y 778 11,129 16,545 9 322,971 32,297 Yes 0.00Union City Electric Department U-15885 U-16636 15,886 3Y 1,625 1,583 1,589 0 15,888 1,589 Yes 0.00City of Wakefield U-15886 U-16637 12,522 3Y 0 416 626 0 13,125 1,313 Yes 0.00Wyandotte Dept. of Muncipal Service U-15887 U-16638 292,801 3Y 0 9,593 14,640 0 292,164 29,216 Yes 0.00Zeeland Board of Public Works U-15888 U-16639 328,156 3Y 0 10,503 16,408 40 337,397 33,740 Yes 0.00
103,291,192 2,687,036 5,020,171 6,378,575 23,184 157,057 103,573,239 10,357,3244.9% 6.2% 10.0%Compliance Renewable Energy %
*Sales from Annual Report
***AES totals are aggregated.
** 3Y = 3 Year Average W = Weather Normalized
***Total
39

Total Plan PeriodAnticipated
2009-2013 2014 Remaining Incremental Energy Reported Reported Anticipated Cost of
2014 2014 Credits Incremental Incremental Incremental ComplianceGenerated Generated Sold Cost of Cost of Cost of (Prior Years plusor Aquired or Aquired in 2014 Compliance Compliance Compliance Anticipated)
Company Name (RECs) (ACECs) (RECs) ($) ($) ($) ($)Investor Owned Utilities:Alpena Power Company 18,040 0 0 2,292,925 350,589 500,000 3,143,514Consumers Energy Company 3,004,566 0 47,844 54,968,171 36,500,000 50,200,000 141,668,171Detroit Edison Company 3,662,195 0 0 166,933,955 65,187,478 398,584,444 630,705,877Indiana Michigan Power Company 278,931 0 35,274 826,963 476,535 18,854,000 20,157,498Northern States Power Company 28,144 0 1,589 0 0 0 0Upper Peninsula Power Company 214,952 0 60,000 0 0 0 0Wisconsin Public Service Corporation 66,799 0 42,149 0 0 0 0Wisconsin Electric Power Co 31,052 0 0 153,495 339,673 5,583,895 6,077,063
7,304,679 0 186,856 225,175,509 102,854,275 473,722,339 801,752,123
Rate Regulated Cooperatives:Cloverland Electric Cooperative 430,854 0 119372 0 0 0 0Thumb Electric Cooperative 8,815 0 0 0 0 0 0
439,669 0 119,372 0 0 0 0
Member Regulated Electric Cooperatives:Alger Delta Cooperative Electric Association 0 0 0 0 0 0 0Bayfield Electric Cooperative 11 0 0 0 51 760 811Cherryland Electric Cooperative 13,898 0 0 0 0 0Great Lakes Energy Cooperative 50,708 0 0 0 0 0 0Homeworks Tri-County Electric Cooperative 12,114 0 0 0 0 0 0Midwest Energy Cooperative 21,453 0 0 0 0 0 0Ontonagon County Rural Electricification Association 2,551 0 3,771 0 0 0 0Presque Isle Electric and Gas Co-op 8,648 0 0 0 0 0 0
109,383 0 3,771 0 51 760 811
Municipally-Owned Electric Utilities:City of Bay City 30,991 0 0 870,594 417,549 9,122,951 10,411,094City of Charlevoix 6,199 0 2,100 90,457 90,877 2,758,984 2,940,318City of Crystal Falls 5,730 0 0 0 0 0 0City of Dowagiac 2,177 0 0 7,146 0 0 7,146City of Eaton Rapids 0 0 0 206,533 122,852 505,488 834,873City of Escanaba 0 0 0 0 0 262,883 262,883City of Gladstone 0 0 0 0 0 0 0City of Harbor Springs 6,200 0 0 21,190 0 0 21,190City of Hart Hydro 4,949 0 0 10,595 0 0 10,595City of Norway 31,883 0 53,043 0 0 0 0City of Petoskey 11,770 0 3,109 167,370 163,377 5,461,628 5,792,375City of Portland 4,086 0 0 12,436 40,672 825,888 878,996City of Sebewaing 1,273 0 0 7,830 4,670 83,808 96,308City of South Haven 6,712 0 0 7,719 0 0 7,719City of St. Louis 2,749 0 0 45,862 29,231 572,344 647,437City of Stephenson 646 0 0 0 0 0 0City of Sturgis 23,300 0 0 12,051 0 0 12,051City of Wakefield 460 0 0 0 0 0 0Chelsea Dept of Electric & Water 5,632 0 0 153,901 220,452 1,876,039 2,250,392Coldwater Board of Public Utilties* 43,410 0 0 3,411 0 0 3,411Croswell Municipal Light & Power Dept 996 0 0 0 822 76,474 77,296Daggett Electric Dept 126 0 0 1,905 0 0 1,905Grand Haven Board of Light & Power 24,794 0 0 804,545 0 0 804,545Hillsdale Board of Public Utilities* 43,410 0 0 1,473 0 0 1,473Holland Board of Public Works 44,206 0 0 6,352,628 0 0 6,352,628Lansing Board of Water & Light 102,827 0 442 8,185,779 2,009,065 10,194,844Lowell Light & Power 8,532 0 7,792 251,029 139,893 11,754,282 12,145,204Marquette Board of Light & Power 31,829 0 0 42,175 0 0 42,175Marshall Electric Dept* 43,410 0 0 7,186 0 0 7,186Negaunee Dept of Public Works 0 0 0 0 0 0 0Newberry Water & Light Board 9,370 0 0 2,173,289 0 0 2,173,289Niles Utility Dept 4,311 0 0 7,529 0 0 7,529Traverse City Light & Power 31,254 0 28,852 0 0 0 0Union City Electric Dept* 43,410 0 0 506 506Wyandotte Dept of Municipal Service 16,803 0 0 266,509 199,958 0 466,467Village of Baraga 0 0 0 0 0 0 0Village of Clinton* 43,410 0 0 269 269Village of L'Anse 0 0 0 0 0 0 0Village of Paw Paw 1,305 0 0 2,505 0 0 2,505Zeeland Board of Public Works 36,702 0 0 1,106 10,226 0 11,332
501,222 0 95,338 19,715,528 1,440,579 35,309,834 56,465,941Combined Annual Report*
Alternative Electric Suppliers (AES):
CMS ERM Michigan LLC 8,251 621 0 1,500Commerce Energy Inc 643 0 0 0 0 0Constellation NewEnergy Inc 229,013 0 18,991 0 0Direct Energy Business LLC 89,471 0 0 83,353 0FirstEnergy Solutions Corp 160,315 0 0 0 0Glacial Energy of Illinois, Inc. 0 0 0 0 125,000Integrys Energy Services Inc 939,773 0 108,410 0 0 0 0Midamerican Energy Company 5,000 0 0 1 2Noble Americas Energy Solutions LLC f/k/a Sempra Energy Solutions LLC 61,310 0 0 0 0Spartan Renewable Energy Inc 47,250 0 47,250 0 0 0 0UP Power Marketing LLC 4,772 0 0 0 0 0 0Wolverine Power Marketing Cooperative Inc 58,488 0 20,862 0 0 0 0
1,604,286 621 195,513 0 83,354 126,502 0
*Totals: 9,959,239 621 600,850 244,891,037 104,378,259 509,159,435 858,218,874
Michigan Retail Sales (MWh): 103,291,192 (Based on Appendix B Retail Sales Total)
Michigan Estimated Renewable Energy %: 9.1%
Source: PA 295 Annual Reports:http://www.michigan.gov/mpsc/0,4639,7-159-16393_53570-240179--,00.html*AES totals are aggregated
Appendix C - ELECTRIC PROVIDER RENEWABLE ENERGY ANNUAL REPORT SUMMARY
2014 Reporting Year
40

Michigan’s Solar Programs Consumers Energy and DTE Electric continued previously established solar programs
designed to incentivize solar installations. During 2013, Cherryland Electric Cooperative and Traverse City Light & Power implemented Michigan’s first community solar program. Tri-County Electric’s Solar Garden Program began in 2014. Consumers Energy Company’s Community Solar Program was approved by the Commission in May 2015.1 Experimental Advanced Renewable Program
Consumers Energy’s original Experimental Advanced Renewable Program (EARP) was approved by the Commission in 2009. The maximum program size was 2 MW (2,000 kW) with 1,500 kW reserved for commercial projects and the remaining 500 kW allotted to residential projects. In June 2011, the company announced that the program had become fully subscribed after completing 102 agreements. After careful review and design, Consumers Energy expanded the program by an additional 3 MW. The Commission approved the expanded program in May 2011 with the option for additional capacity should program funding allow. Later in 2011, the Commission approved an additional 0.25 MW for a total of 5.25 MW. Based on its most recently filed case, the company expects to be able to fund a total of 6 MW of solar installations through 2015 under its EARP.
Under Consumers Energy’s original EARP (Phase 1 and 2), customers receive a firm
price for each kilowatt hour (kWh) generated by the customer’s solar generation system over a 12 year period. Phase 1 agreements began in September 2009 paying $0.65 per kWh for residential systems up to 20 kW and $0.45 per kWh for commercial systems up to 150 kW. Phase 2 agreements began in May 2010 paying $0.525 per kWh for residential systems up to 20 kW and $0.375 per kWh for commercial systems up to 150 kW.
The 4 MWs of capacity under the expanded program are split between residential and
non-residential customers and will be awarded in phases pertaining to the respective customer class. The price is set with a maximum offer of $0.259 per kWh, which was dynamic; increasing or decreasing based on interest in prior phases. Additionally, the company offers a $0.001 per kWh bonus for systems constructed using both Michigan labor and Michigan materials. As of January 2015, the offer price is fixed at $0.240 per kWh for all new residential participants, and $0.199 per kWh for all new non-residential participants.
A system’s size is limited to the customer’s annual electricity use, similar to the net-
metering program. This is a change from the original Phase 1 and 2 of the EARP that allowed for systems larger than customer use within the respective category. The program will continue to add new participants until the approved budget is filled or the end of 2015, whichever comes first. Agreements will have 15 year terms or will expire at the end of the Renewable Energy Plan period in 2029, whichever comes first.
Consumers Energy has awarded agreements through 35 Phases. Of these phases 18
have been residential phases, 11 have been non-residential with the remainder of the 35 being from the first 2 phases and the developer program. At the end of 2015, Consumers Energy had a total of 5.08 MW of solar capacity participating or under construction as part of the EARP with 3.315 MW operational.
1 http://efile.mpsc.state.mi.us/efile/docs/17752/0037.pdf
41

SolarCurrents
DTE Electric’s SolarCurrents pilot program initially included a 5 MW customer-owned program and a 15 MW company-owned program. In May 2011, DTE Electric announced that the customer-owned program was fully subscribed. On December 20, 2011, the Commission ordered MPSC Staff to convene a collaborative to explore opportunities for the continuation of the customer-owned SolarCurrents program. Pursuant to the collaborative, the company filed an application for a 2 MW expansion on October 8, 2012 and the Commission approved the application on November 16, 2012, which increased the SolarCurrents Program to 22MW.
The 5 MW Phase 1 customer-owned SolarCurrents program provided an up-front
renewable energy credit (REC)[2] payment equal to $2.40 per Watt of installed solar PV which is approximately half of the total system cost. The company will purchase the remaining RECs through a monthly payment/on-bill credit equal to $0.11 per kWh for 20 years. System size is limited by the customer's annual electricity use or by the 20 kW size cap (whichever is smaller).
Phase 2 provides for an up-front purchase of approximately 30% of the RECs the
company anticipates will be generated over the life of the system. The remaining RECs will be purchased via monthly bill credits based on actual generation. This purchase is done through $0.02 (for non-residential customers) and $0.03 (for residential customers) per kWh payments starting on the agreement execution date and ending on August 31, 2029, for a maximum term of 16 years. The company accepted applications for the 2 MW Phase 2 program from residential and non-residential customers through four 500 kW tranches. The agreements were awarded using random selection events starting in January 2013 with the last offering awarded in August 2014. As of December 31, 2015, the company has contracted for 5,030 kW from 589 customers representing full participation for Phase 1 of SolarCurrents and commissioned the remaining projects for Phase 2 of the program. SolarCurrents Phase 2 is represented by 242 projects representing 1.7 MW.
DTE Electric’s company-owned SolarCurrents program includes solar photovoltaic
projects ranging from 60 kW to 1,949 kW that are either located on DTE Energy property or on customer premises. Customers selected to host a solar project receive a one-time, upfront construction payment to cover any inconvenience during installation in addition to an annual easement payment for the life of the installation. Pursuant to two separate competitive solicitations, the company contracted with Nova Consultants, Rudolph Libbe, and Inovateus Solar, LLC to construct the solar generating facilities. The panels will be provided by either McNaughton-McKay Electric Company or Inovatus Solar, LLC. Currently, 26 projects are complete totaling 14.2 MW of solar PV capacity. An additional two projects are in the design phase totaling approximately 1.7 MW of capacity. The installation of the final two projects is expected in the summer of 2016 and will conclude the company-owned SolarCurrents pilot program with 15.9 MW, exceeding the program's 15.0 MW target.
Community Solar
Cherryland Electric Cooperative and Traverse City Light & Power are the first electric providers in Michigan to offer a joint community solar program – Solar Up North (SUN) Alliance Program. The framework for this program comes from the energy optimization standard of Act 295 as opposed to net metering or the renewable energy standard. Cherryland Electric Cooperative members and Traverse City Light & Power customers can purchase solar shares
42

for a one time investment of $470.00 each. The participants receive a $75.00 Energy Optimization rebate per panel. The electric providers use the wholesale electric market prices to determine the amount of monthly bill credit to provide to the participants. It is estimated that the credit will be an average of $2.00 per month. This amount will be based on total monthly array output and will vary based on weather conditions. The community solar program has been very successful and is continuing to grow. As of July 2013, one hundred thirty six shares had been purchased.2
In 2014, Tri-County Electric began offering leases as part of its community Solar Garden
Program. The solar array is 20.9 kW. On May 14, 2015 the Commission conditionally approved Consumers Energy’s
application to add Community Solar to its renewable energy plan. It is the first community solar program offered by a rate regulated utility in Michigan. Participants will be allowed to purchase half kW blocks up to their annual usage and receive bill credits based on a value of solar model for 25 years. The program has a total capacity of up to 10 MW.
2 See A Guidebook for Community Solar Programs in Michigan Communities http://glrea.org/
43

Biomass 35%
Hydroelectric Water 22%
Incentive 10%
Industrial Thermal Co-Gen
3%
Industrial Waste 3%
Landfill Gas 13%
Municipal Solid Waste
7% Wind
7%
MIRECS 2009 Vintage Energy Credits 5,256,722 Total Credits
Solar < 1%
Biomass 33%
Hydroelectric Water 20%
Incentive 11% Industrial Thermal
Co-Gen 2%
Industrial Waste 5%
Landfill Gas 14%
Municipal Solid Waste
5% Wind 10%
MIRECS 2010 Vintage Energy Credits 5,109,511 Total Credits
Solar < 1%
44

Biomass 31%
Hydroelectric 20% Incentive
11% Industrial Thermal Co-Gen
2%
Industrial Waste 4%
Landfill Gas 15%
Municipal Solid Waste
5%
Solar 1% Wind
11%
MIRECS 2011 Vintage Energy Credits 5,404,910 Total Credits
biomass, 26%
hydroelectric, 15%
incentive, 11%
industrial thermal cogeneration, 1%
industrial waste energy, 4%
landfill gas, 13%
municipal solid waste, 5%
solar, <1%
wind, 24%
MIRECS 2012 Vintage Energy Credits 6,642,728 Total Credits
45
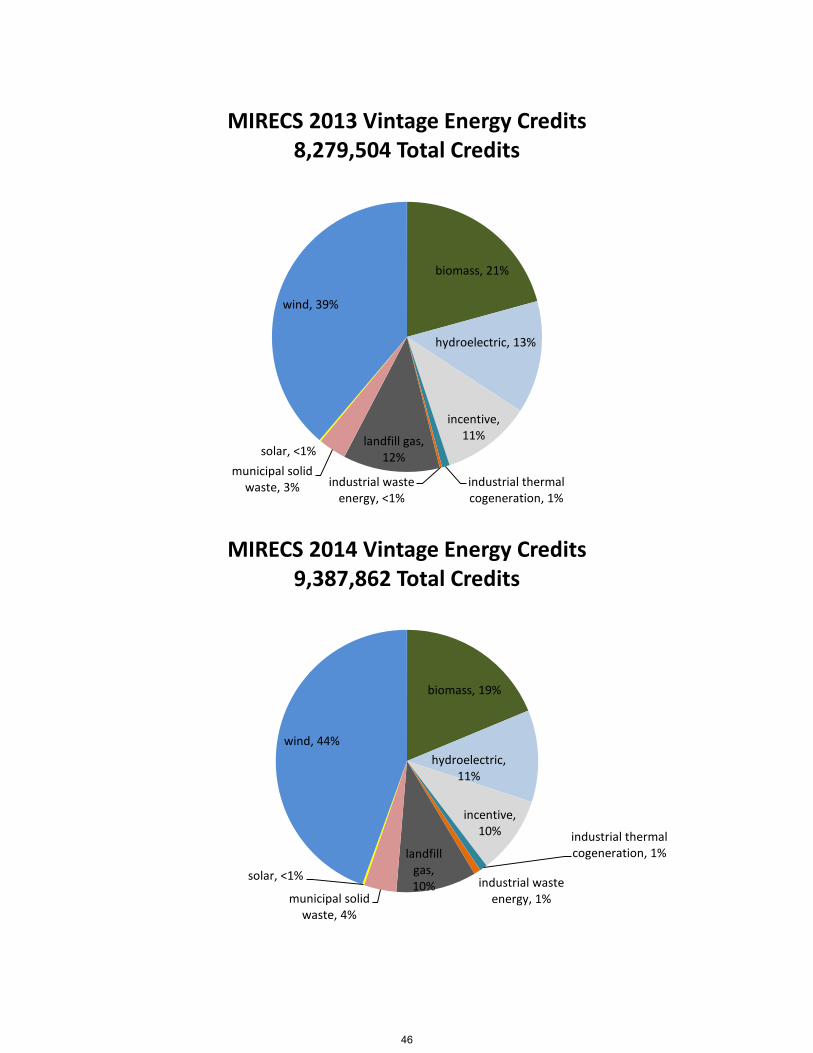
biomass, 21%
hydroelectric, 13%
incentive, 11%
industrial thermal cogeneration, 1%
industrial waste energy, <1%
landfill gas, 12%
municipal solid waste, 3%
solar, <1%
wind, 39%
MIRECS 2013 Vintage Energy Credits 8,279,504 Total Credits
biomass, 19%
hydroelectric, 11%
incentive, 10% industrial thermal
cogeneration, 1%
industrial waste energy, 1%
landfill gas, 10%
municipal solid waste, 4%
solar, <1%
wind, 44%
MIRECS 2014 Vintage Energy Credits 9,387,862 Total Credits
46

*Not all data has been reported for 2015.
biomass, 18%
hydroelectric, 8%
incentive, 8%
landfill gas, 9%
municipal solid waste, 5%
solar, <1%
wind, 52%
MIRECS 2015 Vintage Energy Credits 6,435,771* Total Credits
47
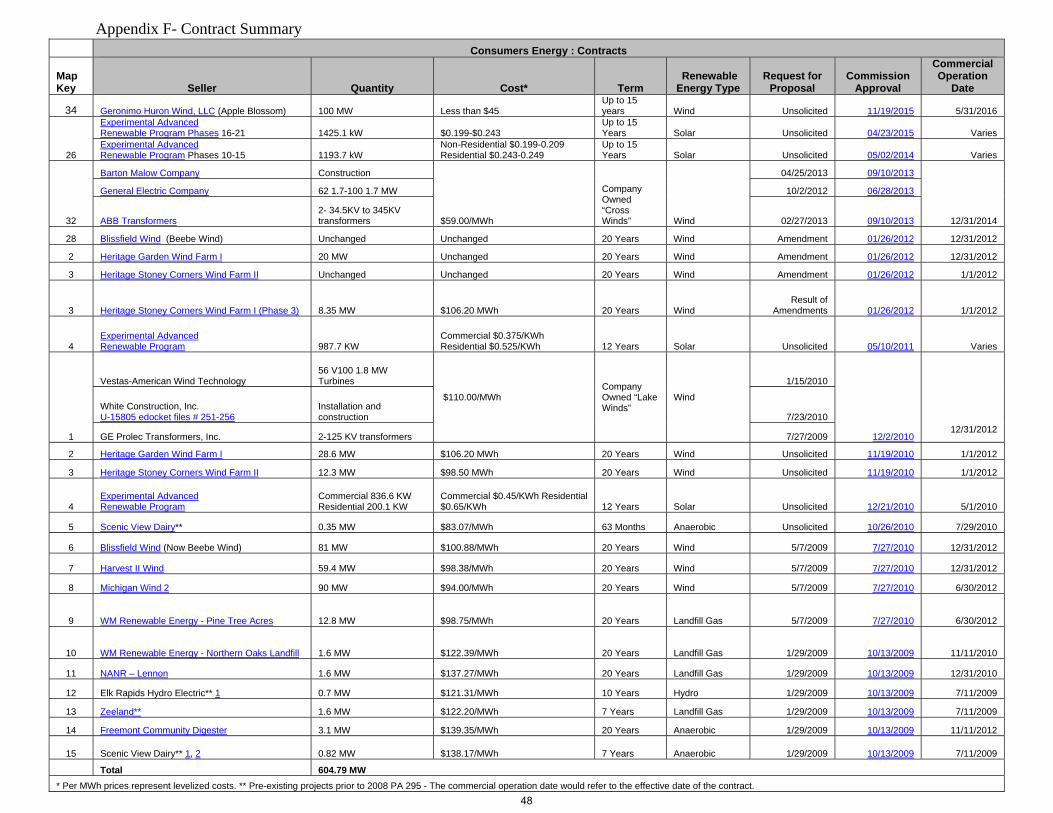
Appendix F- Contract Summary Consumers Energy : Contracts
Map Key Seller Quantity Cost* Term
Renewable Energy Type
Request for Proposal
Commission Approval
Commercial Operation
Date
34 Geronimo Huron Wind, LLC (Apple Blossom) 100 MW Less than $45 Up to 15 years Wind Unsolicited 11/19/2015 5/31/2016
26
Experimental Advanced Renewable Program Phases 16-21 1425.1 kW $0.199-$0.243
Up to 15 Years Solar Unsolicited 04/23/2015 Varies
Experimental Advanced Renewable Program Phases 10-15 1193.7 kW
Non-Residential $0.199-0.209 Residential $0.243-0.249
Up to 15 Years Solar Unsolicited 05/02/2014 Varies
32
Barton Malow Company Construction
$59.00/MWh
Company Owned “Cross Winds” Wind
04/25/2013 09/10/2013
12/31/2014
General Electric Company 62 1.7-100 1.7 MW 10/2/2012 06/28/2013
ABB Transformers 2- 34.5KV to 345KV transformers 02/27/2013 09/10/2013
28 Blissfield Wind (Beebe Wind) Unchanged Unchanged 20 Years Wind Amendment 01/26/2012 12/31/2012
2 Heritage Garden Wind Farm I 20 MW Unchanged 20 Years Wind Amendment 01/26/2012 12/31/2012
3 Heritage Stoney Corners Wind Farm II Unchanged Unchanged 20 Years Wind Amendment 01/26/2012 1/1/2012
3 Heritage Stoney Corners Wind Farm I (Phase 3) 8.35 MW $106.20 MWh 20 Years Wind Result of
Amendments 01/26/2012 1/1/2012
4 Experimental Advanced Renewable Program 987.7 KW
Commercial $0.375/KWh Residential $0.525/KWh 12 Years Solar Unsolicited 05/10/2011 Varies
1
Vestas-American Wind Technology 56 V100 1.8 MW Turbines
$110.00/MWh Company Owned “Lake Winds”
Wind
1/15/2010
12/2/2010
12/31/2012
White Construction, Inc. U-15805 edocket files # 251-256
Installation and construction 7/23/2010
GE Prolec Transformers, Inc. 2-125 KV transformers 7/27/2009
2 Heritage Garden Wind Farm I 28.6 MW $106.20 MWh 20 Years Wind Unsolicited 11/19/2010 1/1/2012
3 Heritage Stoney Corners Wind Farm II 12.3 MW $98.50 MWh 20 Years Wind Unsolicited 11/19/2010 1/1/2012
4 Experimental Advanced Renewable Program
Commercial 836.6 KW Residential 200.1 KW
Commercial $0.45/KWh Residential $0.65/KWh 12 Years Solar Unsolicited 12/21/2010 5/1/2010
5 Scenic View Dairy** 0.35 MW $83.07/MWh 63 Months Anaerobic Unsolicited 10/26/2010 7/29/2010
6 Blissfield Wind (Now Beebe Wind) 81 MW $100.88/MWh 20 Years Wind 5/7/2009 7/27/2010 12/31/2012
7 Harvest II Wind 59.4 MW $98.38/MWh 20 Years Wind 5/7/2009 7/27/2010 12/31/2012
8 Michigan Wind 2 90 MW $94.00/MWh 20 Years Wind 5/7/2009 7/27/2010 6/30/2012
9 WM Renewable Energy - Pine Tree Acres 12.8 MW $98.75/MWh 20 Years Landfill Gas 5/7/2009 7/27/2010 6/30/2012
10 WM Renewable Energy - Northern Oaks Landfill 1.6 MW $122.39/MWh 20 Years Landfill Gas 1/29/2009 10/13/2009 11/11/2010
11 NANR – Lennon 1.6 MW $137.27/MWh 20 Years Landfill Gas 1/29/2009 10/13/2009 12/31/2010
12 Elk Rapids Hydro Electric** 1 0.7 MW $121.31/MWh 10 Years Hydro 1/29/2009 10/13/2009 7/11/2009
13 Zeeland** 1.6 MW $122.20/MWh 7 Years Landfill Gas 1/29/2009 10/13/2009 7/11/2009
14 Freemont Community Digester 3.1 MW $139.35/MWh 20 Years Anaerobic 1/29/2009 10/13/2009 11/11/2012
15 Scenic View Dairy** 1, 2 0.82 MW $138.17/MWh 7 Years Anaerobic 1/29/2009 10/13/2009 7/11/2009
Total 604.79 MW * Per MWh prices represent levelized costs. ** Pre-existing projects prior to 2008 PA 295 - The commercial operation date would refer to the effective date of the contract.
48

Appendix F- Contract Summary DTE Electric Company : Contracts
Map Key Seller Quantity Cost* Term
Renewable Energy Type
Request for Proposal
Commission Approval
Commercial Operation Date
Innovatus Up to 50 MW $113.52/MWh*** Company Owned Solar 6/24/2015 12/11/2015 10/31/2016
35
General Electric Company 1.7MW-100 model turbines up to 50 MW
$47/MlWh - $53/MWh Company Owned “Pinnebog Wind” Wind
2/17/2014
12/18/2014 12/31/2015 Aristeo Construction Company Installation and construction 6/20/2014
16
Rudolf Libbe, Inc 750 kW
$3,741/kW Company Owned Solar 09/28/2012 7/8/2014 04/2015 Inovateus Solar, LLC. 504 kW
33 Big Turtle Wind Farm, LLC 20 MW $53/MWh 20 Years Wind Unsolicited 09/24/2013 Expected 2014
31 Pheasant Run Wind, LLC 74.8 MW Up to $49.25/MWh 20 Years Wind Unsolicited 5/17/2013 12/31/2014
31 Pheasant Run Wind II, LLC “Brookfield” 74.8 MW Up to $49.25/MWh Company Owned Wind Unsolicited 5/17/2013 12/31/2014
16 SolarCurrents Phase II 0.5 MW Non-Residential 1.5 MW Residential
$0.13/W $0.02/kWh $0.20/W $0.03/kWh Through 8/31/2029 Solar Unsolicited 11/16/2012 Varies
29 Tuscola Wind II, LLC 100 MW $49.25/MWh*** 20 Years Wind 5/3/2012 10/31/2012 12/31/2013
30
General Electric Company 1.6MW-100 model turbines up to 110 MW
$52.50/MWh Company Owned “Echo Wind” Wind
10/12/2011
9/11/2012 12/31/2013 Barton Malow Company Installation and construction 4/17/2012
24 Michigan Waste Energy, Inc. Up to 65,000 RECs/Year $7.00/REC 13 Years Incinerator Unsolicited 12/6/2011
1991
16 Nova Consultants, Inc. Solar EPC Up to $48 Million Company Owned Solar
2/28/2011
11/10/2011
12/31/2015 16
McNaughton-McKay Electric Company Supply up to 12 MW of Modules Up to $24 Million 3/24/2011
16 Inovateus Solar, LLC Supply up to 12MW
27
General Electric Company Up to 69 1.6MW-100 Turbines $61-$64/MWh Company Owned “Thumb Wind” Wind 3/9/2011 9/13/2011 12/31/2012
Barton Malow Company Installation and construction 5/6/2011
25 Tuscola Bay Wind. LLC 120 MW Up to $60.90/MWh 20 Years Wind 11/18/2010 8/25/2011 10/31/2012
20 L’Anse Warden Electric Company 110,374 RECs $11.98 (Average of 4 REC/ACEC Contracts)
Amendment Acquiring Vintage RECs Biomass 8/18/2009 8/25/2011 7/1/2010
18 Gratiot County Wind 12.8 MW additional Unchanged from original contract
Company Owned Wind Amendment 5/10/2011 12/31/2012
16 Nova Consultants Unchanged from original contract
Unchanged from original contract Company Owned Solar Extension 12/21/2010 12/31/2011
17 Blue Water Renewables - Smiths Creek Landfill 3.2 MW $99.00/MWh 20 Years Landfill Unsolicited 1/20/2011 12/31/2011
18 Gratiot County Wind
110.4 MW $91.43/MWh Up to $94.43/MWh
20 Years
Wind 8/18/2009 9/14/2010
05/1/2012 89.6 MW Company Owned Company Owned 03/31/2012
49

Appendix F- Contract Summary
DTE Electric Company : Contracts Map Key Seller Quantity Cost* Term
Renewable Energy Type
Request for Proposal
Commission Approval
Commercial Operation Date
19 WM Renewable Energy - Eagle Valley Landfill 3.2 MW
Combined average price of $98.94/MWh
20 years Landfill 8/18/2009 8/10/2010 6/1/2011
20 L’Anse Warden Electric Company
17 MW 20 years Biomass 8/18/2009 8/10/2010 7/1/2010
21
Boyce Hydro**
Firm 210,000 RECs w/additional 112,000 RECs dependent on generation $7.75/ REC 7 Years Hydro 12/23/2009 4/27/2010 3/16/2010
16 Nova Consultants Up to 3 MW Up to $18 Million Company Owned Solar 11/23/2009 3/2/2010 12/31/2010
22 Heritage Sustainable Energy Stoney Corners Wind Farm 12.2 MW
Unchanged from original contract 20 Years Wind Unsolicited 12/1/2009 1/1/2011
23 UPPCO** Firm 500,000 RECs
Combined average price of $12.46/REC
7 Years Hydro 12/23/2009 12/1/2009 10/1/2009
Not Shown Sterling Planet** Firm 2,500,000 RECs 10 Years MISC 12/23/2009 12/1/2009 10/1/2009
22 Heritage Sustainable Energy Stoney Corners Wind Farm 14 MW $116.00/MWh 20 Years Wind Unsolicited 4/30/2009 12/21/2009
Total 990.65 MW
* Per MWh prices represent levelized costs. ** Pre-existing projects prior to 2008 PA 295 - The commercial operation date would refer to the effective date of the contract. ***Staff calculated levelized cost
Alpena Power Company : Contracts
Seller Quantity Cost Term Renewable Energy Type
Request for Proposal
Commission Approval
Commercial Operation Date
26 Consumers Energy "Bulk of RECs needed to meet the RPS"
Consumers Energy Company’s Average Cost of RECs 20 Years MISC Unsolicited 9/15/2009 8/4/2009
AEP/Indiana Michigan : Contracts
Seller Quantity Cost Term Renewable Energy Type
Request for Proposal
Commission Approval
Commercial Operation Date
Fowler Ridge Wind Farm II 50 MW (7.5MW for MI) Redacted 20 Years Wind Unsolicited 9/15/2009 2/15/2010
100 MW (60MW for MI) Redacted 20 years Wind Competitive Solicitation 8/25/2011 12/31/12 Wildcat I Wind Farm, LLC
Wisconsin Electric Power Company : Contracts
Seller Quantity Cost Term Renewable Energy Type
Request for Proposal
Commission Approval
Commercial Operation Date
Cadillac Renewable Energy. LLC REC-Only Redacted Redacted Redacted Biomass Competitive Solicitation 01/23/2014 Redacted
50
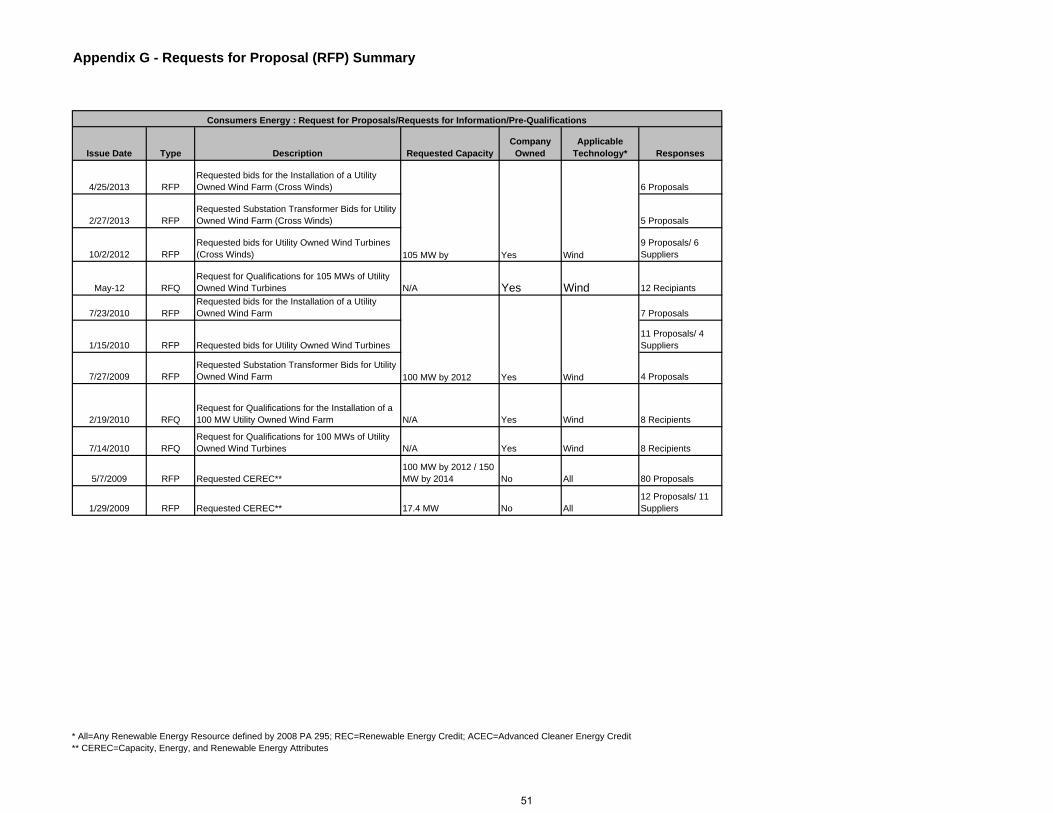
Appendix G - Requests for Proposal (RFP) Summary
Issue Date Type Description Requested CapacityCompany
OwnedApplicable
Technology* Responses
4/25/2013 RFPRequested bids for the Installation of a Utility Owned Wind Farm (Cross Winds) 6 Proposals
2/27/2013 RFPRequested Substation Transformer Bids for Utility Owned Wind Farm (Cross Winds) 5 Proposals
10/2/2012 RFPRequested bids for Utility Owned Wind Turbines (Cross Winds)
9 Proposals/ 6 Suppliers
May-12 RFQRequest for Qualifications for 105 MWs of Utility Owned Wind Turbines N/A Yes Wind 12 Recipiants
7/23/2010 RFPRequested bids for the Installation of a Utility Owned Wind Farm 7 Proposals
1/15/2010 RFP Requested bids for Utility Owned Wind Turbines11 Proposals/ 4 Suppliers
7/27/2009 RFPRequested Substation Transformer Bids for Utility Owned Wind Farm 4 Proposals
2/19/2010 RFQRequest for Qualifications for the Installation of a 100 MW Utility Owned Wind Farm N/A Yes Wind 8 Recipients
7/14/2010 RFQRequest for Qualifications for 100 MWs of Utility Owned Wind Turbines N/A Yes Wind 8 Recipients
5/7/2009 RFP Requested CEREC** 100 MW by 2012 / 150 MW by 2014 No All 80 Proposals
1/29/2009 RFP Requested CEREC** 17.4 MW No All12 Proposals/ 11 Suppliers
Consumers Energy : Request for Proposals/Requests for Information/Pre-Qualifications
100 MW by 2012 Yes Wind
105 MW by Yes Wind
* All=Any Renewable Energy Resource defined by 2008 PA 295; REC=Renewable Energy Credit; ACEC=Advanced Cleaner Energy Credit ** CEREC=Capacity, Energy, and Renewable Energy Attributes
51
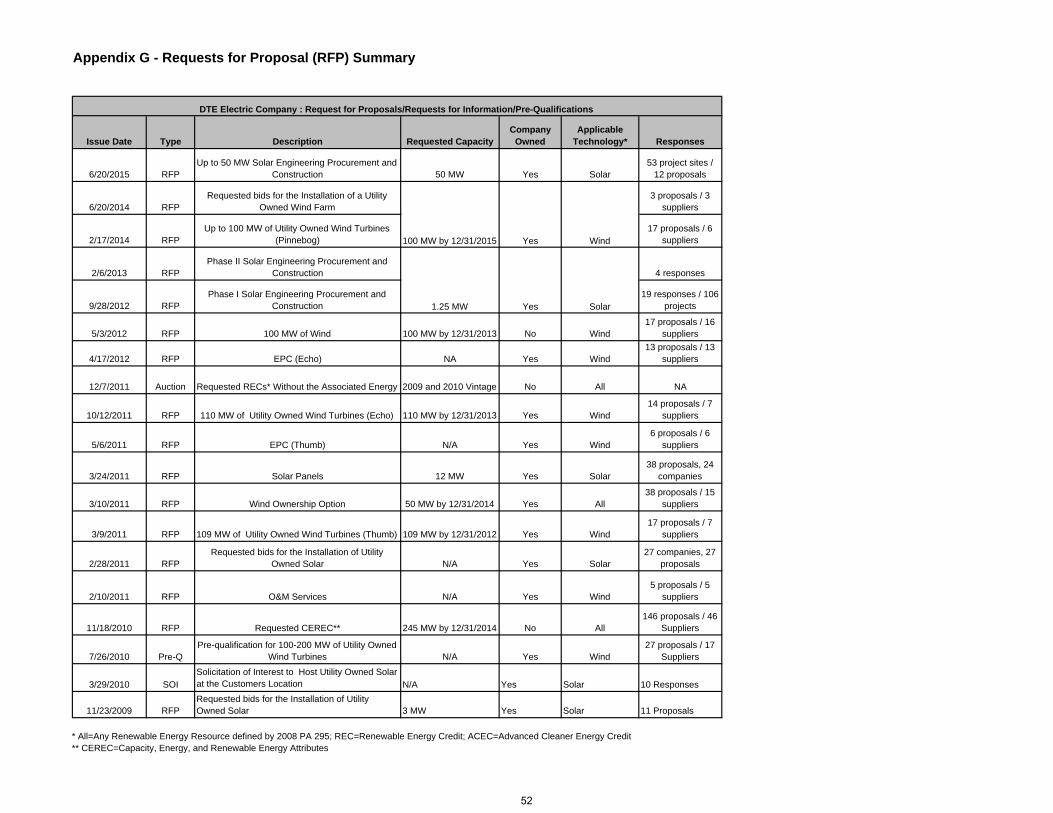
Appendix G - Requests for Proposal (RFP) Summary
Issue Date Type Description Requested CapacityCompany
OwnedApplicable
Technology* Responses
6/20/2015 RFPUp to 50 MW Solar Engineering Procurement and
Construction 50 MW Yes Solar53 project sites /
12 proposals
6/20/2014 RFPRequested bids for the Installation of a Utility
Owned Wind Farm3 proposals / 3
suppliers
2/17/2014 RFPUp to 100 MW of Utility Owned Wind Turbines
(Pinnebog)17 proposals / 6
suppliers
2/6/2013 RFP Phase II Solar Engineering Procurement and
Construction 4 responses
9/28/2012 RFP Phase I Solar Engineering Procurement and
Construction 19 responses / 106
projects
5/3/2012 RFP 100 MW of Wind 100 MW by 12/31/2013 No Wind17 proposals / 16
suppliers
4/17/2012 RFP EPC (Echo) NA Yes Wind13 proposals / 13
suppliers
12/7/2011 Auction Requested RECs* Without the Associated Energy 2009 and 2010 Vintage No All NA
10/12/2011 RFP 110 MW of Utility Owned Wind Turbines (Echo) 110 MW by 12/31/2013 Yes Wind14 proposals / 7
suppliers
5/6/2011 RFP EPC (Thumb) N/A Yes Wind6 proposals / 6
suppliers
3/24/2011 RFP Solar Panels 12 MW Yes Solar38 proposals, 24
companies
3/10/2011 RFP Wind Ownership Option 50 MW by 12/31/2014 Yes All38 proposals / 15
suppliers
3/9/2011 RFP 109 MW of Utility Owned Wind Turbines (Thumb) 109 MW by 12/31/2012 Yes Wind17 proposals / 7
suppliers
2/28/2011 RFPRequested bids for the Installation of Utility
Owned Solar N/A Yes Solar27 companies, 27
proposals
2/10/2011 RFP O&M Services N/A Yes Wind5 proposals / 5
suppliers
11/18/2010 RFP Requested CEREC** 245 MW by 12/31/2014 No All146 proposals / 46
Suppliers
7/26/2010 Pre-QPre-qualification for 100-200 MW of Utility Owned
Wind Turbines N/A Yes Wind27 proposals / 17
Suppliers
3/29/2010 SOISolicitation of Interest to Host Utility Owned Solar at the Customers Location N/A Yes Solar 10 Responses
11/23/2009 RFPRequested bids for the Installation of Utility Owned Solar 3 MW Yes Solar 11 Proposals
1.25 MW Yes Solar
Yes Wind 100 MW by 12/31/2015
DTE Electric Company : Request for Proposals/Requests for Information/Pre-Qualifications
* All=Any Renewable Energy Resource defined by 2008 PA 295; REC=Renewable Energy Credit; ACEC=Advanced Cleaner Energy Credit ** CEREC=Capacity, Energy, and Renewable Energy Attributes
52

Appendix G - Requests for Proposal (RFP) Summary
10/23/2009 Pre-QPre-Qualification for the Installation of 3 MW of Utility Owned Solar N/A Yes Solar 30 Responses
8/18/2009 RFP Joint Development for Utility Owned Wind 75 MW by 12/31/2011 Yes Wind12 Proposals/ 9 Suppliers
8/18/2009 RFP Requested CEREC** 106 MW by 12/31/2011 No All
35 Proposals/ 21 Suppliers
5/22/2009 RFIRequest for Information for the Joint Development of Wind Farms N/A Yes Wind
155 Registered 27 Responses
12/23/2008 RFPRequested RECs* and ACECs* Without the Associated Energy 250,000 RECs*/Year No All
43 Proposals/ 11 Suppliers
* All=Any Renewable Energy Resource defined by 2008 PA 295; REC=Renewable Energy Credit; ACEC=Advanced Cleaner Energy Credit ** CEREC=Capacity, Energy, and Renewable Energy Attributes
53

Map Key Renewable Project Name County Capacity
(MW) Type Power Purchaser Commercial Operation Date
14 Freemont Community Digester Newaygo 3.1 Anaerobic Digester Consumers Energy 2012
5, 15 Scenic View Dairy - 2 Locations Allegan & Barry 1.2 Anaerobic Digester Consumers Energy 2009 - 2010
20 L'Anse Warden Baraga 17 Biomass DTE 2010
21.3 MW
12 Elk Rapids Hydro Antrim 0.7 Hydro DTE Pre-Act 295 Project
0.7 MW
19 Eagle Valley Landfill Oakland 3.2 Landfill Gas DTE 2011
11 Lennon Generation Station Shiawassee 1.6 Landfill Gas Consumers Energy 2010
10 Northern Oaks Landfill Clare 1.6 Landfill Gas Consumers Energy 2010
9 Pine Tree Acres Landfill Macomb 12.8 Landfill Gas Consumers Energy 2012
17 Smith's Creek Landfill St. Clair 3.2 Landfill Gas DTE 2011
13 Zeeland #2 Ottawa 1.6 Landfill Gas Consumers Energy 2009
24 MW
4 Experimental Advanced Renewable Program Varies 6 Solar Consumers Energy 2009-Present
DTE Solar Lapeer/Wayne 50 Solar DTE Owned 2016
Solar Gardens Varies 5 Solar Consumers Energy Owned 2016
16 SolarCurrents Varies 22 Solar DTE Owned and Customer Owned 2009 - Present
83 MW
34 Apple Blossom Huron 100 Wind Consumers Energy December 2016
28 Beebe Gratiot 81 Wind Consumers Energy December 2012
33 Big Turtle Huron 20 Wind DTE December 2014
31 Brookfield Huron 74.8 Wind DTE Owned February 2014
34 Cross Winds Tuscola 105.4 Wind Consumers Energy Owned December 2014
30 Echo Huron 112 Wind DTE Owned September 2014
Fowler Ridge II (MI Allocation)
Benton County, Indiana 7.5 Wind Indiana Michigan 2010
2 Garden I Delta 28 Wind Consumers Energy & DTE September 2012
18 Gratiot County Gratiot 212.8 Wind DTE & DTE Owned June 2012
7 Harvest II Huron 59.4 Wind Consumers Energy November 2012
1 Lake Winds Mason 100.8 Wind Consumers Energy Owned November 2012
27 McKinley Huron 14.4 Wind DTE Owned December 2012
8 Michigan Wind II Sanilac 90 Wind Consumers Energy January 2012
27 Minden Sanilac 32 Wind DTE Owned December 2012
31 Pheasant Run Huron 74.8 Wind DTE December 2013
35 Pinnebog Huron 51 Wind DTE Owned December 2016
27 Sigel Huron 64 Wind DTE Owned December 2012
3 Stoney Corners Missaukee & Osceola 60 Wind Consumers Energy & DTE October 2012
25 Tuscola Bay Wind Tuscola, Bay & Saginaw 120 Wind DTE December 2012
29 Tuscola Bay Wind II Tuscola & Bay 100 Wind DTE November 2013
Wildcat I (MI Allocation)Madison &
Tipton Counties, Indiana
60 Wind Indiana Michigan 2012
1,568 MW
1,697 MW
Appendix H - PA 295 CONTRACT RENEWABLE ENERGY PROJECTS
MPSC Rate Regulated Electric Providers
Total Act 295 Contracts
Wind Total
Solar Total
Landfill Gas Total
Biomass Total
Hydro Total
54

Project Name County Capacity (MW) Turbine Size (MW)
Number of Turbines
Turbine Manufacturer Developer Power Purchaser Commercial Operation
Date
Apple Blossom Huron 100 3.3 30 Geronimo Energy Consumers Energy Expected 12/31/2016
Beebe Gratiot 81 2.4 34 Nordex Exelon & Great Lakes Wind Consumers Energy December 2012
Beebe 1B Gratiot 50.4 2.4 21 Nordex Exelon Municipal Utility December 2014
Big Turtle Huron 20 2.0 10 Gamesa Heritage Sustainable Energy DTE December 2014
Big Turtle II Huron 30 2.0 15 Gamesa Heritage Sustainable Energy Expected 12/31/2016
Brookfield Huron 74.8 1.7 44 GE Energy NextEra Energy DTE February 2014
Cross Winds Tuscola 105.4 1.7 62 GE Energy Consumers Energy N/A December 2014
Deerfield Wind Huron 150 2 72 Vestas RES Americas Wolverine Power Cooperative Expected 12/31/2016
Echo Huron 112 1.6 70 GE Energy DTE N/A September 2014
Garden I Delta 28 2.0 14 Gamesa Heritage Sustainable Energy Consumers Energy** September 2012
Gratiot County Gratiot 212.8 1.6 133 GE Energy Invenergy & DTE DTE June 2012
Harvest Huron 52.8 1.65 32 Vestas Exelon Wolverine Power Cooperative 2008
Harvest II Huron 59.4 1.8 33 Vestas Exelon Consumers Energy November 2012
Lake Winds Mason 100.8 1.8 56 Vestas Consumers Energy N/A November 2012
Mackinaw City Emmet 1.8 0.9 2 NEG Micon Mackinaw Power Consumers Energy 2001
McKinley Huron 14.4 1.6 9 GE Energy DTE N/A December 2012
Michigan Wind I Huron 69 1.5 46 GE Energy Exelon Consumers Energy 2008
Michigan Wind II Sanilac 90 1.8 50 Vestas Exelon Consumers Energy January 2012
Michigan Wind III Sanilac 153 2.4 63 Nordex Exelon Wolverine Power Cooperative Expected 12/31/2016
Minden Sanilac 32 1.6 20 GE Energy DTE N/A December 2012
Pheasant Run Wind Huron 74.8 1.7 44 GE Energy NextEra Energy DTE December 2013
Pinnebog Huron 51 1.7 30 GE Energy DTE DTE Expected 12/31/2016
Sigel Huron 64 1.6 40 GE Energy DTE N/A December 2012
Stoney Corners Missaukee & Osceola 60 2 - 2.5 29
Repower, Fuhrlander,
Northern Power Systems
Heritage Sustainable Energy
Consumers Energy, DTE, Traverse City
Light & Power2008 - October 2012
Tuscola Bay Wind Tuscola, Bay & Saginaw 120 1.6 75 GE Energy NextEra Energy DTE December 2012
Tuscola Wind II Tuscola & Bay 100.3 1.7 59 GE Energy NextEra Energy DTE Electric November 2013
2,007.7 MW 1,093 TurbinesOperational Totals 1,523.7 MW 883 Turbines
**Heritage may supply power and RECs from this wind farm to DTE under an “additional supply” provision in a separate contract. * Prepared by MPSC Staff and includes all wind farms operational, planned or under contract with an MPSC-rate-regulated electric provider. Additional wind farms are included as MPSC Staff becomes aware of the pro
Totals
Bold text indicates the wind farm is operational.
Michigan Utility Scale Wind Farms*Appendix I - Michigan Utility Scale Wind Farms
55

Apple Blossom, 100 MW
Beebe Wind, 81 MW
Beebe 1B, 50.4 MW
Big Turtle, 20 MW
Big Turtle II, 30 MW
Brookfield, 74.8 MW
Crosswinds, 105 MW
Deerfield Wind, 150 MW
Echo Wind, 112 MW
Garden Wind Farm, 28 MW
Gratiot County Wind, 212.8 MW
Harvest I Wind, 52.8 MW
Harvest II Wind, 59.4 MW
Lake Winds Energy Park, 100.8 MW
Mackinaw City, 1.8 MW
McKinley, 14.4 MW
Michigan Wind I, 69 MW
Michigan Wind II, 90 MW
Michigan Wind III, 153 MW
Minden, 32 MW
Pheasant Run Wind, 74.8 MW
Pinnebog, 51 MW
Sigel, 64 MW
Stoney Corners, 60 MW
Tuscola Bay Wind, 120 MW
Tuscola Bay Wind II, 100 MW
1523.7 MW Total Operational
Wind Energy Zone (Region 1)
Primary Wind Energy Zone (Region 4)
3
7 6 11
4
15
2
1
12
9 13
5 10
8
Currently Operational Under Development
Map includes wind farms currently operating or under development for MPSC rate-regulated electric providers.
14
17
18
19
16
21
16
2
3
4
5
6
7 8
9 10
11
18
12
21
14
15
13
19
20
1
17
20
22
22
23
24
25
26
23
24
25
26
Appendix I
Michigan Wind Farm Map
56