Report on the Ghana Urban Malaria Study - JSI
112
Transcript of Report on the Ghana Urban Malaria Study - JSI


ii
This study is made possible by the generous support of the American people through the United States
Agency for International Development (USAID) and the U.S. Centers for Disease Control and Prevention (CDC).
The contents are the responsibility of JSI Research & Training Institute, Inc. and do not necessarily reflect the
views of USAID, CDC, or the United States government.

iii
ACKNOWLEDGEMENTS The Ghana Urban Malaria Study was fully funded by the President’s Malaria Initiative (PMI) through the USAID Focus Region Health Project (USAID/FRHP), which is a four-year (2009 – 2013) project funded by the United States Agency for International Development (USAID) through Cooperative Agreement #641-A-00-09-00030-00 and implemented by JSI Research & Training Institute, Inc. The Ghana Urban Malaria Study, and its use of the triangulation methodology, was proposed by the CDC PMI Resident Advisor in Accra, Dr. Paul Psychas.
USAID/FRHP works closely with the Ministry of Health and the Ghana Health Service as well as the private sector to strengthen access to and use of quality maternal, newborn and child health, family planning, malaria, and HIV prevention and treatment services in the Greater Accra, Central, Western, Eastern, and Ashanti Regions of Ghana. The project also seeks to strengthen health systems and management of services in these regions.

iv
EXECUTIVE SUMMARY
Background
The Ghana Urban Malaria Study aims for policy making, public health programming and health practice to be well-informed by key findings on urban malaria in Ghana. The exercise was undertaken by the USAID-funded USAID Focus Regions Health Project (USAID/FRHP), in collaboration with the U.S. President’s Malaria Initiative (PMI), the Ghana Health Service/ National Malaria Control Programme (NMCP), and the University of Ghana School of Public Health.
In line with the triangulation method, the specific questions to be addressed by the Ghana Urban Malaria Study were defined by a group of stakeholders who met in Accra on 18 and 19 September, 2012. They identified four broad topics to be studied:
1. What evidence is there that the burden of malaria is lower in urban areas than in rural areas?
2. What are the most important determinants of the burden of malaria within urban areas?
3. How does coverage with malaria control interventions differ between urban and rural areas?
4. What are some important determinants of the coverage of urban areas with malaria control interventions?
A team of analysts including an international public health consultant, a Ghanaian statistician and two residents of the University of Ghana School of Public Health set out to compile all available research studies, survey datasets, and routine health data which were relevant to these questions. They assembled and conducted further analyses with a collection of data from 19 research studies, four large household surveys and all data reported by health facilities to the Ghana Health Service each month since January 2011 on outpatient malaria morbidity and malaria testing.
The findings from these analyses were presented at follow-up meetings held in Accra on 20 and 21 November, 2012 with staff of the National Malaria Control Programme (NMCP) and, again, with the stakeholder group. This report presents findings from the stakeholder reviews as well as results from analyses which have subsequently been completed. Conclusions and recommendations that emerged from the meetings with NMCP and the stakeholders are also presented. Findings
SUMMARY OF THE EVIDENCE THAT THE BURDEN OF MALARIA IS LOWER IN URBAN AREAS THAN
IN RURAL AREAS
There is compelling evidence from entomological studies, community prevalence studies and the 2011 Multiple Indicator Cluster Survey (MICS) that the burden of malaria

v
is significantly lower in Accra, Kumasi and Tamale than in smaller communities located in the same ecological zone. Compared to children living in smaller communities of the same ecological zone, the prevalence of malaria parasitemia among children living in the largest cities of each zone was 73% to 86% lower in Accra, 79% to 85% lower in Kumasi, and 34% to 68% lower in Tamale.
As a result of presumptive diagnosis, incompleteness of reporting, uncertainty about the catchment population, and differences in care seeking practices, the malaria data that is now routinely reported by health facilities is not sufficiently reliable to reach robust conclusions about urban/rural differences in the burden of malaria. The available data suggest that less than one third of malaria diagnoses are confirmed with laboratory tests and that, regardless of the season, clinical staff in all parts of the country diagnose roughly 40% to 50% of all sick children as having “malaria.”
The malaria testing positivity rate (TPR) has potential as an indicator of malaria burden that is relatively robust. It can be calculated for each health facility even when data for some months are missing and even when the catchment population of the health facility is uncertain. However, there are major problems with the quality and completeness of malaria testing data that are now captured by the DHIMS database of the GHS.
SUMMARY OF THE EVIDENCE REGARDING THE DETERMINANTS OF THE BURDEN OF MALARIA
WITHIN URBAN AREAS
Research studies as well as the 2011 MICS show that malaria transmission and the prevalence of malaria parasitemia vary greatly between neighborhoods of Accra and Kumasi:
• Transmission of malaria (as measured by the entomological inoculation rate or EIR) and prevalence of malaria parasitemia in children are, on average, higher near areas of urban agriculture;
• The prevalence of malaria parasitemia among children living in the poorest households in Accra and Kumasi is 50% to 100% higher than the average for children in these two cities.
However, all neighborhoods and all socio-economic groups within these two cities experience a burden of malaria that is less severe than that found, on average, in rural communities.
HOW DOES COVERAGE WITH MALARIA CONTROL INTERVENTIONS DIFFER BETWEEN URBAN
AND RURAL AREAS?
On average, the populations of Accra and Kumasi are wealthier, better educated and have better access to health facilities than other Ghanaians. Findings from the 2011 MICS show that a higher percentage of residents in these cities have been exposed to malaria control messages. Findings from the 2008 DHS and the 2011 MICS demonstrated important shortcomings of malaria control activities in these cities.

vi
Shortcomings of household practices in Accra and Kumasi included:
• Failure in some households to make use of ITNs to protect children;
• Widespread failure to treat childhood fever promptly with anti-malarials.
Shortcomings of the health systems of Accra and Kumasi included:
• Delays in distribution of ITNs (this shortcoming was addressed by the end of 2012);
• Missed opportunities to administer intermittent presumptive treatment (IPT) at antenatal care (ANC) clinics;
• Insufficient laboratory testing for malaria and, as a result, incorrect presumptive diagnosis of patients who had fevers from causes other than malaria;
• Inadequate reporting of lab testing.
WHAT ARE SOME IMPORTANT DETERMINANTS OF THE COVERAGE OF URBAN AREAS WITH
MALARIA CONTROL INTERVENTIONS?
Findings from sub-national studies show that urban poverty is associated with poorer quality of care for febrile diseases. This includes inadequate use of anti-malarials and less use of laboratory testing.
Recommendations
RECOMMENDATIONS TO INFORM AND GUIDE HEALTH PROFESSIONALS IN GHANA’S CITIES:
With in-service training, supervision, monitoring and feedback, health professionals practicing in Ghana’s cities should:
1. Be made more aware of the low prevalence of malaria parasitemia in most neighborhoods of Accra and Kumasi and some neighborhoods of smaller cities;
2. Be encouraged to perform malaria tests on a higher percentage of suspected malaria cases. To support this, lab capacity and supplies for microscopy and rapid diagnostic testing must be assured;
3. Be encouraged to regularly review and report on the malaria TPR in their facility. Researchers and partners should gather further data from sentinel sites;
4. Modify their current practices for diagnosis and treatment of febrile illness to reflect the quite low burden of malaria in the catchment areas of many urban health facilities;
5. Provide IPT to ALL women coming for ANC.

vii
RECOMMENDATIONS FOR STRENGTHENING HOUSEHOLD HEALTH PRACTICES
6. Mass media and other behavior change communication strategies targeting residents of Ghana’s cities should aim to:
• Promote use of ITNs by children and pregnant women;
• Encourage prompt laboratory diagnosis of children sick with fevers;
• Encourage treatment with artemisinin-based combination therapy (ACT) in instances where children are sick with a fever and laboratory confirmation is not obtained.
7. Community-based malaria control interventions to support these objectives should be targeted to the poorest urban households and to urban neighborhoods proven to have a higher burden of malaria.
RECOMMENDATIONS REGARDING CHANGES TO MONITORING AND EVALUATION SYSTEMS
8. For health facilities in Ghana’s cities, records of malaria tests should capture information about the residence of the patient. These records should be periodically analyzed to identify neighborhoods with a higher than average malaria burden;
9. The electronic database of the GHS (DHIMS) should be modified so that all of the data on malaria testing (the number of malaria tests performed and the number of positive malaria tests are now recorded on the Case Reporting Form or CRF) are entered independently from the data on malaria cases (recorded on the Outpatient Morbidity Report);
10. At least once each 5 to 10 years, malaria parasitemia should be measured as part of a national household health survey (MICS and/or Demographic Health survey);
11. Future MICS and DHS surveys should include additional questions to characterize the environment (e.g. proximity to agricultural plots and pools of water) and housing characteristics (e.g. screening);
RECOMMENDATIONS REGARDING FURTHER RESEARCH ON URBAN MALARIA IN GHANA
12. The NMCP should continue efforts to compile reports from all research studies (including unpublished studies) which have measured malaria parasitemia, EIR or intensity of mosquito breeding in specific locations in Ghana. The NMCP should maintain a file of hard and soft copies of these reports so that it can serve as a clearinghouse for such findings;
13. Ghana’s universities and research institutions should be supported to conduct additional studies measuring the prevalence of malaria parasitemia, EIR and/or intensity of mosquito breeding in specific neighborhoods. In particular, additional research should assess the burden of malaria in areas adjacent to urban agriculture and pools of water in cities.

viii
ACRONYMS
ACT Artemisinin-based combination therapy
AGA Anglo Gold Ashanti
AMD Accra Metropolitan District
ANC Antenatal care
AR Ashanti Region
BAR Brong Ahafo Region
CI 95% confidence interval
CR Central region
DHIMS District health information management system of the Ghana Health Service
DHIS District Health Information System software
DHS Demographic and Health Survey
EA Enumeration area
EIR Entomological inoculation rate
FELTP Field epidemiology and laboratory training programme
FRHP Focus Region Health Project
GAR Greater Accra Region
GHS Ghana Health Service
GSS Ghana Statistical Service
Hgb Hemoglobin concentration in grams per deciliter of blood
HRP Histidine rich protein
IEC Information, Education and Communication
IPT Intermittent presumptive treatment (also referred to as intermittent preventive treatment)
ITN Insecticide treated net

ix
KMD Kumasi Metropolitan District
KNUST Kwame Nkrumah University of Science and Technology in Kumasi
MAP Malaria Atlas Project
MARA Mapping Malaria Risk in Africa Project
MICS Multiple indicator Cluster Survey
NMCP National Malaria Control Programme
NR Northern Region
OPD Outpatient department (of a health clinic or hospital)
PMI President’s Malaria Initiative
RDT Rapid diagnostic test
SES Socio-economic status
TPR Test positivity rate (or ratio)
UER Upper East Region
USAID United States Agency for International Development
VR Volta Region
WHSA Women’s Health Study of Accra

10
CONTENTS
ACKNOWLEDGEMENTS ................................................................................................... iii
EXECUTIVE SUMMARY ................................................................................................... iv
ACRONYMS ........................................................................................................................viii
INTRODUCTION ..................................................................................................................... 13
BACKGROUND ON URBAN MALARIA IN GHANA ........................................................... 15
SCOPE OF THE STUDY ........................................................................................................ 15
THE STUDY METHODOLOGY ............................................................................................ 15
Triangulation ................................................................................................................. 15
Stakeholders identified the study questions .............................................................. 16
Stakeholders identified the data sources ................................................................... 17
The team of analysts .................................................................................................... 18
Analytic methods .......................................................................................................... 18
Limitations ..................................................................................................................... 22
INDICATORS OF THE BURDEN OF MALARIA .............................................................24
FINDINGS ................................................................................................................................ 34
What evidence is there that the burden of malaria is lower in urban areas than in rural areas? ............................................. 34
Evidence from entomological studies ......................................................................... 35
Evidence from studies measuring the prevalence of malaria parasitemia .............. 35
Evidence from the 2011 MICS ...................................................................................... 42
Evidence from routine health service data ................................................................. 47
Summary of the evidence that the burden of malaria is lower in urban areas than in rural areas ............................................... 54
What are the most important determinants of the burden of malaria within urban areas? ............................................................ 55
Proximity to urban agriculture ..................................................................................... 56
Household wealth and socio-economic status ........................................................... 58
Use of an ITN ................................................................................................................. 62
Summary of the evidence regarding the determinants of the burden of malaria within cities ........................................... 62

11
How does coverage with malaria control interventions differ between urban and rural areas?................................................. 63
Summary: How does coverage with malaria control interventions differ between urban and rural areas?................................................. 73
What are some important determinants of the coverage of urban areas with malaria control interventions? ....................... 73
Summary: What are some important determinants of the coverage of urban areas with malaria control interventions? ....................... 75
CONCLUSIONS AND DISCUSSION .................................................................................. 78
RECOMMENDATIONS .......................................................................................................... 82
ANNEXES .................................................................................................................... 84
Annex 1: Stakeholders for the Ghana Urban Malaria Study .................................... 84
Annex 2: The team of analysts for the Ghana Urban Malaria Study ....................... 85
Annex 3: Data sources sought for the Ghana Urban Malaria Study ....................... 85
Annex 4: Household survey datasets ......................................................................... 86
Annex 5: Malaria data reported routinely by health facilities in Ghana .................. 89
Annex 6: Publications documenting the burden of urban malaria in Ghana ......... 91
Annex 7: The MARA map ............................................................................................ 95
Annex 8: Map of the prevalence of malaria parasitemia by ecological zone, 2011 MICS ................................................................ 96
Annex 9: Graphs illustrating the seasonality of the breeding of mosquitoes in Accra ...................................................................... 97
Annex 10: An example of variation in the prevalence of malaria parasitemia by age group .......................................................................... 98
Annex 11: Percentage of children with malaria parasitemia (by RDT) .................... 99
Annex 12: Malaria test positivity rates, by ecological zone and districts of Ghana ..............................................................100
Annex 13: Photos of a well, furrows and a water-filled footprint ............................. 102
Annex 14: Percentage of households in each expenditure quintile, by region of Ghana ...................................................... 103
Annex 15: Prompt treatment of fever, by maternal education, 2011 MICS .............. 104
Annex 16: Various indicators, by socio-economic class of the neighborhood, WHSA-II .......................................... 104
Annex 17: Various indicators, by education of the woman, WHSA-II ...................... 106

12
Annex 18: Various indicators, by enrollment in NHIS, WHSA-II ............................... 107
Annex 19: Association of women’s education with household wealth, WHSA-II ... 108
Annex 20: Logistic regression analysis of the association between indicators of SES & 2 malaria control practices, WHSA-II ......................... 109
Annex 21: Prevalence of parasitemia (by microscopy) in children 6 to 59 months, by wealth of household in Accra or Kumasi, 2011 MICS ................... 111
Annex 22: Percentage of children living in households owning an ITN who slept the previous night under an ITN, by size of community (with the 95% confidence interval), 2008 DHS ................................................................................... 111
Annex 23: Percentage of children sick with a fever who were reportedly given either ACT or amodiaquine the same day or the next day after onset of the fever (95% confidence interval), 2011 MICS. ......................................... 111

13
INTRODUCTION
The Ghana Urban Malaria Study aims for policy making, public health programming, and health practice to be well-informed by a synthesis of key findings on urban malaria in Ghana. The exercise was undertaken by the USAID-funded Focus Region Health Project (USAID/FRHP), in collaboration with the President’s Malaria Initiative (PMI), the National Malaria Control Programme (NMCP), and the University of Ghana School of Public Health FELTP1 program.
The study used a triangulation methodology,2 compiling existing data and further analyzing it to achieve two objectives:
1. To assess the malaria burden in the major cities of Ghana;
2. To better understand the implications of these findings for malaria control in Ghana.
URBAN MALARIA IN GHANA
Malaria is the leading cause of morbidity and mortality in Ghana, reported to be responsible for over a third of all outpatient cases noted each year3, 20%4 to 30% of deaths in children under five years of age and 11% of maternal deaths.3
Most of what is understood about the epidemiology and control of malaria in Ghana and elsewhere in sub-Saharan Africa comes from research focused on rural areas. Yet a large and growing percentage of Ghanaians live in cities. The year 2010 national population census found that 48% of Ghanaians lived in urban communities (defined as having a population greater than 5,000) and 24% live in one of the 6 cities with a population greater than 150,000: Accra5, Kumasi, Sekondi-Takoradi, Tamale, Obuasi, and Cape Coast. The percentage of Ghanaians living in urban communities is projected to grow to 63% by 2025.6
1 Field Epidemiology and Laboratory Training Program.
2 Rutherford, GW, et al. (2010) Public health triangulation: approach and application to synthesizing data to understand national and local HIV epidemics. BMC Public Health, 10: 447.
3 Strategic Plan for Malaria Control in Ghana: 2008 – 2015. Ghana Ministry of Health, 2008.
4 World Malaria Report (2008) World Health Organization. Note that the lower estimates from WHO take into account that 40% or more of childhood deaths occur at home and malaria is frequently over-diagnosed at health facilities.
5 For the purposes of this study, Accra is defined by the boundaries of 5 districts within the Greater Accra Re-gion: Accra Metropolitan Authority, Ledzokuku Krowor, Tema and Ashaiman.
6 These various statistics and projections are taken from the 2010 presentation of George Owusu entitled “Ur-ban development trends in Ghana and Accra.” Dr. George Owusu is a Senior Research Fellow at the Insti-tute of Statistical, Social and Economic Research of the University of Ghana at Legon. These statistics and projections are based upon data collected with the year 2000 national population census. At the time that this protocol was written, the authors did not yet have access to comparable statistics and projections from the year 2010 national population census.

14
Malaria policy in Ghana has been shaped by routine health service data and national surveys suggesting that malaria is highly prevalent throughout the country. National surveys in Ghana7,8,9 have shown that children residing in urban settings are almost as likely as children in rural settings to have experienced fever in the preceding 2 weeks.10 However, urban studies in Ghana11 and other malaria-endemic countries12 have demonstrated that at least half of children with fever have no laboratory evidence of malaria. Data on malaria cases reported by health facilities are also difficult to interpret because health practitioners usually rely upon presumptive diagnoses without laboratory confirmation.
7 Multiple Indicator Cluster Survey (2006) Ghana Statistical Service.
8 Demographic and Health Survey (2008) Ghana Statistical Service.
9 Multiple Indicator Cluster Survey (2011) Ghana Statistical Service.
10 The percentages of children under five reported to have had fever in the preceding two weeks in rural vs. urban
communities was 24% vs. 20% in the 2006 MICS; 21% vs. 19% in the 2008 DHS; and 22% vs. 15% in the 2011 MICS.
11 Klinkenberg et al. (2005) High malaria prevalence and urban agriculture in Accra, Ghana. Emerging Infectious
Diseases 11, 1290–1293.
12 Wang et al. (2005) Rapid urban malaria appraisal (RUMA) in sub-Saharan Africa. Malaria Journal 2005, 4:40.
Takoradi Harbour
Accra
Kumasi
Tamale

15
Research carried out elsewhere in sub-Saharan Africa13,14,15 has shown that the Anopheles mosquitoes which transmit malaria are significantly less common in large cities than in rural areas, although breeding does take place in some urban sites. To date, scientific stud-ies on urban malaria in Ghana have focused on a few neighborhoods of Accra and Kumasi yielding heterogeneous findings from one neighborhood to another, one season to an-other, or one year to another.
The available evidence on urban malaria in Ghana has yet to be systematically compiled, interpreted, and used to draw conclusions. As a result, urban malaria in Ghana is still not widely understood and malaria policies, public health programming, and health care practice are often based on the assumption that malaria is almost uniformly hyper-endemic throughout the nation. The Ghana Urban Malaria Study was designed to shed light on this issue.
STUDY SCOPE
The study assessed malaria burden and malaria control activities in urban areas (i.e. communities with a population greater than 5,000) nationwide with a special focus on the 6 cities with populations greater than 150,000:16 Accra (2,670,155), Kumasi (2,035,064), Sekondi-Takoradi (559,548), Tamale (371,351), Obuasi (168,641), and Cape Coast (169,894).
STUDY METHODOLOGY
Triangulation
A triangulation approach was used for the study. As defined by Rutherford, “Public health triangulation is a process for reviewing, synthesizing and interpreting secondary data from multiple sources that bear on the same question to make public health decisions. “Triangulation involves examining multiple data sources to validate results, increase credibility and gain a more detailed understanding of findings.”17
Unlike conventional research methodologies relying on statistical tests, triangulation seeks to establish the external validity of available data and justify its conclusions based on the consistency and overall plausibility of a broad range of evidence.
By using pre-existing data, a triangulation exercise can be completed relatively rapidly and at relatively low cost. Review and analysis of data from multiple sources reveals new questions to be studied, permits verification, and reduces the likelihood of bias.
13 Robert et al. (2003) Malaria transmission in urban sub-Saharan Africa. Am. J. Trop. Med. Hyg. 68, 169–176.
14 Donnelly et al. (2005) Malaria and urbanization in sub-Saharan Africa. Malaria Journal 2005, 4:12.
15 Keiser et al. (2004) Urbanization in sub-Saharan Africa and implication for malaria control. Am. J. Trop. Med. Hyg.,
71(Suppl 2), 2004, pp. 118–127.
16 The populations cited are as of the 2010 census. Accra is defined as the combined populations of Accra Metropoli-
tan District, Ledzokuku/Krowor, Tema and Ashaiman districts.
17 Rutherford, GW, et al. (2010) Public health triangulation: approach and application to synthesizing data to under-
stand national and local HIV epidemics. BMC Public Health, 10: 447.

16
Stakeholders identified the study questions
In line with the triangulation method, the specific questions to be addressed by the Ghana Urban Malaria Study were defined by a group of 20 participants with diverse expertise in public health, medicine, administration, sociology, and research. The stakeholders, representing 18 different stakeholder organizations, met in Accra on 18 and 19 September (see list in Annex 1).
The stakeholders prioritized study questions based upon:
• The public health importance of the question; and
• Whether data of sufficient quality and scope have already been collected and are available for further analysis.
Following presentations summarizing current knowledge about urbanization and urban malaria in Ghana, the stakeholders worked in small groups then in plenary to identify and discuss possible questions for the study to address. A small subset of these questions related to the impact of malaria control interventions in urban areas. Participants discussed whether data were available to answer each of the proposed questions and sub-questions. They agreed that data were likely to be available to attempt to answer each question and sub-question except for the questions related to assessing the impact of malaria control interventions. Participants reached a consensus that the Ghana Urban Malaria Study should focus on the remaining questions and that these could be grouped into 4 broad topics as given in Box 1.
Box 1: Questions to be addressed by the Ghana Urban Malaria Study
1. What evidence is there that the burden of malaria is lower in urban areas than in rural areas?
2. What are the most important determinants of the burden of malaria within urban areas?
3. How does coverage with malaria control interventions differ between urban and rural areas?
4. What are some important determinants of the coverage of urban areas with malaria control interventions?

17
Participants at the stakeholders’ meeting specified what they would find to be the most compelling evidence that the burden of malaria was lower in urban areas:
• Incidence of reported, lab-confirmed malaria cases;
• Prevalence of malaria parasitemia in children;
• Prevalence of anemia in pregnant women and children;
• Rate of mortality in children attributed to malaria;
Participants said that they would find findings on the EIR or the malaria TPR less compelling, perhaps because these indicators are not as widely understood.
Stakeholders identified the data sources
The experts meeting on 18 and 19 September 2012 also identified the sources of data likely to be available to address these priority questions. As listed in Annex 3, these included household surveys (both those with a nationwide sample and those focused exclusively on Accra), data reported monthly by health facilities in Ghana, and reports of previous studies documenting the burden of urban malaria in specific communities.
The Ghana Statistical Service granted access to the datasets for the 2011 MICS, the 2008 DHS, and the 2006 MICS. The Ghana Statistical Service was also able to provide information about the location of the enumeration areas sampled for the 2011 MICS and the 2008 DHS but not for the 2006 MICS. This permitted households surveyed for the 2011 MICS and the 2008 DHS to be mapped to specific Ghanaian cities.18 Data from the 2010/2011 urban MICS and the 2007 District MICS could not be obtained in time for the study. As these datasets included no data on biomarkers, it was felt that further analysis of their data would add little to the findings of the study. Investigators with Harvard University granted access to the WHSA-II dataset. Annex 4 provides further description of this and the other survey datasets obtained.
The Ghana Health Service granted access to their DHIMS routine health service data on outpatient malaria cases and malaria testing from 2011 and 2012. This included data from the Outpatients Morbidity Form and the Case Reporting Form (CRF) which each of approximately 3,000 health facilities nationwide have been asked to submit every month since 2011. Annex 5 provides further description of the data reported with these two forms.
18 The datasets for the nationally representative surveys (i.e. 2011 MICS, 2008 DHS, 2006 MICS) specify for each
household the EA numbers, the region and whether the household is in an urban area (i.e. a community with a
population of at least 5,000) or a rural area. This information is not sufficiently precise for purposes of answering
the questions of interest (e.g. Is the burden of malaria in cities significantly different from the burden outside of
cities?).

18
A systematic internet search19 was used to compile reports of 19 previous studies documenting the burden of urban malaria in Ghana. Twelve of these studies were conducted during the last 10 years. Annex 6 provides further description of these studies and their findings. A report from the Labiofam project was also reviewed.20 Findings from the articles identified through internet search were supplemented with data compiled by the Malaria Atlas Project (http://www.map.ox.ac.uk/explorer/) from an additional 7 research reports documenting the prevalence of malaria parasitemia in Ghanaian children. This included data from the baseline community prevalence survey performed in Obuasi by researchers of the Noguchi Memorial Institute for Medical Research immediately prior to the launch of Anglo Gold Ashanti’s Indoor Residual Spraying program.
As part of the literature search, over 1,000 documents were reviewed in the library of the National Malaria Control Programme. Unfortunately, however, this collection included only one report of any study21 documenting the prevalence of malaria parasitemia or the EIR in any site in the country.
The team of analysts
To conduct further analysis for the Ghana Urban Malaria Study, a four-person team of analysts was assembled consisting of the lead consultant, a statistician, and two residents of the Field Epidemiology and Laboratory Training Programme (FELTP) of the School of Public Health of the University of Ghana (see Annex 2).
Analytic methods
Household surveys
The first step in the analysis of data from the nationwide household surveys (2011 MICS and 2008 DHS) was to identify which households in the sample were located in each of five classes of community size:
1. Large city -- Contiguous urban areas with a population greater than 1,000,000. Ghana has only two large cities and they each had a population greater than 2,000,000 as of the 2010 census. For purposes of the analysis, Kumasi was assumed
19 The search used all combinations of the following key words: location (Ghana or Accra or Kumasi or Sekondi or
Takoradi or Tamale or Obuasi or Cape Coast) & malaria indicator (parasitemia or EIR or Anopheles). The search
focused on articles contained in the Medline database of the National Library of Medicine (which, since 2005
has included all articles of the Ghana Medical Journal) as well all other documents which could be located using
Google’s search engine. The search focused on documents reporting a measurement of one of the following in-
dicators of the malaria burden: prevalence of malaria parasitemia, EIR or number of breeding sites of Anopheles
species. The search did not attempt to compile documents on malaria which did not report measurements of
these key indicators of the burden of malaria.
20 Labiofam has used targeted larviciding to control the breeding of anopheline mosquitoes in Accra, Kumasi and
Sunyani.
21 Kweku M (2003) The impact of intermittent treatment using SP on malaria morbidity and hemoglobin levels in chil-
dren aged between 9 to 23 months in the Hohoe district of Ghana. This research report documents that during the
rainy season of 2002 and prior to administering SP 42 (27.1%) of 155 children had malaria parasitemia by micros-
copy. The sample was taken from sites scattered between rural and urban areas. The report does not provide data
distinguishing the urban from the rural sample.

19
to be equivalent to Kumasi Metropolitan District (KMD). Population estimates from the 2010 population census and Ghana Health Service (DHIMS) data are readily available for this district.
For the purposes of this study, Accra was assumed to be equivalent to the Accra Metropolitan District (AMD) plus all of three other neighboring districts: Ledzokuku/Krowor, Tema and Ashaiman. Although portions of other adjacent districts could also have been included as part of Accra (e.g Gbawe of Ga West District or Taifa of Ga East District) they were not included for two reasons. First, population estimates from the 2010 census have not yet been released for sub-districts or individual communities smaller than districts. Hence it is not yet possible to estimate the populations living within more extended boundaries. Second, the analysts found no consensus clearly defining such extended boundaries. The resulting four district area, with a combined population of 2,670,155, might be thought of as the central core of what is probably a larger metropolis.22 This has possible implications for the resulting prevalence of malaria parasitemia. Research on urban malaria in other sub-Saharan African countries has shown that in large cities, the prevalence of malaria parasitemia in peri-urban neighborhoods is often intermediate between that of the central core and that of surrounding rural areas.
2. Medium-sized cities – For the purposes of this study, medium sized cities are those with a population between 150,000 and 1,000,000. The population of Sekondi-Takoradi, Ghana’s third largest city, was estimated to be 559,548 by the 2010 census. Hence, Ghana has no cities with populations between this figure and 2,000,000.
3. Small cities – For the purposes of this study, small cities are those with a population between 50,000 and 150,000. 22 urban areas were included in this group.23 For lack of official population estimates from the 2010 census, the population estimates of most of these communities are based upon projections of estimates from the 2000 census.
To “map” households to these and the larger cities of Ghana, documentation from the Ghana Statistical Service was used which listed the district and sub-district of each enumeration area sampled for the 2011 MICS or the 2008 DHS. As discussed above for Accra, it must be acknowledged that cities do not always neatly fit into specific administrative districts or fill-in entire administrative districts. Hence, the result is that some of the enumeration areas said to be located in these cities probably extend beyond their urban boundaries. Or, in other cases, parts of enumeration areas not allocated to these cities might in fact belong to them and share a similar burden of malaria.
4. Rural – These are habitations with a population, as measured by the 2010 census, of less than 5,000. A data field in each DHS or MICS data file clearly distinguishes rural
22 Some have estimated the total population of Accra to be greater than 3,000,000 although it is unclear what
boundaries and what census data were used to arrive at such an estimate.
23 Aflao, Agona Swedru, Akim Oda, Bawku, Berekum, Bolgatanga, Ejura, Gbawe, Ho, Hohoe, Kasoa, Koforidua, Kin-
tampo, Nkawkaw, Nsawam, Mampong, Suhum, Sunyani, Taifa, Techiman, Wa, Yendi.

20
households from urban households (those in communities with a population greater than 5,000). All enumeration areas classified by the Ghana Statistical Service as rural were allocated to this rural group even if they were in districts or sub-districts shared with a city.
Survey datasets were analyzed using STATA software, version 8.0. Statistics were calculated using appropriate weights24 and taking into account the effect of cluster sampling on confidence intervals.25 Socio-economic status of households is typically assessed by use of principal components analysis, which divides a population into quintiles from poorest to wealthiest based on household assets and attributes (e.g. type of toilet, construction of house, etc.). While the MICS and DHS have defined nationwide wealth quintiles in this way, urban households are, on average, wealthier than rural households. For example, 59% of the households of Accra and Kumasi that were sampled for the 2011 MICS were in the top nationwide wealth quintile. Thus, an urban-specific principal components analysis was performed to identify wealth quintiles from among all houses sampled in Accra and Kumasi.
Research studies in specific communities
Data on the prevalence of malaria parasitemia in Ghanaian children was also obtained from 18 research reports. Findings from 8 articles documenting the prevalence among children living in Ghanaian cities were compared with findings from 12 articles documenting the prevalence among children living in smaller communities or rural areas. Ten of these articles were identified through internet search while data from an additional 8 articles were downloaded from the website of the Malaria Atlas Project.26 Together these sources provide findings from microscopic examinations for malaria parasitemia in 19,060 Ghanaian children from 35 locations in cities (Accra, Kumasi, Tamale) and 46 locations in smaller communities or rural areas. Data for 67 of the 81 locations were collected in the last 12 years. Statistics from these data were expanded27 to re-create a dataset that was then analyzed using STATA software.28 Point estimates and confidence intervals based upon the pooled data could then be calculated.
24 For example, for the 2011 MICS, children in the 3 most northern regions of the Ghana were oversampled. To cal-
culate statistics that were nationally representative, a lower weight was assigned to each observation from these
oversampled regions.
25 STATA’s svy commands were used to take into account the wider confidence intervals resulting from cluster sam-
pling. With the cluster sampling used for the MICS, DHS and other household surveys, 95% confidence intervals
are wider than if the same number of households had been selected with simple random sampling. This reflects
the “design effect” of cluster sampling. Fortunately, for various analyses the design effect was always less than
3 and the resulting confidence intervals were not greatly wider than would have applied if the sample had been
selected through simple random sampling (which provides for a design effect of 1).
26 http://www.map.ox.ac.uk/explorer/
27 For example, the MAP Project Excel spreedsheet for Ghana included a row summarizing data collected by Eh-
rhardt et al. in March of 2002. In the town of Savelugu, north of Tamale, 70 children 6 months to 9 year of age were
examined and 26 were found to be parasitemic. This single row of the Excel spreadsheet was expanded to create
70 records (one for each child examined). Twenty six of these records showed that the child was positive for ma-
laria parasitemia while the other 44 records showed that the child was negative.
28 For the STATA analysis of the data from research reports, data from each separate report and each separate loca-
tion were treated as separate clusters. Confidence intervals were calculated using STATA svyset to take into ac-
count the influence of cluster sampling.

21
Twelve studies documented the intensity of malaria transmission or the breeding of Anopheles mosquitoes in specific neighborhoods of Accra and Kumasi. These findings were compared with results from studies in rural areas or smaller communities of Ghana.
Outpatient malaria case and testing data from the Ghana Health Service
With the permission of the Ghana Health Service and with technical support from the Health Information Systems Programme29, nationwide outpatient malaria case and testing data that were reported to the Ghana Health Service since January 2011 were exported from the DHIMS/DHIS database (see Annex 5) to user friendly Microsoft Excel pivot tables. The data in these pivot tables were disaggregated by month since January 2011 and by each health facility registered in the DHIMS system. This permitted analysis at the level of the individual health facility and the level of each month of the completeness and consistency of the data.30
Stratification by ecological zone
Previous research has shown that transmission of malaria in Ghana varies significantly by ecological zone: Transmission is lowest in the coastal south (including Accra and Sekondi-Takoradi), intermediate in the forest zone in the middle of the country (including Kumasi and Obuasi),31 and highest in the northern savannah (including Tamale). This is shown in the map produced by the Mapping Malaria Risk in Africa (MARA) Project32 shown as Annex 7 and the findings from the 2011 MICS shown as Annex 8. To account for the influence of varying regional ecology on the burden of malaria, analyses were stratified by ecological zone. Hence, the findings from each large city were compared to findings from smaller communities or rural areas in the surrounding ecological zone.
Stratification by season
Previous research has also shown that in the dryer ecological zones, the transmission of malaria is markedly lower during the dry season than during the wet season. This was perhaps best documented by Chinery33 who showed by studying the numbers of
29 The Director General of the Ghana Health Service granted access to the nationwide malaria data. Study analysts
then worked with Dr. Anthony Ofosu of the Planning, Policy, Monitoring and Evaluation Directorate (PPMED) of
the Ghana Health Service and with Mr. Ola Titlestad and Mr. Olav Pappe of the University of Oslo/Health Informa-
tion Systems Programme (http://www.hisp.uio.no/) to export the data to a user friendly MS Excel pivot table.
30 Routine service statistics are typically presented as aggregates of the data reported by multiple health facilities
(e.g. all the health facilities in a district or region or nationwide). These aggregate statistics do not reveal whether
some health facilities failed to report for a given month or reported data for one data element that was inconsis-
tent with another data element (e.g. numbers of lab-confirmed cases of malaria > numbers of malaria tests per-
formed). By using the fully disaggregated data, the analysis was able to rigorously assess the completeness and
consistency of the data, omit inconsistent data and impute values for missing data.
31 Note that this study of childhood malaria parasitemia in Obuasi immediately preceded the launch of indoor re-
sidual spraying in the city.
32 Mapping Malaria Risk in Africa. http://www.mara.org.za/
33 Chinery WA (1984) Effects of ecological changes on the malaria vectors Anopheles funestus and the Anopheles
gambiae complex of mosquitoes in Accra, Ghana. J Trop Med Hyg. 1984 Apr;87(2):75-81.

22
Anopheles larvae and adult Anopheles mosquitoes that the risk of malaria transmission in Accra surged one to two months after the onset of rains in April and subsided dramatically one to two months after they let up in September. His graphs are given in Annex 9. To account for the influence of seasonal changes in the burden of malaria, analyses were either stratified by dry season (December to April) versus wet season (May to November) (e.g. for findings on the prevalence of malaria parasitemia) or included data from a full year or almost a full year (e.g. for annual entomological inoculation rates or routine health service data).
Statistical significance of the difference between two means
Wherever possible, 95% confidence intervals are provided for the means that are reported. Whenever their confidence intervals overlap, the difference between two means is always statistically significant with a p-value of less than 0.05.34 In instances where it is important to compare two means whose confidence intervals overlap, a p-value is reported based upon a t-test.
Limitations
The Ghana Urban Malaria Study adopted a modified triangulation methodology with a somewhat abbreviated approach to reaching consensus amongst stakeholders. This was necessary given the scope, funding and time allotted for the study.
Potential limitations of any triangulation exercise include biases when deciding which datasets to look at, limitations of the datasets themselves (i.e. biases or limits to external validity), and failure to estimate or report on confidence intervals (especially when looking at small sub-populations such as occupants of specific urban areas). To mitigate the risk of such limitations, the stakeholder group requested and the analysts included in their analyses all available data sources. Key statistics from analysis of the survey datasets are presented with a statistically rigorous estimation of confidence intervals taking into account the cluster sampling.
Published research articles provide malaria parasitemia and entomological measurements in specific, purposely selected neighborhoods. These neighborhoods cannot be taken as
34 See, for example, Cornell Statistical Consulting Unit (2008) StatNews # 73: Overlapping Confidence Intervals and
Statistical Significance. StatNews #73. October, 2008. http://www.cscu.cornell.edu/news/statnews/stnews73.pdf.
Figure 1: Neighborhoods of Accra and Kumasi studied by Klinkenberg et al.54

23
representative of entire cities much less of entire ecological zones. Nonetheless, they do provide data points with which to document a difference in malaria burden between urban and rural areas. Most of these data points are based upon large sample sizes and research methods that are well documented in peer-reviewed journals.
The datasets from the nationwide surveys (MICS, DHS), while nationally representative, include small numbers of measurements from each specific neighborhood (for the 2011 MICS, the number of children for whom malaria parasitemia was examined varied between zero and 19 per enumeration area).35
Some worthwhile data could not be compiled before this report was written. This includes unpublished reports of malariometric and entomological studies performed by researchers and students of the Noguchi Memorial Institute and Ghana’s universities.
As noted above, the method used to allocate household survey data to specific urban communities has likely resulted in some misclassification. The result of such misclassification is to reduce the statistical power to discern differences in malaria burden that are attributable to the size of urban areas.
The prevalence of malaria parasitemia has been shown to vary by the age of children sampled. In particular, the prevalence in subjects older than 10 years of age is usually lower than the prevalence in younger children (see Annex 10). Where the research report provided results for each age group, it was possible to limit the analysis to young children (less than 5 year or less than 10 years) to assure a matching age distribution of the populations being compared. When statistics are compared from studies with differing age distributions, the report calls attention to this fact.
Each of the indicators used to measure the burden of malaria has its own limitations. Before presenting study findings, these indicators and their limitations will be discussed in the following section.
35 The median number of children examined per enumeration area was 5 while the mean was 5.6.
24
INDICATORS OF THE BURDEN OF MALARIA Given the data available, various indicators can be used to assess the burden of malaria. In particular, two types of robust evidence warrant special attention:
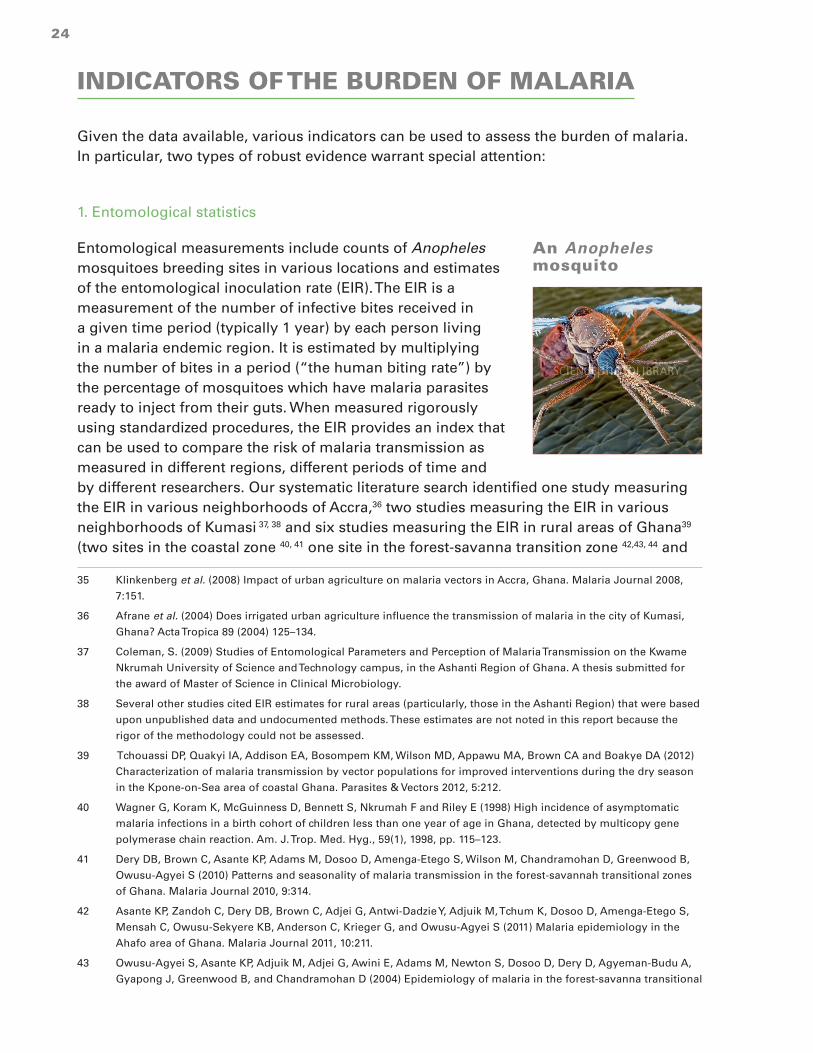
1. Entomological statistics
Entomological measurements include counts of Anopheles mosquitoes breeding sites in various locations and estimates of the entomological inoculation rate (EIR). The EIR is a measurement of the number of infective bites received in a given time period (typically 1 year) by each person living in a malaria endemic region. It is estimated by multiplying the number of bites in a period (“the human biting rate”) by the percentage of mosquitoes which have malaria parasites ready to inject from their guts. When measured rigorously using standardized procedures, the EIR provides an index that can be used to compare the risk of malaria transmission as measured in different regions, different periods of time and by different researchers. Our systematic literature search identified one study measuring the EIR in various neighborhoods of Accra,36 two studies measuring the EIR in various neighborhoods of Kumasi 37, 38 and six studies measuring the EIR in rural areas of Ghana39 (two sites in the coastal zone 40, 41 one site in the forest-savanna transition zone 42,43, 44 and
35 Klinkenberg et al. (2008) Impact of urban agriculture on malaria vectors in Accra, Ghana. Malaria Journal 2008,
7:151.
36 Afrane et al. (2004) Does irrigated urban agriculture influence the transmission of malaria in the city of Kumasi,
Ghana? Acta Tropica 89 (2004) 125–134.
37 Coleman, S. (2009) Studies of Entomological Parameters and Perception of Malaria Transmission on the Kwame
Nkrumah University of Science and Technology campus, in the Ashanti Region of Ghana. A thesis submitted for
the award of Master of Science in Clinical Microbiology.
38 Several other studies cited EIR estimates for rural areas (particularly, those in the Ashanti Region) that were based
upon unpublished data and undocumented methods. These estimates are not noted in this report because the
rigor of the methodology could not be assessed.
39 Tchouassi DP, Quakyi IA, Addison EA, Bosompem KM, Wilson MD, Appawu MA, Brown CA and Boakye DA (2012)
Characterization of malaria transmission by vector populations for improved interventions during the dry season
in the Kpone-on-Sea area of coastal Ghana. Parasites & Vectors 2012, 5:212.
40 Wagner G, Koram K, McGuinness D, Bennett S, Nkrumah F and Riley E (1998) High incidence of asymptomatic
malaria infections in a birth cohort of children less than one year of age in Ghana, detected by multicopy gene
polymerase chain reaction. Am. J. Trop. Med. Hyg., 59(1), 1998, pp. 115–123.
41 Dery DB, Brown C, Asante KP, Adams M, Dosoo D, Amenga-Etego S, Wilson M, Chandramohan D, Greenwood B,
Owusu-Agyei S (2010) Patterns and seasonality of malaria transmission in the forest-savannah transitional zones
of Ghana. Malaria Journal 2010, 9:314.
42 Asante KP, Zandoh C, Dery DB, Brown C, Adjei G, Antwi-Dadzie Y, Adjuik M, Tchum K, Dosoo D, Amenga-Etego S,
Mensah C, Owusu-Sekyere KB, Anderson C, Krieger G, and Owusu-Agyei S (2011) Malaria epidemiology in the
Ahafo area of Ghana. Malaria Journal 2011, 10:211.
43 Owusu-Agyei S, Asante KP, Adjuik M, Adjei G, Awini E, Adams M, Newton S, Dosoo D, Dery D, Agyeman-Budu A,
Gyapong J, Greenwood B, and Chandramohan D (2004) Epidemiology of malaria in the forest-savanna transitional
An Anopheles mosquito

25
one site in the savannah zone).45 Each of these studies also documented the distribution of Anopheles mosquito breeding sites. Another 9 studies documented the presence or absence of these breeding sites and/or adult mosquitoes in various neighborhoods without estimating any entomological inoculation rates. 46, 47, 48, 49, 50, 51, 52, 53, 54
2. Prevalence of malaria parasitemia in children
The prevalence of malaria infection typically declines with age as immunity develops. Hence, the age of subjects must be defined to provide for comparable statistics. Malaria parasitemia is assessed through two laboratory methods:
a. Microscopic exam of blood smears, when completed by a qualified technician, provides the “gold standard” assessment of malaria parasitemia. Microscopy measures the prevalence of infection at the time that the blood sample was drawn.
b. Rapid diagnostic testing (RDT) determines whether proteins produced by the Plasmodium falciparum were present in the blood at the time that the blood sample was drawn. RDTs that react with HRP-II can give positive results for up to two weeks after malaria therapy and parasite clearance as confirmed by microscopy.55 Hence, such RDTs provide the prevalence of infection now or sometime in the recent past. In hyper-endemic
zone of Ghana. Malaria Journal 2009, 8:220.
44 Appawu M, Owusu-Agyei S, Dadzie S, Asoala V, Anto F, Koram K, Rogers W, Nkrumah F, Hoffman SL, Fryauff DJ
(2004) Malaria transmission dynamics at a site in northern Ghana proposed for testing malaria vaccines. Trop.
Med. & Int’l Health. volume 9 no 1 pp 164–170.
45 Afrane YA, Lawson BW, Brenya R, Kruppa T, Yan G. (2012) The ecology of mosquitoes in an irrigated vegetable farm
in Kumasi, Ghana: abundance, productivity and survivorship. Am J Trop Med Hyg. 2012 Nov 19.
46 Opoku AA, Ansa-Asare OD and Amoako J. (2007) The Occurrences and Habitat Characteristics of Mosquitoes in
Accra, Ghana. A research report of the CSIR-Water Research Institute, P.O. Box AH 38, Achimota, Ghana.
47 Chinery WA (1995) Impact of rapid urbanization on mosquitoes and their disease transmission potential in Accra
and Tema, Ghana. Afr J Med Med Sci. 1995 Jun;24(2):179-88.
48 Chinery WA (1990) Variation in frequency in breeding of Anopheles gambiae s.l. and its relationship with in-door
adult mosquito density in various localities in Accra, Ghana. East Afr Med J. 1990 May;67(5):328-35.
49 Chinery WA (1984) Effects of ecological changes on the malaria vectors Anopheles funestus and the Anopheles
gambiae complex of mosquitoes in Accra, Ghana. J Trop Med Hyg. 1984 Apr;87(2):75-81.
50 Chinery WA (1970) A survey of mosquito breeding in Accra, Ghana, during a 2 year period of larval mosquito con-
trol. June 1970 issue of the Ghana Medical Journal.
51 Roberts J (2010) Korle and the mosquito: Histories and memories of the anti-malarial campaign in Accra, 1942-
1945. The Journal of African History. Volume 51, Issue 3, pages 343-365.
52 Christophers SR, Stephens JW (1900) Further reports to the malaria committee of the Royal Society.
53 LABIOFAM (2012) Larviciding and community participation in 3 regions of Ghana. A powerpoint presentation to
the Malaria Vector Control Oversight Committee of Ghana.
55 Igbinosa O, Igbinosa O, Asowata O, Jeffery C (2010) A sequential review on accuracy of detecting malaria parasit-
emia in developing countries with large restriction on resources. Journal of Medicine and Medical Sciences Vol.
1(9) pp. 385-390.

26
areas, it is common to find that 10% or more of subjects have recently resolved infections, negative microscopy but positive RDT results.
For the Ghana Urban Malaria Study, measurements of the prevalence of malaria parasitemia in urban areas are available from several sources:
The 2011 MICS assessed malaria parasitemia by rapid diagnostic testing as well as by microscopy56 in a nationally representative sample of 4,511 children 6 to 59 months of age;
Seven research articles documented the prevalence of malaria parasitemia in children living in urban neighborhoods.11,57, 58, 59, 60, 61, 62 Another study documented the prevalence of malaria parasitemia in women (from rural areas as well as from urban areas) attending antenatal clinics in Sekondi-Takoradi.63 These findings were compared with statistics from
56 For the 2011 MICS, microscopy was performed by a team of 4 experienced microscopists at the Navrongo Health
Research Centre of northern Ghana. Each slide was examined by 2 independent microscopists and discordant
results were read by a 3rd microscopist.
57 Klinkenberg et al. (2006) Urban malaria and anaemia in children: a cross-sectional survey in two cities of Ghana.
Trop Med Int Health 2006; 11: 578– 88.
58 Ronald et al. (2006) Malaria and anaemia among children in two communities of Kumasi, Ghana: a cross-sectional
survey. Malaria Journal 2006, 5:105.
59 Gardiner C, Biggar RJ, Collins WE and Nkrumah FK (1984) Malaria in urban and rural areas of southern Ghana: a
survey of parasitaemia, antibodies, and antimalarial practices. Bulletin of the World Health Organization, 62 (4):
607 – 613.
60 Klinkenberg et al. (2010) Cohort trial reveals community impact of insecticide-treated nets on malariometric indi-
ces in urban Ghana. Transactions of the Royal Society of Tropical Medicine and Hygiene 104 (2010) 496–503.
61 Christophers SR, Stephens JW (1900) Further reports to the malaria committee of the Royal Society.
62 Ehrhardt S, Burchard GD, Mantel C, Cramer JP, Kaiser S, Kubo M, Otchwemah RN, Bienzle U, Mockenhaupt FP
(2006) Malaria, Anemia, and Malnutrition in African Children—Defining Intervention Priorities. Journal of Infec-
tious Diseases 2006:194: 108 - 14.
63 Orish VN, Onyeabor OS, Boampong JN, Aforakwah R, Nwaefuna E, Iriemenam NC (2012) Adolescent pregnancy
and the risk of Plasmodium falciparum malaria and anaemia—A pilot study from Sekondi-Takoradi metropolis,
Ghana. Acta Tropica 123 (2012) 244– 248.

27
studies measuring the prevalence of malaria parasitemia in children living in smaller communities or rural areas.64, 65, 66, 67, 68, 69, 70, 71, 72, 73, 74
3. Prevalence of fever or anemia in children
DHS and MICS surveys routinely ask whether children in each household have been sick with fever in the previous 2 weeks. In recent years, the DHS and MICS have also measured hemoglobin of children +/- women. Data from the 2011 MICS allow determination of how reliable a history of fever is for identifying a child who has recently been infected with malaria. One measurement of the reliability of an indicator is the positive predictive value (PPV), or the probability that a positive test result is a true positive. The PPV of history of fever is the chance that a child reported to have had fever is parasitemic. Findings from the 2011 MICS are presented in Table 1. In rural areas, the indicator appears to have performed well – more than 80% of children reported to have had fever in the last 2 weeks had a positive RDT test. Of children reported to have had fever in Accra and Kumasi, however, only 6.6% had a positive RDT. Clearly, history of fever is not a good indicator with which to document differences in the burden of malaria between urban and rural areas and between different urban neighborhoods. This is for two reasons. First, many
64 Afari E.A., Dunyo S., Appawu M. and Nkrumah F.K. (1994). In vivo seasonal assessment of Plasmodium falciparum
sensitivity to chloroquine in two different malaria endemic communities in Southern Ghana. African Journal of
Health Sciences 1 (3):112-115.
65 Dodoo D., Aikins A., Kusi K.A., Lamptey H., Remarque E., Milligan P., Bosomprah S., Chilengi R., Osei Y.D., Akan-
mori B.D. and Theisen M. (2008). Cohort study of the association of antibody levels to AMA1, MSP119, MSP3 and
GLURP with protection from clinical malaria in Ghanaian children. Malaria Journal 7 :142.
66 Koram, K. and Abuaku, B. (2007) personal communication to the MAP project. These data consist of findings from
a community prevalence study performed by these Noguchi researchers in March of 2006 in Obuasi.
67 Afari E.A., Akanmori B.D., Nakano T. and Ofori-Adjei D. (1992). Plasmodium falciparum: sensitivity to chloroquine
in vivo in three ecological zones in Ghana. Transactions of the Royal Society of Tropical Medicine and Hygiene 86
(3):231-2.
68 Afari EA. (1990). In vivo and in vitro Plasmodium falciparum sensitivity to chloroquine and in vitro response of
Plasmodium falciparum to amodiaquine, quinine and sulfadoxine/pyrimethamine. Legon, Ghana: Epidemiology
Unit, Noguchi Memorial Institute for Medical Research.
69 Landgraf B., Kollaritsch H., Wiedermann G. and Wernsdorfer W.H. (1994). Plasmodium falciparum susceptibility in
vitro and in vivo to chloroquine and sulfadoxine-pyrimethamine in Ghanaian schoolchildren. Transactions of the
Royal Society of Tropical Medicine and Hygiene, 88 (4):440-2.
70 Dodoo D., Omer F.M., Todd J., Akanmori B.D., Koram K.A. and Riley E.M. (2002). Absolute levels and ratios of pro-
inflammatory and anti-inflammatory cytokine production in vitro predict clinical immunity to Plasmodium falci-
parum malaria. The Journal of Infectious Diseases, 185 (7):971-9.
71 Owusu-Agyei S, Smith T, Beck H-P, Amenga-Etego and Felger I (2002) Molecular epidemiology of Plasmodium fal-
ciparum infections among asymptomatic inhabitants of a holoendemic malarious area in northern Ghana. Tropical
Medicine and International Health, volume 7 no 5 pp 421–428.
72 Baird JK, S. Owusiu-Agyei S, Utz GC, Koram K, Barcus MJ, Jones TR, Fryauff DJ, Binka FN, Hoffman SL, AND Nk-
rumah FN (2002) Seasonal malaria attack rates in infants and young children in northern Ghana. Am. J. Trop. Med.
Hyg., 66(3), 2002, pp. 280–286.
73 Asante KP, Zandoh C, Dery DB, Brown C, Adjei G, Antwi-Dadzie Y, Adjuik M, Tchum K, Dosoo D, Amenga-Etego S,
Mensah C, Owusu-Sekyere KB, Anderson C, Krieger G, Owusu-Agyei S (2011) Malaria epidemiology in the Ahafo
area of Ghana. Malaria Journal 2011, 10:211.
74 Owusu-Agyei S, Asante KP, Adjuik M, Adjei G, Awini E, Adams, Newton S, Dosoo D, Dery D, Agyeman-Budu A,
Gyapong J, Greenwood B, Chandramohan D (2009) Epidemiology of malaria in the forest-savanna transitional
zone of Ghana. Malaria Journal 2009, 8:220.

28
diseases other than malaria can cause childhood fever. Second, caretakers find it difficult to accurately recall fever and other symptoms occurring more than 3 days before an interview.75
Table 1: How reliably does a history of fever indicate whether a child recently had a malaria infection? Children 6 - 59 months, 2011 MICS
Data from the 2011 MICS Rapid diagnostic test
+ - PPV
Number of
children with
fever in the
last 2 weeks
Rural areas of
Ghana
487 120 80.2%
Accra &
Kumasi
4 63 6.6%
Findings from the 2011 MICS on the presence of anemia are presented in Table 2. Again, the indicator appears to perform well in rural areas – more than 80% of children with anemia (hemoglobin < 10 g/dl) had a positive RDT test. Of children with anemia in Accra and Kumasi, however, only 13.8% had a positive RDT. Anemia is a somewhat better indicator, but it cannot reliably measure the burden of malaria.76
Table 2: How reliably does presence of anemia indicate whether a child recently had a malaria infection? Children 6 - 59 months, 2011 MICS
Data from the 2011 MICS
Rapid diagnostic test
+ - PPV
Number of
children with
anemia
(Hgb < 10.0 g/dl)
Rural areas of
Ghana
884 184 82.8%
Accra &
Kumasi
12 76 13.8%
4. Verbal autopsy findings from the 2008 DHS
As part of the 2008 DHS, caretakers were interviewed about the circumstances surrounding the deaths of any children who died in the 2 years preceding the survey. In principle, it should thus be possible to analyze these data to compare urban versus rural areas with respect to such indicators as the percentage of deaths attributable to
75 Feiken DR et al. (2010) Evaluation of the optimal recall period for disease symptoms in home-based morbidity sur-
veillance in rural and urban Kenya. Int. J. Epidemiol. (2010) 39 (2):450-458.
76 Other indicators of the reliability of an indicator are the negative predictive value (NPV), sensitivity and specificity.
The 2011 MICS data show that, for history of fever in children 6 to 59 months living in Accra or Kumasi, the NPV is
92.0%, the sensitivity is 10.5% and the specificity is 87.4%. For anemia, the NPV is 93.3%, the sensitivity is 28.2%
and the specificity is 85.0%. Among children surveyed in Accra and Kumasi, 7.8% were RDT positive, 12.4% were
reported to have been sick with a fever in the last 2 weeks and 16.0% were anemic.

29
malaria. However, the 2008 DHS dataset includes verbal autopsy data for only 199 deaths nationwide. Only 111 of these deaths occurred after 2 months of age and only 36 of these (32.4%) were attributed to malaria. The small size of the sample thus greatly limits the analysis that can be performed. The percentage of childhood deaths attributable to malaria for urban households (31.3%; 95% CI 11.5% to 51.0%) is not different from the percentage for rural households (33.0%; 95% CI 22.0% to 44.1%). In any case, these verbal autopsy data must also be interpreted with caution as verbal autopsy attributes deaths to malaria largely on the basis of a history of fever, which, as shown above, is not a reliable indicator of malaria infection.77
5. Incidence of malaria cases (or malaria deaths) as reported by health facilities in Ghana
Data routinely reported by health facilities are frequently used to inform public health decisions. Unfortunately, for several major reasons, health facility data usually cannot be relied upon to estimate the burden of malaria in Ghana:
a. The majority of cases of malaria are diagnosed presumptively (i.e. without lab confirmation). In the case of children, for whom other symptoms are difficult to elicit or non-specific, this usually means reliance upon fever or history of fever to diagnose malaria. Table 3 summarizes statistics for the GHS District Health Information Management System (DHIMS) database. The statistics are derived from the monthly OPD reports submitted during 2012 (January to October) from the 3,043 health facilities in Ghana which have reported any malaria data this year. DHIMS data suggest that the percentage of reported malaria cases which were laboratory confirmed was 6.8% for facilities in Accra Metropolitan District (AMD), 26.5% for facilities in the Kumasi Metropolitan District (KMD), and 29.7% for all other facilities in the country which have reported malaria data.
Table 3: DHIMS data on reported cases of malaria and laboratory confirmed cases of malaria, Jan. - Oct. 2012, by location78
Data from DHIMS (health facilities)
Monthly OPD reporting, Jan. – Oct. 2012
No. of Facilities
Malaria cases
Lab confirmed malaria cases
Reported testing ratio77
AMD -- facilities reporting malaria cases at least once during 2012
46 162,186 11,082 6.8%
KMD -- facilities reporting malaria cases at least once during 2012
70 219,637 58,302 26.5%
Other communities – facilities reporting malaria at least once
2,927 5,076,667 1,510,195 29.7%
77 Todd et al. (1994) The limitations of verbal autopsy in a malaria-endemic region. Ann. Trop. Paediatr. 1994;14 (1):31-
6.
78 The reported number of laboratory-confirmed malaria cases divided by the total number of malaria cases reported.

30
Findings from malaria household surveys (discussed in the section of this report that addresses urban/rural differences in malaria treatment) provide further evidence that the great majority of malaria cases are diagnosed presumptively and that diagnosis of malaria without laboratory confirmation is even more common in Accra and Kumasi than elsewhere in Ghana.
b. Data routinely reported by health facilities are often highly incomplete. As shown in Table 4, the completeness of these data can vary significantly over time and between urban and rural facilities79. The completeness of monthly reporting among facilities reporting at least one month of data was 34% in Accra Metropolitan Authority (row a), 43% in Kumasi Metropolitan Authority (row b), and 35% in other communities (row c). However, among all registered facilities the completeness of reporting was substantially lower in Accra Metropolitan Authority (12% - row d) and Kumasi Metropolitan Authority (23% - row e), but not in other communities (31% - row f). A large number of the health facilities registered in these two cities never reported any malaria data during 2012. Some of these non-reporting health facilities are private and have not yet been persuaded to submit their monthly data. Other non-reporting health facilities are specialized hospitals which don’t typically treat malaria. Whatever the cause, malaria reporting from health facilities in Accra and Kumasi is substantially less complete than malaria reporting from health facilities elsewhere in Ghana. As will be discussed further in the in the section of this report that addresses urban/rural differences in malaria treatment, reporting by health facilities in AMD and KMD of lab-confirmed malaria cases is especially incomplete.
Table 4: DHIMS statistics on the completeness of monthly OPD reporting, Jan. - Oct. 2012
Data from DHIMS (health facilities)
Monthly OPD reporting, Jan. – Oct. 2012
No. of
Facilities
Reports
expected
Reports
received
Completeness of
reporting
a) AMD -- facilities
reporting malaria
cases at least once
during 2012
46 460 158 34.3%
b) KMD -- facilities
reporting malaria
cases at least once
during 2012
70 700 303 43.3%
c) Other communities
– facilities reporting
malaria at least
once
2,927 29,270 10,356 35.4%
79 Rural facilities may face more constraints than urban facilities to transmit their data. Alternatively, due to problems
with collaboration of large numbers of specialized clinical and support staff at hospitals and large polyclinics, routine
reporting of service data is often less complete for some urban health facilities than for smaller rural clinics.

31
d) AMD – all
registered facilities
131 1,310 158 12.1%
e) KMD – all
registered facilities
133 1,330 303 22.8%
f) Other communities
– all registered
facilities
3,398 33,980 10,356 30.5%
To derive meaningful conclusions from significantly incomplete data it is possible to impute values for missing data – to assume that if a report from a particular facility is missing for a given month then the number of cases seen at that facility during that month was equal to the number of cases reported for another month by the same health facility.
c. The catchment area of any specific health facility (the denominator for calculating morbidity and mortality rates) is unknown. This is especially true of many large, urban health facilities that attract patients from nearby rural areas as well as from the city or town in which they are located. It is thus usually not possible to know the extent to which the data reported by an urban magnet institution reflect the malaria burden in a strictly urban area. At best, data from all facilities in a given district can be pooled with the (questionable) assumption that the majority of patients treated reside within that district.
d. There may be major fluctuations (e.g. depending upon drug availability) and differences between urban and rural areas in care seeking practices for malaria. As will be discussed in the section of this report that discusses urban/rural differences in malaria treatment, the evidence suggests that most cases of malaria are treated at home without ever being seen at a health facility. Any difference in care seeking practices between rural and urban areas will affect the number of malaria cases that are reported.
For all of the above reasons (presumptive diagnosis, incompleteness of reporting, uncertainty about the catchment population, differences in care seeking practices) interpretation of the data routinely reported by health facilities requires major manipulation of the data (e.g. imputation of missing values) which can significantly undermine the reliability of the resulting statistics.
6. Malaria test positivity rate (TPR)
Among the more robust statistics obtained from analysis of data reported by health facilities is the percentage of malaria tests (by microscopy and/or RDT) which are found to be positive. The malaria test positivity rate is a “self-sufficient indicator” that is less vulnerable than malaria-specific morbidity and mortality rates to incompleteness of reporting and variation in the size of the catchment population. A potential confounder of the malaria test positivity rate can be variation from one facility to another in care seeking for mild cases and the proportion of malaria tests carried out on asymptomatic or mildly symptomatic patients. For example, it is a well-established practice at some ANC clinics

32
in Ghana to test large numbers of asymptomatic women. Alternatively, it is common for many health workers to forego malaria testing (i.e. to judge it to be unnecessary) when they have a high clinical suspicion of malaria. Findings will be confounded to the extent that such practices are more common in urban areas than in rural areas or vice versa.
Test positivity rates can be calculated with data from the 5 malaria sentinel surveillance sites as well as with data routinely reported by most health facilities in Ghana. Calculation of the malaria test positivity rate from routine reports depends upon numbers recorded each month on the Case Reporting Form (CRF – see Annex 5). Unfortunately, data from the DHIMS (see Table 5) suggest that a large percentage of health facilities have never submitted the CRF. The problem is especially severe for health facilities of AMD and KMD.
Table 5: DHIMS statistics on the numbers of health facilities reporting either no data or inconsistent data on the number of malaria tests performed, Jan - Oct 2012
Data from DHIMS, January to October 2012 Nationwide AMD & KMD
Facilities which have NEVER reported with CRF
/ facilities reporting malaria cases
856/3043 = 28.1% 96/116 = 82.7%
Number of health facilities reporting more lab-
confirmed cases than lab tests performed
957/2,998 = 32% 5/116 = 4%
In addition to these problems with the incompleteness of the CRF reporting, roughly half of the monthly malaria testing data that have been reported were inconsistent in one of two ways:
a. The number of lab-confirmed malaria cases reported by a health facility during a given month was greater than the number of malaria lab tests reported to have been performed at that health facility during that month; or
b. The facility reported the number of malaria lab tests performed but did not report the number of lab-confirmed malaria cases.
Table 5 shows that, for a large number of health facilities (especially those outside of Accra and Kumasi), the reported number of lab-confirmed malaria cases reported during the first 10 months of 2012 was greater than the number of malaria tests which they reported performing during this period. This inconsistency is in part attributable to the way that malaria testing data are now entered into the DHIMS database. As discussed in Annex 5, since May of 2012 data clerks have stopped entering the “total positive malaria tests” as recorded on the CRF. Instead, the DHIS has been modified to extract this data element from the Monthly OPD Morbidity Form (since “total positive malaria tests” should be equal to the number of lab confirmed malaria cases).
To calculate malaria test positivity rates for each of Ghana’s health districts, inconsistent data were omitted. Thus, for each health facility and each month, the reported number of

33
lab-confirmed cases was omitted from the numerator if this reported number was greater than the reported number of lab tests performed. Also, for each health facility and each month, the reported number of lab tests performed was omitted from the denominator if the number of lab-confirmed cases was not reported. The resulting statistics are presented in the next section this report (see pages 34 to 36) as well as in Annex 12.
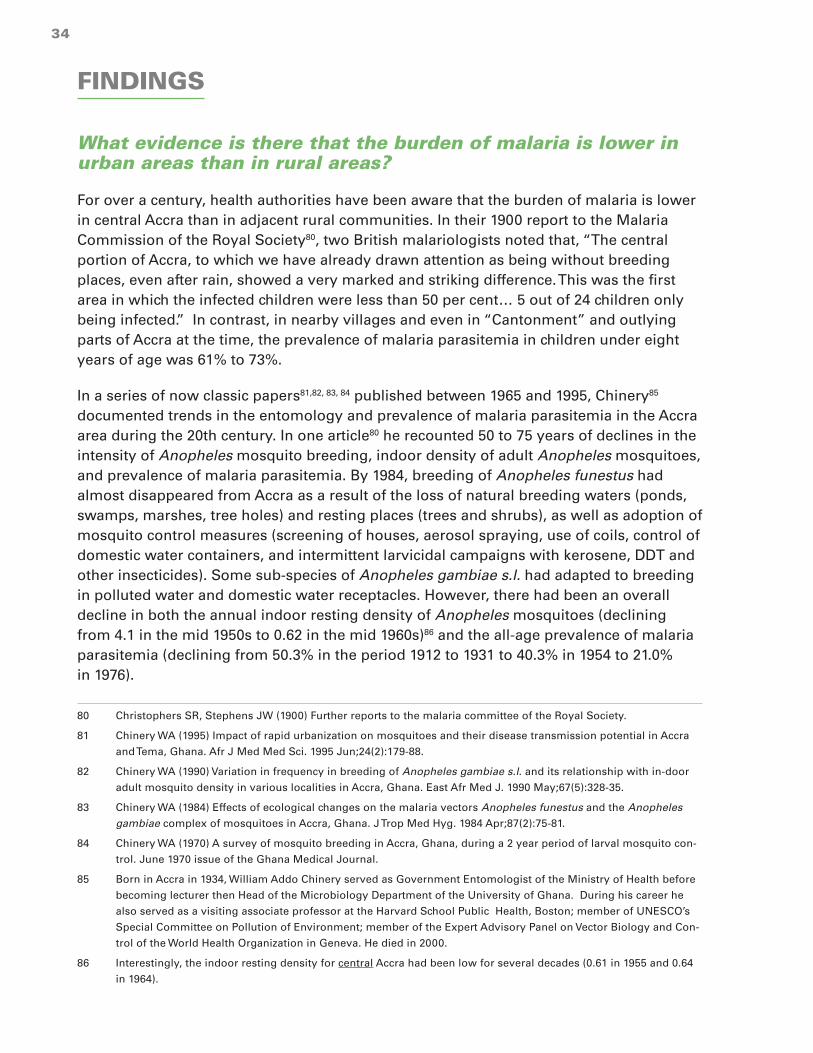
34
FINDINGS
What evidence is there that the burden of malaria is lower in urban areas than in rural areas?
For over a century, health authorities have been aware that the burden of malaria is lower in central Accra than in adjacent rural communities. In their 1900 report to the Malaria Commission of the Royal Society80, two British malariologists noted that, “The central portion of Accra, to which we have already drawn attention as being without breeding places, even after rain, showed a very marked and striking difference. This was the first area in which the infected children were less than 50 per cent… 5 out of 24 children only being infected.” In contrast, in nearby villages and even in “Cantonment” and outlying parts of Accra at the time, the prevalence of malaria parasitemia in children under eight years of age was 61% to 73%.
In a series of now classic papers81,82, 83, 84 published between 1965 and 1995, Chinery85 documented trends in the entomology and prevalence of malaria parasitemia in the Accra area during the 20th century. In one article80 he recounted 50 to 75 years of declines in the intensity of Anopheles mosquito breeding, indoor density of adult Anopheles mosquitoes, and prevalence of malaria parasitemia. By 1984, breeding of Anopheles funestus had almost disappeared from Accra as a result of the loss of natural breeding waters (ponds, swamps, marshes, tree holes) and resting places (trees and shrubs), as well as adoption of mosquito control measures (screening of houses, aerosol spraying, use of coils, control of domestic water containers, and intermittent larvicidal campaigns with kerosene, DDT and other insecticides). Some sub-species of Anopheles gambiae s.l. had adapted to breeding in polluted water and domestic water receptacles. However, there had been an overall decline in both the annual indoor resting density of Anopheles mosquitoes (declining from 4.1 in the mid 1950s to 0.62 in the mid 1960s)86 and the all-age prevalence of malaria parasitemia (declining from 50.3% in the period 1912 to 1931 to 40.3% in 1954 to 21.0% in 1976).
80 Christophers SR, Stephens JW (1900) Further reports to the malaria committee of the Royal Society.
81 Chinery WA (1995) Impact of rapid urbanization on mosquitoes and their disease transmission potential in Accra
and Tema, Ghana. Afr J Med Med Sci. 1995 Jun;24(2):179-88.
82 Chinery WA (1990) Variation in frequency in breeding of Anopheles gambiae s.l. and its relationship with in-door
adult mosquito density in various localities in Accra, Ghana. East Afr Med J. 1990 May;67(5):328-35.
83 Chinery WA (1984) Effects of ecological changes on the malaria vectors Anopheles funestus and the Anopheles
gambiae complex of mosquitoes in Accra, Ghana. J Trop Med Hyg. 1984 Apr;87(2):75-81.
84 Chinery WA (1970) A survey of mosquito breeding in Accra, Ghana, during a 2 year period of larval mosquito con-
trol. June 1970 issue of the Ghana Medical Journal.
85 Born in Accra in 1934, William Addo Chinery served as Government Entomologist of the Ministry of Health before
becoming lecturer then Head of the Microbiology Department of the University of Ghana. During his career he
also served as a visiting associate professor at the Harvard School Public Health, Boston; member of UNESCO’s
Special Committee on Pollution of Environment; member of the Expert Advisory Panel on Vector Biology and Con-
trol of the World Health Organization in Geneva. He died in 2000.
86 Interestingly, the indoor resting density for central Accra had been low for several decades (0.61 in 1955 and 0.64
in 1964).

35
Evidence from entomological studies
A small number of research studies conducted during the last 10 years have measured the EIR in select neighborhoods of Accra and Kumasi. Findings from this research are presented in Table 6 along with measurements of the EIR from elsewhere in Ghana and sub-Saharan Africa. A range is given in the appropriate row of Table 6 if the same study reported on the EIR in several different cities (in the case of the meta-analysis of Robert et al.)84 or several different neighborhoods of the same city (in the case of the study within Accra by Klinkenberg et al.).87 Findings from these studies in Ghana have been consistent with research carried out elsewhere in sub-Saharan Africa:84, 14, 15 Anopheles mosquitoes, while much less common than in most rural areas (the mangrove coast of Prampram in the Volta Region being an apparent exception), do breed in some urban sites and “autochthonous” (internal) transmission of malaria is taking place. EIR findings from Accra and Kumasi also show the great heterogeneity between neighborhoods of the same city during the same time period in the risk of transmission of malaria.
Evidence from studies measuring the prevalence of malaria parasitemia
Research studies in select neighborhoods of Accra, Kumasi and Tamale have also documented a low prevalence of malaria parasitemia in children. Table 7 presents findings by location within each ecological zone, with the largest city listed first followed by smaller communities within the same ecological zone. All findings from studies completed during the dry season are presented first, followed by findings from studies conducted either during the wet season or during both the wet and dry seasons. A range is given in the appropriate row of Table 7 if the study measured the prevalence of malaria parasitemia in several different neighborhoods of the same city.

36
Table 6: Annual entomological inoculation rates (EIR) measured for various locales
Location Annual EIR EIR range Reference
Center of large cities in the forest or wet savanna of sub-Saharan Africa
12.6 0.3 – 30 Robert (2003)86
Rural areas in the forest or wet savanna of sub-Saharan Africa
198.0 80 – 850 Robert (2003)86
Coastal – Accra (AMD) 11.2 2.687 – 44.788 Klinkenberg (2008)89
Coastal – (rural near Prampram, VR*)
8.5 8.5** Appawu (1994)90
Coastal – (rural Kpone, GAR*) 62.1 62.1** Tchouassi (2012)91
Forest – Kumasi (KMD without urban agriculture)
13.592 Range not published
Afrane (2004)93
Forest – Kumasi (KMD with urban agriculture)
89.890 Range not published
Afrane (2004)93
Forest – Kumasi (campus of KNUST – with agric.)
21.5 21.5** Coleman (2009)94
Forest-Savannah (rural near Kintampo, BAR*)
269 269** Owusu-Agyei (2009)95
Forest-Savannah (rural near Kintampo, BAR*)
231 231** Dery (2010)96
Savannah – (rural near Navrongo, UER*)
419 419** Appawu (2004)97
* BAR= Brong Ahafo Region; GAR=Greater Accra Region; UER=Upper East Region; VR=Volta Region.
** A single measurement for one geographic area.

37
878889909192939495969798
87 Robert et al. (2003) Malaria transmission in urban sub-Saharan Africa. Am. J. Trop. Med. Hyg. 68, 169 –176.
88 Ushertown neighborhood of Accra.
89 Kotobabi/Roman Ridge neighborhood of Accra.
90 Klinkenberg et al. (2008) Impact of urban agriculture on malaria vectors in Accra, Ghana. Malaria Journal 2008,
7:151.
91 Appawu MA, Baffoe-Wilmot ABA, Afari EA, Nkrumah FK, Petrarca V (1994). Species composition and inversion
polymorphism of the Anopheles gambiae complex in some sites of Ghana, West Africa. Acta Trop 56: 15–23.
92 Tchouassi DP, Quakyi IA, Addison EA, Bosompem KM, Wilson MD, Appawu MA, Brown CA and Boakye DA (2012)
Characterization of malaria transmission by vector populations for improved interventions during the dry season
in the Kpone-on-Sea area of coastal Ghana. Parasites & Vectors 2012, 5:212.
93 Afrane et al. report on the monthly EIR during the dry season (January to March) and during the rainy season
(June to September). The table shows an estimate of the annual EIR derived by adding 5 times the dry season
monthly EIR to 7 times the rainy season EIR.
94 Afrane et al. (2004) Does irrigated urban agriculture influence the transmission of malaria in the city of Kumasi,
Ghana? Acta Tropica 89 (2004) 125–134.
95 Coleman, S. (2009) Studies of Entomological Parameters and Perception of Malaria Transmission on the Kwame
Nkrumah University of Science and Technology campus, in the Ashanti Region of Ghana. A thesis submitted for
the award of Master of Science in Clinical Microbiology.
96 Owusu-Agyei S, Asante KP, Adjuik M, Adjei G, Awini E, Adams M, Newton S, Dosoo D, Dery D, Agyeman-Budu A,
Gyapong J, Greenwood B, and Chandramohan D (2004) Epidemiology of malaria in the forest-savanna transitional
zone of Ghana. Malaria Journal 2009, 8:220.
97 Dery DB, Brown C, Asante KP, Adams M, Dosoo D, Amenga-Etego S, Wilson M, Chandramohan D, Greenwood B,
Owusu-Agyei S (2010) Patterns and seasonality of malaria transmission in the forest-savannah transitional zones
of Ghana. Malaria Journal 2010, 9:314.
98 Appawu M, Owusu-Agyei S, Dadzie S, Asoala V, Anto F, Koram K, Rogers W, Nkrumah F, Hoffman SL, Fryauff DJ
(2004) Malaria transmission dynamics at a site in northern Ghana proposed for testing malaria vaccines. Trop.
Med. & Int’l Health. volume 9 no 1 pp 164–170.

38
Tab
le 7
: S
um
mar
y o
f st
ud
ies
mea
suri
ng
mal
aria
par
asit
emia
in
Gh
anai
an c
hild
ren
, by
mic
rosc
opy
un
less
sp
ecif
ied
Sea
son
Eco
log
ical
zo
ne
Loca
tio
nS
amp
le s
ize
Pre
vale
nce
of
par
asit
emia
(r
ang
e fo
r va
rio
us
nei
gh
bo
rho
od
s)
Year
en
ded
Ref
eren
ce
< 5
yrs
<10
yrs
< 18
yrs
Dry
Co
asta
lA
ccra
1,75
7--
--14
.9%
(6.
5% -
22.
9%)
2003
Klin
ken
ber
g e
t al
. (2
006
)98
Do
do
wa
?*21
2--
61.3
%**
1992
Afa
ri e
t al
. (19
94)10
6 D
od
ow
a?*
?*13
473
.1%
**20
00
Do
do
o e
t al
. (20
02)99
Do
do
wa
?*35
2--
62.8
%**
2002
Do
do
o e
t al
. (20
08)10
0
Mad
ina
?*?*
1048
54.8
%**
1991
Lan
dg
raf
et a
l. (1
994)
101
Pra
mp
ram
?*19
2--
35.9
%**
1992
Afa
ri e
t al
. (19
94)10
6
Fore
stK
um
asi
1,79
1--
--8.
2% (
2.3%
- 3
2.7%
)20
03K
linke
nb
erg
et
al.
(20
06)98
O
bu
asi
?*30
8--
40.3
%**
2006
Ko
ram
et
al. (
2007
)102
Su
nya
ni
?*?*
715
19.2
%**
1990
Afa
ri e
t al
. (19
92)10
5
Ru
ral B
AR
?*?*
966
45.9
%**
1990
Afa
ri e
t al
. (19
92)10
5 S
avan
nah
Tam
ale
?*56
4--
40.3
% (
25.7
% -
67.
1%)
2002
Eh
rhar
dt
et a
l. (2
006
)103
Ru
ral N
R?*
1,54
4--
61.1
% (
37.1
% -
93.
6%)
2002
Eh
rhar
dt
et a
l. (2
006
)103
Ru
ral U
ER
259
----
69.1
%**
1997
Bai
rd (
2002
)111
Ru
ral B
AR
335
__--
56.7
%**
2004
Ow
usu
-Ag
yei (
2009
)109
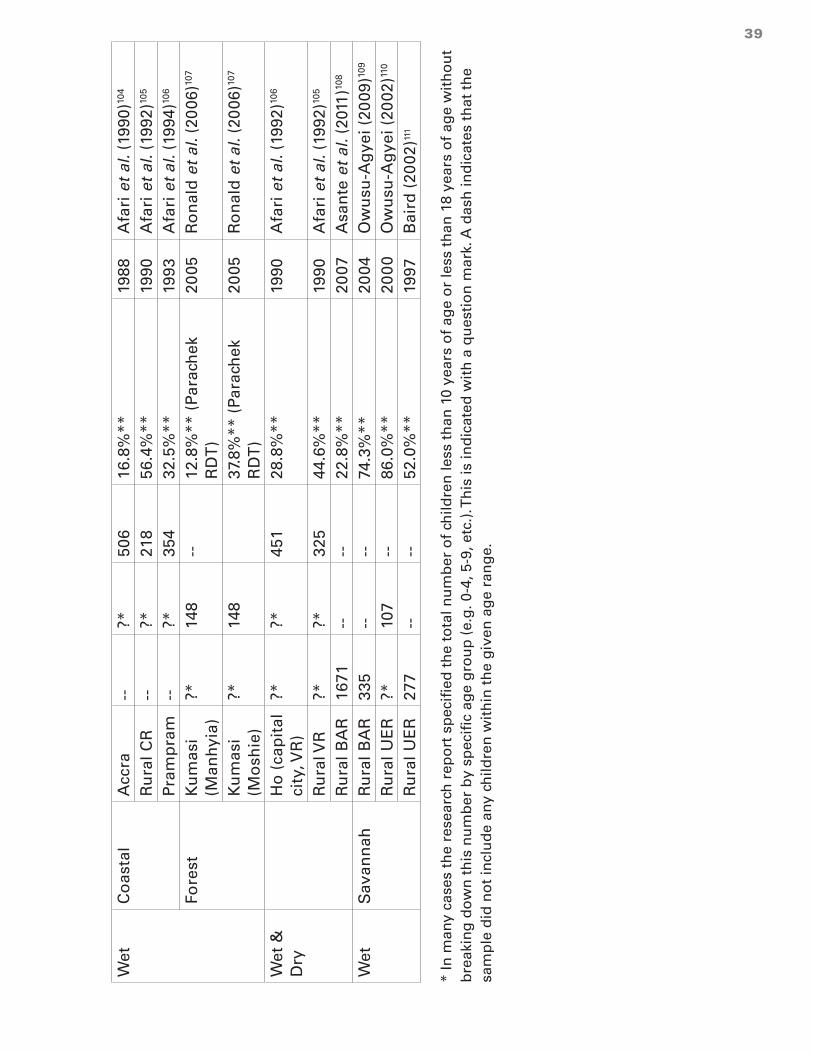
39
Wet
Co
asta
lA
ccra
--?*
506
16.8
%**
1988
Afa
ri e
t al
. (19
90)10
4
Ru
ral C
R--
?*21
856
.4%
**19
90A
fari
et
al. (
1992
)105
Pra
mp
ram
--?*
354
32.5
%**
1993
Afa
ri e
t al
. (19
94)10
6
Fore
stK
um
asi
(Man
hyi
a)?*
148
--12
.8%
** (
Para
chek
R
DT
)20
05R
on
ald
et
al. (
2006
)107
Ku
mas
i (M
osh
ie)
?*14
837
.8%
** (
Para
chek
R
DT
)20
05R
on
ald
et
al. (
2006
)107
Wet
&
Dry
Ho
(ca
pit
al
city
, VR
)?*
?*45
128
.8%
**19
90A
fari
et
al. (
1992
)106
Ru
ral V
R?*
?*32
544
.6%
**19
90A
fari
et
al. (
1992
)105
Ru
ral B
AR
1671
----
22.8
%**
2007
Asa
nte
et
al. (
2011
)108
Wet
Sav
ann
ahR
ura
l BA
R33
5--
--74
.3%
**20
04O
wu
su-A
gye
i (20
09)10
9
Ru
ral U
ER
?*10
7--
86.0
%**
200
0O
wu
su-A
gye
i (20
02)11
0
Ru
ral U
ER
277
----
52.0
%**
1997
Bai
rd (
2002
)111
* In
man
y ca
ses
the
rese
arch
rep
ort
sp
ecif
ied
th
e to
tal n
um
ber
of
child
ren
less
th
an 1
0 ye
ars
of
age
or
less
th
an 1
8 ye
ars
of
age
wit
ho
ut
bre
akin
g d
ow
n t
his
nu
mb
er b
y sp
ecif
ic a
ge
gro
up
(e.
g. 0
-4, 5
-9, e
tc.)
. Th
is is
ind
icat
ed w
ith
a q
ues
tio
n m
ark.
A d
ash
ind
icat
es t
hat
th
e sa
mp
le d
id n
ot
incl
ud
e an
y ch
ildre
n w
ith
in t
he
giv
en a
ge
ran
ge.
** A
sin
gle
mea
sure
men
t fo
r o
ne
geo
gra
ph
ic a
rea

40
99100101102103104105106107108109110111112
99 Klinkenberg et al. (2006) Urban malaria and anaemia in children: a cross-sectional survey in two cities of Ghana.
Trop Med Int Health 2006; 11: 578– 88.
100 Dodoo D., Omer F.M., Todd J., Akanmori B.D., Koram K.A. and Riley E.M. (2002). Absolute levels and ratios of pro-
inflammatory and anti-inflammatory cytokine production in vitro predict clinical immunity to Plasmodium falci-
parum malaria. The Journal of Infectious Diseases, 185 (7):971-9.
101 Dodoo D., Aikins A., Kusi K.A., Lamptey H., Remarque E., Milligan P., Bosomprah S., Chilengi R., Osei Y.D., Akan-
mori B.D. and Theisen M. (2008). Cohort study of the association of antibody levels to AMA1, MSP119, MSP3 and
GLURP with protection from clinical malaria in Ghanaian children. Malaria Journal 7 :142.
102 Landgraf B., Kollaritsch H., Wiedermann G. and Wernsdorfer W.H. (1994). Plasmodium falciparum susceptibility in
vitro and in vivo to chloroquine and sulfadoxine-pyrimethamine in Ghanaian schoolchildren. Transactions of the
Royal Society of Tropical Medicine and Hygiene, 88 (4):440-2.
103 Koram, K. and Abuaku, B. (2007) personal communication to the MAP project. These data consist of findings from
a community prevalence study performed by these Noguchi researchers in March of 2006 in Obuasi.
104 Ehrhardt S,Burchard GD, Mantel C, Cramer JP, Kaiser S, Kubo M, Otchwemah RN, Bienzle U, Mockenhaupt FP
(2006) Malaria, Anemia, and Malnutrition in African Children—Defining Intervention Priorities. Journal of Infec-
tious Diseases 2006:194: 108 - 14.
105 Afari E. A. (1990). In vivo and in vitro Plasmodium falciparum sensitivity to chloroquine and in vitro response of
Plasmodium falciparum to amodiaquine, quinine and sulfadoxine/pyrimethamine. Legon, Ghana: Epidemiology
Unit, Noguchi Memorial Institute for Medical Research.
106 Afari E.A., Akanmori B.D., Nakano T. and Ofori-Adjei D. (1992). Plasmodium falciparum: sensitivity to chloroquine
in vivo in three ecological zones in Ghana. Transactions of the Royal Society of Tropical Medicine and Hygiene 86
(3):231-2.
107 Afari E.A., Dunyo S., Appawu M. and Nkrumah F.K. (1994). In vivo seasonal assessment of Plasmodium falciparum
sensitivity to chloroquine in two different malaria endemic communities in Southern Ghana. African Journal of
Health Sciences 1 (3):112-115.
108 Ronald et al. (2006) Malaria and anaemia among children in two communities of Kumasi, Ghana: a cross-sectional
survey. Malaria Journal 2006, 5:105.
109 Asante KP, Zandoh C, Dery DB, Brown C, Adjei G, Antwi-Dadzie Y, Adjuik M, Tchum K, Dosoo D, Amenga-Etego S,
Mensah C, Owusu-Sekyere KB, Anderson C, Krieger G, Owusu-Agyei S (2011) Malaria epidemiology in the Ahafo
area of Ghana. Malaria Journal 2011, 10:211.
110 Owusu-Agyei S, Asante KP, Adjuik M, Adjei G, Awini E, Adams, Newton S, Dosoo D, Dery D, Agyeman-Budu A,
Gyapong J, Greenwood B, Chandramohan D (2009) Epidemiology of malaria in the forest-savanna transitional
zone of Ghana. Malaria Journal 2009, 8:220.
111 Owusu-Agyei S, Smith T, Beck H-P, Amenga-Etego and Felger I (2002) Molecular epidemiology of Plasmodium fal-
ciparum infections among asymptomatic inhabitants of a holoendemic malarious area in northern Ghana. Tropical
Medicine and International Health, volume 7 no 5 pp 421–428.
112 Baird JK, S. Owusiu-Agyei S, Utz GC, Koram K, Barcus MJ, Jones TR, Fryauff DJ, Binka FN, Hoffman SL, AND Nk-
rumah FN (2002) Seasonal malaria attack rates in infants and young children in northern Ghana. Am. J. Trop. Med.
Hyg., 66(3), 2002, pp. 280–286.

41
Studies conducted during the dry season have shown consistently lower prevalence of malaria parasitemia among children in Accra than in smaller communities of the surrounding coastal ecological zone. Likewise, with only one exception (Moshie Zongo of Kumasi), dry season measurements of the prevalence of malaria parasitemia have been consistently lower for children in Kumasi than for children living in smaller communities of the forest zone. Of note, out of 308 children assessed in March 2006 in Obuasi, Ghana’s fifth largest city (population about 170,000), 40.3% were positive for malaria parasites by microscopy. Finally, dry season measurements have also shown a lower prevalence among children in Tamale (population about 400,000) than in smaller communities of Ghana’s savannah zone. Wet season measurements (or measurements for which the season was not specified) compare in a similar fashion.
Such comparisons need to be interpreted in light of the varying age groups that were assessed in different studies. All of the statistics presented for Tamale and the northern region, however, come from a single research study of children 6 months to 9 years of age.101
If the data from each study and study location (as specified by the geo-coordinates given in the MAP database)25 are assumed to represent a separate cluster of a larger “meta-study”, it is possible to determine the statistical significance of these comparisons. For such an analysis, all cases examined from all available studies were pooled together. Note that, in some cases, samples with differing age distributions are compared for the forest and coastal zones.113 The results of such analyses are presented in Table 8 and Table 9.
Table 8 limits the analysis to measurements made during the dry season on children less than 10 years of age. Table 9 presents the findings from analysis of all available measurements of children less than 18 years of age whether collected in the dry season or the wet season. Both analyses show that children living in Accra, Kumasi, and Tamale had a significantly lower prevalence of malaria parasitemia compared to children living in smaller communities or rural areas of the surrounding ecological zone.
Table 8 also presents, for each of the three ecological zones, the risk ratio of malaria parasitemia during the dry season for children living in the largest city compared to children living in smaller communities of the same ecological zone.114 Children living in Accra were 73% (95% C.I. = 62% to 81%) less likely than children in smaller communities of the coastal zone to be infected with malaria. Children living in Kumasi were 79% (95% C.I. = 58% to 90%) less likely than children in smaller communities of the forest zone to be infected with malaria. Children living in Tamale were 34% (95% C.I. = 18% to 48%) less likely than children in smaller communities of the savannah zone to be infected with malaria.
113 Measurements by Klinkenberg et al. in Accra and Kumasi were limited to children less than 5 years of age where-
as some data for the comparison communities is from older children.
114 The 95% confidence intervals of these risk ratios were calculated with poisson regression using STATA’s svypois-
son command to adjust for cluster sampling and provide for robust estimates of confidence intervals. Refer to
Analysis of surveys with Epi Info and STATA. UCLA. www.ph.ucla.edu/epi/rapidsurveys/RScourse/probstata_epi-
infoex.pdf.

42
Table 8: Percentage of children under ten years of age with malaria parasitemia (by microscopy) and risk ratio, for the largest city compared to smaller communities of each ecological zone. From various studies* conducted during the dry season of various years.
Ecological zone
Coastal Forest Savanna
a) % parasitemic in smaller
communities (95% C.I.)
55.6% (41.7% - 69.4%)
Obuasi = 40.3% (40.3%)
61.4% (56.8% - 66.1%)
b) % parasitemic in the largest
city (95% C.I.)
Accra = 14.9% (11.2% - 18.5%)
Kumasi = 8.3% (2.4% - 14.1%)
Tamale = 40.3% (31.5% - 49.0%)
Risk ratio = B / A (95% C.I.) 0.27 (0.19 – 0.38)
0.21 (0.10 – 0.42)
0.66 (0.52 – 0.82)
*see Table 7 for references.
Table 9: Percentage of children under 18 years of age with malaria parasitemia (by microscopy). From various studies* conducted either during the dry season or during the wet season of various years.
Size of community Ecological zone
Coastal Forest Savanna
% parasitemic in smaller communities (95% C.I.)
51.3% (44.3% - 58.3%)
30.7% (19.9% - 41.4%)
68.1% (57.2% - 78.9%)
% parasitemic in the largest city (95% C.I.)
Accra = 15.3% (12.5% - 18.1%)
Kumasi = 10.7% (4.2% - 17.2%)
Tamale = 40.2% (31.6% - 48.9%)
* see Table 7 for references.
Evidence from the 2011 MICS
Ghana’s 2011 MICS was the first study to measure malaria parasitemia in a nationally representative sample of children in Ghana. Table 10 shows that the prevalence of malaria parasitemia, anemia and fever in children were all lower in large cities than in smaller communities. The prevalence of malaria parasitemia declined more sharply than anemia and fever as the size of the community increased.

43
Table 10: The prevalence of malaria parasitemia, anemia and fever in children 6 to 59 months of age, by community size, 2011 MICS
Size of community % of children with parasitemia (by microscopy)
(95% C.I.)
% of children with anemia (Hgb <10 g/dl)
(95% C.I.)
% of children with fever in the last 2 weeks
(95% C.I.)
Rural (<5,000) 38.8% (35.2% - 42.4%)
42.1% (39.2% - 45.0%)
23.0% (21.2% – 24.8%)
Town (5,000 to 50,000) 19.2% (15.4% - 23.0%)
29.5% (25.1% - 33.9%)
18.9% (15.5% - 22.2%)
Small city (50,000 to 150,000) 14.7% (6.4% - 23.0%)
23.2% (25.4% - 31.0%)
18.3% (13.1% - 23.5%)
Medium city (150,000 to 500,000)
13.0% (4.2% - 21.8%)
25.5% (16.0% - 35.0%)
16.1% (11.1% - 21.0%)
Large city (>1,000,000) 3.8% (1.5% - 6.2%)
16.0% (11.1% - 21.0%)
11.3% (8.2% - 14.3%)
These findings are confounded by ecology, as all of the children living in large cities also live in the coastal or forest zone where the prevalence of malaria parasitemia is lower than in the northern savannah of Ghana (Annex 7 and Annex 8). However, stratified analysis (Table 11) shows that the prevalence of malaria parasitemia by microscopy among children 6 to 59 months was significantly lower in the two largest cities than in rural areas of the same ecological zone.

44
Table 11: Percentage of children with malaria parasitemia (by microscopy), by community size and ecological zone, 2011 MICS
Population of the community
% of children with malaria parasitemia (by micro.)(95% C.I.)
Coastal zone Forest Savannah
Rural (<5,000) 24.3% (16.2%-32.3%)
34.7% (29.5%-40.0%)
51.7% (47.1%-56.2%)
Towns (5,000 to 50,000) 12.8% (6.9%-18.8%)
20.8% (14.6%-26.9%)
25.2% (19.3%-31.3%)
Small cities(50,000 to 150,000)
10.9% (0%-23.6%)
18.3% (7.5%-29.1%)
6.5% (1.9%-11.2%)
Medium cities (150,000 to 600,000)
17.1%*** (3.2%-31.1%)
* Tamale=16.4% (5.1%-27.7%)
Large cities(>2,000,000) Accra = 3.3% (0.5%-6.1%)
Kumasi = 5.3% (1.1%-9.4%)
----**
* Fewer than 25 observations (Obuasi).
** There are no large cities in Ghana’s savannah zone.
*** Sekondi-Takoradi and Cape Coast are the medium-sized cities of the coastal zone.
Comparable results are obtained from analysis of the data from rapid diagnostic testing as shown in Annex 11.
Tamale is the only medium-sized city in Ghana’s savannah zone. The prevalence of malaria parasitemia (by microscopy and by RDT) among the 89 children tested in Tamale was significantly lower than that of children living in rural areas of the savannah.
Only 18 children were examined in Obuasi, the only medium sized city in the forest zone. This is too few to generate reliable statistics. None of these children had parasites by microscopy and 4 were positive by RDT.

45
Of the 54 children tested in Sekondi-Takoradi or Cape Coast, the medium-sized cities of the coastal zone, the variance between clusters (and the resulting confidence interval) was so wide that there was not a statistically significant difference between the prevalence in these medium-sized cities and the prevalence in rural areas of the coastal zone (p = 0.39).115 Table 12 presents, for each of the three ecological zones, the risk ratio of malaria parasitemia for children living in the largest city compared to children living in rural areas of the same ecological zone.116 Children living in Accra were 86% (95% C.I. = 66% to 94%) less likely than children in rural areas of the coastal zone to be infected with malaria. Children living in Kumasi were 85% (95% C.I. = 66% to 95%) less likely than children in rural areas of the forest zone to be infected with malaria. Children living in Tamale were 68% (95% C.I. = 37% to 84%) less likely than children in rural areas of the savannah zone.
Table 12: Relative risk (RR) of malaria parasitemia (by microscopy) for children in the largest city compared to children living in rural areas of each ecological zone, 2011 MICS
Coastal zone Forest Savannah
Relative risk
(95% C.I.)
Accra
0.14 (0.06 – 0.34)
Kumasi
0.15 (0.07 – 0.34)
Tamale
0.32 (0.16 – 0.63)
Findings from analysis of the 2011 MICS substantiate findings from analysis of data from a comprehensive compilation of research studies conducted in specific locations of Ghana. The prevalence of malaria parasitemia in children is significantly lower in Accra, Kumasi and Tamale than in smaller neighborhoods of the surrounding ecological zone.
As shown in Table 13, in the great majority of neighborhoods (EAs) sampled for the 2011 MICS there were no children with malaria parasitemia. This provides evidence that malaria in these large cities is clustered in a small number of neighborhoods. This will be discussed further in the section of the report related to determinants of malaria within the cities of Ghana.
115 The wide variance between clusters as well as the moderate mean prevalence are due to one enumeration area
in Sekondi-Takoradi where 4 out of 11 children were positive by microscopy and 5 out of 11 were positive by RDT.
If this single enumeration area is excluded from the analysis, then the point estimate of the prevalence of parasit-
emia by microscopy drops to 7.5%, the 95% confidence interval narrows to 1.2% to 13.8% and the difference with
the prevalence in rural areas becomes statistically significant. Likewise, if this EA is excluded, the prevalence of
parasitemia by RDT drops to 10.3%, the 95% confidence interval narrows to 1.8% to 18.8% and the difference with
the prevalence in rural areas becomes statistically significant.
116 The 95% confidence intervals of these risk ratios were calculated with poisson regression using STATA’s svypoisson
command to adjust for cluster sampling and provide a robust estimate of confidence intervals. Refer to Analysis of
surveys with Epi Info and STATA. UCLA. www.ph.ucla.edu/epi/rapidsurveys/RScourse/probstata_epiinfoex.pdf.

46
Table 13: Percentage of enumeration areas (EAs) in which no children were found to be parasitemic, by community size and laboratory method, 2011 MICS
Population of the community
% of EAs where no children were detected with parasitemia using:
Microscopy RDT
Rural (<5,000) 18% (92/501) 5% (24/501)
Town (5,000 to 50,000) 48% (72/151) 28% (43/151)
Small city (50,000 to 150,000)
71% (37/52) 35% (18/52)
Medium city (150,000 to 500,000)
71% (24/34) 56% (19/34)
Large city (>1,000,000) 84% (58/69) 80% (55/69)
All communities nationwide
34.5% (275/797) 19.0% (151/797)
The prevalence of anemia in children was also lower in Accra and Kumasi than in rural areas of the same ecological zone (Table 14).
Table 14: The prevalence of anemia in children 6 to 59 months, by community size and ecological zone, 2011 MICS
Population of the community
% of children with anemia (hemoglobin < 10 g/dl)
Coastal zone Forest Savannah
Rural (<5,000) 36.4% (30.4%-42.3%)
33.0% (28.9%-34.1%)
56.9% (52.9%-60.8)
Towns (5,000 to 50,000) 23.2% (15.4%-31.0%)
28.1% (22.1%-34.1%)
36.9% (27.8%-46.1%)
Small cities(50,000 to 150,000)
22.1% (0%-45.5%)
17.1% (%9.6%-24.5%)
40.1% (30.8%-49.4)
Medium cities (150,000 to 600,000)
23.2% (12.8%-33.7%)
Obuasi= 4.6% (0%-12.8%)
Tamale=43.5% (28.6%-58.5%)
Large cities(>2,000,000) Accra = 22.0% (14.5%-29.6%)
Kumasi = 5.1% (0.3%-9.8%)
----
On the other hand, the percentage of children reported to have been sick with fever in the last 2 weeks did not vary significantly by community size (Table 15).
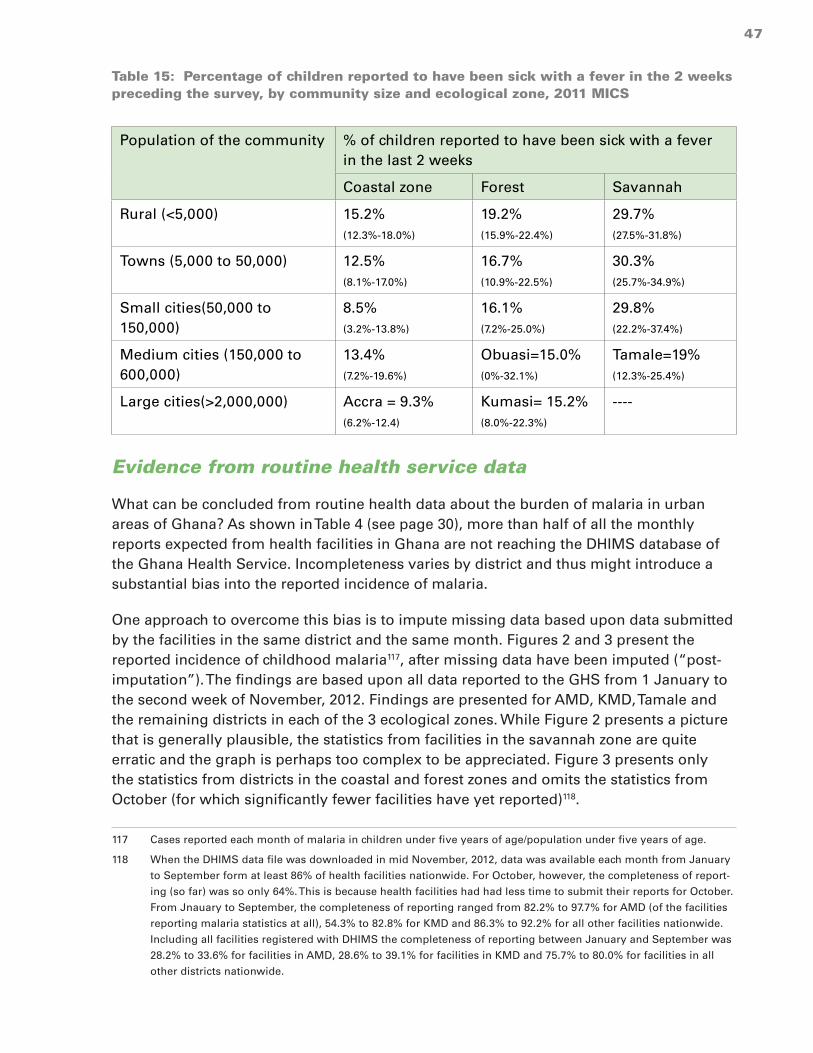
47
Table 15: Percentage of children reported to have been sick with a fever in the 2 weeks preceding the survey, by community size and ecological zone, 2011 MICS
Population of the community % of children reported to have been sick with a fever in the last 2 weeks
Coastal zone Forest Savannah
Rural (<5,000) 15.2% (12.3%-18.0%)
19.2% (15.9%-22.4%)
29.7% (27.5%-31.8%)
Towns (5,000 to 50,000) 12.5% (8.1%-17.0%)
16.7% (10.9%-22.5%)
30.3% (25.7%-34.9%)
Small cities(50,000 to 150,000)
8.5% (3.2%-13.8%)
16.1% (7.2%-25.0%)
29.8% (22.2%-37.4%)
Medium cities (150,000 to 600,000)
13.4% (7.2%-19.6%)
Obuasi=15.0% (0%-32.1%)
Tamale=19% (12.3%-25.4%)
Large cities(>2,000,000) Accra = 9.3% (6.2%-12.4)
Kumasi= 15.2% (8.0%-22.3%)
----
Evidence from routine health service data
What can be concluded from routine health data about the burden of malaria in urban areas of Ghana? As shown in Table 4 (see page 30), more than half of all the monthly reports expected from health facilities in Ghana are not reaching the DHIMS database of the Ghana Health Service. Incompleteness varies by district and thus might introduce a substantial bias into the reported incidence of malaria.
One approach to overcome this bias is to impute missing data based upon data submitted by the facilities in the same district and the same month. Figures 2 and 3 present the reported incidence of childhood malaria117, after missing data have been imputed (“post-imputation”). The findings are based upon all data reported to the GHS from 1 January to the second week of November, 2012. Findings are presented for AMD, KMD, Tamale and the remaining districts in each of the 3 ecological zones. While Figure 2 presents a picture that is generally plausible, the statistics from facilities in the savannah zone are quite erratic and the graph is perhaps too complex to be appreciated. Figure 3 presents only the statistics from districts in the coastal and forest zones and omits the statistics from October (for which significantly fewer facilities have yet reported)118.
117 Cases reported each month of malaria in children under five years of age/population under five years of age.
118 When the DHIMS data file was downloaded in mid November, 2012, data was available each month from January
to September form at least 86% of health facilities nationwide. For October, however, the completeness of report-
ing (so far) was so only 64%. This is because health facilities had had less time to submit their reports for October.
From Jnauary to September, the completeness of reporting ranged from 82.2% to 97.7% for AMD (of the facilities
reporting malaria statistics at all), 54.3% to 82.8% for KMD and 86.3% to 92.2% for all other facilities nationwide.
Including all facilities registered with DHIMS the completeness of reporting between January and September was
28.2% to 33.6% for facilities in AMD, 28.6% to 39.1% for facilities in KMD and 75.7% to 80.0% for facilities in all
other districts nationwide.

48
What can we conclude from these statistics about the reported incidence of childhood malaria?
1. The reported incidence was lowest in the coastal zone, intermediate in the forest zone and highest in the savannah zone.
2. The reported incidence increased sharply around May and began to drop around September.
3. The reported incidence is significantly lower in AMD, KMD and Tamale than in other districts of their surrounding ecological zones.
4. While we can impute data for health facilities that reported malaria cases at least once during 2012, this is not possible for health facilities which have not reported malaria cases at all during this year. As shown in Table 4 (page 30), a significantly lower percentage of health facilities in Accra (46 of 131 facilities registered in the DHIMS) and Kumasi (70 out of 133 DHIMS-registered health facilities) than elsewhere in the country (2,927 out of 3,398 DHIMS-registered health facilities) reported any malaria data at all during 2012. Hence, even after imputing missing data for facilities that did report, lower percentages of cases were reported from AMD and KMD than nationwide.
Figure 2

49
Figure 3
The majority of the reported cases of malaria were not confirmed by laboratory tests and thus not reliably diagnosed (Table 3 – page 29). This conclusion is supported by the finding that the percentage of sick children less than 5 years of age who were diagnosed with malaria varied little by season and between ecological zones (Figure 4). The increase in reported malaria cases during the rainy months (Figures 2 and 3) was closely matched by an increase in outpatient attendance by sick children (i.e. for all diseases) during these same months (Figure 5). The lower number of malaria cases reported from AMD and KMD (Figure 3) was also closely matched by the lower level of outpatient attendance compared to other districts of the surrounding ecological zone119 (Figure 5).
119 Reported per capita <5 OPD attendance for all causes was also lower in the south than in the north and lower in
Tamale than in the rest of the savannah zone (data not shown).

50
Figure 4
Figure 5

51
Donovan et al.120 had identical findings from analysis of routine health data reported from Accra between 2001 and 2006 (Figure 6). They noted that, each and every year from 2001 to 2006, reported cases of malaria accounted for 45% to 49% of all under-five OPD atstendance, 35% to 39% of over-five OPD attendance and 37% to 41% of total OPD attendance. As shown by the line in Figure 6, these steady percentages (with minor increases of a few percentage points during the rainy season) for each age group did not increase even in 2005 when outpatient attendance was 22% higher than during average years.121
Figure 6: Visits to health facility in Accra due to all causes and visits reported to be due to malaria, Accra, 2001 – 2006. Routine data of the GHS. From Donovan et al.
Throughout Ghana (including in the large cities), under-five OPD attendance increases during the rainy season. Clinical staff in all parts of the country and during all seasons presumptively diagnose a roughly constant percentage of sick children as having “malaria”. This percentage varies from one location to another (i.e. somewhat higher in
120 Donovan C, Siadat B and Frimpong J () Seasonal and socio-economic variations in clinical and self-reported ma-
laria in Accra, Ghana: Evidence from facility data and a community survey. Ghana Medical Journal. Vol 46, No. 2,
pages 85 - 94.
121 Donovan et al. suggest that this increase in 2005 in the number of reported cases of malaria is unlikely to have
been due to changes in the incidence of malaria. “… the peak in presumptive malaria is reflective of an overall
increase in health facility visits in 2005. Rainfall during this period was not unusually high; and, in fact, the total
rainfall for 2005 (778 mm) was very close to the average for the 2001 – 2006 period of 789 mm.”

52
Kumasi and somewhat lower in Accra), but the pattern of constant presumptive diagnosis appears to hold in all locations studied. As a result, data on the reported incidence of malaria does not provide a reliable indication of the burden of malaria.
Even with the problems of incomplete reporting, presumptive diagnosis and variable use of lab confirmation, the malaria test positivity rate (TPR) may offer another means to monitor the burden of malaria in various locales. The Ministry of Health/Ghana Health Service and the U.S. PMI supported 5 sentinel sites during 2009 to 2010 to collect higher quality malaria data including the data required to calculate the TPR (Figure 7). The TPR for the sentinel site located in Accra (Maamobi Hospital) was consistently and markedly lower than the rates reported by the sites located in smaller, more rural communities. There was not, however, any clear increase in the TPR during the rainy season months of Q2 2009 and Q3 2009.
Figure 7
Figure 8 presents findings from a large data set (from over 17,000 microscopic tests) compiled from Achimota Hospital of AMD by one of the analysts for the Ghana Urban Malaria Study.122 Note that the TPR increased during the rainy season months of June, July and August. Also note that the TPR for ANC clients (most of whom were probably tested in spite of not having any signs or symptoms of malaria) was consistently less than 5% while the TPR for non-pregnant clients was more than 5% during most months. Further investigation is required to document the circumstances under which malaria tests are
122 As a laboratorian,Worlanyo Pida took a special interest in assessing laboratory data that could measure the
burden of malaria. The 17,172 clients tested included 335 to 441 ANC patients/month, 168 to 364 sick under fives/
month and 630 to 1189 sick patients 5 years or older/month.

53
performed at Achimota Hospital and other clinics in Ghana, however, it is likely that the great majority of these non-pregnant clients were tested because they had fever or other signs or symptoms of malaria.
Figure 8
Figure 9 presents the malaria test positivity rates, by month, as calculated from the data routinely reported so far in 2012 by health facilities nationwide. As discussed in the methods section, inconsistent data were reported for a large number of months for a large number of health facilities. These included months where a facility reported the number of tests but failed to report any laboratory confirmed cases. These also included months where a facility reported more laboratory confirmed cases of malaria than laboratory tests performed. Such inconsistent data had to be omitted before the DHIMS data could be analyzed. At least one month of consistent TPR data are available for only 51% of the facilities nationwide (1,577 out of 3,043). From this subset of 1,577 facilities, consistent TPR data are available for only 37% of months from January to September 2010.
Figure 9

54
* Excluding data for months where reported lab-confirmed malaria cases > reported lab tests performed or
where lab-confirmed cases were not reported.
Overall, there was little variation by season in the nationwide malaria test positivity rate. Graphs from additional analyses of the TPR, stratified by ecological zone are shown in Annex 12. These graphs show that once inconsistent data are omitted the reported TPRs for Accra, Kumasi and Tamale are lower than the TPRs for almost all other districts in the same ecological zone. However, these findings are based upon very few data points (12 facilities for 78 total months in the case of AMD; 5 facilities for 18 total months in the case of KMD) and the resulting TPRs are higher than those reported by facilities that are closely supervised (i.e. see Figure 7 and Figure 8 on previous pages).
Summary of the evidence that the burden of malaria is lower in urban areas than in rural areas
There is compelling evidence from entomological studies, community prevalence studies and the 2011 MICS that the burden of malaria is significantly lower in Accra, Kumasi and Tamale than in smaller communities of the respective ecological zone.
Apart from these three cities, it is less clear to what extent the burden of malaria is lower in other cities and towns of Ghana compared to rural areas. Data from the 2011 MICS suggest that these other cities and towns may have a prevalence of malaria parasitemia that is intermediate between large cities and rural areas. The sample sizes are too small to conclude that the prevalence of malaria parasitemia is lower in any of these other cities and towns than in rural areas.
As a result of presumptive diagnosis, incompleteness of reporting, uncertainty about the catchment population and differences in care seeking practices, the malaria data that is now routinely reported by health facilities is not sufficiently reliable to reach robust conclusions about urban/rural differences in the burden of malaria. The available data suggest that less than one third of malaria diagnoses are confirmed with laboratory tests and that, regardless of the season, clinical staff in all parts of the country diagnose roughly 40% to 50% of all sick children as having “malaria”.
The malaria testing positivity rate has potential as an indicator of malaria burden that is relatively robust. It can be calculated for each health facility even when data for some months are missing and even when the catchment population of the health facility is uncertain. However, there are significant problems with the quality of malaria testing data that that are now captured by the DHIMS database of the Ghana Health Service. These data quality issues interfere with meaningful interpretation of the TPR data from most health facilities and most districts of the country.
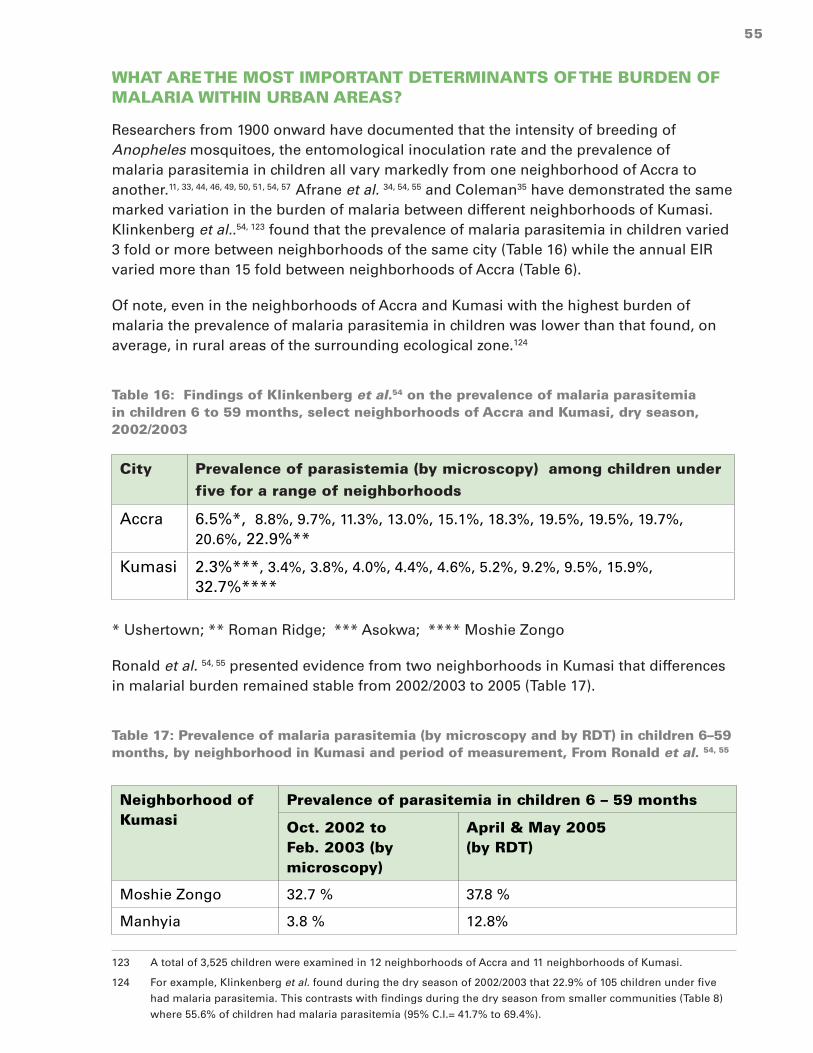
55
WHAT ARE THE MOST IMPORTANT DETERMINANTS OF THE BURDEN OF MALARIA WITHIN URBAN AREAS?
Researchers from 1900 onward have documented that the intensity of breeding of Anopheles mosquitoes, the entomological inoculation rate and the prevalence of malaria parasitemia in children all vary markedly from one neighborhood of Accra to another.11, 33, 44, 46, 49, 50, 51, 54, 57 Afrane et al. 34, 54, 55 and Coleman35 have demonstrated the same marked variation in the burden of malaria between different neighborhoods of Kumasi. Klinkenberg et al..54, 123 found that the prevalence of malaria parasitemia in children varied 3 fold or more between neighborhoods of the same city (Table 16) while the annual EIR varied more than 15 fold between neighborhoods of Accra (Table 6).
Of note, even in the neighborhoods of Accra and Kumasi with the highest burden of malaria the prevalence of malaria parasitemia in children was lower than that found, on average, in rural areas of the surrounding ecological zone.124
Table 16: Findings of Klinkenberg et al.54 on the prevalence of malaria parasitemia in children 6 to 59 months, select neighborhoods of Accra and Kumasi, dry season, 2002/2003
City Prevalence of parasistemia (by microscopy) among children under five for a range of neighborhoods
Accra 6.5%*, 8.8%, 9.7%, 11.3%, 13.0%, 15.1%, 18.3%, 19.5%, 19.5%, 19.7%, 20.6%, 22.9%**
Kumasi 2.3%***, 3.4%, 3.8%, 4.0%, 4.4%, 4.6%, 5.2%, 9.2%, 9.5%, 15.9%, 32.7%****
* Ushertown; ** Roman Ridge; *** Asokwa; **** Moshie Zongo
Ronald et al. 54, 55 presented evidence from two neighborhoods in Kumasi that differences in malarial burden remained stable from 2002/2003 to 2005 (Table 17).
Table 17: Prevalence of malaria parasitemia (by microscopy and by RDT) in children 6–59 months, by neighborhood in Kumasi and period of measurement, From Ronald et al. 54, 55
Neighborhood of Kumasi
Prevalence of parasitemia in children 6 – 59 months
Oct. 2002 to Feb. 2003 (by microscopy)
April & May 2005 (by RDT)
Moshie Zongo 32.7 % 37.8 %
Manhyia 3.8 % 12.8%
123 A total of 3,525 children were examined in 12 neighborhoods of Accra and 11 neighborhoods of Kumasi.
124 For example, Klinkenberg et al. found during the dry season of 2002/2003 that 22.9% of 105 children under five
had malaria parasitemia. This contrasts with findings during the dry season from smaller communities (Table 8)
where 55.6% of children had malaria parasitemia (95% C.I.= 41.7% to 69.4%).

56
Proximity to urban agriculture
Such findings raise the question of what factors contribute to a higher burden of malaria in certain metropolitan neighborhoods. Of the research done to date, proximity to urban agriculture is the determinant for which the most evidence has accumulated. Afrane123, Klinkenberg et al.11, 33, 54 and Coleman125 have demonstrated this for both Accra and Kumasi. Higher EIRs were measured in neighborhoods less than 1 kilometer from urban agricultural plots compared to neighborhoods more than 1 kilometer from such plots (Table 18).
Table 18: Annual entomological inoculation rates of select neighborhoods of Accra and Kumasi, by proximity to urban agriculture
City Distance from agriculture
EIR mean
Range of EIRs for various neighborhoods
Reference
Accra >1 km 6.6 4.9 – 25.2 Klinkenberg (2008)124, 33
Accra < 1 km 19.2 6.1 – 44.7 Klinkenberg (2008)124
Kumasi > 1 km 13.5 * Afrane (2004)125
Kumasi < 1 km 89.8 * Afrane (2004)125
Kumasi < 1 km 21.5 ** Coleman (2009)126,127
Kumasi Peri-urban 133.6 * Afrane (2004)125 126127128
* The range of EIR measurements for various neighborhoods of Kumasi was not reported.
** A single measurement for one geographic area.
125 Klinkenberg et al. (2008) Impact of urban agriculture on malaria vectors in Accra, Ghana. Malaria Journal 2008,
7:151.
126 Afrane et al. (2004) Does irrigated urban agriculture influence the transmission of malaria in the city of Kumasi,
Ghana? Acta Tropica 89 (2004) 125–134.
127 Coleman, S. (2009) Studies of Entomological Parameters and Perception of Malaria Transmission on the Kwame
Nkrumah University of Science and Technology campus, in the Ashanti Region of Ghana. A thesis submitted for
the award of Master of Science in Clinical Microbiology.
128 Given the range of EIRs documented by Klinkenberg et al. for various neighborhoods of Accra, Coleman’s findings
(EIR=21.5 near to agricultural plots on the KNUST campus) are entirely consistent with the findings of Afrane et al.
(average EIR = 89.8 for 4 other Kumasi neighborhoods near to agricultural plots).

57
Figure 10: Locations in and around Kumasi sampled by Afrane et al. UW= > 1 km from agriculture; UA= <1 km from agriculture; PU= peri-urban
Afrane et al.123 also showed that the EIR was even higher four periurban locations (see PU1 to PU4 in Figure 10). As shown in Figure 11, due to the tree cover, each of the urban agricultural sites studied by Afrane et al. and Coleman can be discerned from satellite images of Kumasi. Figure 11, a Google Earth image of the eastern boundary of Kumasi, also shows how the developed, largely treeless portion of Kumasi extends up to but seldom outside of the boundary of KMD (shown by the white dotted line in the middle of the photo.
Figure 11: The six neighborhoods of Kumasi with urban agriculture that were studied by Afrane et al. or by Coleman: Manhyia, Airport, KNUST/Gyinase, Ayigya, Ayeduase
Manhyia
Airport
KNUST/ Gyinyase
Ayigya
Ayeduase

58
Afrane et al.123, 129 and Coleman124 found that breeding of Anopheles mosquitoes in neighborhoods near to urban agricultural plots was confined to hand-dug wells, furrows and human footprints (Annex 13).
From these studies, Afrane conclude that “…irrigation schemes such as those created for vegetable farming produce over 80% of malaria vectors which are involved in the transmission of malaria in the city of Kumasi.”
Household surveys in Accra during the dry season showed that the prevalence of malaria parasitemia among children 6 to 59 months of age was higher in neighborhoods close to urban agricultural plots than in neighborhoods further from urban agricultural plots (Table 19). However, the researchers were unable to show the same association between childhood malaria parasitemia and urban agriculture in Kumasi.
Table 19: Prevalence of malaria parasitemia (by microscopy) among children 6 to 59 months of age, by city and proximity to urban agriculture. From Klinkenberg et al.130
City Distance of the neighborhood to urban agriculture
< 1 km >= 1 kmAccra** 16.3 %* 11.2 %* Kumasi 7.8 % 1.3 %
* p = 0.018.
Unfortunately, the MICS questionnaire collected no data on proximity of the house to bodies of water or agricultural plots or any other aspect of the environment surrounding the house.
Household wealth and socio-economic status
Klinkenberg et al. also found that the prevalence of malaria parasitemia was higher among children living in poorer households of the large cities (Table 20).
129 Afrane et al. (2004) Does irrigated urban agriculture influence the transmission of malaria in the city of Kumasi,
Ghana? Acta Tropica 89 (2004) 125–134.
130 Klinkenberg et al. (2006) Urban malaria and anaemia in children: a cross-sectional survey in two cities of Ghana.
Trop Med Int Health 2006; 11: 578– 88.

59
Table 20: Prevalence of malaria parasitemia (by microscopy) in children 6 to 59 months, by city and household SES. From Klinkenberg et al.127
City Below average SES
(95% C.I.)
Above average SES
(95% C.I.)
Accra 17.2 %*
(14.5% – 19.8%)
12.5 %*
(10.4% – 14.6%)
Kumasi 11.2 %
(8.0% – 15.7%)
5.8 %
(4.1% – 7.4%)
* p = 0.006.
Table 21 presents findings from analysis of data from the 2011 MICS. For houses sampled within Accra and Kumasi, although there appears to be a trend towards lower prevalence as household wealth increases, these differences are not statistically significant.131 On the other hand, for houses sampled in all urban areas, the prevalence of malaria parasitemia is significantly lower for children living in the wealthiest 40% of houses compared to children living in the poorest 60% of houses.132
131 This reflects the small sample size (only 279 children were tested in Accra and Kumasi) and the fact that we are
trying to distinguish between quite small percentages (e.g. 7.5% vs. 1.9%). If the analysis is limited to two wealth
categories (above and below average, as with Klinkenberg et al.), we find that the prevalence of parasitemia among
children living in households of below average wealth was significantly higher than the prevalence of malaria para-
sitemia among children living in households of above average wealth. See annex 21 for table of Prevalence of para-
sitemia (by microscopy) in children 6 to 59 months, by wealth of household in Accra or Kumasi, 2011 MICS.
132 As for Accra and Kumasi, few households in urban communities fall into the poorest national wealth quintile. As
a result, the confidence intervals for the point estimate for urban houses in the lowest national quintile are very
wide. However, when data from urban houses in the lowest 3 national quintiles are pooled, the prevalence for this
group is significantly lower than the prevalence for urban houses in the highest 3 national wealth quintiles.

60
Table 21: Prevalence of malaria parasitemia (by microscopy) among children 6 to 59 months of age, by locale and wealth quintile, 2011 MICS
Locale Household wealth quintile
1 (poorest)
(95% C.I.)
2
(95% C.I.)
3
(95% C.I.)
4
(95% C.I.)
5 (wealthiest)
(95% C.I.)
Accra or Kumasi
6.6%* (0.3% - 12.9%)
4.0% (0% -10.6%)
2.5% (0% - 7.5%)
3.1% (0% - 7.7%)
2.3%* (0% - 6.7%)
Urban – coastal or forest zone
29.5% (0% - 68.6%)
30.1% (18.9%-41.2%)
20.5% (14.5%-26.5%)
9.9% (5.4%-14.4%)
3.3% (1.1%-5.5%)
Rural – coastal or forest zone
46.7% (37.1% - 56.3%)
38.3% (33.0% - 43.5%)
29.3% (23.1% - 35.5%)
12.6% (7.2% - 18.1%)
3.7% (0% - 10.7%)
*p = 0.075 comparing the prevalence among children living in the poorest quintile of houses in Accra and Kumasi to the prevalence among children living in the wealthiest quintile.
From review of Table 21, it is remarkable that childhood malaria parasitemia varies much more by household wealth in rural areas than it does in the two large cities133. In particular, note that, compared to children living in rural households, the prevalence of malaria parasitemia is quite low even among the children living in the poorest quintile of households in Accra and Kumasi.
Table 22 presents findings from analysis of the 2011 MICS malaria parasitemia data by education of the mother. Once again, the sample sizes are too small to distinguish statistically significant differences between groups within Accra and Kumasi.
133 This is largely because there is much more of a range of household wealth in rural areas than in Accra and Ku-
masi. For this reason, as discussed in the methods section of this report, principal components analysis was used
to define wealth quintiles for all households sampled from Accra and Kumasi. Hence the wealth quintiles used for
the Accra and Kumasi rows of Table 22 are different from the wealth quintiles used for the rural row and the urban
row of the Table.
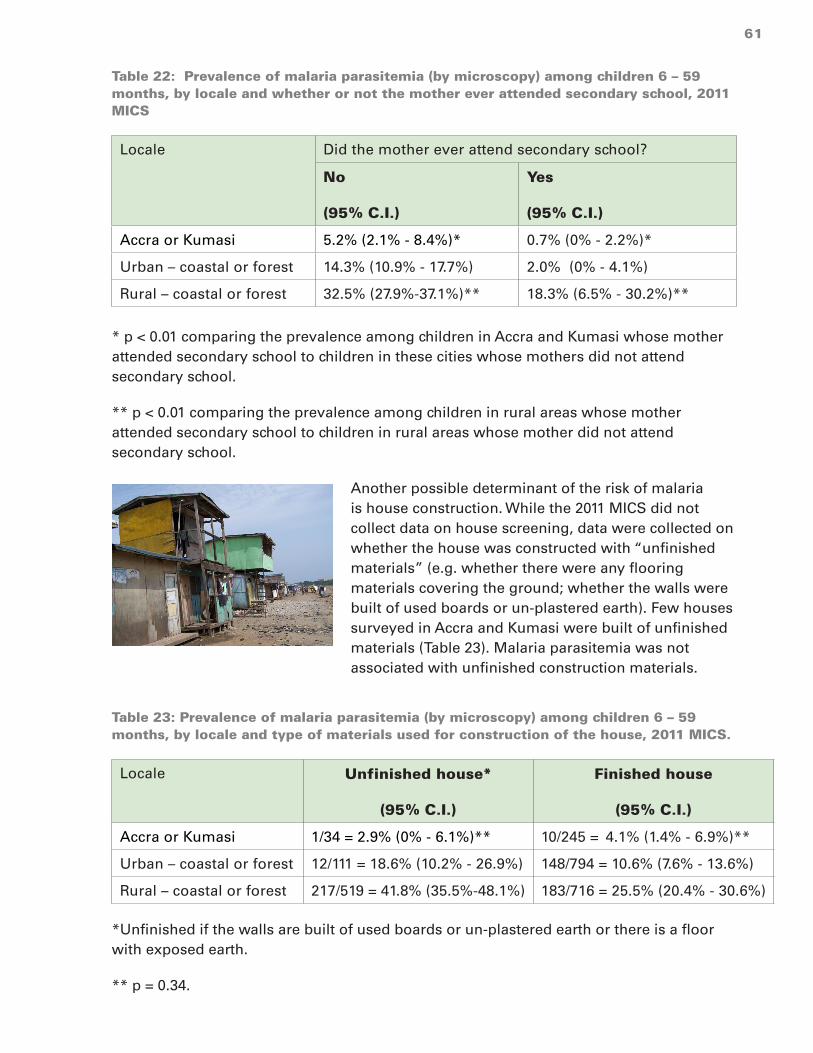
61
Table 22: Prevalence of malaria parasitemia (by microscopy) among children 6 – 59 months, by locale and whether or not the mother ever attended secondary school, 2011 MICS
Locale Did the mother ever attend secondary school?
No
(95% C.I.)
Yes
(95% C.I.)
Accra or Kumasi 5.2% (2.1% - 8.4%)* 0.7% (0% - 2.2%)*
Urban – coastal or forest 14.3% (10.9% - 17.7%) 2.0% (0% - 4.1%)
Rural – coastal or forest 32.5% (27.9%-37.1%)** 18.3% (6.5% - 30.2%)**
* p < 0.01 comparing the prevalence among children in Accra and Kumasi whose mother attended secondary school to children in these cities whose mothers did not attend secondary school.
** p < 0.01 comparing the prevalence among children in rural areas whose mother attended secondary school to children in rural areas whose mother did not attend secondary school.
Another possible determinant of the risk of malaria is house construction. While the 2011 MICS did not collect data on house screening, data were collected on whether the house was constructed with “unfinished materials” (e.g. whether there were any flooring materials covering the ground; whether the walls were built of used boards or un-plastered earth). Few houses surveyed in Accra and Kumasi were built of unfinished materials (Table 23). Malaria parasitemia was not associated with unfinished construction materials.
Table 23: Prevalence of malaria parasitemia (by microscopy) among children 6 – 59 months, by locale and type of materials used for construction of the house, 2011 MICS.
Locale Unfinished house*
(95% C.I.)
Finished house
(95% C.I.)
Accra or Kumasi 1/34 = 2.9% (0% - 6.1%)** 10/245 = 4.1% (1.4% - 6.9%)**
Urban – coastal or forest 12/111 = 18.6% (10.2% - 26.9%) 148/794 = 10.6% (7.6% - 13.6%)
Rural – coastal or forest 217/519 = 41.8% (35.5%-48.1%) 183/716 = 25.5% (20.4% - 30.6%)
*Unfinished if the walls are built of used boards or un-plastered earth or there is a floor with exposed earth.
** p = 0.34.

62
Use of an ITN
According to the 2011 MICs, none of the 48 children living in Accra and Kumasi who were reported to have slept under an ITN the previous night had malaria parasitemia by microscopy (Table 24). This is significantly different from the prevalence (4.6%) among children who were reported to have not slept under an ITN the previous night. However, among all children living in urban communities (n=268) and all children living in rural communities (n=535) there was no association between reported sleeping under an ITN and the prevalence of malaria parasitemia.134
Table 24: Prevalence of malaria parasitemia (by microscopy) among children 6 – 59 months, by locale and whether or not they slept the previous night under an ITN, 2011 MICS
Locale Did not sleep under ITN
(95% C.I.)
Slept under an ITN
(95% C.I.)
Accra or Kumasi 11/231 = 4.6% (1.8% - 7.5%)
0/48= 0.0% (0)
Urban – coastal or forest 76/683 = 11.3%* (7.9% - 14.8)
36/268 = 12.3%* (7.2% - 17.4%)
Rural – coastal or forest 251/700 = 31.5%** (26.1% - 36.8%)
181/535 = 32.1%** (26.5% - 37.7%)
* p= 0.90
** p = 0.83
Summary of the evidence regarding the determinants of the burden of malaria within cities
Research studies as well as the 2011 MICS show that malaria transmission (EIR) and the prevalence of malaria parasitemia vary greatly between neighborhoods of Accra and Kumasi:
• Transmission of malaria (EIR) and prevalence of malaria parasitemia in children is, on average, higher near to areas of urban agriculture;
• The prevalence of malaria parasitemia among children living in the poorest households in Accra and Kumasi is 50% to 100% higher than the average for children in these two cities.
134 This paradoxical finding remains to be explained. There was also no association between reported sleeping under
an ITN and RDT result. The same finding was reported by the analysts who performed preliminary analysis of the
2011 MICS.
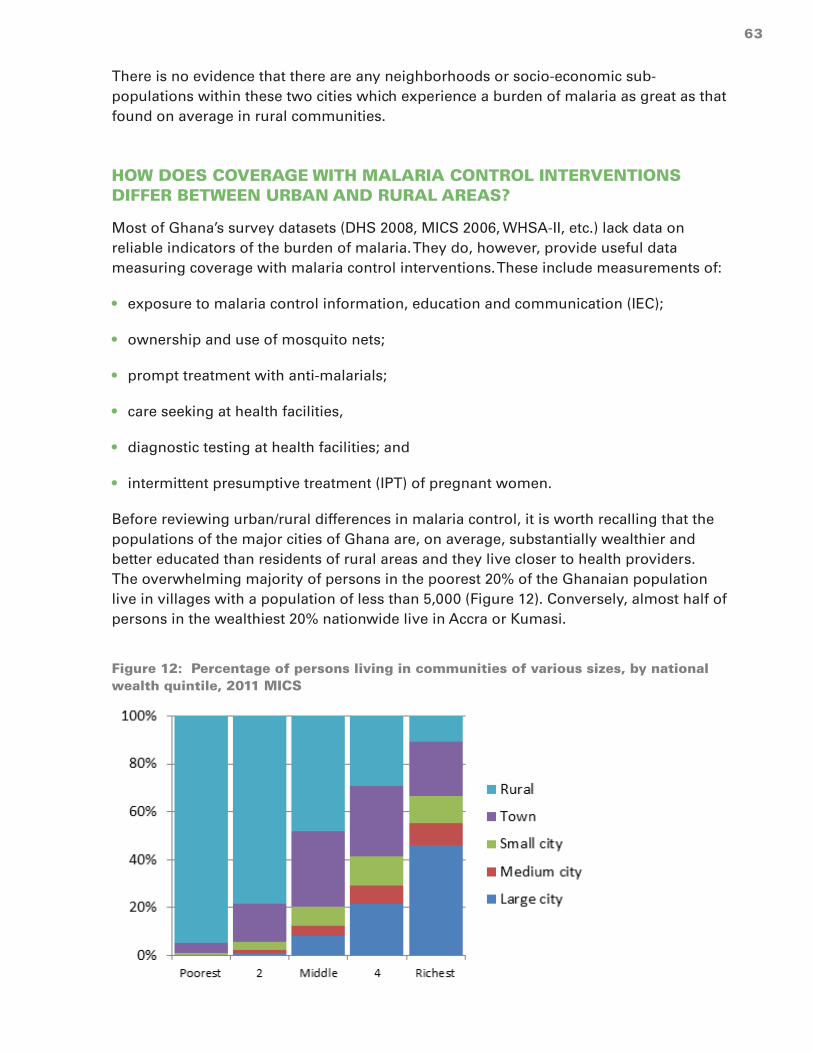
63
There is no evidence that there are any neighborhoods or socio-economic sub-populations within these two cities which experience a burden of malaria as great as that found on average in rural communities.
HOW DOES COVERAGE WITH MALARIA CONTROL INTERVENTIONS DIFFER BETWEEN URBAN AND RURAL AREAS?
Most of Ghana’s survey datasets (DHS 2008, MICS 2006, WHSA-II, etc.) lack data on reliable indicators of the burden of malaria. They do, however, provide useful data measuring coverage with malaria control interventions. These include measurements of:
• exposure to malaria control information, education and communication (IEC);
• ownership and use of mosquito nets;
• prompt treatment with anti-malarials;
• care seeking at health facilities,
• diagnostic testing at health facilities; and
• intermittent presumptive treatment (IPT) of pregnant women.
Before reviewing urban/rural differences in malaria control, it is worth recalling that the populations of the major cities of Ghana are, on average, substantially wealthier and better educated than residents of rural areas and they live closer to health providers. The overwhelming majority of persons in the poorest 20% of the Ghanaian population live in villages with a population of less than 5,000 (Figure 12). Conversely, almost half of persons in the wealthiest 20% nationwide live in Accra or Kumasi.
Figure 12: Percentage of persons living in communities of various sizes, by national wealth quintile, 2011 MICS

64
The Ghana Living Standard Survey135 of 2008 assessed total household expenditure in a nationwide sample and found that 46% of households in the Greater Accra Region fell into the top nationwide quintile and the average per capita expenditure of persons in this region was 63% greater than the national average and 54% greater than the next highest region136 (Annex 14).
Findings from nationwide household surveys in 2006, 2008 and 2011 show women in Ghana’s cities are, on average, better educated than those living in smaller communities and rural areas (Figure 13).
Figure 13: Percentage of women who have attended some secondary school. 2006 - 2011
Findings from the 2011 MICS suggest that women in Ghana’s largest cities have been more exposed to IEC promoting malaria control (Table 25). This is particularly true of the television advertisements promoting use of ACTs. From the questions posed about the cause of malaria, ways to protect against malaria and whether malaria can be treated, malaria knowledge is uniformly high regardless of community size.
135 Ghana Statistical Service (2008) Ghana Living Standards Survey. Report Of The Fifth Round (GLSS 5).
136 Ashanti was the region with the next highest per capita expenditure.

65
Table 25: Percentage of women exposed to malaria control messages and percentage with correct malaria knowledge, by community size, 2011 MICS
Size of community
Heard message about ACT (any source)
Saw message about ACT on TV
Knows correct cause of malaria
Knows correct way to protect against malaria
Knows malaria can be treated
Village (<5,000)
24.3% (20.6%-27.9%)
14.0% (10.6% -17.5%)
86% 92% 95%
Town (5,000 – 50,000)
36.4% (31.1%-41.7%)
27.1% (21.5% -32.6%)
88% 90% 92%
Small city (50,000 to 150,000)
38.8% (25.3%-52.4%)
31.2% (17.5%-45.0%)
90% 94% 97%
Medium city (150,000 to 600,000)
53.4% (37.9%-68.9%)
52.0% (36.5%-67.5%)
83% 88% 95%
Large city (>2,000,000)
74.0% (67.2%-80.8%)
77% (63.8%-78.8%)
91% 99% 99%
Yet there are several respects in which urban populations, or at least those of the large cities, are relatively disadvantaged compared to people living in smaller communities. Data from national surveys so far conducted show that Ghana has been making steady progress, especially in rural areas, with distribution and ownership of ITNS. Compared to rural areas, however, the progress in urban areas has been delayed, especially in Accra and Kumasi (Figure 14).
Figure 14: Percentage of households owning an ITN, by location and year, various surveys

66
In 2011, with the exception of Tamale, the percentage of households owning ITNs was substantially lower in the medium and large cities of Ghana (Accra, Kumasi, Sekondi-Takoradi, Obuasi and Cape Coast) than in smaller communities (Table 26). These statistics reflect the fact that the phased nationwide distribution ITNs was not completed in the two largest cities until 2012. Subsequent household surveys will hopefully show the rate of ownership of ITNs by urban households to be closer to that of rural households.
Table 26: Percentage of households owning an ITN, by locale, 2011 MICS (95% confidence interval)
Locale % of households owning an ITN
Rural (<5,000) 59.4% (56.2% - 62.6%)
Towns (5,000 to 50,000) 52.2% (47.5% - 56.9%)
Small cities (50,000 to 150,000) 51.1% (44.7% - 57.5%)
Tamale 53.4% (46.8% - 60.0%)
Kumasi 31.2% (26.1% - 36.3%)
Sekondi-Takoradi 18.1% (13.5% - 22.7%)
Obuasi 18.9% (16.7% - 21.0%)
Cape Coast 15.3% (10.3% - 20.3%)
Accra 19.3% (15.3% - 23.3)
There is evidence, however, that regardless of efforts to distribute ITNs to urban areas, the residents of Ghana cities may be more resistant to using them. Table 27 shows, for houses that owned an ITN, the percentage of children who slept the previous night under an ITN, as measured by the 2011 MICS. Compared to children living in villages and towns, children living in medium and large cities were significantly less likely to have slept under an ITN even when the analysis is limited to households that owned an ITN (Table 27). Analysis of data from the 2008 DHS produced similar findings although the difference between cities and smaller communities was not statistically significant.137
137 See Annex 22: Percentage of children living in households owning an ITN who slept the previous night under an
ITN, by size of community (with the 95% confidence interval), 2008 DHS.

67
Table 27: Percentage of children living in households owning an ITN who slept the previous night under an ITN, by size of community (with the 95% confidence interval), 2011 MICS
Size of the community % of children living in households owning an ITN who slept the previous night under an ITN
Village (<5,000) 66.4% (63.5% - 69.4%)
Town (5,000 to 50,000) 64.4% (58.0% - 70.7%)
Small city (50,000 to 150,000) 51.7% (41.5% - 61.9%)
Medium city (150,000 to 600,000) 39.3% (25.5% - 53.1%)
Large city (>2,000,000) 45.7% (34.9% - 56.5%)
A detailed discussion of the many factors (disposable income, travel time, road conditions, transport costs, availability of qualified health staff) influencing the accessibility of health services is beyond the scope of this study. The populations of Accra and Kumasi have, on average, greater access to health services than do most Ghanaians living in smaller communities. According to the Ghana Human Resources for Health Country Profile138, 70% of physicians, 39% of all nurses and 53% of all laboratory workers in the country reside in either the Greater Accra Region or the Ashanti Region (Figure 15).139
Figure 15: Percentage of all lab workers, nurses and physicians nationwide who work in each region, 2009135
138 Ministry of Health (2011) Ghana Human Resources for Health Country Profile. These two metropolitan regions are
home to 36% of the national population.
139 Even within these two regions there are great disparities in the distribution of health workers. Daniel Buor compares
Kumasi Metropolitan district (KMD) with Anafo-Ano South district, also in the Ashanti Region. KMD constitutes only
1% of the land mass of the region but has 90% of the physicians and 37% of all of the health facilities in the region.
In contrast, Anafo-South is twice the physical size of KMD but has 2% of the physicians in the region and 2.7% of the
health facilities. Daniel Buor (2004) Accessibility and utilisation of health services in Ghana.

68
Despite the higher density of health staff in these two metropolitan areas, however, the percentage of febrile children taken to a health facility varies little between large cities and smaller communities (Table 28).
Table 28: Percentage of children sick with a fever in the last 2 weeks who were taken to a clinic or hospital, 2008 DHS & 2011 MICS
Size of the community % of children sick with fever who were taken to a clinic or hospital
2008 DHS (95% C.I.) 2011 MICS (95% C.I.)
Village (<5,000) 45.7% (39.1% - 52.2%) 42.9% (38.4% - 47.4%)
Town (5,000 to 50,000) 62.2% (51.9% - 78.6%)) 45.3% (37.2% - 53.4%)
Small city (50,000 to 150,000) 53.8% (40.4% - 67.3%) 45.7% (25.9% - 65.5%)
Medium city (150,000 to 600,000)
63.8% (48.1% - 79.4%) 48.4% (35.9% - 60.9%)
Large city (>2,000,000) 55.7% (37.3% - 74.0%) 45.9% (25.9% -65.8%)
Data from the 2008 DHS and data from the 2011 MICS also show that most children living in Ghana’s cities who were sick with a fever were not given an anti-malarial the same or next day after onset of the fever (Table 29). The percentage of children with fever who were promptly treated was no higher in Accra and Kumasi than in smaller communities and rural areas.
Table 29: Percentage of children sick with a fever who were given an anti-malarial the same day or the next day after onset of the fever, 2008 DHS & 2011 MICS
Size of the community % of children sick with fever who were given an anti-malarial the same or next day
2008 DHS (95% C.I.)
2011 MICS (95% C.I.)
Village (<5,000) 22.0% (16.3% - 27.6%) 30.2% (25.6% - 34.8%)
Town (5,000 to 50,000) 32.8% (21.0% - 44.6%) 47.8% (37.9% - 57.6%)
Small city (50,000 to 150,000) 22.8% (8.0% - 37.7%) 58.7% (28.4% - 89.0%)
Medium city (150,000 to 600,000) 19.5% (0% - 40.6%) 28.6% (10.3% - 46.8%)
Large city (>2,000,000) 26.6% (14.5% - 38.8%) 24.8% (8.3% - 39.3%)
There are doubts about the quality of the data collected during these household surveys on use of specific anti-malarials. Many respondents may confuse one anti-malarial with

69
another.140 As better educated informants (and those more exposed to mass media campaigns) may be more likely to correctly identify the anti-malarial that they used, such misclassification potentially biases findings in favor or those living in large communities.
Taking these concerns into account, Table 30 presents findings from the 2008 DHS and the 2011 MICS on the percentage of febrile children sick who were reported to have been given artemisinin-based combination therapy (ACT) – the first-line anti-malarial in Ghana - the same or next day after onset of the fever.141
140 Such misclassification appears to have been especially common during the 2011 MICS in particular. The draft
report notes that “Twenty-four percent of children under age 5 who had a fever in the two weeks preceding the
survey were reported to have taken ‘amodiaquine’, 18 percent some type of ACT, 11 percent “ACT with green
leaf,” 4 percent quinine, 1 percent took chloroquine, 1 percent took SP/Fansidar, and 6 percent took some other
type of antimalarial drug. The unexpectedly high figure for amodiaquine use is surprising. Taken at face value,
the GMICS4 data suggest that, of all children who took antimalarials for recent fever, 44% took ‘amodiaquine’,
including 55% of those given antimalarials at CHPS compounds, where compliance with national guidelines tends
to be optimal. Unfortunately, it has emerged the GMICS4 data collection process did not distinguish adequately
between ‘Artesunate-Amodiaquine’, which is Ghana’s widely available first-line official ACT product, on the one
hand, and ‘Amodiaquine’, which is a non-approved monotherapy, not widely favored due to perceived side ef-
fects. In popular parlance ‘amodiaquine; is used as a shortened form of ‘Artesunate-amodiaquine’, which appears
to be the source of the error. Thus analysis suggests strongly that a large,but unknowable portion of the ‘amodia-
quine’ responses should have been recorded as ‘ACT’. This would put the proportion of children with fever who
took an ACT at somewhere between 18 and 42 percent.”
141 See Annex 23: Percentage of children sick with a fever who were reportedly given either ACT or amodiaquine the
same day or the next day after onset of the fever (95% confidence interval), 2011 MICS.

70
Table 30: Percentage of children sick with a fever who were given ACT the same day or the next day after onset of the fever, 2008 DHS & 2011 MICS
Size of the community % of children sick with fever who were given ACT the same or next day
2008 DHS (95% C.I.) 2011 MICS (95% C.I.)
Village (<5,000) 9.3% (5.6% - 12.9%) 8.0% (5.6% - 10.4%)
Town (5,000 to 50,000) 14.0% (6.3% - 21.7%) 16.9% (10.9% - 22.8%)
Small city (50,000 to 150,000) 16.1% (1.6% - 30.7%) 25.0% (7.3% - 42.7%)
Medium city (150,000 to 600,000) 15.5% (0% - 36.2%) 17.3% (1.6% - 33.0%)
Large city (>2,000,000) 21.5% (9.0% - 34.0%) 21.0% (7.1% -34.8%)
Children from Accra and Kumasi were less likely to be tested for malaria if they were seen at a health facility for treatment of a febrile illness (Table 31).142 By pooling the observations from medium-sized and large cities143, we find that only 14.5% (95% confidence interval: 2.6% - 26.4%) of the 37 children taken to a health facility were tested. This is significantly lower than the percentage of children living in rural areas who were tested.
Table 31: Percentage of children treated at a health facility for febrile illness who were tested, by community size, 2011 MICS
Size of the community % of children treated at a health facility for febrile illness who were tested (95% C.I.)
Village (<5,000) 36.3% (29.8% - 42.8%)
Town (5,000 to 50,000) 32.7% (20.8% - 44.7%)
Small city (50,000 to 150,000) 45.7% (19.5% - 91.9%)
Medium city (150,000 to 600,000) 19.6%* (1.1% - 38.2%)
Large city (>2,000,000) 11.8%** (0% - 26.8%) * 21 unweighted observations **16 unweighted observations
There is other evidence to suggest that malaria testing is less commonly performed by health facilities in Accra and Kumasi than those elsewhere in the country. Consider the malaria testing ratio – the number of malaria tests performed divided by the number of suspected malaria cases – for each of the 5 malaria sentinel sites in Ghana (Figure 16). Between the first quarter of 2009 and the first quarter of 2010, the malaria testing ratio at
142 A question about malaria testing was included on the questionnaire for the 2011 MICS but not on the question-
naire for the 2008 DHS.
143 Observations have to be pooled because of the small number of children who were reported to have been treated
at a health facility for a febrile illness: 21 in the medium-sized cities and 16 in the large cities.

71
Maamobi Hospital in Accra was consistently and substantially lower than for the other 4 sites.144
Figure 16: Malaria testing ratio = malaria tests performed / suspected malaria cases, malaria sentinel sites, 2009 to 2010
Similar findings for health facilities in Accra come from the routine data of the GHS that were presented earlier (findings from Table 3 are presented again as Table 32 below). Note that the reported testing ratio for Kumasi is comparable to that for other locations nationwide.
Table 32: Ghana Health Service statistics on malaria cases and laboratory confirmed malaria cases, Jan. - Oct. 2012, by location
Locale Monthly OPD reporting, Jan. – Oct. 2012
No. of Facilities
Malaria cases
Lab confirmed malaria cases
Reported testing ratio
AMD 46 162,186 11,082 6.8%
KMD 70 219,637 58,302 26.5%
Other locations nationwide 2,927 5,076,667 1,510,195 29.7%
144 Confirmation rates of greater than 100% were reported by some site for some months due to practices of adminis-
tering malaria tests on asymptomatic ANC clients, testing of samples sent from outside clinics and repeat testing
of some patients.

72
Table 33 shows that, regardless of the size of the community that they live in, a very high percentage of women report that they made 3 or more visits to an ANC clinic during their last pregnancy.
Table 33: Percentage of women who, when last pregnant, made 3 or more ANC visits (95% confidence interval), 2008 DHS & 2011 MICS
Size of the community % of pregnant women who made 3 or more ANC visits
2008 DHS 2011 MICS
Village (<5,000) 89.3% (86.6% - 92.0%) 90.0% (87.7% - 92.2%)
Town (5,000 to 50,000) 96.8% (94.0% - 99.5%) 95.2% (92.6% - 97.8%)
Small city (50,000 to 150,000) 96.3% (91.9% - 100%) 96.1% (91.2% - 100%)
Medium city (150,000 to 600,000) 100% (100%) 99.8% (99.3% - 100%)
Large city (>2,000,000) 96.8% (93.2% - 100%) 97.6% (95.0% - 100%)
However, Table 34 shows that even though there are such good opportunities to combat malaria during pregnancy, only about 2 out of 3 pregnant women in Ghana reported in 2011 that they had benefited from IPT. This was true regardless of community size. These findings from 2011 represent an improvement since 2008 when the percentage of ANC clients benefitting from IPT was only about 50% nationwide and it was below 30% in Accra and Kumasi. This raises the question of why health workers nationwide (including in Ghana’s cities) continue to miss opportunities to administer IPT.
Table 34: Percentage of women who reported receiving IPT during their last pregnancy (95% confidence interval), 2008 DHS & 2011 MICS
Size of the community % of pregnant women who received IPT*
2008 DHS 2011 MICS
Village (<5,000) 49.6% (44.1% - 55.1%) 70.4% (66.8% - 74.1%)
Town (5,000 to 50,000) 54.2% (43.9% - 64.5%) 72.2% (66.4% - 78.0%)
Small city (50,000 to 150,000) 56.6% (38.1% - 75.1%) 60.9% (47.4% - 74.4%)
Medium city (150,000 to 600,000)
61.5% (53.6% - 69.3%) 64.2% (53.0% - 75.4%)
Large city (>2,000,000) 27.9% (17.4% - 38.4%) 66.5% (57.2% - 75.8%)
*2 or more doses of SP administered at a health facility.
73
Summary -- How does coverage with malaria control interventions differ between urban and rural areas?
On average, the populations of Accra and Kumasi are wealthier, better educated and have better access to health facilities than other Ghanaians. Findings from the 2011 MICS show that a higher percentage of residents in these cities have been exposed to malaria control messages.
Yet findings from the 2008 DHS and the 2011 MICS demonstrated important shortcomings of malaria control activities in these cities.
Shortcomings of household practices in Accra and Kumasi included:
• Failure in some households to make use of ITNs to protect children;
• Widespread failure to treat childhood fever promptly with anti-malarials
Shortcomings of the health systems of Accra and Kumasi included:
• Delays in distribution of ITNs (this shortcoming was addressed by the end of 2012);
• Missed opportunities to administer IPT at ANC clinics;
• Insufficient laboratory testing for malaria and, as a result, incorrect presumptive diagnosis of patients who had fevers from causes other than malaria;
• Inadequate reporting of lab testing.
WHAT ARE SOME IMPORTANT DETERMINANTS OF THE COVERAGE OF URBAN AREAS WITH MALARIA CONTROL INTERVENTIONS?
Biritwum et al.145 provide an example of the sort of finding that we are looking for to help answer the fourth and final question of the Ghana Urban Malaria Study. They studied two adjacent communities of differing socio-economic levels in Accra. They concluded that “The proportion of caregivers who purchased drugs without prescription or used, left-over drugs to treat clinical malaria in the children was higher in the poorer community (82% v. 53%), and a child from the poorer community was less likely to have been taken to a clinic or hospital to be treated for malaria than a child from the better-off community (27% v. 42%).”
With analysis of data from national household surveys, the samples of households in large cities is too small to assess the association between care seeking and household wealth (Table 35) or the association between prompt treatment of febrile illness and
145 Biritwum RB, Welbeck J and Barnish C (2000) Incidence and management of malaria in two communities of dif-
ferent socio-economic level, in Accra, Ghana. Ann Trop Med Parasitol. 2000 Dec;94(8):771-8.

74
maternal education (Annex 15). Even with the larger number of rural households sampled during national household surveys, however, there is not a strong association between household wealth and care seeking for febrile illness or between maternal education and prompt treatment of febrile illness with an anti-malarial.
Table 35: Percentage of children sick with a fever in the last 2 weeks who were taken to a clinic or hospital (95% confidence interval), by household wealth quintile, 2011 MICS. Unweighted sample sizes are given, but the statistics are based on the weighted samples.
Locale Household wealth quintile
1 (poorest) 2 3 4 5 (wealthiest)
Accra or Kumasi
2/6* = 47.5.3% (0% - 98.9%)
5/9* = 49.5% (9.0% - 90.0%)
5/7* = 77.2% (44.8% - 100%)
3/10* = 23.1% (0% - 52.5%)
1/3* = 33.8% (0% - 91.7%)
Urban 24/44 = 45.6% (26.0% - 65.3%)
48/81= 54.9% (41.9% - 67.8%)
41/106 = 41.1% (29.7% - 52.6%)
54/105 = 46.0% (33.9% - 58.2%)
37/74 = 45.5% (31.0% - 59.9%)
Rural 391/932 = 37.6% (32.9% - 42.4%)
133/287 = 44.9% (37.6% - 52.3%)
50/110 = 47.1% (35.8% - 58.3%)
22/43 = 60.8% (42.0% - 79.7%)
8/14 = 53.5% (19.9% - 87.1)
* Fewer than 25 observations.
To adequately address the final study question, data from the Women’s Health Survey of Accra, wave II (WHSA-II – see Annex 4) are better suited. Tables 36 and Annexes 16, 17 and 18 present findings from analysis of the association between four possible determinants (household wealth, socio-economic class of the woman’s neighborhood, education of the woman and whether the woman was currently enrolled in the National Health Insurance Scheme) and various indicators of household malaria control activities.
What do these statistics show?
1. As was found from the MICS and DHS surveys, less than 30% of respondents, regardless of socio-economic status or level or education used ACTs for treatment of suspected malaria.
2. Compared to women living in the wealthiest households, women living in the poorest households were:
• 41% less likely to listen to radio every day and 61% less likely to watch television every day;
• 47% less likely to be currently enrolled in the National Health Insurance Scheme;
• 82% more likely to have puddles of water near to their house;
• 28% less likely to own an ITN;

75
• 14% less likely to have screens on their windows (although 86% of women in the poorest households did have screens);
• 11% less likely to take precautions other than use of an ITN (spraying with repellant, wearing protective clothes, mosquito coil) to prevent malaria or mosquito bites;
• about equally likely to have taken an anti-malarial during their last pregnancy146;
• 71% less likely to have used ACTs with their last episode of apparent malaria;
• 14% less likely to have visited a health facility during their last episode of apparent malaria;
• 43% less likely to have been tested if they had symptoms of malaria;
These are findings in Accra as of 2008/2009. Some aspects (such as the percentage of households with ITNS) have almost certainly changed significantly in the interim.
Annexes 16 and 17 present similar findings regarding the association of these indicators with the socio-economic class of the woman’s neighborhood (“slum” vs. “non-slum”) and the educational level of the woman. The level of education of women is clearly associated with household wealth (Annex 19). Logistic regression analysis shows that, after adjusting for the influence of the woman’s level of education, higher household wealth is associated with higher odds of use of ACTs and higher odds of malaria testing (Annex 20). After adjusting for the influence of household wealth, higher level of women’s education is also associated with higher odds of use of ACTs but not higher odds of malaria testing.
Women from poorer households were less likely to be enrolled in NHIS. This is unfortunate as the scheme might subsidize their health expenditures. However, enrollment in the scheme was not associated with a substantial increase in use of health services (Annex 18).
All categories of disadvantaged women were less exposed to mass media (radio and TV). However, almost half of them (and an even higher percentage of more advantaged women) listened daily.
Summary — What are some important determinants of the coverage of urban areas with malaria control interventions?
Analysis of data from the WHSA confirms the findings of Biritwum et al. that urban poverty is associated with poorer quality of care for febrile diseases including inadequate
146 Data on malaria prophylaxis/IPT during pregnancy from the WHSA differ markedly from the related data collected
by DHS or MICS surveys. Firstly, 25% of women questioned answered “I don’t know” when asked whether they
had taken any drugs to keep them from getting malaria. Secondly, 74% of women who recalled that they had
taken some drug to prevent malaria during their last pregnancy were unsure what drug they took. As a result,
less than 10% of respondents who recalled taking some sort of prophylaxis reported that they had taken SP. Given
these anomalous statistics, the indicator cited here is the percentage of women recalling that they had taken some
anti-malarial during their last pregnancy, excluding from the analysis the 25% of women who did not recall wheth-
er they had taken any such drug.

76
use of anti-malarials and less use of laboratory testing. Lack of education of women is also associated with inadequate use of anti-malarials.
Further sub-national studies will help to identify and document additional features of the urban environment (such as reluctance to make use of ITNS or optimal ways to shape the household practices of residents of urban slums)147 which have important implications for malaria control in cities.
Table 36: Various indicators for women in Accra, by household wealth, 2008/2009 WHSA-II148
Indicator Household wealth quintile Risk ratio
(95% C.I.)147
1 (poorest)
(95% C.I.)
2
(95% C.I.)
3
(95% C.I.)
4
(95% C.I.)
5 (wealthiest)
(95% C.I.)
Listen to radio every day
49.3%* (43.7% - 54.8%)
68.7%* (64.0%-73.3%)
76.2%* (72.1%-80.2%)
76.4% (71.7%-81.1%)
84.0% (80.4%-87.5%)
0.59 (0.52 – 0.66)
Watch TV every day
30.8%* (26.5% - 35.1%)
62.0%* (57.7%-66.2%)
68.6%* (64.6%-72.5%)
72.9% (68.3%-77.4%)
78.9% (74.7%-83.1%)
0.39 (0.34 – 0.45)
Enrolled in NHIS
20.8%* (16.8% - 24.8%)
27.4%* (23.7%-31.2%)
38.4% (33.9%-42.9%)
37.4% (33.1%-41.7%)
39.5% (34.4%-44.7%)
0.53 (0.42 – 0.66)
Puddles near to house
50.4%* (43.2% - 57.5%)
51.5%* (45.2% -57.8%)
48.0%* (42.3% - 53.7%)
38.5% (33.3% - 43.7%)
27.7% (21.9% - 33.4%)
1.82 (1.43 – 2.32)
Household owns at least one ITN
17.3% (13.3% - 21.2%)
25.2% (21.4%-29.0%)
25.6% (21.3%-29.8%)
26.3% (21.8%-30.8%)
24.0% (19.9%-28.1%)
0.72 (0.54 – 0.95)
Screen on windows
85.5%* (82.0% - 89.1%)
95.2%* (93.2%-97.2%)
97.2% (95.9%-98.7%)
98.6% (97.6%-99.6%)
99.7% (99.2%-100%)
0.86 (0.82 – 0.89)
147 See http://www.alnap.org/pool/files/community-mgm-malaria.pdf which documents efforts in Kumasi and Bolgatanga
to strengthen community case management of malaria.
148 Percentage for poorest quintile / percentage for wealthiest quintile. Ninety five per cent confidence interval calculated
with poisson regression by using STATA’s svypoission command to adjust for cluster sampling and provide for robust
estimates of confidence intervals. Refer to Analysis of surveys with Epi Info and STATA. UCLA. www.ph.ucla.edu/epi/
rapidsurveys/RScourse/probstata_epiinfoex.pdf.

77
Take precautions against malaria besides ITN148
73.9% (68.7% - 79.1%)
74.7 (70.0%- 79.3%)
76.5% (72.3%- 80.7%)
80.0% (76.0%-84.1%)
83.2% (78.7%- 87.8%)
0.89 (0.82 – 0.97)
Took malaria prophylaxis with last pregnancy143
58.8% (51.2% - 66.3%)
67.7% (61.4%-74.0%)
71.3% (65.9%-76.8%)
71.5% (66.3%-76.7%)
65.3% (58.6%-72.0%)
0.90 (0.77 – 1.06)
Treated last episode with ACT
7.5%* (4.6% - 10.4%)
13.4%* (9.7%-17.1%)
17.1% (13.1%-21.1%)
21.2% (17.2%-25.2%)
25.5% (20.9%-30.0%)
0.29 (0.19 – 0.45)
Sought medical care for the last episode of malaria
76.6%* (68.0% - 85.0%)
88.1% (83.1%-93.2%)
86.3% (81.3%-91.2%)
90.1% (85.7%-94.4%)
89.4% (85.1%-93.6%)
0.86 (0.76 – 0.97)
Got lab test for last episode of malaria
28.9%* (24.7% - 33.1%)
37.5%* (33.0%-42.1%)
37.9%* (33.1%-42.8%)
52.2% (46.7%-57.7%)
50.3% (45.6%-55.1%)
0.57 (0.49 – 0.68)
149 *Reference = highest wealth quintile. The difference between this estimate and the estimate for the highest wealth quintile is statistically significant with P < 0.05.
149 “Do you take any personal precautions (other than using a bed net) to protect yourself from malaria / mosquito
bites (spraying with repellant, wearing protective clothes, mosquito coil)?

78
CONCLUSIONS AND DISCUSSION Clinical practice and public health policy in Ghana have been shaped by routine health service data suggesting that malaria is highly prevalent throughout the country. A different picture emerges, however, from the Ghana Urban Malaria Study.
Published research as well as the 2011 MICS showed that children living in Accra, Kumasi and Tamale were significantly less likely to be infected with malaria compared to children living in smaller communities of the same ecological zone (Table 37). For example, the risk ratio of 0.27 from published research studies shows that children living in Accra were only 27% (95% confidence interval = 19% to 38%) as likely to be infected with malaria as children living in smaller communities of the coastal zone.
Table 37: Risk ratios comparing the prevalence of malaria parasitemia among children living in 3 cities to children living in smaller communities of the same ecological zone, from published research (Table 7) and 2011 MICS
City Risk ratio from published research studies
(95% C.I.)
Risk ratio from the 2011 MICS
(95% C.I.)
Accra (coastal zone; population = 2,670,155 )
0.27 (0.19 – 0.38)
0.14 (0.06 – 0.34)
Kumasi (forest zone; population = 2,035,064 )
0.21 (0.10 – 0.42)
0.15 (0.07 – 0.34)
Tamale (savannah zone; Population = 371,351 )
0.66 (0.52 – 0.82)
0.32 (0.16 – 0.63)
Evidence available for this study is inconclusive as to whether the burden of malaria is lower in Ghana’s mid-sized cities (Sekondi-Takoradi, Obuasi, Cape Coast) other than Tamale.
The lower burden of malaria found in the cities of sub-Saharan Africa has been attributed to two aspects of urbanization.150 ,151 On the one hand, environmental changes acting at the neighborhood level (i.e. loss of or pollution of natural breeding waters and mosquito resting habitats) are thought to have reduced mosquito breeding and the lifespan of adult mosquitoes. On the other hand, practices adopted at the household level (installation of screening, use of insecticides and ITNs, use of anti-malarials) may act to control malaria.
150 Chinery WA (1984) Effects of ecological changes on the malaria vectors Anopheles funestus and the Anopheles
gambiae complex of mosquitoes in Accra, Ghana. J Trop Med Hyg. 1984 Apr;87(2):75-81.
151 Robert et al. (2003) Malaria transmission in urban sub-Saharan Africa. Am. J. Trop. Med. Hyg. 68, 169–176.
79
Entomological findings suggest that the burden of malaria is lower in the large cities of Ghana largely because of environmental changes that have reduced the breeding of mosquitoes. Measurements of the intensity of transmission (EIR) have been consistently lower in neighborhoods of Accra and Kumasi than the average for smaller communities of the surrounding ecological zones. EIRs are especially low in urban neighborhoods that are distant from urban agricultural plots. EIRs are intermediate in neighborhoods (including wealthier neighborhoods such as those on the campus of the University of Science and Technology in Kumasi) less than 1 kilometer from urban agricultural plots and in peri-urban locations.
There is limited evidence that practices and characteristics of individual households are responsible for the reduced burden of malaria within cities. While some household practices (e.g. installation of screening) may be more prevalent in cities than in rural areas, studies of the impact of these practices on the burden of malaria have yet to be carried out in Ghana. The influence of household-level factors is best shown by the significantly lower prevalence of malaria parasitemia found among children living in wealthier urban households compared to poorer urban households. The concrete factors responsible for this association between household poverty and the burden of malaria remain to be established.
What is certain is that the burden of malaria varies substantially between urban neighborhoods as well as between individual urban households. There is sufficient evidence of such variation to justify the targeting of community-based malaria control interventions to urban neighborhoods known to have higher levels of Anopheles breeding and to poorer urban households. This is particularly true given findings that poorer urban households are less likely than wealthier urban households to make appropriate use of ITNs, malaria tests and appropriate anti-malarials. In Ghana, pilot projects have successfully targeted higher risk urban households with community-based interventions such as distribution of ITNs152 and support for home-based treatment of febrile illness.153
Given the generally greater wealth and higher level of education in Accra and Kumasi, it is surprising that the proportions of caretakers reporting key household malaria control practices (use of ITNs, laboratory testing for malaria, use of appropriate anti-malarials) are no higher in these cities than in rural areas of Ghana. A high percentage of adults of all socio-economic classes in Ghana’s cities are regularly exposed to mass media. Radio and television thus offer one means to increase the demand for ITNs, laboratory testing and (where lab confirmation is not obtained for whatever reason) treatment of suspected malaria with ACTs.
On the other hand, even in the neighborhoods of Accra and Kumasi with the highest burden of malaria, the prevalence of malaria parasitemia in children is lower than that
152 Klinkenberg E, Onwona-Agyeman KA, McCall PJ, Wilson MD, Bates I, Verhoeff FH, Barnish G, Donnelly MJ (2010)
Cohort trial reveals community impact of insecticide-treated nets on malariometric indices in urban Ghana. Trans-
actions of the Royal Society of Tropical Medicine and Hygiene 104 (2010) 496–503.
153 Akweongo P, Agyei-Baffour P, Sudhakar M, Simwaka BN, Konaté AT, Adongo PB, Edmund NL Browne ENL, Tegegn
A, Ali D, Traoré A, Amuyunzu-Nyamongo M, Pagnoni F and Barnish G ()Feasibility and acceptability of ACT for the
community case management of malaria in urban settings in five African sites. Malaria Journal 2011, 10:240.

80
found, on average, in rural areas of the surrounding ecological zone. This finding provides compelling justification for prioritizing rural areas for the limited resources available for large scale malaria control interventions such distribution of ITNs154 and indoor residual spraying.155 This would be especially true if, as appears to be the case with use of ITNs, the rtesidents of cities are more resistant than people living in rural areas to adopting certain malaria control practices.
Most cases of suspected malaria seen at Ghana’s health facilities are not confirmed with laboratory testing. Routine health facility data from 2012 suggest that the percentage of reported malaria cases which were laboratory confirmed was 7% for facilities in Accra Metropolitan District, 27% for facilities in the Kumasi Metropolitan District and 30% for all other facilities reporting. In Ghana, most cases of malaria are diagnosed presumptively based largely upon the presence of or history of fever. Data from the 2011 MICS show that in rural areas fever reliably identifies children infected with malaria – more than 80% of children living in rural areas who were reported to have had fever in the last 2 weeks also had a positive rapid diagnostic test (RDT). Of children living in Accra and Kumasi who were reported to have had a recent fever, however, only 7% had a positive RDT.
Hence, laboratory confirmation of suspected malaria is least common in Accra where the prevalence of malaria is the lowest of any community in Ghana and presumptive diagnosis is least reliable. This should be of considerable concern for policy makers, public health programmers and clinicians. One result of presumptive diagnosis of suspected malaria is massive misdiagnosis of individual febrile patients in urban areas. For example, Malm et al.156 found that only 11% of 605 sick children presenting with fever at La General Hospital in Accra had malaria parasites detected by microscopy. Yet 80% of these children were diagnosed as having malaria. Malm et al. suggested that, as a result, “Most febrile cases are treated as malaria, sometimes with fatal consequences though they may not be malaria”. Other consequences of presumptive diagnosis include unnecessary expenditures and side-effects from anti-malarials and increased chances that resistance will develop to anti-malarials.
A final consequence of the prevailing practice of presumptive diagnosis is that the epidemiology of malaria is inadequately appreciated by policy makers, public health programmers and clinicians. In spite of striking differences in the true incidence of malaria (between urban and rural areas, between ecological zones and between seasons), routine health facility data suggest that clinical staff in all parts of the country and during all seasons presumptively diagnose roughly 40% of outpatients as having “malaria”. As a result, data on the reported incidence of malaria do not provide a reliable indication of the burden of malaria.
154 James Frimpong (2011) Improving ITN Ownership And Use Through Door-To-Door Distribution And Hang Up Of
LLINs in Ghana. Presentation at the AMP Partners Meeting, Geneva, February 2011.
155 Sylvester Segbaya (2009) Scaling Up Indoor Residual Spraying In Ghana. Presentation at the 2009 MIM Confer-
ence in Nairobi.
156 Malm K, Bart-Plange C, Armah G, Gyapong J, Owusu-Adjei S, Koram K and Binka F (2012) Malaria as a cause
of acute febrile illness in an urban paediatric population in Ghana. Poster no. 1377 at the annual meeting of the
American Society of Tropical Medicine and Hygiene. Atlanta, GA. November 11 – 15, 2012.

81
The malaria test positivity rate (TPR) may offer a means to monitor the burden of malaria in various locales. It can be calculated for each health facility even when data for some months are missing and even when the catchment population of the health facility is uncertain. However, there are major problems with the quality and completeness of malaria testing data that are now captured by the Ghana Health Service.
The health professionals working in Ghana’s cities are a crucially important target for efforts to strengthen control of urban malaria and promote more rational care for febrile illnesses. Seventy per cent of all physicians, 39% of all nurses and 53% of all laboratory technicians in Ghana reside either in the Greater Accra Region or in the Ashanti region. In the case of physicians, this includes almost all of the academic community which sets trends for clinical care and trains future practitioners. All these health professionals are facing the challenge of keeping abreast of the latest clinical guidelines as Ghana (now classified as a middle income country) undergoes an epidemiological transition (with rising levels of chronic diseases)157 as well as a transition in its health system (with greater focus on the quality of health services).158 In a setting with a low prevalence of malaria, additional effort is required on the part of clinicians and laboratory staff to diagnose and appropriately care for other febrile illnesses. This transition in clinical practice must be supported both with essential laboratory capacities and with training, supervision, monitoring and feedback. Efforts to provide for the last two of these requirements (monitoring and feedback) will require strengthening of the completeness and quality of data reported routinely to the DHIMS database of the Ghana Health Service.
157 Agyei-Mensah S and de-Graft Aikins A (2010) Epidemiological Transition and the Double Burden of Disease in Ac-
cra, Ghana. J Urban Health. 2010 September; 87(5): 879–897.
158 Saleh K (2012) The Health Sector in Ghana. The World Bank. 238 pages.

82
RECOMMENDATIONS
RECOMMENDATIONS TO INFORM AND GUIDE HEALTH PROFESSIONALS IN GHANA’S CITIES:
With in-service training, supervision, monitoring and feedback, health professionals practicing in Ghana’s cities should:
1. Be made more aware of the low prevalence of malaria parasitemia in most neighborhoods of Accra and Kumasi and some neighborhoods of smaller cities;
2. Be encouraged to perform malaria tests on a higher percentage of suspected malaria cases. To support this, lab capacity and supplies for microscopy and rapid diagnostic testing must be assured;
3. Be encouraged to regularly review and report on the malaria TPR in their facility. Researchers and partners should gather further data from sentinel sites;
4. Modify their current practices for diagnosis and treatment of febrile illness to reflect the quite low burden of malaria in the catchment areas of many urban health facilities;
5. Provide IPT to ALL women coming for ANC.
RECOMMENDATIONS FOR STRENGTHENING HOUSEHOLD HEALTH PRACTICES
6. Mass media and other behavior change communication strategies targeting residents of Ghana’s cities should aim to :
a. Promote use of ITNs by children and pregnant women;
b. Encourage prompt laboratory diagnosis of children sick with fevers;
c. Encourage treatment with artemisinin-based combination therapy (ACT) in instances where children are sick with a fever and laboratory confirmation is not obtained.
7. Community-based malaria control interventions to support these objectives should be targeted to the poorest urban households and to urban neighborhoods proven to have a higher burden of malaria.
RECOMMENDATIONS REGARDING CHANGES TO MONITORING AND EVALUATION SYSTEMS
8. For health facilities in Ghana’s cities, records of malaria tests should capture information about the residence of the patient. These records should be periodically analyzed to identify neighborhoods with a higher than average malaria burden;
9. The electronic database of the GHS (DHIMS) should be modified so that all of the data on malaria testing (the number of malaria tests performed and the number of positive malaria tests are now recorded on the Case Reporting Form or CRF) are entered independently from the data on malaria cases (recorded on the Outpatient Morbidity Report);

83
10. At least once each 5 to 10 years, malaria parasitemia should be measured as part of a national household health survey (MICS and/or Demographic Health survey);
11. Future MICS and DHS surveys should include additional questions to characterize the environment (e.g. proximity to agricultural plots and pools of water) and housing characteristics (e.g. screening);
RECOMMENDATIONS REGARDING FURTHER RESEARCH ON URBAN MALARIA IN GHANA
12. The NMCP should continue efforts to compile reports from all research studies (including unpublished studies) which have measured malaria parasitemia, EIR or intensity of mosquito breeding in specific locations in Ghana. The NMCP should maintain a file of hard and soft copies of these reports so that it can serve as a clearinghouse for such findings;
13. Ghana’s universities and the research institutions should be supported to conduct additional studies measuring the prevalance of malaria parasitemia, EIR and/or intensity of mosquito breeding in specific neighborhoods. In particular, additional research should assess the burden of malaria in areas adjacent to urban agriculture and pools of water in cities.
84
ANNEXES
Annex 1: Stakeholders for the Ghana Urban Malaria Study
Stakeholders met in Accra, 18 and 19 September, 2012 to select the questions to be addressed by the Ghana Urban Malaria Study. They represented diverse organizations including:
• Ghana Health Service
· The Directorate of Planning, Policy, Monitoring and Evaluation (PPMED);
· The Disease Control Division;
· The National Malaria Control Programme (whose representative was unable to attend on the 18th of September);
· The Research and Development Division (2 staff from the Dodowa Health Research Unit);
• Teaching hospitals
· Korle Bu (Accra)
· Kwame Nkrumah University of Science and Technology (Kumasi)
• Municipal health services
· Accra Metropolitan Authority MPHD
· Ga South Municipal Hospital
• Ghana Statistics Service
• School of Public Health of the University of Ghana
• Anglo Gold Ashanti
• Christian Health Association of Ghana – Apam Catholic Hospital
• ProMPT Ghana
• World Vision Ghana
• INDEPTH research network (including demographic surveillance sites at Navrongo, Kintampo and Dodowa)
• The President’s Malaria Initiative (PMI)
• The USAID Focus Regions Health Project (USAID/FRHP)
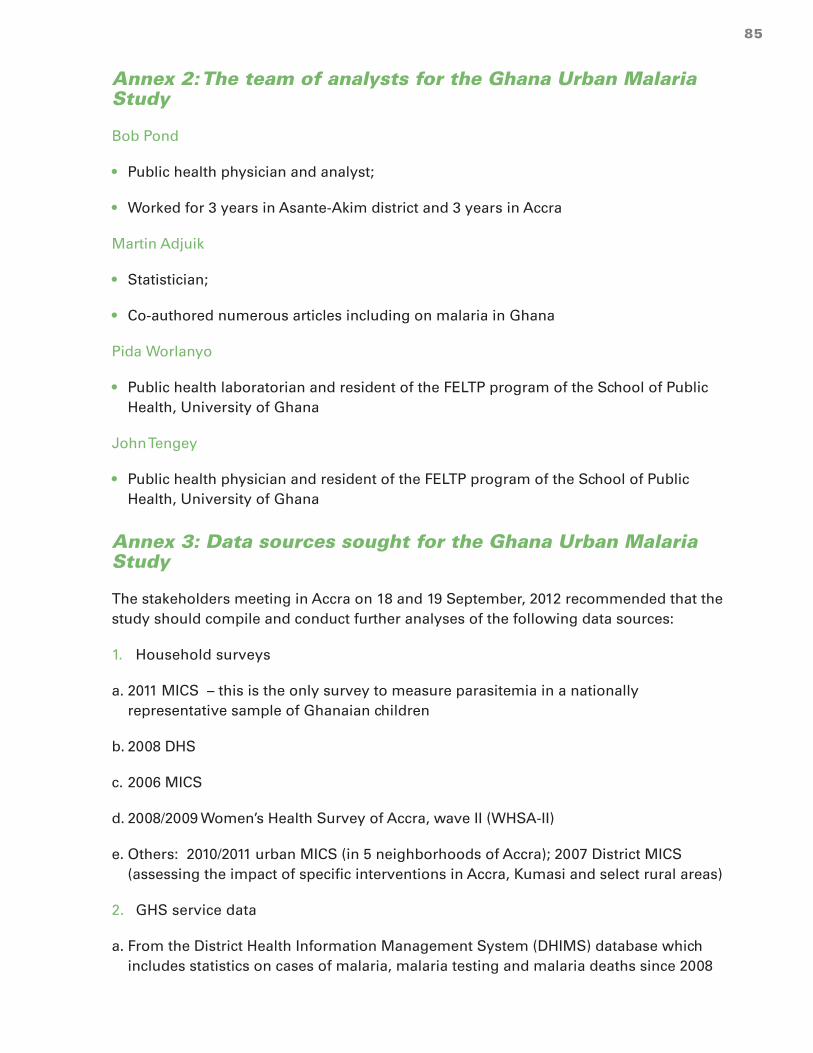
85
Annex 2: The team of analysts for the Ghana Urban Malaria Study
Bob Pond
• Public health physician and analyst;
• Worked for 3 years in Asante-Akim district and 3 years in Accra
Martin Adjuik
• Statistician;
• Co-authored numerous articles including on malaria in Ghana
Pida Worlanyo
• Public health laboratorian and resident of the FELTP program of the School of Public Health, University of Ghana
John Tengey
• Public health physician and resident of the FELTP program of the School of Public Health, University of Ghana
Annex 3: Data sources sought for the Ghana Urban Malaria Study
The stakeholders meeting in Accra on 18 and 19 September, 2012 recommended that the study should compile and conduct further analyses of the following data sources:
1. Household surveys
a. 2011 MICS – this is the only survey to measure parasitemia in a nationally representative sample of Ghanaian children
b. 2008 DHS
c. 2006 MICS
d. 2008/2009 Women’s Health Survey of Accra, wave II (WHSA-II)
e. Others: 2010/2011 urban MICS (in 5 neighborhoods of Accra); 2007 District MICS (assessing the impact of specific interventions in Accra, Kumasi and select rural areas)
2. GHS service data
a. From the District Health Information Management System (DHIMS) database which includes statistics on cases of malaria, malaria testing and malaria deaths since 2008
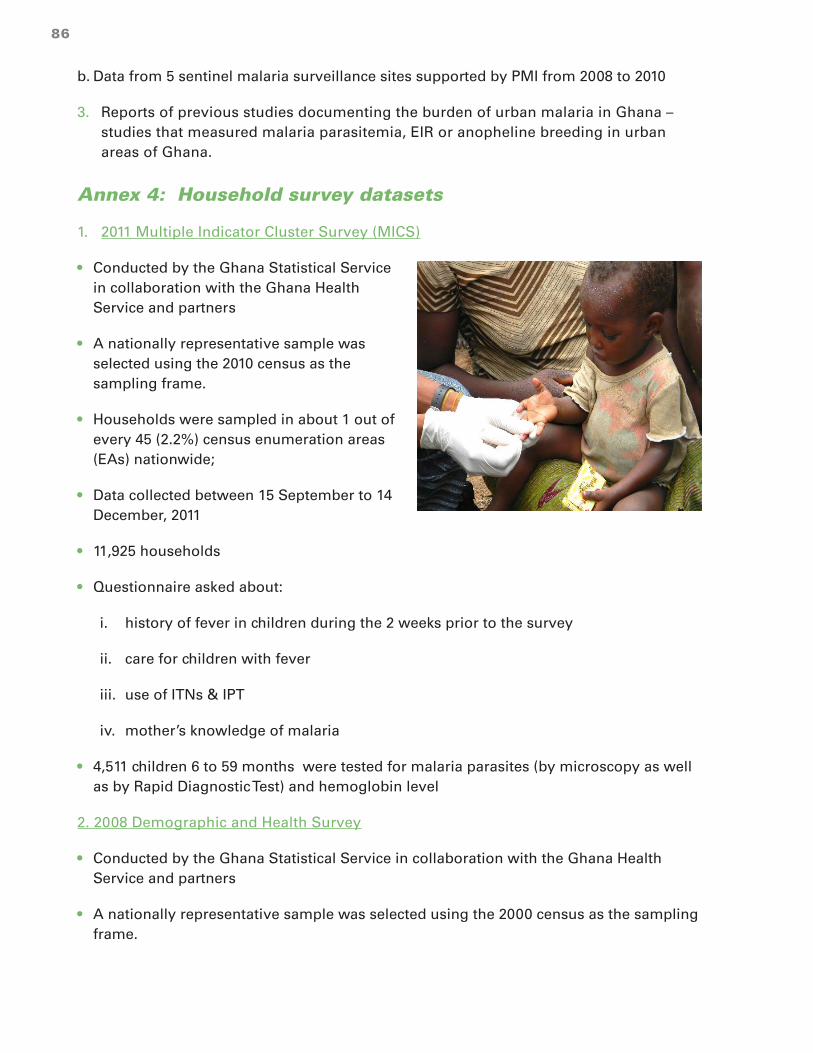
86
b. Data from 5 sentinel malaria surveillance sites supported by PMI from 2008 to 2010
3. Reports of previous studies documenting the burden of urban malaria in Ghana – studies that measured malaria parasitemia, EIR or anopheline breeding in urban areas of Ghana.
Annex 4: Household survey datasets
1. 2011 Multiple Indicator Cluster Survey (MICS)
• Conducted by the Ghana Statistical Service in collaboration with the Ghana Health Service and partners
• A nationally representative sample was selected using the 2010 census as the sampling frame.
• Households were sampled in about 1 out of every 45 (2.2%) census enumeration areas (EAs) nationwide;
• Data collected between 15 September to 14 December, 2011
• 11,925 households
• Questionnaire asked about:
i. history of fever in children during the 2 weeks prior to the survey
ii. care for children with fever
iii. use of ITNs & IPT
iv. mother’s knowledge of malaria
• 4,511 children 6 to 59 months were tested for malaria parasites (by microscopy as well as by Rapid Diagnostic Test) and hemoglobin level
2. 2008 Demographic and Health Survey
• Conducted by the Ghana Statistical Service in collaboration with the Ghana Health Service and partners
• A nationally representative sample was selected using the 2000 census as the sampling frame.

87
• Households were sampled in about 1 out of every 65 (1.6%) census EAs nationwide;
• Data collected between 8 September to 25 November, 2008
• 11,778 households
• Questionnaire asked about:
i. history of fever in children during the 2 weeks prior to the survey
ii. care for children with fever
iii. use of ITNs & IPT
iv. mother’s knowledge of malaria
• A separate verbal autopsy questionnaire was administered to caretakers of children who had died in the previous 2 years
• Measured the hemoglobin of children and women
• No other biomarkers
3. 2006 MICS
• Conducted by the Ghana Statistical Service in collaboration with the Ghana Health Service and partners
• A nationally representative sample was selected using the 2000 census as the sampling frame.
• Households were sampled in about 1 out of every 90 (1.1%) census enumeration areas (EAs) nationwide;
• Data collected between August to October, 2006
• 5,939 households
• Questionnaire asked about:
i. history of fever in children during the 2 weeks prior to the survey
ii. care for children with fever
iii. use of ITNs & IPT
iv. mother’s knowledge of malaria
• No biomarkers were assessed

88
4. Women’s Health Study of Accra, Wave II (WHSA-II)
• Conducted by researchers of Harvard University in collaboration with the Institute of Statistical, Social and Economic Research (ISSER) of the University of Ghana, Legon
• 2,814 women were sampled in about 1 out of every 9 census EAs
• The 2000 census was used in 2003 to select a sample representative of women living in AMD).
• For the wave II survey, approximately one-third of the original sample could not be found and had to be replaced with women matched for age and enumeration area to the original participants.
• Data for WHSA-II were collected from January 2008 to January 2010
• Questionnaire asked about various outcomes related to household management of malaria:
i. “When you had malaria the last time, was it diagnosed by a health professional?”
ii. “The last time you had malaria, was a blood smear or a blood test performed?”
iii. “Does anyone in your household own an ITN?”
iv. “Do you take any personal precautions (other than nets) to protect yourself from malaria?”
v. “During your last pregnancy did you take any SP to keep you from getting malaria?”
• Data were also collected on 4 possible determinants of these outcomes:
i. Household wealth (classified into 5 wealth quintiles);159
ii. Socio-economic level of the neighborhood in which the woman lived (classified as low class, lower middle, upper middle or high class). “Low class” neighborhoods be thought of as “slums”.
iii. Highest level of schooling attended by the woman (None vs. primary vs. middle/ junior secondary school (JSS) vs. secondary vs. higher);
iv. Whether or not the women was currently enrolled in the National Health Insurance Scheme;
• No bio-markers were assessed
159 Household wealth quintile was specified by principal components analysis of the household assets and character-
istics of the women in the sample.

89
Annex 5: Malaria data reported routinely by health facilities in Ghana
Routine health service data
Each month health facilities in Ghana routinely report malaria cases and malaria testing using two forms
a. The Monthly OPD Morbidity Form is used to report all illnesses treated as outpatients. Six rows of the form are devoted to reporting cases of malaria:
• Uncomplicated malaria – non-laboratory confirmed;
• Uncomplicated malaria – laboratory confirmed;
• Severe malaria – non-laboratory confirmed;
• Severe malaria – laboratory confirmed
• Malaria in pregnancy – non-laboratory confirmed
• Malaria in pregnancy – laboratory confirmed
The form has separate columns for reporting cases of each of these illnesses disaggregated by sex and by 12 (!) different age categories.
b. The Case Reporting Form I/II/III ( also known as “CRF I/II/III” or simply “CRF”) was introduced in 2011. It collects the following data for outpatients (disaggregated into children under five, 5 years and older and pregnant) as well as for inpatients (also disaggregated into children under five, 5 years and older and pregnant):
• Total patients (all diseases);
• Total malaria cases (lab confirmed and non-lab confirmed; uncomplicated and severe)
• Total malaria tests performed
• Total positive malaria tests (“confirmed malaria cases only”)
Review of the 2 forms shows some overlap of their data elements (e.g. laboratory confirmed cases from the OPD Morbidity Form should equal the total positive malaria tests from the CRF).
Since late 2011, data from both forms has been entered into the electronic District Health Information System (DHIS) software that is used to manage the data of the District Health Information and Management System (DHIMS) of the Ghana Ministry of Health. A total of 3,662 health facilities nationwide are registered in this system. Of these, only 3,043 health facilities (46 out of 131 health facilities registered in AMD; 70 out of 133 health facilities registered in KMD) have reported any malaria cases using the Monthly OPD Morbidity
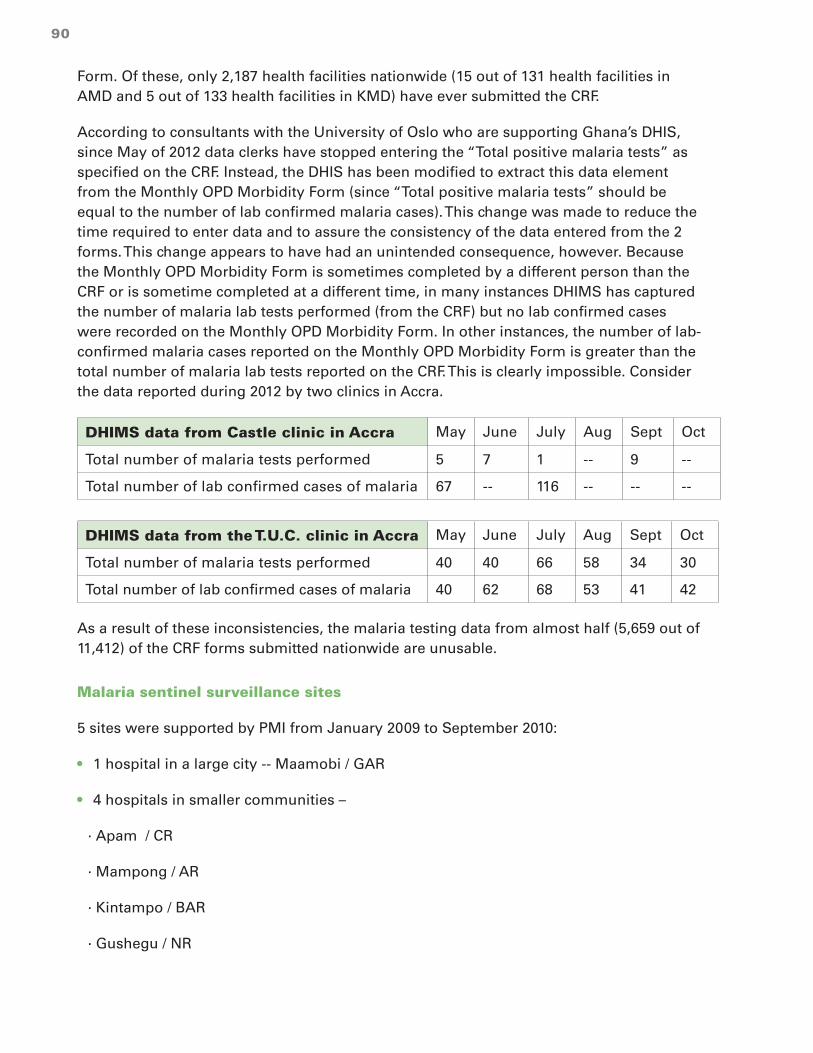
90
Form. Of these, only 2,187 health facilities nationwide (15 out of 131 health facilities in AMD and 5 out of 133 health facilities in KMD) have ever submitted the CRF.
According to consultants with the University of Oslo who are supporting Ghana’s DHIS, since May of 2012 data clerks have stopped entering the “Total positive malaria tests” as specified on the CRF. Instead, the DHIS has been modified to extract this data element from the Monthly OPD Morbidity Form (since “Total positive malaria tests” should be equal to the number of lab confirmed malaria cases). This change was made to reduce the time required to enter data and to assure the consistency of the data entered from the 2 forms. This change appears to have had an unintended consequence, however. Because the Monthly OPD Morbidity Form is sometimes completed by a different person than the CRF or is sometime completed at a different time, in many instances DHIMS has captured the number of malaria lab tests performed (from the CRF) but no lab confirmed cases were recorded on the Monthly OPD Morbidity Form. In other instances, the number of lab-confirmed malaria cases reported on the Monthly OPD Morbidity Form is greater than the total number of malaria lab tests reported on the CRF. This is clearly impossible. Consider the data reported during 2012 by two clinics in Accra.
DHIMS data from Castle clinic in Accra May June July Aug Sept Oct
Total number of malaria tests performed 5 7 1 -- 9 --
Total number of lab confirmed cases of malaria 67 -- 116 -- -- --
DHIMS data from the T.U.C. clinic in Accra May June July Aug Sept Oct
Total number of malaria tests performed 40 40 66 58 34 30
Total number of lab confirmed cases of malaria 40 62 68 53 41 42
As a result of these inconsistencies, the malaria testing data from almost half (5,659 out of 11,412) of the CRF forms submitted nationwide are unusable.
Malaria sentinel surveillance sites
5 sites were supported by PMI from January 2009 to September 2010:
• 1 hospital in a large city -- Maamobi / GAR
• 4 hospitals in smaller communities –
· Apam / CR
· Mampong / AR
· Kintampo / BAR
· Gushegu / NR

91
Support was provided to strengthen routine reporting of malaria cases and malaria testing. Incomplete and variable testing and uncertainty about catchment areas made interpretation of the statistics challenging. Clinicians at Maamobi were especially resistant to malaria testing.
Annex 6: Publications documenting the burden of urban malaria in Ghana
1. Peer reviewed articles published since 2004 on research in select neighborhoods of Accra and Kumasi – Various research partners (International Water Management Institute, Noguchi, KNUST/Kumasi Centre for Collaborative Research, Liverpool School of Hygiene and Tropical Medicine) have collaborated on studies that measured the EIR and/or the prevalence of malaria parasitemia in over 2,000 children under five in Accra and over 2,000 children under five in Kumasi. The key findings of these seven articles (each of which can easily be accessed via the internet) are discussed in detail in the body of this report on the Ghana Urban Malaria Study.
• Afrane YA, Klinkenberg E, Drechsel P, Owusu-Daaku K, Garms R, Kruppa T. (2004) Does irrigated urban agriculture influence the transmission of malaria in the city of Kumasi, Ghana. Acta Tropica 89 (2004) 125–134
• Klinkenberg E, McCall PJ, Hastings IM, Wilson MD, Amerasinghe FP, Donnelly MJ. (2005) High malaria prevalence and urban agriculture in Accra, Ghana. Emerging Infectious Diseases 11, 1290–1293
• Klinkenberg E, McCall PJ, Wilson MD, Akoto AO, Amerasinghe FP, Bates I, Verhoeff FH, Barnish G, Donnelly MJ. (2006) Urban malaria and anaemia in children: a cross-sectional survey in two cities of Ghana. Trop Med Int Health 2006; 11: 578– 88.
• Ronald LA, Kenny SL, Klinkenberg E, Akoto AO, Boakye I, Barnish G, Donnelly MJ. (2006) Malaria and anaemia among children in two communities of Kumasi, Ghana: a cross-sectional survey. Malaria Journal 2006, 5:105
• Klinkenberg E, McCall P, Wilson MD, Amerasinghe FP, Donnelly MJ. (2008) Impact of urban agriculture on malaria vectors in Accra, Ghana. Malaria Journal 2008, 7:151
• Klinkenberg E, Onwona-Agyeman KA, McCall PJ, Wilson MD, Bates I, Verhoeff FH, Barnish G, Donnelly MJ. (2010) Cohort trial reveals community impact of insecticide-treated nets on malariometric indices in urban Ghana. Transactions of the Royal Society of Tropical Medicine and Hygiene 104 (2010) 496–503
• Afrane YA, Lawson BW, Brenya R, Kruppa T, Yan G. (2012) The ecology of mosquitoes in an irrigated vegetable farm in Kumasi, Ghana: abundance, productivity and survivorship. Am J Trop Med Hyg. 2012 Nov 19.
2. Ehrhardt S, Burchard GD, Mantel C, Cramer JP, Kaiser S, Kubo M, Otchwemah RN, Bienzle U, Mockenhaupt FP (2006) Malaria, Anemia, and Malnutrition in African Children—

92
Defining Intervention Priorities. Journal of Infectious Diseases 2006:194: 108 - 14. As part of their study centered on Ghana’s Northern Region (NR), researcher assessed for malaria parasitemia in 4,000 children 3 to 9 years of age. Children were sampled from Tamale as well as from surrounding, more rural communities of the NR. The researchers concluded that the percentage of fever attributable to malaria was 69% in rural areas vs. only 31% in Tamale. Unfortunately, other statistics on malaria parasitemia presented in the article do not disaggregate urban (Tamale) from rural areas. However, the authors shared with the Malaria Atlas Project (MAP -- ) their data on the sample size, age range, numbers of parasitemic children, dates of collection, and geo-coordinates for each community were they assessed for malaria parasitemia during the dry season (February, March or April of 2002). Findings from analysis of these data are presented in the report.
3. Coleman, S. (2009) Studies of Entomological Parameters and Perception of Malaria Transmission on the Kwame Nkrumah University of Science and Technology campus, in the Ashanti Region of Ghana. A thesis submitted for the award of Master of Science in Clinical Microbiology. This thesis documents how breeding of malaria vectors and transmission of malaria (EIR = 22) is associated with agricultural plots adjacent to faculty housing. Excellent photographs and maps of breeding sites are included.
4. Opoku AA, Ansa-Asare OD and Amoako J. (2007) The Occurrences and Habitat Characteristics of Mosquitoes in Accra, Ghana. A research report of the CSIR-Water Research Institute, P.O. Box AH 38, Achimota, Ghana. The authors researched the intensity of breeding of malaria vectors (measuring numbers of larvae isolated) and the environmental conditions present in water bodies of 5 neighborhoods of greater Accra: Ashaiman, La, Chorkor, Gbawe, Adabraka. They found Culex species predominated in all 5 locations, especially in bodies of water with a high nutrient content. In contrast, malaria vectors were less common and were found only in La, Chorkor and Gbawe. “Open, clear and sunlit pools appeared to favour the breeding of A. gambiae and it was found largely in ephemeral pools (hoof prints, footprints, roadside ditches, natural depressions, holes created by man, etc.) These small pools with surface areas < 0.2 m2 account for the majority of sites where A. gambiae was present… The study demonstrated that the Culex species encountered occur in large numbers in a wide variety of places with high nutrient values and low oxygen levels. The Anopheles species also occurred in a wide range of habitats but with relatively low nutrient status and high oxygen levels.”
5. Orish VN, Onyeabor OS, Boampong JN, Aforakwah R, Nwaefuna E, Iriemenam NC (2012) Adolescent pregnancy and the risk of Plasmodium falciparum malaria and anaemia—A pilot study from Sekondi-Takoradi metropolis, Ghana. Acta Tropica 123 (2012) 244– 248. “Pregnant women attending their antenatal care (ANC) visits were strategically sampled from four hospitals in the metropolis with the intention of recruiting pregnant women from sub-urban and rural communities of the city.” Out of 759 clients older than 20 who were tested, 21% were positive for malaria parasites by microscopy. Unfortunately, the report fails to disaggregate the findings by urban vs. rural residence.
6. LABIOFAM (2012) Larviciding and community participation in 3 regions of Ghana. A powerpoint presentation to the Malaria Vector Control Oversight Committee of Ghana.

93
The presentation notes that 394 anopheline breeding sites were identified: 133 in Accra, 149 in Kumasi and 112 in Sunyani. Unfortunately, the presentation does not specify the location of these breeding sites or include any other reliable measurement of the burden of malaria in these 3 cities.
7. Chinery WA (1995) Impact of rapid urbanization on mosquitoes and their disease transmission potential in Accra and Tema, Ghana. Afr J Med Med Sci. 1995 Jun;24(2):179-88.
8. Chinery WA (1990) Variation in frequency in breeding of Anopheles gambiae s.l. and its relationship with in-door adult mosquito density in various localities in Accra, Ghana. East Afr Med J. 1990 May; 67(5):328-35. The author trapped anopheline mosquitoes in houses of 12 neighborhoods of greater Accra. He found that the peripheral neighborhoods of Gbawe and Teshie had higher indoor anopheline resting densities while central Accra (Ministries, Osu, Jamestown/Usher town, Korle Bu and Osu) had lower indoor anopheline resting densities. Indoor mosquito resting densities were closely associated with the frequency of breeding. This suggests, the author argues that mosquitoes are most likely to invade the nearest neighborhoods.
9. Chinery WA (1984) Effects of ecological changes on the malaria vectors Anopheles funestus and the Anopheles gambiae complex of mosquitoes in Accra, Ghana. J Trop Med Hyg. 1984 Apr;87(2):75-81. In this classic article, the author recounts 50 to 75 years of trends in the intensity of anopheline mosquito breeding, indoor density of adult anopheline mosquitoes and prevalence of malaria parasitemia. By the time that the article was written in 1984, breeding of Anopheles funestus had almost been disappeared from Accra as a result of the loss of natural breeding waters (ponds, swamps, marshes, tree holes) and resting places (trees and shrubs) as well as adoption of mosquito control measures (screening of houses, aerosol spraying, use of coils, control of domestic water containers, and intermittent larvicidal campaigns with kerosene, DDT and other insecticides). Some sub species of Anopheles gambiae s.l. (An. arabiensus?) had adapted to breeding in polluted water and domestic water receptacles. However, there had been an overall decline in both the annual indoor resting density of Anopheline mosquitoes (declining from 4.1 in the mid 1950s to 0.62 in the mid 1960s) and the all age prevalence of malaria parasitemia (declining from 50.3% in the period 1912 to 1931 to 40.3% in 1954 to 21.0% in 1976). Interestingly, the indoor resting density for central Accra appears to have been low for several decades (0.61 in 1955 and 0.64 in 1964).
10. Chinery WA (1970) A survey of mosquito breeding in Accra, Ghana, during a 2 year period of larval mosquito control. June 1970 issue of the Ghana Medical Journal. The article includes a graph showing a spike in breeding of Anopheles gambiae s.l. larvae and adult indoor Anopheles gambiae density from May to September, one month following the main rainy season of April to August, 1965.
11. Gardiner C, Biggar RJ, Collins WE and Nkrumah FK (1984) Malaria in urban and rural areas of southern Ghana: a survey of parasitaemia, antibodies, and antimalarial practices. Bulletin of the World Health Organization, 62 (4): 607 – 613. In a survey conducted in January of 1978, only 5 (2.8%) of 176 children 6 to 59 months in randomly selected households in the Ablekuma section of Accra were found to have malaria parasites by

94
microscopy. At the same time, 10 (23.8%) of 42 residents of households in rural Berekuso (just north of Accra) were positive by miscroscopy.
12. Roberts J (2010) Korle and the mosquito: Histories and memories of the anti-malarial campaign in Accra, 1942-1945. The Journal of African History. Volume 51, Issue 3, pages 343-365. Roberts recounts efforts by the “Inter-Allied Malaria Control Group” (IAMCG – a collaboration of British and American military forces and scientists) to fight malaria in Accra while allied air forces were using the city as a re-fueling hub. Mosquitoe traps were used to compile an “Accra Anopheline Index” and map malaria risk. A map from the IAMCG report shows that attention focused on Korle Lagoon and its tributary streams which malariologists of the time found to be “swarming with Anopheline larvae”. In addition to Korle Lagoon, the map features the Odaw river and several other lagoons (Klote near Teshie and Sakumo some miles to the east). The article focuses almost exclusively on the perceived risk of Korle Lagoon but includes none of the data suggesting that this or other areas had a higher “Accra Anopheline Index”.
13. Christophers SR, Stephens JW (1900) Further reports to the malaria committee of the Royal Society. This early mapping of malaria risk around Accra notes that “The central portion of Accra, to which we have already drawn attention as being without breeding places, even after rain, showed a very marked and striking difference. This was the first area in which the infected children were less than 50 per cent… 5 out of 24 children only being infected…” In contrast, in nearby villages and even in “Cantonment” and outlying parts of Accra at the time, the prevalence of malaria parasitemia in children under eight was 61% to 73%.

95
Annex 7: The Mapping Malaria Risk in Africa map
Estimating the prevalence of malaria parasitemia in Ghanaian children based upon research studies up to 2002.

96
Annex 8: Map of the prevalence of malaria parasitemia by ecological zone, 2011 MICS
In children 6 to 59 months of age, by microscopy.
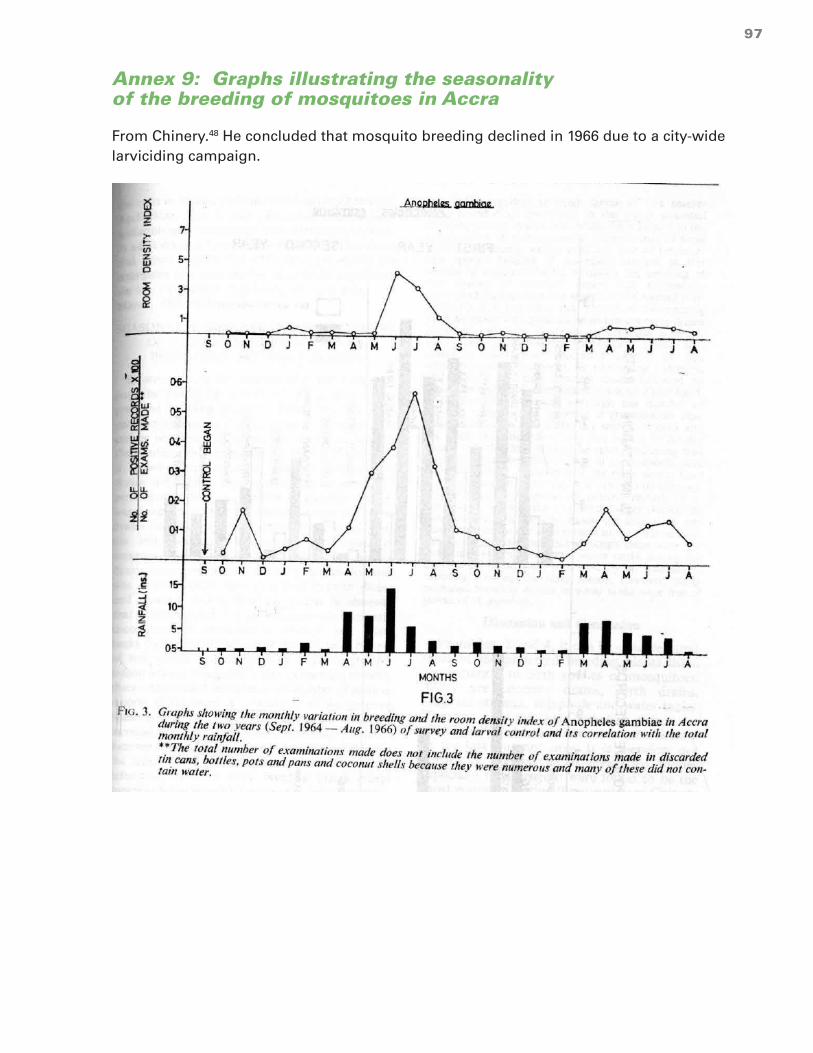
97
Annex 9: Graphs illustrating the seasonality of the breeding of mosquitoes in Accra
From Chinery.48 He concluded that mosquito breeding declined in 1966 due to a city-wide larviciding campaign.

98
Annex 10: An example of variation in the prevalence of malaria parasitemia by age group
From Owusu-Agyei et al. 41 in the forest-savannah transition zone of Ghana, 2004.
Prevalence of malaria parasitemia (by microscopy), by age group

99
Annex 11: Percentage of children with malaria parasitemia (by RDT)
Children 6 to 59 months of age, by community size and ecological zone, 2011 MICS (95% confidence interval).
Population of the community
% of children with malaria parasitemia (by RDT) (95% C.I.)
Coastal zone Forest Savannah
Rural (<5,000) 45.9% (36.1%-55.6%)
62.5% (57.1%-67.8%)
76.9% (72.5%-81.3%)
Towns (5,000 to 50,000) 24.6% (14.9%-34.3%)
35.9% (25.7%-46.1%)
50.0% (39.8%-60.3%)
Small cities(50,000 to 150,000) 33.9% (16.3%-51.5%)
38.5% (3.5%-73.5%)
34.4% (22.2%-46.7%)
Medium cities (150,000 to 600,000)
22.0% (5.3%-38.7%)
* Tamale=31.0% (14.5%-47.4%)
Large cities(>2,000,000) Accra = 7.8% (2.6%-13.1%)
Kumasi = 7.8% (1.0%-14.7%)
----**
* Fewer than 25 observations (Obuasi).
** There are no large cities in Ghana’s savannah zone.

100
Annex 12: Malaria test positivity rates, by ecological zone and districts of Ghana
From GHS DHIMS data January to October 2012.

101

102
Annex 13: Photos of a well, furrows and a water-filled footprint
An agricultural site on the campus of the KNUST in Kumasi. Photos by Coleman.92
human footprint

103
Annex 14: Percentage of households in each expenditure quintile, by region of Ghana
Source: 2008, GLSS, Ghana Statistical Service.
Region Household wealth quintile
1 (poorest)
2 3 4 5 (wealthiest) Total
Western 5.8% 16.7% 18.5% 23.1% 35.9% 100%
Central 7.0% 13.7% 21.0% 23.8% 34.5% 100%
Greater Accra 4.6% 9.1% 15.5% 24.7% 46.1% 100%
Volta 12.7% 23.2% 21.4% 20.3% 22.4% 100%
Eastern 4.9% 14.3% 23.1% 25.7% 31.9% 100%
Ashanti 7.9% 14.6% 16.3% 22.3% 38.9% 100%
Brong Ahafo 11.0% 19.8% 21.1% 21.5% 26.5% 100%
Northern 32.9% 20.7% 15.4% 15.3% 15.6% 100%
Upper East 54.8% 19.1% 13.0% 7.2% 5.9% 100%
Upper West 76.7% 12.5% 5.3% 2.4% 3.1% 100%
Nationwide 20.0% 20.0% 20.0% 20.0% 20.0% 100%
Ghana Statistical Service (2008) Ghana Living Standards Survey. Report of the Fifth Round (GLSS 5).

104
Annex 15: Prompt treatment of fever, by maternal education, 2011 MICS.
Percentage of children sick with fever in the last 2 weeks who were given an anti-malarial the same or next day.
Locale Education of the mother
None
(95% C.I.)
Some
(95% C.I.)
Accra or Kumasi
0/3* = 0% (0%)
8/32 = 26.5% (8.8%% -44.2%)
Urban 61/159 = 36.5% (35.4% - 55.2%)
113/251 = 45.3% (25.7%-47.3%)
Rural 266/945 = 27.0% (22.9% - 31.1%)
150/441 = 34.7% (27.8% - 41.6%)
* Fewer than 25 observations. The sample sizes that are given are unweighted. The statistics given are based on weighted samples.
Annex 16: Various indicators, by socio-economic class of the neighborhood, WHSA-II
Indicator Socio-economic class of the neighborhood Risk ratio
(95% C.I.)159
Low class Lower middle
Upper middle
High class
Enrolled in NHIS
27.9% (23.7% - 32.2%)
30.2% (25.8%-34.6%)
36.6% (32.2%-41.0%)
37.1% (30.8%-43.5%)
0.75 (0.60 – 0.95)
Treated last episode with ACT
12.3%* (8.5% - 16.1%)
17.5% (13.7%-21.4%)
18.4% (14.6%-22.1%)
21.8% (17.8%-25.8%)
0.56 (0.39 – 0.81)
Did you seek medical care for your last episode of malaria?
85.9% (79.0% - 92.9%)
85.5% (79.6%-91.5%)
86.9% (81.9%-91.8%)
88.4% (83.0%-93.7%)
0.97 (0.88 – 1.08)
Got lab test for last episode of malaria
36.8% (32.3% - 41.2%)
44.4% (39.4%-49.3%)
42.8% (37.7%-47.9%)
43.5% (39.2%-47.8%)
0.85 (0.72 – 0.99)

105
Indicator Low class Lower middle
Upper middle
High class Risk ratio
(95% C.I.)159
Took malaria prophylaxis with last pregnancy
62.9% (56.7% - 69.2%)
71.7% (64.7%-78.8%)
69.8% (61.5%-78.0%)
63.1% (55.6%-70.5%)
1.0 (0.85 – 1.17)
Household owns at least one ITN
24.6% (20.8% - 28.4%)
23.7% (19.2%-28.1%)
23.6% (18.6%-28.6%)
22.9% (18.8%-26.9%)
1.08 (0.84.8 – 1.36)
Screen on windows
92.6%* (89.8% - 95.4%)
94.5% (92.4%-96.5%)
97.3% (95.9%-98.8%)
97.3% (95.5%-99.1%)
0.95 (0.92 – 0.99)
Take precautions against malaria besides ITN
74.9% (70.4% - 79.4%)
78.0% (73.0%-82.9%)
77.0% (71.1%-83.0%)
81.4% (76.2%-86.6%)
0.92 (0.84 – 1.01)
Puddles near to house
51.9%* (43.9% -59.9 %)
45.7%* (38.2% -53.2%)
42.7% (35.1% -50.3 %)
30.4% (23.6% - 37.1%)
1.71 (1.3 – 2.25)
Listen to radio every day
57.9%* (50.8% - 65.0%)
72.3% (67.7%-77.0%)
77.7% (73.8%-81.6%)
77.6% (73.4%-81.7%)
0.75 (0.65 – 0.85)
Watch TV every day
54.7%* (49.8% - 59.7%)
59.4% (53.6%-65.3%)
70.1% (65.6%-74.6%)
67.6% (62.8%-72.2%)
0.81 (0.72 – 0.91)
*The difference between this estimate and the estimate for high class neighborhoods is statistically significant with P < 5%.
160
160 Percentage for women living in “low class” neighborhoods / percentage for women living in “high class” neigh-
borhoods. Ninety five per cent confidence interval calculated with poisson regression by using STATA’s svypois-
sion command to adjust for cluster sampling and provide for robust estimates of confidence intervals. Refer to
Analysis of surveys with Epi Info and STATA. UCLA. www.ph.ucla.edu/epi/rapidsurveys/RScourse/probstata_epiin-
foex.pdf.

106
Annex 17: Various indicators, by education of the woman, WHSA-II 161
Indicator Highest level of school attended by the woman Risk ratio
(95% C.I.)160
None
(95% C.I.)
Primary
(95% C.I.)
Middle/JSS
(95% C.I.)
Secondary
(95% C.I.)
Higher
(95% C.I.)
Enrolled in NHIS
29.1% (24.9% - 33.4%)
25.9% (20.6%-31.2%)
33.3% (30.0%-36.4%)
36.8% (31.6%-41.9%)
37.6% (31.4%-43.9%)
0.79 (0.66 – 0.94)
Treated last episode with ACT
6.1%* (3.5% - 8.6%)
8.9%* (5.2%-12.6%)
15.8% (13.3%-18.3%)
21.9% (17.5%-26.4%)
37.7% (31.3% - 44.1%)
0.22 (0.15 – 0.32)
Did you seek medical care for your last episode of malaria?
81.8% (74.4% - 89.2%)
87.1% (80.4%-93.9%)
86.3% (82.4%-90.2%)
88.1% (83.5%-92.7%)
89.2% (83.6%-94.9%)
0.92 (0.84 – 1.02)
Got lab test for last episode of malaria
32.8%* (27.3% - 38.3%)
39.4% (33.5%- 45.4%)
40.9% (37.0%- 44.8%)
44.2% (39.1%-49.2%)
53.9% (47.1%-60.1%)
0.69 (0.57 – 0.82)
Took malaria prophylaxis with last pregnancy
52.8%* (45.2% - 60.5%)
68.9% (61.5%-76.2%)
70.8% (66.3%-75.2%)
71.6% (65.5%-77.8%)
64.7% (55.5%-73.9%)
0.76 (0.65 – 0.89)
Household owns at least one ITN
16.2% (12.8% -19.6 %)
22.2% (17.8%-26.5%)
25.0% (21.6%-28.4%)
28.0% (23.6%-32.5%)
25.5% (19.1%-31.9%)
0.60 (0.47 – 0.76)
Screen on windows
93.8%* (91.5% -96.2 %)
92.5% (89.5%-95.5%)
95.3% (93.9%-96.7%)
97.1% (95.3%-98.8%)
98.2% (96.4%-100%)
0.96 (0.94 – 0.99)
161 Percentage for women with no education / percentage for women with secondary education or higher. Ninety
five per cent confidence interval calculated with poisson regression by using STATA’s svypoission command to
adjust for cluster sampling and provide for robust estimates of confidence intervals. Refer to Analysis of surveys
with Epi Info and STATA. UCLA. www.ph.ucla.edu/epi/rapidsurveys/RScourse/probstata_epiinfoex.pdf.

107
Take precautions against malaria besides ITN161
71.7%* (67.1% - 76.2%)
77.1% (72.0%-82.3%)
76.3% (72.6%-80.1%)
83.0% (79.2%-86.8%)
84.4% (79.4%-89.3%)
0.86 (0.80 – 0.92)
Puddles near to house
46.7% (40.1% - 53.2%)
50.2% (43.2% - 57.3%)
40.8% (36.1% - 45.4%)
44.3% (35.8% - 50.1%)
41.2% (34.1% - 48.3%)
1.08 (0.93 – 1.25)
Listen to radio every day
46.5%* (41.4% -51.7 %)
71.0%* (64.5%-77.4%)
72.3%* (68.8%-75.8%)
81.9% (77.7%-86.0%)
85.7% (81.2%-90.1%)
0.56 (0.50 – 0.63)
Watch TV every day
40.2%* (35.4% - 45.1%)
54.2%* (48.3%-60.1%)
62.9%* (59.3%- 66.5%)
76.9% (72.6%-81.2%)
84.0% (79.0%-88.9%)
0.51 (0.45 – 0.57)
*The difference between this estimate and the estimate for women with secondary education is statistically significant with P <0.05%. (Women with at least secondary education were chosen to assure an adequate sample size for the comparison group.)
162
Annex 18: Various indicators, by enrollment in NHIS, WHSA-II 163
Indicator Currently enrolled in the National Health Insurance Scheme
Risk ratio
(95% C.I.)162
No Yes
Treated last episode with ACT 15.3% (12.9% - 17.6%)
20.6%* (17.1% - 24.1%)
1.35 (1.08 – 1.68)
Did you seek medical care for your last episode of malaria?
84.1% (80.3% - 87.9%)
90.7%* (86.7%- 93.6%)
1.08 (1.03 – 1.13)
Got lab test for last episode of malaria
39.3% (36.2% - 42.4%)
46.1%* (42.0% - 50.2%)
1.17 (1.04 – 1.32)
Took malaria prophylaxis with last pregnancy
66.3% (62.1% - 70.5%)
68.7% (63.9%- 73.4%)
1.04 (0.96 – 1.11)
Household owns at least one ITN 21.8% (19.4% - 24.2%)
28.0%* (24.4%- 31.5%)
1.28 (1.11 – 1.49)
*The percentage of houses with ITNs was significantly greater for women enrolled in NHIS than for women not enrolled in NHIS. P < 0.05.
162 “Do you take any personal precautions (other than using a bed net) to protect yourself from malaria / mosquito
bites (spraying with repellant, wearing protective clothes, mosquito coil)?
163 Percentage for women currently enrolled in the NHIS / percentage for women not currently enrolled in NHIS.
Ninety five per cent confidence interval calculated with poisson regression by using STATA’s svypoission com-
mand to adjust for cluster sampling and provide for robust estimates of confidence intervals. Refer to Analysis of
surveys with Epi Info and STATA. UCLA. www.ph.ucla.edu/epi/rapidsurveys/RScourse/probstata_epiinfoex.pdf.

108
Annex 19: Association of women’s education with household wealth, WHSA-II
Highest level of education of the woman
Household wealth
1 (poorest) 2 3 4 5 (wealthiest)
None 33.6% 22.4% 13.9% 8.7% 5.8%
Primary 19.4% 15.2% 12.7% 10.2% 5.0%
Middle/JSS 39.7% 43.8% 46.5% 45.2% 32.2%
Secondary 6.7% 14.4% 19.9% 21.7% 29.1%
Higher 0.4% 3.9% 6.6% 13.2% 27.0%
Total 100% 100% 100% 100% 100%

109
Annex 20: Logistic regression analysis of the association between indicators of SES & 2 malaria control practices, WHSA-II164165
Table 1: Descriptive statistics
Variable Value Description ACT163 Tested164
n % ACT = 1 n % Tested = 1
All obs. 2199 17.1% 2182 41.7
QUINTILE (household wealth)
1 poorest 375 7.5% 373 28.9%
2 471 13.4% 470 37.5%
3 471 17.1% 465 38.0%
4 466 21.2% 459 52.2%
5 wealthiest 416 25.5% 414 50.4%
EDUC (highest level of school attended)
0 none 317 6.1% 313 32.8%
1 primary 269 8.9% 269 39.4%
2 middle / JSS
925 15.8% 917 40.9%
3 secondary 416 21.9% 410 44.2%
4 higher 248 37.7% 248 53.9%
EASES (class of neighborhood)
1 lowest 613 12.3% 603 36.8%
2 546 17.5% 540 44.4%
3 611 18.4% 611 42.8%
4 highest 429 21.8% 428 43.5%
164 Reported use of ACTs during the most recent episode of suspected malaria.
165 Reported malaria testing during the most recent episode of suspected malaria.

110
Table 2: Logistic regression results -- ACT =Yes
QUINTILE EDUC EASES
Odds
ratio
95%
C.I.
p-value Odds
ratio
95%
C.I.
p-value Odds
ratio
95%
C.I.
p-value
Model 1 1.37 1.26
–
1.50
0.000
Model 2 1.19 1.08
–
1.31
0.000 1.51 1.35
–
1.69
0.000
Model 3 1.03 0.92
–
1.16
0.002 1.51 1.34
–
1.69
0.000 1.03 0.92
–
1.16
0.52
Table 3: Logistic regression results -- Tested =Yes
QUINTILE EDUC EASES
Odds
ratio
95%
C.I.
p-value Odds
ratio
95%
C.I.
p-value Odds
ratio
95%
C.I.
p-value
Model 1 1.27 1.19
–
1.36
0.000
Model 2 1.24 1.15
–
1.34
0.000 1.06 0.98
–
1.15
0.158
Model 3 1.26 1.17
–
1.37
0.000 1.06 0.98
–
1.15
0.137 0.95 0.87
–
1.03
0.226

111
Annex 21: Prevalence of parasitemia (by microscopy) in children 6 to 59 months, by wealth of household in Accra or Kumasi, 2011 MICS
Locale Below average wealth (95% C.I.)
Above average wealth (95% C.I.)
Accra or Kumasi 4.8 %* (1.3% – 8.2%)
2.6%* (0% – 5.5%)
* p < 0.01
Annex 22: Percentage of children living in households owning an ITN who slept the previous night under an ITN, by size of community (with the 95% confidence interval), 2008 DHS
Size of the community % of children living in households owning an ITN who slept the previous night under an ITN
Village (<5,000) 60.4% (57.1% - 63.7%)
Town (5,000 to 50,000) 54.8% (49.0% - 60.6%)
Small city (50,000 to 150,000) 59.4% (50.3% - 68.5%)
Medium city (150,000 to 600,000) 47.6% (37.0% - 58.2%)
Large city (>2,000,000) 50.3% (43.2% - 57.5%)
Annex 23: Percentage of children sick with a fever who were reportedly given either ACT or amodiaquine the same day or the next day after onset of the fever (95% confidence interval), 2011 MICS.
Size of the community % of children sick with fever who were given either ACT or amodiaquine the same or next day
Village (<5,000) 24.2% (19.9% - 28.7%)
Town (5,000 to 50,000) 37.6% (28.3% - 46.9%)
Small city (50,000 to 150,000) 56.8% (25.7% - 88.9%)
Medium city (150,000 to 600,000) 20.3% (4.3% - 36.3%)
Large city (>2,000,000) 23.8% (8.3% - 39.3%)
The table shows, for the 2011 MICS, the percentage of febrile children who were re-ported to have been given either ACT or amodiaquine the same day or the next day after onset of the fever:

112
USAID/FOCUS REGION HEALTH PROJECT
JSI RESEARCH & TRAINING INSTITUTE, INC.
P. O. BOX CT 6141, CANTONMENTS, ACCRA
GHANA
WWW.JSI.COM