REPORT ON THE 2016 REGIONAL ECONOMIC …rsso12.psa.gov.ph/sites/default/files/s/Lectures and...
32
Republic of the Philippines SOCCSKSARGEN REPORT ON THE 2016 REGIONAL ECONOMIC PERFORMANCE OF THE SOCCSKSARGEN REGION East Asia Royale Hotel, General Santos City 04 May 2017, 10:00 AM ATTY. MAQTAHAR L. MANULON, CESE Regional Director PSA-SOCCSKSARGEN
Transcript of REPORT ON THE 2016 REGIONAL ECONOMIC …rsso12.psa.gov.ph/sites/default/files/s/Lectures and...

Republic of the Philippines
SOCCSKSARGEN
REPORT ON THE2016 REGIONAL ECONOMIC
PERFORMANCE OF THESOCCSKSARGEN REGION
East Asia Royale Hotel, General Santos City04 May 2017, 10:00 AM
ATTY. MAQTAHAR L. MANULON, CESERegional Director
PSA-SOCCSKSARGEN

Republic of the Philippines
SOCCSKSARGEN
Highlights of the2016 GROSS REGIONAL
DOMESTIC PRODUCTof
SOCCSKSARGEN Region

Republic of the Philippines
SOCCSKSARGEN
Outline of Presentation
I. GRDP Levels
II. Growth Rates
III. Percent distribution of Sector/Subsector
IV. Contribution to growth
V. Per Capita GRDP
VI. Performance of SOCCSKSARGEN
vis a vis other regions
VII. Data Sources
3

Republic of the Philippines
SOCCSKSARGEN
GROSS REGIONAL DOMESTIC PRODUCT, SOCCSKSARGEN: 2014-2016(At Constant 2000 Prices)
4
196.8
203.2
213.3
180
190
200
210
220
2014 2015 2016
In B
illio
n P
eso
s
GRDP LEVELS
5.0%
3.3%

Republic of the Philippines
SOCCSKSARGEN
5
351.1 356.0386.8
196.8 203.2 213.3
0
50
100
150
200
250
300
350
400
450
2014 2015 2016
In B
illio
n P
eso
s
Current Prices Constant Prices
GROSS REGIONAL DOMESTIC PRODUCT, SOCCSKSARGEN: 2014-2016
GRDP LEVELS

Republic of the Philippines
SOCCSKSARGEN
AREA 2014-2015 2015-2016
Philippines 6.1% 6.9%
SOCCSKSARGEN 3.3% 5.0%
COMPARATIVE GDP GROWTH OF PHILIPPINES AND SOCCSKSARGEN, 2015 and 2016
(In Percent, at Constant 2000 Prices)
6
GROWTH RATES

Republic of the Philippines
SOCCSKSARGEN
2.2 5.3 7.3 8.4 6.2 3.3 5.0
151.3 159.3170.9
185.3196.8 203.2
213.3
0.0
1.0
2.0
3.0
4.0
5.0
6.0
7.0
8.0
9.0
0
50
100
150
200
250
2010 2011 2012 2013 2014 2015 2016
In B
illio
n P
eso
s
Growth Rate GRDP
GROSS REGIONAL DOMESTIC PRODUCT, SOCCSKSARGEN: 2010-2016(at Constant 2000 Prices)
7
GROWTH RATES
In P
erce
nt

Republic of the Philippines
SOCCSKSARGEN
Growth Rates by Industry: SOCCSKSARGEN Region2014-15 and 2015-16 (At Constant 2000 Prices)
INDUSTRY/YEAR 2014-2015 2015-2016
I. AGRI., HUNTING, FORESTRY & FISHING (2.2) (9.5)
a. Agriculture and Forestry (3.4) (6.8)
b. Fishing 3.2 (20.9)
II. INDUSTRY 2.6 13.5
a. Mining and Quarrying 3.6 7.2
b. Manufacturing (0.4) 8.3
c. Construction 13.3 25.8
d. Electricity, Gas and Water Supply 4.4 25.3
III. SERVICE 7.9 7.4
a. Transport, Storage & Communication 9.1 4.0
b. Trade and Repair of Motor Vehicles, Motorcycles, Personal and Household Goods 8.7 7.0
c. Financial Intermediation 6.4 9.7
d. R. Estate, Renting & Business Activities 8.5 8.4
e. Public Administration & Defense; Compulsory Social Security 2.7 5.7
f. Other Services 8.9 9.5
GROSS REGIONAL DOMESTIC PRODUCT 3.3 5.0
8
GROWTH RATES

Republic of the Philippines
SOCCSKSARGEN
9
28.0 26.5 22.9
34.3 34.1 36.9
37.7 39.4 40.3
0%
20%
40%
60%
80%
100%
2014 2015 2016
AHFF Industry Services
PERCENT DISTRIBUTION
MAJOR INDUSTRY DISTRIBUTION OF THE GRDP, SOCCSKSARGEN: 2014-2016(In Percent, at Constant 2000 Prices)

Republic of the Philippines
SOCCSKSARGEN
Percent Distribution by Industry: SOCCSKSARGEN Region2014-2016 (At Constant 2000 Prices)
INDUSTRY/YEAR 2014 2015 2016
I. AGRI., HUNTING, FORESTRY & FISHING 28.0 26.5 22.9
a. Agriculture and Forestry 22.8 21.4 19.0
b. Fishing 5.2 5.2 3.9
II. INDUSTRY 34.3 34.1 36.9
a. Mining and Quarrying 0.3 0.3 0.3
b. Manufacturing 24.6 23.7 24.5
c. Construction 6.2 6.8 8.1
d. Electricity, Gas and Water Supply 3.3 3.4 4.0
III. SERVICES 37.7 39.4 40.3
a. Transport, Storage & Communication 6.8 7.2 7.1
b. Trade and Repair of Motor Vehicles, Motorcycles, Personal and Household Goods 9.3 9.8 9.9
c. Financial Intermediation 4.6 4.8 5.0
d. R. Estate, Renting & Business Activities 5.6 5.9 6.1
e. Public Administration & Defense; Compulsory Social Security 3.6 3.5 3.6
f. Other Services 7.8 8.2 8.6
GROSS REGIONAL DOMESTIC PRODUCT 100.0 100.0 100.0
10
PERCENT DISTRIBUTION

Republic of the Philippines
SOCCSKSARGEN
Sectoral Distribution of AHFF, SOCCSKSARGEN Region: 2016(At Constant 2000 Prices)
11
SECTORAL DISTRIBUTION
Agriculture and Forestry83.0%
Fishing17.0%

Republic of the Philippines
SOCCSKSARGEN
Sectoral Distribution of Industry, SOCCSKSARGEN Region: 2016(At Constant 2000 Prices)
12
SECTORAL DISTRIBUTION
Manufacturing66.3%
Construction22.1%
Electricity, Gas and Water
Supply10.9%
Mining and Quarrying
0.7%

Republic of the Philippines
SOCCSKSARGEN
Sectoral Distribution of Services, SOCCSKSARGEN Region: 2016(At Constant 2000 Prices)
13
SECTORAL DISTRIBUTION
Trade and Repair of Motor Vehicles,
Motorcycles, Personal and Household
Goods24.7%
Other Services21.3%
Transportation, Storage &
Communication17.7%
Real Estate, Renting & Business Activities
15.1%
Financial Intermediation
12.4%
Public Administration &
Defense; Compulsory
Social Security8.8%

Republic of the Philippines
SOCCSKSARGEN
Contribution to Growth by Industry: SOCCSKSARGEN Region 2014-2015 and 2015-2016 (At Constant 2000 Prices)
INDUSTRY/YEAR 2014-2015 2015-2016
I. AGRI., HUNTING, FORESTRY & FISHING (0.6) (2.5)
a. Agriculture and Forestry (0.8) (1.4)
b. Fishing 0.2 (1.1)
II. INDUSTRY 0.9 4.6
a. Mining and Quarrying 0.0 0.0
b. Manufacturing (0.1) 2.0
c. Construction 0.8 1.7
d. Electricity, Gas and Water Supply 0.1 0.9
III. SERVICES 3.0 2.9
a. Transport, Storage & Communication 0.6 0.3
b. Trade and Repair of Motor Vehicles, Motorcycles, Personal and Household Goods
0.8 0.7
c. Financial Intermediation 0.3 0.5
d. R. Estate, Renting & Business Activities 0.5 0.5
e. Public Administration & Defense; Compulsory Social Security
0.1 0.2
f. Other Services 0.7 0.8
GROSS REGIONAL DOMESTIC PRODUCT 3.3 5.0 14
CONTRIBUTION TO GROWTH

Republic of the Philippines
SOCCSKSARGEN
Per Capita GRDP By Region: 2014 to 2016(In Peso at Constant 2000 Prices)
• Per capita GRDP in SOCCSKSARGEN Region was estimated at Php45,484 in 2016, about 42.2 percent lower than the Php78,712 nationalper capita GDP
• NCR posted the highest per capita GRDP of Php232,837 in 2016.
REGION / YEAR 2014 2015 2016
PHILIPPINES 71,741 74,833 78,712
NCR 202,904 218,987 232,837
CAR 73,971 75,048 75,279
ILOCOS 44,894 46,180 49,461
CAGAYAN VALLEY 37,645 38,436 39,153
CENTRAL LUZON 60,670 63,641 68,649
CALABARZON 86,644 92,184 94,826
MIMAROPA 40,706 39,575 39,825
BICOL 24,719 25,770 26,736
WESTERN VISAYAS 37,289 39,653 41,486
CENTRAL VISAYAS 62,743 64,846 69,390
EASTERN VISAYAS 33,771 33,771 37,261
ZAMBOANGA PENINSULA 39,887 41,873 43,106
NORTHERN MINDANAO 57,609 60,290 63,874
DAVAO REGION 58,256 61,335 65,837
SOCCSKSARGEN 43,493 44,178 45,484
CARAGA 35,672 35,553 35,720
ARMM 14,613 13,646 13,350
15 Note: The 2013-2015 series of regional population projections is based on the 2010 Census-based Population Projections in collaboration with the Inter-Agency Working Group on Population Projections
PER CAPITA GRDP

Republic of the Philippines
SOCCSKSARGEN
Per Capita GRDP Growth Rate: 2015 and 2016(At Constant 2000 Prices)
REGION / YEAR 2014-2015 2015-2016
PHILIPPINES 4.3 5.2
NCR 7.9 6.3
CAR 1.5 0.3
ILOCOS 2.9 7.1
CAGAYAN VALLEY 2.1 1.9
CENTRAL LUZON 4.9 7.9
CALABARZON 6.4 2.9
MIMAROPA (2.8) 0.6
BICOL 4.3 3.7
WESTERN VISAYAS 6.3 4.6
CENTRAL VISAYAS 3.4 7.0
EASTERN VISAYAS (0.0) 10.3
ZAMBOANGA PENINSULA 5.0 2.9
NORTHERN MINDANAO 4.7 5.9
DAVAO REGION 5.3 7.3
SOCCSKSARGEN 1.6 3.0
CARAGA (0.3) 0.5
ARMM (6.6) (2.2)
• SOCCSKSARGEN’s per capita GRDP increased by 3.0 percent in 2016
• Eastern Visayas posted highest per capita GRDP growth at 10.3 percent followed by Central Luzon (7.9%) and Davao (7.3%)
16Note: The 2014-2016 series of regional population projections are based on the 2010 Census-based Population Projections in collaboration with the Inter-Agency Working Group on Population Projections
PER CAPITA GRDP

Republic of the Philippines
SOCCSKSARGEN
Performance of SOCCSKSARGENvis a vis the other Regions
Republic of the Philippines
SOCCSKSARGEN
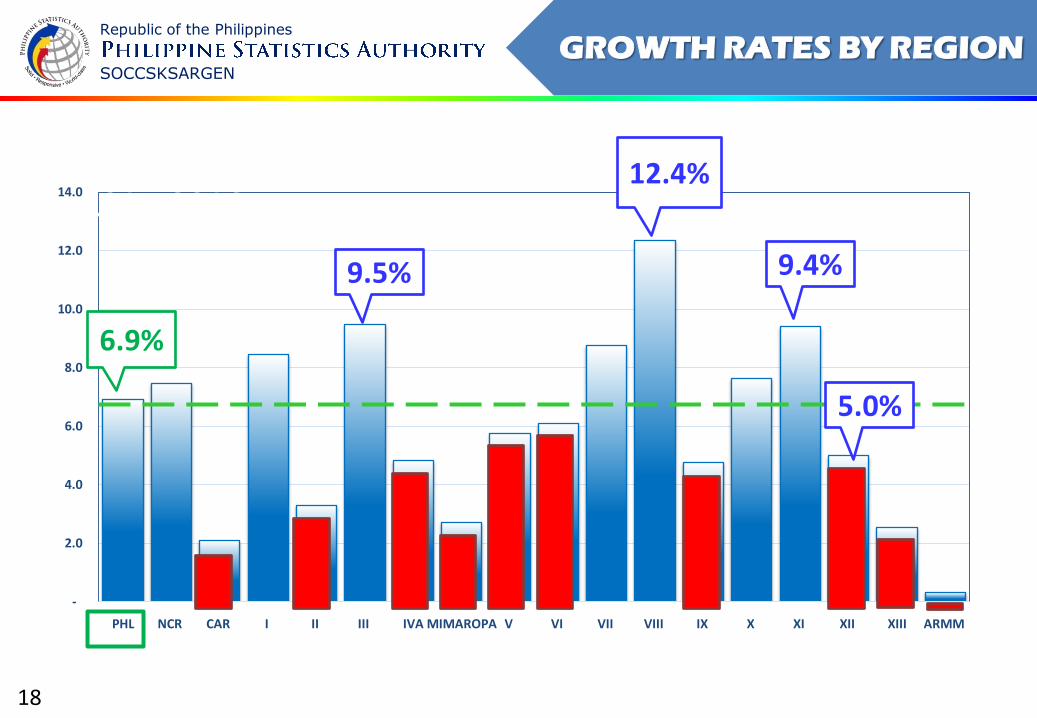
18
-
2.0
4.0
6.0
8.0
10.0
12.0
14.0
PHL NCR CAR I II III IVA MIMAROPA V VI VII VIII IX X XI XII XIII ARMM
2015-201612.4%
6.9%
9.5% 9.4%
5.0%
GROWTH RATES BY REGION

Republic of the Philippines
SOCCSKSARGEN
19
NCR 36.6%
IVA16.8%
III 9.5%
VII 6.5%
XI 4.1%
VI 4.0%
X 3.8%
I 3.2%
XII 2.6%
VIII 2.1%
IX 2.0%
V2.0%
II 1.7%
CAR 1.7%
MIMAROPA1.5%
XIII1.2%
ARMM 0.6% • SOCCSKSARGEN
Region contributed 2.6 percent to the national GDP in 2016
• The region ranked 9th in terms of regional shares
• NCR, CALABARZON and Central Luzon remained as the top three regions with the biggest economies in the country
REGIONAL SHARES

Republic of the Philippines
SOCCSKSARGEN
Regional Contributions to GDP Growth: 2015 and 2016(At Constant 2000 Prices)
• SOCCSKSARGEN
contributed 0.133 percentage point to the 6.9 percent GDP growth in 2016
• NCR was the top contributor to the national growth at 2.723 percentage points followed by Central Luzon, 0.881 percentage point; and CALABARZON at 0.824 percentage point
REGION 2015 2016
PHILIPPINES 6.067 6.924
NCR 2.421 2.723
CAR 0.072 0.037
ILOCOS 0.170 0.264
CAGAYAN VALLEY 0.074 0.058
CENTRAL LUZON 0.522 0.881
CALABARZON 1.004 0.824
MIMAROPA 0.033 0.043
BICOL 0.177 0.117
WESTERN VISAYAS 0.344 0.244
CENTRAL VISAYAS 0.316 0.556
EASTERN VISAYAS 0.094 0.249
ZAMBOANGA PENINSULA 0.158 0.098
NORTHERN MINDANAO 0.214 0.285
DAVAO REGION 0.322 0.376
SOCCSKSARGEN 0.090 0.133
CARAGA 0.058 0.032
ARMM (0.003) 0.002 20
REGIONAL CONTRIBUTIONS

Republic of the Philippines
SOCCSKSARGEN
21 Source: Philippine Statistics Authority
ARMM
IVA VIIICAR III
I II IVBNCR
V VI VII IX
X XI XII XIII
STRUCTURE OF REGIONAL ECONOMIES

Republic of the Philippines
SOCCSKSARGEN
22
DATA SOURCES
Agriculture, Hunting, Forestry and Fishing
• Sugar Regulatory Administration• Forest Management Bureau• Department of Environment and Natural Resources• National Irrigation Administration• Fertilizer and Pesticide Authority• Philippine Fisheries Development Authority
Industry
• Mines and Geosciences Bureau• Department of Public Works and Highways• Local Water Utilities Administration• National Power Corporation• National Electrification Administration• National Grid Corporation of the Philippines• Local power utilities/cooperatives• Local water utilities• Commission on Audit• Local Government Units

Republic of the Philippines
SOCCSKSARGEN
23
DATA SOURCES
Services
• Land Transportation Office• Philippine Ports Authority - Port Management Office – GSC• Civil Aviation Authority of the Philippines• Bangko Sentral ng Pilipinas• Commission on Audit• Commission on Higher Education• Department of Budget and Management• Department of Education • Department of Tourism• Department of Trade and Industry• National Telecommunications Commission• Land Registration Administration• Local Government Units
Annual Reports
• NEDA

Republic of the Philippines
SOCCSKSARGEN
For inquiries, you may visit, call or email us at:
PHILIPPINE STATISTICS AUTHORITY- SOCCSKSARGEN2nd Floor, Elena V. Co Building Don Rufino Alonzo Street, Cotabato City
Tel/Fax Number: (064) 421-2827/421-1817Email Address: [email protected]: www.psa.gov.ph; www.psa12.ph

Republic of the Philippines
SOCCSKSARGEN
REPORT ON THE2016 REGIONAL ECONOMIC
PERFORMANCE OF THESOCCSKSARGEN REGION
East Asia Royale Hotel, General Santos City04 May 2017, 10:00 AM
ATTY. MAQTAHAR L. MANULON, CESERegional Director
PSA-SOCCSKSARGEN

Republic of the Philippines
SOCCSKSARGEN
26

Republic of the Philippines
SOCCSKSARGEN
7th Session of theASEAN Community Statistical System (ACSS) Committee
Manila, Philippines 11-13 October 2017

Republic of the Philippines
SOCCSKSARGEN

Republic of the Philippines
SOCCSKSARGEN
Summit
Regional
Statistics
Committee
2nd
Manila, Philippines 21 September 2017
Republic of the Philippines
SOCCSKSARGEN
1st Quarter 2017 Report on the Philippine Economy
18 May 2017

Republic of the Philippines
SOCCSKSARGEN
Thank You!
http://www.psa.gov.ph
/PhilippineStatisticsAuthority
@PSAgovph
Republic of the Philippines
SOCCSKSARGEN
REPORT ON THE2016 REGIONAL ECONOMIC
PERFORMANCE OF THESOCCSKSARGEN REGION
East Asia Royale Hotel, General Santos City04 May 2017, 10:00 AM
ATTY. MAQTAHAR L. MANULON, CESERegional Director
PSA-SOCCSKSARGEN