Report of the Forest Cover Implementation Team. GOFC ......Report of the Forest Cover Implementation...
39
Report of the Forest Cover Implementation Team. GOFC Science and Technical Board Meeting Frascati, Italy 12 - 13 June 2001 Skole, D. and Gunawan, I. GOFC-GOLD Report No. 13
Transcript of Report of the Forest Cover Implementation Team. GOFC ......Report of the Forest Cover Implementation...
Report of the Forest Cover Implementation Team. GOFCScience and Technical Board Meeting
Frascati, Italy
12 - 13 June 2001
Skole, D. and Gunawan, I.
GOFC-GOLD Report No. 13

ii
Global Observation of Forest and Land Cover Dynamics (GOFC-GOLD) is a coordinated international effort to ensure a continuousprogram of space-based and in situ forest and other land cover observations to better understand global change, to supportinternational assessments and environmental treaties and to contribute to natural resources management.
GOFC-GOLD encourages countries to increase their ability to measure and track forest and land cover dynamics by promoting andsupporting participation on implementation teams and in regional networks. Through these forums, data users and providers shareinformation to improve understanding of user requirements and product quality.
GOFC-GOLD is a Panel of the Global Terrestrial Observing System(GTOS), sponsored by FAO, UNESCO, WMO, ICSU andUNEP. The GOFC-GOLD Secretariat is hosted by Canada and supported by the Canadian Space Agency and Natural ResourcesCanada. Other contributing agencies include NASA, ESA, START and JRC. Further information can be obtained athttp://www.fao.org/gtos/gofc-gold
iii
Table Of ContentTABLE OF CONTENT ................................................................................. IIILIST OF TABLES .........................................................................................V
1.0 M EMBERSHIP OF THE IMPLEMENTATION TEAM................... 1
2.0 N EAR TERM FOCUS FOR THE WORK OF THE FC-IT................ 12.1 INITIAL PRIORITIES, FOREST COVER IT ................................................. 1
2.1.1. Forest cover and carbon ............................................................. 12.1.2. Ecosystem Assessment................................................................. 22.1.3. Forest resource assessment and management. ............................ 2
2.2 EARLY INITIATIVES .............................................................................. 22.2.1 Improve access to remote sensing data ........................................ 22.2.2 Improved pre-processing of remotely sensed data........................ 22.2.3 Evaluation and validation of global land cover products.............. 32.2.4 Improved global land cover products........................................... 32.2.5 Land cover change monitoring..................................................... 32.2.6 Coupled remote sensing in situ systems........................................ 32.2.7 Regional carbon data bundles...................................................... 3
3.0 EXAMPLES OF CONTRIBUTORY PROJECTS............................. 3
4.0 ACTIVITIES ......................................................................................... 44.1 REQUIREMENTS AND PRODUCT DEFINITION. .......................................... 44.2 PLANNING WORKSHOPS AND DEVELOPMENT OF REGIONAL NETWORKS. . 44.3 OTHER ACTIVITIES, INCLUDING FUNDING .............................................. 4
5.0 N EEDS FROM THE STB..................................................................... 5
6.0 STB M EETING.................................................................................... 5
APPENDIX 1 .............................................................................................. 6
SUMMARY OF PRODUCTS.................................................................... 6
1.0 INTRODUCTION ................................................................................ 6
2.0 GENERAL CONSIDERATIONS........................................................ 6
3.0 PRODUCT LEVELS AND SUITES ................................................... 7
4.0 SPATIAL COVERAGE....................................................................... 8
5.0 PROCESSING ...................................................................................... 85.1 GEOREFERENCING................................................................................ 8
iv
5.2 ATMOSPHERIC CORRECTIONS .............................................................. 95.3 BIDIRECTIONAL NORMALIZATION. ....................................................... 95.4 CLOUD SCREENING. ........................................................................... 105.5 MOSAICKING. .................................................................................... 10
6.0 FOREST COVER PRODUCTS ........................................................ 116.1 GLOBAL LAND COVER ....................................................................... 116.2 GLOBAL FOREST DENSITY AND PERCENT TREE COVER ....................... 116.3 GLOBAL FOREST COVER CHANGE IDENTIFICATION ............................. 136.4 REGIONAL LAND COVER .................................................................... 146.7 REGIONAL FRACTIONAL FOREST COVER AND CHANGE ....................... 156.8 REGIONAL FOREST CHANGE ............................................................... 166.9 REGIONAL FOREST FRAGMENTATION ................................................. 18
7.0 PRODUCT VALIDATION, EVALUATION, AND OUTREACHTHROUGH REGIONAL NETWORKS.................................................. 18
7.1 PRODUCT DEFINITION AND ALGORITHM DEVELOPMENT. .................... 187.2 CALIBRATION AND VALIDATION AT FIELD SITES. ............................... 187.3 PRODUCT EVALUATION. ..................................................................... 187.4 OPERATIONAL OUTREACH.................................................................. 19
APPENDIX 2. ........................................................................................... 20
APN FUNDED GOFC PROJECT FOR SE ASIA .................................. 20
1.0 TITLE: SPATIAL DATA AND INFORMATION FOR LAND USEAND FOREST ASSESSMENT AND MANAGEMENT........................ 20
1.1 DETAILED PROPOSAL ........................................................................ 201.1.1 Activity 1: Implementation of the Tropical Rain ForestInformation Center to support GOFC data requirements and users inthe region............................................................................................ 201.1.2 Activity 2: Development of New Datasets and Data Products. . 211.1.3 Activity 3: Product Validation, Evaluation, and Outreach..... 21
1.2 APN FUNDED PORTION ..................................................................... 211.3 RELATIONSHIP TO PRIORITY TOPICS IN THE APN RESEARCHFRAMEWORK ........................................................................................... 21
2.0 REGIONAL COLLABORATION AND COORDINATION ........ 22
3.0 CAPACITY BUILDING ................................................................... 22
4.0 LINKS TO POLICY.......................................................................... 22
5.0 RELATIONSHIP TO GLOBAL CHANGE RESEARCHPROGRAMME ........................................................................................ 23

v
6.0 RELATED RESEARCH WORK ..................................................... 23
APPENDIX 3 ............................................................................................ 25MAJOR COLLABORATORS......................................................................... 25WORK PLAN AND TIME LINE .................................................................... 30UKM NODE AND BIORTOP NODE ......................................................... 31PRODUCT DEVELOPMENT......................................................................... 31TIMELINE FOR PRODUCT DEVELOPMENT .................................................. 33FIELD WORK ACTIVITIES AND USER OUTREACH....................................... 34FINAL WORKSHOP ................................................................................... 34
List of Tables
Table 1. Specification for the Regional Forest Cover Product..................... 14
Table 2. General Description of the Forest Cover Change (FCC) Product 16
Table 3. General Description of the Sample Forest Cover Change (FCC-s)Product ................................................................................................ 17
1
1.0 M EMBERSHIP OF THE IMPLEMENTATION TEAMThe Forest Cover Characteristics and Changes Implementation Team (FC-IT) nowincludes the following members.Iwan Gunawan, ChairDit. TISDA-TPSAIndonesia
David Skole, ChairMichigan State UniversityDepartment of Geography
Tom LovelandU.S. Geological SurveyUSA
Eric F. LambinUniversite Catholique de LouvainDepartment of GeographyBelgium
Philippe MayauxEuropean CommissionItaly
Olga TarakanovaResearch & Development CenterScanExRussia
Christiane SchmulliusFriedrich-Schiller-UniversityInstitute of Geography, Department forGeoinformaticsGermany
Ake RosenqvistNational Space Development Agency ofJapanEarth Observation Research CenterJapan
Hervé JeanjeanCNESEarth Science and ApplicationsFrance
Curtis WoodcockBoston UniversityDepartment of GeographyUSA
Gilbert SaintCNESFrance
New members are being sought from Canada and the JRC in Europe. These additionalnames are being sought to bring into the team members from the Canadian remote sensingand/or forestry communities and someone from the Global Land Cover 2000 project. Inaddition we have an agreement to include Mr. Paul Reichert from the FAO to buildcoordination with the AsiaCover and AfriCover projects. Lastly we are hoping to invite Dr.Thelma Krug from the Brazilian space agency, INPE. Additional members will be added asnecessary.
2.0 N EAR TERM FOCUS FOR THE WORK OF THE FC-IT
2.1 Initial Priorities, Forest Cover IT
2.1.1. Forest cover and carbon
– Contribute to the development of a global carbon observatory for carbon source-sinkissues, both in a scientific and policy context.

2
a) characterization of the missing sink in temperate zone forests, as a function ofchanges within forests through changes in density, changes in the extent of forestareas, replacement of other systems by forests, or loss of forests,
b) source terms in the tropics, the uncertainty leading directly to uncertainty in theestimated sink,
c) issues of measurement methods for large area assessments of changes in landcovers into and out of forest classes, changes in stand density, and methods forlinking in-situ measurements from stand inventory data to remote sensing data.
- In terms of policy there is a clear need to investigate methods for measuring forestchanges in such contexts as Kyoto protocol. The focus would be on prototypingacquisition, some initial products, validation assessment and methodstesting/development.
2.1.2. Ecosystem Assessment
– To provide a demonstration of the role for global observational data for otherinternational needs beyond carbon,
- GOFC should support product needs for the Millennium Ecosystem Assessment with afocus on information relevant to biodiversity and ecosystem structure and distribution.
2.1.3. Forest resource assessment and management.
- Using the regional networks the IT will target key projects for demonstration of supportto forest managers and the national scale.
- Emphasis is not on capacity building but to seek input from the forestry agencies andprototype some key outputs and products, which make use of new remote sensinginformation coupled to in-situ measurements.
- This will also assist in the development of regional "harmonized" forest inventories (asmaps) merged from individual country efforts.
2.2 Early Initiatives
2.2.1 Improve access to remote sensing data
- Develop a global data set of coarse and fine resolution data (such as global Landsat datafor 2000) and make them available through a GOFC mechanism to users, such as FAO,who need access to imagery. This will be done through CEOS agency contributions, databuys, other mechanisms. The goal will be much improved data and information systemfor widespread dissemination of data sets.
2.2.2 Improved pre-processing of remotely sensed data.
3
- Develop a prototyping effort for improved products through "best-practices" orcommunity consensus atmospheric correction, and georegistration. Assess the potentialfor improved system correction and evaluation of existing methods.
2.2.3 Evaluation and validation of global land cover products.
- Validating global and regional land cover products is a very high priority. The principalvehicle for doing this will be regional GOFC networks for validation.
2.2.4 Improved global land cover products
- Provide a demonstration of improved global land cover products using new remotesensing technologies taking advantage of existing research and development activities.sensors, e.g., from MODIS and results from VEGA-2000/GLC2000. Also demonstrationof regional high resolution forest/land cover maps including fine resolution fractional coverfor degradation assessment (from systems such as Landsat and Spot)
2.2.5 Land cover change monitoring
- Demonstration of a multi-level Land Cover Change monitoring systems - globalmoderate resolution change detection with responsive high-resolution acquisition andassociated distribution system. Coordinating a state-of-the-art-review of methods forglobal assessment of deforestation will also be a goal.
2.2.6 Coupled remote sensing in situ systems
– Demonstration of coupled remote sensing-in situ approaches, such as the kNNtechnique and others, which are being developed within the forest management community.
2.2.7 Regional carbon data bundles
- Integrated sets of data (or bundle) relevant to regional carbon assessment includingforest type, fractional cover, area of change and biomass inventory will be created and madeavailable
3.0 EXAMPLES OF CONTRIBUTORY PROJECTSThere are several important contributory projects on-going or soon to be initiated whichcould be part of the activities of the team. These include, as examples: Global Land Cover2000 project of the JRC, the VEGA 2000 project of CNES, NASA’s several activities ofthe MODIS Land Team and the Landsat 7 mission (including the Landsat DataContinuity Mission), several university projects including the University of Maryland’sPercent Tree Cover and Michigan State University’s Tropical Forest Inventory, FAOsAfriCover and its new AsiaCover, several national deforestation and forest inventory effortsin Canada, Brazil, and Southeast Asia, the efforts of the Southeast Asia RegionalInformation Network.
There are also new opportunities to cooperate with the Millennium EcosystemAssessment program and the carbon cycle initiatives in the US, Europe and internationally
4
through the IGBP. These latter efforts need to be tied closely with the TCO initiativeswithin GTOS.
4.0 ACTIVITIESThe FC-IT has been active in establishing requirements and setting regionalinfrastructure.
4.1 Requirements and product definition.
The FC-IT has developed a draft specifications document for product generation, whichis attached as Appendix 1 of this report.
4.2 Planning workshops and development of regional networks.These include:
• Atelier de création du réseau GOFC - OSFAC en Afrique CentraleLibreville,Gabon, February 22-24, 2000
• Southeast Asia Regional GOFC Planning Meeting at Bogor, Indonesia, January31 February 2, 2000
Reports of these workshops are on the GOFC web site. A new workshop is being plannedfor the Russia and Fennoscandia region:
• GOFC Regional Workshop on Remote Sensing of Forest Cover inNorthwesternRussia and Fennoscandia, June 25-27, 2001 - hosted by INENCOCenter of RAS
The goal of this regional GOFC workshop is to promote a coordinated effort amongscientists in the region towards building an observational boreal forest network whichwould result in operational monitoring of forest cover and forest cover change, and to makedata and information on forests usable and accessible. The workshop will examine currentuses of remote sensing in studies of forest cover and carbon exchange in the region,evaluate existing data sets useful for validation and interpretation of remote sensing dataproducts, identify future needs of different user groups, and plan future interdisciplinaryresearch and exchange activities. The workshop will also discuss forest inventory,monitoring, management, and conservation. They will explore current gaps of knowledgein land use and the carbon budget for the region, including understanding of changingdisturbance regimes and driving forces of land use change. Location: St. Petersburg,Russia Contact: Olga Krankina, Oregon State University
4.3 Other activities, including funding
The team has installed a GOFC Fellowship at Michigan State University. Mr. ChetpongButthep from the Thai space agency is in place for one year to help coordinate the effortsof the IT with the SE Asia regional network.

5
A proposal to the Asia Pacific Network was submitted this year as was funded for US$80K for the first year. This project will help coordinate the product development for the SEAsia network, including field calibration and validation. A summary of this project isattached as Appendix 2 and 3.
The IT has been working with the CEOS WGISS to develop information systems andservices for access to data and information. Please see initial project results on the GOFCweb site under Data pages.
5.0 N EEDS FROM THE STBThe IT will need considerable support from the STB including access to large datasets, andassistance in securing funding for the operation of the IT activities. This includes support ofthe IT itself and its activities and the regional networks. In the next year we envisionsupport needed primarily for workshops and meetings of the IT. In addition we will needto support:
• Development of global products using VEGA 2000 and MODIS results, includingthe validation efforts
• Transitioning research on forest fractional cover to operational use, possiblyseveral pilot studies
• Development of forest change techniques including workshops for inter-comparison of methods and harmonization between various national efforts
• Development of an initial start of a Forest Cover Information System
• Participation in the activities of three potential cooperating programs: the FAOprograms on AsiaCover and AfriCover, The Millennium Ecosystem Assessment,and the international and national carbon cycle initiatives
6.0 STB M EETINGMore detailed information will be forthcoming at the STB meeting itself

6
APPENDIX 1
SUMMARY OF PRODUCTSForest Cover Characteristics and Changes Implementation Team
1 June 2001
Background document for the GOFC Science and Technical Board1.0
1.0 INTRODUCTIONThis document provides DRAFT definitions and specifications for a products suite to bedeveloped by the GOFC Forest Cover Changes and Characteristics ImplementationTeam (FC-IT). The product suite is aimed at both global and regional/national scales,and is focused on information needs for the Initial Priorities and Early Initiatives of theFC-IT to support three thematic foci and users:
1) global change research community with an emphasis on the global carbon cycle,
2) international policy and assessments, with a proposed emphasis on theMillennium Ecosystem Assessment, and
3) national and regional forest management users.
This document is a general overview. It is meant to layout the important technicalimplementation issues, regardless of who or what organization implements theproducts. Moreover, it is not a final specification document. This product suite ispreliminary and will be refined over the course of the next 6-12 months by the FC-IT. Itis based on the GOFC design strategy and precursor efforts of the Coarse and FineResolution Design Teams. Full reports from these design teams can be found on the GOFCweb site.
2.0 GENERAL CONSIDERATIONSRecommended for the development of the FC-IT product suite are based on somefundamental considerations, such as:
• Products developed should be achievable, whenever possible, with currenttechnology (i.e., using data from sensors either currently operational, orscheduled to be operating in the coming year). The approach, however, shouldalso include definitions of optimal characteristics that may be achievable withadvancements in future remote sensing systems.
• On-going product development must be practical and lead to a reasonableoperational concept, implemented using existing and near-term observationalsystems, with a straightforward and management level of effort.
7
• Products should be developed using existing and near term programs, and shouldinclude proven or near-ready applications rather than new experimentalapproaches which require considerable research and development.
• However, research will be a necessary component in most product developmentstrategies and will be important for the long-term development of new products;as such it should be an integral element of the work of the FC-IT.
• Product definitions and specifications should be periodically reviewed andimproved so that advances in methods and source data characteristics canbe incorporated to improve overall data quality.
• Validation of data products is necessary to evaluate product quality, and also toidentify new research priorities.
3.0 PRODUCT LEVELS AND SUITESA review of the individual requirements of global change, forest inventory, andpolicy communities reveals a striking convergence, or similarity in scope anddefinition. The most complex and stringent requirements are set by the forest inventoryusers since they have needs for detailed forest cover characteristics linked to specificin-situ data with high spatial accuracy and precision. The carbon cycle community andpolicy users (particularly the emissions inventory requirements) have of subset of theseneeds. Thus, it is possible to define a single common data bundle, which satisfies a verybroad range of users and at the same time focuses on the requirements for the globalcarbon community, forest inventory community, and the policy community.
This FC-IT will focus on development of a suite of datasets and data products with thefollowing general hierarchy levels:
Level 1: raw fine and coarse resolution data such as ETM+, Spot, MODIS or anyother which are not atmospherically corrected and georeferenced by systemcorrection only.
Level 2: Enhanced image datasets, which will include fine and coarseresolution image data from TM, ETM+, ALI, MODIS and VEGATATIONwhich have been atmospherically corrected, georeferenced to earth coordinates,projected, normalized for view / sun angle effect, and mosaicked when multiplescenes needed will also be provided.
Level 3: Derived data products, which will include the results of analyses ofimage products. These products will be used to improve existing global landcover maps of forest density, assessments of deforestation, and otherinformation on forest cover characteristics and changes.
We believe that some users will primarily need access to the Level 1 and Level 2 datasets,such as the UN FAO Forest Resource Assessment program which routinely acquiresthe image data and performs its own in-house data analysis. Others, such as the forestinventory community need access to Level 3 derived data such as extant forest

8
density and fractional cover for making forest inventory or deforestation and forestdegradation assessments
4.0 SPATIAL COVERAGEIn order to design a monitoring system capable of monitoring both high and lowfrequency changes in forest, we propose to establish across spatial and temporalresolution system, using data from multiple satellite and in-situ data sources. It consistsof a data system at three temporal and spatial scales.
Global: This coverage will focus on datasets and products with globalcoverage, and will rely heavily on the coarse resolution datasets. Regionalsubsets or regional components can be used to assemble a global product, butpriority will be given to single global datasets. These will be developed mostly forForest Cover products.
National and Regional : This scale is developed and employed for NationalForest Inventory assessments and monitoring and other regional and nationaluses. These products will be developed mostly from fine resolution source data,while some regional products with regionally-specific classifications may alsoappear. These datasets will be most useful for change analysis.
Focus Areas and Sites: These focus areas serve two purposes: (1) calibrationand validation of derived products, and (2) evaluation and testing of products forforest management applications.
5.0 PROCESSINGImagery acquired must be processed so the data can be analyzed quantitatively. Thisincludes five processing steps that are detailed in the following sections.
5.1 Georeferencing.
Images will be georeferenced to a common coordinate system. To geo-reference the 30mresolution imagery and its derived products, one method might be to use ortho-rectifiedhistorical TM imagery acquired through the NASA Science Data Buy program atStennis Space Center. The product produced for NASA by EarthSat will be ageoreferenced TM data ± 60m of its true coordinates. Problems of relief are greatlyreduced in this dataset. The mosaicked images can be used to serve as a template forgeoreferencing all other 30m resolution satellite images to be acquired. It must be notedthat the Landsat program is producing very good locational accuracy with systemcorrected algorithms using the post-pass ephemeris.
For 250m - 1km resolution imagery and derived products, we could use the VEGETATIONimagery from SPOT 4 satellite as a template. Unlike the AVHRR, VEGETATION sensorhas a spatial resolution of 1.1km across the entire scene. Because the sensor uses an arrayof detectors, each having its own instantaneous field of view, the spatial resolution acrossthe entire image is approximately the same. The spatial accuracy of this sensor is "500m.Alternatively, MODIS 250 data could be used. Another alternative, but with moreeffort, fine resolution data could be used from the method above.
9
5.2 Atmospheric Corrections
Atmosphere affects optical remote sensing signals two ways. It attenuates the solarradiation reaching to the earth surface and that reflected off the earth surface to thesatellite sensors. As a consequence, the signal arriving at the sensor will be weakenedand the resulting image will be darker. On the other hand, the atmosphere scatters solarradiation in all directions, including the direction where satellite sensors are viewing,thus contributing significant scattered radiation toward the sensor. The result of theatmospheric contribution, often termed as path radiance, is to increase the brightnessof the image, and to reduce the contrast of the earth surface features. Therefore, theatmospheric effect in satellite images must be accounted for. There are severalmethods that can be used to correct such effects. Sophisticated methods require precisemeasurements of atmospheric properties such as water vapor content and aerosoldensity. In tropical regions, both aerosol and water vapor content varies spatially andtemporally and, therefore, deployment of instruments for atmospheric measurementsappears impractical. Another way to characterize the atmospheric properties is to modelthe atmosphere as a layered medium, which exerts effects on incoming and reflected solarradiation (Kaufman 1989). The physical properties of the atmosphere can be modeled asa function of latitude, longitude, and day of year. The modeling approach often takessubstantial computation time, and thus correction of atmospheric effects on large-scalesatellite images often prevent operational uses of satellite imagery. A simplified methodexists (Rahman and Dedieu, 1994) and is being used to in some labs to operationallycorrect the VEGETATION data. Therefore, we proposed to use the simplified methodbased on Rahman and Dedieu (1994) to correct satellite images.
Three practical methods have potential to use in this investigation for atmosphericcorrection. The first is to take advantages of already-corrected VEGETATION data.By comparing the statistical means of a large area common on both theatmospherically corrected VEGETATION image and the image to be corrected foreach corresponding spectral band, an adjustment can thus be determined and used foratmospheric correction. This procedure is simple, but relies on the accuracy of theatmospheric correction for the VEGETATION image. Since only histograms need to becomputed, this procedure will be computationally economic.
The second method, which has potential is to use simplified atmosphere models directlysuch as the SMAC (Rahman and Dedieu, 1994). Compute code for SMAC can beobtained and modified to various spectral bands of other sensors. Once coded, themethod will be applied routinely to correct for atmospheric effects.
A third method involves the use of pseudo invariant objects found within a scene. Thistechnique (Chavez, 1988, Qi et al., 1999) appeared to be attractive because of its use ofobjects of known reflectance properties. This method first identifies at a minimum twoobjects that are assumed to be invariant (throughout time). Their reflectanceproperties are known, or can be measured. The reflectance properties of the objects andtheir associated raw digital numbers can be plotted and the slope and intercept can thusbe obtained, which can be subsequently used to correct for atmospheric effect.
These methods can be tested within the FC-IT
5.3 Bidirectional Normalization.

10
Because of the large area coverage from coarse resolution sensors such as VEGETATIONand MODIS, each pixel in an image will have different geometric properties in relation tothe sun and the sensor. Pixels away from the center of the image will have asubstantially large viewing angle, resulting in different levels of brightness due tobidirectional effects. Many numerous studies have shown that bidirectional effects canbe substantial and the effect on subsequent derived products, such as vegetationindices, can be greater than 20%, larger than atmospheric effects found in most cases.Even satellite imagery, which is acquired with a near-nadir angle, brightness can stillvary significantly due to seasonal changes in sun elevation. Therefore, it is critical tocorrect such brightness difference due to solar zenith angle variations, in addition tocorrect for effects due to varying view angles.
Many BRDF models have been proposed (Strahler, 1994, Cabot et al., 1994, andStrahler1997) to simulate the bidirectional reflectance distribution functions. Most ofthem were developed for specific vegetation canopy types. Sensitivity analysis suggeststhat simple empirical models perform as well as many of the sophisticated models. Inorder to use these models to correct remotely sensed imagery acquired at varyingviewing angles, simple models such as those proposed by Roujean et al. (1992), and theWalthall (1985), could be used to normalize the effect due to difference in sun elevationand the sensor’s viewing angles. For all images acquired at different dates or differenttime, which results differences in solar zenith angles, will be normalized to a standard solarzenith angle.
5.4 Cloud Screening.
Persistent cloud appearance in some regions often masks remotely sensed imagery. Thiswill be important for our daily dataset from optical sensors. The techniques that couldbe used include maximum compositing (Holben et al., 1986) and those described byothers (Goward 1990, Gutman 1991, Cihlar et al., 1994, and Qi and Kerr, 1997). Theformer technique uses the normalized difference vegetation index (NDVI) as thresholdto screen clouds. Pixels having the maximum NDVI values from multitemporal imagesare selected to form a new composited image.
The techniques by Qi and Kerr (1997) use combination of NDVI, viewing angles, andtemperature. These techniques retain all pixels above predefined thresholds. Inaddition, these techniques also retain as all pixels as long as they passed through theselection process, which retain more value data. In focus areas where in-situ data areavailable, the latter techniques will be used while for global scales the former (Holben,1986 and Cihlar et al., 1994) technique will be used to composite all images.
5.5 Mosaicking.
Once images have gone through all processes mentioned above, they could bemosaicked to cover the product areas. Although the previous processing procedures willimprove the data quality, it is expected that there still be discontinuities across joiningboundaries of two images. If this occurs, it may be necessary to use an overlap areamatching method to reduce the discontinuity. The outputs from this procedure would begeoreferenced, atmospherically corrected, and mosaicked data of the specified spatial andtemporal resolutions specified above.

11
6.0 FOREST COVER PRODUCTS
6.1 Global Land Cover
The land cover product should be produced every five years, with completion of theproduct 12-24 months following the end of the baseline period. While global land coverwith 250m to 500m resolution will have the highest applications value, in the near terma1000m resolution data set is most practical and feasible. However, it is important torecognize the long-term requirement for higher resolution global land cover products.
The level of thematic detail should be greatest for woody vegetation (i.e., trees, shrubs)and only general land cover types are necessary for the other landscapes. This means thatthere will be uneven categorical detail, with 40-50 classes representing woody vegetation,and approximately 5-10 additional categories representing all other cover types. A draftland cover legend is presented for discussion in the Design Strategy document on theGOFC web site.
While several training procedures and classifiers have recently been used todevelop global land cover data sets (i.e., Defries, et al., 1995; Loveland, et al., submitted),there is currently no clear evidence to suggest that one approach is superior toanother. The selection of a method must therefore be based on applications issues,including degree of required flexibility and tailoring of the GOFC global land coverproduct, frequency of updates, and implementation considerations. This should be amajor activity of the FC- IT.
For this product in the early stages of development, a centralized production model, inwhich one organization develops the product, has advantages and offers greaterchances of global consistency at a lower cost and completed in a shorter period oftime. A decentralized approach is more relevant for policy applications and ecosystemassessments in which it is essential that local to regional landscape conditions are mostreliably represented. The decentralized production approach is amenable to those regionswhere a GOFC Regional Network has been established and has capabilities. In addition,specialized regional products could be developed at the coarse resolution with alegend specifically tailored to regional requirements. With a decentralized model orfor regionally specific products, it is necessary to standardize inputs, and definitions ofresults.
Product validation is important, and could be conducted through a global scheme coupledto high resolution acquisition scheme implemented globally, or through regionalactivities involving the Regional Networks
Data sets targeted for the global land cover products include MODIS, VEGETATION,and similar sensors, which would be acquired through a specific acquisition model tobe developed by the FC-IT.
6.2 Global Forest Density and Percent Tree Cover
An integral part of the global land cover product is a forest canopy density productthat provides estimates of percent tree canopy for each pixel. The density would bedescribed in terms of percent forest cover within the pixel, varying from 0 in locations

12
with no woody cover to 100 for locations with full canopy cover. The resolution of thisproduct should be the same as that used in the global land cover product. This data setshould be produced every five years, but will be needed within 3 months following theend of the baseline period so that it can be used in the global land cover classificationprocess.
The land cover classification will provide information about forest type stratifiedaccording to threshold values for canopy closure. Additional information on forest densitywill allow comparison with other classification systems using alternate definitions andthresholds for canopy cover. A forest density layer will also allow the identification oflocations undergoing changes in forest density that would not be detectable if onlyconsidering the land cover type. This information is required to monitor changes incanopy density and to assess the condition of forests. From the point of view of thescientific user, this information permits the modeling of carbon and other biosphericproperties that would not be possible with the land cover layer alone.
Processing of the forest density layer, though requiring alternate algorithms, wouldbe done in parallel to the generation of the land cover map with a 5 years frequency.Processing for the forest density layer would be done for those pixels classified as woodyvegetation in the land cover map.
Several algorithms have been developed and applied to generate forest density mapson regional and global scales. These methods generally fall into three categories:
• Endmember linear unmixing. In this approach the proportion of vegetation typesare deconvolved based on the assumption that the spectral signature is a linearcombination of reflectances from the components within the pixel.Implementation of this method requires knowledge of reflectances of “purepixels” from spectral libraries, field measurements, or high resolution data. Thisapproach has been applied at regional and global scales (i.e., Adams et al., 1995;Bierwirth, 1990; DeFries et al., submitted; Pech et al., 1986; Quarmby et al.,1992; Settle and Drake, 1993). Recently methods have been applied to incorporatenonlinear mixtures (Foody et al., 1997) and multiple endmembers (Roberts et al.,in press).
• Spectral regressions. This approach is based on empirical relationships derivedfrom coregistration between fine resolution (e.g., Landsat TM) and coarseresolution (e.g. AVHRR) data. The empirical relationships are then extrapolatedover larger regions to estimate percent forest density (DeFries et al., 1997; Iversonet al., 1989; Iverson et al., 1994; Zhu and Evans, 1992; Zhu and Evans, 1994).
• Calibration of areal estimates from spatial aggregation of classifications derivedfrom coarse resolution data. These methods can be used to derive areal estimatesof forest cover based on classification of coarse resolution data. The methodadjusts the areal estimates taking into account the spatial arrangement of landcovers at fine resolution (Mayaux and Lambin, 1995; Moody, 1998).
These methods have all been successfully applied. A comparison of these methods forselected area needs to be carried out by the FC-IT to determine which is the most feasiblein an operational context.
13
The forest density product should be produced in parallel to the land cover map product.Coregistration with the fine resolution product will be needed to assure consistency inresults. The post-launch MODIS product generating continuous fields of vegetationcharacteristics provides an additional link that might useful in the implementationof GOFC.
The forest density product requires validation to provide information on the reliabilityof the continuum of density values. The validation of the density product may be doneusing methods similar to those used for the biophysical products. The forest densityvalidation could use high resolution data and ground studies to assure accuracy. Thisshould be carried out for a small number of selected locations.
6.3 Global Forest Cover Change Identification
Although precise estimates of changes in forest cover and density sufficient forsuch analyses as deforestation assessment and fragmentation analysis needs to bedeveloped using a suite of fine resolution methods and data, a global product wouldprovide a high level identification of areas of significant changes. A global forest coverchange product would identify on an annual basis locations where changes in forestcondition are occurring. This product would be linked with the fine resolution product sothat more in- depth analysis at higher resolution could be carried out for theselocations. The forest cover change product would serve as a flag for detecting change inforest cover.
A separate forest cover change product is needed, as opposed to comparison ofclassification products, because: 1) change detection methods that do not rely onsuccessive comparison of land cover classifications are known to be more accurate;and2) changes in forest cover need to be detected on a more frequent basis than the fiveyears recommended for the global land cover classification product.
The forest cover change product to be generated at a spatial resolution of 250m, theresolution necessary to detect clearings and modifications of forests by human activities(Townshend and Justice, 1988). The product would be produced annually and would becompared to a baseline extent of forest cover as well as to the previous 5 years. The FC-ITwould define a standardized method for deriving this product, including source data andmethodology, to be established by a coordinating group and that the product be generatedon a continental or regional basis by various organizations.
Many methods have been used for change detection based on satellite data. Analysis ofradiometric differences between dates generally provides more accurate results thananalysis of difference between classification results because the latter compoundsinaccuracies in the classification products. Radiometric analysis includes banddifferencing, band ratioing, transformed band differencing, principal component analysis,and multispectral or multitemporal change vector analysis (Singh (1989) provides areview of these methods). A key requirement for a methodology to be operational inGOFC is that the process be automated as much as possible with realisticcomputing resources.
14
In the initial phases of GOFC, we recommend that the change detection product focus onchanges in forest extent. In the future, this would be expanded to cover other types ofland cover conversion such as agricultural expansion.
The forest cover change product would be strongly linked to the fine resolution products.Identification of areas undergoing change would be flagged for more in-depth analysiswith finer resolution data. It will also require linkages with the land cover map and firescar product to assure consistency. The MODIS 250m and 1km land cover changeproducts might serve as a useful linkage for GOFC.
A strong verification process will need to be an integral component of the method. Thiswill involve high resolution data and a sampling strategy on the ground.
6.4 Regional Land Cover
Regional datasets from coarse resolution data similar to that used for the global datasetscan be produced. It is also possible, and desirable at the regional scale to produce landcover maps from fine resolution datasets. In future years, a global land cover dataset canbe envisioned from fine resolution datasets but in the initial years of the FC-IT effort,these will be used for regional products.
The first regional high resolution product is a Forest Cover Characterization product,produced on a wall-to-wall basis at 30 meters every five years. This product willsupport the requirements for forest composition and inventory with detailedclassification forests based on methods, which define classes based on functionalcharacteristics.
The products from high resolution observations take advantage of recent advances indeveloping functional classification of forest cover which are demonstrating thepotential for classifications schemes with detailed classes. The Forest Cover Productclassification scheme will be compatible with the coarse resolution classificationscheme. This should permit a close linkage for calibration and validation, as well asinter-product and inter- scale compatibility. Detailed land cover products for national usecan also be developed. These may have specific classifications relevant to national needs,but when ever feasible versions of the product, which can provide regional harmonizedproducts would be desirable.
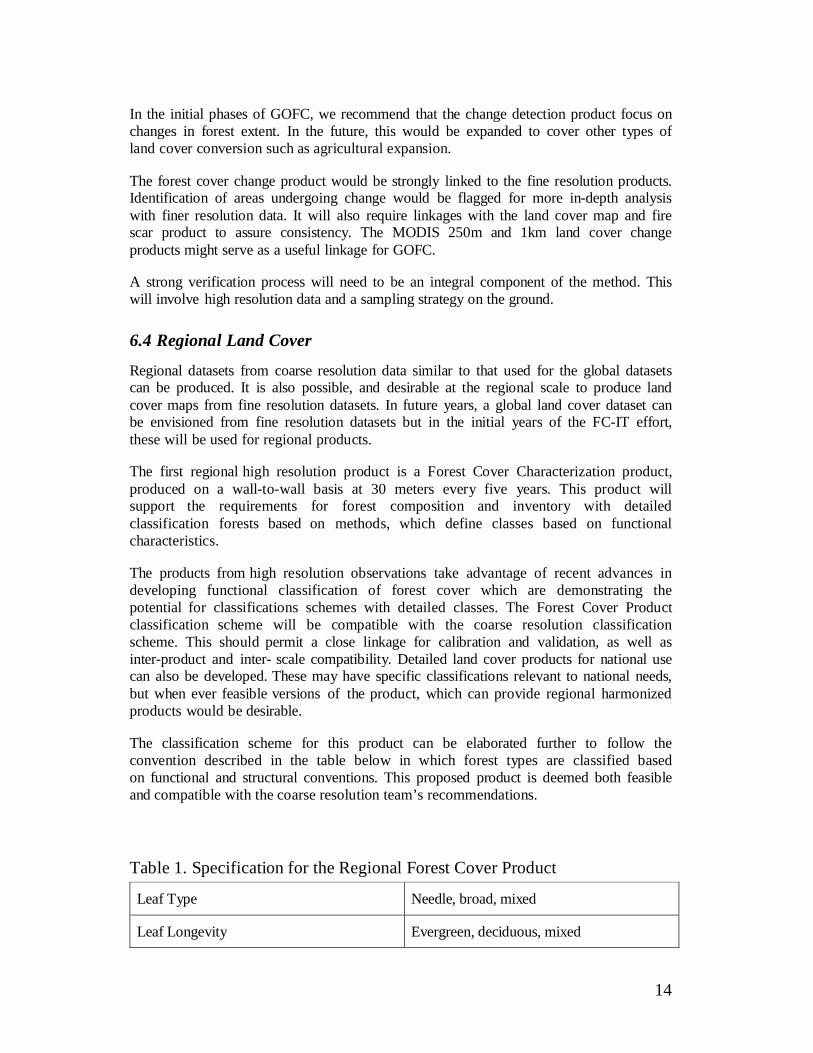
The classification scheme for this product can be elaborated further to follow theconvention described in the table below in which forest types are classified basedon functional and structural conventions. This proposed product is deemed both feasibleand compatible with the coarse resolution team’s recommendations.
Table 1. Specification for the Regional Forest Cover Product
Leaf Type Needle, broad, mixed
Leaf Longevity Evergreen, deciduous, mixed
15
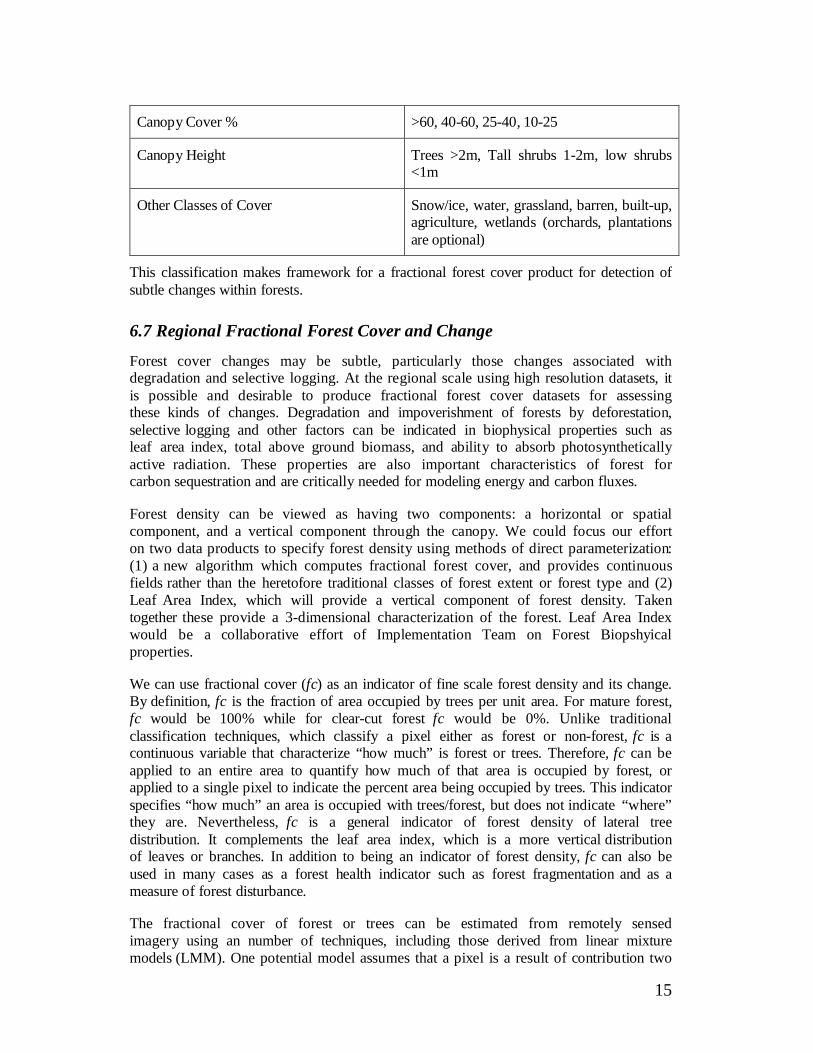
Canopy Cover % >60, 40-60, 25-40, 10-25
Canopy Height Trees >2m, Tall shrubs 1-2m, low shrubs<1m
Other Classes of Cover Snow/ice, water, grassland, barren, built-up,agriculture, wetlands (orchards, plantationsare optional)
This classification makes framework for a fractional forest cover product for detection ofsubtle changes within forests.
6.7 Regional Fractional Forest Cover and Change
Forest cover changes may be subtle, particularly those changes associated withdegradation and selective logging. At the regional scale using high resolution datasets, itis possible and desirable to produce fractional forest cover datasets for assessingthese kinds of changes. Degradation and impoverishment of forests by deforestation,selective logging and other factors can be indicated in biophysical properties such asleaf area index, total above ground biomass, and ability to absorb photosyntheticallyactive radiation. These properties are also important characteristics of forest forcarbon sequestration and are critically needed for modeling energy and carbon fluxes.
Forest density can be viewed as having two components: a horizontal or spatialcomponent, and a vertical component through the canopy. We could focus our efforton two data products to specify forest density using methods of direct parameterization:(1) a new algorithm which computes fractional forest cover, and provides continuousfields rather than the heretofore traditional classes of forest extent or forest type and (2)Leaf Area Index, which will provide a vertical component of forest density. Takentogether these provide a 3-dimensional characterization of the forest. Leaf Area Indexwould be a collaborative effort of Implementation Team on Forest Biopshyicalproperties.
We can use fractional cover (fc) as an indicator of fine scale forest density and its change.By definition, fc is the fraction of area occupied by trees per unit area. For mature forest,fc would be 100% while for clear-cut forest fc would be 0%. Unlike traditionalclassification techniques, which classify a pixel either as forest or non-forest, fc is acontinuous variable that characterize “how much” is forest or trees. Therefore, fc can beapplied to an entire area to quantify how much of that area is occupied by forest, orapplied to a single pixel to indicate the percent area being occupied by trees. This indicatorspecifies “how much” an area is occupied with trees/forest, but does not indicate “where”they are. Nevertheless, fc is a general indicator of forest density of lateral treedistribution. It complements the leaf area index, which is a more vertical distributionof leaves or branches. In addition to being an indicator of forest density, fc can also beused in many cases as a forest health indicator such as forest fragmentation and as ameasure of forest disturbance.
The fractional cover of forest or trees can be estimated from remotely sensedimagery using an number of techniques, including those derived from linear mixturemodels (LMM). One potential model assumes that a pixel is a result of contribution two
16
components: forest and soil/liter substrate. The fractional cover of the forest is fc andtherefore the substrate is 1 – fc. The resulting signal, S, as observed by a remote sensorcan be expressed as S = fc x Sv + (1 fc) x Ss , where Sv is the signal contribution from theforest vegetation component and Ss from the substrate. When applied in the reflectancedomain (Maas, 1998), equation (1) was used to successfully estimated cotton percentagecover. When used in vegetation index domain (Zeng et al., 1999, and Qi et al., 1999),fractional green vegetation cover can be mapped at different spatial scales.
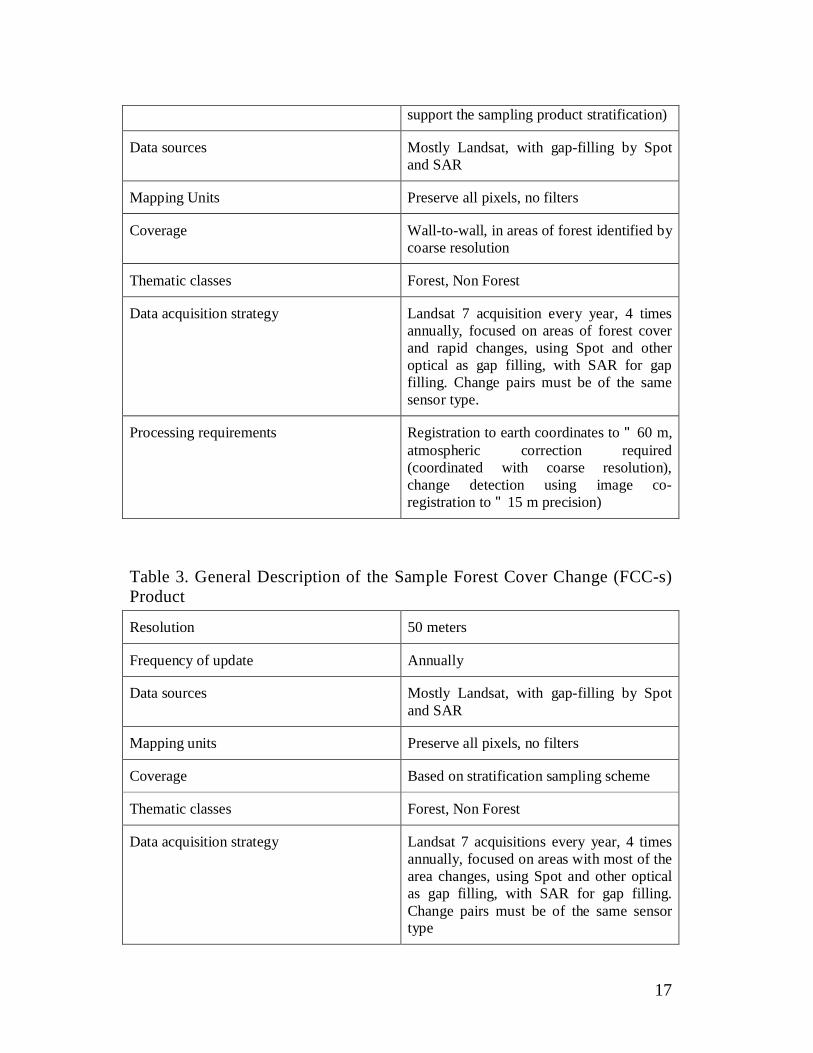
6.8 Regional Forest Change
Specific area and spatial changes in forest cover can be defined over very large regions atvery fine spatial resolution. This product will be used to provide regular maps andquantitative estimates of forest loss from deforestation. This product will be a forest-non forest extent map reproduced on a wall-to-wall basis every five years. Imagechange detection will then be used between dates to define the specific transitions andchanges: forest to non forest, and non forest to forest. In addition, forest change will bemeasured on an annual basis using stratified sampling between the semi-decadalcomplete inventories.
This product will measure and map the change in forest cover using precise image-to-image change detection methods. Unlike the Forest Cover product, which will beindependent classifications at different dates, this analysis will be focused on changedetection. To keep the analysis simple and straightforward, the product will describe“that which is forest at t=1 and is no longer forest at t=1.” The product will also reportareas of non-forest, which returned to forest. This analysis will be conducted usingchange pairs 5 years apart, providing a change period of 5 years globally. The five-year period will be compatible with the 5 years period of the Forest Cover Product.
To support RAD requirements, and most of the carbon cycle requirements, an annualassessment will be completed using stratified sampling. A forest-no-forestclassification is implicit in this change product, but will be compatible with the ForestCover Product at the five-year milestones, so changes on a semi decadal basis will beresolved into forest types, while the inter-milestone stratified samples will not (but couldbe inferred).
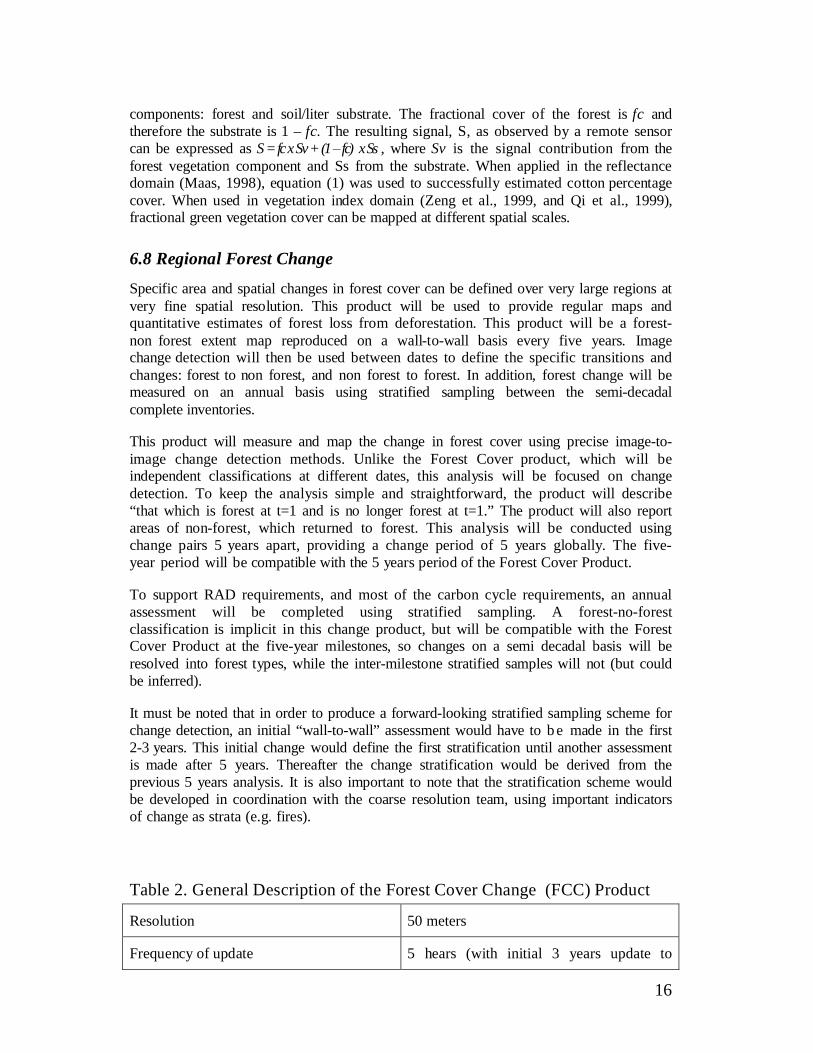
It must be noted that in order to produce a forward-looking stratified sampling scheme forchange detection, an initial “wall-to-wall” assessment would have to b e made in the first2-3 years. This initial change would define the first stratification until another assessmentis made after 5 years. Thereafter the change stratification would be derived from theprevious 5 years analysis. It is also important to note that the stratification scheme wouldbe developed in coordination with the coarse resolution team, using important indicatorsof change as strata (e.g. fires).
Table 2. General Description of the Forest Cover Change (FCC) Product
Resolution 50 meters
Frequency of update 5 hears (with initial 3 years update to
17
support the sampling product stratification)
Data sources Mostly Landsat, with gap-filling by Spotand SAR
Mapping Units Preserve all pixels, no filters
Coverage Wall-to-wall, in areas of forest identified bycoarse resolution
Thematic classes Forest, Non Forest
Data acquisition strategy Landsat 7 acquisition every year, 4 timesannually, focused on areas of forest coverand rapid changes, using Spot and otheroptical as gap filling, with SAR for gapfilling. Change pairs must be of the samesensor type.
Processing requirements Registration to earth coordinates to " 60 m,atmospheric correction required(coordinated with coarse resolution),change detection using image co-registration to " 15 m precision)
Table 3. General Description of the Sample Forest Cover Change (FCC-s)Product
Resolution 50 meters
Frequency of update Annually
Data sources Mostly Landsat, with gap-filling by Spotand SAR
Mapping units Preserve all pixels, no filters
Coverage Based on stratification sampling scheme
Thematic classes Forest, Non Forest
Data acquisition strategy Landsat 7 acquisitions every year, 4 timesannually, focused on areas with most of thearea changes, using Spot and other opticalas gap filling, with SAR for gap filling.Change pairs must be of the same sensortype

18
Processing requirements Registration to earth coordinates to " 60 m,atmospheric correction required(coordinated with coarse resolution),change detection using image co-registration to " 15 m precision.
6.9 Regional Forest Fragmentation
The high resolution analysis at the regional or national scale can provide datasetswhich can then be characterized using fragmentation statistics. A special product thatwould provide patch and edge characteristics would be developed.
7.0 PRODUCT VALIDATION, EVALUATION, ANDOUTREACH THROUGH REGIONAL NETWORKSWe need to develop and refine our products through collaboration with existing andfuture GOFC Regional Networks. There are three levels of effort needed, as describedbelow.
7.1 Product Definition and Algorithm Development.
Working closely between the FC-IT and the GOFC Regional Networks, the algorithmscan be developed for a range of forest conditions and environments. Working from thestart with the Regional Networks is deemed crucial in order that the products notbe created in a “black-box,” with only theoretical expertise and input. Detailedknowledge of land cover in the focus countries, possessed by the invited individuals,will prove invaluable to the early remote sensing activities.
7.2 Calibration and Validation at Field Sites.
It is important that the remote sensing products must be technically sound, and usable inpractical terms. This will involve calibration, validation, and evaluation activitiesinvolving our Regional Network collaborators at specific sites. Once we have calibratedthe product, it must be validated. For instance, fractional cover measures derived fromsatellite ought to agree closely with observed cover on the ground. Validation willfollow a specific procedure in collaboration with the regional scientists and users.Acquisition of special image data, such as commercial IKONOS data, may be necessary.
7.3 Product Evaluation.
Equally important as validation, the form in which the products are presented for forestrymonitoring purposes must be considered and evaluated. In some respects, evaluation willbe an ongoing process given the project design, which includes the involvement ofnetwork scientists, forest management professionals, and other users from the verybeginning. Thus, depending on the application or institutional capability of theadministrative unit charged with forestry management and monitoring, the products could
19
be presented in digital or map form, for jurisdictional units of various sizes, and as yearlyinformation or averages over some time period. Our regional collaborators will be able toevaluate the presentation forms of the products, and judge those most suitable for theiruses.
7.4 Operational Outreach.
Operational outreach comprises the technology transfer component of the project. Here,it will be necessary to stage workshops for potential users from individual countries aswell as the international community. Another approach is to involve user agencies inregular assessment workshops or conferences
20
APPENDIX 2.
APN FUNDED GOFC PROJECT FOR SE ASIA
1.0 TITLE: SPATIAL DATA AND INFORMATION FORLAND USE AND FOREST ASSESSMENT ANDMANAGEMENTPROJECT REFERENCE: 2001-09
1.1 Detailed Proposal
This proposal will support the development and distribution of new data and dataproducts for land use and forest monitoring and management. The aims of theproject are to support the Asia regional Global Observations of Forest Cover(GOFC) program, and to develop research and training leading to an operationalapproach that can support three communities:
a) Global change research focused on the role of land use and forest change in theglobal carbon cycle,
b) National forest management agencies which are faced with real-worldproblems of forest management in the face of global change, and
c) International policy in particular the IPCC, with a special emphasis on theconclusions of the IPCC Special Report on Land Use, Land Use Change andForestry, to which PI Skole was a Lead Author.
The project has three proposed Activities each producing a set of products designedto satisfy a group of users:
1.1.1 Activity 1: Implementation of the Tropical Rain Forest InformationCenter to support GOFC data requirements and users in the region.
We will utilize the basic infrastructure of MSU’s Tropical RainForest Information Center(TRFIC) as a means for data processing, product generation, and user support. TheTRFIC will be extended to the region by establishing two new nodes: one at UKM inMalaysia, an done at BIOTROP, Bogor, Indonesia. The TRFIC is a NASA supportedEarth Science Information Partnership (ESIP) which is currently serving the globalchange research community and others with historical Landsat data, Landsat 7 data, SARdata and some derived products for the humid tropics (seehttp://www.bsrsi.msu.edu/trfic). Data and products can now be ordered using a web-basedinterface and the TRFIC Core System (TCS), an automated information system forprocessing user requests. This proposal will build on this existing work as an essentialelement of the project, but we seek funds only to install the regional nodes.
21
1.1.2 Activity 2: Development of New Datasets and Data Products.
This activity will have two components: (1) First we focus on enhancing the existingdata products from TRFIC by adding atmospherically corrected and geocodedLandsat MSS, TM, and ETM+ data. This will be especially important in certainAsian regions without good GCPs. (2) Second, we will develop new derived dataproducts including 30 m and 1 km resolution Fractional Forest Cover derived fromETM+, Spot VEGETATION, and MODIS. We adhere to the design specifications forproducts proposed in Ahern et al 1999, A Strategy for Global Observation of ForestCover, but with modifications from the regional teams reports following the Bogor,Indonesia Workshop which occurred January 2000.
1.1.3 Activity 3: Product Validation, Evaluation, and Outreach.
The project will work closely with collaborators in Asia to develop end-to-end testswhere in-situ data such as stand inventories are integrated with remote sensing data.We have collaborated for a long time with an existing network of regionalscientists funded under the NASA LCLUC Program, APN, and START, and havewell-established field sites throughout the region. The current collaborative work withthese colleagues focuses on basic research understanding land cover change andcarbon cycle questions: this proposal is to expand this work to include the needs offorest resource management in an operational sense and so we will focus our effortsworking with foresters in the region. These efforts will provide for data calibration andvalidation, and will also provide a test-bed for evaluation of the efficacy of theremote sensing merged with in-situ data for operational forest management needs.
1.2 APN Funded Portion
APN funding would support the following:
§ One workshop in the region focusing on techniques for fractional coveranalysis using SPOT VGT and Landsat ETM+ data with emphasis on inputsto global climate change models (2 members from each of the 7 SE Asiacountries and from the USA and 1 from Japan)
§ Three calibration/validation field studies in the region: Cambodia/Vietnam,Laos/Thailand and Indonesia (One member from USA and one member fromeach of the countries where work will take place)
§ Two technical visits: one to Malaysia and one to Indonesia to establish TRFICdata nodes.
§ Support for the technical development of the products at Michigan StateUniversity. These funds will go to support PEPSEA candidates from the region(see Capacity Buildingbelow)
1.3 Relationship to Priority Topics in the APN Research Framework
The proposed work in this project as well as the related previous and on-going work ofthe science network highlighted in this proposal has emphasized the application of

22
empirical land use and land cover data derived from direct observations usingremotely sensed imagery to help answer local, national and regional scientificquestions of the human dimensions to LUCC, the bio-physical, socio-cultural andeconomic consequences of LUCC and as inputs to modeling global climatechange. The products and training identified in this proposal further these sciencegoals in general and specifically link to the APN priority topic of “Climate Changeand Variability”
2.0 REGIONAL COLLABORATION ANDCOORDINATIONMuch of the preparatory work has been done under prior collaborative LUCCprojects with the SE Asian Team of LUCC scientists. In fact several meetings havebeen held in the region to establish a research network that could support GOFC.
The latest workshop was held in Bogor, Indonesia January 2000. The report of thisworkshop can be found http://www.fao.org/gtos/gofc-gold/docs/sea_gofc.pdf.
The project will coordinate with the APN and IGBP LUCC research network in theregion. The network has already been heavily involved with GOFC. Dr. IwanGunawan, a co-investigator is the co-chair with PI-Skole of the Forest CoverInternational Implementation Team for GOFC (see www.fao.org/gtos/gofc-gold/).Others have been involved from the beginning of the design phase and through theinitial implementation. Two important workshops, with joint sponsorship bySTART, have been important in developing the coordination mechanism necessaryfor implementation of a regional network. The first was held in Washington DC todevelop an overall working strategy for tropical regional networks. The second wasa workshop in Bogor, Indonesia, which laid out the plan for regional networkoperations.
3.0 CAPACITY BUILDINGThe use of new techniques and technologies in analyzing RS data for fractionalcover will be the focus of the workshop. The use of field calibration instruments willalso be discussed and used during the fieldwork tasks. To support training, graduatestudents from the region will work on advanced degrees in the BSRSI program andMichigan State University under the Personnel Exchange Program for South EastAsia (PEPSEA), which has been established within the LUCC team’s network tobuild long-term technical and scientific capacity. These students will work on thisproject and receive degrees in GIS or Remote Sensing from the Department ofGeography at Michigan State University, under the BSRSI and will return to theregion following completion of their program.
4.0 LINKS TO POLICYPrimary to the work in this proposal is the application of new products for resourcemanagers. Linkages have been established at national levels between the teamscientists and forestry agencies. The goal is to establish an operation forest monitoryprogram for resource managers and policy makers and all levels: local to regional.

23
Individual team members often operate within these levels providing expertise inwatershed maintenance, input to national forest assessments and participate inregional, bi-lateral groups, and the come from diverse working environments:university, research institutes, national agencies and NGOs.
5.0 RELATIONSHIP TO GLOBAL CHANGE RESEARCHPROGRAMMEThis project builds upon previous work initiated under START with the IGBP LUCC coreproject activity in SE Asia., in coordination with IHDP with funding from GEF. It alsobuilds upon the work completed under the NASA LCLUC program. It continues thisresearch focus with additional data sets and new methods to support a new global changeresearch program, the Global Observation of Forest Cover (GOFC). Please seehttp://www.fao.org/gtos/gofc-gold/ for more information on GOFC.
This proposal seeks to support the GOFC project in Asia by providing new data and dataproducts for the region’s forests and other important land covers (e.g. rice and urbanareas). Part of the project will be further development of the emerging LUCC researchnetwork to include forestry-related agencies and institutions. As such we also propose aseries of demonstration projects to evaluate the application of data and products totropical forest management needs through collaboration with several forestrymanagement agencies in tropical countries, coordinated through a network ofcollaborating scientists.
A community consensus design for the GOFC project has been developed through aseries of international workshops and is described in several documents that describe itscentral themes and proposed products. These may be viewed athttp://www.fao.org/gtos/gofc-gold/documents.html. The GOFC project aims to developand demonstrate operational forest monitoring at regional and global scales by developingprototype projects along three primary Themes: :(1) Forest Cover Characteristics andChanges (2) Forest Fire Monitoring and Mapping and (3) Forest BiophysicalProcesses. This proposal seeks primarily to support the development of GOFCTheme (1) with lesser support to Theme (3)
Our goal is to enhance existing data from Landsat and Spot VEGETATION, and futuredata from MODIS, by applying atmospheric correction and geo-registration. Inaddition, we recognize that tropical forest change mapping presently has been heavilyfocused on mapping deforestation using methods that provide digital maps of forestand non-forest. Two new developments in global change remote sensing make ourproposal possible. The first involves the use of high spatial resolution optical datafrom Landsat 7. Launched in April of this year, data are now being acquired using theLong Term Acquisition Plan, which will acquire cloud free data at least once per yearfor the entire tropical belt. The overall objective of the LTAP is to provide a globalrefresh 4 times each year, capturing data for both inter- and intra-annualmeasurements on a routine basis.
6.0 RELATED RESEARCH WORK§ NASA Landsat Pathfinder
24
§ IGBP LUCC SE Asia: Four Case Studies in Thailand, Malaysia, Philippinesand Indonesia
§ NASA LCLUC SE Asia: Interannual Dynamic of Forest CoverCharacteristics and ModelingHuman Dimensions of Land Use/Land CoverChange
§ APN 2000-2001 (PI-Dr. Sharifah Mastura S.A)
§ GOFC

25
APPENDIX 3
Major CollaboratorsUNITED STATES OF AMERICA
Implementation Agency
Basic Science and Remote Sensing Initiative
Dept. of Geography
Michigan State University
1405 S Harrison Road
East Lansing, MI USA
Tel: 517 432 3924
Fax: 517 353 2932
Email: [email protected]
Principal Investigators
o Prof. Dr. David Skole
o Mr. Jay Samek
o Dr. Jiaguo Qi
MALAYSIA
Implementing Agency
Universiti Kegangsaan Malaysia
Department of Geography
Universiti Kebangsaan Malaysia
43600 Bangi, Selangor, Malaysia
Tel: 603 8293679
Fax: 603 8293334
Email: [email protected]
Malaysia Forestry Department
Project Advisor
Dr. Lim Joo Teck
Project Leaders
Dr. Sharifah Mastura Syed Abdullah
Mr. Alias Md. Sood
Team Members
Dr. Othman A. Karim
Dr. Abdul Rahim Md. Nor
Mr. Laili Nordin
Mr. Mokhtar Jaafar
Dr. Asmah Ahmad
26
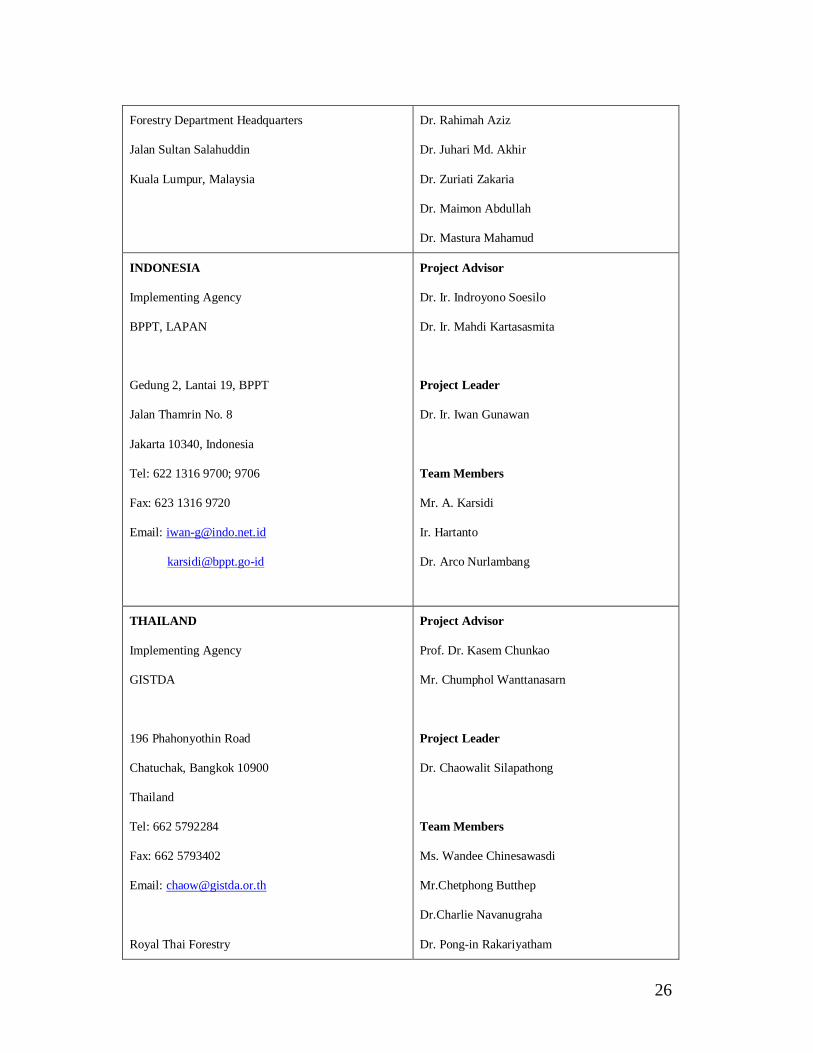
Forestry Department Headquarters
Jalan Sultan Salahuddin
Kuala Lumpur, Malaysia
Dr. Rahimah Aziz
Dr. Juhari Md. Akhir
Dr. Zuriati Zakaria
Dr. Maimon Abdullah
Dr. Mastura Mahamud
INDONESIA
Implementing Agency
BPPT, LAPAN
Gedung 2, Lantai 19, BPPT
Jalan Thamrin No. 8
Jakarta 10340, Indonesia
Tel: 622 1316 9700; 9706
Fax: 623 1316 9720
Email: [email protected]
Project Advisor
Dr. Ir. Indroyono Soesilo
Dr. Ir. Mahdi Kartasasmita
Project Leader
Dr. Ir. Iwan Gunawan
Team Members
Mr. A. Karsidi
Ir. Hartanto
Dr. Arco Nurlambang
THAILAND
Implementing Agency
GISTDA
196 Phahonyothin Road
Chatuchak, Bangkok 10900
Thailand
Tel: 662 5792284
Fax: 662 5793402
Email: [email protected]
Royal Thai Forestry
Project Advisor
Prof. Dr. Kasem Chunkao
Mr. Chumphol Wanttanasarn
Project Leader
Dr. Chaowalit Silapathong
Team Members
Ms. Wandee Chinesawasdi
Mr.Chetphong Butthep
Dr.Charlie Navanugraha
Dr. Pong-in Rakariyatham

27
Forest Resources Assessment Division
Forest Research Office
Chatuchak, Bangkok 10900
Thailand
Tel: 662 940 5737
Email: [email protected]
Mr.Kamron Saifuk
Dr. Suwit Ongosomwong
Ms. Darurat Disthanchong
Dr. Kankhajane Chucip
PHILLIPPINES
Implementing Agency
NAMRIA & PAGASA
National Remote Sensing Centre
NAMRIA, Lawton Avenue, Fort Bonifacio
Makati City, Phillippines
Tel: (632) 8105463
Fax: (632) 8104844/8102891
Email: [email protected]
Project Leaders
Dr. Virgilio S. Santos
Dr. Flaviana Hilario
Team Members
Ms. Alma Alquero
Mr. Bobby Crisostomo
Mr. Leo Belgira
Mr. Ernestine Gayban
Mr. Sunday Lingad
Mr. Jojo Bernando
Mr. Jesus Mcdenilla
Mr Romeo Tejada
Mr. Eriberto Brillantes
Mr. Claro Lopez III
VIETNAM
Implementing Agency
Department of Satellite Applications
Hydro-Meteorological Service of Vietnam
4 Dan Thai Tnam Str. Hanoi, Vietnam
Project Leader
Dr. Hoang Minh Hien
Ms. Tran Thi Bang Tam
Team Members
Dr. Do Xuan Lan

28
Tel: 844 826 1187
Fax: 844 825 4278
Email: [email protected]
Mr. Nguyen Vinh Thu
LAOS
Implementing Agency
National University of Laos
P.O. Box 5653
Vientiane, LAO PDR
Tel: 856 21 414813
Fax: 856 21 732096 or 85621, 732294
Email: [email protected]
Project Leader
Dr. Soukkongseng Saignaleuth
Team Members
Dr. Sithong Thongmanivong
Dr. Sengkham Inthiravongsy
Dr. Houngphet Chanthavong
CAMBODIA
Implementing Agency
Department of Natural Resources Assessment andEnvironmental Data Management
Sihanouk Blvd., Phnom Penh, CAMBODIA
Tel: +855 023-426 814
Fax: +855 023 216 297
Project Leader
Dr. Pum Vicheth
Team Members
Dr. Touch Nina
Dr. Ek Menrith
Dr. Prak Noma
JAPAN
Implementing Agency
RESTEC/NASDA
NASDA Earth Observation Planning Department
Office of Earth Observation Systems
Tel: +81 3 3438-6344
Fax: +81 3 5401-8702
Email: [email protected]
sobue@[email protected]
Project Leader
Dr. Shi-ichi Sobue
Team Members
Hiroshi Ishiguro

29
CHINA
Implementing Agency
International Institute for Earth System Science
Nanjing University
Hankou Road 22#
Nanjing 210093, P.R. China
Tel: +86 (0) 25-3597077
Fax: +86 (0) 25-3592288
Project Leader
Dr. Wanchang Zhang
30
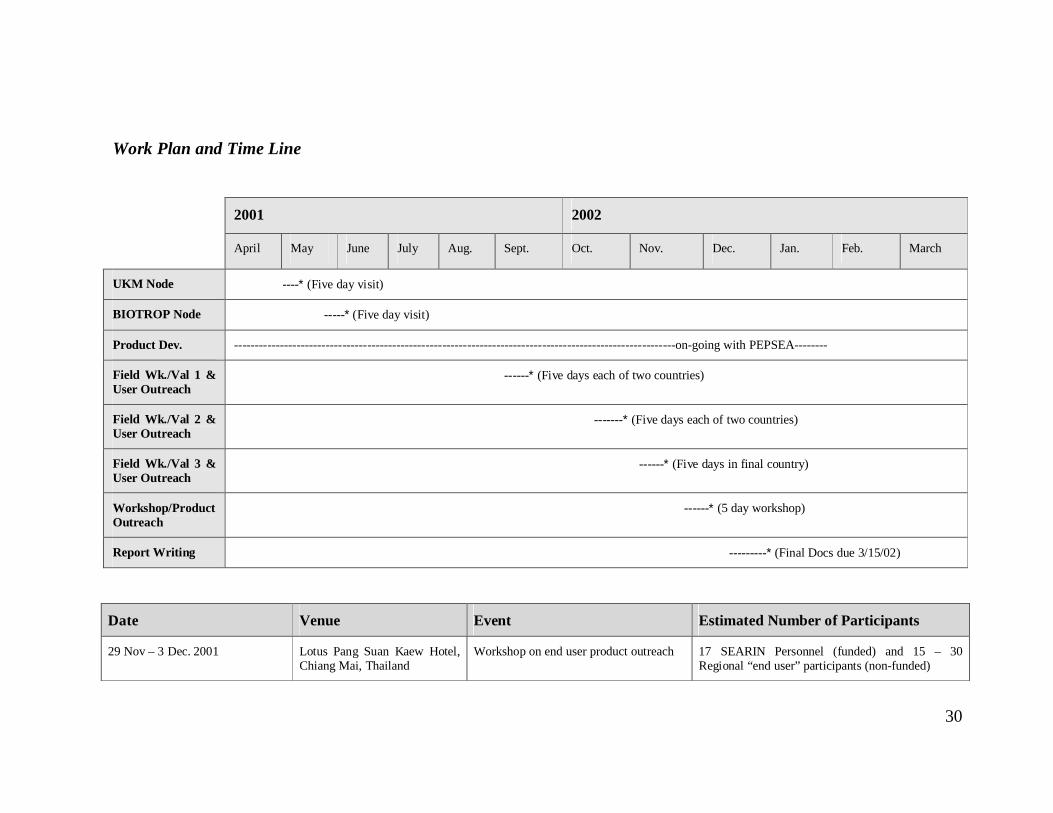
Work Plan and Time Line
2001 2002
April May June July Aug. Sept. Oct. Nov. Dec. Jan. Feb. March
UKM Node ----* (Five day visit)
BIOTROP Node -----* (Five day visit)
Product Dev. ----------------------------------------------------------------------------------------------------------on-going with PEPSEA--------
Field Wk./Val 1 &User Outreach
------* (Five days each of two countries)
Field Wk./Val 2 &User Outreach
-------* (Five days each of two countries)
Field Wk./Val 3 &User Outreach
------* (Five days in final country)
Workshop/ProductOutreach
------* (5 day workshop)
Report Writing ---------* (Final Docs due 3/15/02)
Date Venue Event Estimated Number of Participants
29 Nov – 3 Dec. 2001 Lotus Pang Suan Kaew Hotel,Chiang Mai, Thailand
Workshop on end user product outreach 17 SEARIN Personnel (funded) and 15 – 30Regional “end user” participants (non-funded)

31
UKM Node and BIORTOP Node
Assistance in the installation of software and hardware, the creation of an RDBMSpopulated with remote sensing satellite imagery metadata, and the establishment ofInternet connectivity between these nodes and the Tropical Rain Forest InformationCenter to serve data to users supporting a variety of national resource management andscientific activities throughout the region. These nodes will facilitate the ease and access ofdata for end users, as well as provide archive opportunities for future products beingdeveloped through R & D efforts and by natural resource managers themselves.
Product Development
This project will focus on development of a suite of datasets and data products asfollows(see Table 1 below):
Level 1 TM and ETM+ data from TRFIC, which are not atmospherically corrected andgeo-referenced by system correction only will be made available. In addition, wewill acquire SPOT VEGETATION and MODIS images over the tropical forest areas.
Level 2 Enhanced image datasets, which will include fine and coarse resolution imagedata from TM, ETM+, ALI, MODIS and VEGATATION which have beenatmospherically corrected, geo-referenced to earth coordinates (+ 60m),projected,normalized for view / sun angle effect, and mosaicked when multiple scenesneeded will also be provided.
Level 3 Derived data products, which will include the results of analyses of image productsusing new algorithms, which compute fractional forest cover and LAI. These productswill be used to improve existing assessments of deforestation, re-growth, logging, andforest cover characteristics.
We believe that some users will primarily need access to the Level 1 and Level 2 datasets,such as the UN FAO Forest Resource Assessment program which routinely acquiresthe image data and performs its own in-house data analysis. Others, such as the forestinventory community need access to Level 3 derived data such as extant forestdensity and fractional cover for making forest inventory or deforestation and forestdegradation assessments.

32
ProductLevel
Product Description Spatial and temporal coverage
1a Raw TM and ETM+ from TRFIC, no atmospheric correction, geo-referenced bysystem correction only.
Focus area: 30m/1yr
Regional: 30m/3yr
1b Raw VEGETATIPON and MODIS imagery, no atmospheric corrections, geo-referenced by system correction only.
Focus area: 1km/month
Regional: 1km/month
2 Geo-referenced and atmospherically corrected, normalized for sun and view angles,30m and 1km resolution imagery from Landsat, supplemented with EO-1, SPOT, andASTER imagery. Spatial accuracy "60m
Focus area: 30m + 1km)/yr
Regional: 30m/3yrs & 1km/month
3a Forest Density (FD): Forest fractional cover computed from geo-referenced ETM+and MODIS/VEGETATION imagery
Focus areas: 30m/1yr
Regional: 30m/3yr & 1km/month
3b Forest Density (FD): Estimated total green leaf area index and fPAR using MODISLAI/fPAR algorithm, optimized for tropical forest.
Focus area: 30m/3yr
Regional: 30m/3yr & 1km/month
33
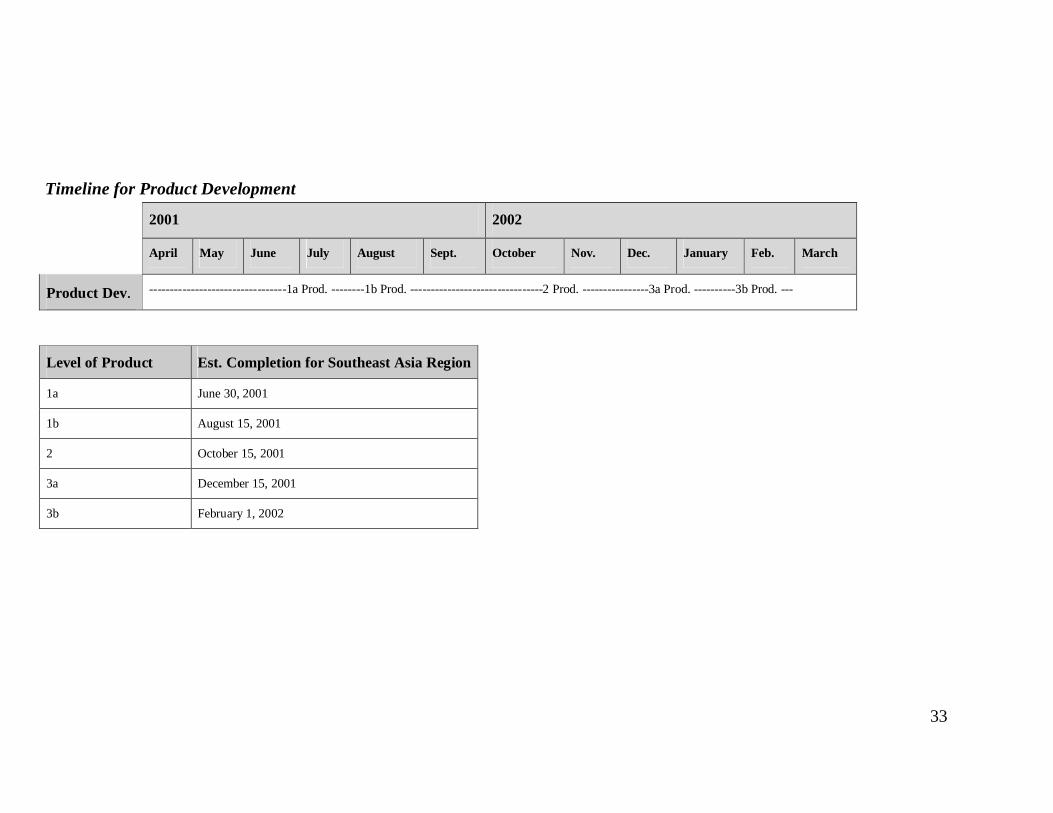
Timeline for Product Development
2001 2002
April May June July August Sept. October Nov. Dec. January Feb. March
Product Dev. ---------------------------------1a Prod. --------1b Prod. --------------------------------2 Prod. ----------------3a Prod. ----------3b Prod. ---
Level of Product Est. Completion for Southeast Asia Region
1a June 30, 2001
1b August 15, 2001
2 October 15, 2001
3a December 15, 2001
3b February 1, 2002
34
Field Work Activities and User Outreach
These activities will take place in the following countries: Thailand, Laos,Cambodia, Vietnam and Indonesia. Activities will center on gathering feedback fromend users (Forestry agencies, Natural Resource Management Agencies, planners, etc.)regarding new products, access to data, data formats, and data delivery mechanism.End user requirements will direct any specific “course corrections” necessary in theproduct development and data distribution scenarios. Field site visits with end users willhelp to validate product accuracy. These activities will occur in three field visits: one inThailand and Laos, a second in Vietnam and Cambodia and a third in Indonesia. Workwill span five days in each of the five countries. End user information collected in thisactivity will flow back in the form of document summaries distributed to governmentagencies, NGOs etc., and through the development of a web site. This will help facilitateon-going user feedback and continued discussion directed at user requirements tohelp focus the product development strategy.
Final Workshop
A final workshop will be held in the region late November or early December 2001focused on product outreach and continued end user product support. This workshop willserve as a capstone to the previous eight months work in which collaboratingagencies will have an opportunity to share developed products (data on CDROM, photoproducts, posters, policy briefs, documents, etc.) and develop future plans to supportother agencies with this data and information at local to regional levels.