Report - ESMA · The report contains three sections. ... DE 785 700 585 442 493 409 364 396 377 399...
16
ESMA31-62-746 3 July 2017 Report EEA prospectus activity in 2016
Transcript of Report - ESMA · The report contains three sections. ... DE 785 700 585 442 493 409 364 396 377 399...
ESMA31-62-746 3 July 2017
Report EEA prospectus activity in 2016
2
Table of Contents
Acronyms .............................................................................................................................. 3
1 Introduction .................................................................................................................... 5
2 General approval activity ................................................................................................ 6
3 Details of approved prospectuses .................................................................................. 8
3.1 Structure of approved prospectuses ........................................................................ 8
3.1.1 Standalone vs. base prospectuses .................................................................. 8
3.1.2 Single document vs. tripartite prospectuses ................................................... 10
3.2 Content of approved prospectuses ........................................................................ 10
3.2.1 Equity vs. non-equity ...................................................................................... 10
3.2.2 Type of securities ........................................................................................... 11
4 Passporting activity ...................................................................................................... 12
4.1 Prospectuses passported out ................................................................................ 12
4.2 Prospectuses passported in .................................................................................. 15
3
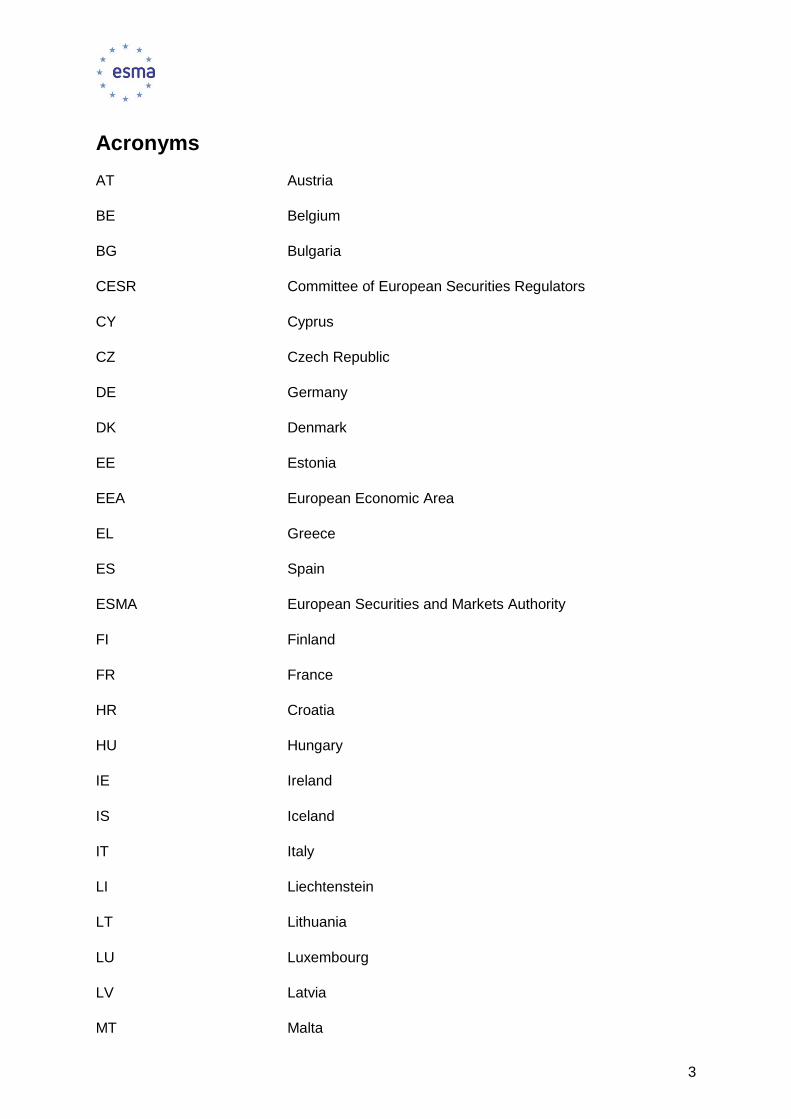
Acronyms
AT Austria
BE Belgium
BG Bulgaria
CESR Committee of European Securities Regulators
CY Cyprus
CZ Czech Republic
DE Germany
DK Denmark
EE Estonia
EEA European Economic Area
EL Greece
ES Spain
ESMA European Securities and Markets Authority
FI Finland
FR France
HR Croatia
HU Hungary
IE Ireland
IS Iceland
IT Italy
LI Liechtenstein
LT Lithuania
LU Luxembourg
LV Latvia
MT Malta
4
NCA National Competent Authority
New Prospectus Regulation Regulation (EU) 2017/1129 of the European Parliament and of
the Council of 14 June 2017 on the prospectus to be published
when securities are offered to the public or admitted to trading
on a regulated market, and repealing Directive 2003/71/EC
NL Netherlands
NO Norway
PL Poland
Prospectus Directive/PD Directive 2003/71/EC of the European Parliament and of the
Council of 4 November 2003 on the prospectus to be
published when securities are offered to the public or admitted
to trading and amending Directive 2001/34/EC
PT Portugal
RO Romania
SE Sweden
SI Slovenia
SK Slovakia
UK United Kingdom
5
1 Introduction
Background
Since 2007, ESMA1 has published statistical data on the number of prospectuses approved
and passported by the National Competent Authorities (NCAs) of the European Economic
Area (EEA) within the EU prospectus regime. The purpose of making such data available is
to provide information about trends within the prospectus regime in terms of general approval
and passporting activity as well as the structure of approved prospectuses and the types of
securities they cover.
Content and main findings
The report contains three sections. Section 2 sets out general information on prospectus
approval activity in 2016 and presents the trends in approval activity since 2006. Section 3
provides more granular data on the structure and content of prospectuses approved in 2016
while section 4 presents information on passporting activity both out of and in to EEA countries
during 2016 and discusses trends since 2010.
The report shows that the amount of prospectus approvals across the EEA fell by 8.5% from
2015 to 2016. This was a continuation of the overall decreasing trend seen since 2009 as a
result of the impact of the financial crisis, the amount of approvals in 2016 amounting to 33.5%
of the 2007 peak level. Around 40% of approved prospectuses were in the form of base
prospectuses and 91% were drawn up as single documents as opposed to tripartite
prospectuses. Almost three quarters of approved prospectuses related to non-equity
securities with the most frequent security type being debt securities with a denomination of at
least €100.000. Both non-equity and equity approvals were highly concentrated in a small
number of jurisdictions. In terms of passporting activity, a small number of countries accounted
for the majority of prospectuses passported to other EEA countries in 2016, the overall
passporting of prospectuses having declined from 2015.
ESMA will continue to publish annual information on prospectus activity in the EEA and will
expand its reporting under Article 47 of the new Prospectus Regulation.
Underlying data
The present report is compiled on the basis of notifications made by NCAs through ESMA’s
Prospectus Register where stakeholders are able to search in additional detailed information
in relation to prospectuses approved and passported within the EEA.
ESMA is not able to provide any representation or warranty that all notifications have been
made in an accurate and timely fashion as this is the responsibility of each NCA. Furthermore,
please note that NCAs sometimes provide ESMA with slight adjustments of previously notified
data. Where this is the case, ESMA publishes the adjusted data in the first coming report after
the notification of the adjustment. Accordingly, if any discrepancy is identified between the
numbers in this report and numbers in previously published reports, the present report should
be taken as the authoritative source.
1 From 2007 to 2010, this task was undertaken by CESR, the predecessor of ESMA. Data reports published between 2011 and 2015 are available on ESMA’s website.
6
2 General approval activity
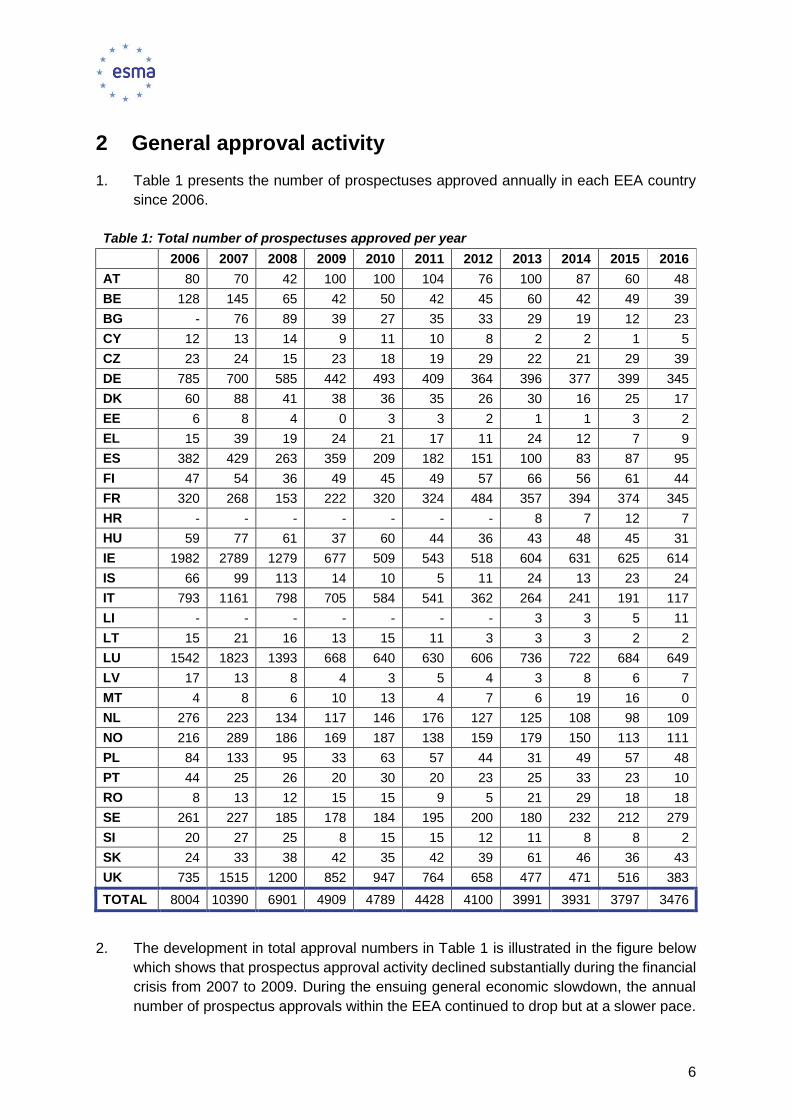
1. Table 1 presents the number of prospectuses approved annually in each EEA country
since 2006.
Table 1: Total number of prospectuses approved per year
2006 2007 2008 2009 2010 2011 2012 2013 2014 2015 2016
AT 80 70 42 100 100 104 76 100 87 60 48
BE 128 145 65 42 50 42 45 60 42 49 39
BG - 76 89 39 27 35 33 29 19 12 23
CY 12 13 14 9 11 10 8 2 2 1 5
CZ 23 24 15 23 18 19 29 22 21 29 39
DE 785 700 585 442 493 409 364 396 377 399 345
DK 60 88 41 38 36 35 26 30 16 25 17
EE 6 8 4 0 3 3 2 1 1 3 2
EL 15 39 19 24 21 17 11 24 12 7 9
ES 382 429 263 359 209 182 151 100 83 87 95
FI 47 54 36 49 45 49 57 66 56 61 44
FR 320 268 153 222 320 324 484 357 394 374 345
HR - - - - - - - 8 7 12 7
HU 59 77 61 37 60 44 36 43 48 45 31
IE 1982 2789 1279 677 509 543 518 604 631 625 614
IS 66 99 113 14 10 5 11 24 13 23 24
IT 793 1161 798 705 584 541 362 264 241 191 117
LI - - - - - - - 3 3 5 11
LT 15 21 16 13 15 11 3 3 3 2 2
LU 1542 1823 1393 668 640 630 606 736 722 684 649
LV 17 13 8 4 3 5 4 3 8 6 7
MT 4 8 6 10 13 4 7 6 19 16 0
NL 276 223 134 117 146 176 127 125 108 98 109
NO 216 289 186 169 187 138 159 179 150 113 111
PL 84 133 95 33 63 57 44 31 49 57 48
PT 44 25 26 20 30 20 23 25 33 23 10
RO 8 13 12 15 15 9 5 21 29 18 18
SE 261 227 185 178 184 195 200 180 232 212 279
SI 20 27 25 8 15 15 12 11 8 8 2
SK 24 33 38 42 35 42 39 61 46 36 43
UK 735 1515 1200 852 947 764 658 477 471 516 383
TOTAL 8004 10390 6901 4909 4789 4428 4100 3991 3931 3797 3476
2. The development in total approval numbers in Table 1 is illustrated in the figure below
which shows that prospectus approval activity declined substantially during the financial
crisis from 2007 to 2009. During the ensuing general economic slowdown, the annual
number of prospectus approvals within the EEA continued to drop but at a slower pace.
7
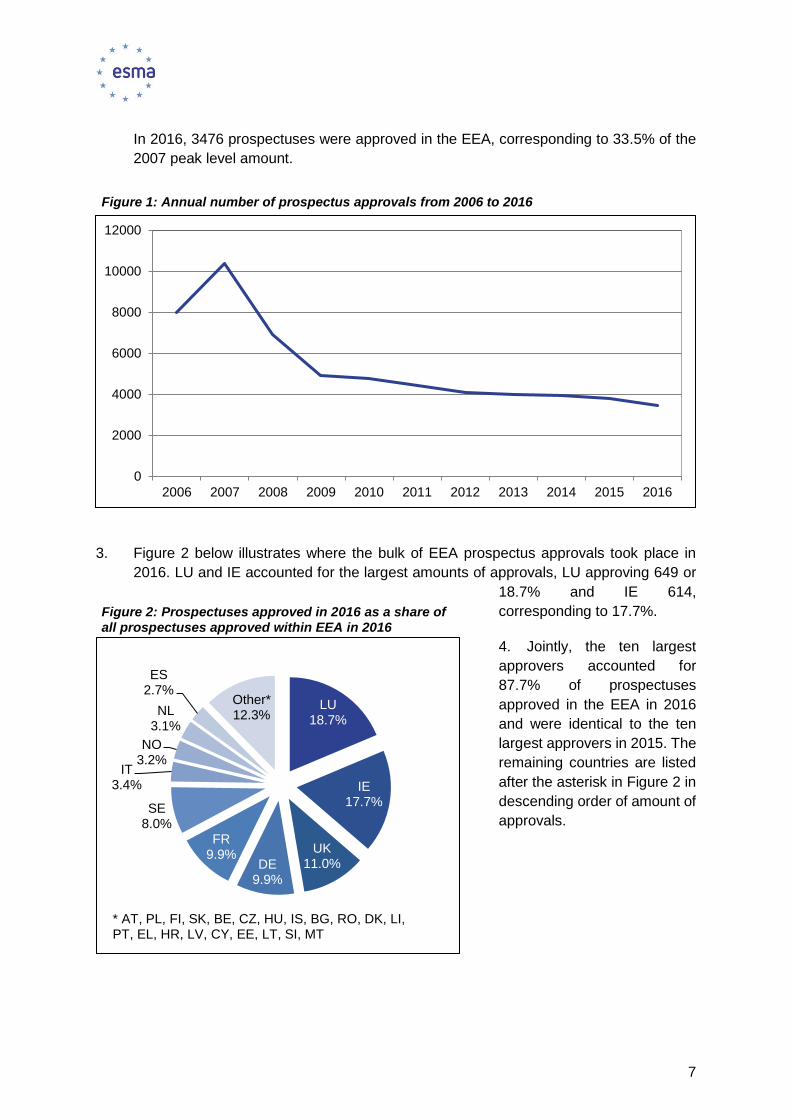
In 2016, 3476 prospectuses were approved in the EEA, corresponding to 33.5% of the
2007 peak level amount.
3. Figure 2 below illustrates where the bulk of EEA prospectus approvals took place in
2016. LU and IE accounted for the largest amounts of approvals, LU approving 649 or
18.7% and IE 614,
corresponding to 17.7%.
4. Jointly, the ten largest
approvers accounted for
87.7% of prospectuses
approved in the EEA in 2016
and were identical to the ten
largest approvers in 2015. The
remaining countries are listed
after the asterisk in Figure 2 in
descending order of amount of
approvals.
Figure 1: Annual number of prospectus approvals from 2006 to 2016
0
2000
4000
6000
8000
10000
12000
2006 2007 2008 2009 2010 2011 2012 2013 2014 2015 2016
Figure 2: Prospectuses approved in 2016 as a share of all prospectuses approved within EEA in 2016
LU18.7%
IE17.7%
UK11.0%DE
9.9%
FR9.9%
SE8.0%
IT3.4%
NO3.2%
NL3.1%
ES2.7%
Other*12.3%
* AT, PL, FI, SK, BE, CZ, HU, IS, BG, RO, DK, LI, PT, EL, HR, LV, CY, EE, LT, SI, MT
8
3 Details of approved prospectuses
5. Section 3 offers information on the structure of prospectuses approved in 2016, both in
terms of i) whether they were drawn up as standalone prospectuses or, in accordance
with Article 5(4) of the Prospectus Directive (PD), as base prospectuses with the final
terms possibly as a separately filed document, and ii) whether they were drawn up as
single documents, tripartite documents consisting of a registration document, a
securities note and a summary or tripartite documents without a summary. Additionally,
the section provides information on the security types which prospectuses concerned,
illustrated by way of a distinction between equity and non-equity as well as a distinction
between the specific security types.
3.1 Structure of approved prospectuses
3.1.1 Standalone vs. base prospectuses
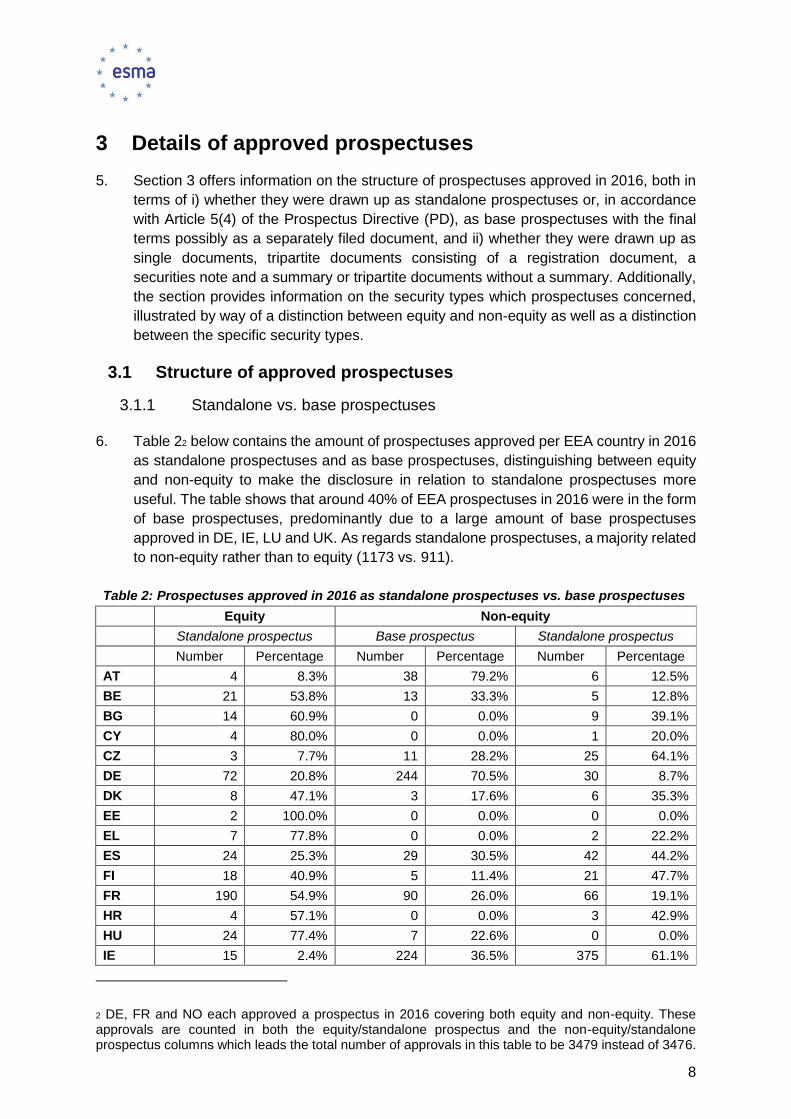
6. Table 22 below contains the amount of prospectuses approved per EEA country in 2016
as standalone prospectuses and as base prospectuses, distinguishing between equity
and non-equity to make the disclosure in relation to standalone prospectuses more
useful. The table shows that around 40% of EEA prospectuses in 2016 were in the form
of base prospectuses, predominantly due to a large amount of base prospectuses
approved in DE, IE, LU and UK. As regards standalone prospectuses, a majority related
to non-equity rather than to equity (1173 vs. 911).
Table 2: Prospectuses approved in 2016 as standalone prospectuses vs. base prospectuses
Equity Non-equity
Standalone prospectus Base prospectus Standalone prospectus
Number Percentage Number Percentage Number Percentage
AT 4 8.3% 38 79.2% 6 12.5%
BE 21 53.8% 13 33.3% 5 12.8%
BG 14 60.9% 0 0.0% 9 39.1%
CY 4 80.0% 0 0.0% 1 20.0%
CZ 3 7.7% 11 28.2% 25 64.1%
DE 72 20.8% 244 70.5% 30 8.7%
DK 8 47.1% 3 17.6% 6 35.3%
EE 2 100.0% 0 0.0% 0 0.0%
EL 7 77.8% 0 0.0% 2 22.2%
ES 24 25.3% 29 30.5% 42 44.2%
FI 18 40.9% 5 11.4% 21 47.7%
FR 190 54.9% 90 26.0% 66 19.1%
HR 4 57.1% 0 0.0% 3 42.9%
HU 24 77.4% 7 22.6% 0 0.0%
IE 15 2.4% 224 36.5% 375 61.1%
2 DE, FR and NO each approved a prospectus in 2016 covering both equity and non-equity. These approvals are counted in both the equity/standalone prospectus and the non-equity/standalone prospectus columns which leads the total number of approvals in this table to be 3479 instead of 3476.
9
IS 1 4.2% 9 37.5% 14 58.3%
IT 29 24.8% 84 71.8% 4 3.4%
LI 0 0.0% 3 27.3% 8 72.7%
LT 2 100.0% 0 0.0% 0 0.0%
LU 12 1.8% 306 47.1% 331 51.0%
LV 0 0.0% 6 85.7% 1 14.3%
MT 0 0.0% 0 0.0% 0 0.0%
NL 40 36.7% 47 43.1% 22 20.2%
NO 45 40.2% 6 5.4% 61 54.5%
PL 36 75.0% 11 22.9% 1 2.1%
PT 4 40.0% 2 20.0% 4 40.0%
RO 17 94.4% 1 5.6% 0 0.0%
SE 144 51.6% 61 21.9% 74 26.5%
SI 1 50.0% 0 0.0% 1 50.0%
SK 0 0.0% 4 9.3% 39 90.7%
UK 170 44.4% 191 49.9% 22 5.7%
TOTAL 911 26.2% 1395 40.1% 1173 33.7%
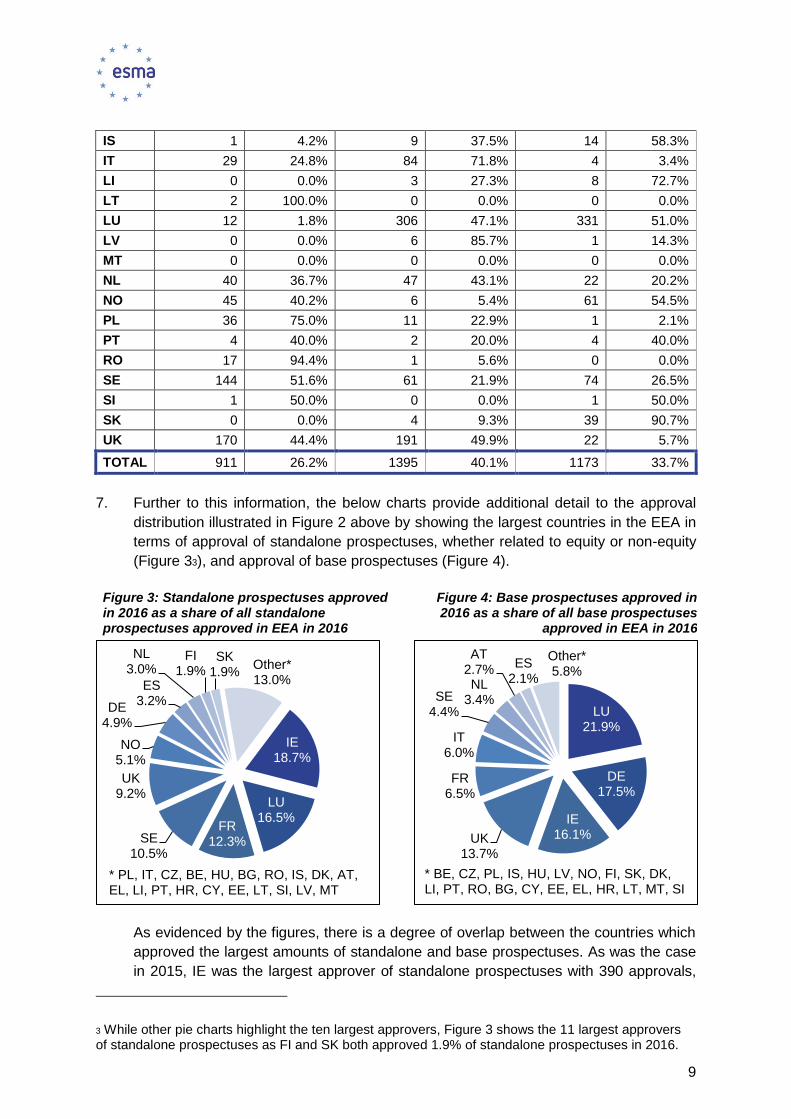
7. Further to this information, the below charts provide additional detail to the approval
distribution illustrated in Figure 2 above by showing the largest countries in the EEA in
terms of approval of standalone prospectuses, whether related to equity or non-equity
(Figure 33), and approval of base prospectuses (Figure 4).
As evidenced by the figures, there is a degree of overlap between the countries which
approved the largest amounts of standalone and base prospectuses. As was the case
in 2015, IE was the largest approver of standalone prospectuses with 390 approvals,
3 While other pie charts highlight the ten largest approvers, Figure 3 shows the 11 largest approvers of standalone prospectuses as FI and SK both approved 1.9% of standalone prospectuses in 2016.
Figure 3: Standalone prospectuses approved in 2016 as a share of all standalone prospectuses approved in EEA in 2016
Figure 4: Base prospectuses approved in 2016 as a share of all base prospectuses
approved in EEA in 2016
IE18.7%
LU16.5%
FR12.3%SE
10.5%
UK9.2%
NO5.1%
DE4.9%
ES3.2%
NL3.0%
FI1.9%
SK1.9%
Other*13.0%
* PL, IT, CZ, BE, HU, BG, RO, IS, DK, AT, EL, LI, PT, HR, CY, EE, LT, SI, LV, MT
LU21.9%
DE17.5%
IE16.1%UK
13.7%
FR6.5%
IT6.0%
SE4.4%
NL3.4%
AT2.7%
ES2.1%
Other*5.8%
* BE, CZ, PL, IS, HU, LV, NO, FI, SK, DK, LI, PT, RO, BG, CY, EE, EL, HR, LT, MT, SI
10
largely due to its high amount of non-equity prospectuses. On the base prospectus side,
LU accounted for 306 approvals or 21.9%, keeping its 2015 position as the largest
approver in this category.
3.1.2 Single document vs. tripartite prospectuses
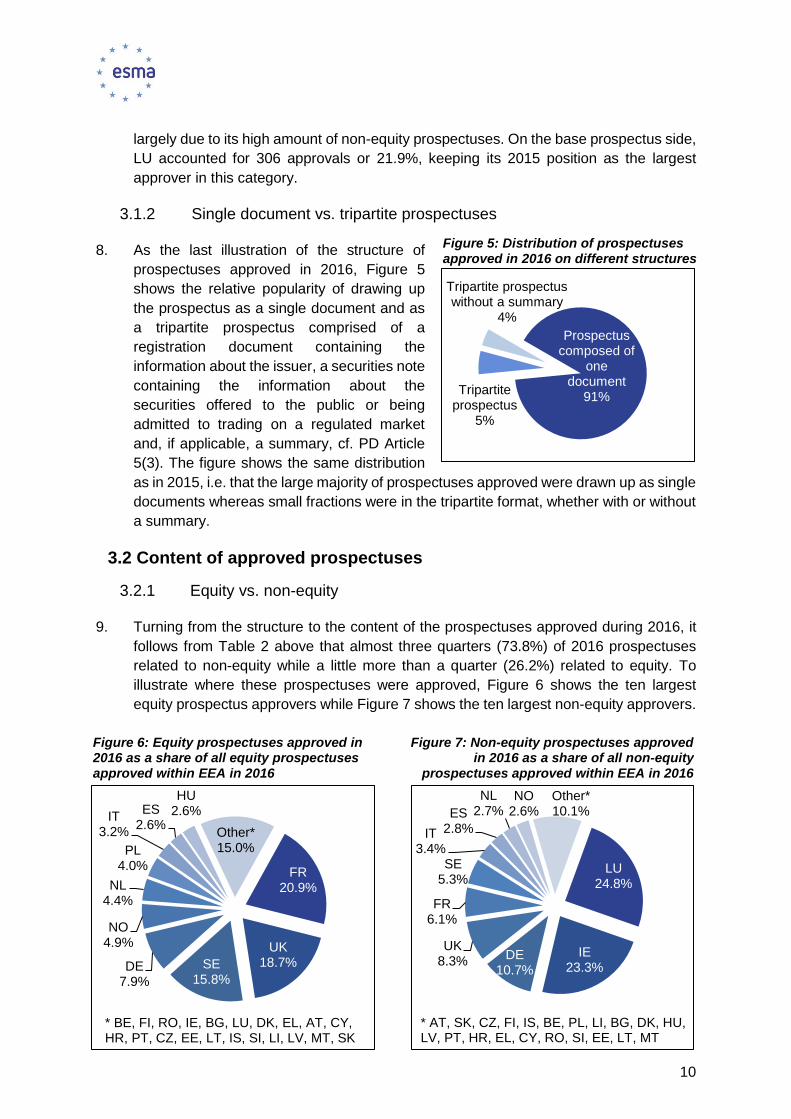
8. As the last illustration of the structure of
prospectuses approved in 2016, Figure 5
shows the relative popularity of drawing up
the prospectus as a single document and as
a tripartite prospectus comprised of a
registration document containing the
information about the issuer, a securities note
containing the information about the
securities offered to the public or being
admitted to trading on a regulated market
and, if applicable, a summary, cf. PD Article
5(3). The figure shows the same distribution
as in 2015, i.e. that the large majority of prospectuses approved were drawn up as single
documents whereas small fractions were in the tripartite format, whether with or without
a summary.
3.2 Content of approved prospectuses
3.2.1 Equity vs. non-equity
9. Turning from the structure to the content of the prospectuses approved during 2016, it
follows from Table 2 above that almost three quarters (73.8%) of 2016 prospectuses
related to non-equity while a little more than a quarter (26.2%) related to equity. To
illustrate where these prospectuses were approved, Figure 6 shows the ten largest
equity prospectus approvers while Figure 7 shows the ten largest non-equity approvers.
Figure 6: Equity prospectuses approved in 2016 as a share of all equity prospectuses approved within EEA in 2016
FR20.9%
UK18.7%SE
15.8%DE
7.9%
NO4.9%
NL4.4%
PL4.0%
IT3.2%
ES2.6%
HU2.6%
Other*15.0%
* BE, FI, RO, IE, BG, LU, DK, EL, AT, CY, HR, PT, CZ, EE, LT, IS, SI, LI, LV, MT, SK
Figure 7: Non-equity prospectuses approved in 2016 as a share of all non-equity
prospectuses approved within EEA in 2016
LU24.8%
IE23.3%
DE10.7%
UK8.3%
FR6.1%
SE5.3%
IT3.4%
ES2.8%
NL2.7%
NO2.6%
Other*10.1%
* AT, SK, CZ, FI, IS, BE, PL, LI, BG, DK, HU, LV, PT, HR, EL, CY, RO, SI, EE, LT, MT
Figure 5: Distribution of prospectuses approved in 2016 on different structures
Prospectus composed of
one document
91%Tripartite
prospectus5%
Tripartite prospectus without a summary
4%
11
As regards equity approvals, FR accounted for slightly more than a fifth, replacing UK
as the largest equity approver in 2016. Collectively, FR, UK, SE and DE accounted for
63.2% of equity approvals. Looking in turn at non-equity prospectuses, LU approved
almost a quarter closely followed by IE with more than 23%. Together with DE and UK,
these countries accounted for just over 67% of non-equity approvals in 2016.
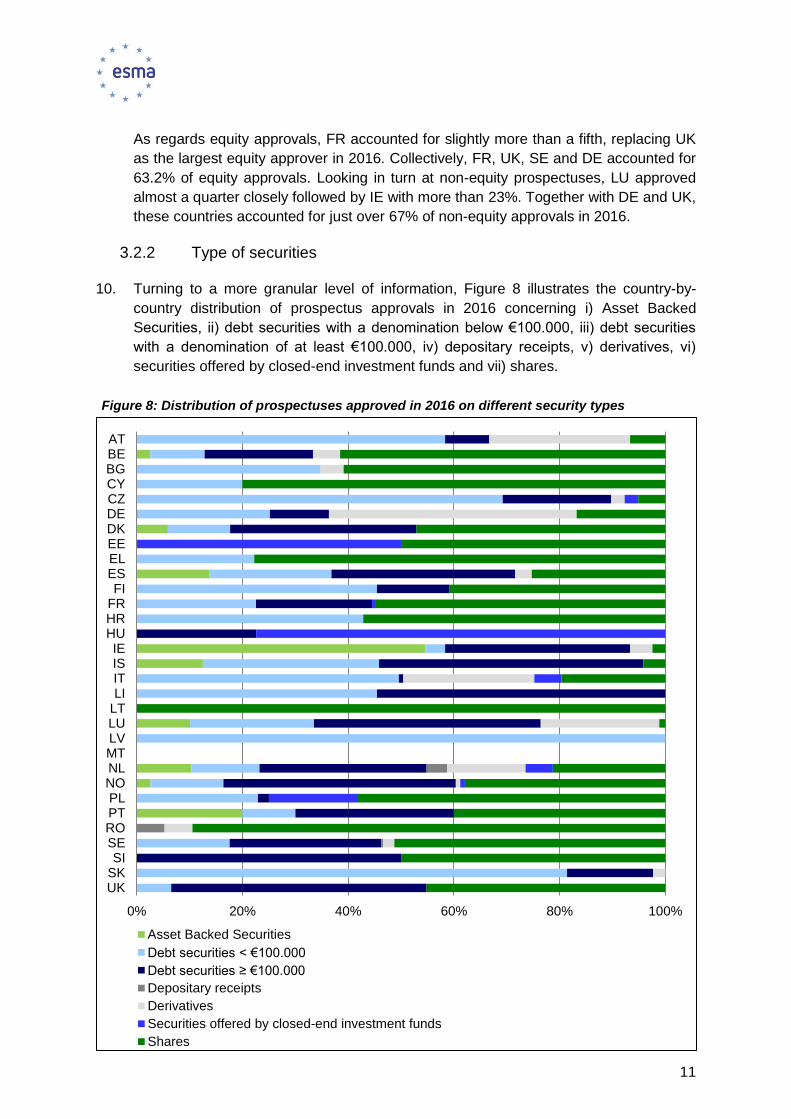
3.2.2 Type of securities
10. Turning to a more granular level of information, Figure 8 illustrates the country-by-
country distribution of prospectus approvals in 2016 concerning i) Asset Backed
Securities, ii) debt securities with a denomination below €100.000, iii) debt securities
with a denomination of at least €100.000, iv) depositary receipts, v) derivatives, vi)
securities offered by closed-end investment funds and vii) shares.
0% 20% 40% 60% 80% 100%
UKSKSI
SEROPTPLNONLMTLVLULTLIITISIE
HUHRFRFI
ESELEEDKDECZCYBGBEAT
Asset Backed Securities
Debt securities < €100.000
Debt securities ≥ €100.000
Depositary receipts
Derivatives
Securities offered by closed-end investment funds
Shares
Figure 8: Distribution of prospectuses approved in 2016 on different security types
12
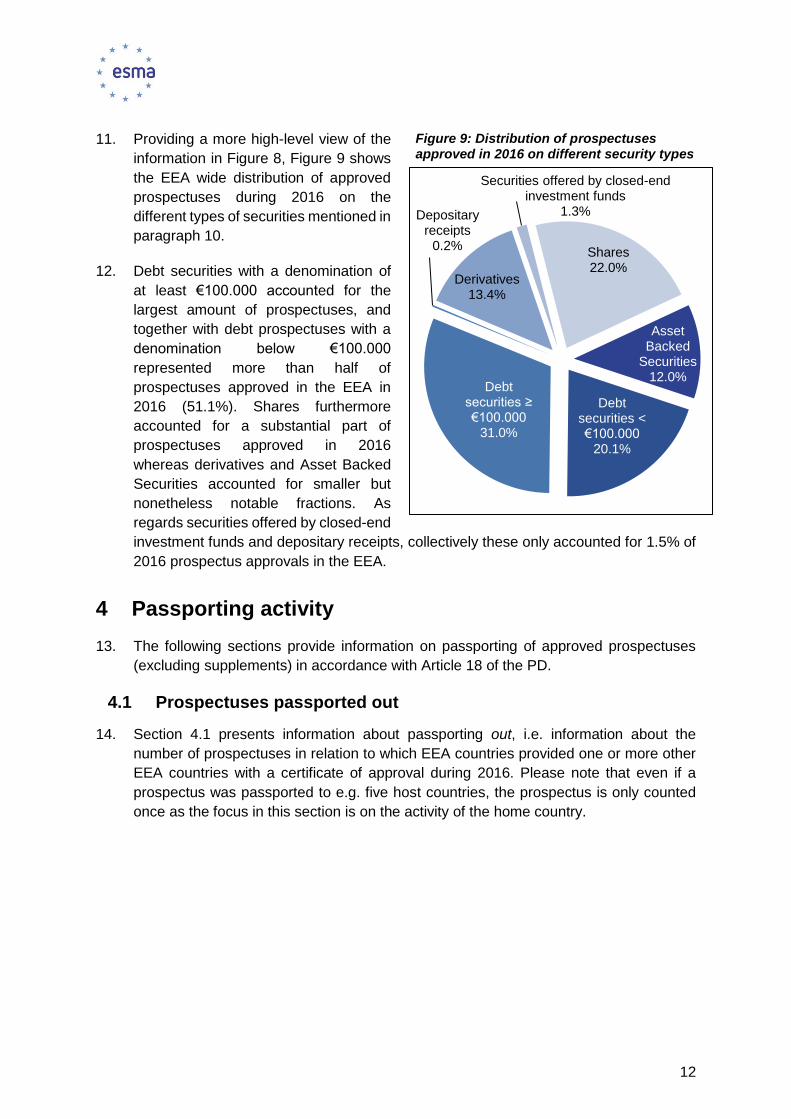
11. Providing a more high-level view of the
information in Figure 8, Figure 9 shows
the EEA wide distribution of approved
prospectuses during 2016 on the
different types of securities mentioned in
paragraph 10.
12. Debt securities with a denomination of
at least €100.000 accounted for the
largest amount of prospectuses, and
together with debt prospectuses with a
denomination below €100.000
represented more than half of
prospectuses approved in the EEA in
2016 (51.1%). Shares furthermore
accounted for a substantial part of
prospectuses approved in 2016
whereas derivatives and Asset Backed
Securities accounted for smaller but
nonetheless notable fractions. As
regards securities offered by closed-end
investment funds and depositary receipts, collectively these only accounted for 1.5% of
2016 prospectus approvals in the EEA.
4 Passporting activity
13. The following sections provide information on passporting of approved prospectuses
(excluding supplements) in accordance with Article 18 of the PD.
4.1 Prospectuses passported out
14. Section 4.1 presents information about passporting out, i.e. information about the
number of prospectuses in relation to which EEA countries provided one or more other
EEA countries with a certificate of approval during 2016. Please note that even if a
prospectus was passported to e.g. five host countries, the prospectus is only counted
once as the focus in this section is on the activity of the home country.
Asset Backed
Securities12.0%
Debt securities < €100.000
20.1%
Debt securities ≥ €100.000
31.0%
Depositary receipts
0.2%
Derivatives13.4%
Securities offered by closed-end investment funds
1.3%
Shares22.0%
Figure 9: Distribution of prospectuses approved in 2016 on different security types
13
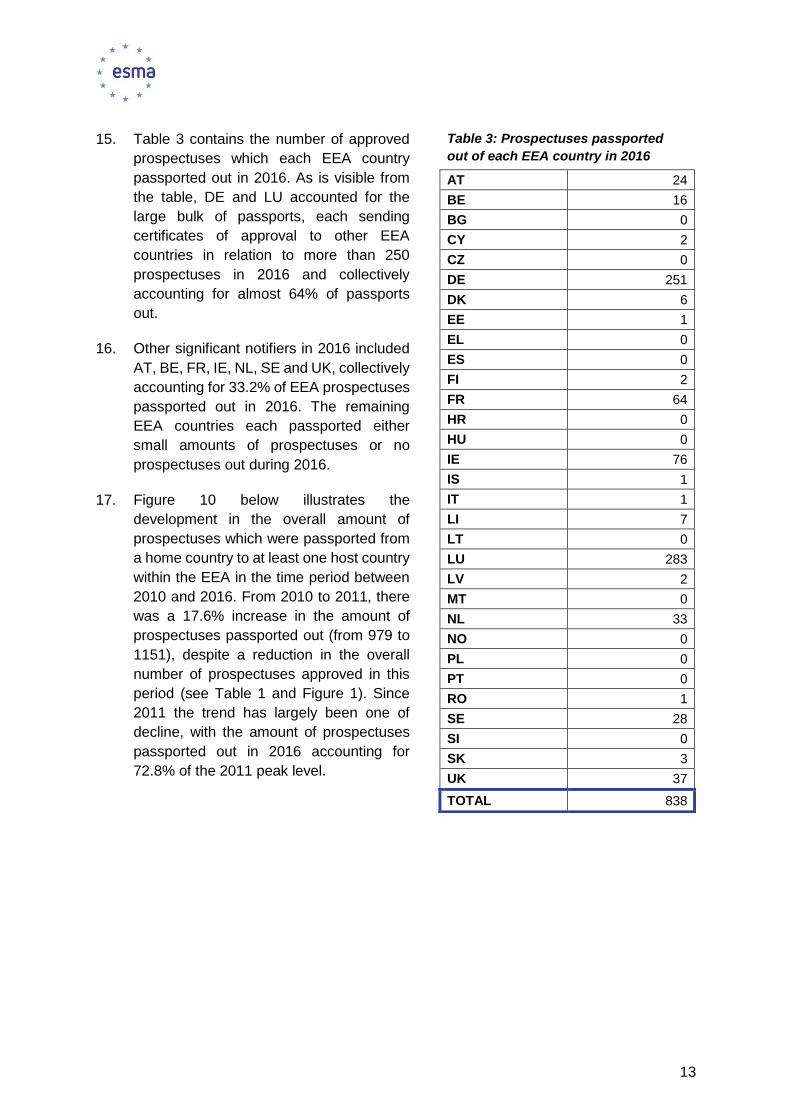
15. Table 3 contains the number of approved
prospectuses which each EEA country
passported out in 2016. As is visible from
the table, DE and LU accounted for the
large bulk of passports, each sending
certificates of approval to other EEA
countries in relation to more than 250
prospectuses in 2016 and collectively
accounting for almost 64% of passports
out.
16. Other significant notifiers in 2016 included
AT, BE, FR, IE, NL, SE and UK, collectively
accounting for 33.2% of EEA prospectuses
passported out in 2016. The remaining
EEA countries each passported either
small amounts of prospectuses or no
prospectuses out during 2016.
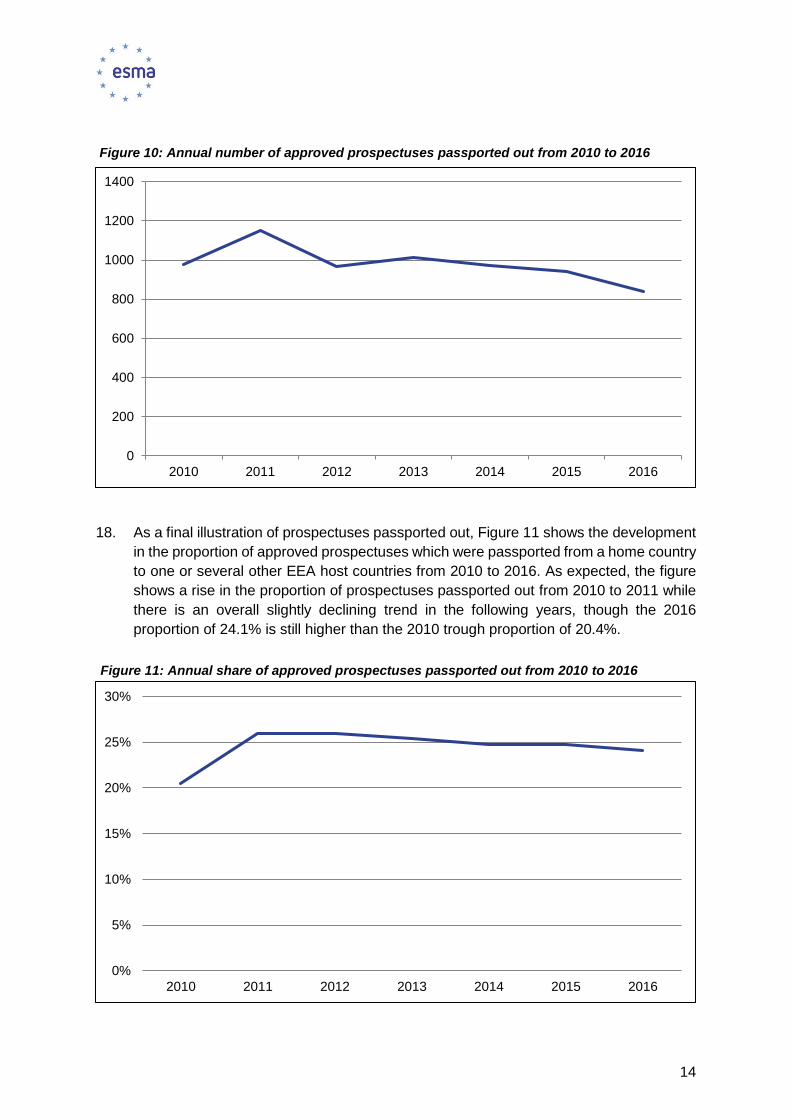
17. Figure 10 below illustrates the
development in the overall amount of
prospectuses which were passported from
a home country to at least one host country
within the EEA in the time period between
2010 and 2016. From 2010 to 2011, there
was a 17.6% increase in the amount of
prospectuses passported out (from 979 to
1151), despite a reduction in the overall
number of prospectuses approved in this
period (see Table 1 and Figure 1). Since
2011 the trend has largely been one of
decline, with the amount of prospectuses
passported out in 2016 accounting for
72.8% of the 2011 peak level.
Table 3: Prospectuses passported
out of each EEA country in 2016
AT 24
BE 16
BG 0
CY 2
CZ 0
DE 251
DK 6
EE 1
EL 0
ES 0
FI 2
FR 64
HR 0
HU 0
IE 76
IS 1
IT 1
LI 7
LT 0
LU 283
LV 2
MT 0
NL 33
NO 0
PL 0
PT 0
RO 1
SE 28
SI 0
SK 3
UK 37
TOTAL 838
14
18. As a final illustration of prospectuses passported out, Figure 11 shows the development
in the proportion of approved prospectuses which were passported from a home country
to one or several other EEA host countries from 2010 to 2016. As expected, the figure
shows a rise in the proportion of prospectuses passported out from 2010 to 2011 while
there is an overall slightly declining trend in the following years, though the 2016
proportion of 24.1% is still higher than the 2010 trough proportion of 20.4%.
Figure 10: Annual number of approved prospectuses passported out from 2010 to 2016
0
200
400
600
800
1000
1200
1400
2010 2011 2012 2013 2014 2015 2016
0%
5%
10%
15%
20%
25%
30%
2010 2011 2012 2013 2014 2015 2016
Figure 11: Annual share of approved prospectuses passported out from 2010 to 2016
15
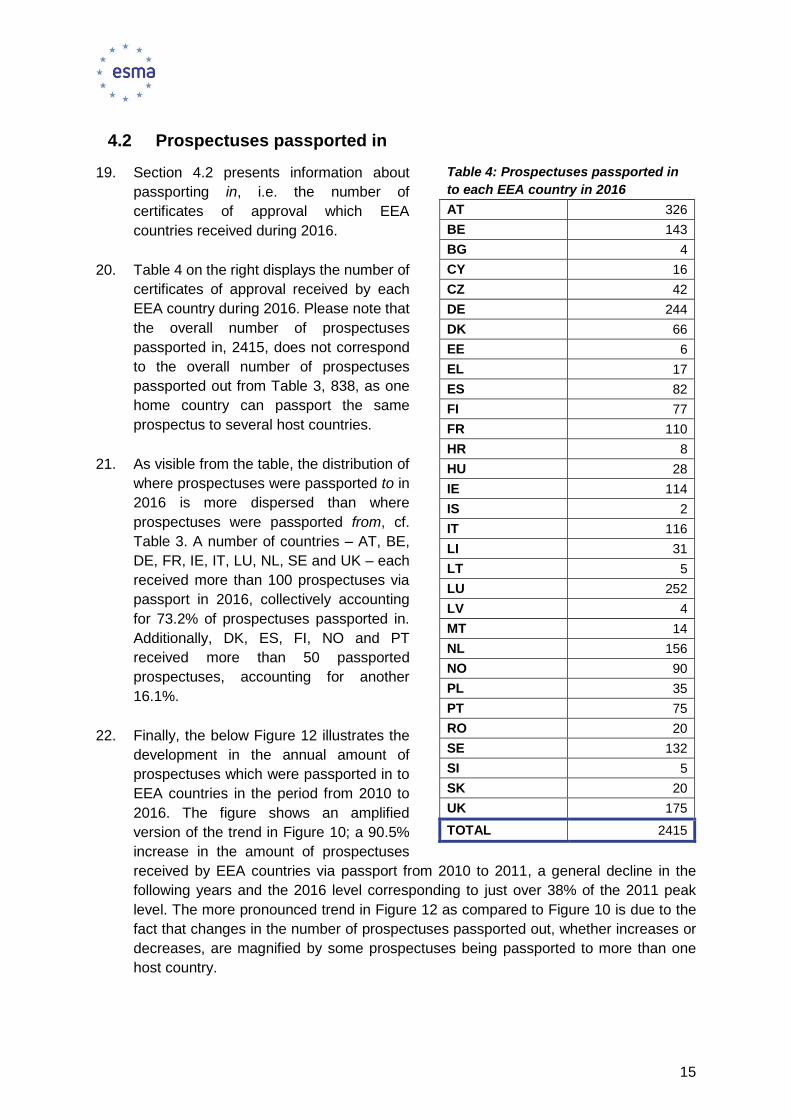
4.2 Prospectuses passported in
19. Section 4.2 presents information about
passporting in, i.e. the number of
certificates of approval which EEA
countries received during 2016.
20. Table 4 on the right displays the number of
certificates of approval received by each
EEA country during 2016. Please note that
the overall number of prospectuses
passported in, 2415, does not correspond
to the overall number of prospectuses
passported out from Table 3, 838, as one
home country can passport the same
prospectus to several host countries.
21. As visible from the table, the distribution of
where prospectuses were passported to in
2016 is more dispersed than where
prospectuses were passported from, cf.
Table 3. A number of countries – AT, BE,
DE, FR, IE, IT, LU, NL, SE and UK – each
received more than 100 prospectuses via
passport in 2016, collectively accounting
for 73.2% of prospectuses passported in.
Additionally, DK, ES, FI, NO and PT
received more than 50 passported
prospectuses, accounting for another
16.1%.
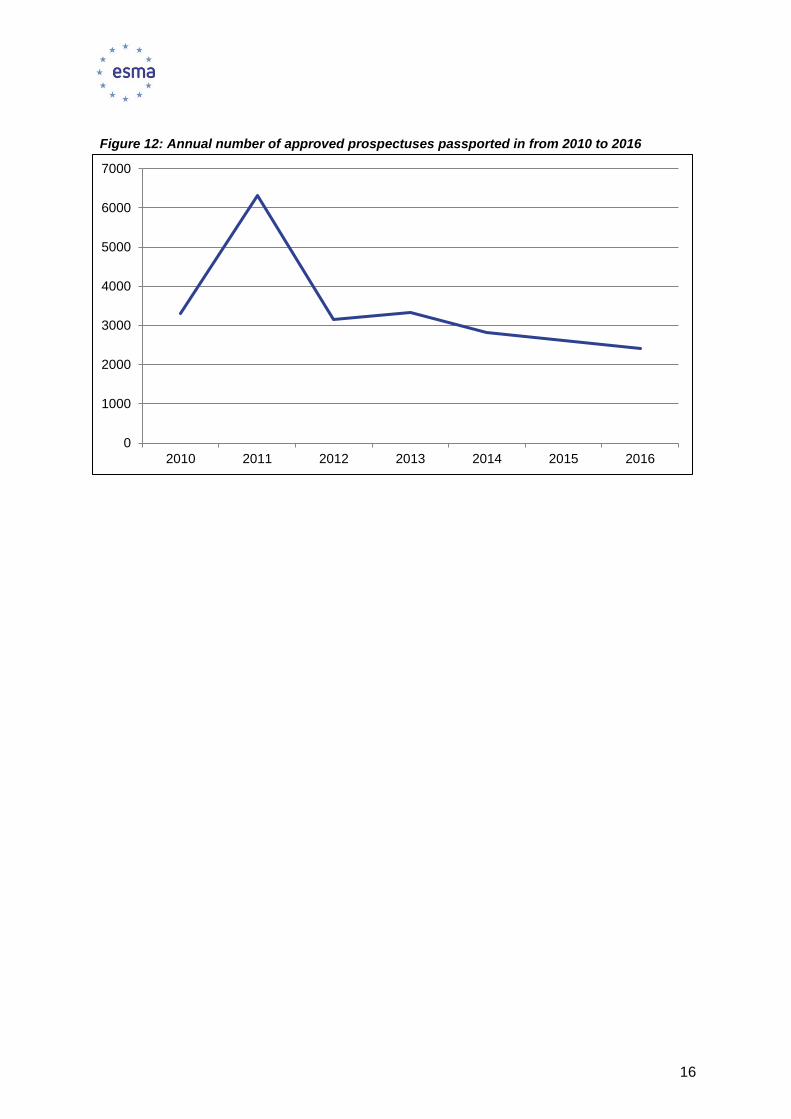
22. Finally, the below Figure 12 illustrates the
development in the annual amount of
prospectuses which were passported in to
EEA countries in the period from 2010 to
2016. The figure shows an amplified
version of the trend in Figure 10; a 90.5%
increase in the amount of prospectuses
received by EEA countries via passport from 2010 to 2011, a general decline in the
following years and the 2016 level corresponding to just over 38% of the 2011 peak
level. The more pronounced trend in Figure 12 as compared to Figure 10 is due to the
fact that changes in the number of prospectuses passported out, whether increases or
decreases, are magnified by some prospectuses being passported to more than one
host country.
Table 4: Prospectuses passported in
to each EEA country in 2016
AT 326
BE 143
BG 4
CY 16
CZ 42
DE 244
DK 66
EE 6
EL 17
ES 82
FI 77
FR 110
HR 8
HU 28
IE 114
IS 2
IT 116
LI 31
LT 5
LU 252
LV 4
MT 14
NL 156
NO 90
PL 35
PT 75
RO 20
SE 132
SI 5
SK 20
UK 175
TOTAL 2415
16
Figure 12: Annual number of approved prospectuses passported in from 2010 to 2016
0
1000
2000
3000
4000
5000
6000
7000
2010 2011 2012 2013 2014 2015 2016