Seaward AGL-5 Airfield Ground Lighting High Voltage HV Detector - Seaward High Voltage Products


REPORT DOCUMENTATION PAGE Form Approved OMB NO. 0704-0188
Long-Term Profile and Sediment Morphodynamics: Field Research Facility Case History Work Unit 32540
Donald K. Stauble
USAE Waterways Experiment Station Coastal Engineering Research Center 3909 Halls Ferry Road Vicksburg, MS 39180-6199
US Army Corps of Engineers Washington, DC 20314-1000
8. PERFORMING ORGANIZATION REPORT NUMBER
Technical Report CERC-92-7
10. SPONSORING I MONITORING AGENCY REPORT NUMBER
1 Technical Information Service, 5285 Port Royal Road,
I Approved for public release; distribution is unlimited. Surface sediment grab samples were collected along one profile line at the
Field Research Facility (FRF) at Duck, NC, over a 17.8-month period from March 1984 to September 1985. Profile surveys were taken about every 2 weeks, with sediment samples collected approximately once a month. Extra profile and sediment samples were collected after storms. This comprehensive data set of beach profiles, sediment, and wave and weather conditions provides a unique opportunity to examine natural profile changes and resulting changes in sedi- ment grain-size distribution along the entire length of an active profile and to test and evaluate models of beach profile/sediment interactions to changing coastal processes. Spatial changes indicate that the most active part of the profile at the FRF is the bar/trough area that alternately moves seaward after storms and migrates landward during fair weather wave conditions. The highest variability in sediment grain-size distributions occurred on the subaerial beach and foreshore area. The most stable sediment distributions occurred on
I Beach cross-shore sediment distributions Long-term beach Beach profile/sediment interaction profile change
OF THIS PAGE OF ABSTRACT
NSN 7540-01 -280-5500 Standard Form 298 (Rev. 2-89) Prescrlbed by ANSI 5td 239-18 298-102

the most stable nearshore area, seaward of 450 m from the baseline. High wave activity caused foreshore erosion and sediment migration seaward and alongshore. After high energy events, the sediments became coarser and more poorly sorted. Lower energy wave conditions for long periods of time created conditions of landward migration of the inner bar and accretion on the foreshore, with deposition of finer sediments. Any modeling effort requiring grain-size data should evaluate the cross shore variability of that particular beach and choose either a composite of the subaerial berm/foreshore portion of the beach or total profile to characterize the sediment distribution. Since most equations require a single value, the use of a beach or profile composite mean is suggested to give the best representation.

PREFACE
This report provides a summary of long-term profile and sediment morpho-
dynamics using data collected at the Field Research Facility (FRF) of the
Coastal Engineering Research Center (CERC), US Army Engineer Waterways Experi-
ment Station (WES). This research was authorized by Headquarters, US Army
Corps of Engineers (HQUSACE), under Civil Works Coastal Geology and
Geotechnology Program Work Unit 32540, "Use of Geological Characteristics to
Interpret Coastal Processes." Funds were provided through the WES, CERC,
Coastal Geology and Geotechnical Program under the management of
Dr. C. Linwood Vincent. The HQUSACE Technical Monitor was Mr. John F. C.
Sanda . This report was prepared by Dr. Donald K. Stauble, Research Physical
Scientist, Team Leader, Coastal Geology Unit (CGU), Coastal Structures and
Evaluation Branch (CS&E), Engineering Development Division (EDD), CERC, under
the direct supervision of Ms. Joan Pope, Chief, CS&E, and under the general
supervision of Mr. Thomas W. Richardson, Chief, EDD; Dr. James R. Houston,
Director, CERC; and Mr. Charles C. Calhoun, Jr., Assistant Director, CERC.
Mr. William A. Birkemeier, Chief, FRF, provided data on beach profiles,
sediment grain size, and waves and tides collected at the FRF. Computer
analysis and graphics were performed by Ms. Karen R. Pitchford, CS&E, and
Ms. Lynn Bessonette, Ms. Michelle Kindhart, Mr. Cory Kindhart, Ms. Claire
Livingston, and Ms. Elizabeth Sprehe of the CGU.
Dr. Robert W. Whalin was Director of WES during the publication of this
report. COL Leonard G. Hassell, EN, was Commander and Deputy Director.

CONTENTS
Paze
PREFACE . . . . . . . . . . . . . . . . . . . . . . . . . . . . . . . . . . . . . . . . . . . . . . . . . . . . . . . . . . . . . . . . . . 1 LIST OF TABLES . . . . . . . . . . . . . . . . . . . . . . . . . . . . . . . . . . . . . . . . . . . . . . . . . . . . . . . . . . . 3 LIST OF FIGURES . . . . . . . . . . . . . . . . . . . . . . . . . . . . . . . . . . . . . . . . . . . . . . . . . . . . . . . . . . 3 PART I: INTRODUCTION . . . . . . . . . . . . . . . . . . . . . . . . . . . . . . . . . . . . . . . . . . . . . . . . . . 5
PART 11: PROFILE DATA . . . . . . . . . . . . . . . . . . . . . . . . . . . . . . . . . . . . . . . . . . . . . . . . . . 9
. . . . . . . . . . . . . . . . . . . . . . . . . . . . . . . . . . . . . . . . . . . . . . . . . PART 111: SEDIMENT DATA 12
PART IV: WAVE AND WATER LEVEL DATA . . . . . . . . . . . . . . . . . . . . . . . . . . . . . . . . . . . . . 24 PART V: RESULTS . . . . . . . . . . . . . . . . . . . . . . . . . . . . . . . . . . . . . . . . . . . . . . . . . . . . . . . 32
Profile Changes . . . . . . . . . . . . . . . . . . . . . . . . . . . . . . . . . . . . . . . . . . . . . . . . . . . . 32 Sediment Grain-Size Distributions . . . . . . . . . . . . . . . . . . . . . . . . . . . . . . . . . . 39 Use of Composites . . . . . . . . . . . . . . . . . . . . . . . . . . . . . . . . . . . . . . . . . . . . . . . . . . 58 Erosion/Accretion Calculations . . . . . . . . . . . . . . . . . . . . . . . . . . . . . . . . . . . . . 63
. . . . . . . . . . . . . . . . . . . . . . . . . . . . . . . . . . . PART VI: SUMMARY AND RECOMMENDATIONS 69
REFERENCES . . . . . . . . . . . . . . . . . . . . . . . . . . . . . . . . . . . . . . . . . . . . . . . . . . . . . . . . . . . . . . . 73 . . . . . . . . . . . . . . . . . . . . . . . . . . . . . . . . . . . . . . . . APPENDIX A: PROFILE CHANGE PLOTS A1
APPENDIX B: SEDIMENT DATA . . . . . . . . . . . . . . . . . . . . . . . . . . . . . . . . . . . . . . . . B1

LIST OF TABLES
No. PaRe . . . . . . . . . . . . . . . . . . . . . . . . . . . . . . . . . . . . . . . . . . . . . 1 Summary of Profile Data 10
. . . . . . . . . . . . . 2 Conversion Chart of Sediment Grain Size Classifications 20 3 Dates of High Wave Height and Wave Power . . . . . . . . . . . . . . . . . . . . . . . . . . . . 31 4 Volume Changes Between Profiles . . . . . . . . . . . . . . . . . . . . . . . . . . . . . . . . 37
LIST OF FIGURES
No.
Location map of the FRF . . . . . . . . . . . . . . . . . . . . . . . . . . . . . . . . . . . . . . . . . . . . . . . . . . . . . . Location of Profile Line 62 on plan view of FRF survey area
. . . . . . . . . . . . . Examples of typical profile configurations during study Profiles and sediment sampling locations from 20 March 1984
. . . . . . . . . . . . . . . . . . . . . . . . . . . . . . . . . . . . . . . . . . . . . . . to 6 September 1985 . . . . . . . . . . . . . . . . . . . . . . . . . . . . . . . . . . . . . . . FRF Survey Line 62, 1989-1985
Time line of wave and water level records with profile survey and . . . . . . . . . sediment collection times, tide and wave height, Gage 625
Time line of calculated wave power for Gage 625 with profile . . . . . . . . . . . . . . . . . . . . . . . . . . . . . . survey and sediment collection times
Prospective view of Profile 62 morphology changes through the study period . . . . . . . . . . . . . . . . . . . . . . . . . . . . . . . . . . . . . . . . . . . . . . . . . . . . . .
. . . . . . . . . . . . . . . . . . . . . . . . Cumulative volume changes on Profile Line 62 Time series of deepwater wave power and wave steepness compared
. . . . . . . . . . . . . . . . . . . . . . . . . . . . with bar crest and berm crest position Sediment sample grouping across the profile with the components of the four composite samples . . . . . . . . . . . . . . . . . . . . . . . . . . . . . . . . . . . . . . . .
Example of frequency curves of sediment samples located on the dune at Stations 1 and 2 . . . . . . . . . . . . . . . . . . . . . . . . . . . . . . . . . . . . . . . . . .
Plots of mean grain size versus sorting for all samples from . . . . . . . . . . . . . . . . . . . . . . . . . . . . . . Stations 1 and 2 located in the dune
Example of frequency curves of sediment samples located on the beach at Stations 3, 4, 5, and 6 . . . . . . . . . . . . . . . . . . . . . . . . . . . . . . . . . .
Plots of mean grain size versus sorting for all samples in the beach group . . . . . . . . . . . . . . . . . . . . . . . . . . . . . . . . . . . . . . . . . . . . . . . . . . . . . . .
Example of frequency curves of sediment samples located in the . . . . . . . . . . . . . . . . . . . . . . . bar/trough area at Stations 7, 8, 9, and 10
Plots of mean grain size versus sorting for all samples in the . . . . . . . . . . . . . . . . . . . . . . . . . . . . . . . . . . . . . . . . . . . . . . . . . . bar/trough group
Examples of frequency curves of sediment samples located in the . . . . . . . . . . . . . . . . . . . . . . . . nearshore group at Stations 12, 15, and 17
Plots of mean grain size versus sorting for all samples in the nearshore group . . . . . . . . . . . . . . . . . . . . . . . . . . . . . . . . . . . . . . . . . . . . . . . . . . . . .
Plots of mean grain size versus sorting of dune, beach, bar/trough, and nearshore groups . . . . . . . . . . . . . . . . . . . . . . . . . . . . . . . . . . . . . . . . . . . . . .
Sediment grain-size distributions across a well-developed inner . . . . . . . . . . . . . . . . . . . . . . . . . . . . . . . . . bar profile during 2 October 1984
Sediment grain-size distributions across a shallow inner bar profile during 21 August 1985 . . . . . . . . . . . . . . . . . . . . . . . . . . . . . . . . . . . . .
Plots of composite mean grain size versus composite sorting of the four sediment groups . . . . . . . . . . . . . . . . . . . . . . . . . . . . . . . . . . . . . . . . . . . . . .
Page
7 8 11

No. Page
2 4 Composite grain-size distributions changes through time . . . . . . . . . . . . . 6 1 25 Profile composite grain-size distribution changes through time
. . . . . . . . . . . . . . . . . . . . . . . . . . . . . . . . . . . . . . . . . . . and mean versus sorting 6 2 26 Time series of variation in composite means of beach. nearshore.
and profile with wave power and wave steepness . . . . . . . . . . . . . . . . . . . . 6 4 . . . . . . 27 Erosion/accretion prediction using median grain size (D, ) data 6 6
. . . . . . . . . . . . . 2 8 Erosion/accretion prediction using mean grain-size data 67

LONG-TERM PROFILE AND SEDIMENT MORPHODYNAMICS:
FIELD RESEARCH FACILITY CASE HISTORY
PART I: INTRODUCTION
1. This report provides an examination of the interaction between long-
term beach and nearshore profile changes and sediment grain-size distributions
across the profile. At the present, there is little guidance on the modeling
of sediment grain-size parameters in cross-shore changes in the beach profile.
This is the first report on the use of geological characteristics in interpre-
tation of coastal processes. It will focus on the morphodynamics (the change
in morphology due to the dynamics of coastal processes) of an oceanfront beach
over a 535-day period. The beach is constantly reshaping its profile and
sediment composition as it is being influenced by ever changing wave, wind,
tides, and longshore currents. A better understanding of this complex inter-
action is needed to improve beachfront erosion control and storm protection
project design.
2. A unique data set of long beach profiles stretching from the dune
out 1,000 m into the nearshore is being collected on a continuous basis at the
Field Research Facility (FRF) of the US Army Engineer Waterways Experiment
Station (WES), Coastal Engineering Research Center (CERC). This facility was
established to provide research and development capability for field studies
in coastal processes and shoreline response. As part of the operation, a
long-term data set of waves, currents, tides, atmospheric conditions, and
beach profile changes is continuously being collected. As a supplement to
this data collection, surface sediment grab samples were collected along one
profile line over a 17.8-month period from March 1984 to September 1985. Pro-
file surveys were taken on an approximately 2-week schedule, with the sediment
samples collected approximately once a month. Extra profiles and sediment
samples were collected after storms.
3. This continuing collection of data is unique in providing a long-
term data set of accurate profile response to coastal processes. With the
addition of sediment samples for the study period, spatial coverage is pro-
vided along the profile over a long temporal period, with concomitant wave,
weather, and water-level information. This comprehensive data set provides a

unique opportunity to examine the natural profile changes and resulting
changes in the sediment grain size distribution along the entire length of the
active profile and to test and evaluate models of beach profile/sediment
interactions to changing coastal processes.
4. The ERF is located just north of the village of Duck, NC, on a nar-
row barrier spit that is part of the outer banks barrier island and spit
complex fronting the Atlantic Ocean (Figure 1). The facility contains a
shore-normal 561-m-long research pier and 1,200 m of beachfront. General
information on the ERE is found in Birkemeier et al. (1985), and information
on the geology is found in Meisburger and Judge (1989).
5. The data used in this report were collected on Profile Line 62,
located 489.21 m north of the pier as shown on Figure 2. This line is located
outside the influence of the pier (Miller, Birkemeier, and DeWall 1983).
Data on profiles have been collected on a continuous basis on this line (as
well as three others) since January 1981 (Howd and Birkemeier 1987). A sys-
tematic collection of sediment data began on 20 March 1984 and continued until
6 September 1985. During this study period, 41 profiles were surveyed, with
21 containing sediment data. The sampling period extended across the seasonal
cycle at the ERE, which is somewhat typical of most US east coast beaches,
consisting of extratropical storms (northeasters) commonly occurring during
the winter months from September to May with fair weather conditions during
the summer months. No tropical storms (occurring in the summer months from
June to October) impacted the area during the study period. Only a few extra-
tropical storms of major proportion occurred during the study.

A TLANTlC
V I R G I N I A .
NORTH CAROLINA .
RESEARCH
. . .
Figure 1. Location map of the FRF

PROFILE LINE 62
RESEARCH PlER
DISTRNCE, M
FRF BATHYMETRY 27 NOV 84 CONTOURS IN METERS
Figure 2. Location of Profile Line 62 on plan view of FRF survey area

PART 11: PROFILE DATA
6 . The beach profile data were collected from a shore-parallel baseline
landward of the dune out to a depth of between -8 to -9 m, which extended up
to 1,000 m seaward of the baseline on the longer profiles. All profiles were
referenced to the 1929 National Geodetic Vertical Datum (NGVD). Collection
was approximately biweekly, but varied between each individual profile. Some
profiles closely bracketed storm events.
7 . All profiles were surveyed using the ERE Coastal Research Amphibious
Buggy (CRAB) for the subaqueous portion of the profile. (See Birkemeier and
Mason (1984) for details on the CRAB.) The dry beach and dune portions of the
profile were surveyed by standard rod method, placing the rod at regular
intervals or breaks in slope along the profile between the regular intervals
(Howd and Birkemeier 1987). A Zeiss Elta-2 electronic surveying instrument
was used to collect the profile data.
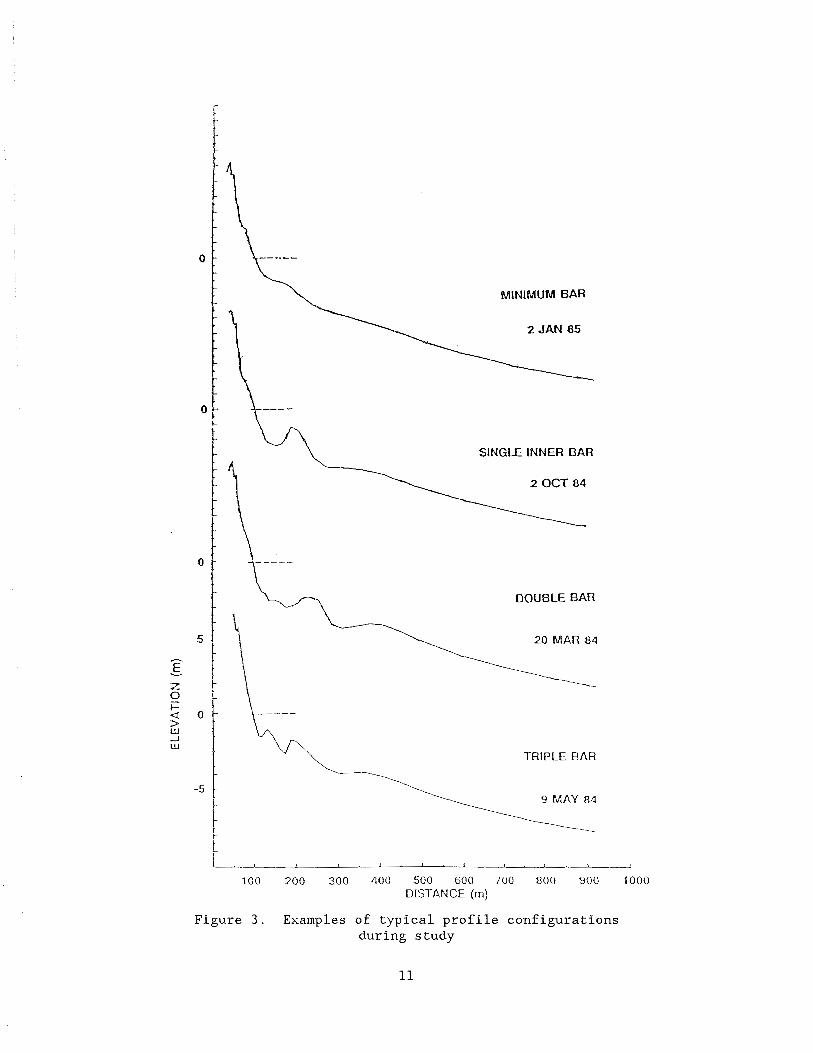
8. Pertinent data on the profiles used in this report are given in
Table 1. The time scale of these data allows resolution from a few days to
17.8 months. Howd and Birkemeier (1987) described five profile configurations
found at the FRF ranging from a minimal to a triple bar. Four of these pro-
file types were observed during the study ranging from (a) the minimal bar
feature, with a concave profile shape; (b) single inner bar centering around
200 m seaward of the baseline; (c) double bar with a prominent inner bar and a
lower relief outer bar centering around 350 m from the baseline; and (d) tri-
ple bar with two bars in the inner region between 100 and 200 m, and the outer
bar around 350 m. Figure 3 shows an example profile from each of the four
categories. The most common profile type during the study period was the
single inner bar. The profile data were analyzed and plotted using the Inter-
active Survey Reduction Program (ISRP) as described in Birkemeier (1984).

Table 1
Summary of Profile Data
Date
20 Mar 84 2 Apr 84 6 Apr 84 13 Apr 84 25 Apr 84 9 May 84 14 May 84 24 May 84 1 Jun 84 13 Jun 84 28 Jun 84 9 Jul 84 21 Jul 84 27 Jul 84 11 Aug 84 30 Aug 84 6 Sep 84 10 Sep 84 20 Sep 84 2 Oct 84 7 Oct 84 16 Oct 84 29 Oct 84 27 Nov 84 13 Dec 84 2 Jan 85 5 Jan 85 25 Jan 85 14 Feb 85 1 Mar 85 15 Mar 85 26 Mar 85 23 Apr 85 9 May 85 31 May 85 20 Jun 85 15 Jul 85 24 Jul 85 7 Aug 85 21 Aug 85 3 Sep 85 6 Sep 85
Profile No.
141 143 144 145 146 147 148 149 150 151 152 153 154 155 156 157 158 159 160 161 162 163 165 167 168 169 170 171 173 174 175 176 178 179 180 181 182 184 185 186 187 188
Length m
934.1 980.2 924.3 1055.5 950.5 926.6 926.0 977.9 965.3 1005.4 983.3 991.3 987.2 983.1 987.6 988.8 925.9 687.3 976.2 903.0 678.0 786.6 992.2 966.7 928.9 934.8 755.1 911.4 944.8 926.8 981.3 809.5 1017.0 920.2 941.3 946.4 990.8 780.7 919.4 965.2 995.9 968.9
Profile T Y D ~
Double Bar Double Bar Double Bar Double Bar Triple Bar Triple Bar Triple Bar Triple Bar Inner Bar Inner Bar Inner Bar Inner Bar Inner Bar Inner Bar Inner Bar Minimal Bar Minimal Bar Inner Bar Inner Bar Inner Bar Inner Bar Inner Bar Inner Bar Inner Bar Inner Bar Minimal Bar Inner Bar Inner Bar Inner Bar Inner Bar Inner Bar Inner Bar Minimal Bar Inner Bar Inner Bar Inner Bar Inner Bar Inner Bar Inner Bar Inner Bar Minimal Bar Minimal Bar
Sediments Collected
Yes no no no no no no no no no no no no no yes* no no Yes Yes Yes no Yes Yes Yes no Yes Yes Yes Yes Yes Yes no no Yes Yes Yes Yes no Yes Yes no Yes
* Above NGVD only.
10
\ MINIMUM BAR
2 JAN 85
\ SINGLE INNER BAR
DOUBLE BAR
TRIPLE BAR
9 MAY 84
C 1 1 - 1 . q J I
100 200 300 400 500 600 700 800 900 1000 DISTANCE (m)
Figure 3. Examples of typical profile configurations during study
PART 111: SEDIMENT DATA
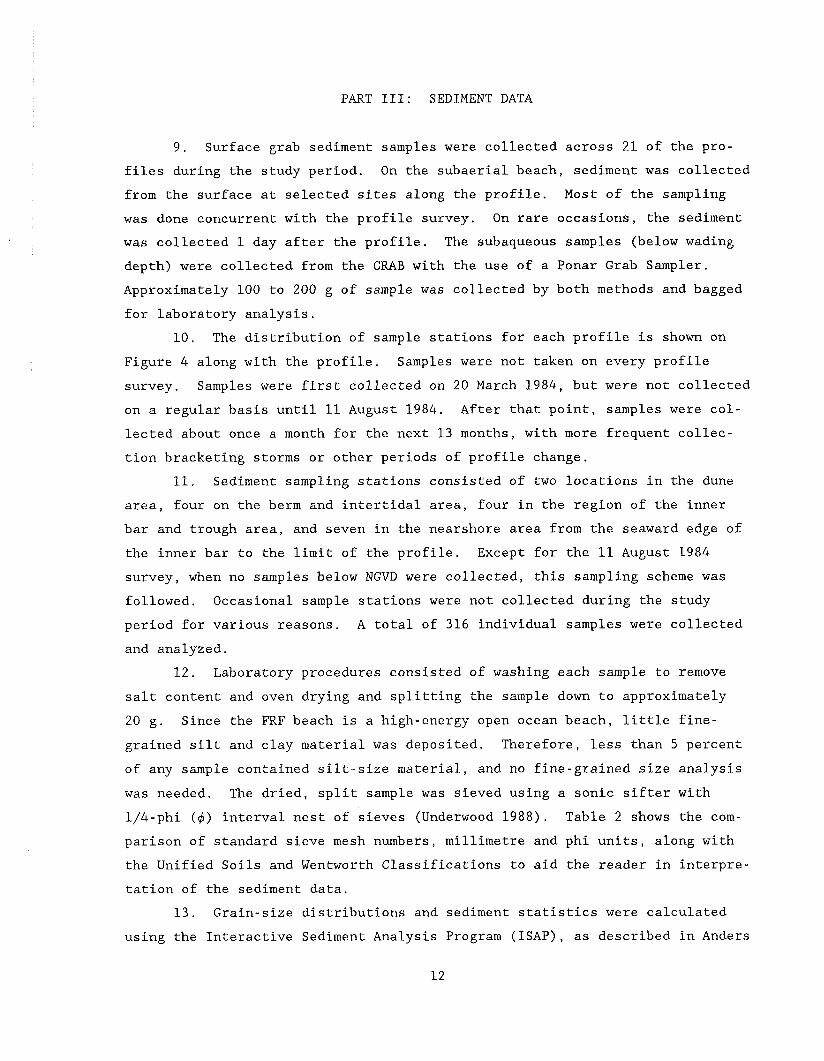
9. Surface grab sediment samples were collected across 21 of the pro-
files during the study period. On the subaerial beach, sediment was collected
from the surface at selected sites along the profile. Most of the sampling
was done concurrent with the profile survey. On rare occasions, the sediment
was collected 1 day after the profile. The subaqueous samples (below wading
depth) were collected from the CRAB with the use of a Ponar Grab Sampler.
Approximately 100 to 200 g of sample was collected by both methods and bagged
for laboratory analysis.
10. The distribution of sample stations for each profile is shown on
Figure 4 along with the profile. Samples were not taken on every profile
survey. Samples were first collected on 20 March 1984, but were not collected
on a regular basis until 11 August 1984. After that point, samples were col-
lected about once a month for the next 13 months, with more frequent collec-
tion bracketing storms or other periods of profile change.
11. Sediment sampling stations consisted of two locations in the dune
area, four on the berm and intertidal area, four in the region of the inner
bar and trough area, and seven in the nearshore area from the seaward edge of
the inner bar to the limit of the profile. Except for the 11 August 1984
survey, when no samples below NGVD were collected, this sampling scheme was
followed. Occasional sample stations were not collected during the study
period for various reasons. A total of 316 individual samples were collected
and analyzed.
12. Laboratory procedures consisted of washing each sample to remove
salt content and oven drying and splitting the sample down to approximately
20 g. Since the FRF beach is a high-energy open ocean beach, little fine-
grained silt and clay material was deposited. Therefore, less than 5 percent
of any sample contained silt-size material, and no fine-grained size analysis
was needed. The dried, split sample was sieved using a sonic sifter with
1/4-phi (4) interval nest of sieves (Underwood 1988). Table 2 shows the com-
parison of standard sieve mesh numbers, millimetre and phi units, along with
the Unified Soils and Wentworth Classifications to aid the reader in interpre-
tation of the sediment data.
13. Grain-size distributions and sediment statistics were calculated
using the Interactive Sediment Analysis Program (ISAP), as described in Anders

0
0 20 MAR 8 4
0
0
6 APR 84
0
13 APR 8 4
I
c'
4-d
a 0 aJ - 2'5 APR 8 4 W
-5 Profile ~ i n e 62 - 9 MAY 8 4
100 200 300 400 500 600 700 800 900 1000
Distance. M
a. March to May 1984
Figure 4. Profiles and sediment sampling locations from 20 March 1984 to 6 September 1985 (Sheet 1 of 7)
13

14 H A Y 84
2 4 H A Y 84
1 JUN 84
13 JUN 84
28 JUN 84
Proflle L l n e 6 2 9 JUL 84
D is tance. M
b . May t o J u l y 1984
Figure 4 . (Sheet 2 o f 7 )

21 JUL 84
27 JUL 84
11 AUG 84
30 AUG 8 4
6 SEP 84
Profile Line 6 2 10 SEP 84
Distance. H
c. July to September 1984
Figure 4. (Sheet 3 of 7)

Distance. W
d . September through November 1984
Figure 4. (Sheet 4 of 7)

13 OEC 84
2 JAN 85
5 JAN 85
25 JAN 8 5
14 FEE 85
I
13 OEC 84
2 JAN 85
I
5 JAN 85
25 JAN 8 5
14 FEE 85
P r o f ~ l e Line 62 1 WAR 85
100 200 300 400 500 600 700 BOO 900 1000
Olstance. H
e. December 1984 to March 1985
Figure 4 . (Sheet 5 of 7)

9 HAY 85
Distance. H
f . March through June 1985
Figure 4 . (Sheet 6 of 7 )

15 JUL 85
24 JUL 85
\
7 AUG 85
\ j 4 21 AUG 85
Distance. M
g. July to September 1985
Figure 4. (Sheet 7 of 7)

Table 2
Conversion Chart of Sediment Grain-Size Classifications
PHI SIZE
- 12 .0 - 1 0 . 0 - 8 .0
1 - 7 . 0 - 6 .75 -6 .5 - 6 .25 -6 .0 - 5 . 7 5 - 5 .5 - 5 .25 - 5 .0 - 4 .75 - 4 . 5 - 4 .25 - 4 . 0 - 3 .75 - 3 .5 - 3 .25 - 3 . 0 - 2 . 7 5 - 2 .5 - 2 . 2 5 - 2 . 0 -1.75 - 1 .5 - 1 . 2 5 -1.0 - 0 .75 - 0 .5 - 0 .25
0 . 0 0 .25 0 . 5 0 . 7 5 1 . 0 1.25 1 .5 1 . 7 5 2 . 0 2 .25 2 .5 1 2 . 7 5 3 . 0
WENTWORTH MM SIZE
4096.00 1024.00
256 .OO 128.00 107.64 90 .51 76 .00 64.00 58.82 45.26 38.00 32.00 26.9 1 22.63 19.00 16 .00 13.45 11.31
9 .51 8 .00 6 .73 5 .66 4 .76 4 .00 3 .36 2.85 2 .35 2.00 1.68 1 .41 1.19 1 .OO 0 .84 0 .71 0 .59 0 .50 0 . 4 2 0 .35 0.30 0 .25 0 .210 0 .177 0 . 1 4 9 0 .125
CLASSIFICATION
BOULDER
COBBLE
PEBBLE
GRANULE
Very Coarse
Coarse
. Medium
Fine
Very Fine
ASTM MESH
2.5 3 3 .5 4 5 6 7 8
10 12 14 16 18 2 0 2 5 3 0 35 4 0 45 50 6 0 70 8 0
100 120
G
R
A
V
E
L
S
A
N
D
I
UNIFIED SOILS CLASSIFICATION
COBBLE
COARSE GRAVEL
FINE GRAVEL
SILT
CLAY
S
A
N
D
140 170 200 230 270 325 400
Coarse
Medium
Fine
SILT
CLAY
COLLOID
0 .105 3 . 2 5 0 . 0 8 8 1 3 . 5 0.074 3 . 7 5 0 .0625 1 4 .0
M
U
D
0 .053 ' 0.044 0.037 0 . 0 3 1 0 .0156 0 .0078 0 .0039 0 .0020 0 .00098 0 .00049 0 .00024 0 .00012 0 .00006
4 .25 4 .5 4 .75 5 . 0 6 . 0 7 . 0 8 . 0 9 . 0
1 0 . 0 1 1 .O 12 .0 13 .0 14 .0

et al. (in preparation). The output of the program provided several sediment
size statistics and provided graphic capability to produce frequency, cumula-
tive frequency, histograms, and probability curves of the individual sediment
samples. Mean and sorting values included in this report were calculated
using the method of moments (Friedman and Sanders 1978). The median values
were calculated by graphic formulas (Folk 1974). The program also calculated
composite samples, combining individual samples mathematically to produce
composite sediment statistics and graphics.
14. Sediment sample statistics are used to characterize the sediment
grain-size distribution. Beach sediments can be composed of several types of
minerals such as quartz, feldspar, carbonate shell material, and heavy min-
erals. The FRF beach contains primarily quartz sand with secondary components
of rock fragments of granule size, some shell material, heavy minerals, mica,
glauconite pellets, and foraminifera1 tests (Meisburger and Judge 1989). The
main statistical descriptors used here to describe the sediment are the first
moment (mean grain size), second moment (standard deviation representing the
degree of sorting), and the median or D,. While these values are good single-
value descriptors of the sediment, the entire grain-size distribution is
needed to show the variation that encompasses the size range common to this
coast. Grain.-size distributions are illustrated using a frequency curve.
15. The sediment sampling scheme attempted to locate the sample at the
same distance seaward of the baseline during each sampling period. Figure 5
shows the average locations of the 17 samples with the range at each station.
For the most part, the 21 sediment sampling periods collected sediment within
a narrow across-profile position. The sampling positions varied more in the
nearshore area as the spacing between stations increased. The first and last
profiles are plotted to show the envelope of elevation change and position of
the berm, bar, and trough relative to the station locations with time. The
general trend was for the sediment to become finer in the offshore direction.
An average of all the means for each station from Station 1 in the dune to
Station 17 in the nearshore region showed this trend (Figure 5 ) , except for
Station 3 at the base of the dune and Station 6 on the foreshore, which were
coarser than the surrounding stations. The stations on the beach (Stations 3
through 6) had the highest range of standard deviation. The narrowest range
in standard deviation over the study period occurred in the far nearshore
region (Stations 14 through 17).

FINE 4.0 r
LEGEND
-AVERAGE MEAN
COARSE -0.5 I I I I I I I 1
0 2 4 6 8 10 12 14 16
DUNE SAMPLE NUMBER NEARSHORE
a. Average mean grain-size distribution with standard deviation across profile
LEGEND
- - - 20 MAR 84 - 6 SEP 85 r 17 MEAN SAMPLE LOCATION
RANGE
-rol I I I I I I I I I I 0 100 200 300 400 500 600 700 800 900 1000
DISTANCE. m
b . Mean and range of sample locations shown on envelope qf profiles over study period
Figure 5. FRF Survey Line 62, 1984-1985

16. Bascom (1959) characterized the variation in grain-size distribu-
tions across several Pacific Coast beaches. Based on a reference sample
located in the midtide beach face, the trend was for samples landward of this
reference point on the berm to be coarser and then to become finer into the
dune area. In the offshore direction, samples at the plunge point (just sea-
ward of the backwash, shore break interaction area) were the coarsest, with a
fining of samples with increasing depth and distance offshore. The largest
grain sizes are found at the areas of highest turbulence, with decrease in
size with decreasing turbulence. The mean size distribution at the FRF gener-
ally fits this model. The mean grain size becomes progressively finer in the
offshore direction. Samples were not consistently collected at the plunge
point at the base of the foreshore for this experiment, so the coarsest sedi-
ment may have been missed.
17. A somewhat anomalous condition exists at the FRF in that the coars-
est material measured was located at Station 3 in the vicinity of the base of
the dune rather than the top of the summer berm as found by Bascom (1959).
The mean of the dune samples also was coarser than some of the beach samples,
possibly because the dunes were man-made in the 1930's by a Work Projects
Administration project and were not solely a product of eolian transport.

PART IV: WAVE AND WATER LEVEL DATA
18. Wave heights and periods have been collected at the FRF on a con-
tinuous basis at various gages. Gage 625, a Baylor wave staff located near
the end of the research pier (Figure 2), was used in this study, since it had
the most complete data during the study period. Data were sampled at 4 Hz,
every 6 hr for 20 min, with hourly readings during storms (Howd and Birkemeier
1987). During some storms, Gage 625 was in the breaker zone and gave breaking
wave readings. During these times and when the gage was otherwise inoperable,
data were transformed into the pier from Gage 620, a Waverider buoy located in
18 m of water, some 2.1 km eastward from the baseline on the dune, directly in
line with the pier (Birkemeier et al. 1985). These data were transformed into
the depth of the pier using a method developed by Hallermeier (1983).
19. A tide gage maintained by the National Oceanographic and Atmo-
spheric Administration, National Ocean Service (NOAA/NOS), at the seaward end
of the pier (Figure 2) recorded the water levels due to tidal fluctuations and
storm surge. The total water level was used to give an identification of
storm surge as a forcing function to profile and sediment change.
20. Figure 6 shows the time-averaged record of the wave height and
water level relative to the profile surveys and sediment sampling. The sea-
sonal cycle in wave height can be seen with low waves occurring during the
summer months of June through August. Only one event of higher waves (just
reaching 2-m heights) occurred 2-3 August 1985. Higher frequencies of extreme
events (waves greater than 2 m and elevation of water level above normal tidal
variations) occurred during the fall, winter, and spring months of 1984 and
1985. Approximately one event occurred within each fall, winter, and spring
monthly period during the study. Several times during the study, the wave
height was greater than 2 m. Some of these events were accompanied with ele-
vated water levels, indicative of a storm surge. The highest waves recorded
during the study were greater than 3 m and occurred from 11 to 17 October
1984. Otherwise, the entire study period from March 1984 to September 1985
was relatively free from major storm events.
21. In an effort to identify high wave events that would affect profile
change and sediment distribution, wave power was calculated and plotted for
the study period (Figure 7). The wave power was calculated from the wave


1
I ,
* = SEDIMENT SAMPLES I
WAVE POWER FOR GAGE' 625 i = PROFILE LINE 62 I
Figure 7. Time line of calculated wave power for Gage 625 with profile survey and sediment collection times (Continued)


height and per iod da ta co l l ec ted a t Gage 625.* The s i x da tes when the wave
power was g rea te r than 50 kW/m, chosen t o i d e n t i f y extreme events l i k e l y t o
cause p r o f i l e and sediment changes, a r e l i s t e d i n Table 3 , along with 10 addi-
t i o n a l da tes when wave heights were g rea te r than 2 m.
Table 3
Dates of High Wave Height and Wave Power
Wave Height Greater Than 2 m Wave Power Greater Than 50 kW/m
5 Apr 1984
31 May 1984
17 Sep 1984
27 Sep 1985
29-31 Sep 1984
11-18 Oct 1984
3 Nov 1984
20 Nov 1984
6 Dec 1984
3-4 Jan 1985
12 Eeb 1985
22-23 Mar 1985
14-15 Apr 1985
29 Apr 1985
4 May 1985
2 Aug 1985
30-31 Sep 1984
11-15 Oct 1984
3 Jan 1985
12-13 Feb 1985
22-23 Mar 1985
14-15 Apr 1985
* Personal Communication, William A . Birkemeier, Chief , ERE, Duck, N C .

PART V: RESULTS
22. Coastal processes are constantly at work modifying the beach pro-
file and the sediment distribution across the profile with each wave. Daily
changes during fair weather waves are small. Storm-induced changes can, how-
ever, be significant and can occur over the period of one to five tidal
cycles. The longer term changes in the profile shape and sediment distribu-
tion are a function of the frequency of storm-induced changes. The cyclic
variation in this storm frequency leads to a general seasonal cycle of erosion
typical to the winter months due to increased extratropical storm occurrence.
Accretion is more likely in the more quiescent summer months, barring tropical
storm impacts. The key forcing functions are the frequency and duration of
storm activity. The present study covers a period of 17.8 months, from March
to September, which spans this seasonal time frame. Several storm events were
also bracketed with surveys and samples. This unique data set allows for
analysis of long-term changes in the profile and sediment distribution under
varying wave conditions.
Profile Changes
23. A general description of long-term profile changes that occurred at
the FRF are described from 1981 to 1984 in Birkemeier (1985). This present
study extends that data set into 1985. The general morphology of the beach at
the FRF includes the dune, initially bulldozed by man and now under the influ-
ence of eolian transport; the berm, or dry beach, under the influence of wave
transport only during high-water conditions; the foreshore or intertidal area,
changed daily by the uprush and backwash during each tidal cycle; the bar/
trough region where the wave breaks and reforms into a bore in the surf zone;
and the nearshore area seaward of the bar and breaker zone.
24. The profile at the ERE is most active during storms and is charac-
terized by an dynamic bar/trough movement zone. The inner bar, located at a
depth of -0.6 to -1.5 m (Birkemeier 1985), moves offshore in response to the
storm waves. During fair weather periods, the bar migrates back onshore.
The berm and foreshore change along with the bar movement, typically eroding
as the bar moves offshore and accreting as the bar moves onshore.

25. Seaward of the 450-m distance from the baseline and -4.5-m depth,
to the seaward limit of the profile (see Table 3), the profile elevations were
essentially the same throughout the study (Figure 5b). Howd and Birkemeier
(1987) found that over the longer 1982 to 1984 period, the vertical change was
minimal seaward of the -7-m depth, which occurred about 700 m seaward from the
baseline. During this shorter study period, which experienced minimal high
wave energy events, the area of minimal elevation change moved inshore.
26. For the study period, the volumes and areas of erosion and accre-
tion were plotted between each profile. Appendix A contains the profile pairs
showing the pattern of erosion and accretion. The nearshore bar was quite
active, moving in response to the wave climate. A prospective view of Profile
Line 62 is shown in Figure 8. From the beginning of the study in March 1984
to September 1984, the bar migrated inshore. The movement of the bar to its
farthermost offshore position was in response to a storm from 11 to 15 October
1984. Another storm on 3 to 5 January 1985 also caused the bar to retreat
seaward. From March 1985 to the end of the study, the bar position was rela-
tively stable, fluctuating between 150 and 200 m seaward of the baseline and
finally moving inshore at the end of the summer months of 1985.
27, Calculations of cumulative volume changes between profiles from the
ISRP program (Birkemeier 1984) for the beach above and below NGVD are shown in
Figure 9a. The above NGVD volumes represent the changes on the berm and the
foreshore area, from 65 m seaward of the baseline (base of dune) to the
0 crossing position. The bar/trough and nearshore area, from the 0 crossing
out to 650 m seaward of the baseline (shortest profile in the data set), are
included in the below NGVD changes. The net change in cumulative volume
across the entire profile, from the base of the dune at 65 m out to the short-
est profile at 650 m, is shown on Figure 9b. The general trend in cumulative
change is of a net accretion of volume on all locations across the profile
during the study. During the spring of 1984, the above NGVD portion of the
profile showed a net loss of sand volume, whereas the below NGVD area gained
volume. After the large storm in October 1984, the trend was toward accretion
on both the beach and nearshore regions. This cumulative volume change can
only be interpreted in cross-shore changes, while in reality, volume changes
are a result of alongshore movements of sediment also. A net gain of 41 m3/m
was measured over this 17.8 month study as the berm received sand. The
nearshore bar region also showed a net gain of 77 m3/m. The total net profile
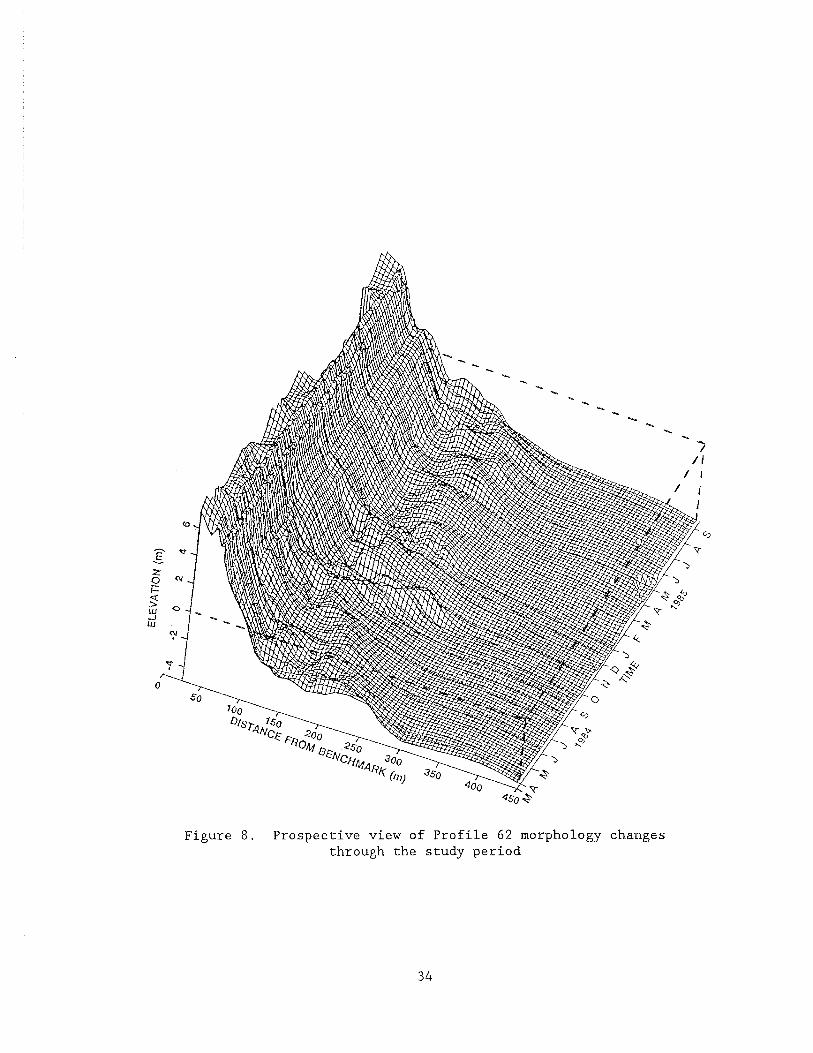
Figure 8. Prospective view of Profile 62 morphology changes through the study period

W W W S S W W W S S S W S W W W
LLJx8.Q BELOW NGVD ABOVE NGVD
S STORM OCCURRENCE W HIGH WAVES
a . Above and below NGVD change
W W W S S W W W S S S W S W W W
lamu2 - NET PROFILE
S STORM OCCURRENCE W HIGH WAVES
APR JUN AUG O C I BEC FEB APR JUN AUG
b . Net p r o f i l e change, with major high wave events
Figure 9 . Cumulative volume changes on P r o f i l e Line 62
accretion over the study period was 118 m3/m. Table 4 summarized the above
NGVD, below NGVD, and total profile volume changes between profiles. This net
accretional trend may have been a result of longshore transport of sand into
the FRF coastal area. The migration of sand waves has been identified along
the Outer Banks coast (Dolan 1971), and the relationship of the beach with
rhythmic crescentic bars has been noted (see Komar 1976 and Davis 1985 for
further discussion). This sand wave/crescentic bar migration process is a
three-dimensional process and is beyond the scope of the present two-
dimensional data set.
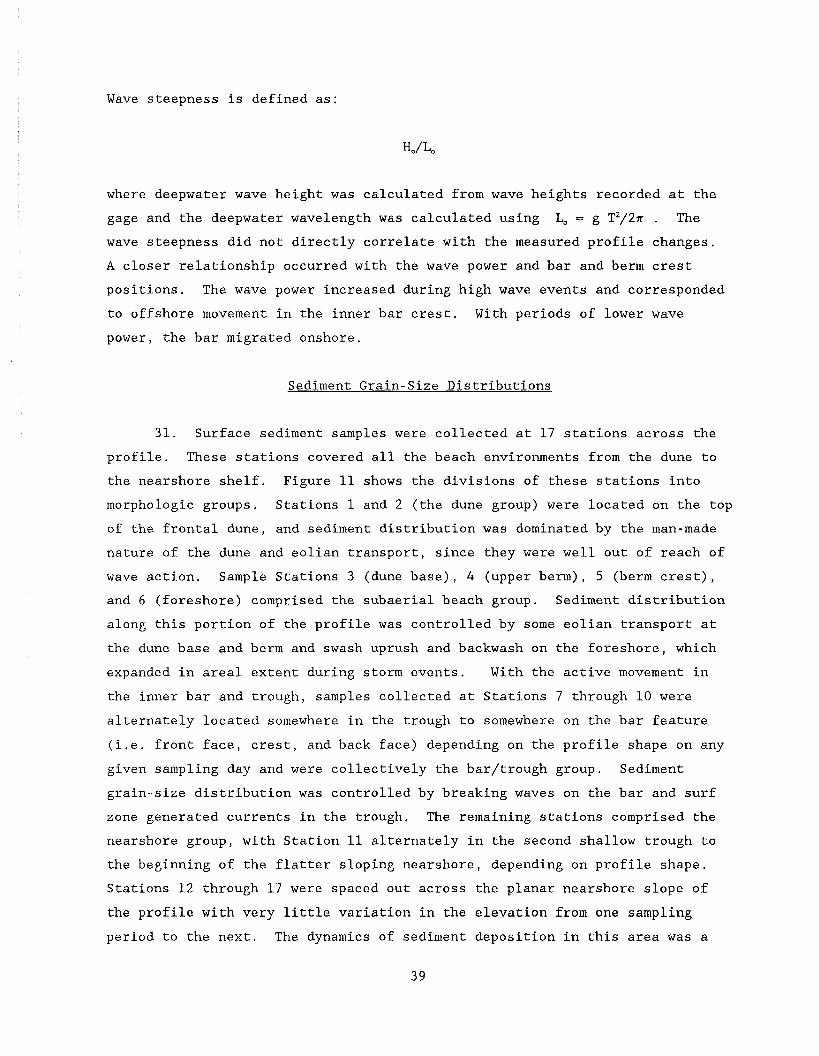
28. High wave events (waves greater than 2 m) and storm events (wave
power greater than 50 kW/m) have been plotted on Figure 9 to show the rough
correlation of high wave events with net erosion of the profile. However, net
accretion was also measured under some high wave events. Because of the
irregular spacing of the profile collection, most high wave events were not
closely bracketed, and some recovery was possible before the next profile.
29. The nearshore bar should be a good indicator of the response of the
profile to wave events. Figure 10 shows the correlation of the time series of
wave power and wave steepness with bar crest position measured on the profile
seaward of the baseline. The berm crest position indicates the accretion and
erosion on the visible portion of the profile and is plotted, although there
is less dramatic changes than the inner bar. The trend is for erosion of the
berm to correspond to accretion in the nearshore, with seaward movement of the
inner bar crest. As the berm moves seaward during accretion, the bar moves
inshore.
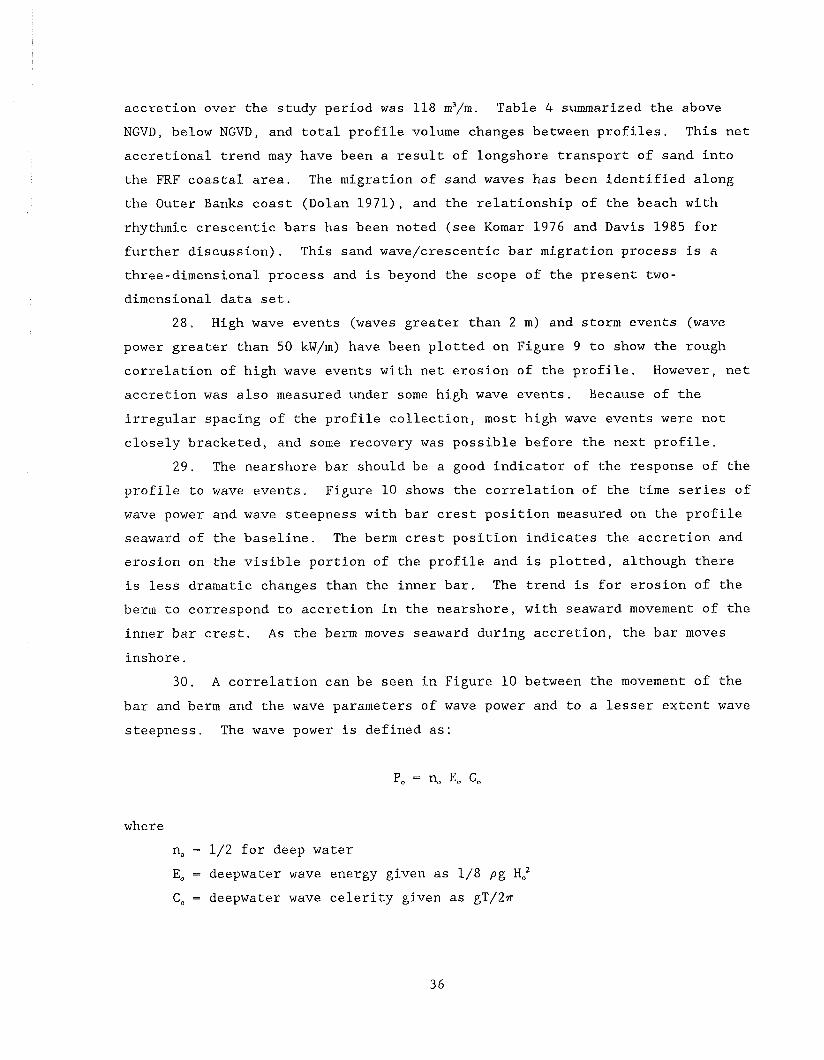
30. A correlation can be seen in Figure 10 between the movement of the
bar and berm and the wave parameters of wave power and to a lesser extent wave
steepness. The wave power is defined as:
where
no = 1/2 for deep water
E, = deepwater wave energy given as 1/8 pg H:
C, = deepwater wave celerity given as gT/2n

Table 4
Volume Chanpes - Between P ro f i l e s
Prof i l e Dates
Above NGVD Change, m3/m
Below NGVD Change, - m3/m
1984
Total P ro f i l e Change, m3/m

M A M J J A S O N D J F M A M J J A S 1984 TIME 1985
+#- BERM CREST -Ff BAR CREST
POWER - STEEPNESS
Figure 10 . Time s e r i e s of deepwater wave power and wave s t e e p - ness compared wi th ba r c r e s t and berm c r e s t p o s i t i o n
Wave steepness is defined as:
where deepwater wave height was calculated from wave heights recorded at the
gage and the deepwater wavelength was calculated using Lo = g T2/27r . The
wave steepness did not directly correlate with the measured profile changes.
A closer relationship occurred with the wave power and bar and berm crest
positions. The wave power increased during high wave events and corresponded
to offshore movement in the inner bar crest. With periods of lower wave
power, the bar migrated onshore.
Sediment Grain-Size Distributions
31. Surface sediment samples were collected at 17 stations across the
profile. These stations covered all the beach environments from the dune to
the nearshore shelf. Figure 11 shows the divisions of these stations into
morphologic groups. Stations 1 and 2 (the dune group) were located on the top
of the frontal dune, and sediment distribution was dominated by the man-made
nature of the dune and eolian transport, since they were well out of reach of
wave action. Sample Stations 3 (dune base), 4 (upper berm), 5 (berm crest),
and 6 (foreshore) comprised the subaerial beach group. Sediment distribution
along this portion of the profile was controlled by some eolian transport at
the dune base and berm and swash uprush and backwash on the foreshore, which
expanded in areal extent during storm events. With the active movement in
the inner bar and trough, samples collected at Stations 7 through 10 were
alternately located somewhere in the trough to somewhere on the bar feature
(i.e. front face, crest, and back face) depending on the profile shape on any
given sampling day and were collectively the bar/trough group. Sediment
grain-size distribution was controlled by breaking waves on the bar and surf
zone generated currents in the trough. The remaining stations comprised the
nearshore group, with Station 11 alternately in the second shallow trough to
the beginning of the flatter sloping nearshore, depending on profile shape.
Stations 12 through 17 were spaced out across the planar nearshore slope of
the profile with very little variation in the elevation from one sampling
period to the next. The dynamics of sediment deposition in this area was a


function of the transformation of waves from transitional to shallow water as
they passed over this region on their way to the beach.
Dune group
32. There is a wide variation in the grain-size distributions of each
of the four groups of sediment across the profile, related to the different
forcing functions responsible for controlling deposition in each region of the
profile and the available mineralogy. Figure 12 shows an example of the dune
group grain-size distributions from Station 1 on the top of the dune and Sta-
tion 2 on the front face of the dune. This dune is characterized by a rela-
tively coarse sediment, probably because the dune was bulldozed from surround-
ing coarse beach sands in the 1930's. The frequency curve of Station 1 has a
trimodal distribution, while Station 2 has a bimodal one, indicating the pos-
sibility of multiple sources for the dune components. Wind-induced sediment
transport is active in daily deposition within the dune area and controls
deposition of the finer sand sizes, while the coarser material is probably a
lag deposit.
33. In order to investigate the temporal and spatial distribution in
the sediment in this study, plots of individual mean grain size were compared
with sample sorting. Figure 13 shows the mean versus sorting plot for all the
sediment samples collected at Stations 1 and 2. They are both tightly
clumped, indicating little variation through time in sediment characteristics.
These samples were, for the most part, unaffected by temporal changes in
coastal processes, except for wind transport. The one outlying data point on
each graph is from the first sampling on 20 March 1984, which contained shell
material, making that date's sample more poorly sorted and coarser than the
rest . Beach group
34. The grain-size distribution was the most varied in space and time
within this group. Figure 14 shows a somewhat general example of the fre-
quency curves at Stations 3 through 6. Because the environment of deposition
changed from eolian transport to swash transport daily as the profile changed
in elevation, the beach group sediment grain-size distributions reflected this
change. Most of these distributions showed a bimodal distribution, with the
main component centering around 0.25 mm (2 4 ) and the secondary component
centering around 1.0 mm (0 4 ) .

Sample # : 6216101
Gravel I Sand I
5 10 20 40 60 100 200 ASTM Mesh
50 1 T
Mean
CI 40 -
C w U L a, a L.8
30 -
( p h i )
Moment Measures Mean 1.44 S t d . Dev. 0.79 Skewness -0.46 Kurtosis 3.04 Graphic Median 1.55
Grain Size
a. Station 1
Sample X : 6218402 850808
Gravel I Sand I 5 10 20 40 60 100 200 ASTM Mesh
50 1 Moment Measures
Mean 1.28 S t d . Dev. 0.65 Skewness -0.41 Kurtosis 3.11
- 3 - 2 - 1 0 1 2 3 4 5 (phi)
8.0000 2.0000 0.5000 0.1250 0.0313 (mm)
Grain Size
b. Station 2
Figure 12. Example of frequency curves of sediment samples located on the dune at Stations 1 and 2

0*5 0 -2 _ -1.5 -1
COARSE 0 0.5 1 1.5 2 2.5 3 3.5 4
MEAN (phi) FINE
a. Station 1 (+)
COARSE MEAN (phi)
b. Station 2 (*)
FINE
Figure 13. Plots of mean grain size versus sorting for all samples from Stations 1 and 2 located in the dune

0 0 rur
0 0. -
0. (0
n
m o .
0 ~ ,u
_ 0 . -
- >n. a
0

35. Station 3 at the base of the dune was unusually coarse and poorly
sorted, indicating that a coarse lag component was mixed with storm wave
deposits at extreme high-water levels and finer wind-transported material
during fair weather. The berm samples (Stations 4 and 5) exhibited the
bimodal distribution with the secondary mode centered around 1.0 mm (0 4) becoming more dominant on sampling days after storms had deposited sediment on
the berm through swash processes.
36. Station 6 was the only sampling station in the intertidal area
between mean high water (MHW) and mean low water (MLW). Bascom (1959) sug-
gested that if only one sample could be collected to represent the grain size
of a beach, the best position to use as a reference sampling site was the
midtide area. Samples collected at MHW, midtide, and MLW were found to best
characterize the beach for sand suitability determination for beach fills
(Stauble, Hansen, and Blake 1985). During the study, Station 6 sediment sam-
ples were collected somewhat randomly throughout the intertidal area and made
it difficult to characterize this important zone. The samples had a widest
variation in sediment distribution through time with the largest temporal
variation in mean grain size. At times, the main component of this commonly
bimodal distribution centered around the gravel range of 11.3 to 5.66 mm
(-3.5 to -2.5 4) and was composed of predominantly iron-stained quartz sands and rock fragments. Most of the times the coarse distribution occurred was
after storm events, except on 15 July 1985 during a low wave energy period,
when Station 6 also contained this coarse distribution. A possible explana-
tion could be that the sampling that particular day was on a cusp, which can
accumulate coarse material on its horn. The other sampling days had distribu-
tions similar to that shown in Figure 14.
37. The larger variation in grain-size distributions of the beach group
can be seen on Figure 15, where the mean grain size for each individual sample
is plotted against the sorting. A general trend is a fining of mean grain
sizes as one moves from the dune base to the foreshore with a better sorting.
The coarse and more poorly sorted samples at Stations 4 and 6 deposited after
storm events can be seen to the left of the tightly grouped data points at
each station. The sediment deposition is under the influence of uprush and
backwash processes in this region of the profile. A common trend shown at all
stations is that the finer means have a better sorting, whereas the coarser
samples have a wider range of poorer sorting values.

J _I
U J O 2 - -' -d., ; 0 5 15 1 2:s A 3'5 --4 COARSE MEAN (phi) FINE
a. Station 3 (0)
J W
3 0-L -;5 11 i . 5 0 15 1 5 j 3 5 i COARSE MEAN (phi) FINE
b. Station 4 (x)
W
''-2 -1.5 -1 -0.5 0 0.5 1 1.5 2 2.5 3 3.5 4 COARSE MEAN (phi) FINE
c. Station 5 ( 0 )
-2 -1.5 -1 -0.5 0 0.5 1 1.5 2 2.5 3 3.5 4 COARSE MEAN (phi) FINE
d. Station 6 (A)
Figure 15. Plots of mean grain size versus sorting for all samples in
the beach group

Bar/trough group -
38. The sediments deposited in the bar/trough region was more unimodal.
All of these samples were located below NGVD and were submerged even at low
tide. Figure 16 shows examples of the bar/trough group grain-size distribu-
tions. Station 7 was located within the trough area and fluctuated between
the landward continuation of the foreshore and the base of the trough. If
only a minimal bar was present as occurred 6 times during the study (Table I),
Station 7 was located in the vicinity of the step. Station 8 was located
between the trough and the bar crest. This position basically covered the bar
front area. Station 9 samples were collected, for the most part, over the bar
crest region, extending from the landward bar front to the seaward bar back
slope. Station 10 samples were mostly extending from the bar crest across the
seaward bar back slope. The wide range in environments of deposition is due
to the active bar and trough lateral movement. The grain-size distributions
across this group, however, did not vary widely throughout the study. The
greatest variability was seen in Station 7 with the coarsest distributions
occurring when the samples were collected on the step or lower portion of the
continuation of the foreshore slope. The wave environment in this configura-
tion was the plunge point for the shore break and was an area of high turbu-
lence, supporting only deposition of relatively coarse material.
3 9 . The wider distribution of means and sorting values for Station 7
can be seen in Figure 17. A more closely spaced distribution for all the
samples can be seen for the other stations in the bar/trough group. The shift
to finer mean grain size in the seaward direction can be seen ranging from
around 0.190 mm (2.4 4) at Station 7 to 0.165 mm (2.6 4) at Station 10. A
general trend of finer means which correlates to better sorting similar to the
beach group can be observed, but the bar/trough sediments have less of a data
spread. The environment of deposition in this group ranges from under the
breakers over the bar crest to the plunge point under the shore break. This
area is influenced by cross-shore and alongshore induced currents in the
trough.
Nearshore group -
40. Seaward of the bar, the profile takes on the shape of a concave
upwards slope. The low relief second bar located at a distance of 400 m from
the baseline reported by Howd and Birkemeier (1987) was observed only during
the beginning of the study period. Figure 18 gives individual grain-size

0.
m ",
0 0 1 0 0 0 1 ( 0 m T m - - m UI - ",NO-U)",
", UI
. - " - ~ ?, = a
e, * - I -
7 3
a - - : :YI g 2 : : ; " O 0 - m - " I C O L
C x u 0 r n u a c r n a - x , c 1Ui'nro

COARSE
- L A
0.5 1 1.5 2 2.5 3 3.5 4
MEAN hi) FlNE
a. Station 7 (x)
1
g o i ' ' -2 -1.5 -1 -0.5 0 0.5 1 1.5 2 2.5 3 3.5 4
COARSE MEAN (phi) FlNE
b. Station 8 (o)
-2 -1.5 -1 -0.5 0 0.5 1 1.5 2 2.5 3 3.5 4 COARSE MEAN (phi) FINE
c. Station 9 (v)
1 *
_1 W
0 5 1 5 b 0 5 15 ; 2 ; 3:s ! COARSE MEAN (phi) FINE
d. Station 10 (+)
Figure 17. Plots of mean grain size versus sorting for all samples in
the bar/trough group

a. Station 12
5
30 . rn
:20 .
10 -
0 1
Sample r 6216115 84 1002
Moment n e a 5 u r e 5 m a n 2 71 Sta O e r 0 34 Srerness -2 72 K Y P ~ O S I S 37 05 GraDnic Mealan 2 71
Gravel 8 Sano 5 10 20 60 60 100 200 ASTM uesn
50 1
-3 -2 - I o I 2 3 4 51onl1 8 0000 2 0000 0 5000 0 1250 0 0313 Imml
Mean 2.96 Sto. Oev o 49 Sxewness -3.99 K u r t 0 3 l ~ 39.71 Grapnlc Mealan 2 93
b, Station 15
Gravel I Sana 5 10 20 40 60 100 200 ASTM uesn
50 1 Moment ~ e a s u r e s
Mean 3 08 St0 Dev 0 33 Skewness -5 61 K U P ~ O S I S 75 92 Graonrc Median 3 08
c. Station 17
Figure 18. Examples of frequency curves of sediment samples located in the near- shore group at Stations 12, 15, and 17

distribution examples from the nearshore group showing a well-sorted unimodal
distribution prevalent at all stations from 11 to 17. This group had the
least variability during the study period. Since all the distributions were
similar, only examples from Stations 12, 15, and 17 are shown. Each station
exhibited a small tail of fine-grained sand in the 0.074 mm (3.75 4 ) range. The profile elevation below NGVD ranged from around -4 m at Station 11 to -8 m
at Station 17. The grain-size data suggest that the environment of deposition
was relatively uniform over the entire 16-month length of the study.
41. Figure 19 shows the distribution of mean grain size and sorting
values from the nearshore group. There is very little variation in the
tightly packed groupings when compared with the more active swash and wave
breaker zone groups of the beach and bar/trough. A slight shift in means can
be seen from around 0.165 mm (2.6 4 ) at Station 11 to around 0.117 mm (3.1 4 ) at Station 17. The sorting range decreases as one moves offshore into deeper
water with samples being more well sorted. The data points with the "poorest"
sorting and "coarsest" mean grain size were collected after storm events,
indicating some active transport under extreme events. The variation in depo-
sition and resulting grain-size distributions, however, decreases with
increasing depth.
42. Combining the individual mean grain-size and sorting values into
the four groups shows the relationship of the cross-shore change in sediment
data (Figure 20). The coarser and more poorly sorted sediment distributions
occurred during the winter months at the beginning of the study. The coarsest
and most poorly sorted samples in all groups correspond to the first sampling
day on 20 March 1984. This survey was taken after a series of high wave
events when the bar was in one of its farthermost positions seaward of the
baseline. Samples collected in October 1984 also exhibited coarse and more
poorly sorted distributions after the largest waves that were measured during
the study period. The widest spread in data was seen in the beach group. The
next widest spread was in the bar/trough group. The tightest grouping was
found in the dune and the nearshore groups. Each of these groups were in
lower energy environments and thus showed less variation in grain-size
distribution.

_I -I
W
* ! 5 1 - 5 A 0 5 ; ,, 1 2:s ; 3:s ! COARSE MEAN (phi) FINE
a. Station 11 (0)
-1 W
- 5 1 5 A 0 5 ; 1, * 2 ; 3 5 I COARSE MEAN (phi) FINE
b. Station 12 ( 0 )
2
$ O i ' ' a ' L ' -2 -1.5 -1 -0.5 0 0.5 1 1.5 2 2.5 3 3.5 4 COARSE MEAN (phi) FlNE
c. Station 13 ( m )
COARSE MEAN (phi) FlNE
d. Station 14 (@)
Figure 19. Plots of mean grain size versus sorting for all samples in
the nearshore group (Continued)

- _t W
- L L - I _ J p A * O-? -;, i1 - d 5 i 0 1 5 1.5 5 3.5 1 COARSE MEAN (phi )
FINE
e. Station 15 (A)
dL 0
-2 -1.5 -1 -0.5 0 COARSE
L - - - L
0 5 1 1.5 2 2.5 3 3.5 4
MEAN (phi) FINE
f. Station 16 (+ )
_I -1
O 5 , , , , , , , , " 1 E -2 -1.5 -1 -0.5 0 0.5 1 1.5 2 2.5 3 3.5 4
COARSE M E A N (phi ) FINE
g. Station 17 ( v )
Figure 19. (Concluded)

A
0 ----- l--L2.-L-J-LI_I-- 1 -2 -1.5 -1 -0.5 0 0.5 1 1.5 2 2.5 3 3.5 4
COARSE MEAN (phi) FlNE
a. Dune (0)
W I ' '-2 -1.5 -1 -0.5 0 0.5 1 1.5 2 2.5 3 3.5 4 COARSE MEAN (phi) FINE
b. Beach (*)
_I
W oL.. -2 - L . . L J -2 -1:s -'I -d.5 A 0.5 1 1.5 2 2.5 3 3 5 4
COARSE MEAN (phi) FlNE
J
W I , J O! -1., i, -d., b 5 1:s i 2 y 5 3.5 COARSE MEAN (phi) FlNE
d. Nearshore ( @ )
Figure 20. Plots of mean grain size versus sorting of dune, beach, bar/
trough, and nearshore groups

Across profile sediment distribution trend
43. To summarize, the spatial across-profile sediment grain-size dis-
tribution varies mainly due to the variation in sediment transport forcing
functions and mechanisms. The dune group's principal distribution is related
to the coarse lag deposit and bed load and saltation of fine sand sizes due to
wind.
44. The beach group's high variation in grain-size distributions is
related to the variation in wind transport on the dry beach and the swash
transport processes on the foreshore. The swash transport contains the highly
turbulent uprush, which transports sediment upslope on the foreshore in a
series of modes, changing irregularly from one of suspension, to saltation,
and finally bed load until the forward momentum is stopped by slope friction
and gravity (Waddell 1976). As the bore reaches its maximum runup position,
there is a period of decreasing upslope movement. The fluid comes to a momen-
tary halt, depositing specific grain sizes caught in the upslope transport.
The initiation of backwash begins with a rapid drop in water depth as the
fluid accelerates back downslope (Stauble 1979). The backwash has different
internal flow characteristics, with a reverse spectrum of sediment transport
modes from bed load through saltation to suspension. The lower backwash
obtains high velocities, but shallow depths limit transport capacity.
45. The bar/trough region is characterized by the breaker and surf
zone, where sediment is suspended by the breakers over the bar crest and again
at the lower foreshore step. The mechanisms of wave breaking and resulting
profile modifications are discussed by Miller (1976). The surf zone between
the bar and the shore transports sediment as the bore travels into shore and
interacts with the swash zone (Brenninkmeyer 1976).
46. A comparison of the temporal and spatial changes in cross-shore
sediment distribution for a winter higher wave period is shown in Figure 21.
Sediment grain-size distributions across a well-developed inner bar profile
during 2 October 1984 demonstrate the coarse sediment component found in the
beach and bar/trough groups. A representative profile from the accretionary
period toward the end of the study is shown in Figure 22. Sediment grain-size
distributions across a shallow inner bar profile collected during 21 August
1985 show an overall decrease in coarse sediment on the profile and the shift

WEIGHT PERCENT 5, 25 5,O
DISTANCE FROM BACKSTAKE (m)
Figure 21. Sediment grain-size distributions across a well-developed inner bar profile during 2 October 1984

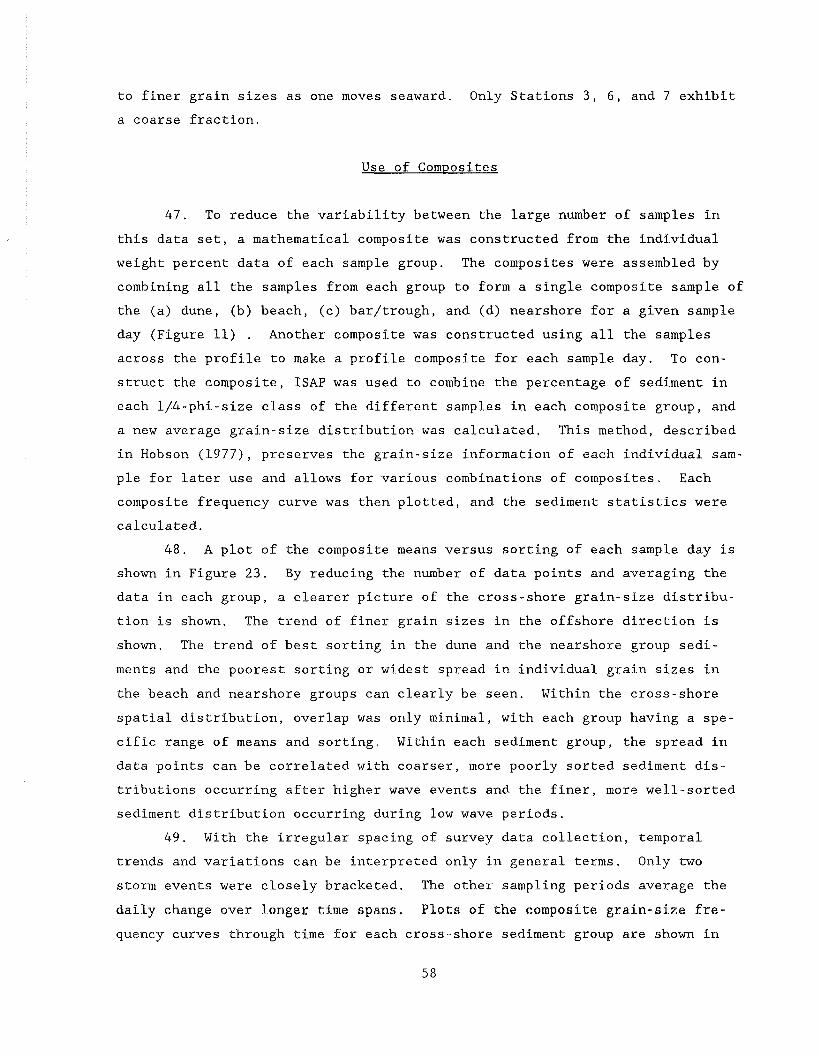
to finer grain sizes as one moves seaward. Only Stations 3, 6, and 7 exhibit
a coarse fraction.
Use of Com~osites
47. To reduce the variability between the large number of samples in
this data set, a mathematical composite was constructed from the individual
weight percent data of each sample group. The composites were assembled by
combining all the samples from each group to form a single composite sample of
the (a) dune, (b) beach, (c) bar/trough, and (d) nearshore for a given sample
day (Figure 11) . Another composite was constructed using all the samples
across the profile to make a profile composite for each sample day. To con-
struct the composite, ISAP was used to combine the percentage of sediment in
each 1/4-phi-size class of the different samples in each composite group, and
a new average grain-size distribution was calculated. This method, described
in Hobson (1977), preserves the grain-size information of each individual sam-
ple for later use and allows for various combinations of composites. Each
composite frequency curve was then plotted, and the sediment statistics were
calculated.
48. A plot of the composite means versus sorting of each sample day is
shown in Figure 23. By reducing the number of data points and averaging the
data in each group, a clearer picture of the cross-shore grain-size distribu-
tion is shown. The trend of finer grain sizes in the offshore direction is
shown. The trend of best sorting in the dune and the nearshore group sedi-
ments and the poorest sorting or widest spread in individual grain sizes in
the beach and nearshore groups can clearly be seen. Within the cross-shore
spatial distribution, overlap was only minimal, with each group having a spe-
cific range of means and sorting. Within each sediment group, the spread in
data points can be correlated with coarser, more poorly sorted sediment dis-
tributions occurring after higher wave events and the finer, more well-sorted
sediment distribution occurring during low wave periods.
49. With the irregular spacing of survey data collection, temporal
trends and variations can be interpreted only in general terms. Only two
storm events were closely bracketed. The other sampling periods average the
daily change over longer time spans. Plots of the composite grain-size fre-
quency curves through time for each cross-shore sediment group are shown in


Figure 24. Using the entire distribution from the coarse to fine sizes shows
the details of change by grain-size class, in depositional regimes. The dune
composite distributions show little change through time. The slight change in
percentages in each grain-size class is due to sampling within the vegetated
dune. Coarse shifts in the curves are due to collection of coarse shell mate-
rial. The highest variability in distribution was found in the beach group
composites. The bimodal nature of the distribution can be seen, with
increases in the coarse mode fraction after storms or when samples on the
foreshore contained granule-size lag deposits. The coarsest material was
present early in the study period during the winter storm period. Later beach
distributions showed a shift to the finer mode, except during July 1985 when a
coarse fraction was present. The bar/trough group showed a more unimodal
distribution that was more uniform through time. Again, a coarse component
was present during the winter of 1984/85 sampling, that was not there during
the later sampling periods during the summer of 1985. Little change can be
seen in the nearshore distribution throughout the entire study period, with
only a slight percentage of coarse material appearing in the winter months.
Note the small percentage of coarse material that occurred after the
11-13 October 1984 and the 3-5 January 1985 storms and disappeared into the
summer months.
50. A temporal summary in the grain-size distribution was constructed
by creating a profile composite, averaging all 17 individual cross-profile
samples for each sample day into one mathematical composite. Details of the
cross-shore differences are smoothed, and variations are reduced with this
procedure, but the main trends are more prevalent. Figure 25 showed the pro-
file composite frequency curve grain-size distributions through time as well
as the mean grain size versus sorting. This use of a profile composite shows
the change from a flatter frequency curve that had a coarse mean and poor
sorting and higher percentage of the coarser grain sizes during the winter to
a smoother bell-shaped curve in the summer. The well-sorted coarse distribu-
tion of 11 August 1984 resulted because no samples were collected below NGVD
that sample day. The general trend in grain-size distribution variation is
characterized by the change in the coarse fraction. The finer fraction, owing
to the large number of samples in the bar/trough and nearshore regions,
remained the dominant percentage of this profile composite.

a. Dune b. Beach
c. Bar d. Nearshore
Figure 24. Composite grain-size distributions changes through time

a. Grain-size distribution changes through time
PROFILE b. Mean versus sorting
Figure 25. Profile composite grain-size distribution changes through time and mean versus sorting

51. In order to relate the variations in grain-size distributions to
the physical processes, a comparison of the changes in composite mean grain
sizes of (a) the profile mean, (b) the beach group mean, and (c) the nearshore
group mean were compared with the wave power and wave steepness values. Fig-
ure 26 shows the time series of variation in the means of these groups to the
wave parameters. Owing to the differences in sediment transport modes and
depositional environments, the beach group had the highest variation in com-
posite means. The nearshore group had the smallest variation. The profile
mean fell between these two and was composed of all the means from the dune to
the nearshore. All of the means reflect the trend to coarser (and more poorly
sorted) sediment grain-size distribution after high wave conditions. High
wave power values and, to a lesser extent, wave steepness values correlated
with times when the means become coarse. The shift to finer means occur as
the wave parameters decrease.
Erosion/Accretion Calculations
52. Most numerical modeling efforts to identify beach response and
cross-shore transport require some measure of grain size. However, there is
no standard in choosing a good representative value. In fact, most equations
using grain-size data use a median value (D,), but the specifics of what
median value to use are left to the individual. With the known variability in
grain-size distributions across the beach as shown in this report, it is
important to pick a reasonable representative value to apply to model
equations.
53. One example of the use of grain-size data in modeling is to predict
whether a beach profile of a specific sand size will erode or accrete given
specific data on incident wave height and period. This information is impor-
tant to assess the stability of a native beach or predict the stability of a
beach fill. The procedure for calculation is given in Kraus (1990). The
variables used to determine the erosion of accretion on a beach are the deep-
water wave height, H, ; wave period, T ; and sediment fall velocity, w . Sediment fall velocity is calculated from the median grain diameter, D, , and
water temperature. Additional information on the calculation procedure is
given in Kraus (1990) and Stauble et al. (in preparation). Two nondimensional
ratios are used in the calculations: deepwater wave steepness, H,/L, ,

* NEARSHORE MEAN
- PROfllE MEAN
+ BEACH MEAN
~ A H J J A S O N ~ J F M A H J J A S 1984 TIME 1985
- STEEPNESS + POWER
Figure 26. Time series of variation in composite means of beach, nearshore, and profile with wave power and wave steepness

and deepwater fall velocity parameter, Ho/wT , where the deepwater wavelength
is calculated from the wave period data using Lo = gT2/27r , where g = accel-
eration of gravity or 9.8 m/sec2. This expression can be simplified to
Lo = 1.56 T2 (m) . With the availability of wave data for the study, the
deepwater significant wave height was calculated from the gage data, using an
average wave height from the 24-hr before the profile (wave data was collected
every 6 hr) and sediment sampling were taken. The corresponding 24-hr average
spectral peak wave period was also used.
54. Several combinations of grain-size data were applied to the calcu-
lations for fall velocity to see the changes in data spread and to determine
the best grain-size data to use in the calculation procedure. Figure 27 shows
the plot of criteria for distinguishing bar and berm profiles or erosion/
accretion using median grain size (D,) data to determine sediment fall veloc-
ity. The sediment fall velocity was calculated using composite D, data from
the beach group, the nearshore group, and the entire profile composite for
each sample day.
55. Figure 28 shows the erosion/accretion using mean grain size instead
of median values for the same three groups of the beach, nearshore, and pro-
file. The division line is the same as in the median plots. The substitution
of mean values rather than D, values for the calculation of the sediment
fall velocity shows little differences in placement of data points. The dif-
ferences are greatest for some of the bimodal beach samples. For unimodal
samples that are reasonably well sorted, the mean and the median are very
similar, and either analysis could be used.
56. These plots give a line representing the criterion representing the
division between erosion and accretion of Ho/Lo = 0.00027 Ho/wT reported in
Kraus (1990) based on field data. A second criterion was also described by
Kraus (1990) for identification of an erosional profile from an accretional
profile by using a single value of Ho/wT = 3.2 . Values of Ho/wT 1 3.2
indicate that erosion is predicted, and values of Ho/wT < 3.2 indicate that
accretion is probable. An identification of erosion and accretion for this
study was to chose whether the profile experienced a net loss of material from
the previous profile or a net gain respectively and is indicated as such in
Figures 27 and 28. Due to the irregular temporal spacing of profiles, this
may not be a good indicator for differentiation in this model. Since wave

EROSION O ACCRETION
a. Median beach composites
0.1 1.0 10.0
Ho/wT
B EROSION 0 ACCRETION
b. Median profiles composites
EROSION 0 ACCRETION
c. Median nearshore composites
Figure 27. Erosion/accretion prediction using median grain-size (D,) data

EROSION 0 ACCRETION
a. Mean beach composites
@ EROSION 0 ACCRETION
b. Mean profile composites
- EROSION " ACCRETION
c. Mean nearshore composites
Figure 28. Erosion/accretion prediction using mean grain-size data

data were taken during the preceding 24-hr period of profile survey, the wave
data can be considered influential in the deposition of the particular sedi-
ment deposited on the profile on that day. The measure of erosion or accre-
tion was based on anywhere from 2 days to over a month between profiles; thus
there was not a good agreement of determined erosion and accretion with the
theoretical values. Since all but three of the profiles had a general inner
bar shape, the criterion of bar or berm profile shape was not a good delimiter
of erosion or accretion.
57. The main point of this part of the study was to show that the
choice of grain-size data to use in the calculation of the sediment fall
velocity is important to the use of this criterion. Coarse berm sediment
means or medians will shift the point to the left toward an accretional mode,
while the use of finer means or medians such as were found in the nearshore
composites shifted the data to the erosional side of the plot. The use of a
profile composite seemed to fit the criteria of Kraus (1990) the best. The
location on the profile of median grain-size data used in Kraus (1990) was not
specified. The composite profile sediment data set using the FRF data fell
between the beach and nearshore data and basically averaged the grain-size
median or mean over the entire cross-shore distance.
58. It is suspected that in the past most sediment data have been col-
lected on the subaerial beach, but the original criterion H,/wT was devel-
oped by Dean (1973), who based the settling velocity of the grains on the area
of location under the breaker. The formation of a bar-type profile is usually
dependent on transport of sand from the beach foreshore out to the nearshore
bar position. Movement of sand by bar migration onto the lower foreshore with
berm growth characterizes accretion. Swash processes dominate the transport
on the foreshore, while turbulent interactions of wave and current-induced
transport characterize the dominate processes over the nearshore bar. More
research needs to be done on the correct choice of median (or mean) grain size
to use in predicting erosion or accretion, owing to the fact that the grain-
size distribution varies across the profile depending on the mode of transport
common to that area.
PART VI: SUMMARY AND RECOMMENDATIONS
59. This unique data set of long-term beach profile elevations, sedi-
ment samples, and wave data has provided a rare opportunity to examine the
interaction between cross-shore profile changes and the resulting grain-size
distributions for the wide range of energy environments found across the
active beach profile under varying wave conditions. Spatial changes indicate
that the most active part of the profile at the FRF is the bar/trough area,
which alternately moves seaward after storms and migrates landward during fair
weather wave conditions. The highest variability in sediment grain-size dis-
tributions occurred on the subaerial beach and foreshore area. The most
stable sediment distributions occurred on the most stable portion of the pro-
file in the nearshore area seaward of 450 m from the baseline. High wave
activity caused the foreshore to erode and sediment to migrate into the sea-
ward direction (and alongshore, which was beyond the scope of the present
study). After these high-energy events, the sediments became coarser and more
poorly sorted. Lower energy wave conditions for long periods of time created
conditions of landward migration of the inner bar and accretion on the fore-
shore, with deposition of finer sediments.
60. Sediment sample spacing across the profile is important to identify
the changes. From this study, it was found that the dune sample distribution
changes little, since most of the transport is limited to the finer sizes due
to wind. With the high variability in sediment of the beach group, more sam-
ples of closer spacing are needed. The beach at the FRF is composed of coarse
material. Coarser grain-size distributions lead to higher variability in
sediment distributions (Bascom 1959). This higher variability in coarser sand
beaches requires more samples of the foreshore region (Anders and Hansen
1990). From their study, as well as others, and the apparent variability in
Station 6 on the foreshore in this present study, it is recommended that more
samples be collected in the foreshore region on coarse beaches. Additional
samples should be collected at the area of MHW, midtide region, and the MLW
area to characterize the active foreshore area. Uniformity of sediment dis-
tributions in the nearshore region requires less sediment samples to charac-
terize that region. Surprisingly, the bar/trough group showed less variabil-
ity than expected, but wave- and current-induced depositional areas vary
greatly, depending on the position and shape of the bar, trough, and lower

foreshore step. Care should be taken when sampling this zone to cover the
main morphologic features of step, trough, and bar crest. Sediment sampling
locations based on hydrodynamic zonation appears to provide more information
on sediment distributions than sampling on a fixed distance from a baseline
(Stauble, Hansen, and Blake 1985).
61. The main trend of profile response was to erode the above NGVD
portion of the beach during the first portion of the study from March 1984 to
October 1984. There was a weak seasonal trend of erosion in the spring, fall,
and winter months, with accretion in the summer months. A stronger trend was
for the occurrence of more storms in the spring and fall of 1984 to cause an
alternating erosional trend after storms and a slow accretional trend between
storms. The second half of the study period from October 1984 to September
1985 had more of a trend for general accretion in both the nearshore and
bar/trough area below NGVD and the berm and foreshore area above NGVD. Occa-
sional storms caused short periods of erosion, but there was less frequency of
storm occurrence during the latter part of the study.
62. The temporal trend in sediment grain-size distributions was harder
to discern than the spatial cross-shore distribution. The use of composite
samples helped to remove some of the variability in distributions. By com-
positing samples deposited in similar transport dynamic zones, four groups
were identified. The dune group had little variation, except for sampling
variability of shell material in the vegetated dune area. Since no storm
waves reached the dune during the study, the only transport was by wind, with
lag deposits of coarser material, resulting in uniform sediment distributions
throughout the study.
63. The beach group was under the influence of wind on the dry beach
during fair weather conditions, and during storm conditions the foreshore zone
expanded as the wave runup reached higher in the berm area. The daily change
in wave conditions, as well as changes in the beach morphology due to swash
processes, created the highest variability of any of the groups in the study.
Primarily bimodal in character, the beach group showed an increase in the
deposition of coarse mode material after high wave events and deposition of
more fine mode material during lower wave periods.
64. The bar/trough group samples were collected in a variety of sub-
environments from the step to the trough to the inner bar during the study
depending on the shape and location of the bar. The mostly unimodal samples

generally became finer in the offshore direction and had only coarse material
after storm events or when Station 7 was at the highly turbulent step region.
65. One of the interesting findings of this study was the low variabil-
ity in the nearshore group during the study period. Contrasted with the
higher variability in the beach and bar/trough groups responding to changes in
the wave energy levels, the nearshore group sediment distribution remained
relatively constant over the 18-month study. Only a slight coarsening was
observed in the sediment distribution after storm events. This low variabil-
ity in sediment distribution change is concurrent with low variability in
profile elevation changes seaward of the 450-m distance from the baseline.
This portion of the profile was not under the influence of the wave regime,
being seaward of the breaker zone. There are few forcing functions to cause
transport of this seaward fining sediment. The study period was, however,
lacking any major storm events. Howd and Birkemeier (1987) in a longer period
of study did observe a small change in the second bar around 400 m seaward of
the baseline with limited change up to a depth of -7 m. It is suspected that
the present study, with significant measured changes only out to a depth of
-4 m, has not sampled the total effects of storms on the change in this near-
shore area.
66. The unique combination of accurate long profiles, detailed sediment
sampling over all regions of the cross-shore profile, and frequent records of
wave processes has provided a better understanding of the long-term process-
induced response of ocean beaches. The wave records indicate that the higher
wave energy events tend to erode the foreshore area and deposit sediment in
the nearshore region (and in the alongshore direction). The sediments that
remain on the profile after the storm are coarser than before the storm. This
trend was found to be true in the beach and nearshore group and to a lesser
extent in the nearshore group. In the absence of a high frequency of large
wave events, the bar tends to migrate inshore with a corresponding accretion
on the foreshore. The sediments across the profile trend to finer grain-size
distributions with finer means and better sorting. The frequency of occur-
rence of high wave events is the leading cause of beach response, and controls
or supersedes any seasonal cycle of erosion/deposition. The longer the period
of low wave events, the more accretional the profile becomes, with a fining of
grain-size distributions.

67. The use of the entire grain-size distribution gives a detailed
picture of the sediment distribution at each sampling location showing bimodal
versus unimodal distributions, as well as changes in specific size classes in
response to wave action. The use of composite samples reduces the variability
and allows large data sets, such as in this study, to be analyzed and trends
to be identified. The choice of sediment statistics used to characterize a
sediment is important. The most used grain-size descriptor in modeling
efforts is the use of the median (D,). The mean grain size is probably the
most reported statistic. These two values are very similar except in
polymodal sediment distributions, such as were found in the beach group. A
comparison of the composite means of the beach, entire profile, and nearshore
groups gives a better picture of temporal cross-shore change than any one
individual sample mean. This study indicated that the most variability was
found in the beach group, whereas the nearshore composite means were the least
variable and indicated only changes due to high wave events. The use of the
profile composite mean fell between them and gave a reasonable picture of
grain-size changes.
68. Any modeling effort that requires grain-size data should evaluate
the cross-shore variability of that particular beach and should choose either
a composite of the subaerial berm and foreshore portion of the beach or the
total profile to characterize the sediment distribution. Since most equations
require a single value, the use of a beach or profile composite mean is sug-
gested to give the best representation.

REFERENCES
Anders, F. J., and Hansen, M. 1990. "Beach and Borrow Site Sediment Investi- gation for a Beach Nourishment at Ocean City, Maryland," Technical Report CERC-87-9, US Army Engineer Waterways Experiment Station, Vicksburg, MS.
Anders, F. J., Reed, D. W., Stauble, D. K., and Hansen, M. "Interactive Sedi- ment Analysis Program ISAP: A User's Guide," Instructional Report in prepara- tion, US Army Engineer Waterways Experiment Station, Vicksburg, MS.
Bascom, W. N. 1959. "The Relationship Between Sand Size and Beach Face Slope," American Geophysical Union Transactions, Vol 32, No. 6, pp 866-874.
Birkemeier, W. A. 1984. "A User's Guide to ISRP: The Interactive Survey Reduction Program," Instructional Report CERC-84-1, US Army Engineer Waterways Experiment Station, Vicksburg, MS.
. 1985. "Time Scales of Nearshore Profile Changes," Proceedings of the 19th Coastal En~ineerinn Conference. American Society of Civil Engineers, pp 1507 - 1521.
Birkemeier, W. A., and Mason, C. 1984. "The CRAB: A Unique Nearshore Sur- veying Vehicle," American Society of Civil Engineers Journal of Surveying Engineering, Vol 110, No. 1, pp 1-7.
Birkemeier, W. A., et al. 1985. "User's Guide to CERC's Field Research Facility," Instructional Report CERC-85-1, US Army Engineer Waterways Experi- ment Station, Vicksburg, MS.
Brenninkmeyer, B. M. 1976. "Sand Fountains in the Surf Zone," In: R. A. Davis and R. L. Ethington, eds., Beach and Nearshore Sedimentation, S.E.P.M. Special Publication No. 24, pp 69-91.
Davis, R. A. 1985. "Beach and Nearshore Zone," In: R. A. Davis, ed., Coastal Sedimentary Environments, Springer-Verlag, New York, pp 379-444.
Dean, R. C. 1973. "Heuristic Models of Sand Transport in the Surf Zone," Proceedin~s of the Conference on Ennineering Dynamics in the Surf Zone, Syd- ney, Australia, pp 208-214.
Dolan, R. 1971. "Coastal Landforms: Crescentic and Rhythmic," Geological Society American Bulletin, Vol 82, pp 177-180.
Friedman, G. M., and Sanders, J. E. 1978. "Principles of Sedimentology," John Wiley and Sons, New York, pp 78-80.
Folk, R. L. 1974. "Petrology of Sedimentary Rocks," Hemphill Publishing Com- pany, Austin, TX.
Hallermeier, R. J. 1983. "Calculation of Wave Shoaling with Dissipation Over Nearshore Sands," Coastal Engineering Technical Aid 83-1, US Army Engineer Waterways Experiment Station, Vicksburg, MS.
Hobson, R. D. 1977. "Review of Design Elements for Beach-Fill Evaluation," Technical Publication TP-77-6, US Army Engineer Waterways Experiment Station, Vicksburg, MS.
Howd, P. A., and Birkemeier, W. A. 1987. "Beach and Nearshore Survey Data: 1981-1984 CERC Field Research Facility," Technical Report CERC-87-9, US Army Engineer Waterways Experiment Station, Vicksburg, MS.

Komar, P. D. 1976. "Beach Processes and Sedimentation," Prentice Hall, Englewood Cliffs, NJ, pp 263-280.
Kraus, N. C. 1990. "Prediction of Eroded Versus Accreted Beaches," CETN-11-2, US Army Engineer Waterways Experiment Station, Vicksburg, MS.
Meisburger, E. P., and Judge, C. 1989. "Physiographic and Geological Setting of the Coastal Engineering Research Center's Field Research Facility," Miscel- laneous Paper CERC-89-9, US Army Engineer Waterways Experiment Station, Vicksburg , MS.
Miller, H. C., Birkemeier, W. A., and DeWall, A. E. 1983. "Effects of CERC Research Pier on Nearshore Processes," Proceedinps - of the Coastal Structures '83 Conference, American Society of Civil Engineers, pp 765-784.
Miller, R. L. 1976. "Role of Vortices in Surf Zone Prediction: Sedimenta- tion and Wave Forces," In: R. A. Davis and R. L. Ethington, eds., Beach and Nearshore Sedimentation, S.E.P.M. Special Publication No. 24, pp 92-114.
Stauble, D. K. 1979. "Modifications to Swash-Beach Profile Interaction in the Presence of Seawalls, Dunes and Overwash Channels," Proceedings - of the 23rd Annual Conference on Beach Preservation, Florida Shore and Beach Preser- vation Association, Tallahassee, FL, pp 94-114.
Stauble, D. K., Hansen, M., and Blake, W. 1985. "An Assessment of Beach Nourishment Sediment Characteristics," Proceedin~s of the 19th Coastal En& neerin~ Conference, American Society of Civil Engineers, pp 1471-1487.
Stauble, D. K., et al. "Beach Foreshore Sediment and Profile Dynamics During the SUPERDUCK Experiment," Miscellaneous Paper in preparation, US Army Engi- neer Waterways Experiment Station, Vicksburg, MS.
Underwood, S. P. 1988. "Sonic Sifting: A Fast and Efficient Method for Sand Size Analysis," CETN-11-14, US Army Engineer Waterways Experiment Station, Vicksburg, MS.
Waddell, E. 1976. "Swash-Groundwater-Beach Profile Interaction," In: R. A. Davis and R. L. Ethington, eds., Beach and Nearshore Sedimentation, S.E.P.M. Special Publication No. 24, pp 115-125.

APPENDIX A : PROFILE CHANGE PLOTS
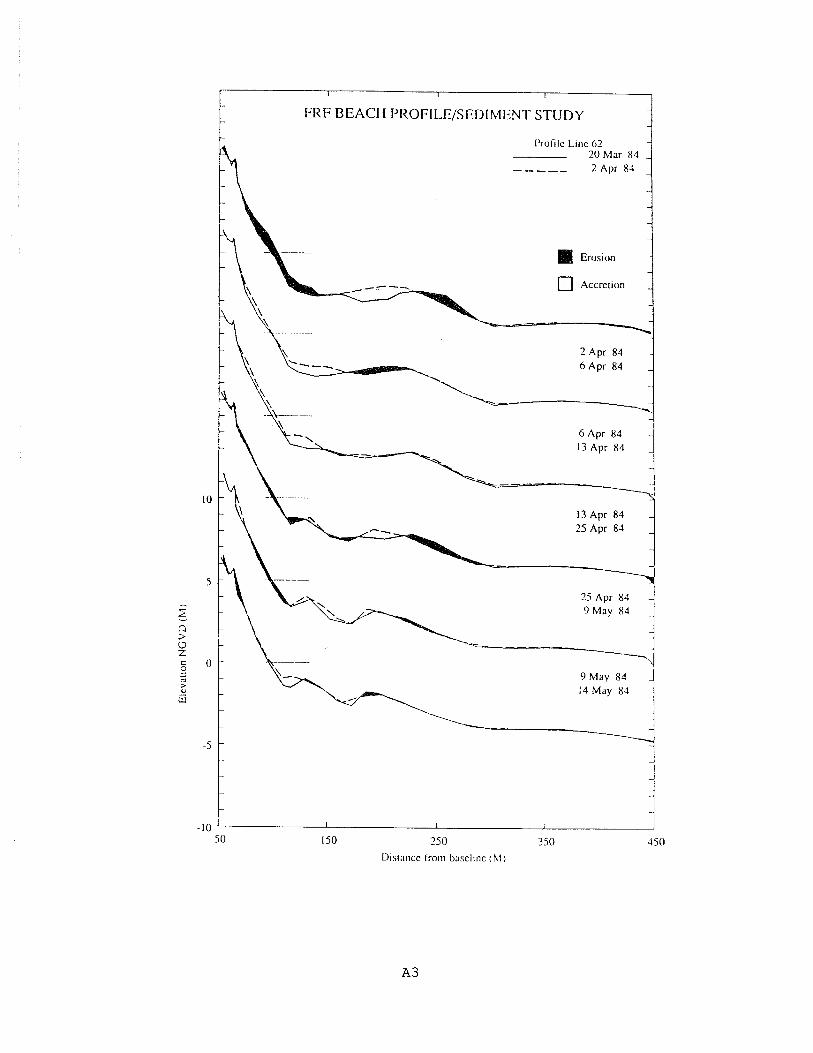

I'rofiie Line 62
----- 21 May 84
28 June 84
5 0 150 250 Disr;incc f ~ . o ~ n I,;~.;cl~tlc (h.1)

FRF BEACH PROFILEJSEDIMENT STUDY
I'rofile Line 63-
10
5
0
-5
- 10 5 0 150 250 350 450
Uislaricc Irorii 0;tscl111c ( h l )
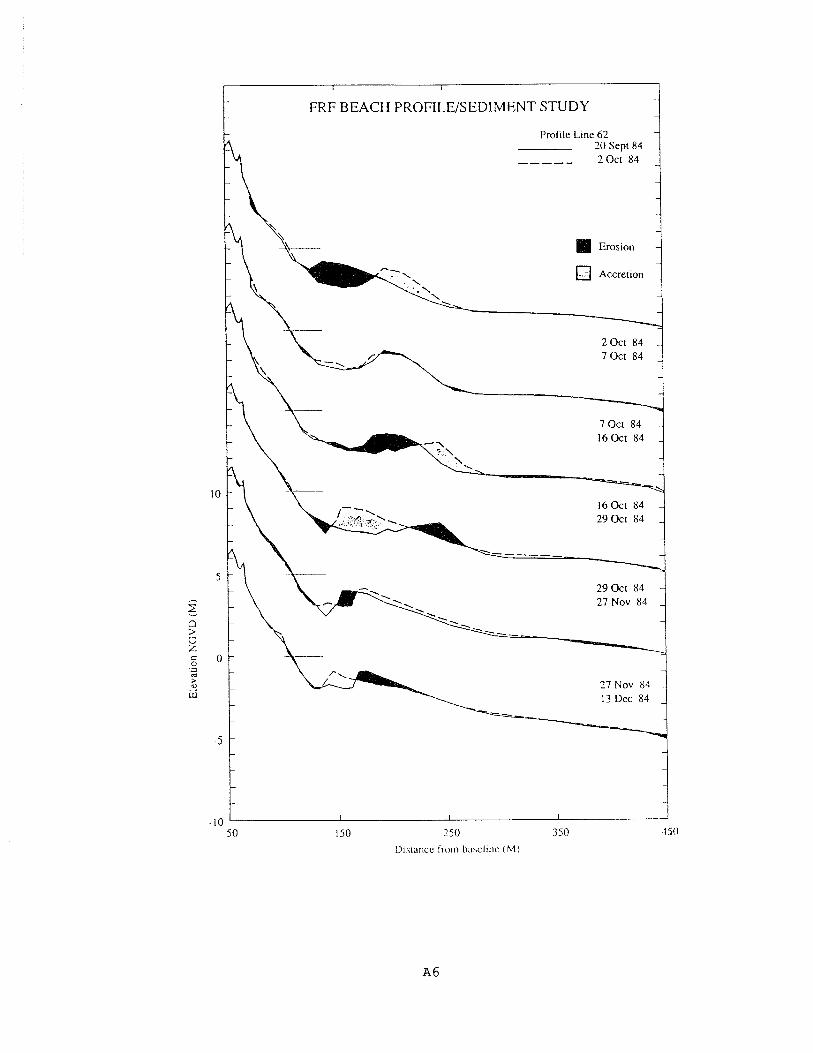
FRF BEACH PROFILEJSEDIMENT STUDY
-- 2 OCI 84
10
5
- r: a > U Z
2 O 3
> - W
5
-10 50 150 250 350 150
D~\r.~rlce fro111 h , ~ \ c l ~ ~ l c ( h l )

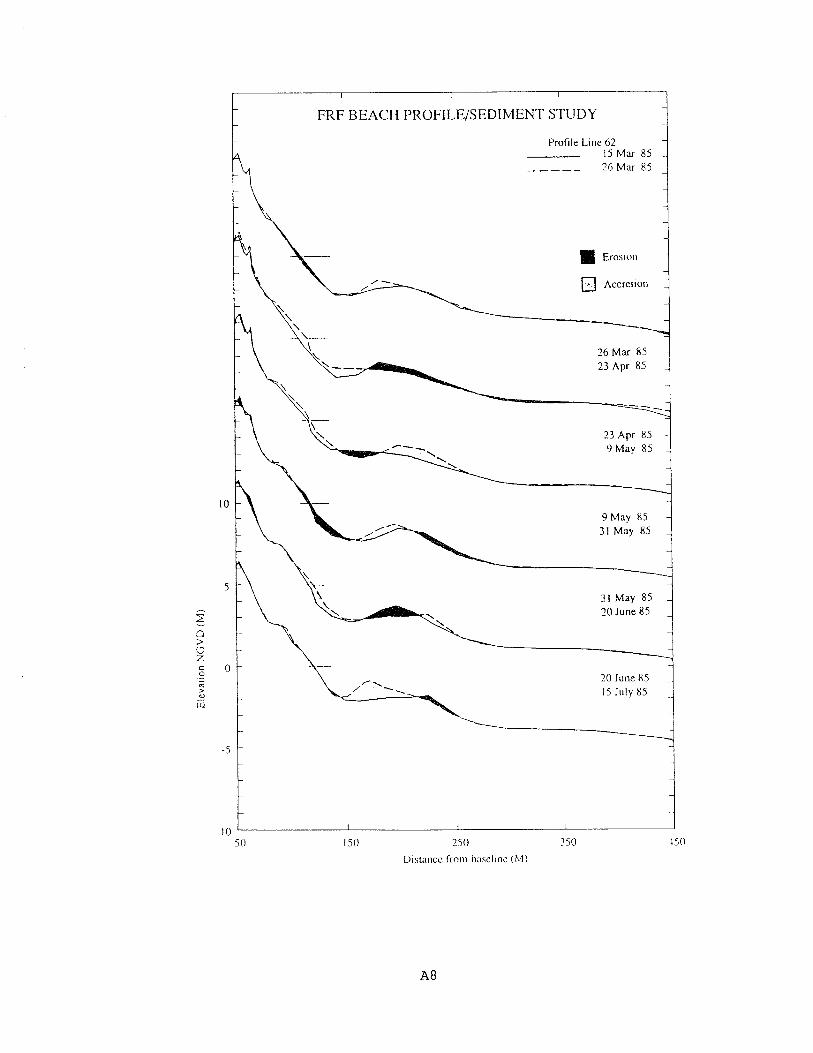

I I
FRF BEACH PROFILE/SEDIMENT STUDY
Profile Line 62 15 J u l y 8 5
----- 24 J u l y 85
81 Erosion

APPENDIX B: SEDIMENT DATA

Appendix B contains the individual sample grain-size analysis data
sheets. The Sample number identifies the location on the profile, and the
Date identifies when the sample was taken. The code to understand the Sample
number is as follows:
ex. Sample 6214101
62 = Profile Line 62 at the Field Research Facility (FRF)
141 = profile number (141 to 188)
01 = sample location on profile (1 to 17)
The X position is the position of Profile Line 62 on the FRF grid in feet.
The Y position is across the profile, from the backstake to nearshore in feet.
Each sample was a grab sample, and the Elevation to Top of Core represents the
surface elevation on the profile where the sample was collected in feet.
The table of sieve weights are in 1/4-phi intervals from 6.727 mm (-2.75 4 ) to 0.016 mm (6.00 4 ) . Columns in the table are phi sieve size, corresponding
millimetre equivalent, weight retained on each sieve in grams, weight percent
(Percnt) of sample in each sieve, and the cumulative weight percent (Cumul
Percnt) of sieves. The start weight was the initial weight of the sample
before sieve analysis, and the final weight was the weight of the total sample
after sieve analysis by sonic sifter. The percent deviation was the amount of
sand lost or gained during analysis. Data also give the percentage by weight
of each sediment type of either the Wentworth or the Unified Soils Classifica-
tion. The standard statistical values of median, mean, standard deviation
(Dev.), skewness (Skew), and kurtosis (Kurt) are given in phi units using the
Method of Moments, Folk Graphic Measures, and millimetre conversions for
median and mean. Output was generated by the Interactive Sediment Analysis
sediment analysis program.
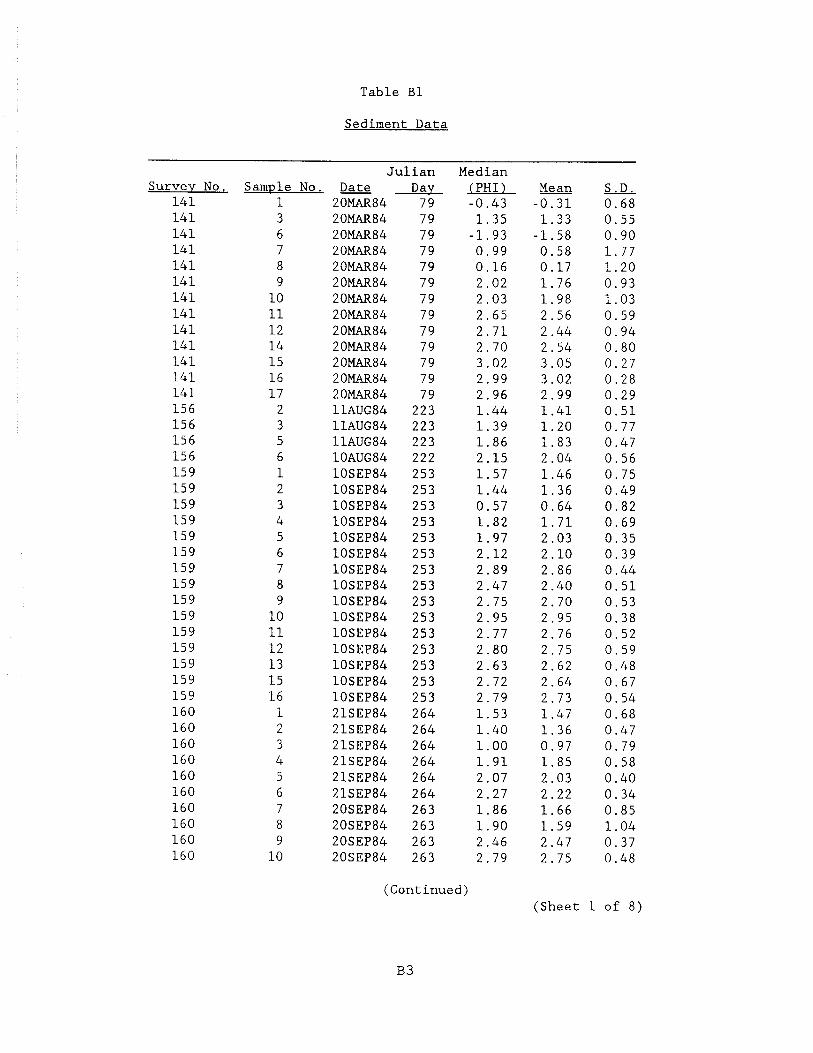
Table B1
Sediment Data
Survey No. 141 141 141 141 141 141 141 141 141 141 141 141 141 156 156 156 156 159 159 159 15 9 159 15 9 159 159 159 159 159 159 159 159 159 160 160 160 160 160 160 160 16 0 16 0 160
Sample No. 1 3 6 7 8 9 10 11 12 14 15 16 17 2 3 5 6 1 2 3 4 5 6 7 8 9 10 11 12 13 15 16
Julian Median Date Day (PHI ) 20MAR84 79 -0.43 2OMAR84 79 1.35 20MAR84 79 -1.93 20MAR84 79 0.99 2OMAR84 79 0.16 20MAR84 79 2.02 2OMAR84 79 2.03 2OMAR84 79 2.65 2OMAR84 79 2.71 2OMAR84 79 2.70 2OMAR84 79 3.02 2OMAR84 79 2.99 2OMAR84 79 2.96 llAUG84 223 1.44 llAUG84 223 1.39 llAUG84 223 1.86 10AUG84 222 2.15 10SEP84 253 1.57 10SEP84 253 1.44 10SEP84 253 0.57 10SEP84 253 1.82 10SEP84 253 1.97 10SEP84 253 2.12 10SEP84 253 2.89 10SEP84 253 2.47 10SEP84 253 2.75 10SEP84 253 2.95 10SEP84 253 2.77 10SEP84 253 2.80 10SEP84 253 2.63 10SEP84 253 2.72 10SEP84 253 2.79 21SEP84 264 1.53 21SEP84 264 1.40 21SEP84 264 1.00 21SEP84 264 1.91 21SEP84 264 2.07 21SEP84 264 2.27 20SEP84 263 1.86 20SEP84 263 1.90 20SEP84 263 2.46 20SEP84 263 2.79
Mean - S.D. -0.31 0.68 1.33 0.55 -1.58 0.90 0.58 1.77 0.17 1.20 1.76 0.93 1.98 1.03 2.56 0.59 2.44 0.94 2.54 0.80 3.05 0.27 3.02 0.28 2.99 0.29 1.41 0.51 1.20 0.77 1.83 0.47 2.04 0.56 1.46 0.75 1.36 0.49 0.64 0.82 1.71 0.69 2.03 0.35 2.10 0.39 2.86 0.44 2.40 0.51 2.70 0.53 2.95 0.38 2.76 0.52 2.75 0.59 2.62 0.48 2.64 0.67 2.73 0.54 1.47 0.68 1.36 0.47 0.97 0.79 1.85 0.58 2.03 0.40 2.22 0.34 1.66 0.85 1.59 1.04 2.47 0.37 2.75 0.48
(Continued) (Sheet 1 of 8)

Table B1 (Continued)
Survey No. 160 160 160 160 160 160 160 161 161 16 1 161 161 16 1 161 161 161 161 161 16 1 161 161 161 161 161 163 163 163 163 163 163 163 163 163 163 163 163 163 16 3 165 165 165 165 165 165
Sample No. 11 12 13 14 15 16 17 1 2 3 4 5 6 7 8 9 10 11 12 13 14 15 16 17 1 2 3 4 7 8 9 10 11 12 13 14 15 17 1 2 3 4 5 7
Julian Day 2 6 3 255 263 263 263 263 263 275 275 275 275 275 275 275 275 275 275 275 275 275 275 275 275 275 2 8 8 288 2 8 8 288 289 289 289 289 289 289 289 289 2 8 9 2 8 9 302 302 302 302 302 302
Median (PHI) 2.96 2.75 2.45 2.78 2.86 2.89 2.90 1.55 1.48 0.45 -0.11 0.92 -0.74 0.67 2.30 2.08 2.80 2.76
Mean 2.92 2.63 2.30 2.81 2.89 2.92 2.94 1.45 1.48 0.57 0.20 1.01 -0.79 0.54 2.22 1.96 2.73 2.75 2.70 2.69 2.96 2.96 2.76 2.98 1.23 1.38 0.72 0.38 -0.55 1.49 0.97 2.38 2.54 2.52 2.26 2.63 2.88 2.37 1.54 1.30 0.87 1.36 1.79 2.46
(Continued) (Sheet

Table B1 (Continued)
Survev No. 165 165 165 165 165 165 165 165 165 165 167 167 167 167 16 7 167 167 167 167 167 167 167 167 167 167 167 169 169 169 169 169 169 169 169 169 169 169 169 169 169 169 169 170 170
Sample No. 8 9 10 11 12 13 14 15 16 17 2 3 4 5 6 7 8 9 10 11 12 13 14 15 16 17 2 3 4 5 6 7 8 9 10 11 12 13 14 15 16 17 1 2
Julian Date Dav 290CT84 302 290CT84 302 290CT84 302 290CT84 302 290CT84 302 290CT84 302 290CT84 302 290CT84 302 290CT84 302 290CT84 302 27NOV84 331 27NOV84 331 27NOV84 331 27NOV84 331 27NOV84 331 27NOV84 331 27NOV84 331 27NOV84 331 27NOV84 331 27NOV84 331 27NOV84 331 27NOV84 331 27NOV84 331 27NOV84 331 27NOV84 331 27NOV84 331 02JAN85 367 02JAN85 367 02JAN85 367 02JAN85 367 02JAN85 367 02JAN85 367 02JAN85 367 02JAN85 367 02JAN85 367 02JAN85 367 02JAN85 367 02JAN85 367 02JAN85 367 02JAN85 367 02JAN85 367 02JAN85 367 05JAN85 370 05JAN85 370
Median ( P H I ) 2.27 2.46 2.56 2.85 2.71 2.75 2.81 2.91 2.94 3.05 1.47 0.61 1.62 1.44 0.05 2.25 2.04 2.61 2.75 2.90 2.83 2.83 2.93 3.01 3.00 2.96 1.08 0.80 0.96 2.10 1.96 1.47 2.55 2.73 2.75 2.86 2.86 2.89 2.78 2.95 3.01 3.00 1.41 1.54
(Continued) (Sheet 3

Table B1 (Continued)
Survey No. 170 170 170 170 170 170 170 170 170 170 170 170 170 170 171 171 171 171 171 171 171 171 171 171 171 171 171 171 171 173 173 173 173 173 17 3 173 173 173 173 173 173 17 3 173 173
Sample No. 3
Julian
370 370 370 370 370 370 370 370 370 370 370 370 370 370 390 390 390 390 390 390 390 390 390 390 390 390 390 390 390 410 410 410 410 410 410 410 410 410 410 410 410 410 410 410
Median (PHI) 0.99 1.43 1.89 1.90 2.52 2.30 1.93 2.64 2.54 2.76 2.86 3.00 3.05 3.02 0.62 1.28 1.85 1.92 2.30 2.09 1.72 2.70 2.73 2.86 3.01 3.01 3.05 3.02 3.02 1.34 1.39 1.03 1.71 1.74 -1.37 2.34 2.37 2.17 2.28 2.49 2.74 2.84 2.94 3.04
S.D. 0.96 0.75 0.75 0.83 0.54 0.54 0.62 0.64 0.71 0.58 0.43 0.42 0.37 0.34 1.01 0.76 0.65 0.57 0.74 0.48 0.81 0.29 0.40 0.32 0.78 0.29 0.29 0.36 0.32 0.68 0.49 0.92 0.86 0.73 1.19 0.45 0.60 0.71 0.67 0.58 0.29 0.26 0.29 0.37
(Continued) (Sheet 4

Table B1 (Continued)
Survey No. 173 173 174 174 174 174 174 174 174 174 174 174 174 174 174 174 174 17 5 175 17 5 175 175 17 5 175 175 175 175 17 5 175 175 175 175 17 9 179 179 179 179 17 9 179 17 9 179 179 179 17 9
Sample No. 16 17 3 4 5 6 7 8 9 10 11 12 13 14 15 16 17 3 4 5 6
Julian Day 410 410 425 425 425 42 5 42 5 42 5 425 425 425 425 425 425 425 425 425 439 439 439 439 439 439 439 439 439 439 439 439 439 439 439 494 494 494 494 494 494 494 494 494 494 494 494
Median (PHI 1 3.09 3.07 0.97 1.61 2.13 2.01 2.38 2.29 2.48 2.41 2.70 2.71 2.75 2.91 3.06 3.10 3.06 0.04 1.44 1.92 1.55 2.31 2.26 2.46 2.71 2.75 2.65 2.63 2.84 3.00 3.06 3.05 0.76 1.95 1.93 2.10 2.45 2.09 2.20 2.70 2.67 2.52 2.71 2.93
(Continued) (Sheet 5

Table B1 (Continued)
Survey No. 17 9 179 180 180 180 180 180 180 180 180 180 180 180 180 180 180 181 181 181 181 181 181 181 18 1 181 181 181 181 181 181 181 18 1 182 182 182 182 182 182 182 182 18 2 182 182 182
Sample No. 16 17 3 4 5 6 7 8 9 10 11 13 14 15 16 17 2 3 4 5 6 7 8 9 10 11 12 13 14 15 16
Julian Date D av 09MAY85 494 09MAY85 494 31MAY85 516 31MAY85 516 31MAY85 516 31MAY85 516 30MAY85 515 30MAY85 515 30MAY85 515 30MAY85 515 3OMAY85 515 30MAY85 515 30MAY85 515 30MAY85 515 30MAY85 515 30MAY85 515 20JUN85 536 20JUN85 536 20JUN85 536 20JUN85 536 20JUN85 536 20JUN85 536 20JUN85 536 20JUN85 536 20JUN85 536 20JUN85 536 20JUN85 536 20JUN85 536 20JUN85 536 20JUN85 536 20JUN85 536 20JUN85 536 15JUL85 561 15JUL85 561 15JUL85 561 15JUL85 561 15JUL85 561 15JUL85 561 15JUL85 561 15JUL85 561 15JUL85 561 15JUL85 561 15JUL85 561 15JUL85 561
Median (PHI ) 3.04 3.14 0.86 1.85 1.95 1.44 2.25 2.33 2.47 2.49 2.58 2.42 2.84 2.90 2.90 3.06 1.49 0.83 1.90 1.95 1.94 1.99 2.53 2.40 2.61 2.60 2.53 2.53 2.69 2.84 2.79 2.90 1.49 0.37 1.75 1.63 -1.47 2.33 2.03 2.31 2.65 2.74 2.60 2.44
Mean 3.07 3.16 0.85 1.69 1.82 1.23 2.24 2.24 2.48 2.26 2.54 2.34 2.83 2.93 2.93 3.08 1.46 0.82 1.58 1.83 1.37 1.88 2.43 2.24 2.56 2.51 2.45 2.47 2.75 2.88 2.85 2.95 1.46 0.63 1.37 1.54 -1.16 2.31 1.91 2.25 2.54
(Continued) (Sheet 6

Table B1 (Concluded)
Survev No. Sample 182 14 182 15 182 16 182 17 184 1 184 2 184 3 184 4 184 5 184 6 184 7 184 8 184 9 184 10 184 11 184 12 184 13 184 14 184 15 184 16 184 17 186 1 186 2 186 3 18 6 4 186 5 186 6 186 7 18 6 8 18 6 9 18 6 10 186 11 186 12 18 6 13 186 14 186 15 186 16 186 17 188 2 18 8 3 188 4 18 8 5 188 6 188 7
Julian No. Date Day
15JUL85 561 15JUL85 561 15JUL85 561 15JUL85 561 15JUL85 561 08AUG85 585 08AUG85 585 08AUG85 585 07AUG85 584 07AUG85 584 07AUG85 584 07AUG85 584 07AUG85 584 07AUG85 584 07AUG85 584 07AUG85 584 07AUG85 584 07AUG85 584 07AUG85 584 07AUG85 584 07AUG85 584 21AUG85 598 21AUG85 598 21AUG85 598 21AUG85 598 21AUG85 598 21AUG85 598 21AUG85 598 21AUG85 598 21AUG85 598 21AUG85 598 21AUG85 598 21AUG85 598 21AUG85 598 21AUG85 598 21AUG85 598 21AUG85 598 21AUG85 598 06SEP85 614 06SEP85 614 06SEP85 614 06SEP85 614 06SEP85 614 06SEP85 614
Median (PHI) 2.65
(Continued) (Sheet 7

Table B1 (Concluded)
Survey No. 188 188 188 188 188 188 188 188 188 188
Sample 8 9
10 11 12 13 14 15 16
No. Date -- 06SEP85 06SEP85 06SEP85 06SEP85 06SEP85 06SEP85 06SEP85 06SEP85 06SEP85 06SEP85
Julian DaV
6 14 6 14 6 14 6 14 6 14 6 14 6 14 6 14 6 14 6 14
Median (PHI) Mean S.D. 2.47 2.39 0.66 2.50 2.44 0.59 2.70 2.63 0.71 2.76 2.79 0.44 2.52 2.48 0.63 2.63 2.65 0.48 2.84 2.80 0.62 3.01 3.01 0.33 3.06 3.10 0.31 3.07 3.10 0.32
(Sheet 8 of 8)

Locality Type Sample Date Profile Analysis Date Analy7 39 G 6214101 840320 8 6 0 3 1 1 LS C
X Positlon : 3300 .00 Y Position : 165 .00
Elevation of Top of Core : 20 .50 Length of Core 0 . 0 0 Depth to Top of Sample : 0 .00 Depth to Bottom of Sample :
Comments :
Start Weiqht : 61 .200 Final Welght
PHI Weight Percnt cumul Percnt ------
0.000 0 .000 0 .000 0.000 0 .000 0 .590 2.940
11.519 24.169 44 .038
PHI HM
Deviation : 0 . 0 1 1 %
Weiqht Percnt Cumul Percnt ------ ------ ------
0 . 6 6 1 1 . 0 8 0 98.459 0.428 0 .699 99.158
Sample Content by Weight Percent :
Gravel Sand Silt Clay coarse medium fine
Wentworth Classification 11.519 83.619 4 . 0 2 0 0 .842 0 .000 0 .000 Unified Classification 0 .000 11.519 84.959 3.502 0 .020 0.000
Standard Statistics : Median Mean DeV. Skew Kurt
Method of Moments (PHI) Folk Graphic Measures (PHI) Grain size (mm)
Sample Content by Weight Percent :
Locality Type Sample Date Profile Analysis Date Analyz 3 9 G 6214102 840320 8 6 0 3 1 1 LSC
X Position : 3300.00 Y Position : 1 9 5 . 0 0
Elevation of Top of Core : 1 1 . 3 0 Length of Core 0 . 0 0 Depth to Top of Sample : 0 . 0 0 Depth to Bottom of Sample :
Comments :
Start Weight : 50.740 Finil Weight : 50 .770 Deviation : 0 . 0 5 9 %
Gravel Sand Silt Clay coarse medium fine
PHI MM Weight Percnt Cumul Percnt ----- ----- ------ ------ ------
-2.75 6.727 0 .000 0 . 0 0 0 0.000 -2 .50 5.657 0 .000 0 .000 0 .000 -2.25 4 .757 0.000 0 .000 0 .000 - 2 . 0 0 4 . 0 0 0 0.609 1.200 1 .200 -1.75 3.364 0.462 0.910 2.110 -1.50 2 .828 1 . 6 9 1 3 . 3 3 1 5 .440 -1.25 2.378 3 .630 7 .150 12.590 -1 .00 2.000 6 . 6 9 1 13 .179 25.769 -0.75 1.682 6.722 13 .240 39.009 -0 .50 1 . 4 1 4 9 .946 19.590 58.600 -0 .25 1.189 6.788 13.370 71.970
0 . 0 0 1 . 0 0 0 3.442 6.780 78 .749 0 .25 0 . 8 4 1 2.818 5 . 5 5 1 84 .300 0 . 5 0 0.707 1 .680 3 .309 87.609 0.75 0 .595 1 .239 2 .440 90 .049 1 .00 0 . 5 0 0 1 .340 2.639 92.689 1.25 0 . 4 2 0 0 .929 1.830 94 .518 1 . 5 0 0.354 0 . 7 5 1 1 .479 95 .998
Wentworth Classification 25 .769 66 .919 6 .139 1 . 1 7 0 . 0 0 0 0 . 0 0 0 Unlfied Classification 0 .000 25.769 68.749 5 .462 0 . 0 2 0 0 . 0 0 0
PHI MM Weight Percnt Cumul Percnt ----- ----- ------ ------ ------
1 . 7 5 0.297 0 . 8 9 9 1 . 7 7 1 97 .768 2 . 0 0 0 .250 0 .538 1 . 0 6 0 98 .828 2.25 0 . 2 1 0 0 .269 0.530 99 .358 2.50 0 .177 0 . 1 1 2 0 . 2 2 1 99.578 2 .75 0 .149 0 . 0 4 1 0 . 0 8 1 99 .659 3 . 0 0 0 .125 0 . 0 4 1 0 . 0 8 1 9 9 . 7 4 0 3 .25 0.105 0 . 0 5 1 0 . 1 0 0 99 .840 3 .50 0.088 0 .030 0 .059 99 .900 3.75 0.074 0 . 0 4 1 0 . 0 8 1 99 .980 4.00 0.063 0 . 0 1 0 0.020 100.000 4.25 0.053 0 . 0 0 0 0 . 0 0 0 1 0 0 . 0 0 0 4.50 0 .044 0 . 0 0 0 0 . 0 0 0 100.000 4.75 0.037 0 . 0 0 0 0 . 0 0 0 100.000 5 .00 0 . 0 3 1 0 . 0 0 0 0 . 0 0 0 100 .000 5 .25 0.026 0 .000 0.000 100 .000 5 . 5 0 0.022 0 . 0 0 0 0 . 0 0 0 100 .000 5 .75 0 . 0 1 9 0 . 0 0 0 0 . 0 0 0 100 .000 6.00 0 .016 0 . 0 0 0 0.000 100 .000
Standard Statistics : Median Mean Dev. Skew Kurt
Method of Moments (PHI) Folk Graphic Measures (PHI) Grain Size (mm)

L o c a l i t y Type Sample Date P r o f i l e Analysis Date Analyz 39 G 6214103 840320 860313 LSC
X P o s i t i o n : 3300 .00 Y P o s i t i o n : 225 .00
Eleva t ion o f Top o f Core : 13.63 Length of Core 0.00 Depth t o Top of Sample : 0 . 0 0 Depth t o Bottom o f Sample :
Comments :
s t a r t Weight : 57.470 F i n a l Weiqht : 57 .471 Deviat ion : 0.002 %
PHI HM Weight Pe rcn t Cumul I PHI HI4 Weight Pe rcn t Cumul Perrnt Percn t
Sample Content by Weight Pe rcen t :
Gravel Sand S i l t Clay c o a r s e medium f i n e
Wentworth c l a s s i f i c a t i o n 0.000 32.538 56 .761 10 .701 0 .000 0 .000 Unif ied C l a s s i f i c a t i o n 0 . 0 0 0 0 . 0 0 0 45 .118 5 4 . 8 7 1 0 .010 0.000
Standa rd S t a t i s t i c s : Median ' Hean Dev. Skew Kurt
Hethod o f Moments (PHI) 1.33 0.55 0.08 2.37 ~ o l k Graphic Measures (PHI) 1 . 3 5 1 .33 0 .55 -0.02 0 . 8 1 Grain S i z e (m) 0.39 0 .40
L o c a l i t y Sample Date P r o f i l e Analysis Date Analyz 39 ? 6214106 8 4 0 3 2 0 860310 LSC
x p o s i t i o n : 3300 .00 Y P o s i t i o n : 325.00
Eleva t ion of Top of Core : Length of Core Depth t o Top o f Sample : k p t h t o Bottom o f Sample :
comments :
s t a r t w e i g h t : 46 .340 F i n a l w e i g h t : 46 .350 Deviat ion : 0.022 %
PHI MM Weight Pe rcn t CUmUl P e r c n t
PHI HM Weight Percnt CUmul Pe rcn t
Sample Content by Weight Pe rcen t :
Gravel Sand slit c l a y c o a r s e medium f i n e
Wentworth C l a s s i f i c a t i o n 86 .006 10 .162 2 .300 1 . 5 3 2 0 . 0 0 0 0 . 0 0 0 Cni f i ed Classification 0 . 0 0 0 86 .006 1 0 . 4 0 1 3.592 0 .000 0 . 0 0 0
Standa rd S t a t i s t i c s : Median Mean Dev. Skew Kurt
uethod of Moments (PHI) -1 .58 0 .90 6 1 0 . 3 5 Folk Graphic Measures (PHI) -1.94 -1.74 0 . 6 6 0.68 1 .60 Graln S i z e (EUU) 3.83 3 .00

Locality Type Sample Date Profile Analysis Date Analyz 39 G 6214107 540320 860311 LSC
X Position : 3300.00 Y Position : 425.00
Elevation of Top of Core : 6.25 Length of Core 0.00 Depth to Top of Sample : 0.00 Depth to Bottom of Sample :
Comments : FINE - IRON FLAKES FOUND THROUGHOUT Start Weiqht : 21.980 Final Weight : 21.981 Deviation : 0.005 %
PHI MM Weight Percnt Cumul PHI Mn Weight Percnt Cumul ~ercnt I Percnt
Sample Content by Weight Percent :
Gravel Sand Silt Clay coarse medium fine
Wentworth Classification 29.107 20.950 16.009 33.934 0.000 0.000 unified Classification 0.000 29.107 22.092 48.769 0.032 0.000
Standard Statistics : Median Mean Dev. Skew Xurt
Method of Moments (PHI) Folk Graphic Measures (PHI) Grain Size (mm)
Locality Type Sample Date Profile Analysis Date Analyz 3 9 G 6214108 840320 860311 LSC
X Position : 3300.00 Y Position : 650.00
Elevation of Top of Core : -9.30 Length of Core 0.00 Depth to Top of Sample : 0.00 Depth to Bottom of Sample :
Comments :
Start Weight : 60.890 Final Weight : 60.952 Deviation : 0.102 %
PHI
----- -2.75 -2.50 -2.25 -2.00 -1.75 -1.50 -1.25 -1.00 -0.75 -0.50 -0.25 0.00 0.25 0.50 0.75 1.00 1.25 1.50
Weight
------ Percnt CumUl
Percnt Weight Percnt
------ 3.860 4.090 1.851 2.740 1.299 0.430 0.071 0.000 0.000 0.000 0.000 0.000 0.000 0.000 0.000 0.000 0.000 0.000
Cumul Percnt ------ 89.520 93.610 95.460 98.200 99.500 99.929 100.000 100.000 100.000 100.000
Sample Content by Weight Percent :
Gravel Sand Silt Clay coarse medium fine
Wentworth Classification 17.891 57.468 18.250 6.390 0.000 0.000 Unified Classification 0.000 17.891 60.848 21.261 0.000 0.000
Standard Statistics : Median Mean Dev. Skew Kurt
Method of Moments (PHI) 0.17 1.20 -0.02 2.35 Folk Graphic Measures (PHI) 0.16 0.16 1.28 -0.02 1.04 Grain Size (mm) 0.89 0.89

Sample Content by Weight Percent :
Locality Type Sample Date Profile Analysis Date Analyz 19 G 6214109 840320 e60311 LSC
X Position : 3300.00 Y Position : 725.00
Elevation of Top of Core : -7.50 Length of Core 0.00 Depth to Top of Sample : 0.00 Depth to Bottom of Sample :
Comments :
Start Weiqht : 64.740 Final Weiqht : 64.850 Deviation : 0.170 %
Gravel Sand Silt Clay coarse medium fine
PHI MM Weight Percnt Cumul ~ercnt ----- ----- ------ ------ ------
-2.75 6.727 0.000 0.000 0.000 -2.50 5.657 0.000 0.000 0.000 -2.25 4.757 0.000 0.000 0.000 -2.00 4.000 0.000 0.000 0.000 -1.75 3.364 0.000 0.000 0.000 -1.50 2.828 0.123 0.190 0.190 -1.25 2.378 0.422 0.651 0.840 -1.00 2.000 0.467 0.720 1.561 -0.75 1.682 0.927 1.429 2.990 -0.50 1.414 1.083 1.670 4.660 -0.25 1.189 1.109 1.710 6.370 0.00 1.000 0.947 1.460 7.830 0.25 0.841 1.297 2.000 9.830 0.50 0.707 1.051 1.621 11.451 0.75 0.595 1.388 2.140 13.591 1.00 0.500 2.192 3.380 16.971 1.25 0.420 1.407 2.170 19.141 1.50 0.354 4.539 6.999 26.140
Wentworth Classification 1.561 15.411 32.109 50.919 0.000 0.000 Unified Classification 0.000 1.561 17.581 80.799 0.060 0.000
PHI HM Weight Percnt Cumul Percnt ----- ----- ------ ------ ------
1.75 0.297 4.728 7.291 33.431 2.00 0.250 10.149 15.650 49.081 2.25 0.210 9.760 15.050 64.131 2.50 0.177 13.871 21.389 85.520 2.75 0.149 6.498 10.020 95.540 3.00 0.125 2.322 3.581 99.121 3.25 0.105 0.363 0.560 99.681 3.50 0.088 0.071 0.109 99.790 3.75 0.074 0.097 0.150 99.940 4.00 0.063 0.039 0.060 100.000 4.25 0.053 0.000 0.000 100.000 4.50 0.044 0.000 0.000 100.000 4.75 0.037 0.000 0.000 100.000 5.00 0.031 0.000 0.000 100.000 5.25 0.026 0.000 0.000 100.000 5.50 0.022 0.000 0.000 100.000 5.75 0.019 0.000 0.000 100.000 6.00 0.016 0.000 0.000 100.000
Standard Statistics : Hedian Hean Dev. Skew Kurt
Hetinod of Howents (PHI) 1.76 0.93 -1.44 4.72 Folk Graphic Measures (PHI) 2.02 1.81 0.87 -0.47 1.42 Grain size (mm) 0.25 0.30
Locality 39
Sample 6214110
Date 840320
Profile Analysis Date Analyz 860311 LSC
x Position : 3300.00 Y Position : 800.00
Elevation of Top of Core : -7.80 Lenqth of Core 0.00 Depth to Top of Sample : 0.00 Depth to Bottom of Sample :
Comments :
Start Weiqht : 51.570 Final Weight : 51.531 Deviation : 0.076 %
PHI MM Weight Percnt Cumul Percnt ----- ----- ------ ------ ------
- 2 . 7 5 6.727 0.000 0.000 0.000
PHI MM Weight Percnt Cumul Percnt ----- ----- ------ ------ ------
1.75 0.297 5.519 10.710 38.381
Sample Content by Weiqht Percent :
Gravel Sand Silt Clay coarse medium fine
Wentworth classification 0.871 15.369 32.580 51.179 0.000 0.000 Cnified Classification 0.000 0.871 20.710 77.419 0.999 0.000
Standard Statistics : Median Mean Dev. Skew Kurt
!<ethod of Moments (PHI) Folk Graphlc Measures (PHI) Grain Size (mm)

Locality Type Sample Date Profile Analysis Date Anai); 3 9 G 6214111 840320 860311 L S C
X Position : 330o.00 Y Position : 1000.00
Elevation of Top of Core : -14.30 Length of Core 0.00 Depth to Top of Sample : 0.00 Depth to Bottom of Sample :
Comments : FINE
Start Weight : 52.230 Final Weiqht : 52.259 Deviation : 0.056 i.
PHI Weight Percnt cwu1 Percnt
PHI Weiqht Percnt
------ 0.899 1.801 5.611 19.501 30.351 26.250 8.171 2.579 0.329 0.071 0.000 0.000 0.000 0.000 0.000 0.000 0.000 0.000
CUmUl Percnt ------ 5.337 7.138 12.748
Sample Content by Weiqht Percent :
Gravel Sand Silt Clay coarse medium fine
Wentworth Classification 0.350 3.048 3.739 92.862 0.000 0.000 Unified classification 0.000 0.350 3.588 95.991 0.071 0.000
Standard Statistics : Hedian Mean Dev. Skew Kurt
Method of Moments (PHI) Folk Graphic Measures (PHI) Grain Size (mu)
Sample Date Profile Analysis Date Analyz 3 9 6214112 840320 860313 LSC
X position : 3300.00 Y position : 1300.00
Elevation of TOP of Core : -13.60 Length of Core 0.00 Depth to Top of Sample : 0.00 Depth to Bottom of Sample :
Comments :
Start weight : 50.690 Final Weight : 50.841 Deviation : 0.298 %
PHI MM Weight Percnt Cumul Percnt ------ ------
0.000 0.000 0.000 0.000 0.000 0.000
PHI HH Weight Percnt Cumul Percnt ----- ----- ------ ------ ------
1.75 0.297 1.032 2.030 16.201
Sample Content by Weight Percent :
Gravel Sand Silt Clay coarse medium fine
Wentworth classification 0.732 10.470 8.340 80.459 0.000 0.000 Unified Classification 0.000 0.732 12.100 86.908 0.260 0.000
Standard Statistics : Median Mean Dev. Skew Kurt
Method of Moments (PHI) Folk Graphic Measures (PHI) Grain Size (mm)

Loca l i t y Type Sample Date p r o f i l e h n a l y s i s Date Analyz 39 G 6214114 840320 860312 L S C
X P o s i t i o n : 3300.00 Y p o s i t i o n : 1650.00
Eleva t ion of Top of Core : Length of Core Depth t o Top of Sample : Depth t o Bottom of Sample :
Comments : FINE
S t a r t Weight : 59.500 F i n a l Weight : 59.390 Deviat ion :
PHI EM Weight P e r c n t Cumul Pe rcn t ----- ----- ------ ------ ------
PHI hI4
----- ----- Weight P e r c n t Cumul
Pe rcn t
Sample Content by Weight Pe rcen t :
Gravel Sand s i l t Clay c o a r s e medium f i n e
W e n t w o r t h C l a s s i f i c a t i o n 0.051 7.240 9.709 83.001 0.000 0.000 Unif ied c l a s s i f i c a t i o n 0.000 0.051 8.150 89.939 1.861 0.000
Standard S t a t i s t i c s : Median Mean Dev. Skew Kurt
Method of Moments (PHI) Folk Graphic Measures (PHI) Grain S i z e (mm)
Loca l i t y 3 9
Sample 6214115
Date 840320
P r o f i l e Ana lys i s Date Analyz 860312 LSC
X P o s i t i o n : 3300.00 Y P o s i t i o n : 2000.00
E l e v a t i o n of Top of Core : -20.40 Length of Core 0.00 Depth t o Top of Sample : 0.00 Depth t o Bottom of Sample :
Comments : FINE
s t a r t w e i g h t : 50.210 F i n a l w e i g h t : 50.169 Deviat ion : 0.082%
PHI EM Weight P e r c n t Cumul P e r c n t ----- ----- ------ ------ ------
PHI Ul4 Weight P e r c n t Cumul Pe rcn t ----- ----- ------ ------ ------
Sample Content by Weight Pe rcen t :
Gravel Sand S i l t Clay c o a r s e medium f i n e
W e n t w o r t h C l a s s i f i c a t i o n 0.000 0.000 0.060 99.940 0.000 0.000 Unif ied C l a s s i f i c a t i o n 0.000 0.000 0.000 98.850 1.150 0.000
Standard S t a t i s t i c s : Median Mean Dev. Skew Kurt
Method of Moments (PHI) 3.05 0.27 0.30 3.76 Folk Graphic Measures (PHI) 3.03 3.05 0.27 0.09 1.07 Grain Size (mm) 0.12 0.12

Locality Type Sample Date Profile Analysis Date Analyz 39 G 6214116 840320 860313 LSC
X Position : 3300.00 Y Position : 2700.00
Elevation of Top of Core : -25.10 Length of Core 0.00 Depth to Top of Sample : 0.00 Depth to Bottom of Sample :
Comments : FINE
Start Weight : 51.850 Final Weight : 51.521 Deviation : 0.635 9,
PHI
----- -2.75 -2.50 -2.25 -2.00 -1.75 -1.50 -1.25 -1.00 -0.75 -0.50 -0.25 0.00 0.25 0.50 0.75 1.00 1.25 1.50
Weight Percnt Cumu 1 Percnt ------ 0.000 0.000
PHI Weight Percnt CUmUl Percnt
Sample Content by Weight Percent :
Gravel Sand Silt Clay coarse medium fine
Wentworth Classification 0.000 0.000 0.060 99.940 0.000 0.000 Unified Classification 0.000 0.000 0.000 98.570 1.430 0.000
Standard Statistics : Median Mean Dev. Skew Kurt
Method of Moments (PHI) Folk Graphic Measures (PHI) Grain size (mm)
Locality Sample Date Profile Analysis Date Analyz 3 9 6214117 840320 860313 LSC
X Position : 3300.00 Y Position : 3000.00
Elevation of Top of core : -26.70 Length of Core 0.00 Depth to Top of Sample : 0.00 Depth to Bottom of Sample :
Comments : FINE
Start weight : 60.860 Final Weight : 60.761 Deviation : 0.163 9,
PHI MI4 Weight Percnt Cumul PHI MM Weight Percnt Cumul ~ercnt 1 Percnt
Sample Content by Weight Percent :
Gravel coarse
Wentworth Classification 0.000 0.071 Unified Classification 0.000 0.000
Standard Statistics : Median
Method of Moments (PHI) Folk Graphic Measures (PHI) 2.96 Grain Size (mm) 0.13
Sand Silt Clay medium fine
Mean Dev. Skew Kurt

Sample Content by Weight Percent :
Locality T Sample Date Profile Analysis Date Analyz 3 9 6215602 840811 850824 SGU
X Position : 3300.00 Y Position : 195.00
Elevation of Top of Core : 18.03 Length of Core 0.00 Depth to Top of Sample : 0.00 Depth to Bottom of Sample :
Comments : 1.25 PHI CORRECTION BY BEST LINEAR FIT, 27 JUN 86
start Weight : 59.070 Final Weight : 58.999 Deviation : 0.120 %
Gravel sand silt Clay coarse medium fine
PHI weight Percnt Cumul Percnt ----- ----- ------ ------ ------
-2.75 6.727 0.000 0.000 0.000 -2.50 5.657 0.000 0,000 0.000 -2.25 4.757 0.000 0.000 0.000 -2.00 4.000 0.000 0.000 0.000 -1.75 3.364 0.000 0.000 0.000 -1.50 2.828 0.000 0.000 0.000 -1.25 2.378 0.000 0.000 0.000 -1.00 2.000 0.000 0.000 0.000 -0.75 1.682 0.000 0.000 0.000 -0.50 1.414 0.041 0.069 0.069 -0.25 1.189 0.059 0.100 0.169 0.00 1.000 0.183 0.310 0.480 0.25 0.841 0.519 0.880 1.359 0.50 0.707 1.510 2.559 3.919 0.75 0.595 3.670 6.220 10.139 1.00 0.500 6.708 11.370 21.509 1.25 0.420 9.593 16.260 37.768 1.50 0.354 11.216 19.010 56.779
Wentworth Classification 0.000 21.509 68.589 9.902 0.000 0.000 Unified Classification 0.000 0.000 37.768 62.232 0.000 0.000
PHI Hn Weight Percnt Cumul Percnt ----- ----- ------ ------ ------
1.75 0.297 10.537 17.860 74.639 2.00 0.250 9.121 15.460 90.098 2.25 0.210 2.679 4.541 94.639 2.50 0.177 2.348 3.980 98.619 2.75 0.149 0.608 1.031 99.649 3.00 0.125 0.142 0.241 99.890 3.25 0.105 0.041 0.069 99.959 3.50 0.088 0.012 0.020 99.980 3.75 0.074 0.012 0.020 100.000 4.00 0.063 0.000 0.000 100.000 4.25 0.053 0.000 0.000 100.000 4.50 0.044 0.000 0.000 100.000 4.75 0.037 0.000 0.000 100.000 5.00 0.031 0.000 0.000 100.000 5.25 0.026 0.000 0.000 100.000 5.50 0.022 0.000 0.000 100.000 5.75 0.019 0.000 0.000 100.000 6.00 0.016 0.000 0.000 100.000
Standard Statistics : Median Mean Dev. Skew Kurt
Method of Moments (PHI) 1.40 0.52 -0.08 3.22 ~ o l k ~raphic Measures (PHI) 1.41 1.40 0.52 -0.02 1.01 Grain size (mm) 0.38 0.38
Locality Sample Date Profile Analysis Date Analyz 3 9 6215603 840811 850827 SGU
x position : 3300.00 Y Position : 219.00
Elevation of Top of Core : 14.34 Length of Core 0.00 wpth to TOP of sample : 0.00 wpth to Bottom of Sample :
Comments : 1.25 PHI CORRECTION BY BEST LINEAR FIT; 27 JUN 86
Start Weight : 64.950 Final Weight : 64.832 Deviation : 0.182 %
PHI Hn Weight Percnt Cumul PHI m Weight Percnt Cumul Percnt I Percnt
Sample Content by Weight Percent :
Gravel Sand silt clay coarse medium fine
Wentworth Classification 1.151 34.589 53.830 10.430 0.000 0.000 Unified Classification 0.000 1.151 41.620 57.229 0.000 0.000
Standard Statistics : Median Mean Dev. Skew Kurt
Kethod of Moments (PHI) 1.20 0.77 -0.89 4.32 Folk Graphic Measures (PHI) 1.35 1.24 0.74 -0.24 1.10 Grain Size (nm) 0.39 0.43

Locality Type Sample Date Profile Analysis Date Analyz 39 G 6215604 eao8ii 850827 SGU
X Position : 3300.00 Y Position : 250.00
Elevation of Top of Core : 7.41 Length of Core 0.00 Depth to Top of Sample : 0.00 Depth to Bottom of Sample :
Comments : 1.25 PHI CORRECTION BY BEST LINEAR FIT: 27 JUN 86
Start Weight : 54.320 Final Weight : 54.150 Deviation : 0.313 8
PHI MU Weight Percnt Cumul Percnt ----- ----- ------ ------ ------
PHI HM Weight Percnt Cumul Percnt ----- ----- ------ ------ ------
Sample Content by Weight Percent :
Gravel Sand Silt Clay coarse medium fine
Wentworth Classification 1.370 28.369 55.921 14.340 0.000 0.000 Unified Classification 0.000 1.370 38.410 60.220 0.000 0.000
Standard Statistics : Median Mean Dev. Skew Kurt
Method of Moments (PHI) 1.30 0.79 -0.99 4.09 Folk Graphic Measures (PHI) 1.46 1.33 0.76 -0.30 1.13 Grain size (mm) 0.36 0.41
Locality Type Sample Date Profile Analysis Date Analyz 3 9 G 6215605 840811 850827 SGU
X Position : 3300.00 Y Position : 292.00
Elevation of Top of Core : 6.49 Length of Core 0.00 Depth to Top of Sample : 0.00 Depth to Bottom of Sample :
Comments : 1.25 PHI CORRECTION BY AVERAGING: 27 JUN 86
Start Weight : 50.050 Final Weight : 49.782 Deviation : 0.535
PHI Weight Percnt Cumul Percnt
PHI HM Weight Percnt Cumul Percnt ------ ------ ------
8.268 16.608 37.158
Sample Content by Weight Percent :
Gravel Sand Silt Clay coarse medium fine
Wentworth Classification 0.020 5.990 59.057 34.932 0.000 0.000 Unified Classification 0.000 0.020 8.901 91.079 0.000 0.000
Standard Statistics : Yedian Mean Dev. Skew Kurt
Eethod of Moments (PHI) 1.83 0.47 -0.76 4.49 Folk Graphic Measures (PAI) 1.87 1.86 0.46 -0.11 1.08 Grain size (mm) 0.27 0.28

Locality Type Sample Date Profile Analysis Date Analyz 3 9 G 6215606 840810 850827 SGU
x Position : 3300.00 Y Posltion : 324.00
Elevation of Top of Core : 1.66 Length of Core 0.00 hpth to Top of Sample : 0.00 Depth to Bottom of Sample :
Comments :
Start Weight : 52.610 Final Weight : 52.330 Deviation : 0.532 %
PHI
----- -2.75 -2.50 -2.25 -2.00 -1.75 -1.50 -1.25 -1.00 -0.75 -0.50 -0.25 0.00 0.25 0.50 0.75 1.00 1.25 1.50
Weight Percnt CumUl Percnt ------ 0.000 0.000
PHI
----- 1.75 2.00 2.25 2.50 2.75 3.00 3.25 3.50 3.75 4.00 4.25 4.50 4.75 5.00 5.25 5.50 5.75 6.00
Weight Percnt Cumul Percnt
sample Content by Weight Percent :
Gravel Sand Silt Clay coarse medium fine
Wentworth Classification 0.589 3.751 33.700 61.961 0.000 0.000 Unified Classification 0.000 0.589 4.951 94.460 0.000 0.000
Standard Statistics : Median Mean Dev. Skew Kurt
Method of Moments (PHI) 2.04 0.56 -2.64 14.25 Folk Graphic Measures (PHI) 2.15 2.10 0.41 -0.29 1.15 Grain size (mm) 0.22 0.24
Locality 39
Sample 6215901
Date 840910
Profile Analysis Date Analyz 850828 TAY
X Position : 3300.00 Y Position : 168.70
Elevation of Top of Core : 20.79 Length of Core 0.00 DepthtoTopofSample : 0.00 Depth to Bottom of Sample :
Comments : PRE-HURRICANE DIANA SURVEY,BLOWING WIND b RAIN
Start Weight : 52.230 Final Weight : 51.760 Deviation : 0.900 %
PHI
----- -2.75 -2.50 -2.25 -2.00 -1.75 -1.50 -1.25 -1.00 -0.75 -0.50 -0.25 0.00 0.25 0.50 0.75 1.00 1.25 1.50
Weight Percnt curnu1 Percnt
PHI
----- 1.75 2.00 2.25 2.50 2.75 3.00 3.25 3.50 3.75 4.00 4.25 4.50 4.75 5.00 5.25 5.50 5.75 6.00
Weight Percnt
------ 13.470 16.750 8.910 10.091 3.190 1.061 0.290 0.060 0.000 0.000 0.000 0.000 0.000 0.000 0.000 0.000 0.000 0.000
clmul Percnt ------
Sample Content by Weight Percent :
Gravel Sand Silt Clay coarse medium fine
Kentworth classification 0.278 27.660 48.460 23.601 0.000 0.000 unified Classification 0.000 0.278 32.780 66.942 0.000 0.000
Standard Statistics : Median Mean Dev. Skew Kurt
Kethod of Moments (PHI) Folk Graphic Measures (PHI) Grain Size (mm)
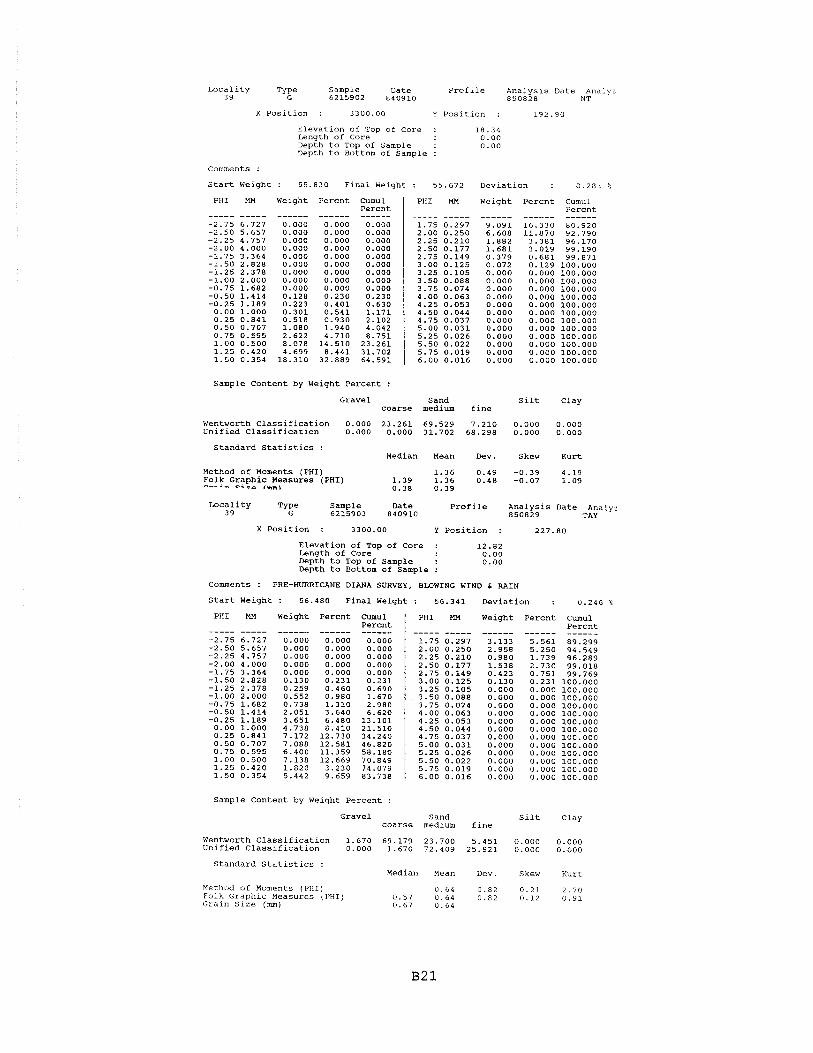
Sample Date Profile Analysis Date Analyz 3 9 6215902 840910 850828 NT
X Position : 3300.00 Y Position : 192.90
Elevatlon of Top of Core : 18.34 Length of Core 0.00 Depth to Top of Sample : 0.00 Depth to Bottom of Sample :
Comments :
Start Weight : 55.830 Final Weight : 55.672 Deviation : 0.283 h
PHI MN Weight Percnt Cumul PHI MM Weight Percnt Cumul Percnt I Percnt
Sample Content by Weight Percent :
Gravel Sand Silt Clay coarse medium fine
Wentworth Classification 0.000 23.261 69.529 7.210 0.000 0.000 Unified Classification 0.000 0.000 31.702 68.298 0.000 0.000
Standard Statistics : Median Mean Dev. Skew Kurt
Method of Moments (PHI) 1.36 0.49 -0.39 4.19 Folk Graphic Measures (PHI) - - - a - c;,, ,,,)
1.39 1.36 0.48 -0.07 1.09 0.38 0.39
Locality Type Sample Date Profile Analysis Date Analyz 39 G 6215903 840910 850829 TAY
X Position : 3300.00 Y Position : 227.80
Elevation of Top of Core : 12.82 Length of Core 0.00 DepthtoTopofSample : 0.00 Depth to Bottom of Sample :
Comments : PRE-HURRICANE DIANA SURVEY, BLOWING WIND & RAIN
Start Weight : 56.480 Final Weight : 56.341 Deviation : 0.246 %
PHI MM Weight Percnt Cumul Percnt ----- ----- ------ ------ ------
PHI MM Weight Percnt Cumul Percnt ----- ----- ------ ------ ------
0.751 0.231 0.000 0.000 0.000 0.000 0.000 0.000 0.000 0.000 o. oon
100.000 100.000 100.000 100.000 100.000 i n n nnn
Sample Content by Weight Percent :
Gravel Sand Silt Clay coarse medium fine
Wentworth Classification 1.670 69.179 23.700 5.451 0.000 0.000 unified Classification 0.000 1.670 72.409 25.921 0.000 0.000
Standard Statistics : Median Mean Dev. Skew Kurt
Method of Moments (PHI) 0.64 0.82 0.21 2.70 Folk Graphic Measures (PHI) 0.57 0.64 0.82 0.12 0.91 Grain Size (mm) 0.67 0.64

Locality Type Sample Date Profile Analysls Date Analyz 3 9 G 6215904 840910 850829 TAY
x Position : 3300.00 Y Position : 260.70
Elevation of Top of Core : Length of Core Depth to Top of Sample : Depth to Bottom of Sample :
Comments : PRE-HURRICANE DIANA SURVEY
Start Weight : 57.050 Final Weight : 56.971 Deviation : 0.138 %
PHI
----- -2.75 -2.50 -2.25 -2.00 -1.75 -1.50 -1.25 -1.00 -0.75 -0.50 -0.25 0.00 0.25 0.50 0.75 1.00 1.25 1.50
Weight Percnt CumUl Percnt
PHI Weight Percnt
------ 15.250 25.439 10.970 15.970 3.370 1.301 0.260 0.049 0.000 0.000 0.000 0.000 0.000 0.000 0.000 0.000 0.000 0.000
CumUl Percnt ------ 42.641
Sample Content by Weight Percent :
Gravel Sand Silt Clay coarse medium fine
Wentworth Classification 0.830 11.620 55.630 31.920 0.000 0.000 Unified Classification 0.000 0.830 14.040 85.129 0.000 0.000
Standard Statistics : Median Mean Dev. Skew Kurt
Method of Moments (PHI) 1.71 0.69 -1.60 7.07 ~ o l k Graphic Measures (PHI) 1.82 1.81 0.59 -0.20 1.24 Grain Size fmm) 0.28 0.31
Locality Sample Date Profile Analysis Date Analyz 39 6215905 840910 850829 TAY
xposition : 3300.00 Y Position : 294.80
Elevation of Too of Core : T ~ n o t h of Core >--- - - - - - - Depth to Top of Sample : Depth to Bottom of Sample :
Comments : PRE-HURRICANE DIANA SURVEY
Start Weight : 55.510 Final Weight : 55.202 Deviation : 0.555 %
PHI IM Weight Percnt Cumul PHI IM Weight Percnt Cumul Percnt I Percnt ----- ----- ------ ------ ------ ----- ----- ------ ------ ------
Sample Content by Weight Percent :
Gravel Sand Silt Clay coarse medium fine
Wentworth Classification 0.000 0.219 53.560 46.221 0.000 0.000 Unified Classification 0.000 0.000 0.560 99.429 0.011 0.000
Standard Statistics : Median Mean Dev. Skew Kurt
Kethod of Moments (PHI) Folk Graphic Measures (PHI) Grain Size (m)

Locality Type Sample Date Profile Analysis Date Analyz 39 G 6215906 840910 850829 TAY
X Position : 3300.00 Y Position : 317.10
Elevation of Top of Core : Length of Core Depth to Top of Sample : Depth to Bottom of Sample :
Comments : PRE-HURRICANE DIANA SURVEY
Start Weiqht : 56.810 Final Weight : 56.410 Deviation : 0.704 %
PHI MH Weight Percnt Cumul Percnt ------ ------
0.000 0.000 0.000 0.000 0.000 0.000 0.000 0.000 0.000 0.000 0.000 0.000 0.000 0.000 0.000 0.000 0.000 0.000 0.000 0.000 0.000 0.000 0.000 0.000 0.000 0.000 0.000 0.000 0.069 0.069 0.410 0.479 0.961 1.439 5.230 6.669
PHI MM Weight Percnt Cumul Percnt ----- ----- ------ ------ ------
1.75 0.297 6.058 10.739 17.408 2.00 0.250 13.048 23.131 40.539 2.25 0.210 11.062 19.610 60.149 2.50 0.177 15.118 26.800 86.949 2.75 0.149 5.382 9.541 96.490 3.00 0.125 1.737 3.079 99.569 3.25 0.105 0.243 0.431 100.000 3.50 0.088 0.000 0.000 100.000 3.75 0.074 0.000 0.000 100.000 4.00 0.063 0.000 0.000 100.000 4.25 0.053 0.000 0.000 100.000 4.50 0.044 0.000 0.000 100.000 4.75 0.037 0.000 0.000 100.000 5.00 0.031 0.000 0.000 100.000 5.25 0.026 0.000 0.000 100.000 5.50 0.022 0.000 0.000 100.000 5.75 0.019 0.000 0.000 100.000 6.00 0.016 0.000 0.000 100.000
Sample Content by Weight Percent :
Gravel Sand Silt Clay coarse medium fine
Wentworth Classification 0.000 0.479 40.060 59.461 0.000 0.000 Unified classification 0.000 0.000 1.439 98.561 0.000 0.000
Standard Statistics : Median Hean Dev. Skew Kurt
Method of Homents (PHI) 2.10 0.39 -0.25 2.95 Folk Graphic Measures (PHI) 2.12 2.10 0.38 -0.08 0.95 Grain size (mm) 0.23 0.23
Locality Type Sample Date Profile Analysis Date Analyz 3 9 G 6215907 840910 850829 T AY
X Position : 3300.00 Y Position : 449.75
Elevation of Top of Core : -5.28 Length of Core 0.00 Depth to Top of Sample : 0.00 Depth to Bottom of Sample :
Comments : PRE-HURRICANE DIANA SURVEY
Start Weiqht : 55.550 Final Weiqht : 55.411 Deviation : 0.250 %
PHI MM Weight Percnt Cumul Percnt ----- ----- ------ ------ ------
Sample Content by Weight Percent :
PHI MM Weight Percnt Cumul Percnt
Gravel Sand Silt Clay coarse medium fine
Wentworth Classification 0.110 1.012 1.370 97.508 0.000 0.000 Unified classification 0.000 0.110 1.083 97.417 1.390 0.000
Standard Statistics : Median nean Dev. Skew Kurt
Method of Moments (PHI) 2.86 0.44 -3.25 25.15 Folk Graphic Measures (PHI) 2.89 2.89 0.30 0.02 1.38 Grain size (mm) 0.14 0.14
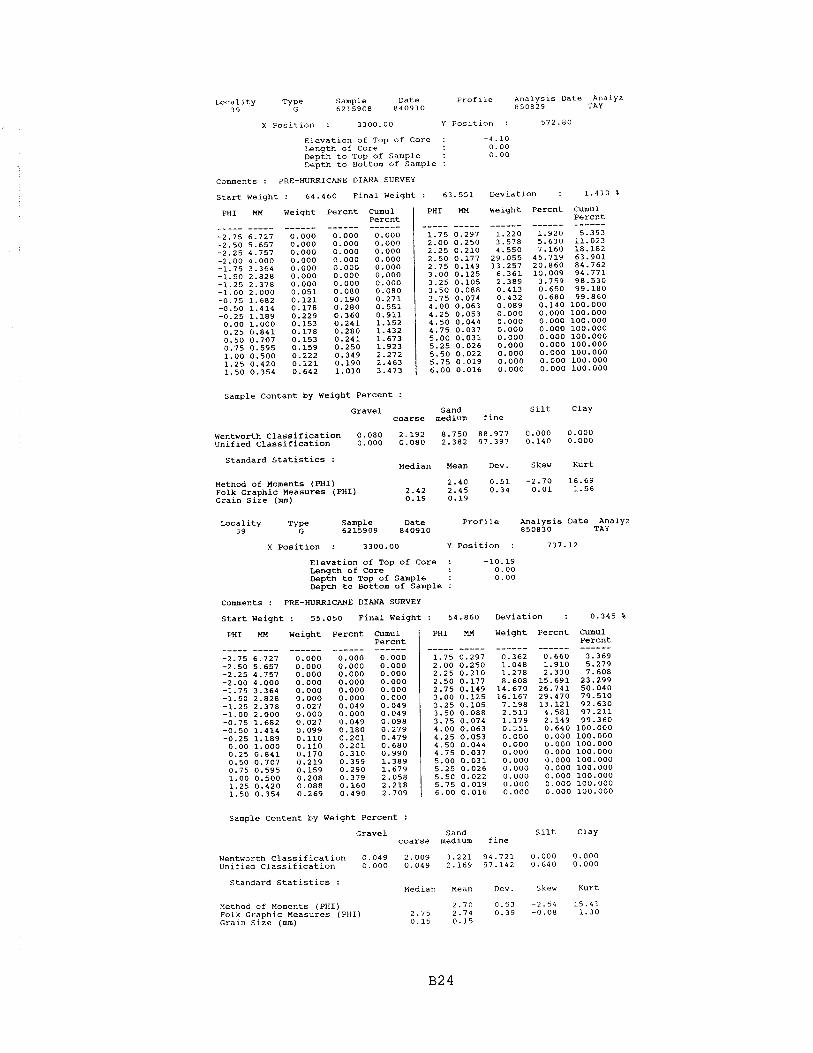
Locality Type Sample Date profile Analysis Date Analyz 39 G 6215908 840910 850829 TAY
X Positlon : 3300.00 Y Position : 572.80
Elevation of Top of Core : -4.10 angth of Core 0.00 Depth to Top of Sample : 0.00 Depth to Bottom of Sample :
Comments : PRE-HURRICANE DIANA SURVEY
Start Weight : 64.460 Final Weight : 63.551 Deviation : 1.410 %
PHI MM Weight Percnt Cumul Hn Weiqht Percnt Cumul P r r r n t I PHI Percnt
Sample Content by Weight Percent :
Gravel Sand Silt Clay coarse medium fine
Wentworth Classification 0.080 2.192 8.750 88.977 0.000 0.000 Unified Classification 0.000 0.080 2.382 97.397 0.140 0.000
Standard Statistics : Median Mean Dev. Skew Kurt
Method of Moments (PHI) 2.40 0.51 -2.70 16.69 Folk Graphic Measures (PHI) 2.42 2.45 0.34 0.01 1.56 Grain Size (mm) 0.19 0.19
Locality Type sample Date Profile Analysis Date Analyz 3 9 G 6215909 840910 850830 T AY
X Position : 3300.00 Y Position : 737.12
Elevation of Top of Core : -10.19 Length of Core 0.00 Depth to Top of Sample : 0.00 Depth to Bottom of Sample :
Comments : PRE-HURRICANE DIANA SURVEY
Start Weight : 55.050 Final Weight : 54.860 Deviation : 0.345 %
PHI
----- -2.75 -2.50 -2.25 -2.00 -1.75 -1.50 -1.25 -1.00 -0.75 -0.50 -0.25 0.00 0.25 0.50 0.75 1.00 1.25 1.50
Weight
------ Percnt Cumu 1
Percnt PHI Weiqht Percnt
------ 0.660 1.910 2.330 15.691 26.741 29.470 13.121 4.581 2.149 0.640 0.000 0.000 0.000 0.000 0.000 0.000 0.000 0.000
Cumul Percnt ------
Sample Content by Weight Percent :
Gravel Sand Silt Clay coarse medium fine
Wentworth Classification 0.049 2.009 3.221 94.721 0.000 0.000 Unified Classification 0.000 0.049 2.169 97.142 0.640 0.000
Standard Statistics : Median Mean Dev. Skew Kurt
Method of Moments (PHI) 2.70 0.53 -2.54 15.41 Folk Graphic Measures (PHI) 2.75 2.74 0.39 -0.08 1.30 Grain Size (mm) 0.15 0.15

Iacal ity Sample Date Profile Analysis Date Analyz 3 9 6215910 E40910 850830 TRY
X Position : 3300.00 Y Position : 884.06
Elevation of Top of Core : -12.45 Length of Core 0.00 Depth to Top of Sample : 0.00 Depth to Bottom of Sample :
Comments : PRE-HURRICANE DIANA SLIRVEY
Start Weight : 51.320 Final Weight Deviation :
PHI MH Weight Percnt Cumu 1 Percnt ------ 0.000 0.000 0.000 0.000 0.000 0.119 0.119 0.119 0.119 0.119 0.119 0.119 0.260 0.341 0.341 0.341 0.341 0.341
PHI h3l Weight Percnt Cumu 1 Percnt
Sample Content by Weight Percent :
Gravel Sand Silt Clay coarse medium fine
Wentworth Classification 0.119 0.221 0.431 99.229 0.000 0.000 unified Classification 0.000 0.119 0.221 97.980 1.680 0.000
Standard Statistics : Median Mean Dev. Skew Kurt
Method of Moments (PHI) 2.95 0.38 -2.67 31.71 Folk Graphic Measures (PHI) 2.95 2.95 0.32 0.03 1.18 Grain Size (mm) 0.13 0.13
Locality Type Sample Date Profile Analysis Date Analyz 3 9 G 6215911 840910 850830 TAY
X Position : 3300.00 Y Position : 995.71
Elevation of Too of Core : - 1 2 . 9 5 = - ~ - - - ~ength-of core~ 0.00 Depth to Top of Sample : 0.00 Depth to Bottom of Sample :
Comments : PRE-HURRICANE DIANA SURVEY
start Weight : 64.330 Final Weight : 64.210 Deviation : 0.187 %
PHI Weight Percnt Cumul Percnt
PHI Weight Percnt cumul Percnt ------ 1.101 2.211
Sample Content by Weight Percent :
Gravel coarse
Sand Silt Clay medium fine
Wentworth Classification 0.511 0.369 Unified Classification 0.000 0.511
Standard Statistics : Median Mean Dev. Skew Yurt
Method of noments (PHI) Folk Graphic Measures (PHI) 2.77 Grain Size (mm) 0.15
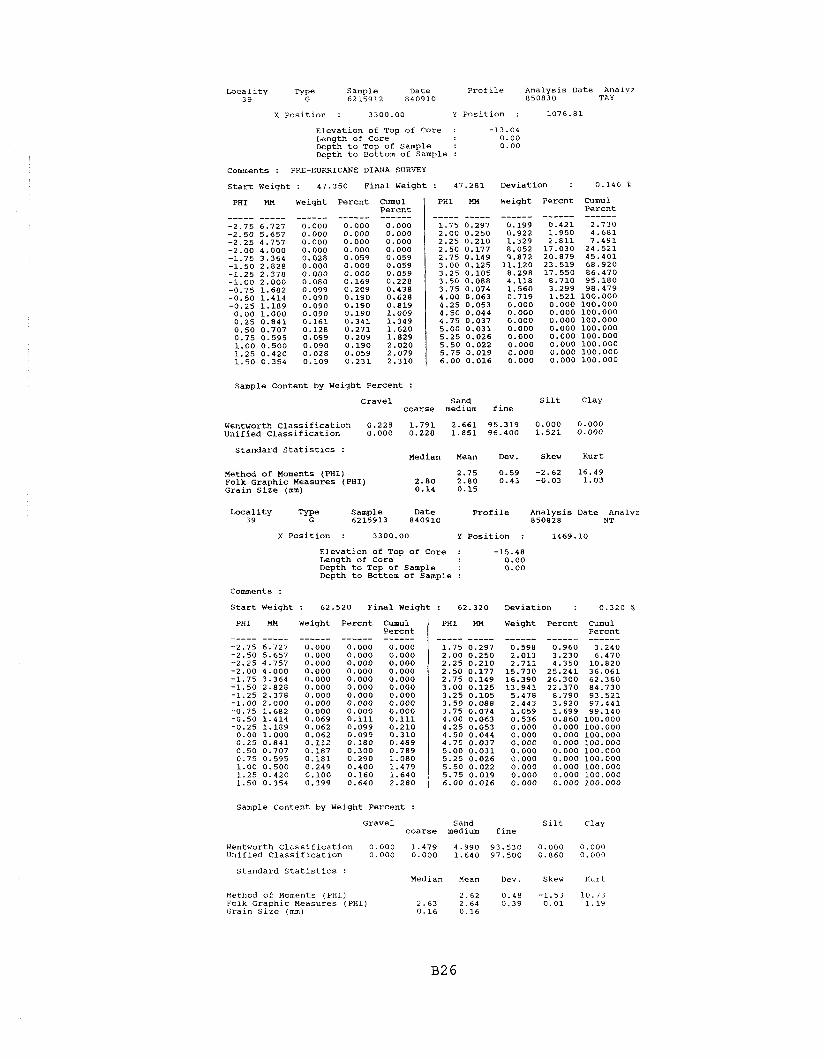
l a c a l i t y Type Sample Date P r o f i l e Ana lys i s Date Analyz 39 G 6215912 840910 850830 TAY
X P o s i t i o n : 3300.00 Y P o s i t i o n : 1076.81
Eleva t ion of Top of Core : -13.04 Length of Core 0.00 Depth t o Top of Sample : 0.00 Depth t o Bottom of Sample :
Comments : PRE-HURRICANE DIANA SURVEY
S t a r t Weight : 47.350 F i n a l Weight : 47.281 Deviat ion : 0.146 %
PHI MM Weight Pe rcn t Cumul Pe rcn t ----- ----- ------ ------ ------
PHI
----- 1.75 2.00 2.25 2.50 2.75 3.00 3.25 3.50 3.75 4.00 4.25 4.50 4.75 5.00 5.25 5.50 5.75 6.00
Weight Pe rcn t Curnul Pe rcn t
Sample Content by Weight Pe rcen t :
Gravel Sand S i l t Clay c o a r s e medium f i n e
W e n t w o r t h C l a s s i f i c a t i o n 0.228 1.791 2.661 95.319 0.000 0.000 Uni f i ed C l a s s i f i c a t i o n 0.000 0.228 1.851 96.400 1.521 0.000
Standa rd S t a t i s t i c s : Median Mean Dev. Skew Kurt
Method o f Moments (PHI) 2.75 0.59 -2.62 16.49 Folk Graphic Measures (PHI) 2.80 2.80 0.43 -0.03 1.03 Grain s i z e (mm) 0.14 0.15
L o c a l i t y T Sample Date p r o f i l e Ana lys i s Date Analyz 3 9 6215913 840910 850828 NT
X P o s i t i o n : 3300.00 Y P o s i t i o n : 1469.10
Eleva t ion of Top o f Core : -15.48 Length of Core' 0.00 Depth t o Top o f Sample : 0.00 Depth t o Bottom o f Sample :
Comments :
S t a r t w e i g h t : 62.520 F i n a l w e i g h t : 62.320 Deviat ion : 0.320%
PHI
----- -2.75 -2.50 -2.25 -2.00 -1.75 -1.50 -1.25 -1.00 -0.75 -0.50 -0.25 0.00 0.25 0.50 0.75 1.00 1.25 1.50
Weight P e r c n t CUmUl P e r c n t ------ 0.000 0.000 0.000 0.000 0.000 0.000 0.000 0.000
PHI MM Weight Pe rcn t Cumul Pe rcn t ------ ------ ------
Sample Content by Weight Pe rcen t :
Gravel Sand S i l t Clay c o a r s e medium f i n e
W e n t w o r t h C l a s s i f i c a t i o n 0.000 1.479 4.990 93.530 0.000 0.000 Unif ied C l a s s i f i c a t i o n 0.000 0.000 1.640 97.500 0.860 0.000
s t a n d a r d S t a t i s t i c s : Median Mean Dev. Skew Kurt
Method of Monents (PHI) 2.62 0.48 -1.53 10.73 Folk Graphic Measures (PHI) 2.63 2.64 0.39 0.01 1.19 Graln S i z e (mm) 0.16 0.16
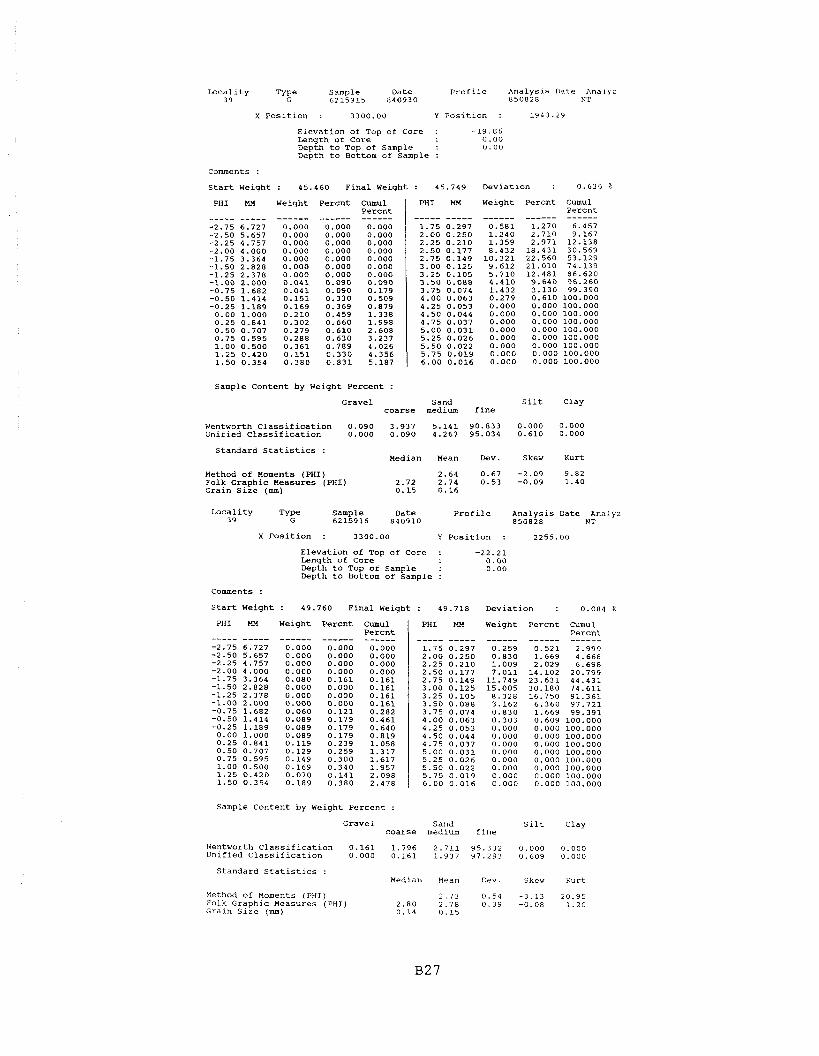
Loca l i t y Type Sample Date P r o f i l e Analysis Date Analyz 3 9 G 6215915 840910 850828 liT
X P o s i t i o n : 3300.00 Y P o s i t i o n : 1943.29
Eleva t ion of Top of Core : -19.86 Length of Core 0.00 Depth t o Top of Sample : 0.00 Depth t o Bottom of Sample :
Comments :
S t a r t w e i g h t : 45.460 F i n a l w e i g h t : 45.749 Deviat ion : 0.636%
PHI Weight
------ Percn t
------ Cumu 1 Percn t ------
PHI
----- 1.75 2.00 2.25 2.50 2.75 3.00 3.25 3.50 3.75 4.00 4.25 4.50 4.75 5.00 5.25 5.50 5.75 6.00
Weight Percnt Cumul Pe rcn t
Sample Content by Weight Pe rcen t :
Gravel Sand S i l t Clay c o a r s e medium f i n e
Wentworth C l a s s i f i c a t i o n 0.090 3.937 5.141 90.833 0.000 0.000 Unif ied C l a s s i f i c a t i o n 0.000 0.090 4.267 95.034 0.610 0.000
Standa rd S t a t i s t i c s : Median Mean Dev. Skew Kurt
Method of Moments (PHI ) 2.64 0.67 -2.09 9.82 Folk Graphic Measures (PHI) 2.72 2.74 0.53 -0.09 1.40 Grain S i z e (mm) 0.15 0.16
Sample Content by Weight Pe rcen t :
L o c a l i t y Sample Date P r o f i l e ~ n a l y s i s Date Analyz 3 9 6215916 840910 850828 NT
X P o s i t i o n : 3300.00 Y P o s i t i o n : 2255.00
Eleva t ion o f Top o f Core : -22.21 Length o f Core 0.00 Depth t o Top of Sample : 0.00 Depth t o Bottom of Sample :
Comments :
S t a r t Weight : 49.760 F i n a l Weight : 49.718 Deviat ion : 0.084 9,
Gravel Sand S i l t Clay coa r se medium f i n e
PHI MM Weight Pe rcn t Cumul Pe rcn t ----- ----- ------ ------ ------
-2.75 6.727 0.000 0.000 0.000 -2.50 5.657 0.000 0.000 0.000 -2.25 4.757 0.000 0.000 0.000 -2.00 4.000 0.000 0.000 0.000 -1.75 3.364 0.080 0.161 0.161 -1.50 2.828 0.000 0.000 0.161 -1.25 2.378 0.000 0.000 0.161 -1.00 2.000 0.000 0.000 0.161 -0.75 1.682 0.060 0.121 0.282 -0.50 1.414 0.089 0.179 0.461 -0.25 1.189 0.089 0.179 0.640 0.00 1.000 0.089 0.179 0.819 0.250.841 0.119 0.239 1.058 0.50 0.707 0.129 0.259 1.317 0.75 0.595 0.149 0.300 1.617 1.00 0.500 0.169 0.340 1.957 1.25 0.420 0.070 0.141 2.098 1.50 0.354 0.189 0.380 2.478
Wentworth C l a s s i f i c a t i o n 0.161 1.796 2.711 95.332 0.000 0.000 Unif ied classification 0.000 0.161 1.937 97.293 0.609 0.000
PHI MM Weight Pe rcn t Cumul Pe rcn t ----- ----- ------ ------ ------
1.75 0.297 0.259 0.521 2.999 2.00 0.250 0.830 1.669 4.668 2.25 0.210 1.009 2.029 6.698 2.50 0.177 7.011 14.102 20.799 2.75 0.149 11.749 23.631 44.431 3.00 0.125 15.005 30.180 74.611 3.25 0.105 8.328 16.750 91.361 3.50 0.088 3.162 6.360 97.721 3.75 0.074 0.830 1.669 99.391 4.00 0.063 0.303 0.609 100.000 4.25 0.053 0.000 0.000 100.000 4.50 0.044 0.000 0.000 100.000 4.75 0.037 0.000 0.000 100.000 5.00 0.031 0.000 0.000 100.000 5.25 0.026 0.000 0.000 100.000 5.50 0.022 0.000 0.000 100.000 5.75 0.019 0.000 0.000100.000 6.00 0.016 0.000 0.000 100,000
Standard S t a t i s t i c s : Median Hean Dev. Skew Kurt
Method of Moments (PHI ) Folk Graphic Measures (PHI) Grain S i z e (mm)

Loca l i t y Type Sample m t e P r o f i l e Analysis Date Analy: 3 9 G 6216001 8 4 0 9 2 1 850904 SGU
X Pos i t i on : 3300.00 Y P o s i t i o n : 169 .70
Eleva t ion of Too of Core : 2 0 . 8 2 Length of Core 0.00 Depth t o Top of Sample : 0.00 Depth t o Bottom of Sample :
Comments : 1.25 PHI CORRECTION BY BEST LINEAR FIT 2 7 JUN 8 6
S t a r t Weiqht : 55.750 F i n a l Weiqht : 55.662 Deviat ion : 0 .158 %
PHI MU Weight Pe rcn t Cumul Pe rcn t ----- ----- ------ ------ ------
PHI m Weight Pe rcn t Cumul P e r c n t ----- ----- ------ ------ ------
Sample Content by Weight Pe rcen t :
Gravel Sand S i l t Clay c o a r s e medium f i n e
Wentworth C l a s s i f i c a t i o n 0.059 24.022 56.660 19.259 0.000 0.000 Unif ied C l a s s i f i c a t i o n 0.000 0.059 35.022 64.859 0.059 0.000
Standard S t a t i s t i c s : Median Mean Dev. Skew Kurt
Method o f Moments (PHI) 1 . 4 5 0.68 -0.43 3.30 Folk Graphic Measures (PHI) 1.53 1.47 0.68 -0.15 1.02 Grain S i z e (mm) 0.35 0.36
b c a l i t y Type Sample Date P r o f i l e Ana lys i s Date Analyz 3 9 G 6216002 8 4 0 9 2 1 850905 SGU
X P o s i t i o n : 3300.00 Y P o s i t i o n : 196.90
Eleva t ion o f Top of Core : 17 .85 Length o f Core 0.00 Depth t o Top of Sample : 0.00 Depth t o Bottom o f Sample :
Comments : 1.25 PHI CORRECTION BY MOD. LINEAR FIT 27 J U N 8 6
s t a r t Weight : 52.040 F i n a l Weiqht : 51.888 Deviat ion : 0 . 2 9 2 %
PHI MU Weight Pe rcn t Cumul P e r c n t ----- ----- ------ ------ ------
PHI MH Weight Pe rcn t Cumul P e r c n t ----- ----- ------ ------ ------
Sample Content by Weiqht Pe rcen t :
Gravel Sand S i l t Clay c o a r s e medium f i n e
Wentworth C l a s s i f i c a t i o n 0.060 2 7 . 1 3 0 66.033 6.778 0.000 0.000 Unif ied C l a s s i f i c a t i o n 0.000 0.060 4 4 . 2 1 1 55 .730 0.000 0.000
Standard S t a t i s t i c s : Median Mean Dev. Skew Kurt
Hethod o f Moments (PHI) Folk Graphlc Measures (PHI) Grain S i z e (mm)

Locality Type Sample Date Profile Analysls Date Analyz 3 9 G 6216003 8 4 0 9 2 1 850905 SGU
X Position : 3300.00 Y Position : 236 .84
Elevation of Top of Core : 11.52 Length of Core 0 .00 Depth to Top of Sample : 0 .00 wpth to Bottom of Sample :
Comments : 1 . 2 5 PHI CORRECTION BY NOD. LINERR FIT 27 JUN 86
Start Weight : 50.580 Final Weight : 50 .519 Deviation : 0 . 1 2 1 9
PHI MM Weight Percnt Cumul Percnt ----- ----- ------ ------ ------
PHI
----- 1 .75 2 .00 2 .25 2 .50 2.75 3.00 3.25 3 .50 3.75 4 .00 4.25 4.50 4 .75 5 .00 5.25 5 .50 5 .75 6 .00
Weight Percnt
------ 1 1 . 6 4 1
9.499 3 . 0 3 1 1.619 0 . 5 7 0 0 .240 0.079 0 . 0 4 0 0 .000 0 .000 0.000 0 . 0 0 0 0 .000 0 . 0 0 0 0 .000 0 .000 0 . 0 0 0 0 .000
Cumul Percnt
Sample Content by Weight Percent :
Gravel Sand Silt Clay coarse medium fine
wentworth Classification 2.061 47.930 44 .431 5.578 0 . 0 0 0 0 .000 Unlfied Classlficatlon 0 .000 2 . 0 6 1 60 .320 37 .620 0 . 0 0 0 0 . 0 0 0
Standard Statistics : Median Mean Dev. Skew Kurt
Method of Moments (PHI) 0.96 0.79 -0.72 4 .18 Folk Graphic Measures (PHI) 1.00 0 .99 0.75 -0 .09 1 .00 Grain size (mm) 0 .50 0 . 5 1
Locality Type Sample Date Profile Analysis Date Analyz 3 9 G 6216004 8 4 0 9 2 1 8 5 0 9 0 5 SGU
X Position : 3300.00 Y Position : 259 .85
Elevation of Top of Core : Length of Core Depth to Top of Sample : Depth to Bottom of Sample :
Comments : 1 .25 PHI CORRECTION BY AVERAGING 27 JUN 8 6
Startweight: 50 .120 Finalweight: 50.109 Deviation : 0 . 0 2 2 %
PHI MM Weight Percnt Cumul Percnt ------
0.000
PHI MM Weight Percnt Cumul Percnt ----- ----- ------ ------ ------
Sample Content by Weight Percent :
Gravel Sand Silt Clay coarse medium fine
Wentworth Classification 0 . 1 6 0 9 .370 49 .420 4 1 . 0 5 1 0 .000 0.000 Unified classification 0 . 0 0 0 0 .160 15 .229 84.612 0 .000 0.000
Standard Statistics : Median Mean Dev. Skew Kurt
Kethod of Moments (PHI) 1 .84 0.58 -1 .03 5 .51 Folk Graphic Measures (PHI) 1 . 9 1 1 .85 0.55 -0 .17 1 .09 Grain Size (mm) 0 .27 0 . 2 8

Locality Type Sample Date Profile Analysis Date Analyz 39 G 6216005 840921 850905 SGU
X Position : 3300.00 Y Position : 299.46
Elevation of Top of Core : 4.29 Length of Core 0.00 Depth to Top of Sample : 0.00 Depth to Bottom of Sample :
Comments :
Start Weight : 58.520 Final Weigt
PHI MM Weight Percnt Cumul Percnt ----- ----- ------ ------ ------
-2.75 6.727 0.000 0.000 0.000 -2.50 5.657 0.000 0.000 0.000 -2.25 4.757 0.000 0.000 0.000 -2.00 4.000 0.000 0.000 0.000
Deviation :
Weight Percnt CumUl Percnt
Sample Content by Weight Percent :
Gravel Sand Silt Clay coarse medium fine
Wentworth Classification 0.041 2.371 41.159 56.428 0.000 0.000 Unified Classification 0.000 0.041 3.742 96.217 0.000 0.000
standard Statistics : Median Mean Dev. Skew Kurt
Method of Moments (PHI) Folk Graphic Measures (PHI) Grain size (mm)
Locality Sample Date 6216006 840921
Profile Analysis Date Analyz 3 9 850905 SGU
X Position : 3300.00 Y Position : 331.24
Elevation of Top of Core : 1.90 Length of Core 0.00 Depth to Top of Sample : 0.00 Depth to Bottom of Sample :
Comments :
Start Weight : 51.750 Final Weight : 51.009 Deviation : 1.432 %
PHI MM Weight Percnt Cumul PHI MM Weight Percnt Cumul ~ercnt I Percnt
Sample Content by Weight Percent :
Gravel Sand Silt Clay coarse medium fine
Wentworth classification 0.020 0.608 23.190 76.183 0.000 0.000 Unified classification 0.000 0.020 0.998 98.983 0.000 0.000
standard Statistics : Median Mean Dev. Skew Kurt
Method of Moments (PHI) 2.22 0.34 -1.03 8.78 Folk Graphic Measures (PHI) 2.27 2.22 0.31 -0.18 1.02 Grain Size (mm) 0.21 0.21
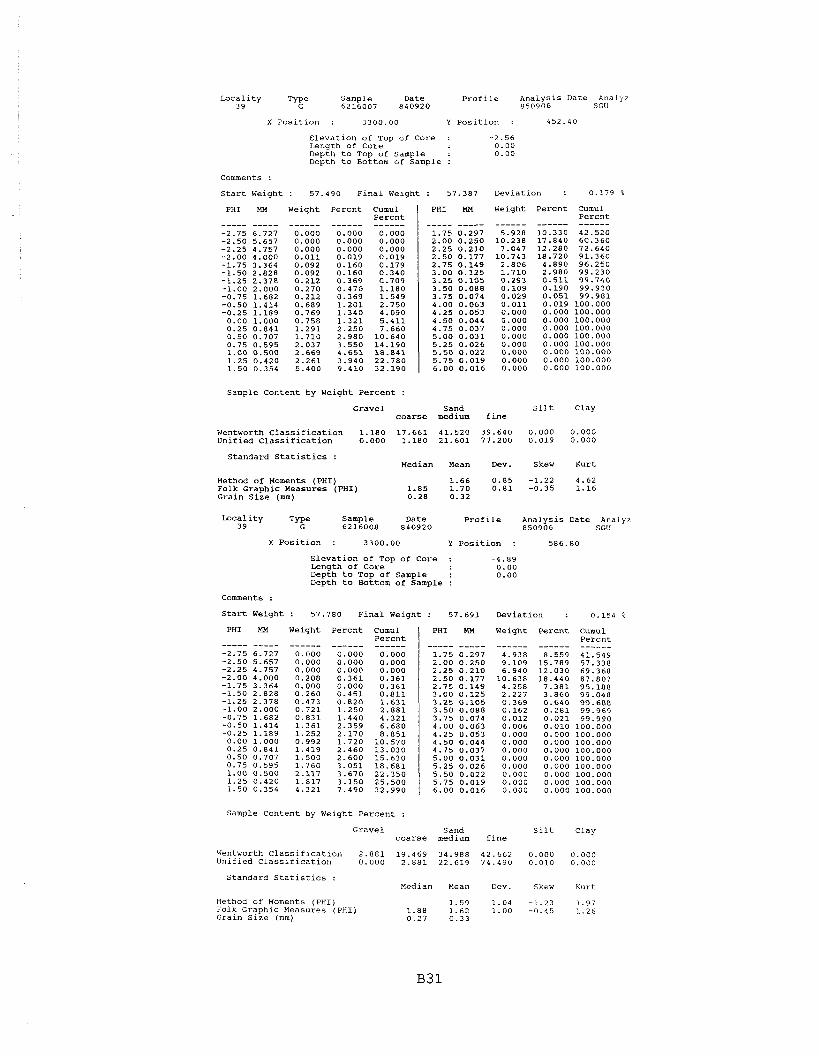
Locality Type Sample Date Profile Analysis Date Analyz 3 9 G 6216007 840920 850906 SGU
X Position : 3300.00 Y Position : 452.40
Elevation of TOP of Core : -2.56 Length of Core 0.00 Depth to Top of Sample : 0.00 Depth to Bottom of Sample :
Comments :
Start Weight : 57.490 Final Weiqht : 57.387 Deviatlon : 0.179 %
PHI MH Weight Percnt Cumul PHI m Weight Percnt Cumul Percnt I Percnt
Sample content by Weight Percent :
Gravel Sand Silt Clay coarse medium fine
Wentworth Classification 1.180 17.661 41.520 39.640 0.000 0.000 Unified Classification 0.000 1.180 21.601 77.200 0.019 0.000
Standard Statistics : Median Mean Dev. Skew Kurt
Method of Moments (PHI) Folk Graphic Measures (PHI) Grain Size (mm)
Locality Type Sample Date Profile ~nalysis Date Analyz 3 9 G 6216008 840920 850906 SGU
X Position : 3300.00 Y Position : 586.80
Elevation of Too of Core : - 4 - 8 9 - - - - - - - ..-- Length of core- 0.00 Depth to Top of Sample : 0.00 Depth to Bottom of Sample :
Comments :
Startweight: 57.780 Finalweight: 57.691 Deviation : 0.154 %
PHI
----- -2.75 -2.50 -2.25 -2.00 -1.75 -1.50 -1.25 -1.00 -0.75 -0.50 -0.25 0.00 0.25 0.50 0.75 1.00 1.25 1.50
Weiqht 'ercnt Cumul Percnt
Sample Content by Weight Percent :
PHI
Gravel coarse
Wentworth Classification 2.881 19.469 Unified Classification 0.000 2.881
Standard Statistics : Median
Method of Moments (PHI) Folk Graphic Measures (PHI) 1.88 Grain Size (mm) 0.27
Weight Percnt CUmUl Percnt ------ 41.549 57.338
Sand Silt Clay medium fine
Mean Dev. Skew Kurt

Locality Type Sample Date Proflle Analysis Date Analyz 3 9 G 6216009 840920 850906 SGU
X Position : 3300.00 Y Position : 715.96
Elevation of Top of Core : Length of Core k p t h to Top of Sample : Depth to Bottom of Sample :
Comments :
: 62.370 Final Weight : 62.320 Deviation : 0.080 % start Weight
PHI MH Weight Percnt Cumul Percnt ------ ------ ------
Weight Percnt Cumul Percnt
PHI MM
loo. 000 100.000 100.000
Sample Content by Weight Percent :
Gravel Sand Silt Clay coarse medium fine
Wentworth Classification 0.178 0.390 5.260 94.172 0.000 0.000 Unified Classification 0.000 0.178 0.501 99.291 0.030 0.000
Standard Statistics : Median Mean Dev. Skew Kurt
Method of Moments (PHI) 2.47 0.37 -3.03 32.20 Folk Graphic Measures (PHI) 2.45 2.49 0.29 0.13 1.17 Grain size (mm) 0.18 0.18
Locality 39
Sample 6216010
Date 840920
Profile Analysis Date Analyz 850906 SGU
X Position : 3300.00 Y Position : 842.60
Elevation of Top of Core : -11.95 Length of Core 0.00 Depth to Top of Sample . 0.00 Depth to Bottom of Sample 1
Comments :
start Weight : 56.540 Final Weight : 56.430 Deviation : 0.195 %
PHI MH Weight Percnt Cumul Percnt ----- ----- ------ ------ ------
PHI MM Weight Percnt Cumul Percnt ----- ----- ------ ------ ------
Sample Content by Weight Percent :
Gravel Sand Silt Clay coarse medium fine
wentworthclassification 0.050 1.421 2.580 95.949 0.000 0.000 Unified Classification 0.000 0.050 1.611 98.070 0.269 0.000
Standard Statistics : Median Mean Dev. Skew Kurt
nethod of Moments (PHI) Folk Graphic Measures (PHI) Grain Size (mm)

Sample Date Profile Analysls Date Anal>z 3 9 6216011 840920 850906 SGU
X Position : 3300.00 Y Position : 987.82
Elevation of Top of Core : -12.86 Length of Core 0.00 Depth to Top of Sample : 0.00 Depth to Bottom of Sample :
Comments :
Start Weight
PHI MM
: 53.170 Final Weight
Weight Percnt Cumul Percnt ------ ------ ------
0.000 0.000 0.000 0.000 0.000 0.000 0.000 0.000 0.000 0.000 0.000 0.000 0.000 0.000 0.000 0.000 0.000 0.000 0.000 0.000 0.000 0.037 0.070 0.070 0.058 0.109 0.179 0.048 0.091 0.270 0.079 0.149 0.419 0.037 0.070 0.489 0.111 0.209 0.698 0.138 0.260 0.959 0.170 0.321 1.280 0.201 0.379 1.659 0.111 0.209 1.868 0 .201 0.379 2.248
PHI MM
Deviation :
Weight Percnt
0.340 S
Cumul Percnt
Sample Content by Weight Percent :
Gravel Sand Silt Clay coarse medium fine
Wentworth Classification 0.070 1.589 2.229 96.112 0.000 0.000 Unified Classification 0.000 0.070 1.798 95.512 2.619 0.000
Standard Statistics : Median Mean Dev. Skew Kurt
Method of Moments (PHI) Folk Graphic Measures (PHI) Grain Size (mm)
Locality Type Sample Date Profile Analysis Date Analyz 3 9 G 6216012 840912 850906 SGU
X Position : 3300.00 Y Position : 1233.89
Elevation of Top of Core : -13.72 Length of Core 0.00 Depth to Top of Sample : 0.00 Depth to Bottom of Sample :
Comments :
Start Weight : 50.060 Final Weight : 49.641 Deviation : 0.837 P
PHI MM Weight Percnt Cumul PHI MM Weight Percnt Cumul Percnt _---- ----- ------ ------ ----- ----- ------ ------ ------
Sample Content by Weight Percent :
Gravel Sand Silt Clay coarse medium fine
WentworthClassification 0.598 3.731 4.192 91.479 0 .000 0.000 Unified Classification 0.000 0.598 4.132 95.189 0.081 0.000
Standard Statistics : Median Hean Dev . Skew Kurt
Method of Moments (PHI) Folk Graphic Measures (PHI) Grain Size (mm)

Locality 3 9
Sample 6216013
Date 840920
Profile Analysis Date Analyz 850905 SGU
X Position : 3300.00 Y position : 1499.02
Elevation of Top of Core : -16.01 Length of Core 0.00 Depth to Top of Sample : 0.00 Depth to Bottom of Sample :
Comments :
Start Weiqht : 60.870 Final Weight : 60.821 Deviation : 0.080 9,
PHI HN Weight Percnt Cumul Percnt ----- ----- ------ ------ ------
PHI HH Weight Percnt Nmul Percnt - ----- ------ ------ ------
Sample Content by Weight Percent :
Gravel Sand Silt Clay coarse medium fine
Wentworth Classification 1.271 5.690 14.809 78.230 0.000 0.000 Unified Classification 0.000 1.271 7.150 91.118 0.460 0.000
Standard Statistics : Median Mean Dev. Skew Kurt
Method of Moments (PHI) Folk Graphic Measures (PHI) Grain Size (mm)
Locality Sample Date Profile Analysis Date Analyz 3 9 6216014 840920 840907 SGU
X Position : 3300.00 Y Position : 1738.11
Elevation of Top of Core : -18.34 Length of Core 0.00 Depth to Top of Sample : 0.00 Depth to Bottom of Sample :
Comments :
start Weiqht : 58.210 Final Weight : 57.931 Deviation : 0.479 %
PHI HH Weiqht Percnt Cumul Percnt ----- ----- ------ ------ ------
PHI HM Weiqht Percnt Cumul Percnt ----- ----- ------ ------ ------
Sample Content by Weiqht Percent :
Gravel Sand Silt Clay coarse medium fine
WentworthClassification 0.000 0.330 0.920 98.750 0.000 0.000 Unified Classification 0.000 0.000 0.499 98.091 1.410 0.000
standard Statistics : Median Mean Dev. Skew Kurt
nethod of Moments (PHI) Folk Graphic Measures (PHI) Grain Size (mm)
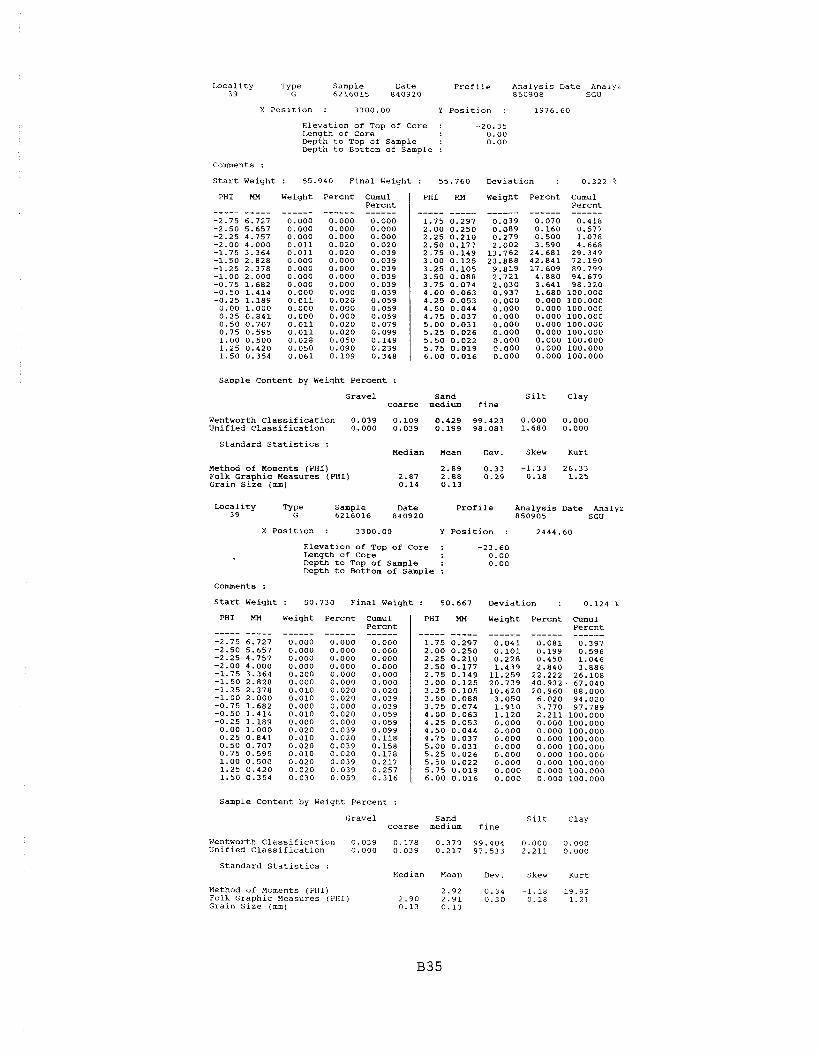
Loca l i t y 3 9
Sample 6216015
Date 840920
P r o f i l e Ana lys i s Date AnaLyi 850908 SGU
X P o s i t i o n : 3300.00 Y P o s i t i o n : 1976 .60
Eleva t ion of Top of Core : -20 .35 Length of Core 0.00 Depth t o Top of Sample : 0.00 Depth t o Bottom of Sample :
Comments :
S t a r t Weight : 55.940 F i n a l Weiqht : 55.760 Deviat ion : 0.322 %
PHI MM Weight Pe rcn t Cumul Percnt ----- ----- ------ ------ ------
PHI MM Weight Pe rcn t Cumul Percnt ----- ----- ------ ------ ------
Sample Content by Weiqht Pe rcen t :
Gravel Sand S i l t Clay c o a r s e medium f i n e
Wentworth C l a s s i f i c a t i o n 0.039 0.109 0.429 99.423 0.000 0.000 Unif ied c l a s s i f i c a t i o n 0.000 0.039 0.199 98.081 1.680 0.000
Standa rd S t a t i s t i c s : Median Mean Dev. Skew Kurt
Method of Moments (PHI) Folk Graphic Measures (PHI) Grain S i z e (mm)
L o c a l i t y Sample Date P r o f i l e Ana lys i s Date Analyz 3 9 6216016 840920 850905 SGU
X P o s i t i o n : 3300.00 Y P o s i t i o n : 2 4 4 4 . 6 0
Eleva t ion o f TOD o f Core : -23.60 -. .. Lenath of Core n.no -.-- ~ e p f h t o ~ o p - o f Sample : 0.00 Depth t o Bottom of Sample :
Comments :
S t a r t Weiqht : 50.730 F i n a l Weight : 50.667 Devia t ion : 0 .124 %
PHI MM Weight Pe rcn t Cumul Pe rcn t ----- ----- ------ ------ ------
PHI MM Weight Pe rcn t Cumul Percnt
Sample Content by Weight Pe rcen t :
Gravel Sand S i l t Clay coa r se medium f i n e
Wentworth C l a s s i f i c a t i o n 0.039 0.178 0.379 99 .404 0.000 0.000 Unif ied C l a s s i f i c a t i o n 0.000 0.039 0 .217 97 .533 2 . 2 1 1 0.000
Standa rd S t a t i s t i c s : Median Mean Dev. Skew Kurt
Method o f Moments (PHI) Folk Graphic Measures (PHI) Grain S i z e (mm)
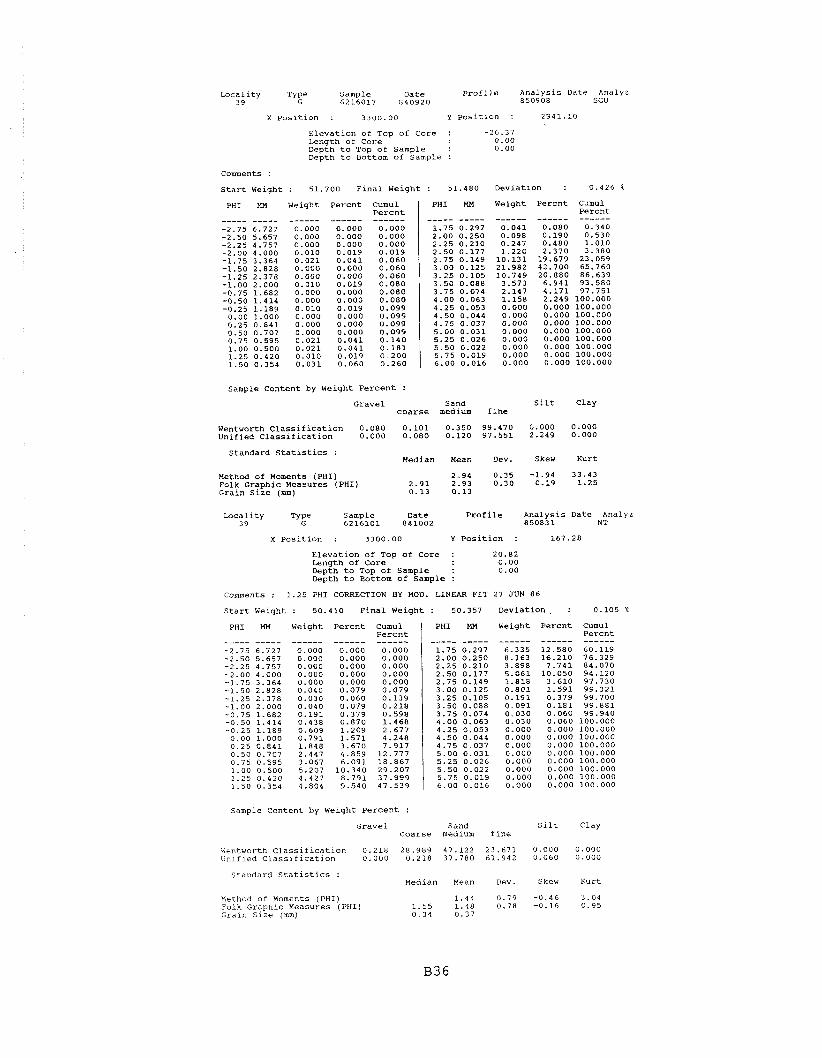
Sample Content by Weight Percent :
Locality Type Sample Date Profile Analysis Date Analyz 39 G 6216017 840920 850908 SGU
X Position : 3300.00 Y position : 2941.10
Elevation of Top of Core : -26.37 Length of Core 0.00 Depth to Top of Sample : 0.00 Depth to Bottom of Sample :
Comments :
Start Weight : 51.700 Final Weight : 51.480 Deviation : 0.426 %
Gravel Sand Silt Clay coarse medium fine
PHI MU Weight Percnt Cumul Percnt --__- ___-_ ____-_ ___-__ ____--
-2.756.727 0.000 0.000 0.000 -2.505.657 0.000 0.000 0.000 -2.25 4.757 0.000 0.000 0.000 -2.00 4.000 0.010 0.019 0.019 -1.75 3.364 0.021 0.041 0.060 -1.50 2.828 0.000 0.000 0.060 -1.25 2.378 0.000 0.000 0.060 -1.00 2.000 0.010 0.019 0.080 -0.75 1.682 0.000 0.000 0.080 -0.50 1.414 0.000 0.000 0.080 -0.25 1.189 0.010 0.019 0.099 0.00 1.000 0.000 0.000 0.099 0.25 0.841 0.000 0.000 0.099 0.50 0.707 0.000 0.000 0.099 0.75 0.595 0.021 0.041 0.140 1.00 0.500 0.021 0.041 0.181 1.25 0.420 0.010 0.019 0.200 1.50 0.354 0.031 0.060 0.260
Wentworth Classification 0.080 0.101 0.350 99.470 0.000 0.000 Unified Classification 0.000 0.080 0.120 97.551 2.249 0.000
PHI MU Weight Percnt Cumul Percnt __-_- __--_ --__-- ------
1.75 0.297 0.041 0.080 0.340 2.00 0.250 0.098 0.190 0.530 2.250.210 0.247 0.480 1.010 2.50 0.177 1.220 2.370 3.380 2.75 0.149 10.131 19.679 23.059 3.00 0.125 21.982 42.700 65.760 3.25 0.105 10.749 20.880 86.639 3.50 0.088 3.573 6.941 93.580 3.75 0.074 2.147 4.171 97.751 4.000.063 1.158 2.249 100.000 4.25 0.053 0.000 0.000 100.000 4.50 0.044 0.000 0.000100.000 4.75 0.037 0.000 0.000 100.000 5.00 0.031 0.000 0.000 100.000 5.25 0.026 0.000 0.000 100.000 5.50 0.022 0.000 0.000 100.000 5.75 0.019 0.000 0.000 100.000 6.00 0.016 0.000 0.000 100.000
Standard Statistics : Median Mean Dev. Skew Kurt
Method of Moments (PHI) Folk Graphic Measures (PHI) Grain size (mm)
Locality T Sample Date Profile Analysis Date Analyz 3 9 6216101 841002 850831 NT
X Position : 3300.00 Y Position : 167.28
Elevation of Top of Core : 20.82 Length of Core 0.00 Depth to Top of Sample : 0.00 Depth to Bottom of Sample :
Comments : 1.25 PHI CORRECTION BY MOD. LINEAR FIT 27 JON 86
Startweight: 50.410 Finalweight: 50.357 Deviation : 0.105%
PHI MM Weight Percnt Cumul Percnt
PHI MM Weight Percnt Cumul
sample Content by Weight Percent :
Gravel Sand Silt Clay coarse medium fine
Kentworth Classification Lnlfied Classification
Standard Statistics : Median Mean Dev. Skew Kurt
Kethod of Moments (PHI) 1.44 0.79 -0.46 3.04 Folk Graphic Measures (PHI) 1.55 1.48 0.78 -0.16 0.95 Graln size ( m n ) 0.34 0.37

Loca l i t y Type Sample Date P r o f i l e Ana lys i s Date Analyz 3 9 G 6216102 841002 850831 NT
X P o s i t i o n : 3300.00 Y P o s i t i o n : 195.33
Eleva t ion of Top o f Core : 18.06 I eng th of Core 0.00 Depth t o Top of Sample : 0.00 Depth t o Bottom of Sample :
Comments : 1.25 PHI CORRECTION BY MOO. LINEAR FIT 27 J U N 86
S t a r t Weight : 55.440 F i n a l Weight : 55.152 Deviat ion : 0.519 %
PHI Weight Pe rcn t CUmUl Percnt
PHI MM Weight Pe rcn t Cumul Pe rcn t ------ ------
16.969 71.158
Sample Content by Weight Percent :
Gravel Sand S i l t Clay c o a r s e medium f i n e
Wentworth C l a s s i f i c a t i o n 0.060 19.140 65.648 15.153 0.000 0.000 Unif ied C l a s s i f i c a t i o n 0.000 0.060 36.389 63.541 0.011 0.000
Standard S t a t i s t i c s : Median Mean Dev. Skew Kurt
Method o f Moments (PHI) 1.46 0.52 -0.25 4.59 Folk Graphic Measures (PHI) 1.44 1.46 0.49 0.09 0.86 Grain S i z e (mm) 0.37 0.36
L o c a l i t y 3 9
Sample 6216103
Date 841002
P r o f i l e Ana lys i s Date Analyz 850831 NT
X P o s i t i o n : 3300.00 Y P o s i t i o n : 229.56
Eleva t ion of Top o f Core : 12.80 Length of Core 0.00 Depth t o Top of Sample : 0.00 Depth t o Bottom of Sample :
Comments : 1.25 PHI CORRECTION BY MOD. LINEAR FIT 27 JUN 86
S t a r t Weight : 49.480 F i n a l Weight : 49.388 Deviat ion : 0.186 %
PHI MM Weight Pe rcn t Cumul PHI MH Weight P e r c n t Cumul Pe rcn t I Day,-..+
Sample Content by Weight Percent :
Gravel Sand S i l t Clay c o a r s e medium f i n e
Wentworth C l a s s i f i c a t i o n 2.539 66.571 23.901 6.990 0.000 0.000 Unif ied C 1 . s s s i f i c a t i o n 0.000 2.539 72.621 24.840 0.000 0.000
Standard S t a t i s t i c s : Median Mean Dev. Skew Kurt
Method o f Moments (PHI) Folk Graphic Measures (PHI) Grain s i z e (mm)

Sample Date P r o f i l e Analysls Date Analyz 39 6216104 841002 850831 NT
x P o s i t i o n : 3300.00 Y Pos i t i on : 257.71
Eleva t ion o f Top of Core : 7.06 Length of Core 0.00 b p t h t o Top of Sample : 0.00 Depth t o Bottom o f Sample :
Comments :
S t a r t Weight : 48.740 F i n a l Weight : 48.762 Deviat ion : 0.045 2
PHI
----- -2.75 -2.50 -2.25 -2.00 -1.75 -1.50 -1.25 -1.00 -0.75 -0.50 -0.25 0.00 0.25 0.50 0.75 1.00 1.25 1.50
Weight P e r c n t Cumul Percnt
PHI MU Weight Pe rcn t CUmUl P e r c n t ----- ----- ------ ------ ------
Sample Content by Weight Pe rcen t :
Gravel Sand S i l t Clay c o a r s e medium f i n e
W e n t w o r t h C l a s s i f i c a t i o n 1.940 81.707 6.552 9.801 0.000 0.000 Unif ied C l a s s i f i c a t i o n 0.000 1.940 82.367 15.693 0.000 0.000
Standard S t a t i s t i c s : Median Mean Dev. Skew Kurt
Method o f Moments ( P H I ) 0.20 0.94 1.35 3.95 Folk Graphic Measures (PHI) -0.10 0.18 0.88 0.56 1.73 Grain s i z e (mm) 1.07 0.87
L o c a l i t y Sample Date P r o f i l e ~ n a l y s i s Date Analyz 3 9 6216105 841002 850902 NT
x P o s i t i o n : 3300.00 Y P o s i t i o n : 283.30
E l e v a t i o n of Top o f Core : Length o f Core w p t h t o Top o f Sample : a e p t h t o Bottom o f Sample :
Comments : 1.25 PHI CORRECTION BY MOD. LINEAR FIT 27 J U N 86
S t a r t Weight : 58.580 F i n a l Weight : 58.400 Deviat ion : 0.307 Oa
PHI
----- -2.75 -2.50 -2.25 -2.00 -1.75 -1.50 -1.25 -1.00 -0.75 -0.50 -0.25 0.00 0.25 0.50 0.75 1.00 1.25 1.50
Weight P e r c n t Cumul Pe rcn t
PHI Weight Pe rcn t Cumul P e r c n t ------
Sample Content by Weight Percent :
Gravel Sand S i l t Clay c o a r s e medium f i n e
Wentworth C l a s s i f i c a t i o n 1.918 49.461 28.211 20.411 0.000 0.000 Unif ied C l a s s i f i c a t i o n 0.000 1.918 54.580 43.502 0.000 0.000
Standard S t a t i s t i c s : Median Eean Dev. Skev Kurt
Kethod o f Moments (PHI) 1.01 1.02 -0.09 2.04 Folk Graphic Measures (PHI) 0.95 1.02 1.03 0.05 0.73 Grain s i z e (m) 0.52 0.50

Sample Date Profile Analysis Date Analyz 3 9 6216106 841002 850902 NT
X Position : 3300.00 Y Position : 336.93
Elevation of Top of Core : Length of Core Depth to Top of Sample : Depth to Bottom of Sample :
Comments :
Start Weight : 59.010 Final Weight : 58.978 Deviation : 0.054 %
PHI Weight Percnt CumUl Percnt ------ 0.000 0.000 0.000 3.520 5.400 10.280 18.431 31.641 49.401
PHI
----- 1.75 2.00 2.25 2.50 2.75 3.00 3.25 3.50 3.75 4.00 4.25 4.50 4.75 5.00 5.25 5.50 5.75 6.00
Weight Percnt
------ 0.300 0.359 0.149 0.200 0.070 0.020 0.000 0.020 0.000 0.010 0.000 0.000 0.000 0.000 0.000 0.000 0.000 0.000
Cumul Percnt ------ 99.171 99.530 99.680 99.880 99.949 99.969 99.969 99.990 99.990 100.000 100.000 100.000 100.000 100.000 100.000 100.000 100.000 100.000
Sample Content by Weight Percent :
Gravel Sand Silt Clay coarse medium fine
Wentworth Classification 31.641 66.691 1.199 0.470 0.000 0.000 Unified Classification 0.000 31.641 66.840 1.509 0.010 0.000
Standard Statistics : Median Mean Dev. Skew Kurt
Method of Moments (PHI) -0.79 0.61 1.1 8.59 Folk Graphic Measures (PHI) -0.74 -0.82 0.51 -0.19 1.25 Grain Size (mm) 1.68 1.73
Locality Sample Date Profile Analysis Date Analyz 3 9 6216107 841002 850902 NT
X Position : 3300.00 Y Position : 470.57
Elevation < ~f Top of Core : -7.41 Length of Core Depth to Top of Sample : Depth to Bottom of Sample :
Comments :
Start Weight : 55.430 Final Weight : 55.349 Deviation : 0.146 %
PHI HH Weight Percnt Cumul Percnt ----- ----- ------ ------ ------
PHI MH Weight Percnt Cumul Percnt ------ ------ ------
3.371 6.090 69.360
Sample Content by Weight Percent :
Gravel Sand Silt Clay coarse medium fine
Wentworth Classification 18.660 36.770 23.579 20.990 0.000 0.000 Unified Classification 0.000 18.660 38.740 42.590 0.011 0.000
Standard Statistics : Median Mean DeV. Skew Kurt
Method of Moments (PHI) 0.54 1.51 -0.27 1.82 Folk Graphic Measures (PHI) 0.67 0.57 1.56 -0.14 0.74 Grain Size (mm) 0.63 0.69
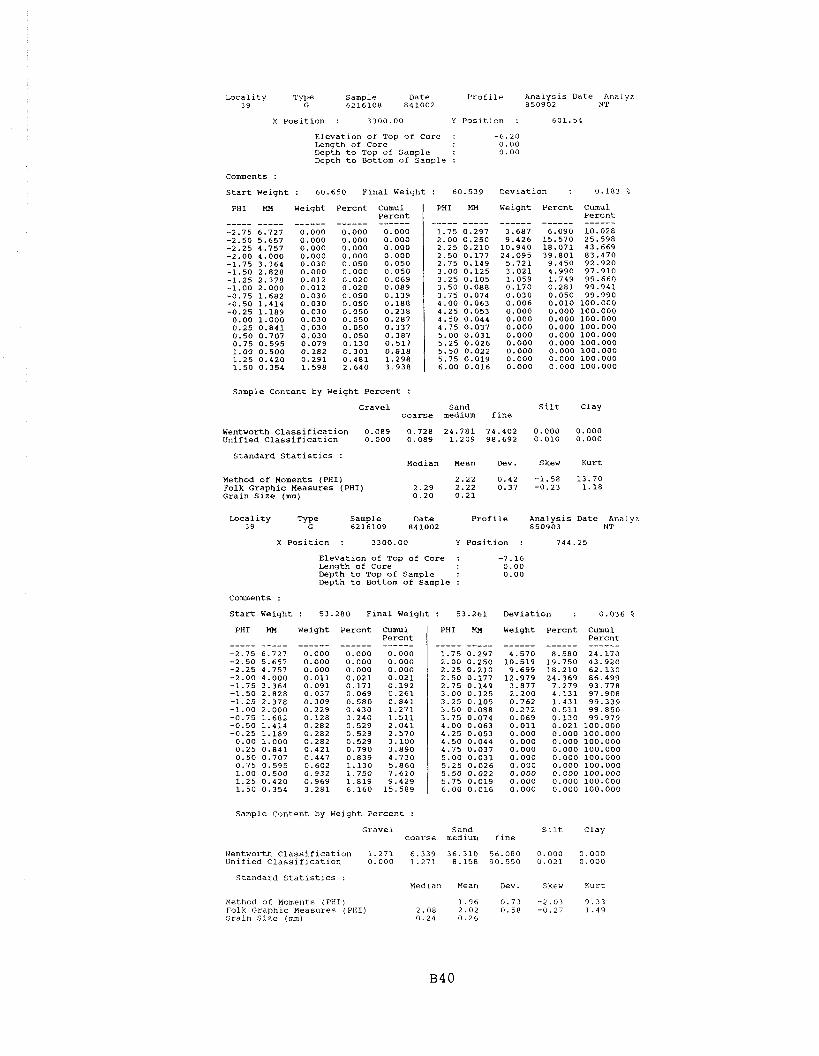
Locality Type Sample Date Profile Analysis Date Analyz 39 G 6216108 841002 850902 NT
X position : 3 3 0 0 . 0 0 Y Position : 601.54
Elevation of Top of Core : -6 .20 Length of Core 0 .00 Depth to Top of Sample : 0 .00 Depth to Bottom of Sample :
Comments :
Start Weight : 60.650 Final Weight : 60 .539 Deviation : 0.183 %
PHI HH Weight Percnt C~mul Percnt ----- ----- ------ ------ ------
PHI
1 .75 2.00 2.25 2 .50 2.75 3 .00 3.25 3.50 3.75 4.00 4.25 4 .50 4.75 5.00 5.25 5.50 5.75 6.00
Weight Percnt
------ 6 .090
15.570 1 8 . 0 7 1 39 .801
9 .450 4 . 9 9 0 1.749 0 . 2 8 1 0.050 0.010 0.000 0 . 0 0 0 0.000 0 .000 0.000 0.000 0 .000 0 . 0 0 0
cumu1 Percnt
sample Content by Weight Percent :
Gravel Sand Silt clay coarse medium fine
Wentvorth Classification 0 .089 0 .728 2 4 . 7 8 1 74.402 0 . 0 0 0 0 .000 Unified Classification 0 .000 0 .089 1.209 98 .692 0.010 0 . 0 0 0
Standard Statistics : Median Mean Dev. Skew Kurt
Method of Moments (PHI) 2.22 0.42 -1.58 13.70 Folk Graphic Measures (PHI) 2 .29 2.22 0.37 -0.23 1 . 1 8 Grain size (mm) 0.20 0 . 2 1
Sample Date Profile Analysis Date Analyz 39 6216109 841002 850903 NT
x Position : 3300 .00 Y Position : 744 .25
Elevation of Top of Core : -7.16 Length of Core 0.00 Depth to Top of Sample : 0.00 Depth to Bottom of Sample :
Comments :
start Weight : 53 .280 Final Weight : 53 .261 Deviation : 0 .036 %
PHI HH Weight Percnt Cumul Percnt ----- ----- ------ ------ ------
PHI Hn Weight Percnt Cumul Percnt
Sample Content by Weiqht Percent :
Gravel Sand Silt Clay coarse medium fine
Wentworth Classification 1 . 2 7 1 6.339 36 .310 56 .080 0 . 0 0 0 0 .000 Unified Classification 0 .000 1 . 2 7 1 8 .158 90 .550 0 . 0 2 1 0 . 0 0 0
Standard Statistics : Medlan Mean Dev. Skew Kurt
Method of Moments (PHI) Folk Graphic Measures (PHI) Grain Size (mm)

L o c a l i t y Type Sample Date P r o f i l e ~ n a l y s i s Date Analyz 39 G 850903 NT 6216110 , 841002
X P o s i t i o n : 3300.00 Y P o s i t i o n : 952.28
E l e v a t i o n o f Top of Core : -12.92 Length o f Core 0.00 Depth t o Top of Sample : 0.00 Depth t o Bottom of Sample :
Comments : AGGREGATES AND ROCK: PHI= -1.0 TO -0 .5 .
S t a r t Weight : 62.600 F i n a l Weight : 62.339 D e v i a t i o n : 0.417 %
PHI MU w e i g h t P e r c n t Cumul P e r c n t ----- ----- ------ ------ ------
PHI MM Weight P e r c n t Cumul P e r c n t ----- ----- ------ ------ ------
Sample C o n t e n t by Weight P e r c e n t :
G r a v e l Sand S i l t Clay c o a r s e medium f i n e
W e n t w o r t h c l a s s i f i c a t i o n 0.520 2.450 3.080 93 .951 0 .000 0.000 U n i f i e d C l a s s i f i c a t i o n 0.000 0.520 2 .769 94.182 2 .530 0 .000
S t a n d a r d S t a t i s t i c s : Median Mean Dev. Skew Kurt
Method o f Moments (PHI) 2.73 0 .65 -2.87 16.60 F o l k G r a p h i c Measures (PHI) 2 .81 2 .80 0.44 -0.08 1 .63 G r a i n S i z e (mm) 0.14 0 .15
Sample Date P r o f i l e A n a l y s i s Date Analyz 39 6216111 841002 850904 NT
X P o s i t i o n : 3300.00 Y P o s i t i o n : 985.24
E l e v a t i o n o f Top o f Core : -12.92 Length o f Core 0 .00 Depth t o Top o f Sample : 0.00 Depth t o Bottom o f Sample :
Comments :
S t a r t w e i g h t : 64 .750 F i n a l w e i g h t : 64.618 D e v i a t i o n : 0 . 2 0 4 %
PHI HM Weight P e r c n t Cumul P e r c n t ----- ----- ------ ------ ------
PHI NH Weight P e r c n t Cumul P e r c n t ----- ----- ------ ------ ------
Sample C o n t e n t by Weight P e r c e n t :
G r a v e l Sand S i l t c l a y c o a r s e medium f i n e
Wentworth C l a s s i f i c a t i o n 0 .119 0 .800 2.069 97.012 0 . 0 0 0 0 . 0 0 0 U n i f i e d C l a s s i f i c a t i o n 0 .000 0.119 0 .890 97.382 1 . 6 0 9 0 . 0 0 0
S t a n d a r d S t a t i s t i c s : Median Mean Dev. Skew K u r t
Method of Moments ( P H I ) 2 .75 0 . 4 6 -2 .18 1 9 . 9 5 F o l k G r a p h i c Measures (PHI) 2.76 2 . 7 6 0 . 3 5 0 .09 1 . 2 1 G r a i n S i z e (mm) 0.15 0 . 1 5

Iacality Type Sample Date Profile ~nalysis Date Analyz 39 G 6216112 841002 850904 NT
X Position : 3300.00 Y Position : 1230.00
Elevation of Top of Core : -13.74 Length of Core 0.00 Depth to Top of Sample : 0.00 Depth to Bottom of Sample :
comments :
Start Weight
PHI HH
----- -----
Deviation : 0.153 % : 60.320 Final Weight : 60.228
Weight Percnt CUmUl Percnt
PHI MM Weight Percnt Cumul Percnt
Sample Content by Weight Percent :
Gravel Sand silt Clay coarse medium fine
Wentworth Classification 0.428 1.320 0.809 97.443 0.000 0.000 Unified Classification 0.000 0.428 1.350 97.091 1.131 0.000
Standard Statistics : Median Mean Dev. Skew Kurt
Method of Moments (PHI) 2.70 0.53 -4.09 31.61 Folk Graphic Heasures (PHI) 2.71 2.72 0.29 0.11 1.18 Grain Size (mm) 0.15 0.15
Locality Sample Date Profile ~nalysis Date Analyz 3 9 6216113 841002 850904 NT
X Position : 3300.00 Y Position : 1499.79
Elevation of Top of Core : -15.97 Length of Core 0.00 Depth to Top of Sample : 0.00 ~epth to Bottom of Sample :
Comments :
Start Weight : 49.370 Final Weight : 49.279 Deviation : 0.184 %
PHI MM Weight Percnt Cumul PHI HH Weight Percnt Cumul ~ercnt 1 Percnt
sample Content by Weight Percent :
Gravel Sand Silt clay coarse medium fine
Wentworth Classification 0.759 2.441 3.789 93.011 0.000 0.000 Unifiedclassification 0.000 0.759 2.660 94.521 2.060 0.000
Standard Statistics : Median Mean Dev. Skew Kurt
nethod of Moments (PHI) 2.69 0.69 -2.94 17.14 Folk ~raphic Measures (PHI) 2.78 2.77 0.47 -0.08 1.46 Graln Size (mm) 0.15 0.15

Lacality Type sample Date Profile Analysis Date Analyz 39 G 6216114 841002 850904 NT
X Position : 3300.00 Y Position : 1743.24
Elevation of Top of Core : -18.50 Length of Core 0.00 Depth to Top of Sample : 0.00 Depth to Bottom of Sample :
Comments :
Start Weight : 63.490 Final Weight : 63.412 Deviation : 0.123 2
PHI MM weight Percnt Cumul PHI HM Weight Percnt Cumul Percnt 1 Percnt
Sample Content by Weight Percent :
Gravel Sand Silt Clay coarse medium fine
Wentworth Classification 0.202 0.432 0.281 99.085 0.000 0.000 Unified classification 0.000 0.202 0.453 94.906 4.439 0.000
Standard Statistics : Hedian Mean Dev. Skew Kurt
Method of uoments (PHI) 2.96 0.45 -3.37 36.65 Folk Graphic Measures (PHI) 2.92 2.96 0.34 0.24 1.31 Grain Size (mm) 0.13 0.13
Locality sample Date profile Analysis Date Analyz 3 9 6216115 841002 850904 NT
X Position : 3300.00 Y Position : 1981.62
Elevation of Top of Core : -20.53 Length of Core 0.00 Depth to Top of Sample : 0.00 Depth to Bottom of Sample :
Comments :
Startweight: 50.280 Finalweight: 50.229 Deviation : 0.1012
PHI HM Weight Percnt Cumul PHI HM Weight Percnt Cumul Percnt I Percnt
Sample Content by Weight Percent :
Gravel Sand Silt Clay coarse medium fine
Wentworth Classification 0.360 0.378 0.319 98.943 0.000 0.000 Unified Classification 0.000 0.360 0.398 95.090 4.151 0.000
Standard Statistics : Median Mean Dev. Skew Kurt
Method of Moments (PHI) Folk Graphic Measures (PHI) Grain Size (mm)

Sample 6216116
Date 841002
Profile malysis Date Analyz 850904 SGU
X Position : 3300.00 Y Position : 2465.92
Elevation of Top of Core : -23.86 Length of Core 0.00 Depth to Top of Sample : 0.00 Depth to Bottom of Sample :
comnents :
Start Weight : 48.930 Final Weight : 48.289 Deviation : 1.310 %
PHI MH Weight Percnt Cumul Percnt ----- ----- ------ ------ ------
PHI HM Weight Percnt Cumul Percnt ----- ----- ------ ------ ------
Sample Content by Weight Percent :
Gravel Sand Silt Clay coarse medium fine
Sentworth Classification 0.139 0.480 0.360 99.020 0.000 0.000 Unified Classification 0.000 0.139 0.520 97.471 1.870 0.000
Standard Statistics : Median Mean Dev, Skew Kurt
Method of Moments (PHI) 2.76 0.43 -2.17 25.33 ~ o l k Graphic Measures (PHI) 2.71 2.75 0.34 0.27 1.20 Grain Size (mm) 0.15 0.15
~ocality Type sample Date Profile Analysis Date Analyz 3 9 G 6216117 841002 850904 SGU
X Position : 3300.00 YPosition : 2962.58
Elevation of Top of Core : -26.30 Length of Core 0.00 Depth to Top of Sample : 0.00 Depth to Bottom of Sample :
Comments :
Start Weight : 48.130 Final Weight : 48.162 Deviation : 0.066 %
Sample Content by Weight Percent :
PHI HM Weight Percnt Cumul Percnt ----- ----- ------ ------ ------
-2.75 6.727 0.000 0.000 0.000 -2.50 5.657 0.000 0.000 0.000
Gravel Sand Silt Clay coarse medium fine
PHI HM Weight Percnt Cumul Percnt ----- ----- ------ ------ ------
1.75 0.297 0.019 0.039 0.455 2.00 0.250 0.067 0.139 0.594
Wentworth Classification Lnified Classification
Standard Statistics : Median Mean Dev. Skew Kurt
!'*:hod ot Eot,ents (PHI) 2.58 0.42 -0.91 15.54 Folk Graphic ~easu;es (PHI) Grain Size (m)

L o c a l i t y Type Sample Date p r o f i l e Ana lys i s Date Analyz 3 9 G 6216301 841015 850910 SGU
X P o s i t i o n : 3300.00 Y P o s i t i o n : 178.55
Eleva t ion of Tcp of Core : 21.55 Length of Core 0.00 Depth t o Top of Sample : 0.00 Depth t o Bottom o f Sample :
Comments : 1.25 PHI CORRECTION BY MOD. LINEAR FIT 27 J U N 86
S t a r t Weight : 60.180 F i n a l Weight : 60.050 Deviat ion : 0.216 1
PHI Weight
------ Percnt cumul
Pe rcn t ------ 0.000
PHI
----- 1.75 2.00 2.25 2.50 2.75 3.00 3.25 3.50 3.75 4.00 4.25 4.50 4.75 5.00 5.25 5.50 5.75 6.00
Weight Pe rcn t
------ 13.980 13.321 4.160 4.849 1.071 0.380 0.070 0.020 0.020 0.020 0.000 0.000 0.000 0.000 0.000 0.000 0.000 0.000
cumul Pe rcn t
Sample Content by Weight Pe rcen t :
Gravel Sand S i l t Clay c o a r s e medium f i n e
Wentworth C l a s s i f i c a t i o n 0.040 37.820 51.550 10.590 0.000 0.000 u n i f i e d C l a s s i f i c a t i o n 0.000 0.040 49.820 50.120 0.020 0.000
Standard S t a t i s t i c s : Median Mean Dev. Skew Kurt
Method o f Moments (PHI) 1 . 2 1 0.69 -0.24 2.82 Folk Graphic Measures (PHI) 1.25 1.21 0.70 -0.08 0.97 Grain S i z e (mm) 0.42 0.43
sample 6216302
Date 841015
P r o f i l e Ana lys i s Date Analyz 850916 SGU
X P o s i t i o n : 3300.00 Y P o s i t i o n : 193.59
Eleva t ion of Top of Core : 18.11 Length o f Core 0.00 Depth t o Top of Sample : 0.00 Depth t o Bottom of Sample :
Comments : 1.25 PHI CORRECTION BY MOD. LINEAR FIT 27 JUN 86
S t a r t w e i g h t : 60.570 F i n a l w e i g h t : 60.278 Deviat ion : 0.482%
PHI Weight Percnt CUmUl Pe rcn t ------ 0.000 0.000 0.000 0.020 0.040 0.040 0.040 0.070 0.090 0.109 0.129 0.159 0.239 2.250 8.499
26.069 43.630 61.190
PHI
----- 1.75 2.00 2.25 2.50 2.75 3.00 3.25 3.50 3.75 4.00 4.25 4.50 4.75 5.00 5.25 5.50 5.75 6.00
Weight P e r c n t m u 1 Percn t ------
Sample c o n t e n t by Weight Percent :
Gravel Sand S i l t Clay c o a r s e medium f i n e
Wentworth c l a s s i f i c a t i o n 0.070 26.000 66.752 7.178 0.000 0.000 Unif ied C l a s s i f i c a t i o n 0.000 0.070 43.560 56.370 0.000 0.000
Standard S t a t i s t i c s : Median Mean Dev. Skew Kurt
Method of Moments (PHI) Folk Graphic Measures (PHI) Grain S i z e (mm)

Sample Date Profile Analysis Date Analyz 3 9 6216303 841015 850910 NT
X Position : 3300.00 Y Position : 230.65
Elevation of Top of Core : 12.70 Length of Core 0.00 Depth to Top of Sample : 0.00 Depth to Bottom of Sample :
Comments : 1.25 PHI CORRECTION BY MOD. LINEAR FIT 27 JUN 86
Start Weight : 61.760 Final Weight : 61.730 Deviation : 0.049 '6
PHI MM Weight Percnt Cumul Percnt
Sample Content by Weight Percent :
PHI MM Weight Percnt CUmul Percnt ----- ----- ------ ------ ------
Gravel Sand Silt Clay coarse medium fine
Wentworth Classification 0.620 66.520 25.829 7.031 0.000 0.000 Unified Classification 0.000 0.620 73.830 25.540 0.010 0.000
Standard Statistics : Median Mean Dev. Skew Kurt
Method of Moments (PHI) Folk Graphic Measures (PHI) Grain Size (mm)
Locality Sample Date Profile Analysis Date Analyz 3 9 6216304 841015 850910 NT
XPosition : 3300.00 Y Position : 272.70
Elevation of Top of Core : Length of Core Depth to Top of Sample : Depth to Bottom of Sample :
Comments : 1.25 PHI CORRECTION BY HOD. LINEAR FIT 27 JLTN 86
Start Weight : 60.180 Final Weight : 60.100 Deviation : 0.133 9
PHI MH Weight Percnt Cumul Percnt ----- ----- ------ ------ ------
-2.75 6.727 0.000 0.000 0.000
PHI MM Weight Percnt Cumul Percnt ----- ----- ------ ------ ------
1.75 0.297 2.759 4.591 87.511
Sample Content by Weight Percent :
Gravel Sand Silt Clay coarse medium fine
Wentworth Classification 5.140 69.531 18.551 6.779 0.000 0.000 Unified Classification 0.000 5.140 74.281 20.559 0.020 0.000
Standard Statistics : Median Mean Dev. Skew Kurt
Method of Moments (PHI) 0.38 0.99 0.39 2.43 Folk Graphic Measures (PHI) 0.25 0.39 1.03 0.21 0.92 Grain size (mm) 0.84 0.77

Locality Type Sample Date Profile Analysis Date Analyz 39 G 6216307 841016 850910 IiT
X Position : 3300.00 Y Position : 433.12
Elevation of Top of Core : -5.46 Length of Core 0.00 Depth to Top of Sample : 0.00 Depth to Bottom of Sample :
Comments :
Start Weight : 61.310 Final Weight : 61.168 Deviation : 0.232 2
PHI MM Weight Percnt Cumul Percnt
PHI MN Weight Percnt Cumul Percnt ----- ----- ------ ------ ------
Sample Content by Weight Percent :
Gravel sand Silt Clay coarse medium fine
Wentworth Classification 43.560 42.790 3.760 9.889 0.000 0.000 Unified Classification 0.000 43.560 43.130 13.299 0.010 0.000
Standard Statistics : Median Mean Dev. Skew Kurt
Method of Moments (PHI) -0.55 1.32 1.28 3.91 Folk Graphic Measures (PHI) -0.86 -0.69 1.25 0.34 1.73 Grain Size (mm) 1.81 1.47
Locality Type Sample Date Profile Analysis Date Analyz 3 9 G 6216308 841016 850910 NT
X Position : 3300.00 Y Position : 564.24
Elevation of Top of Core : -8.09 Length of Core 0.00 Depth to Top of Sample : 0.00 Depth to Bottom of Sample :
Comments :
Startweight: 63.250 Finalweight: 64.563 Deviation : 2.076%
PHI MM Weight Percnt Cumul PHI PIM Weight Percnt Cumul Percnt ----- ----- ------ ------ ----- ----- ------ ------ ------
Sample Content by Weight Percent :
Gravel Sand Silt Clay coarse medium fine
Wentworth Classification 4.441 18.100 45.269 32.190 0.000 0.000 Unified Classification 0.000 4.441 21.320 74.230 0.009 0.000
Standard Statistics : Median Mean Dev. Skew Kurt
Method of Moments (PHI) 1.49 1.05 -1.53 5.44 Folk Graphic Measures (PHI) 1.75 1.61 0.95 -0.36 1.43 Grain Size (mm) 0.30 0.36

sample Content by Weight Percent :
Locality Type Sample Date Profile Analysis Date Analyz 39 G 6216309 841016 850910 NT
X Position : 3300.00 Y Position : 703.63
Elevation of Top of Core : -7.21 Lenqth of Core 0.00 Depth to Top of Sample : 0.00 Depth to Bottom of Sample :
Comments :
Start Weight : 58.120 Final Weight : 58.051 Deviation : 0.119 %
Gravel Sand Silt Clay coarse medium fine
PHI MI4 Weight Percnt Cumul Percnt _---- __-_- ____-- _----_ _---_-
-2.75 6.727 0.000 0.000 0.000 -2.50 5.657 0.000 0.000 0.000 -2.25 4.757 0,000 0.000 0.000 -2.00 4.000 0.389 0.670 0.670 -1.75 3.364 0.122 0.210 0.880 -1.50 2.828 0.650 1.120 2.000 -1.25 2.378 1.161 2.000 4.000 -1.00 2.000 1.521 2.620 6.620 -0.75 1.682 1.591 2.741 9.361 -0.50 1.414 3.013 5.190 14.551 -0.25 1.189 3.291 5.669 20.220 0.00 1.000 2.618 4.510 24.730 0.25 0.841 3.442 5.929 30.659 0.50 0.707 3.158 5.440 36.099 0.75 0.595 3.048 5.251 41.350 1.00 0.500 3.611 6.220 47.570 1.25 0.420 1.358 2.339 49.910 1.50 0.354 4.650 8.010 57.920
Wentworth Classification 6.620 40.950 29.500 22.930 0.000 0.000 Unified Classification 0.000 6.620 43.290 50.090 0.000 0.000
PHI MH Weight Percnt Cumul Percnt ____- -_--_ ------ ------ ------
1.75 0.297 4.389 7.561 65.480 2.00 0.250 6.728 11.590 77.070 2.25 0.210 3.622 6.239 83.310 2.50 0.177 5.712 9.840 93.149 2.75 0.149 2.363 4.071 97.220 3.00 0.125 1.260 2.171 99.390 3.25 0.105 0.279 0.481 99.871 3.50 0.088 0.058 0.100 99.971 3.75 0.074 0.017 0.029 100.000 4.00 0.063 0.000 0.000 100.000 4.25 0.053 0.000 0.000 100.000 4.50 0.044 0.000 0.000 100.000 4.75 0.037 0.000 0.000 100.000 5.00 0.031 0.000 0.000 100.000 5.25 0.026 0.000 0.000 100.000 5.50 0.022 0.000 0.000 100.000 5.75 0.019 0.000 0.000 100.000 6.00 0.016 0.000 0.000 100.000
Standard Statistics :
Method of Moments (PHI) Folk Graphic Measures (PHI) Grain Size (mm)
Sample 6216310
Median Mean Dev. Skew Kurt
0.97 1.21 -0.39 2.15 1.25 1.03 1.25 -0.26 0.79 0.42 0.51
Date 841016
Profile Analysis Date Analyz 850910 SGU
x Position : 3300.00 Y Position : 838.51
Elevation of Top of Core : -8.67 Length of core 0.00 Depth to Top of Sample : 0.00 Lkpth to Bottom of Sample :
Comments : MICA CHIPS PRESENT
start Weight : 66.160 Final Weight : 66.160 Deviation : 0.000 %
PHI MEI Weight Percnt Cumul Percnt ----- ----- ------ ------ ------
PHI NH Weight Percnt Cumul Percnt ----- ----- ------ ------ ------
Sample Content by Weight Percent :
Gravel Sand Silt Clay coarse medium fine
Wentworth Classification 0.100 3.762 8.479 87.659 0.000 0.000 Unified Classification 0.000 0.100 4.022 95.818 0.060 0.000
Standard Statistics : Median Mean Dev. Skew Kurt
Method of Moments (PHI) Folk Graphic Measures (PHI) Grain size (m)

Locality Type Sample Date Proflle Analysis Date Analyz 39 G 6 2 1 6 3 1 1 841016 850910 NT
X Position : 3300.00 Y Position : 1047 .38
Elevation of Top of Core : - 1 3 . 5 0 Length of Core 0 . 0 0 Depth to Top of Sample : 0 .00 Depth to Bottom of Sample :
Comments :
Start Weight : 53 .250 Final Weight : 53 .190 Deviation : 0.113 %
PHI MM Weight Percnt Cumul Percnt
----- ----- ------ ------ ------ -2.75 6.727 0.000 0.000 0.000 -2.50 5.657 0.000 0.000 0.000
PHI MM Weight Percnt Cumul Percnt ----- ----- ------ ------ ------
1.75 0.297 0 . 4 2 0 0.790 6.962 2.00 0.250 0 .968 1 . 8 2 0 8.782
Sample Content by Weight Percent :
Gravel Sand Silt Clay coarse medium fine
Wentworth Classification 0 . 0 8 1 4 . 7 2 1 3 .980 91.218 0.000 0 . 0 0 0 unified Classification 0.000 0 . 0 8 1 5 . 1 3 1 94 .659 0 . 1 3 0 0.000
Standard Statistics : Median Mean Dev. Skew Kurt
Method of Moments (PHI) Folk Graphic Measures (PHI) Grain Size (mm)
Locality Type Sample Date Profile Analysis Date Analyz 39 G 6216312 841016 850910 SGU
X Position : 3300.00 Y Position : 1200 .26
Elevation of Top of Core : -13.64 Length of Core 0 .00 Depth to Top of Sample : 0 .00 Depth to Bottom of Sample :
Comments :
start Weight : 57 .500 Final Weight : 57.409 Deviation : 0.158 %
PHI Weight Percnt CumUl Percnt ------
0 .000 0 .000 0 .000 0 .000 0 .000 0 .000 0.019 0 .038 0 .068 0.138 0.228 0.368 0.908 1.958 3.268 4.797 5.267 6.088
PHI MM Weight Percnt Cumul Percnt ----- ----- ------ ------ ------
2 .50 0.177 1 3 . 3 3 1 2 3 . 2 2 1 33 .779 2 .75 0.149 20 .891 3 6 . 3 9 0 70.168 3 .00 0 .125 12.889 2 2 . 4 5 1 92.620 3.25 0.105 2 .807 4 .889 97 .509 3 .50 0.088 1.062 1 . 8 5 0 99.359 3.75 0.074 0 .299 0 . 5 2 1 99.880 4.00 0.063 0.069 0 . 1 2 0 100 .000 4 .25 0.053 0 . 0 0 0 0.000 100 .000 4 .50 0.044 0 .000 0 . 0 0 0 1 0 0 . 0 0 0 4.75 0.037 0 .000 0 . 0 0 0 100.000 5 .00 0 . 0 3 1 0 . 0 0 0 0 . 0 0 0 100 .000 5 .25 0.026 0.000 n.nnn ~ n n nnn
Sample Content by Weight Percent :
Gravel Sand Silt Clay coarse medium fine
Wentworth Classification 0.038 4 . 7 5 9 3 . 6 2 0 91.583 0 . 0 0 0 0 . 0 0 0 Unified Classification 0 .000 0 .038 5 .229 94.612 0 .120 0 . 0 0 0
Standard Statistics : Kedian Mean Dev. Skew Kurt
Xethod of Moments (PHI) 2 . 5 2 0 . 5 6 - 2 . 4 5 1 0 . 8 7 Folk Graphic Measures (PHI) 2 . 6 1 2 . 6 1 0 . 4 5 - 0 . 2 6 2 . 0 7 Grain Size (mm) 0 . 1 6 0 . 1 7

Sample Date P r o f i l e Analysis Date Analyz 3 9 6216313 841016 850910 SGU
x P o s i t i o n : 3300.00 Y P o s i t i o n : 1404 .57
Eleva t ion of Top of Core : -15.02 Length of Core 0.00 Depth t o Top o f Sample : 0.00 Depth t o Bottom of Sample :
comments :
S t a r t Weight : 57.830 F i n a l Weight : 57.759 Deviat ion : 0.123 %
PHI hl4 Weight Pe rcn t Cumul P e r c n t ----- ----- ------ ------ ------
PHI hl4 Weight P e r c n t Cum1 P e r c n t ----- ----- ------ ------ ------
Sample Content by Weight Pe rcen t :
Gravel Sand S i l t Clay c o a r s e medium f i n e
W e n t w o r t h C l a s s i f i c a t i o n 0.859 8.099 8.350 82.692 0.000 0.000 Unif ied C l a s s i f i c a t i o n 0.000 0.859 9 . 1 4 0 89.932 0.069 0.000
Standard S t a t i s t i c s : Median Mean Dev. Skew Kurt
Method of Moments (PHI) 2.26 0.75 -2 .48 11.70 ~ o l k G r a ~ h i c Measures (PHI) 2 . 4 1 2.36 0.57 -0.34 2 . 7 1 Grain siie (mm) 0.19 0 . 2 1
Loca l i t y Sample Date P r o f i l e Ana lys i s Date Analyz 3 9 6216314 841016 850910 SGU
x P o s i t i o n : 3300.00 Y P o s i t i o n : 1689.57
Eleva t ion of Top of Core : -17.91 Length o f Core 0.00 m p t h t o TOP of Sample : 0.00 ~ e p t h t o ~ o t t 0 m of Sample :
Comments :
s t a r t Weight
PHI MH
: 54.870 F i n a l Weight
Weight Pe rcn t Cumul Pe rcn t - - - - - - - - - - - - - - - - - -
0.000 0.000 0.000 0.000 0.000 0.000 0.000 0.000 0.000 0.120 0.219 0.219 0.000 0.000 0.219 0.060 0.110 0.329 0 . 1 3 1 0.239 0.568 0.082 0.150 0.718 0.027 0.049 0.767 0.022 0.040 0.807 0.038 0.069 0.876 0.027 0.049 0.926 0.011 0.020 0.946 0.000 0.000 0.946 0.022 0.040 0.986 0.022 0.040 1.026 0.022 0.040 1.066 0.027 0.049 1.116
PHI hl4
Deviat ion : 0.190 %
Weight Pe rcn t Cumul P e r c n t
sample Content by Weight Pe rcen t :
Gravel Sand S i l t Clay c o a r s e medium f i n e
Wentworth C l a s s i f i c a t i o n 0.718 0.309 0.889 98.085 0.000 0.000 Unif ied c l a s s i f i c a t i o n 0.000 0 .718 0 . 3 4 9 98 .683 0 .250 0.000
Standard S t a t i s t i c s : Median Mean Dev. Skew Kurt
Kethod o f Moments (PHI) 2 . 6 3 0 . 5 0 - 4 . 9 2 4 3 . 9 0 Folk Graphic Measures (PHI) 2 .64 2 . 6 5 0 . 2 9 0 . 1 4 0 .93 Grain S i z e (mm) 0 .16 0 . 1 6

Sample Date P r o f i l e Analysis Date Analyz 39 6216315 841016 850910 SGU
X P o s i t i o n : 3300.00 Y P o s i t i o n : 1950.76
Eleva t ion of Top of Core : -20.40 Length of Core 0.00 Depth t o Top of Sample : 0.00 Depth t o Bottom o f Sample :
Comments :
S t a r t Weight
PHI MM
,330 F i n a l Weight Deviat ion : 0.304 %
Weight Pe rcn t Cumul Pe rcn t ------ ------
0.000 0.000 0.000 0.000 0.000 0.000 0.219 0.219 0.000 0.219 0.100 0.319 0.000 0.319 0.060 0.379 0.020 0.399 0.120 0.518 0.060 0.578 0.080 0.658 0.020 0.678 0.020 0.698 0.040 0.737 0.040 0.777 0.020 0.797 0.080 0.877
PHI MM Weight
------ Percn t Cumul
Pe rcn t ------
Sample Content by Weight Pe rcen t :
Gravel Sand s i l t Clay c o a r s e medium f i n e
W e n t w o r t h c l a s s i f i c a t i o n 0.379 0.399 0.700 98.523 0.000 0.000 Unif ied C l a s s i f i c a t i o n 0.000 0.379 0.419 97.314 1.889 0.000
Standard S t a t i s t i c s : Median Mean Dev. Skew Kurt
Method of Moments (PHI) 2.88 0.49 -4.19 40.82 Folk Graphic Measures (PHI) 2.88 2.89 0.35 0.12 1.18 Grain S i z e (mm) 0.14 0.14
Loca l i t y sample Date P r o f i l e Ana lys i s Date Analyz 3 9 ? 6216317 841016 850909 NT
X P o s i t i o n : 3300.00 Y P o s i t i o n : 2537.05
Eleva t ion of Top of Core : -24.30 Length of Core 0.00 D e p t h t o T o p o f S a m p l e : 0.00 Depth t o Bottom o f Sample :
Comments :
s t a r t Weight : 52.390 F i n a l Weight : 52.300 Deviat ion : 0.172 %
PHI MM Weight Pe rcn t Cumul PHI Kt4 Weight Pe rcn t Cumul e n I P e r c n t ----- ----- ------ ------ ------ ----- ----- ------ ------ ------
Sample Content by Weight Percent :
Gravel s and s i l t Clay c o a r s e medium f i n e
Wentworth C l a s s i f i c a t i o n 0.340 1.468 11.992 86.199 0.000 0.000 Unif ied C l a s s i f i c a t i o n 0.000 0.340 1.679 97.910 0.071 0.000
Standard S t a t i s t i c s : Median Mean Dev. Skew Kurt
Method o f Moments (PHI) 2 . 3 8 0.51 -3.03 21.26 Folk Graphic Measures (PHI) 2 . 4 1 2.40 0.37 -0.06 1.29 Grain S i z e (mm) 0.19 0.19

Sample Content by Weight Percent :
lacality Type Sample Date Profile Analysis Date Analyz 39 G 6216501 841029 850913 NT
X Position : 3300.00 Y Position : 169.73
Elevation of TOP of Core : 20.85 Length of Core 0.00 Depth to Top of Sample : 0.00 Depth to Bottom of Sample :
Comments :
Start Weight : 62.750 Final Weight: 62.712 Deviation : 0.061 %
Gravel Sand Silt Clay coarse medium fine
PHI HM Weight Percnt Cumul Percnt ----- ----- ------ ------ ------
-2.75 6.727 0.000 0.000 0.000 -2.50 5.657 0.000 0.000 0.000 -2.25 4.757 0.000 0.000 0.000 -2.00 4.000 0.000 0.000 0.000 -1.75 3.364 0.000 0.000 0.000 -1.50 2.828 0.013 0.021 0.021 -1.25 2.378 0.000 0.000 0.021 -1.00 2.000 0.069 0.110 0.131 -0.75 1.682 0.082 0.131 0.262 -0.501.414 0.219 0.349 0.611 -0.25 1.189 0.508 0.810 1.421 0.00 1.000 0.759 1.210 2.631 0.25 0.841 1.461 2.330 4.961 0.50 0.707 2.270 3.620 8.580 0.75 0.595 2.998 4.781 13.361 1.00 0.500 5.500 8.770 22.131 1.25 0.420 3.167 5.050 27.181 1.50 0.354 9.218 14.699 41.880
Wentworth Classification 0.131 22.001 53.988 23.881 0.000 0.000 Unified Classification 0.000 0.131 27.051 72.798 0.021 0.000
PHI Hn Weight Percnt Cumul Percnt ----- ----- ------ ------ ------
1.75 0.297 9.137 14.570 56.450 2.00 0.250 12.335 19.669 76.119 2.25 0.210 6.528 10.409 86.529 2.50 0.177 5.631 8.979 95.508 2.75 0.149 1.819 2.901 98.409 3.00 0.125 0.740 1.180 99.589 3.25 0.105 0.182 0.290 99.879 3.50 0.088 0.050 0.080 99.959 3.75 0.074 0.013 0.021 99.979 4.000.063 0.013 0.021100.000 4.25 0.053 0.000 0.000 100.000 4.50 0.044 0.000 0.000 100.000 4.75 0.037 0.000 0.000100.000 5.00 0.031 0.000 0.000 100.000 5.25 0.026 0.000 0.000 100.000 5.50 0.022 0.000 0.000 100.000 5.75 0.019 0.000 0.000 100.000 6.00 0.016 0.000 0.000 100.000
Standard Statistics : Median Mean Dev. Skew Kurt
Method of Moments (PHI) 1.54 0.69 -0.65 3.50 Folk Graphic Ueasures (PHI) 1.64 1.55 0.68 -0.22 1.08 Grain Size (mm) 0.32 0.34
Locality Te Sample Date Profile Analysis Date Analyz 3 9 6216502 841029 850913 NT
x Position : 3300.00 Y position : 191.81
Elevation of Top of Core : 20.46 Length of Core 0.00 Depth to Top of Sample : 0.00 Depth to Bottom of Sample :
Comments :
Start Weight
PHI MM
: 56.290 Final Weight
Weight Percnt Cumul Percnt ------ ------ ------
0.000 0.000 0.000 0.000 0.000 0.000 0.000 0.000 0.000
PHI Kt4
Deviation : 0.284 P
Weight Percnt Cumul Percnt
sample Content by Weight Percent :
Gravel Sand Silt Clay coarse medium fine
Wentworth Classification 0.020 31.513 59.029 9.439 0.000 0.000 Unified Classification 0.000 0.020 39.282 60.698 0.000 0.000
Standard Statistics : Median Mean Dev. Skew Kurt
Method of Moments (PHI) Folk Graphic Measures (PHI) Grain Size (mm)

Iacality Type Sample Date Profile Analysls Date Analy: 3 9 G 6216503 841029 850913 NT
X Position : 3 3 0 0 . 0 0 Y Position : 2 2 9 . 4 1
Elevation of Top of Core : 12.06 Length of Core 0.00 Depth to Top of Sample : 0.00 Depth to Bottom of Sample :
Comments :
start Weight : 59.960 Final Weight : 59 .931 Deviation : 0 . 0 4 8 %
PHI MM Weight Percnt Cumul Percnt ----- ----- ------ ------ ------
PHI MM Weight Percnt Cumul Percnt
----- ----- ------ ------ ------
Sample Content by Weight Percent :
Gravel Sand Silt Clay coarse medium fine
Wentworth Classification 0.230 59.901 30.560 9.309 0.000 0.000 Unified Classification 0.000 0.230 63 .321 36.449 0.000 0.000
Standard Statistics : Median Mean Dev. Skew Kurt
Method of Moments (PHI) 0.87 0.83 0.16 2 . 2 1 Folk Graphic Measures (PHI) 0.77 0.87 0.85 0.15 0.83 Grain size (mm) 0.59 0.55
Locality Sample Date Profile Analysis Date Ana 3 9 6216504 841029 850916 NT
XPosition : 3300.00 Y Position : 265.35
Elevation of Top of Core : 8.39 Length of Core 0.00 Depth to Top of Sample : 0.00 Depth to Bottom of Sample :
Comments :
Start Weight : 55.420 Final Weight : 55.359 Deviation : 0.110
PHI MM Weight Percnt Cumul PHI MM Weight Percnt Cumul percnt 1 Percnt ----- ----- ------ ------ ------ ----- ----- ------ ------ --__--
Sample Content by Weight Percent :
Gravel Sand Silt Clay coarse medium fine
h'entworth C1ass:flcation 1 . 4 9 9 79 .379 4 5 . 7 2 9 2 3 . 3 9 3 0.000 0.000 Onifled Claoslflcatlon 3 . 0 0 0 1 . 4 9 9 3 2 . 8 4 9 65.C51 0.000 S . 0 0 ~
Standard Statistics : Median Mean Dev. Skew Kurt
Method of Moments (PHI) Folk Graphic Measures (PHI) Grain size (mm)

Sample Content by Weight Percent :
Locality Type Sample Date Profile Analysis Date Analyz 3 9 G 6216505 841029 850916 SGU
X Position : 3300.00 Y Position : 300.95
Elevation of Top of Core : 5.99 Length of Core 0.00 Depth to Top of Sample : 0.00 Depth to Bottom of Sample :
Comments :
Start Weight : 64.890 Final Weight : 64.690 Deviation : 0.308 9;
Gravel Sand Silt Clay coarse medium fine
PHI MM Weight Percnt Cumul Percnt ___-- _ _ _ _ _ ______ _____- __-_-_
-2.75 6.727 0.000 0.000 0.000 -2.50 5.657 0.000 0.000 0.000 -2.25 4.757 0.000 0.000 0.000 -2.00 4.000 0.000 0.000 0.000 -1.75 3.364 0.000 0.000 0.000 -1.50 2.828 0.000 0.000 0.000 -1.25 2.378 0.123 0.190 0.190 -1.00 2.000 0.259 0.400 0.591 -0.75 1.682 0.330 0.510 1.101 -0.50 1.414 0.563 0.870 1.971 -0.25 1.189 0.272 0.420 2.391 0.00 1.000 0.259 0.400 2.792 0.25 0.841 0.408 0.631 3.422 0.50 0.707 0.582 0.900 4.322 0.75 0.595 1.061 1.640 5.962 1.00 0.500 2.387 3.690 9.652 1.25 0.420 1.481 2.289 11.942 1.50 0.354 6.482 10.020 21.962
Wentworth Classification 0.591 9.062 53.690 36.658 0.000 0.000 Unified classification 0.000 0.591 11.351 88.049 0.009 0.000
PHI MM Weight Percnt Cumul Percnt ---_- --__- ___--- ---__- -----_
1.75 0.297 8.940 13.820 35.781 2.00 0.250 17.829 27.561 63.342 2.25 0.210 9.257 14.310 77.652 2.50 0.177 10.971 16.959 94.611 2.75 0.149 2.568 3.970 98.581 3.00 0.125 0.718 1.110 99.691 3.25 0.105 0.129 0.199 99.890 3.50 0.088 0.052 0.080 99.971 3.75 0.074 0.013 0.020 99.991 4.00 0.063 0.006 0.009 100.000 4.25 0.053 0.000 0.000 100.000 4.50 0.044 0.000 0.000 100.000 4.75 0.037 0.000 0.000 100.000 5.00 0.031 0.000 0.000 100.000 5.25 0,026 0.000 0.000 100.000 5.50 0.022 0.000 0.000 100.000 5.75 0.019 0.000 0.000 100.000 6.00 0.016 0.000 0.000 100.000
Standard Statistics : Median Hean Dev. Skew Kurt
Method of Moments (PHI) 1.79 0.65 -1.78 7.97 ~ o l k Graphic Measures (PHI) 1.88 1.86 0.54 -0.20 1.21 Grain Size (mm) 0.27 0.29
Locality Type Sample Date Profile Analysis Date Analyz 3 9 G 6216507 841029 850916 SGU
x Position : 3300.00 Y Position : 457.25
Elevation of Top of Core : -8.61 Length of Core 0.00 Depth to Top of Sample : 0.00 wpth to Bottom of Sample :
Comments :
Start Weight : 58.090 Final Weight : 57.768 Deviation : 0.554 $
PHI
----- -2.75 -2.50 -2.25 -2.00 -1.75 -1.50 -1.25 -1.00 -0.75 -0.50 -0.25 0.00 0.25 0.50 0.75 1.00 1.25 1.50
Weight Percnt CUmUl Percnt
PHI Weight Percnt CumUl Percnt
Sample Content by Weight Percent :
Gravel Sand Silt Clay coarse medium fine
Wentworth Classification 0.779 2.958 6.040 90.223 0.000 0.000 unified Classification 0.000 0.779 3.078 96.032 0.111 0.000
Standard Statistics : Median Mean Dev. Skew Kurt
Method of Moments (PHI) 2.46 0.68 -3.11 16.00 Folk Graphic Measures (PHI) 2.55 2.57 0.40 -0.04 1.30 Grain size (mm) 0.17 0.18
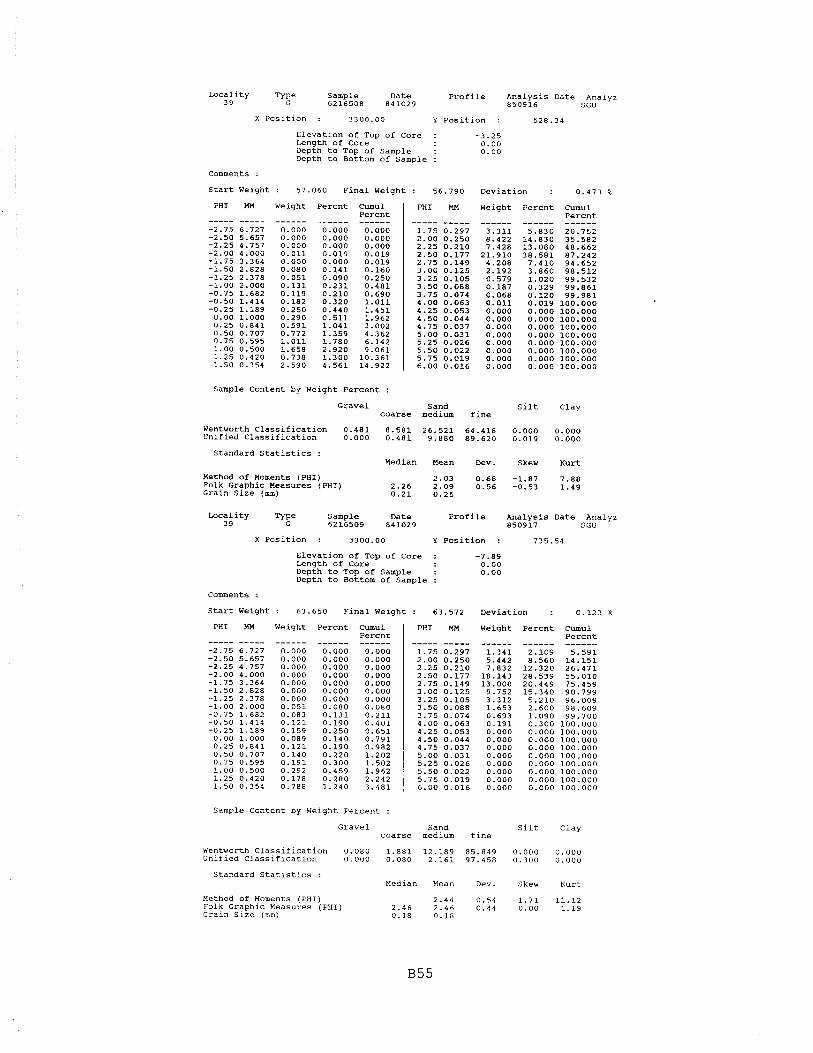
Iacality Type Sample Date 39
Profile Analysis Date Analyz G 6216508 841029 850916 SGU
X Position : 3300.00 Y Position : 528.34
Elevation of Top of Core : -3.25 Length of Core 0.00 Depth to Top of Sample : 0.00 Depth to Bottom of Sample :
Comments :
Start Weight : 57.060 Final Weight : 56.790 Deviation : 0.473 O
PHI
----- -2.75 -2.50 -2.25 -2.00 -1.75 -1.50 -1.25 -1.00 -0.75 -0.50 -0.25 0.00 0.25 0.50 0.75 1.00 1.25 1.50
Weight Percnt CUmUl Percnt
PHI Weight Percnt
------ 5.830 14.830 13.080 38.581 7.410 3.860 1.020 0.329 0.120 0.019 0.000 0.000 0.000 0.000 0.000 0.000 0.000 0.000
Cumul Percnt ------ 20.752 35.582 48.662 87.242 94.652 98.512 99.532 99.861 99.981 100.000 100.000 100.000 100.000 100.000 100.000 100.000 100.000 100.000
Sample Content by Weight Percent :
Gravel Sand Silt Clay coarse medium fine
Wentworth Classification 0.481 8.581 26.521 64.418 0.000 0.000 Unified Classification 0.000 0.481 9.880 89.620 0.019 0.000
Standard Statistics : Median Mean Dev. Skew Kurt
Method of Uoments (PHI) 2.03 0.68 -1.87 7.88 Folk Graphic Ueasures (PHI) 2.26 2.09 0.56 -0.53 1.49 Grain Size (mm) 0.21 0.25
Locality Sample Date Profile Analysis Date Analyz 3 9 6216509 841029 850917 SGU
X Position : 3300.00 Y Position : 735.54
Elevation of Top of Core : -7.89 Length of Core 0.00 Depth to Top of Sample : 0.00 Depth to Bottom of Sample :
Comments :
Startweight: 63.650 Finalweight: 63.572 Deviation : 0.123%
PHI Mn Weight Percnt Cumul Percnt ----- ----- ------ ------ ------
PHI MM Weight Percnt
------ 2.109 8.560 12.320 28.539 20.449 15.340 5.210 2.600 1.090 0.300 0.000 0.000 0.000 0.000 0.000 0.000 0.000 0.000
CumUl Percnt
Sample Content by Weight Percent :
Gravel Sand Silt Clay coarse medium fine
Wentworth Classification 0.080 1.881 12.189 85.849 0.000 0.000 Unified Classification 0.000 0.080 2.161 97.458 0.300 0.000
Standard Statistics : Median Mean Dev. Skew Kurt
Method of Moments (PHI) Folk Graphic Measures (PHI) Grain Size ( m m )

b c a l i t y Type Sample Date P r o f i l e Ana lys i s Date Analyz 39 G 6216510 841029 850917 SGU
X P o s i t i o n : 3300 .00 Y P o s i t i o n : 859 .48
Eleva t ion of Top of Core : -10.87 Length of Core 0 .00 Depth t o Top of Sample : 0 .00 Depth t o Bottom of Sample :
Comments :
S t a r t Weight : 57.820 Fina l Weight : 57 .789 Devia t ion : 0.054 P
PHI
----- -2.75 -2.50 -2.25 -2.00 -1.75 -1.50 -1.25 -1.00 -0.75 -0.50 -0.25
0.00 0.25 0.50 0.75 1.00 1 .25 1 . 5 0
Weight Pe rcn t Cumul Pe rcn t
PHI Weight Pe rcn t Cumu 1 Percn t
Sample Content by Weight Pe rcen t :
Gravel Sand S i l t Clay c o a r s e medium f i n e
Wentworth C l a s s l f l c a t i o n 0.069 0 .997 9 . 3 5 1 89 .583 0 .000 0 . 0 0 0 Unif ied C l a s s i f i c a t i o n 0 .000 0 .069 1.327 98.313 0 . 2 9 1 0 . 0 0 0
Standard S t a t i s t i c s : Median Mean Dev. Skew Kurt
2 .55 0 .49 -1.49 1 1 . 2 0 2 .57 2 .57 0.42 -0.02 1.16 0.17 0.17
Method of Moments (PHI) Folk Graphic Measures (PHI) Grain s i z e (m)
L o c a l i t y Sample Date P r o f i l e ~ n a l y s i s Date Analyz 3 9 l?? 6 2 1 6 5 1 1 841029 850917 SGU
X P o s i t i o n : 3300 .00 Y P o s i t i o n : 1004 .83
Eleva t ion of Top of Core : - 1 2 . 8 1 Length of Core 0 .00 Depth t o Top of Sample : 0 .00 Depth t o Bottom o f Sample :
comments :
S t a r t Weight : 55.260 Fina l Weight : 55.079 Deviat ion : 0.328 %
PHI MM Weight Pe rcn t
----- ----- ------ ------ CumUl Pe rcn t ------
0.000
PHI Weight Pe rcn t
------ 0 .619 1.759 2 . 1 6 1
10 .619 17.250 29 .650 1 6 . 9 8 1
9 .909 4 . 5 8 1 0 .000 0 . 0 0 0 0.000 0 .000 0 .000 0 .000 0 .000 0.000 0 .000
CumUl Percnt
sample Content by Weight Percent :
Gravel Sand S i l t Clay c o a r s e medium f i n e
W e n t w o r t h C l a s s i f i c a t i o n 1.142 4 .470 3 .237 9 1 . 1 5 1 0 .000 0 . 0 0 0 Unif ied C l a s s i f i c a t i o n 0.000 1 .142 4 .710 94 .148 0 . 0 0 0 0 . 0 0 0
Standard S t a t i s t i c s : Median Mean Dev. Skew Kurt
Method of Moments (PHI) 2.68 0.83 -2.89 13 .07 Folk Graphic Measures (PHI) 2 . 8 4 2 . 8 1 0 .62 - 0 . 3 1 2.02 Grain S i z e (mm) 0.14 0 . 1 6

Locality Type Sample Date Profrle Analysis Date Anal 3 9 G 6216512 841029 850918 SGU
X Position : 3300.00 Y Position : 1217.64
Elevation of Top of Core : -13.54 Length of Core 0.00 Depth to Top of Sample : 0.00 Depth to Bottom of Sample :
Comments :
Start Weight : 58.280 Final Weight : 58.231 Deviation : 0.084
PHI Weight Percnt Cumul Percnt
PHI
----- 1.75 2.00 2.25 2.50 2.75 3.00 3.25 3.50 3.75 4.00 4.25 4.50 4.75 5.00 5.25 5.50 5.75 6.00
Weight
------ Percnt
------ 0.840 2.129 2.731 14.970 22.270 23.470 10.489 6.460 4.209 1.661 0.000 0.000 0.000 0.000 0.000 0.000 0.000 0.000
Cumul Percnt ------ 11.611 13.740 16.471 31.440 53.710 77.181 87.670 94.130 98.339 100.000 100.000 100.000 100.000 100.000 100.000 100.000 100.000 100.000
Sample Content by Weight Percent :
Gravel Sand Silt Clay coarse medium fine
Wentworth classification 2.961 6.481 4.298 86.260 0.000 0.000 Unified classification 0.000 2.961 6.871 88.508 1.661 0.000
Standard Statistics : Median Mean Dev. Skew Kurt
Method of Moments (PHI) 2.47 1.07 -2.42 9.39 Folk Graphic Measures (PHI) 2.71 2.69 0.78 -0.29 2.52 Grain Size (mm) 0.15 0.18
Locality Sample Date Profile Analysis Date Analyz 39 6216513 841029 850918 SGU
X Position : 3300.00 Y Position : 1509.43
Elevation of.Top of Core : -16.25 Length of Core 0.00 Depth to Top of Sample : 0.00 Depth to Bottom of Sample :
Comments :
Start Weight : 50.390 Final Weight : 49.952 Deviation : 0.869 %
PHI
----- -2.75 -2.50 -2.25 -2.00 -1.75 -1.50 -1.25 -1.00 -0.75 -0.50 -0.25 0.00 0.25 0.50 0.75 1.00 1.25 1.50
Weight
------ Percnt
------ CumUl Percnt
PHI
----- 1.75 2.00 2.25 2.50 2.75 3.00 3.25 3.50 3.75 4.00 4.25 4.50 4.75 5.00 5.25 5.50 5.75 6.00
Weight Percnt
------ 0.280 1.539 2.701 17.679 24.359 24.870 11.309 7.009 4.180 2.150 0.000 0.000 0.000 0.000 0.000 0.000 0.000 0.000
Cumul Percnt ------
Sample Content by Weight Percent :
Gravel Sand Silt Clay coarse medium fine
Wentworth Classification 0.801 2.823 2.120 94.256 0.000 0.000 Unified Classification 0.000 0.801 2.903 94.146 2.150 0.000
Standard Statistics : Median Mean Dev. Skew Kurt
Method of Moments (PHI) 2.68 0.73 -2.99 16.41 Folk Graphic Measures (PHI) Grain Size (mm)
2.75 2.76 0.47 0.03 1.36 0.15 0.16

Sample Content by Weight Percent :
TyEe Sample Date Profile Analysis Date Analyz 3 9 6216514 841029 850919 SGU
X Position : 3300.00 Y Position : 1737.94
Elevation of Top of Core : -18.55 Iangth of Core 0.00 Depth to Top of Sample : 0.00 Depth to Bottom of Sample :
Comments :
Start Weight : 55.320 Final Weight : 55.220 Deviation : 0.181 %
Gravel Sand Silt Clay coarse medium fine
PHI M?4 Weight Percnt Cumul Percnt ___-_ --___ -_____ __---- -___--
-2.75 6.727 0.000 0.000 0.000 -2.50 5.657 0.000 0.000 0.000 -2.25 4.757 0.000 0.000 0.000 -2.00 4.000 0.000 0.000 0.000 -1.75 3.364 0.000 0.000 0.000 -1.50 2.828 0.072 0.130 0.130 -1.25 2.378 0.171 0.310 0.440 -1.00 2.000 0.232 0.420 0.860 -0.75 1.682 0.061 0.110 0.971 -0.50 1.414 0.050 0.091 1.061 -0.25 1.189 0.039 0.071 1.132 0.00 1.000 0.050 0.091 1.222 0.25 0.841 0.039 0.071 1.293 0.50 0.707 0.039 0.071 1.364 0.75 0.595 0.050 0.091 1.454 1.00 0.500 0.088 0.159 1.614 1.25 0.420 0.039 0.071 1.684 1.50 0.354 0.088 0.159 1.844
Wentworth Classifiytion 0.860 0.753 1.548 96.838 0.000 0.000 Unified Classificatron 0.000 0.860 0.824 95.706 2.610 0.000
PHI MM Weight Percnt Cumul Percnt ----- ---_- ------ ------ ------
1.75 0.297 0.121 0.219 2.063 2.00 0.250 0.607 1.099 3.162 2.25 0.210 1.138 2.061 5.223 2.50 0.177 7.228 13.089 18.312 2.75 0.149 12.761 23.109 41.422 3.00 0.125 16.897 30.599 72.021 3.25 0.105 6.637 12.019 84.040 3.50 0.088 4.683 8.481 92.521 3.75 0.074 2.689 4.870 97.390 4.00 0.063 1.441 2.610 100.000 4.25 0.053 0.000 0.000 100.000 4.50 0.044 0.000 0.000 100.000 4.75 0.037 0.000 0.000 100.000 5.00 0.031 0.000 0.000 100.000 5.25 0.026 0.000 0.000 100.000 5.50 0.022 0.000 0.000 100.000 5.75 0.019 0.000 0.000 100.000 6.00 0.016 0.000 0.000 100.000
Standard Statistics : Median Mean Dev. Skew Kurt
Method of Moments (PHI) 2.80 0.61 -3.26 22.93 ~ o l k Graphic Measures (PHI) 2.82 2.84 0.41 0.12 1.18 Grain size (mm) 0.14 0.14
Locality 3 9
Sample 6216515
Date 841029
Profile Analysis Date Analyz 850919 SGU
x Position : 3300.00 Y Position : 2009.84
Elevation of Top of Core : -20.79 Length of Core 0.00 Depth to Top of Sample : 0.00 Depth to Bottom of Sample :
comments :
Start Weight : 63.520 Final Weight : 63.402 Deviation : 0.186 %
PHI Weight Percnt Cumul Percnt ----- ----- ------ ------ ------
PHI MM Weight Percnt Cumul Percnt ----- ----- ------ ------ ------
Sample Content by Weight Percent :
Gravel Sand Silt Clay coarse medium fine
Wentworth Classification 0.080 0.202 0.401 99.317 0.000 0.000 Unified Classification 0.000 0.080 0.222 96.607 3.090 0.000
Standard Statistics : Median Mean Dev. Skew Kurt
Method of Moments (PHI) Folk Graphic Measures (PHI) Grain Size (mm)

Locality T Sample Date Proflle ~nalysis Date Analyz 39 6216516 841029 850919 SGU
X Position : 3300 .00 Y Position : 2467 .35
Elevation of Top of Core : -23.77 Length of Core 0 .00 Depth to Top of Sample : 0 .00 Depth to Bottom of Sample :
Comments :
Start Weight : 53 .720 Final Weight : 53.522 Deviation : 0.369 %
PHI MM Weight Percnt Cumul Percnt ----- ----- ------ ------ ------
PHI MX Weight Percnt Cumul Percnt ----- ----- ------ ------ ------
Sample Content by Weight Percent :
Gravel Sand Silt Clay coarse medium fine
Wentworth Classification 0 . 7 1 0 0.142 0 . 2 3 0 98.918 0 .000 0 . 0 0 0 Unified Classification 0 . 0 0 0 0.710 0 .163 95.157 3.970 0.000
Standard Statistics : Median Mean Dev. Skew Kurt
Method of Moments (PHI) Folk Graphic Measures (PHI) Grain size (mm) 0.13 0 .13
Sample Date Profile Analysis Date Analyz 3 9 6216517 841029 850919 SGU
X Position : 3300 .00 YPosition : 2950 .00
Elevation of Top of Core : -26.30 Length of Core 0 .00 Depth to Top of Sample : 0.00 Depth to Bottom of Sample :
Comments :
start Weight : 56.760 Final Weight Deviation :
PHI MX Weight Percnt Cumul Percnt ------ ------ ------
0.000 0 . 0 0 0 0 .000 0 .000 0.000 0 .000
PHI MX Weight Percnt CumUl Percnt ------
0 .159
Sample Content by Weight Percent :
Gravel Sand Silt Clay coarse medium fine
wentworthclassification 0 .019 0 .060 0.199 9 9 . 7 2 1 0 .000 0 .000 Unlfied Classification 0 . 0 0 0 0.019 0.079 9 4 . 7 4 1 5.160 0.000
Standard Statistics : Median Mean Dev. Skew Kurt
Method of Moments (PHI) Folk Graphic Measures (PHI) Grain Size (mm)

Locality Type Sample Date profile Analysis Date Anaiyz 3 9 G 6216702 841127 850924 SGU
Sample Content by Weight Percent :
X Position : 3300.00 Y Position : 194.25
Elevation of Top of Core : 18.05 Length of Core 0.00 Depth to Top of Sample : 0.00 Depth to Bottom of Sample :
Comments :
Start Weight : 58.760 Final Weight : 57.950 Deviation : 1.378 9,
Gravel Sand Silt Clay coarse medium fine
PHI MH Weight Percnt Cumul Percnt ----- ----- ------ ------ ------
-2.75 6.727 0.000 0.000 0.000 -2.50 5.657 0.000 0.000 0.000 -2.25 4.757 0.000 0.000 0.000 -2.00 4.000 0.000 0.000 0.000 -1.75 3.364 0.000 0.000 0.000 -1.50 2.828 0.000 0.000 0.000 -1.25 2.378 0.000 0.000 0.000 -1.00 2.000 0.000 0.000 0.000 -0.75 1.682 0.000 0.000 0.000 -0.50 1.414 0.017 0.029 0.029 -0.25 1.189 0.058 0.100 0.129 0.00 1.000 0.093 0.160 0.290 0.25 0.841 0.382 0.659 0.949 0.50 0.707 0.991 1.710 2.659 0.75 0.595 2.828 4.880 7.539 1.00 0.500 8.200 14.150 21.689 1.25 0.420 4.068 7.020 28.709 1.50 0.354 17.211 29.700 58.409
Wentworth Classification 0.000 21.689 68.970 9.341 0.000 0.000 Unlfled Classlficatlon 0.000 0.000 28.709 71.280 0.010 0.000
PHI HM Weight Percnt Cumul Percnt ----- ----- ------ ------ ------
1.75 0.297 10.020 17.291 75.700 2.00 0.250 8.669 14.959 90.659 2.25 0.210 2.260 3.900 94.559 2.50 0,177 2.422 4.179 98.739 2.75 0.149 0.510 0.880 99.619 3.00 0.125 0.162 0.280 99.898 3.25 0.105 0.029 0.050 99.948 3.50 0.088 0.012 0.021 99.969 3.75 0.074 0.012 0.021 99.990 4.00 0.063 0.006 0.010 100.000 4.25 0.053 0.000 0.000 100.000 4.50 0.044 0.000 0.000 100.000 4.75 0.037 0.000 0.000 100.000 5.00 0.031 0.000 0.000 100.000 5.25 0.026 0.000 0.000 100.000 5.50 0.022 0.000 0.000 100.000 5.75 0.019 0.000 0.000 100.000 6.00 0.016 0.000 0.000 100.000
Standard Statistics : Median Mean Dev. Skew Kurt
Method of Moments (PHI) 1.43 0.49 -0.04 3.49 Folk Graphic Measures (PHI) 1.43 1.41 0.50 -0.02 1.09 Grain Size (mm) 0.37 0.37
Locality Type Sample Date Profile Analysis Date Analyz 39 G 6216703 841127 850924 SGU
X Position : 3300.00 Y Position : 229.99
Elevation of Top of Core : 12.63 Length of Core 0.00 Depth to Top of Sample : 0.00 Depth to Bottom of Sample :
Comments : 3.92% ERROR WITH RECORDED START WEIGHT OF 53.14
Startweight: 50.980 Finalweight: 51.059 Deviation : 0.1559,
PHI MH Weight Percnt Cmul Percnt ----- ----- ------ ------ ------
Sample Content by Weight Percent :
PHI MM Weight Percnt Cumul Percnt ----- ----- ------ ------ ------
Gravel coarse
Wentworth classification 0.670 63.370 Unified classification 0.000 0.670
Standard Statistics : Hedian
Method of Moments (PHI) Folk Graphic Measures (PHI) 0.62 Grain Size (mm) 0.65
Sand medium
Mean
Silt Clay fine
Dev. Skew Kurt

Locality Type Sample Date Profile Analysis Date Analyz 39 G 6216704 841127 850924 SGU
X Position : 3300.00 Y Position : 262.79
Elevation of Top of Core : Length of Core Depth to Top of Sample : Depth to Bottom of Sample :
Comments :
Start Weight : 64 .580 Final Weight : 6 4 . 6 0 1 Deviation : 0 .033 %
PHI MN Weight Percnt Cumul Percnt
PHI
----- 1.75 2.00 2.25 2.50 2.75 3.00 3.25 3.50 3.75 4.00 4.25 4.50 4.75 5.00 5.25 5.50 5.75 6.00
Weight Percnt
------ 20.870 24 .089
5 .820 7.320 1.320 0.419 0.080 0.020 0 .020 0 .000 0 .000 0 .000 0 .000 0 .000 0.000 0 .000 0 .000 0 .000
Cumul Percnt ------
Sample Content by Weight Percent :
Gravel Sand Silt Clay coarse medium fine
Wentworth Classification 0 . 2 6 0 18 .110 66.629 15 .001 0 .000 0.000 Unified classification 0 .000 0 .260 22.179 7 7 . 5 6 1 0.000 0.000
standard Statistics : Median Mean Dev. Skew Kurt
Method of Moments (PHI) Folk Graphic Measures (PHI) Grain Size (mm)
Sample Date Ty!? 6216705 841127
Profile Analysis Date Analyz 39 850924 SGU
X Position : 3300 .00 Y Position : 284.75
Elevation of Top of Core : 5.66 Length of Core 0.00 Depth to Top of Sample : 0 .00 Depth to Bottom of Sample :
Comments :
Start Weight : 53
Weight
. 390 Final Weight : 53.357 Deviation : 0 .062
PHI MM Percnt Cumul Percnt ------ ------
0 . 0 0 0 0 . 0 0 0 0 .000 0 .000 0.000 0 . 0 0 0 0.000 0 .000
I PHI MM Weight Percnt Cumul Percnt ------ ------ ------
Sample content by Weight Percent :
Gravel Sand Silt Clay coarse medium fine
Wentworth classification 0 .039 4 1 . 0 7 1 45 .831 13 .059 0 . 0 0 0 0 .000 Unified Classification 0 . 0 0 0 0 .039 42 .890 57.070 0 .000 0.000
Standard Statistics : Median Mean Dev. Skew Kurt
Method of Moments (PHI) Folk Graphic Measures (PHI) Grain Size (mm)

Locality Type Sample Date Profile Analysls Date Analyz 3 9 G 6216706 841127 851003 SGU
,sition : 3300.00 Y Position : 336.89
Elevation of Top of Core : Length of Core Depth to Top of Sample : Depth to Bottom of Sample :
Comments :
Start Weight : 59.610 Final Weight Deviation : 0.185 %
PHI MM Weight Percnt Cuaul Percnt ------ ------
0.000 0.000 0.000 0.000 0.000 0.000 0.299 0.299 0.000 0.299 0.071 0.370 0.570 0.939 1.681 2.620 3.339 5.960 10.790 16.750 15.030 31.780 14.691 46.471 15.810 62.281 10.840 73.121 6.709 79.830 5.560 85.390 1.481 86.871 4.271 91.141
PHI MM weight Percnt Cumul Percnt ------ ------ ------
1.791 3.010 94.151 1.987 3.339 97.491 0.672 1.129 98.620 0.660 1.109 99.729 0.131 0.220 99.950 0.030 0.050 100.000 0.000 0.000 100.000 0.000 0.000 100.000 0.000 0.000 100.000 0.000 0.000 100.000 0.000 0.000 100.000 0.000 0.000 100.000
Sample Content by Weight Percent :
Gravel Sand Silt Clay coarse medium fine
Wentworth Classification 2.620 82.770 12.101 2.509 0.000 0.000 Unified Classification 0.000 2.620 84.250 13.129 0.000 0.000
Standard Statistics : Median Mean Dev. Skew Kurt
Method of Moments (PHI) 0.19 0.79 0.75 3.42 Folk Graphic Measures (PHI) 0.06 0.16 0.76 0.27 1.16 Grain Size (nun) 0.96 0.88
Locality Type Sample Date Profile Analysis Date Analyz 3 9 G 6216707 841127 851003 SGU
X Position : 3300.00 Y Position : 459.63
Elevation of Top of Core : -5.77 Length of Core 0.00 Depth to Top of Sample : 0.00 Depth to Bottom of Sample :
Comments :
Start Weight
MM
: 52.580 Final Weight Deviation : 0.019 %
PHI Weight Percnt Cumul Percnt
PHI MM Weight Percnt cumul Percnt
Sample Content by Weight Percent :
Gravel Sand Silt Clay coarse medium fine
Wentworth Classification 0.000 0.603 28.800 70.597 0.000 0.000 Unified Classification 0.000 0.000 0.812 99.188 0.000 0.000
Standard Statistics : Median Mean Dev. Skew Kurt
Method of Moments (PHI) 2.27 0.43 -0.04 3.83 Folk Graphlc ~easu;es ;PHI) 2.25 2.28 0.42 0.09 0.89 Grain Size (mm) 0.21 0.21
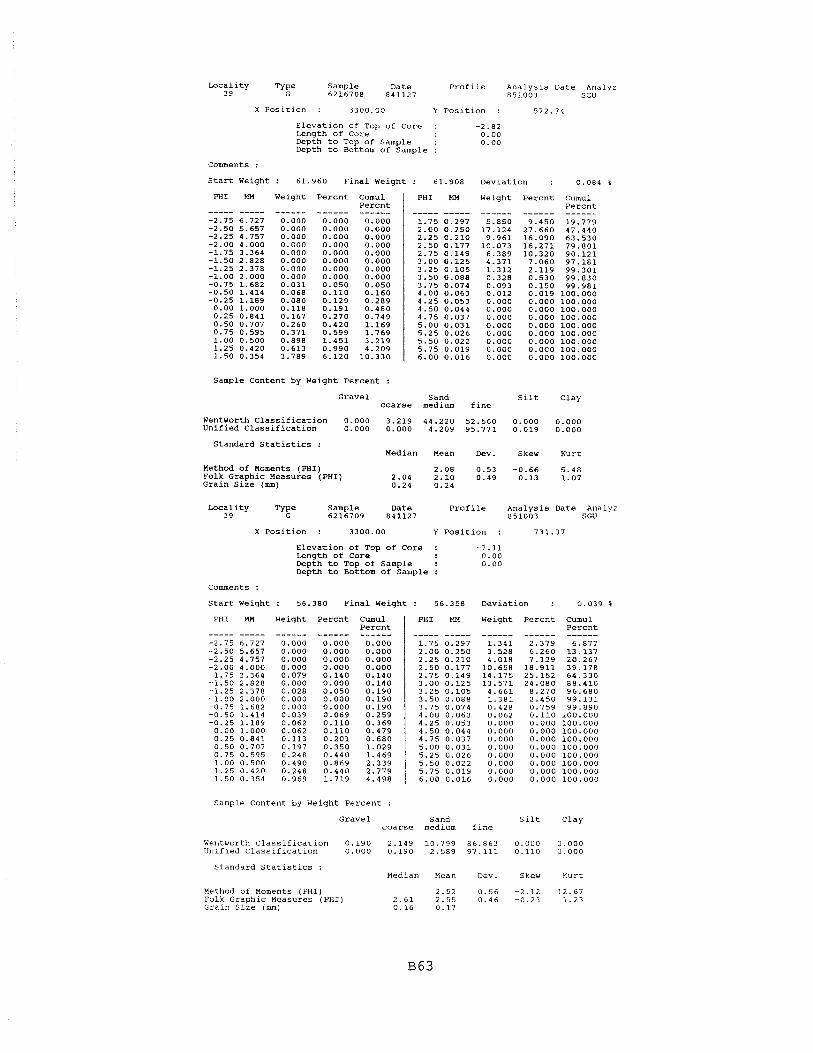
Locality Type Sample Date Profile Analysis Date Analyz 39 G 6216708 841127 851003 SGU
X Position : 3300.00 Y Position : 572.74
Elevation of Top of Core : -2.82 Length of Core 0.00 Depth to Top of Sample : 0.00 Depth to Bottom of Sample :
Comments :
Start Weight : 61.960 Final Weight : 61.908 Deviation : 0.084 1
PHI
----- -2.75 -2.50 -2.25 -2.00 -1.75 -1.50 -1.25 -1.00 -0.75 -0.50 -0.25 0.00 0.25 0.50 0.75 1.00 1.25 1.50
Weight Percnt Cumul Percnt ------ ------
0.000 0.000 0.000 0.000 0.000 0.000 0.000 0.000 0.000 0.000 0.000 0.000 0.000 0.000 0.000 0.000 0.050 0.050 0.110 0.160 0.129 0.289 0.191 0.480 0.270 0.749 0.420 1.169 0.599 1.769 1.451 3.219 0.990 4.209 6.120 10.330
PHI MM Weight Percnt Cumul Percnt ----- ----- ------ ------ ------
Sample Content by Weight Percent :
Gravel Sand Silt Clay coarse medium fine
wentworth classification 0.000 3.219 44.220 52.560 0.000 0.000 Unified Classification 0.000 0.000 4.209 95.771 0.019 0.000
Standard Statistics : Median Mean Dev. Skew Kurt
Method of Moments (PHI) Folk Graphic Measures (PHI) Grain Size (mm)
Locality Sample Date Profile Analysis Date Analyz 3 9 l?? 6216709 841127 851003 SGU
X Position : 3300.00 Y Position : 731.37
Elevation of Top of Core : -7.11 Length of Core 0.00 Depth to Top of Sample : 0.00 Depth to Sottom of Sample :
Comments :
Start Weight : 56.380 Final Weight : 56.358 Deviation : 0.039 %
PHI HM Weight Percnt Cumul Percnt ----- ----- ------ ------ ------
PHI EM Weight Percnt Cumul Percnt ----- ----- ------ ------ ------
Sample Content by weight Percent :
Gravel Sand Silt Clay coarse medium fine
Wentworth Classification 0.190 2.149 10.799 86.863 0.000 0.000 Unified Classification 0.000 0.190 2.589 97.111 0.110 0.000
Standard Statistics : Median Mean Dev. Skew Kurt
Method of Moments (PHI) Folk Graphic Measures (PHI) Grain Size (nun)
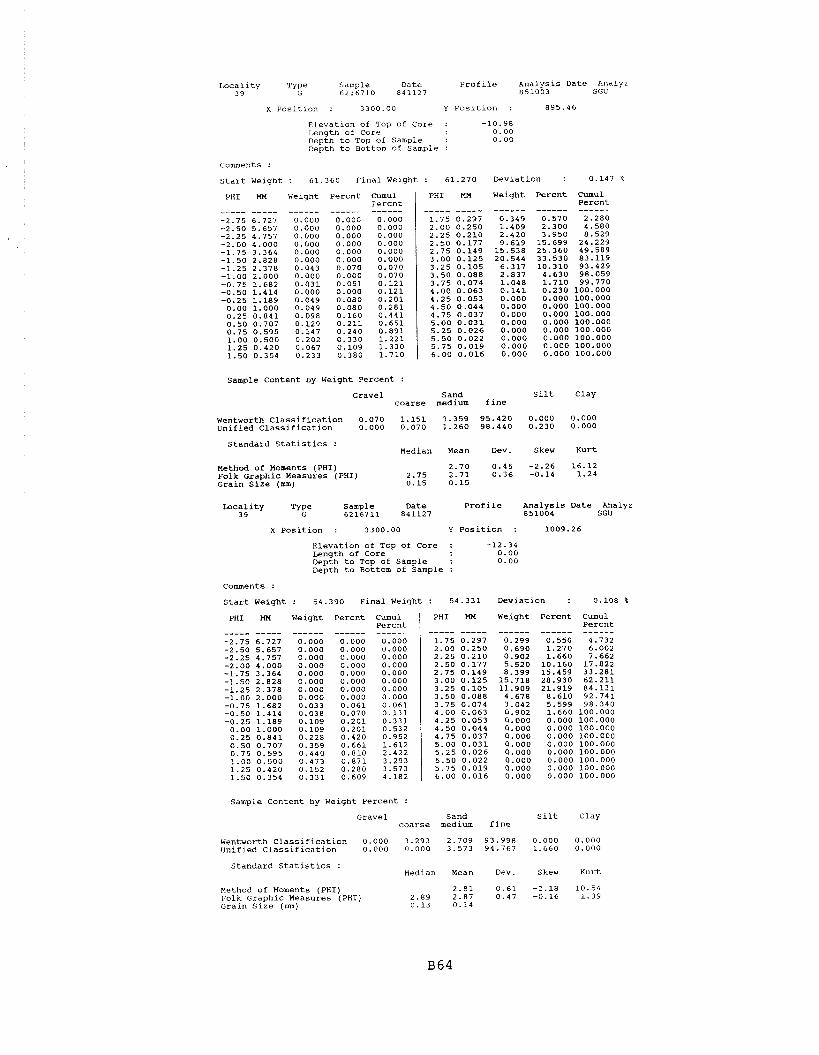
Lacality Type Sample Date Profile Analysis Date Analyz 39 G 6216710 841127 851003 SGU
X Position : 3300.00 Y Position : 895.46
Elevation of Top of Core : -10.98 Length of Core 0.00 Depth to Top of Sample : 0.00 Depth to Bottom o€ Sample :
comments :
Start Weiqht : 61.360 Final Weight : 61.270 Deviation : 0.147 %
PHI
----- -2.75 -2.50 -2.25 -2.00 -1.75 -1.50 -1.25 -1.00 -0.75 -0.50 -0.25 0.00 0.25 0.50 0.75 1.00 1.25 1.50
Weiqht Percnt CumUl Percnt
PHI Hn Weight Percnt Cumul Percnt
Sample Content by Weight Percent :
Gravel Sand Silt Clay coarse medium fine
Wentworth Classification 0.070 1.151 3.359 95.420 0.000 0.000 Unified Classification 0.000 0.070 1.260 98.440 0.230 0.000
Standard Statistics : Median Mean Dev. Skew Kurt
Method of Moments (PHI) Folk ~raphic Measures (PHI) Grain Size (mm)
sample Content by Weight Percent :
Locality Type Sample Date Profile Analysis Date Analyz 3 9 G 6216711 841127 851004 SGU
X Position : 3300.00 Y Position : 1009.26
Elevation of Top of Core : -12.34 Length of Core 0.00 Depth to Top of Sample : 0.00 Depth to Bottom of Sample :
Comments :
Startweight: 54.390 Finalweight: 54.331 Deviation : 0.108%
Gravel Sand Silt Clay coarse medium fine
PHI MM Weight Percnt Cumul Percnt ----- ----- ------ ------ ------
-2.75 6.727 0.000 0.000 0.000 -2.50 5.657 0.000 0.000 0.000 -2.25 4.757 0.000 0.000 0.000 -2.00 4.000 0.000 0.000 0.000 -1.75 3.364 0.000 0.000 0.000 -1.50 2.828 0.000 0.000 0.000 -1.25 2.378 0.000 0.000 0.000 -1.00 2.000 0.000 0.000 0.000 -0.75 1.682 0.033 0.061 0.061 -0.50 1.414 0.038 0.070 0.131 -0.25 1.189 0.109 0.201 0.331 0.00 1.000 0.109 0.201 0.532 0.25 0.841 0.228 0.420 0.952 0.50 0.707 0.359 0.661 1.612 0.75 0.595 0.440 0.810 2.422 1.00 0.500 0.473 0.871 3.293 1.25 0.420 0.152 0.280 3.573 1.50 0.354 0.331 0,609 4.182
Wentworth Classification 0.000 3.293 2.709 93.998 0.000 0.000 Unified Classification 0.000 0.000 3.573 94.767 1.660 0.000
PHI MU Weight Percnt Cumul Percnt ----- ----- ------ ------ ------
1.75 0.297 0.299 0.550 4.732 2.00 0.250 0.690 1.270 6.002 2.25 0.210 0.902 1.660 7.662 2.50 0.177 5.520 10.160 17.822 2.75 0.149 8.399 15.459 33.281 3.00 0.125 15.718 28.930 62.211 3.25 0.105 11.909 21.919 84.131 3.50 0.088 4.678 8.610 92.741 3.75 0.074 3.042 5.599 98.340 4.00 0.063 0.902 1.660 100.000 4.25 0.053 0.000 0.000 100.000 4.50 0.044 0.000 0.000 100.000 4.75 0.037 0.000 0.000 100.000 5.00 0.031 0.000 0.000 100.000 5.25 0.026 0.000 0.000 100.000 5.50 0.022 0.000 0.000 100.000 5.75 0.019 0.000 0.000 100.000 6.00 0.016 0.000 0.000 100.000
standard Statistics : Median Mean Dev. Skew Kurt
Method of Moments (PHI) 2.81 0.61 -2.18 10.54 folk Graphic Measures (PHI) 2.89 2.87 0.47 -0.16 1.39 Grain size (mm) 0.13 0.14

Locality Type Sample Date Profile Analysis Date Analyz 3 9 G 6216712 8 4 1 1 2 7 851004 5GU
X Position : 3300.00 Y Position : 1235.55
Elevation of Top of Core : - 1 4 . 2 0 Length of Core 0.00 DepthtoTopof Sample : 0.00 Depth to Bottom of Sample :
Comments :
Start Weight : 57.600 Final Weight : 57.298 Deviation : 0.524 %
PHI MM Weight Percnt Cumul PHI EM Weight Percnt Cumul ~ercnt I Percnt
Sample Content by Weight Percent :
Gravel Sand Silt Clay coarse medium fine
Wentworth classification 2.990 2.230 1.689 93.091 0.000 0.000 Unified Classification 0.000 2.990 2.370 93 .731 0.909 0.000
Standard Statistics : Median Mean DeV. Skew Kurt
Method of Moments (PHI) 2.67 0.96 -3 .48 16.37 Folk Graphic Measures (PHI) 2.84 2.84 0.59 -0.24 2.45 Grain Size (mm) 0 .14 0.16
Locality Sample Date Profile Analysis Date Analyz 3 9 l?? 6216713 841127 851004 SGU
X Position : 3300.00 Y Position : 1478 .45
Elevation of Top of Core : -16.07 Length of Core 0.00 Depth to Top of Sample : 0.00 Depth to Bottom of Sample :
Comments :
Start Weight : 50.260 Final Weight : 5 0 . 4 3 1 Deviation : 0.340 %
PHI MH Weight Percnt Cumul Percnt ----- ----- ------ ------ ------
PHI MM Weight Percnt Cumul Percnt ----- ----- ------ ------ ------
Sample Content by Weight Percent :
Gravel Sand Silt Clay coarse medium fine
Wentworth Classification 0 . 6 4 0 1 . 7 8 3 1.491 96.086 0 .000 0.000 Unified Classification 0.000 0.640 1 . 8 4 2 95.098 2 .419 0.000
Standard Statistics : Median Mean Dev. Skew Kurt
Method of Moments (PHI) Folk Graphic Measures (PHI) Grain Size (mm)

Locality Sample Date Profile Analysis Date Analyz 39 6216714 841127 851004 SGU
Sample Content by Weight Percent :
X Position : 3300.00 Y Position : 1781.84
Elevation of Top of Core : -19.09 Length of Core 0.00 Depth to Top of Sample : 0.00 Depth to Bottom of Sample :
Comments :
Start Weight : 56.080 Final Weight : 55.790 Deviation : 0.517 %
Gravel Sand Silt Clay coarse medium fine
PHI MN Weight Percnt Cumul Percnt ----- ----- ------ ------
-2.75 6.727 0.000 0.000 0.000 -2.50 5.657 0.000 0.000 0.000 -2.25 4.757 0.000 0.000 0.000 -2.00 4.000 0.000 0.000 0.000 -1.75 3.364 0.000 0.000 0.000 -1.50 2.828 0.089 0.160 0.160 -1.25 2.378 0.000 0.000 0.160 -1.00 2.000 0.050 0.090 0.249 -0.75 1.682 0.028 0.050 0.299 -0.50 1.414 0.028 0.050 0.350 -0.25 1.189 0.039 0.070 0.419 0.00 1.000 0.028 0.050 0.470 0.25 0.841 0.000 0.000 0.470 0.50 0.707 0.039 0.070 0.540 0.75 0.595 0.028 0.050 0.590 1.00 0.500 0.028 0.050 0.640 1.25 0.420 0.000 0.000 0.640 1.50 0.354 0.028 0.050 0.690
Wentworth Classification 0.249 0.391 0.769 98.591 0.000 0.000 Unified Classification 0.000 0.249 0.391 96.161 3.199 0.000
PHI l4M Weight Percnt Cumul Percnt ----- ----- ------ ------ ------
1.75 0.297 0.050 0.090 0.780 2.00 0.250 0.351 0.629 1.409 2.25 0.210 0.831 1.490 2.898 2.50 0.177 4.731 8.480 11.378 2.75 0.149 7.889 14.141 25.519 3.00 0.125 18.673 33.470 58.989 3.25 0.105 11.147 19.980 78.969 3.50 0.088 5.970 10.701 89.670 3.75 0.074 3.978 7.130 96.801 4.00 0.063 1.785 3.199 100.000 4.25 0.053 0.000 0.000 100.000 4.50 0.044 0.000 0.000 100.000 4.75 0.037 0.000 0.000 100.000 5.00 0.031 0.000 0.000 100.000 5.25 0.026 0.000 0.000 100.000 5.50 0.022 0.000 0.000 100.000 5.75 0.019 0.000 0.000 100.000 6.00 0.016 0.000 0.000 100.000
Standard Statistics : Median Mean Dev. Skew Kurt
Method of Moments (PHI) ~ o l k Graphic Measures (PHI) Grain Size (mm)
Locality Sample Date Profile Analysis Date Analyz 39 6216715 841127 851004 SGU
x Position : 3300.00 Y Position : 2031.93
Elevation of Top of Core : -21.03 Length of Core 0.00 Depth to Top of Sample : 0.00 Depth to Bottom of Sample :
Comments :
Start Weight : 51.980 Final Weight : 51.750 Deviation : 0.442 %
PHI MM Weight Percnt Cumul PHI HM Weight Percnt Cumul ~ercnt 1 Percnt
Sample Content by Weight Percent :
Gravel Sand Silt Clay coarse medium fine
Wentworth Classification 0.000 0.000 0.290 99.710 0.000 0.000 Unified Classification 0.000 0.000 0.000 95.880 4.120 0.000
Standard Statistics : Hedian Mean Dev. Skew Kurt
Method of Momencs (PHI) Folk Graphic Measures (PHI) Grain Size (mm)

lacality Type Sample Date Profile Analysis Date Analyz 3 9 G 6216716 8 4 1 1 2 7 8 5 1 0 0 4 SGU
X Position : 3 3 0 0 . 0 0 Y Position : 2 4 9 9 . 4 8
Elevation of Too of Core : - 2 4 . 3 3 - .. Length of Core 0.00 Depth to Top of Sample : 0.00 Depth to Bottom of Sample :
Comments :
Start Weight : 57.580 Final Weight : 57.561 Deviation : 0.033 %
PHI MU Weight Percnt Cumul PHI MU Weight Percnt Cumul Percnt 1 Percnt
Sample Content by Weight Percent :
Gravel Sand Silt Clay coarse medium fine
WentworthClassification 0.000 0.050 0.290 99.659 0.000 0.000 Unified classification 0.000 0.000 0.050 95.050 4.899 0.000
Standard Statistics : Median Mean Dev. Skew Kurt
Method of Moments (PHI) 3 .04 0.35 0.28 4.18 Folk Graphic Measures (PHI) 3.00 3.04 0.35 0 . 2 1 1.20 Grain Size (mm) 0 .12 0.12
Locality Sample Date Profile Analysis Date Analyz 3 9 6216717 841127 851004 SGU
X Position : 3300.00 Y Position : 2953.25
Elevation of Top of core : - 2 6 . 3 4 Length of Core 0.00 Depth to Top of Sample : 0.00 Depth to Bottom of Sample :
Comments :
Start Weight : 52.840 Final Weight : 5 2 . 8 2 1 Deviation : 0.036 %
PHI MM Weight Percnt Cumul Percnt ----- ----- ------ ------ ------
PHI MH Weight Percnt Cumul Percnt ----- ----- ------ ------ ------
Sample Content by Weight Percent :
Gravel Sand Silt Clay coarse medium fine
WentworthClassification 0.000 0 .000 0 . 2 3 1 99.769 0.000 0.000 Unified Classification 0.000 0.000 0.000 97 .209 2 . 7 9 1 0.000
Standard Statistics : Median Mean Dev. Skew Kurt
Method of Moments (PHI) Folk Graphic Measures (PHI) Grain Size (mm)

Locality Type Sample Date Profile Analysis Date Analyz 39 G 6216902 850102 860313 LS C
X Position : 3300.00 Y Position : 194.62
Elevation of Top of Core : 20.00 Length of Core 0.00 Depth to Top of Sample : 0.00 Depth to Botton of Sample :
Comments :
Start Weight : 55.000 Final Weight : 55.139 Deviation : 0.253 '6
PHI MM Weiqht Percnt Cumul Percnt ----- ----- ------ ------ ------
PHI
----- 1.75 2.00 2.25 2.50 2.75 3.00 3.25 3.50 3.75 4.00 4.25 4.50 4.75 5.00 5.25 5.50 5.75 6.00
Weiqht Percnt
------ 12.371 10.140 6.560 3.720 1.340 0.490 0.131 0.051 0.000 0.011 0.000 0.000 0.000 0.000 0.000 0.000 0.000 0.000
Cumul Percnt
Sample Content by Weiqht Percent :
Gravel Sand Silt Clay coarse medium fine
Wentworth Classification Unified Classification
Standard Statistics : Median Mean Dev. Skew Kurt
Method of Moments (PHI) 1.05 0.83 -0.20 2.40 ~ o l k Graphic Measures (PHI) 1.08 1.04 0.85 -0.08 0.86 Grain Size (mm) 0.47 0.48
Locality Type Sample Date profile Analysis Date Analyz 3 9 C 6216903 850102 860314 LSC
xposition : 3300.00 Y Position : 230.56
Elevation of Top of Core : 14.57 Length of Core 0.00 Depth to Top of Sample : 0.00 Depth to Bottom of Sample :
Comments : 1.25 PHI CORRECTION BY AVERAGING 27 JUN 86
Start Weight : 54.050 Final Weight : 54.080 Deviation : 0.056 %
PHI MM Weight Percnt Cumul Percnt ----- ----- ------ ------ ------
PHI MM Weight Percnt Cumul Percnt ----- ----- ------ ------ ------
Sample Content by Weight Percent :
Gravel Sand Silt Clay coarse medium fine
Wentworth Classification 0.381 56.509 32.800 10.311 0.000 0.000 Unified Classification 0.000 0.381 63.519 36.100 0.000 0.000
Standard Statistics : Median Mean Dev. Skew Kurt
Method of Moments (PHI) 0.87 0.86 0.08 2.09 Folk Graphic Measures (PHI) 0.82 0.88 0.88 0.08 0.77 Grain Size (mm) 0.57 0.55

Locality Type Sample Date Profile Analysis Date Analyz 3 9 G 6216904 850102 860313 LSC
X Position : 3300.00 Y Position : 261.38
Elevation of Top of Core : 10.06 Length of Core 0.00 Depth to Top of Sample : 0.00 Depth to Bottom of Sample :
Comments :
Start Weight : 64.430 Final Weight : 64.622 Deviation : 0.298 %
PHI HM Weight Percnt Cumul PHI HM Weight Percnt Cumul ~ercnt I Percnt
Sample Content by Weight Percent :
Gravel Sand Silt Clay coarse medium fine
Wentworth Classification 24.089 27.031 32.269 16.610 0.000 0.000 Unified Classification 0.000 24.089 32.001 43.909 0.000 0.000
Standard Statistics : Median Mean Dev. Skew Kurt
Method of Moments (PHI) 0.52 1.41 -0.12 1.39 Folk Graphic Measures (PHI) 0.94 0.61 1.36 -0.28 0.55 Grain Size (mm) 0.52 0.70
Locality Type sample oate Profile Analysis Date Analyz 39 G 6216905 850102 860314 LSC
x Position : 3300.00 Y Position : 295.72
Elevation of Top of Core : 8.52 Length of Core 0.00 Depth to Top of Sample : 0.00 Depth to Bottom of Sample :
Comments : 1.25 PHI CORRECTION BY AVERAGING 27 JUN 86
Start Weight : 63.030 Final Weight : 63.110 Deviation : 0.127 %
PHI Mn Weight Percnt Cumul Percnt ------ ------
0.000 0.000 0.000 0.000 0.000 0.000
PHI HM Weight Percnt Cumul Percnt ----- ----- ------ ------ ------
1.75 0.297 5.011 7.940 26.581 2.00 0.250 10.243 16.230 42.811 2.25 0.210 11.227 17.790 60.601 2.50 0.177 12.710 20.139 80.740 2.75 0.149 6.929 10.979 91.719 3.00 0.125 3.970 6.291 98.010 3.25 0.105 0.928 1.470 99.480 3.50 0.088 0.252 0.399 99.880 3.75 0.074 0.063 0.100 99.979
Sample Content by Weight Percent :
Gravel Sand Silt Clay coarse medium fine
Wentworth C:assification 1.911 9.710 31.190 57.169 0.000 0.000 Unified Classification 0.000 1.911 13.220 84.849 0.021 0.000
Standard Statistics : Median Mean Dev. Skew Kurt
Method of Moments (PHI) 1.91 0.87 -1.90 7.51 Folk Graphic Measures (PHI) 2.10 2.00 0.75 -0.35 1.60 Grain Size (mm) 0.23 0.27

Locality Type Sample Date profile Analysis Date Analyz 3 9 G 6216906 850102 860317 LSC
X Position : 3300.00 Y position : 328.73
Elevation of Top of Core : 6.30 Length of Core 0.00 Depth to Top of Sample : 0.00 Depth to Bottom of Sample :
Comments :
Start Weight : 53.710 Final Weight : 53.610 Deviation : 0.186 %
PHI Mn Weight Percnt Cumul Percnt
PHI MM Weight Percnt Cumul Percnt
Sample Content by Weight Percent :
Gravel Sand Silt clay coarse medium fine
Wentworth Classification 0.670 19.172 32.749 47.409 0.000 0.000 Unified classification 0.000 0.670 22.582 76.739 0.009 0.000
Standard Statistics : Median Mean Dev. Skew Kurt
Method of Moments (PHI) Folk Graphic Measures (PHI) Grain size (mm)
Locality Type Sample Date Profile Analysis Date Analyz 3 9 G 6216907 850102 860314 LSC
X Position : 3300.00 Y Position : 467.47
Elevation of Top of Core : -4.18 Length of Core 0.00 Depth to Top of Sample : 0.00 Depth to Bottom of Sample :
Comments : 1.25 PHI CORRECTION BY AVERAGING 27 JUN 86
Start Weight : 55.910 Final Weight : 56.040 Deviation : 0.233 %
PHI MH Weight Percnt Cumul PHI MM Weight Percnt Cumul ~ercnt I Percnt
Sample Content by Weight Percent :
Gravel Sand Silt Clay coarse medium fine
Wentworth Classification 0.389 41.738 36.362 21.511 0.000 0.000 Unified Classification 0.000 0.389 46.768 52.843 0.000 0.000
Standard Statistics : Median Mean Dev. Skew Kurt
Method of Moments (PHI) Folk Graphic Measures (PHI) Grain Size (mm)
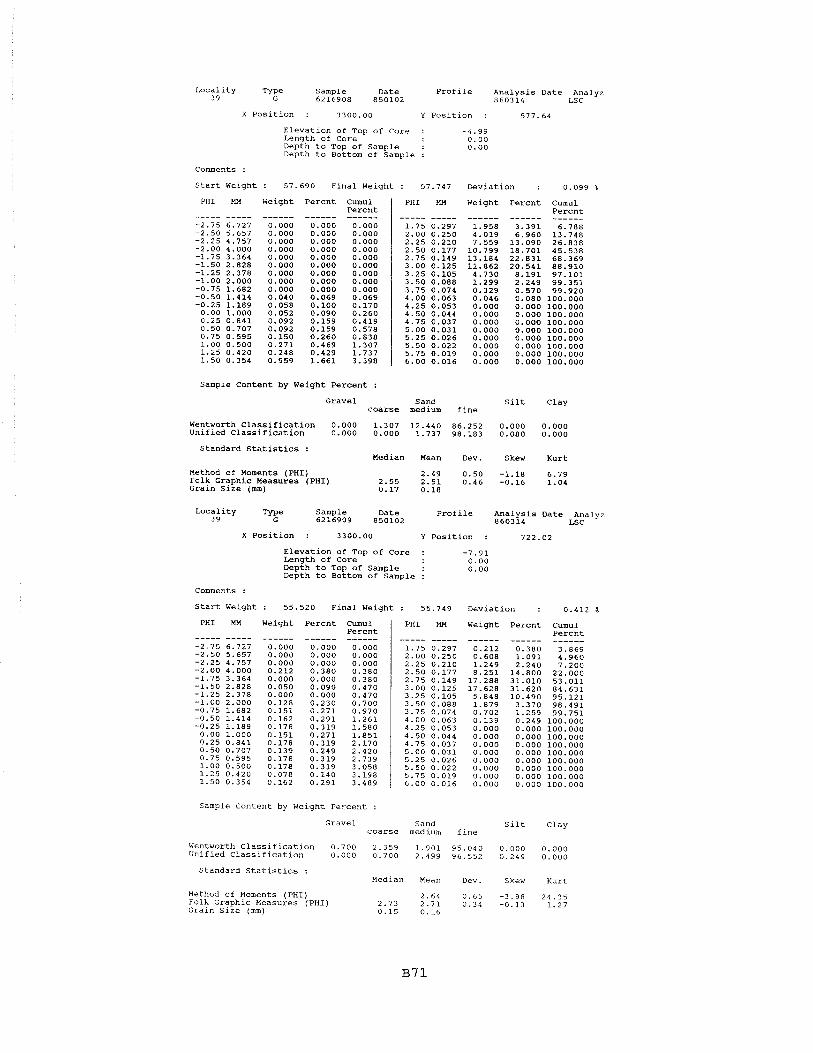
Locality Type Sample Date Profile Analysis Date Analyz 39 G 6216908 850102 860314 LSC
X Position : 3300.00 Y Position : 577.64
Elevation of Top of Core : -4.99 Length of Core 0.00 Depth to Top of Sample : 0.00 Depth to Bottom of Sample :
Comments :
Start Weight : 57.690 Final Weight : 57.747 Deviation : 0.099 %
PHI Nn Weight Percnt Cumul Percnt
PHI
----- 1.75 2.00 2.25 2.50 2.75 3.00 3.25 3.50 3.75 4.00 4.25 4.50 4.75 5.00 5.25 5.50 5.75 6.00
Weight Percnt
------ 3.391 6.960
13.090 18.701 22.831 20.541 8.191 2.249 0.570 0.080 0.000 0.000 0.000 0.000 0.000 0.000 0.000 0.000
Cumul Percnt ------
Sample Content by Weight Percent :
Gravel Sand Silt Clay coarse medium fine
Wentworth Classification 0.000 1.307 12.440 86.252 0.000 0.000 Unified Classification 0.000 0.000 1.737 98.183 0.080 0.000
Standard Statistics : Median Mean Dev. Skew Kurt
Method of Moments (PHI) Folk Graphic Measures (PHI) Grain Size (mm)
Locality T? Sample Date Profile Analysis Date Analyz 3 9 6216909 850102 860314 LSC
X Position : 3300.00 Y Position : 722.02
Elevation of Top of Core : -7.91 Length of Core 0.00 Depth to Top of Sample : 0.00 Depth to Bottom of Sample :
Comments :
Start Weight : 55.520 Final Weight : 55.749 Deviation : 0.412 9,
PHI Mn Weight Percnt Cumul PHI Mn Weight Percnt Cumul ~ercnt I p e v c n t
Sample Content by Weight Percent :
Gravel Sand Silt Clay coarse medium fine
Wentworth Classification 0.700 2.359 1.901 95.040 0.000 0.000 Unified Classification 0.000 0.700 2.499 96.552 0.249 0.000
standard Statistics : Median Mean Dev. Skew Kurt
Method of Moments (PHI) Folk Graphic Measures (PHI) Grain Size (mm)
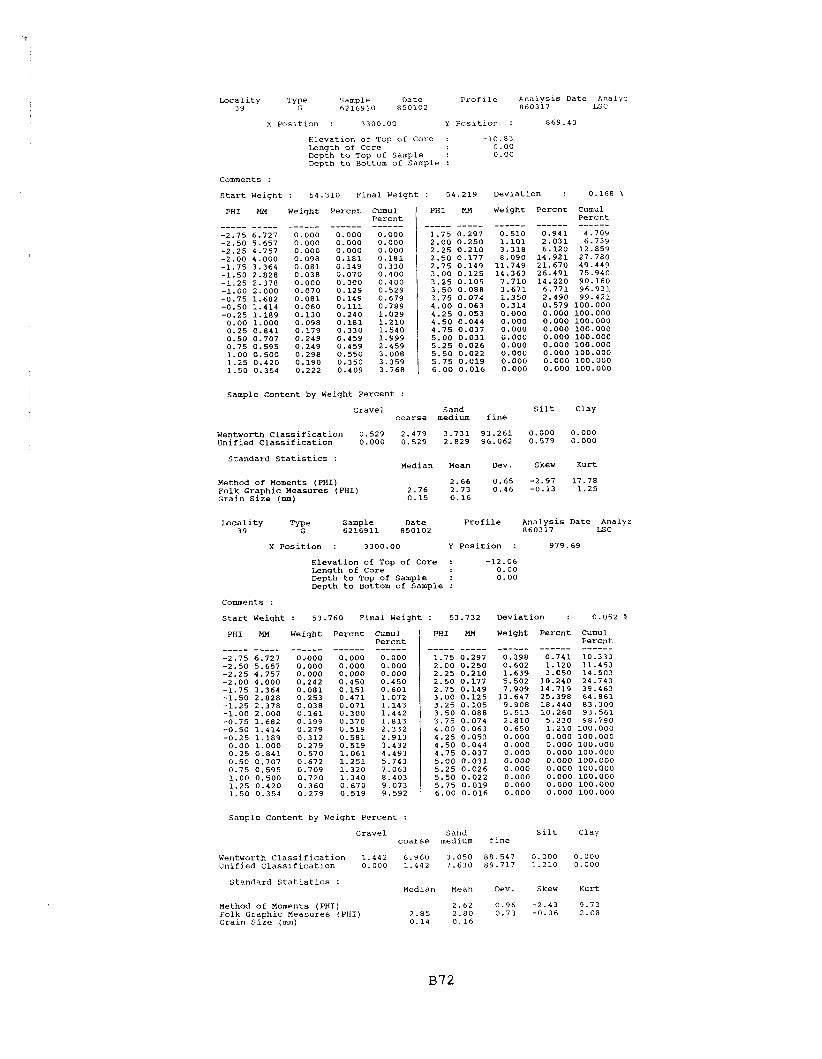
Locality 39
Sample 6216910
Date 850102
Analysis Date Analyz 860317 LSC
x Position : 3300.00 Y Position : 869.43
Elevation of Top of Core : -10.83 Length of Core 0.00 mpth to TOP of Sample : 0.00 mpth to Bottom of Sample :
comments :
Start Weight : 54.310 Final Weight : 54.219 Deviation : 0.168 2
PHI NN Weight Percnt Cumul PHI MM Weight Percnt Cumul Percnt 1 Percnt
Sample Content by Weight Percent :
Gravel Sand silt Clay coarse medium fine
Wentworth Classification Unified Classification
Standard Statistics : Median Mean Dev. Skew Kurt
Method of Moments (PHI) 2.66 0.65 -2.97 17.78 Folk Graphic Measures (PHI) 2.76 2.73 0.46 -0.13 1.25 Grain size (mm) 0.15 0.16
Locality Type Sample Date Profile Analysis Date Analyz 39 G 6216911 850102 860317 LSC
X Position : 3300.00 Y Position : 979.69
Elevation of Top of Core : -12.06 Length of Core 0.00 mpth to Top of Sample : 0.00 Depth to Bottom of Sample :
Comments :
Start Weight : 53.760 Final Weight : 53.732 Deviation : 0.052 %
PHI
----- -2.75 -2.50 -2.25 -2.00 -1.75 -1.50 -1.25 -1.00 -0.75 -0.50 -0.25 0.00 0.25 0.50 0.75 1.00 1.25 1.50
Weight
------ Percnt cumu1
Percnt ------ 0.000 0.000 0.000 0.450 0.601 1.072 1.143 1.442 1.813 2.332
PHI
----- 1.75 2.00 2.25 2.50 2.75 3.00 3.25 3.50 3.75 4.00 4.25 4.50 4.75 5.00 5.25 5.50 5.75 6.00
Weight Percnt CUmUl Percnt
Sample Content by Weight Percent :
Gravel Sand Silt Clay coarse medium fine
Wentworthclassification 1.442 6.960 3.050 88.547 0.000 0.000 Unified Classification 0.000 1.442 7.630 89.717 1.210 0.000
Standard Statistics : Median Mean Dev. Skew Kurt
Method of Moments (PHI) 2.62 0.96 -2.43 9.73 Folk Graphic Measures (PHI) 2.85 2.80 0.73 -0.36 2.08 Grain Size (mm) 0.14 0.16
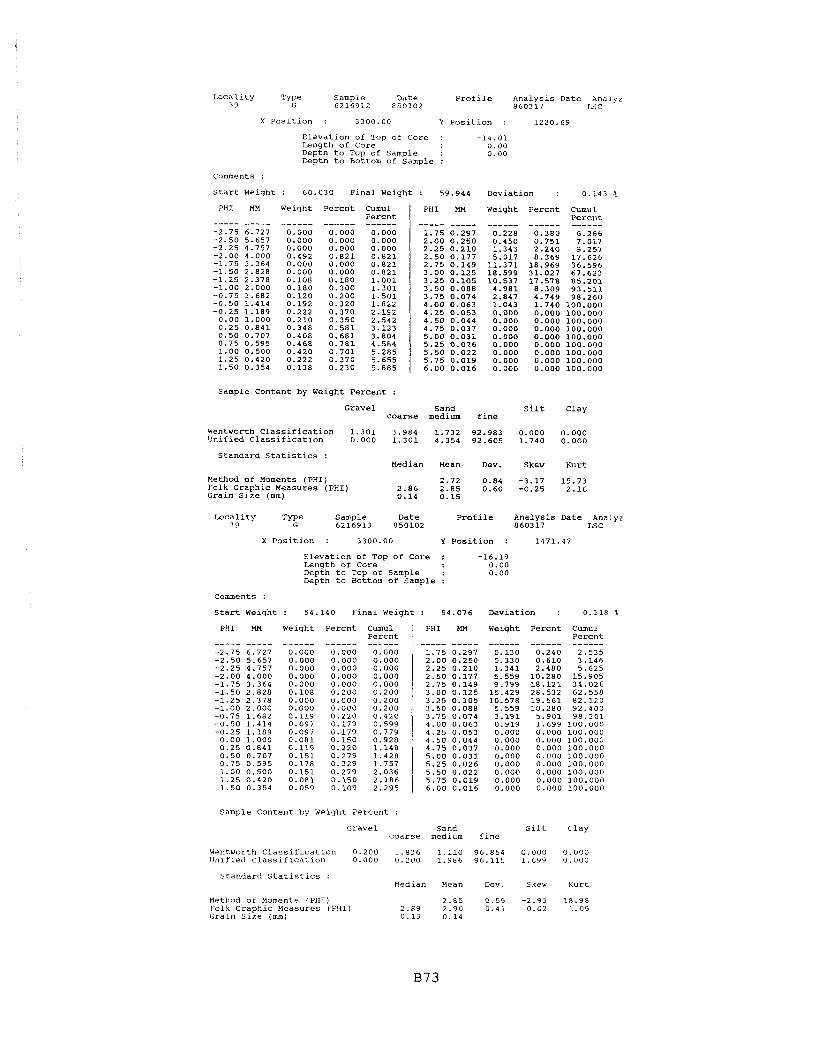
Locality Type Sample Date Profile Analysis Date Analyz 3 9 G 6216912 850102 860317 LSC
X Position : 3300 .00 Y Position : 1 2 2 0 . 6 9
Elevation of Top of Core : -14 .01 Length of Core 0.00 Depth to Top of Sample : 0.00 Depth to Bottom of Sample :
Comments :
startweight: 60.030 finalweight: 59.944 Deviation : 0 . 1 4 3 %
PHI MM Weight Percnt cumul PHI Hn Weight Percnt Cumul ~ercnt 1 Percnt ----- ----- ------ ------ ------ ----- ---_- __---- ------ --_-_-
Sample Content by Weight Percent :
Gravel Sand Silt Clay coarse medium fine
Wentworth classification 1 . 3 0 1 3.984 1.732 92.983 0.000 0.000 Unified classification 0.000 1 . 3 0 1 4 .354 92.605 1.740 0.000
Standard Statistics : Median Mean Dev. Skew Kurt
Method of Moments (PHI) Folk Graphic Measures (PHI) Grain size (mm)
Locality Type Sample Date profile Analysis Date Analyz 3 9 G 6216913 850102 860317 LSC
x Position : 3300.00 Y Position : 1471 .47
Elevation of Top of Core : -16.19 Length of Core 0.00 Depth to Top of Sample : 0.00 Depth to Bottom of Sample :
Comments :
start Weight : 5 4 . 1 4 0 Final Weight : 54.076 Deviation : 0.118 %
PHI Weight Percnt cumu 1 Percnt
PHI Weight Percnt
------ 0.240 0.610 2.480
10.280 18 .121 28.532 19.561 10.280
5.901 1.699 0.000 0.000 0.000 0.000 0.000 0.000 0.000 0.000
CumUl Percnt
Sample Content by Weight Percent :
Gravel Sand Silt Clay coarse medium fine
Wentworth Classification 0.200 1 .836 1.110 96 .854 0.000 0.000 Unlfied Classification 0.000 0.200 1.986 96.115 1 . 6 9 9 0 .000
Standard Statistics : Median Hean Dev. Skew Kurt
Hethod of Moments (PHI) Folk Graphic Measures (PHI) Graln Size (mm)

L o c a l i t y Type Sample Date P r o f i l e A n a l y s i s Date Analyz 3 9 G 6216914 e50102 860317 ISC
X P o s i t i o n : 3300.00 Y P o s i t i o n : 1718.05
E l e v a t i o n of Top o f Core : -18.56 Length o f Core 0.00 ~ e p t h t o Top of Sample : 0.00 Depth t o Bottom o f Sample :
Comments :
S t a r t Weight : 55.010 F i n a l Weight : 54.948 D e v i a t i o n : 0.113 %
PHI MM Weight P e r c n t Cumul P e r c n t ----- ----- ------ ------ ------
PHI MM Weight P e r c n t Cumul P e r c n t ----- ------ ------ ------
Sample C o n t e n t by Weight P e r c e n t :
G r a v e l Sand S i l t C l a y c o a r s e medium f i n e
W e n t w o r t h c l a s s i f i c a t i o n 5.209 8.928 3.170 82.693 0.000 0.000 U n i f i e d C l a s s i f i c a t i o n 0.000 5.209 9.369 83.883 1.540 0.000
S t a n d a r d S t a t i s t i c s : Median Mean Dev. Skew K u r t
Method o f Moments (PHI) 2.35 1 . 3 2 -1.90 5 .81 Folk G r a p h i c Measures (PHI) 2.77 2 .61 1 . 0 5 -0.51 2 . 4 1 G r a i n S i z e (mm) 0.15 0 .20
s a m p l e b t e P r o f i l e A n a l y s i s Date Analyz 3 9 6216915 850102 860317 LSC
X P o s i t i o n : 3300.00 Y P o s i t i o n : 2016.82
E l e v a t i o n c I£ Top of Core : -20.97 Length-of c o r e Depth t o Top o f Sample : Depth t o Bottom o f Sample :
Comments :
S t a r t w e i g h t : 54.810 F i n a l w e i g h t : 54.669 D e v i a t i o n : 0 . 2 5 7 %
PHI M?4 Weight P e r c n t CUmUl P e r c n t
PHI MM Weight P e r c n t Cumul P e r c n t
Sample C o n t e n t by Weight P e r c e n t :
G r a v e l Sand S i l t C l a y c o a r s e medium f i n e
W e n t w o r t h c l a s s i f i c a t i o n 5 .050 0 .466 0.419 94.064 0.000 0.000 U n i f i e d C l a s s i f i c a t i o n 0.000 5.050 0.466 91.622 2.861 0.000
S t a n d a r d S t a t i s t i c s : Median Mean Dev. Skew K u r t
Method o f Moments (PHI) Folk G r a p h i c Measures (PHI) G r a i n S i z e (mm)
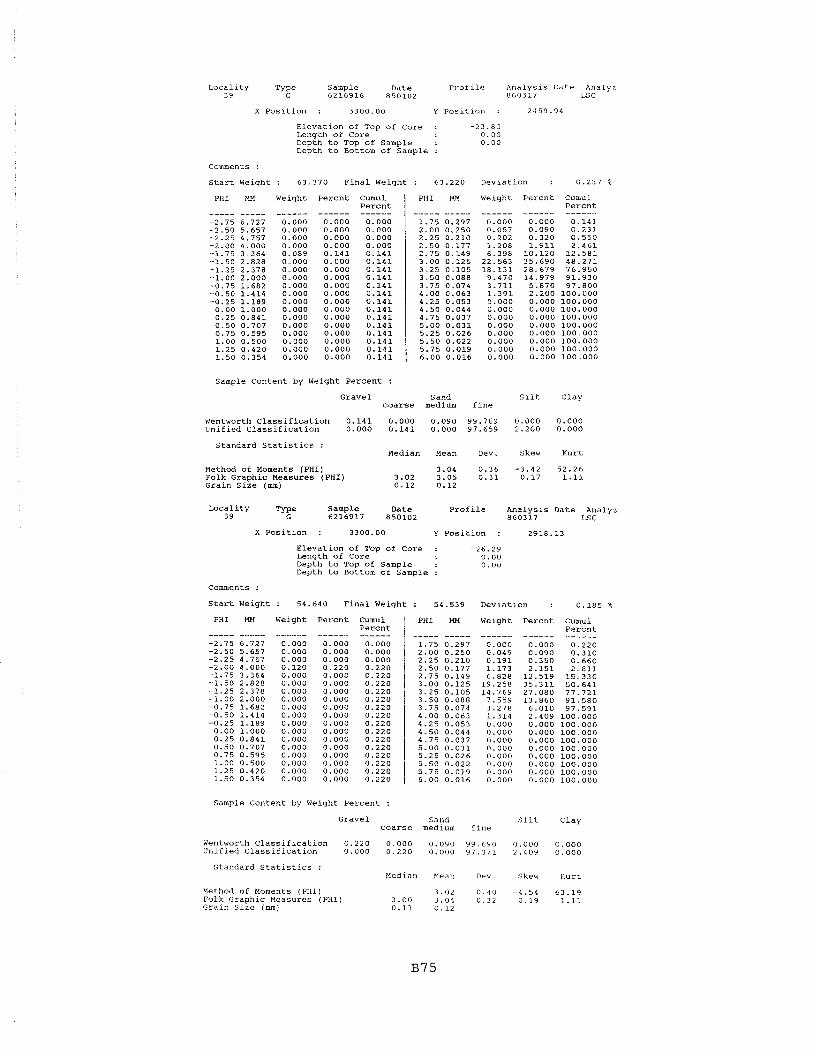
L o c a l i t y Sample Date P r o f i l e A n a l y s i s Date Analyz 3 9 6216916 850102 860317 ISC
X P o s i t i o n : 3300.00 Y P o s i t l o n : 2459.94
E l e v a t i o n of Too o f Core : -23.80 - ~- ~
Length o f Core 0.00 Depth t o Top o f Sample : 0.00 Depth t o Bottom o f Sample :
Comments :
S t a r t Weight : 63.370 F i n a l Weight : 63.220 D e v i a t i o n : 0.237 %
PHI MM Weight P e r c n t Curnu1 P e r c n t ----- ----- ------ ------ ------
PHI M3 Weight P e r c n t Cumul P e r c n t ----- ----- ------ ------ ------
Sample C o n t e n t by Weight P e r c e n t :
G r a v e l Sand S i l t C l a y c o a r s e medium f i n e
Wentworth C l a s s i f i c a t i o n 0.141 0.000 0.090 99.769 0.000 0.000 U n i f i e d C l a s s i f i c a t i o n 0.000 0.141 0.000 97.659 2.200 0.000
S t a n d a r d S t a t i s t i c s : Median Mean Dev. Skew K u r t
Method o f Moments (PHI) Folk Graphic Measures (PHI) G r a i n S i z e (mm)
L o c a l i t y Sample Date P r o f i l e A n a l y s i s Date Analyz 3 9 6216917 850102 860317 LSC
X P o s i t i o n : 3300.00 Y P o s i t i o n : 2918.13
E l e v a t i o n o f Top o f Core : -26.29 Length o f Core 0.00 Depth t o Top of Sample : 0.00 Depth t o Bottom o f Sample :
Comments :
S t a r t w e i g h t : 54.640 F i n a l w e i g h t : 54.539 D e v i a t i o n : 0.185%
PHI NN Weight P e r c n t Cumul P e r c n t
PHI
----- 1.75 2.00 2.25 2.50 2.75 3.00 3.25 3.50 3.75 4.00 4.25 4.50 4.75 5.00 5.25 5.50 5.75 6.00
Weight P e r c n t Cumul P e r c n t ------ 0.220 0.310 0.660 2.811
15.330 50.641 77.721 91.580 97.591 100.000
Sample C o n t e n t by Weight P e r c e n t :
G r a v e l c o a r s e
Sand S i l t C l a y medium f i n e
W e n t w o r t h c l a s s i f i c a t i o n 0.220 0.000 U n i f i e d C l a s s i f i c a t i o n 0.000 0.220
S t a n d a r d S t a t i s t i c s : Median Mean Dev. Skew K u r t
Method of Moments (PHI) Folk Graphic Measures (PHI) 3.00 G r a i n S i z e (mm) 0.13

Locality Type Sample Date Profile Analysis Date Analyz 39 G 6217001 850105 860502 ISC
X Position : 3300.00 Y position : 161.75
Elevation of Top of Core : 19.56 Length of Core 0.00 Depth to Top of Sample : 0.00 Depth to Bottom of Sample :
Comments :
Start Weight : 52.050 Final Weight : 52.019 Deviation : 0.060 %
PHI MM Weight Percnt Cumul Percnt
PHI MM Weight Percnt Cumul Percnt ----- ----- ------ ------ ------
Sample Content by Weight Percent :
Gravel Sand Silt Clay coarse medium fine
Wentworth Classification 0.000 29.939 56.431 13.630 0.000 0.000 Unified Classification 0.000 0.000 41.550 58.440 0.010 0.000
standard statistics : Median Mean Dev. Skew Kurt
Method of Moments (PHI) Folk Graphic Measures (PHI) Grain Size (mm)
Locality Type Sample Date Profile Analysis Date Analyz 3 9 G 6217002 850105 860515 LSC
X position : 3300.00 Y Position : 198.40
Elevation of Top of Core : 17.63 Length of Core 0.00 Depth to Top of Sample : 0.00 Depth to Bottom of Sample :
Comments :
Start Weight : 30.690 Final Weight : 30.732 Deviation : 0.137 P
PHI Weight Percnt cumu1 Percnt ------
0.000 0.000 0.000 0.000 0.000 0.000 0.000 0.000 0.000 0.290 0.550 0.940
PHI Weight Percnt
------ 22.488 16.270 8.620 4.230 1.240 0.420 0.101 0.000 0.000 0.010 0.000 0.000 0.000 0.000 0.000 0.000 0.000 0.000
Cumu 1 Percnt ------
Sample Content by Weight Percent :
Gravel Sand Silt Clay coarse medium fine
Wentworth Classification 0.000 16.654 68.726 14.620 0.000 0.000 Unified Classlficatlon 0.000 0.000 30.024 69.966 0.010 0.000
standard Statistics : ~edian Mean Dev. Skew Kurt
Method of Moments (PHI) 1.49 0.52 -0 .41 3.98 Folk Graphic Measures (PHI) 1.54 1 .50 0.50 -0.09 0.99 Graln Size (mm) 0.34 0.35

Sample Content by Weight Percent :
Locality Type Sample Date profile hnalysis Date Analyz 3 9 G 6217003 850105 860501 LSC
X Position : 3300.00 Y position : 230.51
Elevation of Top of Core : 12.53 Length of Core 0.00 Depth to Top of Sample : 0.00 DepCh to Bottom of Sample :
Comments :
Start Weight : 60.370 Final Weight : 60.280 Deviation : 0.149 %
Gravel Sand Silt Clay coarse medium fine
PHI MI4 Weight Percnt C m u l Percnt ----- ----- ------ ------ ------
-2.75 6.727 0.000 0.000 0.000 -2.50 5.657 0.000 0.000 0.000 -2.25 4.757 0.000 0.000 0.000 -2.00 4.000 0.000 0.000 0.000 -1.75 3.364 0.000 0.000 0.000 -1.50 2.828 0.072 0.119 0.119 -1.25 2.378 0.109 0.181 0.300 -1.00 2.000 0.229 0.380 0.680 -0.75 1.682 0.760 1.261 1.941 -0.50 1.414 2.652 4.399 6.340 -0.25 1.189 4.690 7.780 14.121 0.00 1.000 4.630 7.681 21.802 0.25 0.841 5.467 9.069 30.871 0.50 0.707 3.737 6.199 37.070 0.75 0.595 3.418 5.670 42.741 1.00 0.500 4.642 7.701 50.441 1.25 0.420 3.858 6.400 56.841 1.50 0.354 4.189 6.949 63.791
wentworth Classification 0.680 49.761 34.829 14.730 0.000 0.000 Unified Classification 0.000 0.680 56.161 43.159 0.000 0.000
PHI MI4 Weight Percnt Cumul Percnt ----- ----- ------ ------ ------
1.75 0.297 6.281 10.420 74.210 2.00 0.250 6.667 11.060 85.270 2.25 0.210 4.961 8.230 93.500 2.50 0.177 2.701 4.481 97.981 2.75 0.149 0.922 1.530 99.511 3.00 0.125 0.247 0.410 99.920 3.25 0.105 0.048 0.080 100.000 3.50 0.088 0.000 0.000 100.000 3.75 0.074 0.000 0.000 100.000 4.00 0.063 0.000 0.000 100.000 4.25 0.053 0.000 0.000 100.000 4.50 0.044 0.000 0.000 100.000 4.75 0.037 0.000 0.000 100.000 5.00 0.031 0.000 0.000 100.000 5.25 0.026 0.000 0.000 100.000 5.50 0.022 0.000 0.000 100.000 5.75 0.019 0.000 0.000 100.000 6.00 0.016 0.000 0.000 100.000
Standard Statistics : Median Mean Dev. Skew Kurt
Method of Moments (PHI) Folk Graphic Measures (PHI) Grain Size (mm)
tocality Type Sample Date Profile Analysis Date Analyz 3 9 G 6217004 850105 860501 LSC
X Position : 3300.00 Y Position : 263.47
Elevation of Top of Core : Length of Core Depth to Top of Sample : Depth to Bottom of Sample :
Comments :
Start Weight : 58.110 Final Weight : 58.139 Deviation : 0.050 O
PHI KM Weight Percnt Cumul Percnt ------ ------
0.000 0.000 0.000 0.000 0.000 0.000 0.000 0.000 0.000 0.000
PHI
----- 1.75 2.00 2.25 2.50 2.75 3.00 3.25 3.50 3.75 4.00 4.25 4.50 4.75 5.00 5.25 5.50 5.75 6.00
HM Weight Percnt Cumul Percnt ----- ------ ------ ------
loo. 000 ioo. ooo 100.000 100.000 100.000 100.000
Sample Content by Weight Percent :
Gravel Sand Silt Clay coarse medium fine
wentworth Classif:.cation 0.089 37.321 42.550 20.040 0.000 0.000 Unified Classification 0.000 0.089 44.581 55.329 0.000 0.000
Standard Statistics : Median Mean Dev. Skew Kurt
Method of Moments (PHI) Folk Graphic Measures (PHI) Grain Size (mm)

L o c a l i t y Type Sample Date P r o f i l e Analysis Date Analyz 39 G 6217005 850105 860502 LSC
X P o s i t i o n : 3300.00 Y P o s i t i o n : 295.19
Eleva t ion of Top of Core : 6 .47 Length of Core 0 .00 Depth t o Top of Sample : 0 .00 Depth t o Bottom of Sample :
Comments :
S t a r t Weight : 56 .450 F i n a l Weight : 56.408 Deviat ion : 0.074 P
PHI MM Weight Pe rcn t cumul PHI m Weight Pe rcn t Cumul ~ e r c n t 1 Percn t
Sample Content by Weight Percent :
Gravel Sand S i l t Clay c o a r s e medium f i n e
Wentworth C l a s s i f i c a t i o n 0.000 19 .939 38 .510 4 1 . 5 5 1 0.000 0 . 0 0 0 Uni f i ed C l a s s i f i c a t i o n 0.000 0 . 0 0 0 24.438 75 .551 0 . 0 1 1 0 . 0 0 0
Standa rd S t a t i s t i c s : Median Mean DeV. Skew Kurt
Method of Moments (PHI) Folk Graphic Measures (PHI) Grain S i z e (mm)
L o c a l i t y Type Sample Date P r o f i l e Analysis Date Analyz 3 9 G 6217006 8 5 0 1 0 5 860502 LSC
X P o s i t i o n : 3300 .00 Y P o s i t i o n : 328.89
Eleva t ion of Top of Core : 4.15 Length of Core 0 .00 Depth t o Top o f sample : 0.00 ~ e p t h t o Bottom of Sample :
Comments :
S t a r t Weight : 54.380 F i n a l Weight : 54.360 Deviat ion : 0.037 %
PHI MM Weight Pe rcn t Cumul PHI MM Weight Percnt Cumul ~ e r c n t I Pe rcn t
Sample Content by Weight Pe rcen t :
Gravel Sand S i l t c l a y c o a r s e medium f i n e
Wentworth C l a s s i f i c a t i o n 0 . 2 8 1 2 0 . 9 8 1 36.378 42 .360 0 .000 0 .000 Uni f i ed C l a s s i f i c a t i o n 0 .000 0 . 2 8 1 25.270 7 4 . 4 3 9 0.009 0 . 0 0 0
Standa rd S t a t i s t i c s : Median Mean Dev. Skew Kurt
Method of Moments (PHI) Folk Graphic Measures (PHI) Grain s i z e (nm)

Locality Type Sample Date ProEile Analysls Date Analyz 3 9 G 6217007 850105 860502 ISC
X Position : 3300 .00 Y Position : 4 5 3 . 7 8
Elevation of Top of Core : - 5 . 2 4 Length of Core 0.00 Depth to Top of Sample : 0.00 Depth to Bottom of Sample :
Comments :
Start Weight : 51 .130 Final Weight : 50.720 Deviation : 0 .802 %
PHI NH Weight Percnt Cumul Percnt ----- ----- ------ ------ ------
PHI MM Weight Percnt Cumul Percnt ----- ----- ------ ------ ------
Sample Content by Weight Percent :
Gravel sand Silt Clay coarse medium fine
Wentworth Classification 0.319 1.849 8.511 89 .320 0.000 0.000 unified Classification 0.000 0.319 2.220 97.370 0 .091 0.000
Standard Statistics : Median Mean Dev. Skew Kurt
Method of Moments (PHI) Folk Graphic Measures (PHI) Grain Size (m)
Locality Sample Date Profile Analysis Date Analyz 3 9 6217008 850105 860502 LSC
X Position : 3300.00 Y Position : 572 .61
Elevation of Top of Core : -7.89 Length of Core 0.00 Depth to Top of Sample : 0.00 Depth to Bottom of Sample :
Comments :
Start Weight : 56.400 Final Weight : 56.380 Deviation : 0 .035 b
PHI MM Weight Percnt Cumul Percnt ----- ----- ------ ------ ------
PHI NH Weight Percnt Cumul Percnt ----- ----- ------ ------ ------
Sample Content by Weight Percent :
Gravel Sand Silt Clay coarse medium fine
Wentworth classification 0 . 2 4 1 2 .208 1 7 . 6 1 1 79 .940 0.000 0.000 Unified Classification 0.000 0 . 2 4 1 3.008 9 6 . 7 2 0 0 .030 0.000
Standard Statistics : Median Mean Dev. Skew Kurt
Method of Moments (PHI) Folk Graphic Measures (PHI) Graln Size (m)
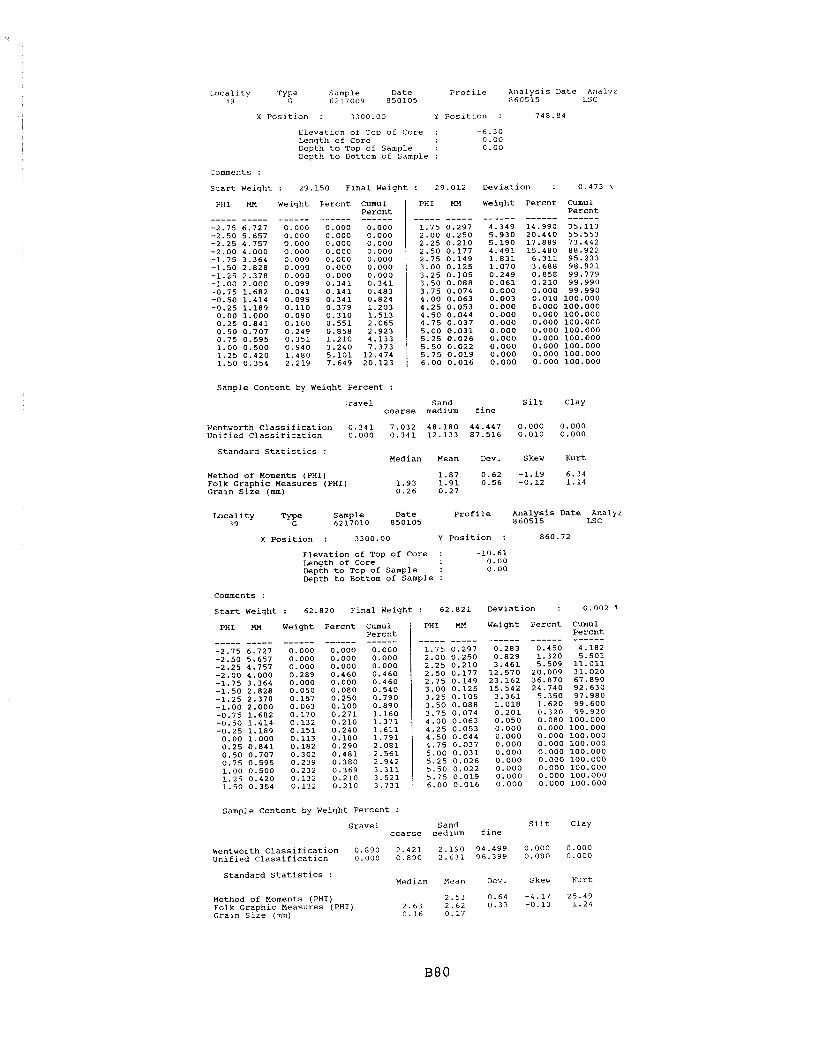

Loca l i t y 3 9
Sample 6217011
Date 850105
P r o f i l e Analysis Date Analyz 860514 LSC
X P o s i t i o n : 3300.00 Y P o s i t i o n : 1002.42
Eleva t ion o f Top of Core : -12.40 Length of Core 0.00 Depth t o Top of Sample : 0.00 W p t h t o Bottom of Sample :
Comments :
S t a r t Weight : 51.180 F i n a l Weight : 51.231 Deviation : 0.100 %
PHI 2IH Weight Pe rcn t Cumul Pe rcn t ----- ----- ------ ------ ------
PHI MM Werght Pe rcn t Cumul P e r c n t ----- ----- ------ ------ ------
Sample Content by Weight Pe rcen t :
Gravel Sand S i l t Clay c o a r s e medium f i n e
W e n t w o r t h c l a s s i f i c a t i o n 0.791 3.929 7.550 87.730 0.000 0.000 Unif ied c l a s s i f i c a t i o n 0.000 0.791 4.550 94.289 0.371 0.000
Standard S t a t i s t i c s : Median Mean Dev. Skev Kurt
Method o f Moments (PHI) 2.45 0.71 -2.59 13.79 Folk Graphic Measures (PHI ) 2.55 2.53 0.53 -0.20 1.64 Grain s i z e (mm) 0.17 0.18
L o c a l i t y sample Date 6217012 850105
P r o f i l e Analysis Date Analyz 3 9 860514 LSC
X P o s i t i o n : 3300.00 Y P o s i t i o n : 1208.98
E l e v a t i o n o f Top of Core : -13.72 Length of Core 0.00 Depth t o Top of Sample : 0.00 Depth t o Bottom of Sample :
Comments :
S t a r t Weight : 53.340 F i n a l Weight : 53.480 Deviat ion : 0.262 9.
PHI MM Weight P e r c n t Cumul P e r c n t ----- ----- ------ ------ ------
-2.75 6.727 0.000 0.000 0.000 -2.50 5.657 0.000 0.000 0.000 -2.25 4.757 0.000 0.000 0.000 -2.00 4.000 0.000 0.000 0.000 -1.75 3.364 0.000 0.000 0.000 -1.50 2.828 0.080 0.150 0.150 -1.25 2.378 0.102 0.191 0.340 -1.00 2.000 0.080 0.150 0.490 -0.75 1.682 0.091 0.170 0.660 -0.50 1.414 0.150 0.280 0.941 -0.25 1.189 0.091 0.170 1.111 0.00 1.000 0.102 0.191 1.301 0.25 0.841 0.112 0.209 1.511 0.50 0.707 0.048 0.090 1.601 0.75 0.595 0.048 0.090 1.690 1.00 0.500 0.037 0.069 1.760 1.25 0.420 0.000 0.000 1.760 1.50 0.354 0.048 0.090 1.849
PHI EM Weight Percnt CUmUl P e r c n t ------ 1.980 2.521 4.351
Sample Content by Weight Pe rcen t :
Gravel Sand S i l t Clay c o a r s e medium f i n e
W e n t w o r t h c l a s s i f i c a t i o n 0.490 1.270 0.761 97.475 0.000 0.000 Unif ied C l a s s i f i c a t i o n 0.000 0.490 1.270 96.631 1.610 0.000
Standa rd S t a t i s t i c s : Median Mean Dev. Skew Kurt
Method o f Moments (PHI) Folk Graphic Measures (PHI) Grain S i z e (mm)

Loca l i t y Type Sample Date P r o f i l e Ana lys i s Date Analyz 39 G 6217013 850105 860514 LSC
X P o s i t i o n : 3300 .00 Y P o s i t i o n : 1505 .11
Eleva t ion of Top of co re : -16.65 Length o f Core 0 .00 Depth t o Top of Sample : 0 .00 Depth t o Bottom of Sample :
Comments :
s t a r t Weight : 48 .920 F i n a l Weight : 48 .829 Deviat ion : 0.186 %
PHI MN Weight Pe rcn t Cumul PHI MM Weight Pe rcn t Cumul ~ e r c n t 1 Percn t ----- ----- ------ ------ ------ ----- ----- ------ ------ ------
Sample Content by Weight Pe rcen t :
Gravel Sand S i l t Clay coa r se medium f i n e
W e n t w o r t h c l a s s i f i c a t i o n 0.330 0.059 0 . 3 4 0 99 .271 0.000 0.000 Unif ied C l a s s i f i c a t i o n 0.000 0 .330 0.059 97 .661 1.950 0 . 0 0 0
Standard S t a t i s t i c s : Median Mean Dev. Skew Kurt
Method of Moments (PHI) 2 .90 0 .43 -4.64 57 .65 Folk Graphic Measures (PHI) 2.88 2.89 0 . 3 1 0 .20 1 .23 Grain S i z e (mm) 0.14 0.13
~ a c a l i t y sample Date p r o f i l e Ana lys i s Date Analyz 39 6217014 850105 860515 LSC
X P o s i t i o n : 3300.00 Y P o s i t i o n : 1755 .99
E l e v a t i o n of Top of Core : -18.80 Length of Core 0.00 Depth t o Top o f Sample : 0 .00 Depth t o Bottom of Sample :
Comments :
S t a r t Weight : 49 .060 F i n a l Weight : 48 .889 Deviat ion : 0 .349 %
PHI KM Weight P e r c n t Cumul PHI NM Weight Pe rcn t Cumul ~ e r c n t I Percn t
Sample Content by Weight Pe rcen t :
Gravel Sand S i l t Clay coa r se medium f i n e
W e n t w o r t h c l a s s i f i c a t i o n 0 . 3 6 0 0 .000 0 . 1 6 0 99 .480 0 .000 0 .000 Unif ied C l a s s i f i c a t i o n 0 .000 0 .360 0.000 97 .590 2 .050 0.000
Standard S t a t i s t i c s : Median Mean Dev. Skew Kurt
Method of Moments (PHI) Folk Graphic Measures (PHI) Grain S i z e (mm)

L o c a l l t y Type Sample Date P r o f i l e A n a l y s l s D a t e Analyz 3 9 G 6217015 850105 860515 is C
x ~ o s 1 t 1 o n : 3300 .00 Y P o s i t i o n : 1 9 8 7 . 2 8
E l e v a t i o n o f Top of Core : -20.88 Length o f C o r e 0 . 0 0 Depth t o Top o f Sample : 0 . 0 0 Depth t o Bottom o f S a n p l e :
Comments :
S t a r t Weight : 46 .360 F i n a l Weight : 46 .250 D e v i a t i o n : 0 .237 %
Weight P e r c n t Cumul P e r c n t ------
0.000 0 . 0 0 0 0 . 0 0 0 0 .000 0 . 0 0 0 0 . 0 0 0 0.110 0 .110 0 .110 0 . 1 1 0 0 . 1 1 0 0 . 1 1 0 0 . 1 1 0 0 . 1 1 0 0 . 1 1 0 0 .110 0.110 0 . 1 1 0
PHI Weight P e r c n t Cumul P e r c n t
Sample C o n t e n t by Weight P e r c e n t :
G r a v e l Sand S i l t C l a y c o a r s e medium f i n e
W e n t w o r t h C l a s s i f i c a t i o n 0 . 1 1 0 0 . 0 0 0 0 . 1 7 1 99 .719 0 .000 0.000 U n i f i e d C l a s s i f i c a t i o n 0 . 0 0 0 0 . 1 1 0 0 .000 9 5 . 8 2 1 4.069 0 . 0 0 0
s t a n d a r d S t a t i s t i c s : Median Mean Dev. Skew K u r t
Method o f Moments (PHI) 3.08 0 .37 -1.70 25 .08 Folk G r a p h i c Measures (PHI) 3 .06 3.09 0.34 0 .15 1.03 G r a i n S i z e (mm) 0 .12 0.12
L o c a l i t y Sample Date p r o f i l e A n a l y s i s D a t e Analyz 39 6217016 8 5 0 1 0 5 860514 LSC
X P o s i t i o n : 3300 .00 Y p o s i t i o n : 2477 .35
E l e v a t i o n o f Tou o f Core : -23.96 Length o f C o r e 0 . 0 0 Depth t o Top o f Sample : 0 . 0 0 Depth t o Bottom o f Sample :
Comments :
S t a r t Weight : 53 .520 F i n a l Weight : 5 3 . 3 0 1 D e v i a t i o n : 0 .409 %
PHI HN Weight P e r c n t Cumul PHI HN Welght P e r c n t Cumul ~ e r c n t 1 P e r c n t ----- ----- ------ ------ ------ ----- ----- ------ ------ ------
sample C o n t e n t by Weight P e r c e n t :
G r a v e l Sand S i l t C l a y c o a r s e medium f i n e
W e n t w o r t h C l a s s i f i c a t i o n 0 . 0 0 0 0 . 0 0 0 0 . 2 5 0 9 9 . 7 5 0 0 . 0 0 0 0 . 0 0 0 U n l f i e d C l a s s i f i c a t i o n 0 . 0 0 0 0 . 0 0 0 0 . 0 0 0 97 .310 2 .690 0 . 0 0 0
s t a n d a r d S t a t i s t i c s : Median Mean Dev. Skew K u r t
Kethod o f Moments (PHI) 3.07 0.33 0 .23 3 .42 Folk G r a p h i c Measures (PHI) 3.03 3 . 0 8 0 . 3 4 0 . 2 0 1 .09 G r a l n S l z e ( n m ) 0 .12 0 .12

Locality Type Sample Date Profile Analysis Date Analyz 39 G 6217103 850125 860521 LSC
X Position : 3300.00 Y Position : 230.05
Elevation of Top of Core : 12.50 Length of Core 0.00 Depth to Top of Sample : 0.00 Depth to Bottom of Sample :
Comments : 1.25 PHI CORRECTION BY AVERAGING 27 JUN 86
Start
PHI
----- -2.75 -2.50 -2.25 -2.00 -1.75 -1.50 -1.25 -1.00 -0.75 -0.50 -0.25 0.00 0.25 0.50 0.75 1.00 1.25 1.50
Weight
m
: 64.
Weight
------ 0.000 0.000 0.000 0.181 0.000 0.071 0.497 0.853 1.919 3.799 6.099 5.531 6.875 4.387 4.458 4.878 3.650 3.650
660 Final Weight Deviation :
Percnt Cumul Percnt ------ ------
0.000 0.000 0.000 0.000 0.000 0.000 0.280 0.280 0.000 0.280 0.110 0.390 0.769 1.159 1.320 2.480 2.970 5.450 5.880 11.330 9.440 20.770 8.561 29.330 10.641 39.971 6.790 46.761 6.900 53.661 7.550 61.211 5.649 66.861 5.649 72.510
PHI MM Weight Percnt Cumul Percnt
Sample Content by Weight Percent :
Gravel sand Silt Clay coarse medium fine
Wentworth Classification 2.480 58.732 27.499 11.289 0.000 0.000 Unified Classification 0.000 2.480 64.381 33.139 0.000 0.000
Standard Statistics : Median Mean Dev. Skew Kurt
Method of Moments (PHI) 0.69 1.01 0.08 2.08 Folk Graphic Measures (PHI) 0.62 0.70 1.03 0.10 0.74 Grain Size (mm) 0.65 0.62
Locality Type sample Date profile Analysis Date Analyz 3 9 G 6217104 850125 860521 ISC
X Position : 3300.00 Y Position : 261.50
Elevation of Top of Core : Length of Core Depth to Top of Sample : Depth to Bottom of Sample :
Comments : 1.25 PHI CORRECTION BY AVERAGING 27 JUN
Start Weight : 27.310 Final Weight : 27.280 Deviation :
PHI HM Weight Percnt Cumul Percnt ----- ----- ------ ------ ------
PHI MM
----- ----- Weight Percnt Cumul
Percnt
Sample Content by Weight Percent :
Gravel Sand Silt Clay coarse medium fine
Wentworth Classification 0.150 44.421 37.108 18.321 0.000 0.000 Unified Classification 0.000 0.150 51.360 48.490 0.000 0.000
Standard Statistics : Median Mean Dev. Skew Kurt
Method of Moments (PHI) 1.23 0.76 -0.03 2.09 Folk Graphic Measures (PHI) 1.20 1.22 0.77 0.05 0.75 Grain Size (mm) 0.44 0.43

Locality Type Sample Date Profile Analysis Date Analyz 39 G 6217105 850125 8 6 0 5 2 1 ISC
X Posltion : 3300 .00 Y Position : 290 .22
Elevation of Top of Core : 7 . 0 0 Length of Core 0 .00 Depth to Top of Sample : 0 .00 Depth to Bottom of Sample :
Comments : 1.25 PHI CORRECTION BY AVERAGING 27 J U N 8 6
Start Weight : 47 .990 Final Weight : 47 .870 Deviation : 0.250 Z
PHI m Weight Percnt Cumul PHI m Weight Percnt Cumul Percnt I Percnt ----- ----- ------ ------ ------ ----- ----- ------ ------ ------
Sample Content by Weight Percent :
Gravel Sand Silt Clay coarse medium fine
Wentworth Classification 0 . 0 0 0 14.333 51.738 33 .929 0.000 0.000 Unified Classification 0.000 0.000 20.512 79.478 0 .010 0.000
Standard Statistics : Median Mean Dev. Skew Kurt
Method of Moments (PHI) Folk Graphic Measures (PHI) Grain Size (mm)
Locality Sample Date Profile Analysis Date Analyz 39 Ty!? 6217106 850125 860522 ISC
X Position : 3300 .00 Y Position : 328.28
Elevation of Too of Core : -- -
Length of Core ~epth to Top of Sample : ~epth to Bottom of Sample :
Comments :
Start Weight : 32.200 Final Weight : 32.189 Deviation : 0.034 %
PHI MI4 Weight Percnt Cumul Percnt ----- ----- ------ ------ ------
PHI MI4 Weight Percnt Cumul Percnt ----- ----- ------ ------ ------
Sample Content by Weight Percent :
Gravel Sand Silt Clay coarse medium fine
Wentworth Classification 0 . 1 2 1 7 .888 49 .899 42.092 0 .000 0 . 0 0 0 L'nified Classification 0 . 0 0 0 0 . 1 2 1 12.917 86.952 0 . 0 0 9 0 .000
Standard Statistics : Median Mean Dev. Skew Kurt
Method of Moments (PHI) 1 .83 0.57 -1.39 6 .52 Folk Graphic Measures (PHI) 1 . 9 1 1.87 0 .51 -0.20 1 .18 Grain size (mm) 0.27 0 .28

Locality Type Sample Date Profile Analysis Date Analyz 35 G 6217107 850125 860522 LSC
X Position : 3300.00 Y Position : 455.53
Elevation of Top of Core : -6.43 Length of Core 0 .00 Depth to Top of Sample : 0 .00 Depth to Bottom of Sample :
Comments :
Start Weight : 30.750 Final Weight : 3 0 . 7 4 1 Deviation : 0.025 %
PHI M14 Weiqht Percnt Cumul Percnt ----- ----- ------ ------ ------
PHI MM Weight Percnt Cumul Percnt ----- ----- ------ ------ ------
83.572 94 .951 98 .500 99.639 99.928
100.000 100.000 i n n . nnn
Sample Content by Weiqht Percent :
Gravel Sand Silt Clay coarse medium fine
Wentworth Classification 0 .940 5.400 19.853 73 .807 0.000 0.000 Unified Classification 0.000 0 . 9 4 0 6.831 92.157 0 .072 0.000
Standard Statistics : Median Mean Dev. Skew Kurt
Method of Moments (PHI) Folk Graphic Measures (PHI) Grain Size (mm)
Locality Type Sample Date Profile Analysis Date Analyz 3 9 G 6217108 850125 860522 ISC
X Position : 3300.00 Y Position : 586.00
Elevation of Top of Core : -7.84 Length of Core 0.00 Depth to Top of Sample : 0 .00 Depth to Bottom of Sample :
Comments :
start Weight : 32 .880 Final Weight : 32.880 Deviation : 0.000 4,
PHI MM Weiqht Percnt Cuaul Percnt ----- ----- ------ ------ ------
PHI MM Weight Percnt Cumul Percnt ----- ----- ------ ------ ------
Sample Content by Weight Percent :
Gravel Sand Silt Clay coarse medium fine
Wentworth Classification 0.237 1 . 9 3 1 37 .430 6 0 . 4 0 1 0 .000 0.000 Unified Classification 0 . 0 0 0 0 .237 3.273 9 6 . 4 5 1 0 .040 0.000
Standard Statistics : Median Mean Dev. Skew Kurt
Method of Moments (PHI) 2.07 0.47 -1 .69 1 2 . 0 0 ~ o l k Graphic ~easures \PHI) Grain Size (mm)

Locality Type Sample Date Profile Analysis Date Analyz 39 G 6217109 850125 860522 LSC
X Position : 3300.00 Y Position : 716 .00
Comments :
start Weight
PHI MM
Elevation of Top of Core : Length of Core Depth to Top of Sample : Depth to Bottom of Sample :
Weight
640 Final Weight
Percnt Cumul Percnt ------ ------
0 .000 0.000 0 . 0 0 0 0 .000 0 .000 0 .000 0.000 0 .000 0.000 0 .000 0 .000 0 . 0 0 0 0 .199 0 .199 0.199 0.398 0.489 0.887 0 . 8 5 1 1 .738 1 . 3 0 1 3.039 1.239 4.278 2 .410 6.688 3.130 9 .818 3.522 13.340 6 . 8 5 1 20 .190 7 .819 28 .010 9 .319 37.329
: 30.668 Deviation : 0 . 0 9 1 %
PHI MM Weight Percnt Cumul Percnt
sample Content by Weight Percent :
Gravel Sand Silt Clay coarse medium fine
Wentworth Classification 0 .398 19 .793 46.319 3 3 . 4 9 1 0 . 0 0 0 0 . 0 0 0 Unified Classification 0 .000 0.398 27.612 7 1 . 9 8 1 0 .010 0 .000
Standard Statistics : Median Mean Dev. Skew Kurt
Method of Moments (PHI) Folk Graphic Measures (PHI) Grain size (mm)
Locality Type sample Date Profile Analysis Date Analyz 3 9 G 6217110 850125 860522 LSC
X Position : 3300.00 Y Position : 8 7 7 . 8 1
Elevation of Top of Core : - 1 0 . 7 1 Length of Core 0 .00 Depth to Top of Sample : 0 .00 Depth to Bottom of Sample :
Comments :
Start Weight : 33.950 Final Weight : 33 .891 Deviation : 0.174 %
PHI Hn Weight Percnt Cumul PHI MM Weight Percnt Cumul ~ercnt I Percnt
Sample Content by Weight Percent :
Gravel Sand Silt Clay coarse medium fine
Wentworth Classification 0 .000 0 . 0 0 0 0 . 3 0 1 9 9 . 6 9 9 0 . 0 0 0 0 . 0 0 0 Unified Classification 0 .000 0 .000 0 . 0 0 0 99 .829 0 . 1 7 1 0 . 0 0 0
Standard Statistics : Median Mean Dev. Skew Kurt
Method of Moments (PHI) 2.72 0 .29 0 . 4 1 3 . 5 1 Folk Graphic Measures (PHI) 2 .70 2 .70 0 .29 0 .04 1 . 0 1 Grain size (vm) 0 .15 0 . 1 5

Locality Type Sample Date Profile Analysis Date Analyz 3 9 G 6217111 850125 860522 LSC
x ~osltion : 3300.00 Y Posltion : 980.79
Elevation of Top of Core : -12.06 Length of Core 0.00 Depth to Top of Sample : 0.00 Depth to Bottom of Sample :
Comments :
Start Weight : 40.120 Final Weight : 40.138 Deviation : 0.045 t
PHI m Weight Percnt Cumul Percnt
PHI MM Weight Percnt Cumul Percnt ----- ----- ------ ------ ------
sample Content by Weight Percent :
Gravel Sand Silt Clay coarse medium fine
Wentworth Classification 0.070 0.727 0.909 98.293 0.000 0.000 Unified Classification 0.000 0.070 0.847 98.722 0.361 0.000
Standard Statistics :
Method of Moments (PHI) Folk Graphic Measures (PHI) Grain Size (mm)
Median Mean Dev. Skew Kurt
2.73 0.40 -2.28 20.68 2.73 2.73 0.31 0.08 1.10 0.15 0.15
Locality Sample Date h-of ile Analysis Date Analyz 3 9 6217112 850125 860523 LSC
X Position : 3300.00 Y Position : 1194.60
Elevation of Top of Core : -13.59 Length of Core 0.00 Depth to Top of Sample : 0.00 Depth to Bottom of Sample :
Comments :
Start Weight : 31.800 Final Weight : 31.529 Deviation : 0.852 %
PHI m Weight Percnt Cumul Percnt
PHI Hn Weight Percnt Cumul Percnt ----- ----- ------ ------ ------
Sample Content by Weight Percent :
Gravel Sand Silt Clay coarse medium fine
Wentworthclassification 0.000 0.000 0.130 99.870 0.000 0.000 Unified Classification 0.000 0.000 0.000 98.341 1.659 0.000
Standard Statistics : Median Mean Dev. Skew Kurt
Method of Moments (PHI) 2.89 0.32 0.56 3.80 Folk Graphic Measures (PHI) 2.87 2.88 0.32 0.09 1.15 Grain Size (mm) 0.14 0.13

Locality Sample Date Profile Analysis Date Analyz 3 9 6217113 850125 860523 LSC
X Position : 3300.00 Y Position : 1496.88
Elevation of Top of Core : -16.39 Length of Core 0.00 Depth to Top of Sample : 0.00 k p t h to Bottom of Sample :
Comments :
Start Weight : 28.990 Final Weight : 28.880 Deviation : 0.379 %
PHI MM Weight Percnt Cumul Percnt ----- ----- ------ ------ ------
PHI MM Weight Percnt Cumul Percnt ----- ----- ------ ------ ------
Sample Content by Weight Percent :
Gravel Sand Silt Clay coarse medium fine
Wentworth Classification 1.939 0.000 0.000 98.061 0.000 0.000 Unified Classification 0.000 1.939 0.000 95.062 2.999 0.000
Standard Statistics : Median Mean Dev. Skew Kurt
Method of Moments (PHI) Folk Graphic Measures (PHI) Grain size (mm)
Locality Type Sample Date Profile Analysis Date Analyz 39 G 6217114 850125 860523 ISC
X Position : 3300.00 Y Position : 1774.92
Elevation of Top of Core : -19.00 Length of Core 0.00 Depth to Top of Sample : 0.00 Depth to Bottom of Sample :
Comments :
Start
PHI
Weight
m
: 37.690 Final Weight
weight Percnt Cumul Percnt ------ ------ ------
0.000 0.000 0.000 0.000 0.000 0.000 0.000 0.000 0.000 0.000 0.000 0.000 0.000 0.000 0.000 0.000 0.000 0.000 0.000 0.000 0.000 0.000 0.000 0.000 0.000 0.000 0.000 0.000 0.000 0.000 0.000 0.000 0.000 0.000 0.000 0.000 0.000 0.000 0.000 0.000 0.000 0.000 0.000 0.000 0.000 0.000 0.000 0.000 0.000 0.000 0.000 0.000 0.000 0.000
PHI HX
Deviation :
Weight Percnt Cumul Percnt ------
0.000
Sample Content by Weight Percent :
Gravel sand Silt Clay coarse medium fine
Wentworth Classification 0.000 0.000 0.000 100.000 0.000 0.000 Unified Classification 0.000 0.000 0.000 98.051 1.949 0.000
Standard Statistics : Median Mean Dev. Skew Kurt
Method of Moments (PHI) 3.04 0.29 0 .41 3.71 Folk Graphic Measures (PHI) 3.02 3.03 0.28 0.09 1.17 Grain Size (mm) 0.12 0.12
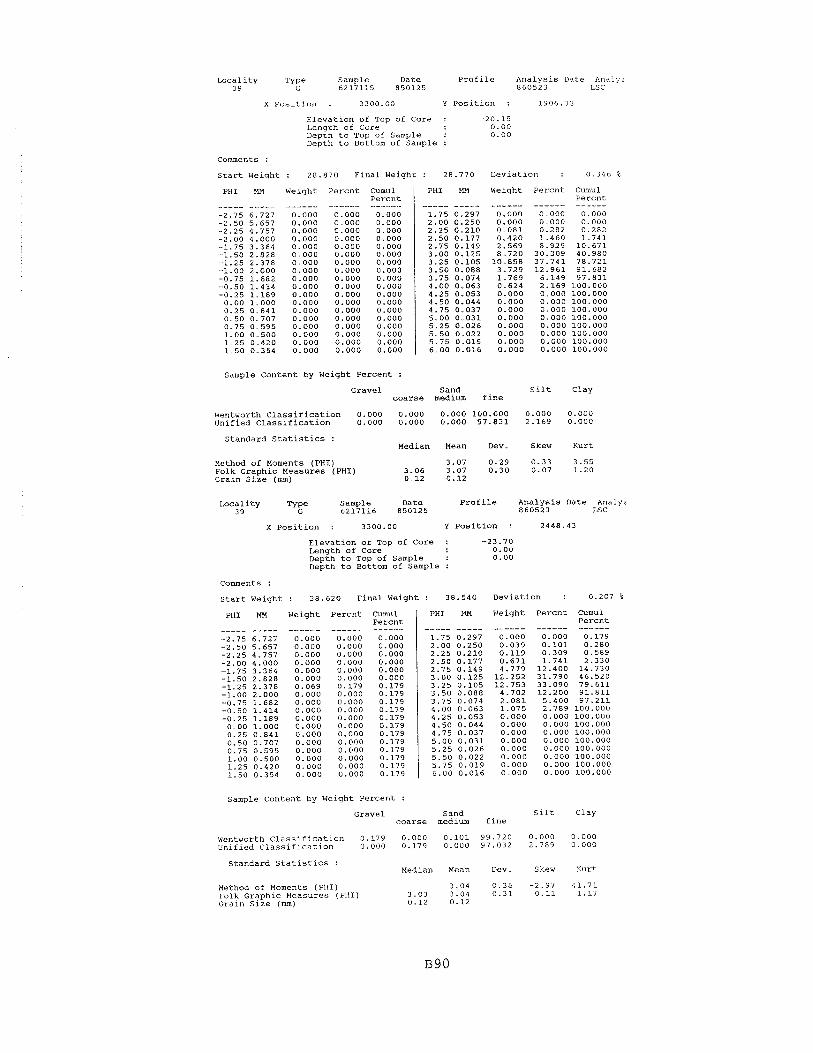
Locality Type Sample Date Profile Analysis Date Analyz 3 9 G 6217115 850125 860523 LSC
X Position : 3300.00 Y Position : 1906.32
Elevation of Top of Core : -20 .15 Length of Core 0 .00 Depth to Top of Sample : 0 .00 Depth to Bottom of Sample :
Comments :
start Weight : 28 .870 Final Weiqht : 28 .770 Deviation : 0.346 2
PHI m Weight Percnt Cumul Percnt ----- ----- ------ ------ ------
PHI m Weight Percnt Cumul Percnt ----- ----- ------ ------ ------
Sample Content by Weight Percent :
Gravel sand silt Clay coarse medium fine
Wentworth Classification 0 .000 0.000 0.000 100 .000 0 . 0 0 0 0.000 Unified Classification 0 .000 0 .000 0.000 9 7 . 8 3 1 2.169 0 .000
Standard Statistics : Median Mean Dev. Skew Kurt
Method of Moments (PHI) 3.07 0.29 0.33 3.55 Folk Graphic Measures (PHI) 3.06 3.07 0.30 0.07 1 .20 Grain Size (ram) 0.12 0 .12
Locality Type Sample Date Profile Analysis Date Analyz 39 G 6217116 850125 860523 LSC
x Position : 3300.00 Y Position : 2448.43
Elevation of Top of Core : -23.70 Length of Core 0.00 Depth to Top of Sample : 0 .00 Depth to Bottom of Sample :
Comments :
Deviation : start Weight : 38 .
Weiqht
6 2 0 Final Weight : 38.540 0.207 %
Cumu 1 Percnt
Percnt Cumul Percnt ------ ------
PHI m ----- -----
Weight Percnt PHI MM
sample content by Weight Percent :
Gravel Sand Silt Clay coarse medium fine
Wentworth Classification 0 .179 0 .000 0 . 1 0 1 9 9 . 7 2 0 0 .000 0 . 0 0 0 Unified Classification 0.000 0.179 0 .000 97 .032 2 . 7 8 9 0 . 0 0 0
Standard Statistics : Median Mean Dev. Skew Kurt
Method of Moments (PHI) 3.04 0 .36 -2 .97 1 1 . 7 1 Folk Graphic Measures (PHI) 3 .03 3.04 0 . 3 1 0 . 1 1 1.17 Grain size (mm) 0 .12 0 . 1 2

Locality Type Sample Date Profile Analysis Date Analyz 3 9 G 6217117 850125 860523 ISC
X Position : 3 3 0 0 . 0 0 Y Position : 2943 .33
Elevation of Top of Core : - 2 6 . 4 1 Length of Core 0 .00 Depth to Top of Sample : 0 . 0 0 Depth to Bottom of Sample :
Comments :
Start Weight : 27 .280 Final Weight : 27 .171 Deviation : 0 .400 4.
PHI MM Weight Percnt Cumul PHI MM Weight Percnt Cumul Percnt Percnt ----- ----- ------ ------ ------ --_-- ----- ------ ------ ------
-2 .75 6.727 0.000 0 .000 0.000 1.75 0 .297 0.030 0 . 1 1 0 0 . 1 1 0
Sample content by Weight Percent :
Gravel coarse
Wentworth Classification 0 .000 0 .000 Unified Classification 0 . 0 0 0 0 . 0 0 0
Standard Statistics : Median
Method of Moments (PHI) Folk Graphic Measures (PHI) Grain Size (mm)
Sand Silt Clay medium fine
Mean Dev. Skew Kurt
Sample Content by Weight Percent :
Locality Type Sample Date Profile Analysis Date Analyz 3 9 G 6 2 1 7 3 0 1 850214 860605 LSC
X Position : 3300 .00 Y Position : 164.73
Elevation of Top of Core : 20.22 Length of Core 0 .00 Depth to Top of Sample : 0 .00 Depth to Bottom of Sample :
Comments : 1 .25 PHI CORRECTION BY AVERAGING 27 JUN 8 6
Start Weight : 33 .860 Final Weight : 33.829 Deviation : 0.092 %
Gravel Sand Silt Clay coarse medium fine
PHI MM Weight Percnt Cumul Percnt ----- ----_ __---- ------ -----_
-2.75 6.727 0 . 0 0 0 0 . 0 0 0 0 .000 -2.50 5 .657 0 . 0 0 0 0 .000 0 . 0 0 0 -2.25 4.757 0 . 0 0 0 0 . 0 0 0 0 . 0 0 0 -2.00 4 .000 0 . 0 0 0 0 . 0 0 0 0.000 -1.75 3 .364 0.000 0.000 0.000 -1.50 2 .828 0.000 0 . 0 0 0 0.000 -1.25 2.378 0.000 0 . 0 0 0 0 . 0 0 0 -1.00 2 .000 0 . 0 0 0 0 . 0 0 0 0 .000 -0.75 1 .682 0.000 0 . 0 0 0 0 .000 -0.50 1 .414 0 . 0 7 1 0 . 2 1 0 0 .210 -0.25 1 .189 0 .460 1 . 3 6 0 1 .570
0.00 1.000 0 . 7 6 1 2 .250 3 .819 0.25 0 . 8 4 1 1 . 6 6 1 4.910 8 .729 0.50 0 .707 1.570 4 . 6 4 1 13 .370 0.75 0 .595 2.659 7 .860 21 .230 1.00 0 .500 4 .351 12 .862 34.092 1.25 0 .420 4 .208 12 .439 4 6 . 5 3 1 1 .50 0.354 4 .208 12.439 58.970
Wentworth Classification 0 . 0 0 0 34.092 52.857 1 3 . 0 5 1 0 .000 0 .000 Unified Classification 0 .000 0 .000 4 6 . 5 3 1 53.460 0 . 0 0 9 0 . 0 3 0
PHI MM Weight Percnt cumul Percnt --__- ----- --___- ----_- _ _ _ _ _ -
1 .75 0.297 5.267 15 .569 7 4 . 5 4 0 2.00 0.250 4.198 12.409 8 6 . 9 4 9 2.25 0 .210 2 .321 6 . 8 6 1 9 3 . 8 1 0 2.50 0 .177 1.390 4 .109 97 .919 2.75 0 .149 0 . 5 0 1 1 . 4 8 1 99 .400 3 .00 0.125 0.159 0 . 4 7 0 9 9 . 8 7 0 3.25 0.105 0 . 0 4 1 0 . 1 2 1 9 9 . 9 9 1 3 .50 0 .088 0 .000 0 . 0 0 0 9 9 . 9 9 1 3 .75 0 .074 0 .000 0 . 0 0 0 9 9 . 9 9 1 4 .00 0.063 0.003 0 .009 1 0 0 . 0 0 0 4 .25 0 .053 0 .000 0 . 0 0 0 100 .000 4 .50 0.044 0 .000 0 . 0 0 0 100 .000 4 .75 0 .037 0 .000 0 . 0 0 0 100 .000 5.00 0 . 0 3 1 0 .000 0.000 100 .000 5 .25 0 .026 0 .000 0 . 0 0 0 1 0 0 . 0 0 0 5 .50 0 .022 0 .000 0 . 0 0 0 1 0 0 . 0 0 0 5 .75 0.019 0 .000 0 . 0 0 0 1 0 0 . 0 0 0 6.00 0.016 0 .000 0 . 0 0 0 1 0 0 . 0 0 0
Standard Statistics : Median Mean Dev. Skew Kurt
Method of Moments (PHI) 1.27 0 . 6 8 - 0 . 2 5 2 .70 Folk Graphic Measures (PHI) 1 .32 1.28 0.68 -0 .10 0 . 9 9 Grain size (mm) 0 . 4 0 0 . 4 1

Locality Type Sample Date Profile Analysis Date h n a l y z 39 G 6217302 850214 860612 LSC
X Position : 3300.00 Y Position : 164.73
Elevation of Top of Core : 20 .22 Length of Core 0 . 0 0 ~epth to TOP of sample : 0.00 Depth to Bottom of Sample :
Comments :
Start Weight : 44.980 Final Weight : 44.929 Deviation : 0 .113 t
PHI MM Weight Percnt Cumul Percnt ----- ----- ------ ------ ------
PHI MM Weight Percnt Cumul Percnt ----- ----- ------ ------ ------
0.000 0.000 0 .000 0 .000 0.000 n. ooo
Sample Content by Weight Percent :
Gravel Sand Silt Clay coarse medium fine
Wentworth classification 0 .000 23.608 66 .672 9 .720 0 . 0 0 0 0 .000 Unified Classification 0 ,000 0 .000 40 .408 59 .592 0 .000 0 .000
Standard Statistics : Median Mean Dev. Skew Kurt
Method of Moments (PHI) 1.38 0.49 -0.08 3.09 Folk Graphic Measures (PHI) 1.38 1.38 0.50 - 0 . 0 1 0.95 Grain size (mm) 0.38 0.38
Locality Type Sample Date Profile Analysis Date Analyz 3 9 G 6217303 850214 860603 LSC
X Position : 3300 .00 Y Position : 228 .58
Elevation of Top of Core : 1 2 . 9 5 Length of Core 0 .00 Depth to Top of Sample : 0 . 0 0 Lkpth to ~ottom of sample :
Comments : 1.25 PHI CORRECTION BY AVERAGING 2 7 JUN 8 6
Start Weight : 52.050 Final Weight : 5 2 . 0 1 9 Deviation : 0.060 %
PHI MM Weight Percnt Cumul Percnt
Weight Percnt Cumul Percnt
Sample Content by Weight Percent :
Gravel Sand Silt Clay coarse medium fine
Wentworth Classification 0 .350 48.909 38 .609 12 .132 0 .000 0 .000 Unified Classification 0 .000 0 . 3 5 0 57 .139 4 2 . 5 1 1 0 . 0 0 0 0 . 0 0 0
Standard Statistics : Median Mean Dev. Skew Kurt
Method of Moments (PHI) Folk Graphic Measures (PHI) Grain Size ( m m )

Locality Type Sample Date Profile Analysis Date Analyz 39 G 6217304 850214 860612 LSC
Elevation of Top of Core : Length of Core Depth to Top of Sample : Depth to Bottom of Sample :
Comments :
X Position : 1300.00 Y Position : 255.54
Start Weight : 42.380 Final Weight
PHI MM Weight Percnt Cumul Percnt ----- ----- ------ ------ ------
-2.75 6.727 0 . 0 0 0 0.000 0.000 -2.50 5 .657 0 . 0 0 0 0 . 0 0 0 0.000 -2.25 4 .757 0 .000 0.000 0.000 -2.00 4 .000 0 . 0 0 0 0 . 0 0 0 0.000 -1.75 3.364 0 . 0 0 0 0.000 0.000 -1.50 2.828 0 . 0 0 0 0 . 0 0 0 0.000 -1.25 2.378 0 .119 0 . 2 8 1 0 . 2 8 1 -1.00 2.000 0.140 0 .331 0.612 -0.75 1.682 0 . 4 4 0 1 .039 1 . 6 5 1 -0.50 1.414 0 .969 2.289 3 . 9 4 0 -0.25 1.189 1.380 3 .260 7 . 2 0 1
0.00 1.000 1 . 0 5 0 2 . 4 8 1 9 . 6 8 1
PHI MM
Deviation :
Weight Percnt cumul Percnt ------ 53 .260 72.710 88 .469 97 .449 99 .409 99 .910
1 0 0 . 0 0 0 100 .000 100 .000 100.000
Sample Content by Weight Percent :
Gravel Sand Silt Clay coarse medium fine
Wentworth Classification 0 .612 24.519 47.579 27.290 0 . 0 0 0 0 . 0 0 0 Unified Classification 0 . 0 0 0 0.612 30.449 68 .939 0 . 0 0 0 0.000
Standard Statistics : Median Mean Dev. Skew Kurt
Method of Moments (PHI) Folk Graphic Measures (PHI) Grain Size (mm)
Locality Type Sample Date Profile Analysis Date Analyz 3 9 G 6217305 850214 860612 LSC
x Position : 3300.00 Y Position : 290 .78
Elevation of Top of Core : Length of Core Depth to Top of Sample : Depth to Bottom of Sample :
Comments :
Start Weight : 54 .430 Final Weight : 54.400 Deviation : 0.055 %
PHI MM Weight Percnt Cumul PHI MM Weight Percnt Cumul Percnt ----- ----- ------ ------ ----- ----- ------ ------ ------
Sample Content by Weight Percent :
Gravel Sand Silt Clay coarse medium fine
Wentworth Classification 0 .279 18 .882 52.489 28 .349 0 . 0 0 0 0 . 0 0 0 Unified Classification 0 . 0 0 0 0 .279 25.022 74 .699 0 .000 0.000
Standard Statistics : Median Mean Dev. Skew Kurt
Method of Moments (PHI) 1.57 0 . 7 3 -1.07 4.12 Folk Graphic Measures (PHI) 1.73 1 . 6 0 0 .71 -0.33 1 .22 Grain Size (rm) 0.30 0.34

Locality Type Sample Date Profile Analysis Date Analyz 3 9 G 6217306 850214 860604 ISC
x Position : 3300.00 Y Position : 360.86
Elevation of Top of core : Length of Core Depth to Top of Sample : Depth to Bottom of Sample :
Comments : MAJORITY OF PEBBLES >2.0 PHI
start Weight : 55.110 Final Weight : 55.102 Deviation : 0.015 %
PHI MM Weight Percnt Cumul Percnt ----- ----- ------ ------ ------
PHI MH Weight Percnt Cumul Percnt ----- ----- ------ ------ ------
1.75 0.297 0.920 1.670 93.407
ioo. 000 100.000 100.000 100.000 100.000
Sample Content by Weight Percent :
Gravel Sand Silt Clay coarse medium fine
wentworth classification 65.858 23.919 5.749 4.474 0.000 0.000 Unified Classification 0.000 65.858 24.769 9.363 0.011 0.000
Standard Statistics : Median Mean Dev. Skew Kurt
Method of Moments (PHI) Folk Graphic Measures (PHI) Grain Size (mm)
Locality 39
sample 6217307
Date 850214
Profile Analysis Date Anal 860604 ISC
x Position : 3300.00 Y Position : 473.27
Elevation of Top of Core : -8.23 Length of Core 0.00 Depth to Top of Sample : 0.00 Depth to Bottom of Sample :
Comments :
Start Weight : 25.800 Final Weight : 25.739 Deviation : 0.236 %
PHI HH Weight Percnt Cumul Percnt ----- ----- ------ ------ ------
PHI MM Weight Percnt Cumul Percnt ----- ----- ------ ------ ------
Sample Content by Weight Percent :
Gravel Sand silt Clay coarse medium fine
Wentworth Classification 0.000 0.901 20.436 78.663 0.000 0.000 Unified Classification 0.000 0.000 1.480 98.450 0.070 0.000
Standard Statistics : Median Mean Dev. Skew Kurt
Method of Moments (PHI) 2.33 0.45 -0.41 4.43 Folk Graphic Measures (PHI) 2.34 2.34 0.44 0.00 1.01 Grain size (mm) 0.20 0.20

lacality Type Sample Date Profile Analysis Date Analyz 3 9 G 6217308 850214 860604 LSC
X Position : 3300.00 Y Position : 601.51
Elevation of Top of Core : -6.71 Length of Core 0.00 Depth to Top of Sample : 0.00 Depth to Bottom of Sample :
Comments :
Start Weight : 38.590 Final Weight : 38.570 Deviation : 0.052 %
PHI Weight Percnt Cumu 1 Percnt ------ 0.000 0.000 0.000 0.000 0.000 0.000 0.000 0.000 0.000
PHI m Weight Percnt Cumul Percnt ----- ----- ------ ------ ------
Sample Content by Weight Percent :
Gravel Sand Silt Clay coarse medium fine
Wentworth Classification 0.000 3.993 22.730 73.277 0.000 0.000 Unified Classification 0.000 0.000 6.194 93.767 0.039 0.000
Standard Statistics : Median Mean DeV. Skew Kurt
Method of Moments (PHI) 2.28 0.60 -1.11 4.98 Folk Graphic Measures (PHI) 2.37 2-37 0 . 5 7 -0.20 1.07
Locality T Sample Date Profile Analysis ate Analyz 3 9 6217309 850214 860604 LSC
X Position : 3300.00 Y Position : 717.63
Elevation of Top of Core : -6.89 Length of Core 0.00 Depth to Top of Sample : 0.00 Depth to Bottom of Sample :
Comments :
Start Weight : 41.440 Final Weight : 41.410
PHI Weight Percnt Cumul Percnt
PHI
----- 1.75 2.00 2.25 2.50 2.75 3.00 3.25 3.50 3.75 4.00 4.25 4.50 4.75 5.00 5.25 5.50 5.75 6.00
Deviation : 0.072 %
Weight Percnt Cumul Percnt ------ ------ ------
Sample content by Weight Percent :
Gravel Sand Silt Clay coarse medium fine
Wentworth Classification 0.360 7.001 32.449 60.191 0.000 0.000 Unified Classification 0.000 0.360 10.280 89.239 0.121 0.000
Standard Statistics : Median Mean Dev. Skew Kurt
Method of Moments (PHI) Folk Graphic Measures (PHI) Grain Size (mm)
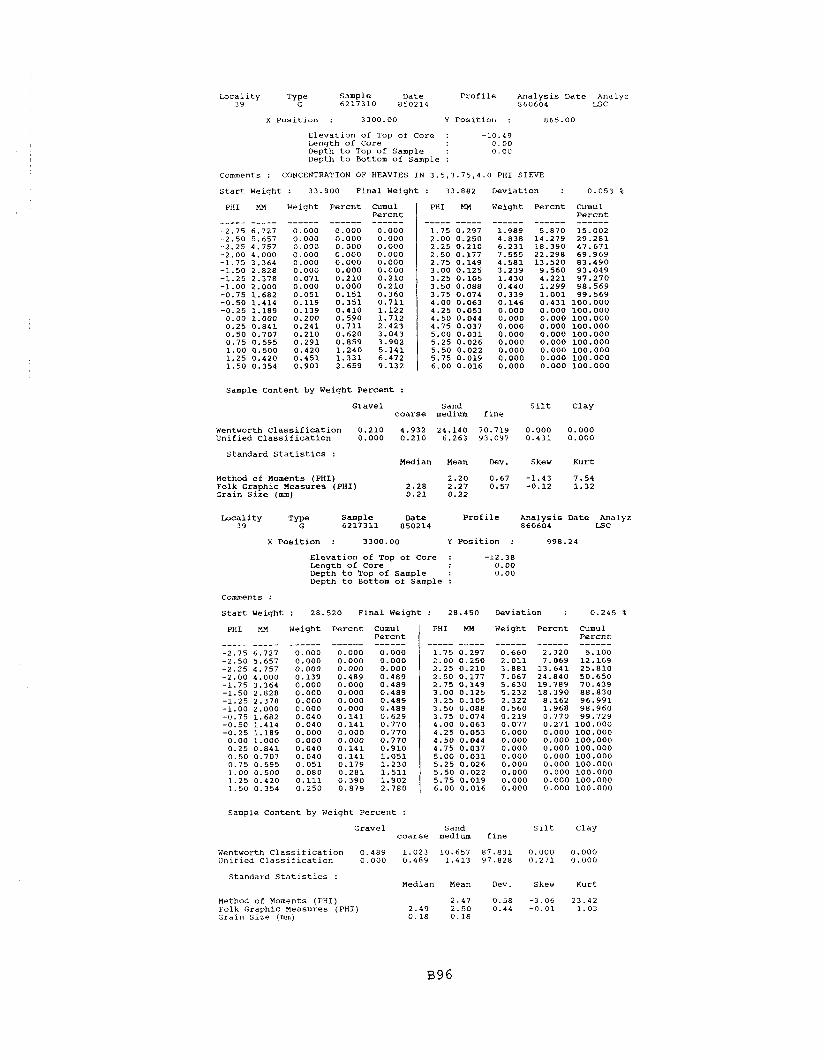
Locality Type Sample Date Profile Analysis Date Analyz 39 G 6217310 850214 860604 ISC
X Position : 3300.00 Y Position : 865.00
Elevation of Top of Core : -10.49 Length of Core 0.00 Depth to Top of Sample : 0.00 Depth to Bottom of Sample :
Comments : CONCENTRATION OF HEAVIES IN 3.5,3.75,4.0 PHI SIEVE
Start Weight : 33.900 Final Weight : 33.882 Deviation : 0.053 "a
PHI HN Weiqht Percnt Cumul Percnt
PHI H13 Weight Percnt Cumul Percnt
Sample Content by Weight Percent :
Gravel Sand Silt Clay coarse medium fine
Wentwonh classification 0.210 4.932 24.140 70.719 0.000 0.000 Unified classification 0.000 0.210 6.263 93.097 0.431 0.000
Standard Statistics : Median Mean Dev. Skew Kurt
Method of Moments (PHI) 2.20 0.67 -1.43 7.54 Folk Graphic Measures (PHI) 2.28 2.27 0.57 -0.12 1.32 Grain size (mm) 0.21 0.22
Locality Type sample Date Profile Analysis Date Analyz 3 9 G 6217311 850214 860604 LSC
X Position : 3300.00 Y Position : 998.24
Elevation of Top of Core : -12.38 Length of Core 0.00 Depth to Top of Sample : 0.00 Depth to Bottom of Sample :
Comments :
Start Weight : 28.520 Final Weight Deviation :
PHI Mn Weight Percnt Cumul Percnt ------ ------ ------
0.000 0.000 0.000 0.000 0.000 0.000 0.000 0.000 0.000 0.139 0.489 0.489 0.000 0.000 0.489 0.000 0.000 0.489 0.000 0.000 0.489 0.000 0.000 0.489 0.040 0.141 0.629 0.040 0.141 0.770 0.000 0.000 0.770 0.000 0.000 0.770
PHI MI4 Weight Percnt Cumu 1 Percnt
Sample Content by Weight Percent :
Gravel Sand silt clay coarse medium fine
Wentworth Classification 0.489 1.023 10.657 87.831 0.000 0.000 Unified Classification 0.000 0.489 1.413 97.828 0.271 0.000
Standard Statistics : Median Mean Dev. Skew Kurt
Method of Moments (PHI) 2.47 0.58 -3.06 23.42 Folk Graphic ~easures ?PHI) Grain size (mm)

Locality Type sample Date Profile Analysis Date Analyz 39 G 6217312 850214 860604 LSC
x Position : 3300.00 Y Position : 1223.00
Elevation of Top of Core : -13.43 Length of Core 0.00 Depth to Top of Sample : 0.00 Depth to Bottom of Sample :
Comments :
Start Weight : 32.620 Final Weight : 32.470 Deviation : 0.460 1
PHI Weight Percnt Cumul Percnt
PHI
----- 1.75 2.00 2.25 2.50 2.75 3.00 3.25 3.50 3.75 4.00 4.25 4.50 4.75 5.00 5.25 5.50 5.75 6.00
Weight Percnt
------ 0.000 0.370 2.310 16.791 32.331 31.050 12.969 3.261 0.739 0.179 0.000 0.000 0.000 0.000 0.000 0.000 0.000 0.000
curnu1 Percnt ------ 0.000 0.370 2.679 19.470 51.802 82.852 95.821 99.082 99.821 100.000 100.000 100.000 100.000 100.000 100.000 100.000 100.000 100.000
Sample Content by Weight Percent :
Gravel Sand Silt Clay coarse medium fine
Wentworth Classification 0.000 0.000 0.370 99.630 0.000 0.000 Unified Classification 0.000 0.000 0.000 99.821 0.179 0.000
Standard Statistics : Median Mean Dev. Skew Kurt
Method of Moments (PHI) 2.75 0.29 0.27 3.38 Folk Graphic Measures (PHI) 2.74 2.74 0.29 0.02 0.99 Grain Size (mm) 0.15 0.15
LDcality Type Sample Date Profile Analysis Date Analyz 3 9 G 6217313 850214 860604 LSC
X Position : 3300.00 Y Position : 1483.25
Elevation of Top of Core : -15.45 Length of Core 0.00 Depth to Top of Sample : 0.00 Depth to Bottom of Sample :
Comments :
Startweight: 19.580 Finalweight: 19.520 Deviation : 0.306%
PHI MU Weight Percnt Cumul Percnt ----- ----- ------ ------ ------
Sample Content by Weight Percent :
PHI MI4 Weight Percnt Cumul Percnt ----- ----- ------ ------ ------
Gravel Sand Silt Clay coarse medium fine
Wentworth Classification 0.000 0.000 0.000 100.000 0.000 0.000 Unified Classification 0.000 0.000 0.000 99.631 0.369 0.000
Standard Statistics : Median Mean Dev. Skew Kurt
Method of Moments (PHI) 2.86 0.26 0.40 3.95 Folk Graphic Measures (PHI) 2 . 8 5 2.85 0.26 0.03 1.07 Grain size (mm) 0.14 0.14

Sample Content by Weight Pe rcen t :
I a c a l i t y Type Sample Date P r o f i l e Ana lys i s Date Analyz 39 G 6217314 850214 860604 LSC
x P o s i t i o n : 3300.00 Y P o s i t i o n : 1739.48
Eleva t ion of Top of Core : -18.45 Length of Core 0.00 Depth t o Top of Sample : 0.00 Depth t o Bottom of Sample :
Comments :
S t a r t Weiqht : 25.630 F i n a l Weiqht : 25.541 Deviat ion : 0.347 %
Gravel Sand S i l t Clay c o a r s e medium f i n e
PHI MM Weight P e r c n t Cumul Pe rcn t ----- ----- ------ ------ ------
-2.75 6.727 0.000 0.000 0.000 -2.50 5.657 0.000 0.000 0.000 -2.25 4.757 0.000 0.000 0.000 -2.00 4.000 0.000 0.000 0.000 -1.75 3.364 0.000 0.000 0.000 -1.50 2.828 0.000 0.000 0.000 -1.25 2.378 0.000 0.000 0.000 -1.00 2.000 0.000 0.000 0.000 -0.75 1.682 0.000 0.000 0.000 -0.50 1.414 0.000 0.000 0.000 -0.25 1.189 0.000 0.000 0.000 0.00 1.000 0.000 0.000 0.000 0.25 0.841 0.000 0.000 0.000 0.50 0.707 0.000 0.000 0.000 0.75 0.595 0.000 0.000 0.000 1.00 0.500 0.000 0.000 0.000 1.25 0.420 0.000 0.000 0.000 1.50 0.354 0.000 0.000 0.000
Wentworth C l a s s i f i c a t i o n 0.000 0.000 0.121 99.879 0.000 0.000 u n i f i e d C l a s s i f i c a t i o n 0.000 0.000 0.000 99.158 0.842 0.000
PHI Hn Weight Pe rcn t Cumul P e r c n t ----- ----- ------ ------ ------
1.75 0.297 0.000 0.000 0.000 2.00 0.250 0.031 0.121 0.121 2.25 0.210 0.130 0.509 0.630 2.50 0.177 1.080 4.228 4.859 2.75 0.149 4.222 16.530 21.389 3.00 0.125 9.570 37.469 58.858 3.25 0.105 7.062 27.650 86.508 3.50 0.088 2.370 9.279 95.787 3.75 0.074 0.861 3.371 99.158 4.00 0.063 0.215 0.842 100.000 4.25 0.053 0.000 0.000 100.000 4.50 0.044 0.000 0.000 100.000 4.75 0.037 0.000 0.000 100.000 5.00 0.031 0.000 0.000 100.000 5.25 0.026 0.000 0.000 100.000 5.50 0.022 0.000 0.000 100.000 5.75 0.019 0.000 0.000 100.000 6.00 0.016 0.000 0.000 100.000
Standard S t a t i s t i c s : Median Mean Dev. Skew Kurt
Method of Moments (PHI) Folk Graphic Measures (PHI) Grain S i z e (mm)
Sample Content by Weiqht Pe rcen t :
L o c a l i t y Sample Date P r o f i l e Ana lys i s Date Analyz 3 9 6217315 850214 860604 LSC
x p o s i t i o n : 3300.00 Y P o s i t i o n : 1954.11
Eleva t ion of Top of Core : -20.60 Length of Core 0.00 Depth t o Top of Sample : 0.00 Depth t o Bottom of Sample :
Comments :
S t a r t w e i g h t : 24.330 f i n a l w e i g h t : 24.291 Devia t ion : 0.160%
Gravel Sand S i l t Clay c o a r s e medium f i n e
PHI MM Weight Pe rcn t Cumul Pe rcn t ----- ----- ------ ------ ------
-2.756.727 0.000 0.000 0.000 -2.50 5.(,57 0.000 0.000 0.000 -2.25 4.757 0.000 0.000 0.000 -2.004.000 0.000 0.000 0.000 -1.75 3.364 0.000 0.000 0.000 -1.50 2.828 0.000 0.000 0.000 -1.25 2.378 0.051 0.210 0.210 -1.00 2.000 0.000 0.000 0.210 -0.75 1.682 0.000 0.000 0.210 -0.50 1.414 0.000 0.000 0.210 -0.251.189 0.000 0.000 0.210 0.00 1.000 0.000 0.000 0.210 0.25 0.841 0.000 0.000 0.210 0.50 0.707 0.000 0.000 0.210 0.75 0.595 0.000 0.000 0.210 1.00 0.500 0.000 0.000 0.210 1.25 0.420 0.000 0.000 0.210 1.50 0.354 0.000 0.000 0.210
W e n t w o r t h C l a s s i f i c a t i o n 0.210 0.000 0.119 99.671 0.000 0.000 Unif ied C l a s s i f i c a t i o n 0.000 0.210 0.000 96.600 3.190 0.000
PHI MM Weight Pe rcn t Cumul Pe rcn t ----- ----- ------ ------ ------
1.750.297 0.000 0.000 0.210 2.00 0.250 0.029 0.119 0.329 2.25 0.210 0.090 0.371 0.700 2.500.177 0.491 2.021 2.721 2.75 0.149 2.310 9.510 12.231 3.00 0.125 7.270 29.929 42.160 3.25 0.105 8.536 35.141 77.300 3.50 0.088 3.180 13.091 90.392 3.75 0.074 1.559 6.418 96.810 4.00 0.063 0.775 3.190 100.000 4.25 0.053 0.000 0.000 100.000 4.50 0.044 0.000 0.000 100.000 4.75 0.037 0.000 0.000 100.000 5.00 0.031 0.000 0.000 100.000 5.25 0.026 0.000 0.000 100.000 5.50 0.022 0.000 0.000100.000 5.75 0.019 0.000 0.000 100.000 6.00 0.016 0.000 0.000 100.000
Standard S t a t i s t i c s : Median Mean Dev. Skew Kurt
Method o f Moments (PHI) 3.06 0.37 -3.28 43.25 Folk Graphic Measures (PHI) 3.06 3.07 0.32 0.10 1.22 Grain s i z e (mm) 0.12 0.12

L o c a l i t y Type Sample Date P r o f i l e Ana lys i s Date Analyz 39 G 6217316 850214 860604 LSC
X P o s i t i o n : 3300.00 Y p o s i t i o n : 2450.24
Eleva t ion of Top of Core : -23.66 Length of Core 0.00 Depth t o Top of Sample : 0.00 Depth t o Bottom of Sample :
Comments :
S t a r t Weight : 34.670 Fina l Weight : 34.620 Devia t ion : 0.144 %
PHI M3 Weight Percnt Cumul Percnt ----- ----- ------ ------ ------
PHI MM Weiqht Pe rcn t Cumul Pe rcn t ----- ----- ------ ------ ------
Sample Content by Weiqht Percent :
Gravel Sand s i l t Clay c o a r s e medium f i n e
W e n t w o r t h C l a s s i f i c a t i o n 0.000 0.000 0.000 100.000 0.000 0.000 Unif ied C l a s s i f i c a t i o n 0.000 0.000 0.000 95.529 4.471 0.000
Standa rd S t a t i s t i c s : Median Mean Dev. Skew K u r t
Method o f Moments (PHI) Folk Graphic Measures (PHI) Grain s i z e (mm)
Sample Date P r o f i l e Ana lys i s Date Analyz 3 9 6217317 850214 860604 LSC
X P o s i t i o n : 3300.00 Y P o s i t i o n : 2939.35
Eleva t ion of TOP of c o r e : -26.37 Length of Core 0.00 Depth t o Top of Sample : 0.00 Depth t o f3ottom of Sample :
Comments :
S t a r t Weight : 31.300 F i n a l Weiqht : 31.221 Deviat ion : 0.252 %
PHI Weiqht Pe rcn t cumu1 Percnt
PHI MM Weight P e r c n t Cumul Pe rcn t ------ ------
0.000 0.000 0.000 0.000 0.221 0.221 1.380 1.601 8.331 9.932
27.799 37.731 33.029 70.760 14.449 85.209 9.061 94.270 5.730 100.000 0.000 100.000 0.000 100.000
Sample Content by Weight Percent :
Gravel Sand S i l t Clay c o a r s e medium f i n e
Wentworth C l a s s i f i c a t i o n 0.000 0.000 0.000 100.000 0.000 0.000 Unif ied C l a s s i f i c a t i o n 0.000 0.000 0.000 94.270 5.730 0.000
Standard S t a t i s t i c s : Median Mean Dev. Skew Kurt
Method of Moments (PHI) Folk Graphic Measures (PHI) Grain S i z e (mm)

Locality Type Sample Date profile Analysis Date Analyz 3 9 G 6217403 850301 860528 SGU
X Position : 3300.00 Y Position : 228.72
Elevation of Top of Core : 12.83 Length of Core 0.00 ~epth to TOP of Sample : 0.00 mpth to Bottom of Sample :
Comments :
Start Weight : 50.310 Final Height : 50.270 Deviation : 0.080 %
PHI MI4 Weight Percnt cumu1 Percnt ------ 0.000 0.000 0.000 0.000 0.179 0.179 0.599 1.969 4.440 11.001 18.440 24.941 32.160 38.070 43.561 50.881 56.990 63.670
PHI MH Weight Percnt
------ 10.380 11.070 8.490 4.440 1.450 0.440 0.060 0.000 0.000 0.000 0.000 0.000 0.000 0.000 0.000 0.000 0.000 0.000
cumu1 Percnt
Sample Content by Weight Percent :
Gravel Sand Silt Clay coarse medium fine
Wentworth Classification 1.969 48.912 34.239 14.880 0.000 0.000 Unified Classification 0.000 1.969 55.021 43.010 0.000 0.000
Standard Statistics : Median Mean Dev. Skew Kurt
Method of Moments (PHI) ~ o l k Graphic Measures (PHI) Grain size (mm)
Locality Type Sample Date Profile Analysis Date Analyz 39 G 6217404 850301 860528 SGU
x Position : 3300.00 Y Position : 257.38
Elevation of Top of Core : Length of Core Depth to Top of Sample : Depth to Bottom of Sample :
Comments :
Start Weight : 48.610 Final Weight : 48.469 Deviation : 0.290 %
PHI FPl Weight
------ Percnt
------ Cumul Percnt ------ 0.000 0.000 0.000 0.000 0.000 0.000 0.000 0.309 1.030 2.600 4.190 6.051 9.022 12.261 16.551 25.150 33.419 43.490
PHI HM Weight Percnt
------ 17.081 19.480 10.931 6.309 2.129 0.520 0.060 0.000 0.000 0.000 0.000 0.000 0.000 0.000 0.000 0.000 0.000 0.000
cumu1 Percnt ------ 60.571 80.051 90.982 97.291 99.420 99.940 100.000 100.000 100.000 100.000 100.000 100.000 100.000 100.000 100.000 100.000 100.000 100.000
Sample Content by Weight Percent :
Gravel Sand Silt Clay coarse medium fine
Wentworth Classification 0.309 24.841 54.901 19.949 0.000 0.000 Enifled Classification 0.000 0.309 33.110 66.581 0.000 0.000
Standard Statistics : Median Mean Dev. Skew Kurt
Method of Moments (PHI) 1.42 0.75 -0.94 3.67 Folk Graphic Measures (PHI) 1.60 1.47 0.73 -0.32 1.11 Grarn size (mm) 0.33 0.37
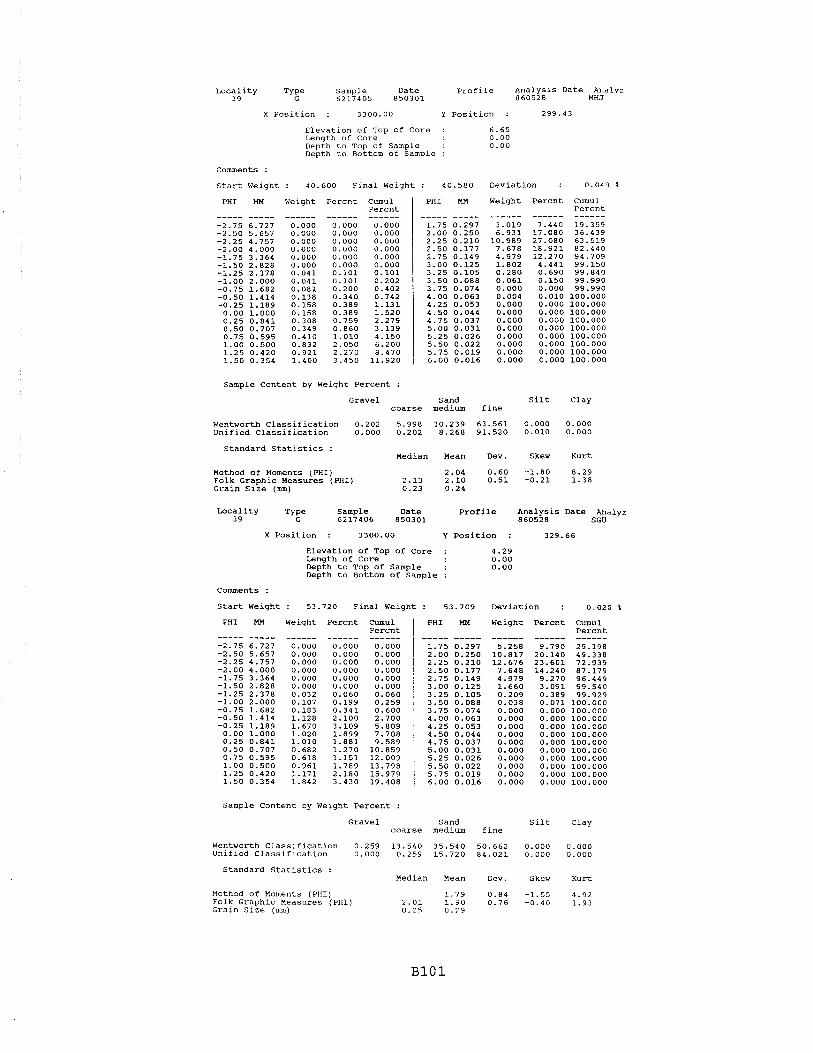
L o c a l i t y Type Sample Date p r o f i l e Analysis Date Analyz 3 9 G 6217405 850301 860528 MHJ
X P o s i t i o n : 3300.00 Y P o s i t i o n : 299.43
Eleva t ion of Top of Core : 6.65 Length of Core 0.00 Depth t o Top of Sample : 0.00 0epth t o Bottom of Sample :
Comments :
S t a r t Weight : 40.600 Fina l Weight : 40.580 Deviat ion : 0.049 %
PHI HN Weight Pe rcn t Cumul Percnt
PHI MM Weight Pe rcn t Cumul Pe rcn t ----- ----- ------ ------ ------
Sample Content by Weight Percent :
Gravel Sand S i l t Clay c o a r s e medium f i n e
wentworth C l a s s i f i c a t i o n 0.202 5.998 30.239 63.561 0.000 0.000 Unif ied C l a s s i f i c a t i o n 0.000 0.202 8.268 91.520 0.010 0.000
Standa rd S t a t i s t i c s : Median Mean Dev. Skew Kurt
Method o f Moments (PHI) 2.04 0.60 -1.80 8.29 Folk Graphic Measures (PHI) 2.13 2.10 0.51 -0.21 1.38 Grain site (mm) 0.23 0.24
L o c a l i t y T Sample Date P r o f i l e Ana lys i s Date Analyz 3 9 6217406 850301 860528 SGU
X P o s i t i o n : 3300.00 Y p o s i t i o n : 329.66
Eleva t ion o f Top of Core : 4.29 Length o f Core 0.00 Depth t o Top o f Sample : 0.00 Depth t o Bottom o f Sample :
Comments :
s t a r t w e i g h t : 53.720 F i n a l w e i g h t : 53.709 Devia t ion : 0.020%
PHI Weight Pe rcn t m u 1 Pe rcn t
PHI
----- 1.75 2.00 2.25 2.50 2.75 3.00 3.25 3.50 3.75 4.00 4.25 4.50 4.75 5.00 5.25 5.50 5.75 6.00
Weight Pe rcn t Cumul Pe rcn t
Sample Content by Weight Pe rcen t :
Gravel Sand S i l t Clay c o a r s e medium f i n e
Wentworth C l . a s s i f i ca t ion 0.259 13.540 35.540 50.662 0.000 0.000 Unif ied C1a: ;s i f ica t ion 0.000 0.259 15.720 84.021 0.000 0.000
Standard S t a t i s t i c s : Median Mean Dev. Skew Kurt
Method o f Moments (PHI) Folk Graphic Measures (PHI) Grain S i z e (mm)

sample Content by Weight Percent :
Iacality Type Sample Date Profile Analysis Date Analyz 3 9 G 6217407 850301 860528 LSC
X Position : 3300.00 Y Position : 152.33
Elevation of TOP of Core : -7.45 Length of core 0.00 Depth to Top of Sample : 0.00 Depth to Bottom of Sample :
Comments :
Start Weight : 31.060 Final Weight : 30.990 Deviation : 0.225 %
Gravel Sand Silt Clay coarse medium fine
PHI Mn Weight Percnt Cumul Percnt ----- ----- ------ ------ ------
-2.75 6.727 0.000 0.000 0.000 -2.50 5.657 0.000 0.000 0.000 -2.25 4.757 0.000 0.000 0.000 -2.00 4.000 0.108 0.348 0.348 -1.75 3.364 0.000 0.000 0.348 -1.50 2.828 0.000 0.000 0.348 -1.25 2.378 0.000 0.000 0.348 -1.00 2.000 0.050 0.161 0.510 -0.75 1.682 0.000 0.000 0.510 -0.50 1.414 0.000 0.000 0.510 -0.25 1.189 0.000 0.000 0.510 0.00 1.000 0.031 0.100 0.610 0.25 0.841 0.000 0.000 0.610 0.50 0.707 0.050 0.161 0.771 0.75 0.595 0.059 0.190 0.962 1.00 0.500 0.149 0.481 1.442 1.25 0.420 0.229 0.739 2.181 1.50 0.354 0.350 1.129 3.311
wentvorth Classification 0.510 0.933 12.901 85.657 0.000 0.000 Unlfled Classification 0.000 0.510 1.672 97.780 0.039 0.000
PHI MM Weight Percnt Cumul Percnt ----- ----- ------ ------ ------
1.75 0.297 1.020 3.291 6.602 2.00 0.250 2.399 7.741 14.343 2.25 0.210 5.680 18.328 32.672 2.50 0.177 10.351 33.401 66.073 2.75 0.149 6.179 19.939 86.012 3.00 0.125 3.431 11.071 97.083 3.25 0.105 0.731 2.359 99.442 3.50 0.088 0.130 0.419 99.861 3.75 0.074 0.031 0.100 99.961 4.00 0.063 0.012 0.039 100.000 4.25 0.053 0.000 0.000 100.000 4.50 0.044 0.000 0.000 100.000 4.75 0.037 0.000 0.000 100.000 5.00 0.031 0.000 0.000 100.000 5.25 0.026 0.000 0.000 100.000 5.50 0.022 0.000 0.000 100.000 5.75 0.019 0.000 0.000 100.000 6.00 0.016 0.000 0.000 100.000
Standard Statistics : Median Mean Dev. Skew Kurt
Method of Moments (PHI) 2.34 0.50 -3.44 28.37 Folk Graphic Measures (PHI) 2.38 2.38 0.38 -0.08 1.16 Grain Size (mm) 0.19 0.20
Locality Type Sample Date profile Analysis Date Analyz 3 9 G 6217408 850301 860528 LSC
x Position : 3300.00 Y Position : 603.28
Elevation of Top of Core : -5.37 Length of Core 0.00 mpth to TOP of sample : 0.00 Depth to Bottom of Sample :
Comments :
Startweight: 45.680 Finalweight: 45.670 Deviation : 0.022%
PHI weight Percnt CumUl Percnt ------ 0.000 0.000 0.000 0.000 0.000 0.000 0.000 0.000 0.090 0.269
PHI Weight Percnt Cumul Percnt
Sample Content by Weight Percent :
Gravel Sand Silt clay coarse medium fine
Wentworth Classification 0.000 4.819 23.390 71.791 0.000 0.000 Unified Classification 0.000 0.000 7.099 92.862 0.039 0.000
Standard Statistics : Median Mean Dev. Skew Kurt
Method of Moments (PHI) 2.19 0.59 -1.26 5.95 Folk Graphic Measures (PHI) 2.29 2.24 0.54 -0.22 1.25 Grain size (mm) 0.20 G.22

b c a l i t y Type Sample D a t e P r o f i l e A n a l y s i s D a t e Ana lyz 39 G 6217409 8 5 0 3 0 1 860528 LSC
X P o s i t i o n : 3300 .00 Y P o s i t i o n : 7 4 9 . 6 9
E l e v a t i o n o f Top o f C o r e : - 8 . 1 9 L e n g t h o f C o r e 0 .00 D e p t h t o Top o f S a m p l e : 0 . 0 0 D e p t h t o Bo t tom o f S a m p l e :
Comments :
S t a r t w e i g h t : 3 4 . 1 1 0 F i n a l w e i g h t : 33 .910 D e v i a t i o n : 0 . 5 8 6 %
PHI MU W e i g h t P e r c n t Cumul PHI MU W e i g h t P e r c n t Cumul ~ e r c n t I P e r c n t
S a m p l e C o n t e n t b y W e i g h t P e r c e n t :
G r a v e l S a n d S i l t C l a y c o a r s e medium f i n e
Wentwor th C l a s s i f i c a t i o n 0 . 5 6 0 2 .247 4.482 9 2 . 7 1 0 0 . 0 0 0 0 . 0 0 0 U n i f i e d C l a s s i f i c a t i o n 0 .000 0 . 5 6 0 2 .518 9 6 . 8 0 0 0 . 1 2 1 0 . 0 0 0
S t a n d a r d S t a t i s t i c s : M e d i a n Mean Dev. Skew K u r t
Method o f Moments (PHI) F o l k G r a p h i c M e a s u r e s (PHI) G r a i n S i z e (mm)
L o c a l i t y T y p e s a m p l e D a t e P r o f i l e A n a l y s i s D a t e Ana lyz 3 9 G 6217410 8 5 0 3 0 1 860528 LSC
X P o s i t i o n : 3 3 0 0 . 0 0 Y P o s i t i o n : 8 4 2 . 0 8
E l e v a t i o n o f Top o f C o r e : - 1 0 . 3 5 L e n g t h o f C o r e 0 . 0 0 D e p t h t o Top o f S a m p l e : 0 . 0 0 D e p t h t o Bo t tom o f S a m p l e :
Comments :
S t a r t W e i q h t : 2 5 . 0 4 0 F i n a l W e i g h t : 2 4 . 8 9 1 D e v i a t i o n : 0 . 5 9 5 %
PHI MU W e i g h t P e r c n t Cumul P e r c n t ----- ----- ------ ------ ------
PHI MU W e i q h t P e r c n t Cumul P e r c n t ----- ----- ------ ------ ------
S a m p l e C o n t e n t b y W e i g h t P e r c e n t :
G r a v e l S a n d S i l t C l a y c o a r s e medium f i n e
Wentwor th C l a s s i f i c a t i o n 0 . 0 0 0 5 . 2 9 1 1 5 . 3 1 9 7 9 . 3 9 0 0.000 0 . 0 0 0 U n i f i e d C l a s s i f i c a t i o n 0 . 0 0 0 0 . 0 0 0 6 . 4 6 0 9 3 . 2 9 9 0 . 2 4 1 0 . 0 0 0
S t a n d a r d S t a t i s t i c s : M e d i a n Mean Dev. Skew K u r t
Method o f Moments ( P H I ) 2 .32 0 . 6 7 -1 .57 7 . 1 1 F o l k G r a p h i c M e a s u r e s (PHI) 2 . 4 1 2 . 3 8 0 . 5 9 -0 .20 1 . 4 0 G r a i n s i z e (mm) 0 . 1 9 3 . 2 0

Locality Type Sample Date profile Analysis Date Analyz 3 9 G 6217411 850301 860528 LSC
X Posltion : 3300.00 Y Position : 989.20
Elevation of Top of Core : -12.34 Length of Core 0.00 Depth to Top of Sample : 0.00 Depth to Bottom of Sample :
Comments :
Start Weight : 25.640 Final Weight : 25.478 Deviation : 0.632 %
PHI
----- -2.75 -2.50 -2.25 -2.00 -1.75 -1.50 -1.25 -1.00 -0.75 -0.50 -0.25 0.00 0.25 0.50 0.75 1.00 1.25 1.50
Weiqht
------ Percnt Nmul
Percnt ------ 0.000 0.000 0.000 0.510 1.142 1.142 1.531 1.802 1.802
PHI
----- 1.75 2.00 2.25 2.50 2.75 3.00 3.25 3.50 3.75 4.00 4.25 4.50 4.75 5.00 5.25 5.50 5.75 6.00
Weight Percnt Cumul Percnt
Sample Content by Weight Percent :
Gravel Sand Silt Clay coarse medium fine
Wentworthclassification 1.802 1.770 5.679 90.749 0.000 0.000 Unified Classification 0.000 1.802 2.080 95.659 0.459 0.000
Standard Statistics : Median Mean Dev. Skew Kurt
Method of Moments (PHI) 2.56 0.79 -3.42 18.46 Folk Graphic neasures (PHI) 2.69 2.66 0.47 -0.19 1.27 Grain Size (mm) 0.15 0.17
Sample Content by Weight Percent :
Locality sample Date Profile Analysis Date Analyz 3 9 6217412 850301 860529 LSC
x Position : 3300.00 Y Position : 1220.40
Elevation of Top of core : -13.31 ~ength of core 0.00 Depth to Top of Sample : 0.00 Depth to Bottom of Sample :
Comments :
Start Weight : 22.020 Final Weight : 21.911 Deviation : 0.495 %
Wentworth Classification unified Classification
PHI MM Weight Percnt Cumul Percnt ----- ----- ------ ------ ------
-2.75 6.727 0.000 0.000 0.000 -2.50 5.657 0.000 0.000 0.000 -2.25 4.757 0.000 0.000 0.000 -2.00 4.000 0.000 0.000 0.000 -1.75 3.364 0.000 0.000 0.000 -1.50 2.828 0.000 0.000 0.000 -1.25 2.378 0.039 0.178 0.178 -1.00 2.000 0.000 0.000 0.178 -0.75 1.682 0.000 0.000 0.178 -0.50 1.414 0.000 0.000 0.178 -0.25 1.189 0.000 0.000 0.178 0.00 1.000 0.000 0.000 0.178 0.25 0.841 0.000 0.000 0.178 0.50 0.707 0.000 0.000 0.178 0.75 0.595 0.000 0.000 0.178 1.00 0.500 0.000 0.000 0.178 1.25 0.420 0.000 0.000 0.178 1.50 0.354 0.000 0.000 0.178
Gravel coarse
PHI m Weight Percnt Cumul Percnt ----- ----- ------ ------ ------
1.75 0.297 0.000 0.000 0.178 2.00 0.250 0.110 0.502 0.680 2.25 0.210 0.780 3.560 4.240 2.50 0.177 4.220 19.260 23.500 2.75 0.149 6.963 31.779 55.278 3.00 0.125 6.492 29.629 84.907 3.25 0.105 2.500 11.410 96.317 3.50 0.088 0.570 2.601 98.918 3.75 0.074 0.180 0.822 99.740 4.00 0.063 0.057 0.260 100.000 4.25 0.053 0.000 0.000 100.000 4.50 0.044 0.000 0.000 100.000 4.75 0.037 0.000 0.000 100.000 5.00 0.031 0.000 0.000 100.000 5.25 0.026 0.000 0.000 100.000 5.50 0.022 0.000 0.000 100.000 5.75 0.019 0.000 0.000 100.000 6.00 0.016 0.000 0.000 100.000
Standard Statistics : Median
Method of Moments (PHI) Folk Graphic Measures (PHI) 2.71 Grain Size (mm) 0.15
Sand Silt Clay medium fine
Mean Dev. Skew Kurt

Locality Type Sample Date Profile ~nalysis Date Analyz 39 G 6217413 850301 860529 LSC
X Position : 3300.00 Y Position : 1487.11
Elevation of Top of Core : -15.56 Length of Core 0.00 Depth to Top of Sample : 0.00 Depth to Bottom of Sample :
Comments :
start Weight : 23.240 Final Weight : 23.100 Deviation : 0.602 9.
PHI MM Weight Percnt CumUl Percnt
PHI HM Weight Percnt Cumul Percnt ----- ----- ------ ------ ------
1.75 0.297 0.000 0.000 0.000 2.00 0.250 0.081 0.351 0.351
Sample Content by Weight Percent :
Gravel Sand Silt Clay coarse medium fine
Wentworth Classification 0.000 0.000 0.351 99.649 0.000 0.000 Unified Classification 0.000 0.000 0.000 99.688 0.312 0.000
Standard Statistics : Median Mean Dev. Skew Kurt
Method of Moments (PHI) Folk Graphic Measures (PHI) Grain size (Dm)
Locality Te Sample Date Profile Analysis Date Analyz 3 9 6217414 850301 860529 LSC
X Position : 3300.00 Y Position : 1706.37
Elevation of Top of Core : -18.09 Length of Core 0.00 Depth to Top of Sample : 0.00 Depth to Bottom of Sample :
Comments :
start Weight : 23.750 Final Weight : 23.639 Deviation : 0.467 %
PHI MM Weight Percnt Cumul Percnt ----- ----- ------ ------ ------
PHI MM Weight Percnt Cumul Percnt ----- ----- ------ ------ ------
Sample Content by Weight Percent :
Gravel Sand Silt Clay coarse medium fine
Wentworth Classification 0.000 0.000 0.000 100.000 0.000 0.000 Unified Classification 0.000 0.000 0.000 99.509 0.491 0.000
Standard Statistics : Median Mean Dev. Skew Kurt
Method of Moments (PHI) 2.92 0.26 0.37 3.88 Folk Graphic Measures (PHI) 2.91 2.92 0.26 0.08 1.11 Grain size (mm) 0.13 0.13
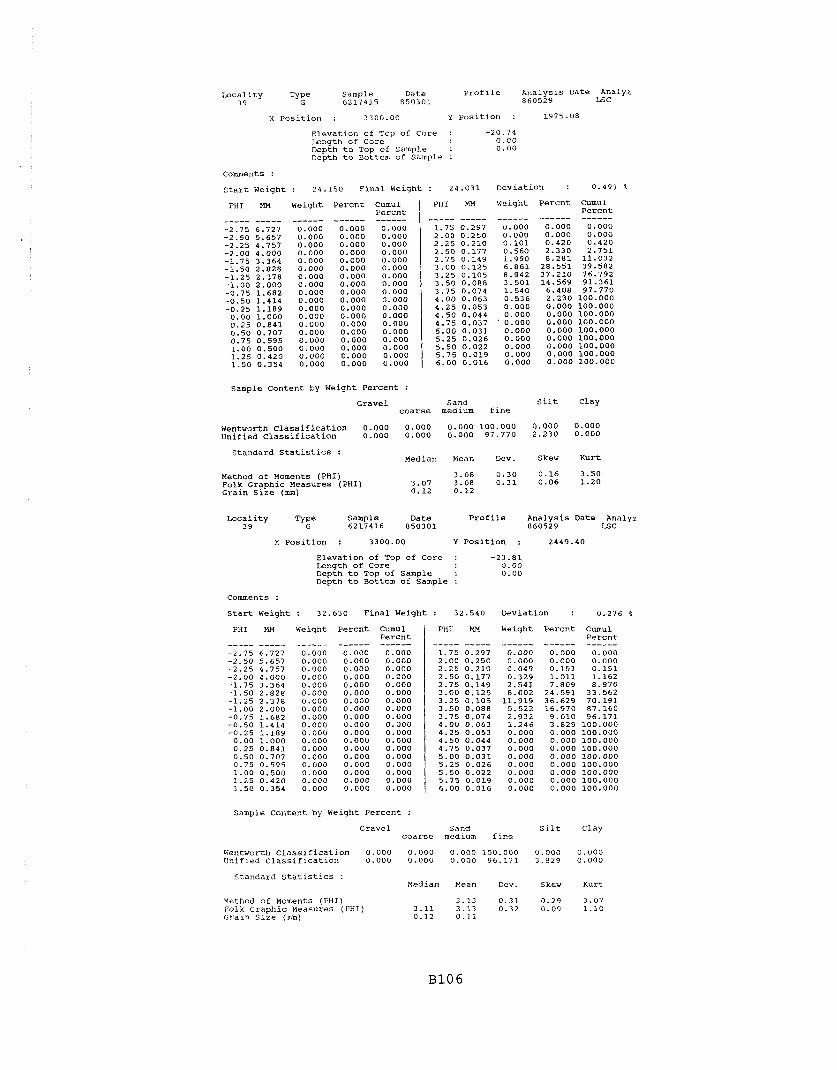
Loca l i t y Type Sample Date P r o f i l e Ana lys i s Date Analyz 3 9 G 860529 6217415 850301 LSC
X P o s i t i o n : 3300.00 y p o s i t i o n : 1975.08
Eleva t ion of Top of Core : -20.74 Length of Core 0.00 Depth t o Top of Sample : 0.00 Depth t o Bottom of Sample :
Comments :
S t a r t Weight : 24.150 F i n a l Weight : 24.031 Deviat ion : 0.493 %
PHI MM Weight Pe rcn t Cumul PHI Kt4 It'eight P e r c n t Cumul ~ e r c n t 1 Pe rcn t
Sample Content by Weight Percent :
Gravel Sand S i l t Clay c o a r s e medium f i n e
Wentworth C l a s s i f i c a t i o n 0.000 0.000 0.000 100.000 0.000 0.000 Unif ied c l a s s i f i c a t i o n 0.000 0.000 0.000 97.770 2.230 0.000
Standard S t a t i s t i c s : Median Mean Dev. Skew Kurt
Method o f Moments (PHI) 3.08 0.30 0.16 3.50 Folk Graphic Measures (PHI) 3.07 3.08 0.31 0.06 1.20 Grain S i z e (mm) 0.12 0.12
L o c a l i t y Sample h t e P r o f i l e Ana lys i s Date Analyz 39 6217416 850301 860529 LSC
X P o s i t i o n : 3300.00 Y P o s i t i o n : 2449.40
Eleva t ion o f Top of Core : -23.81 Length of Core 0.00 Depth t o Top of Sample : 0.00 Depth t o Bottom of Sample :
Comments :
s t a r t Weight : 32.630 F i n a l Weight : 32.540 Deviat ion : 0.276 %
PHI MM Weight Pe rcn t Cumul Pe rcn t ----- ----- ------ ------ ------
PHI MM Weight P e r c n t Cumul Pe rcn t ----- ----- ------ ------ ------
Sample c o n t e n t by Weight Pe rcen t :
Gravel Sand S i l t Clay c o a r s e medium f i n e
W e n t w o r t h ~ l a s s i f i c a t i o n 0.000 0.000 0.000 100.000 0.000 0.000 Unif ied C l a s s i f i c a t i o n 0.000 0.000 0.000 96.171 3.829 0.000
Standard S t a t i s t i c s : Median Mean Dev. Skew Kurt
Method of Moments (PHI) 3.13 0.31 0.29 3.07 Folk Graphic Measures (PHI) 3.11 3.13 0.32 0.09 1.10 Grain S i z e (mm) 0.12 0.li

Locality Type Sample Date Profile Analysis Date knalyz 3 9 G 6217417 850301 860529 LSC
X Position : 3300.00 Y Position : 2942.52
Elevation of Top of core : -26.48 J.,ength of Core 0.00 Depth to Top of Sample : 0.00 Depth to Bottom of Sample :
Comments :
Start Weight : 32.040 Final Weight : 31.870 Deviation : 0.531 8
PHI
----- -2.75 -2.50 -2.25 -2.00 -1.75 -1.50 -1.25 -1.00 -0.75 -0.50 -0.25 0.00 0.25 0.50 0.75 1.00 1.25 1.50
Weight Percnt CumUl Percnt
PHI MM Weight Percnt Cumul Percnt ----- ------ ------ ------
Sample Content by Weight Percent :
Gravel Sand silt Clay coarse medium fine
Wentworth Classification 0.000 0.000 0.000 100.000 0.000 0.000 Unified Classification 0.000 0.000 0.000 95.861 4.139 0.000
Standard Statistics : Median Mean Dev. Skew Kurt
Method of Moments (PHI) Folk Graphic Measures (PHI) Grain Size (mm)
Locality Type sample Date Profile Analysis Date Analyz 39 G 6217503 850315 860612 LSC
X Position : 3300.00 Y Position : 227.60
Elevation of Top of Core : 12.25 Length of Core 0.00 Depth to Top of Sample : 0.00 Depth to Bottom of Sample :
Comments :
Start Weight 200 Final Weight
Percnt Cumul Percnt ------ ------
0.000 0.000 0.000 0.000 0.000 0.000 0.000 0.000 0.000 0.000 0.000 0.000 0.190 0.190 0.981 1.171 3.119 4.290 12.140 16.431 16.730 33.161 14.209 47.370 13.950 61.320
Deviation :
PHI HM Weight PHI MI4 Weight Percnt cumu1 Percnt
Sample Content by Weight Percent :
Gravel Sand Silt Clay coarse medium fine
Wentworth Classification 1.171 76.018 13.571 9.239 0.000 0.000 Unified Classification 0.000 1.171 78.198 20.621 0.009 0.000
Standard Statistics : Median Mean Dev. Skew Kurt
Method of Moments (PHI) Folk Graphic Measures (PHI) Grain Size (mm)

Loca l i t y Type Sample Date p r o f i l e Ana lys i s Date Analyz 3 9 G 6217504 850315 860612 LSC
x Pos i t i on : 3300 .00 Y P o s i t i o n : 262 .00
Eleva t ion of Top of Core : Length o f Core Depth t o Top o f Sample : Depth t o Bottom of Sample :
Comments :
S t a r t Weight : 29 .730 F i n a l Weiqht : 29.659 Deviat ion : 0.239 %
PHI Mn Weight Pe rcn t Cumul Pe rcn t ----- ----- ------ ------ ------
PHI Mn Weight Pe rcn t Cumul Pe rcn t
Sample c o n t e n t by Weight Pe rcen t :
Gravel Sand S i l t Clay c o a r s e medium f i n e
Wentworth C l a s s i f i c a t i o n 0.169 35.922 44.792 19 .117 0.000 0.000 Unif ied C l a s s i f i c a t i o n 0.000 0 .169 43.201 56 .630 0.000 0 . 0 0 0
Standard S t a t i s t i c s : Median Wean Dev. Skew Kurt
Method of Moments (PHI) 1.27 0.80 -0.44 2.35 F o l k Graphic Measures (PHI) 1.44 1 . 2 9 0.82 -0.26 0.83 Grain S i z e (mm) 0.37 0 . 4 1
Loca l i t y Type Sample Date p r o f i l e Ana lys i s Date Analyz 3 9 G 6217505 8 5 0 3 1 5 860613 L S C
x P o s i t i o n : 3300 .00 Y P o s i t i o n : 300 .00
Eleva t ion of Top o f Core : Length of Core Depth t o Top of Sample : Depth t o Bottom of Sample :
Comments : SAND HAS PINKISH TINT (Fe OXIDATION I N OVEN ? )
S t a r t Weiqht
PHI Mn
: 54 .630 F i n a l Weight
Weight Pe rcn t Cumul Pe rcn t ------ ------ ------
0 .000 0.000 0 . 0 0 0 0 . 0 0 0 0 . 0 0 0 0.000
PHI MM
Deviat ion : 0.016
Weight Pe rcn t Cumul P e r c n t
sample c o n t e n t by Weight Pe rcen t :
Gravel Sand S i l t Clay c o a r s e medium f i n e
V.entworth C l a s s i f i c a t i o n 3 . 1 7 0 1 0 . 8 4 2 43 .070 42 .918 0 . 0 0 0 0 . 0 0 0 Zni f i ed Classification 0 . 0 0 0 3 . 1 7 0 14.962 81 .859 0 . 0 0 9 0 . 0 0 0
s t anda rd S t a t i s t i c s : Median Mean Dev. Skew K u r t
Yethod of Moments (PHI1 1 .69 0 .92 - 2 . 0 5 7 . 7 8 ~ o l k Graphlc Measuies ? P H I ) 1 . 9 1 1 . 8 0 0 .77 - 0 . 3 9 1 . 7 6 c r a l n Size (mx) 0 . 2 7 0 . 3 1

L o c a l l t y Type Sample D a t e P r o f i l e A n a l y s i s Date Analyz 39 G 6217506 850315 860613 LSC
x P o s l t l o n : 3300.00 Y P o s i t i o n : 337 .20
E l e v a t i o n o f Top o f Core : Length o f Core Depth t o Top o f Sample : Depth t o Bottom o f Sample :
Comments :
S t a r t Weight : 56.190 F i n a l Weight : 56 .092 D e v i a t i o n : 0.17G %
PHI MM Weight P e r c n t Cumu 1 P e r c n t ------
PHI
----- 1 .75 2.00 2 . 2 5 2.50 2 . 7 5 3.00 3.25 3 . 5 0 3 . 7 5 4 . 0 0 4.25 4 . 5 0 4 . 7 5 5.00 5.25 5.50 5 .75 6 .00
Weight P e r c n t Cumul P e r c n t
s a m p l e c o n t e n t by Weight P e r c e n t :
G r a v e l Sand silt Clay c o a r s e medium f i n e
Wentworth C l a s s i f i c a t i o n 0 .200 29.780 46 .770 23 .251 0 .000 0 .000 U n i f i e d C l a s s i f i c a t i o n 0 .000 0 .200 38 .410 61.380 0 . 0 1 1 0 . 0 0 0
s t a n d a r d S t a t i s t i c s : Median Mean Dev. Skew K u r t
Method o f Moments (PHI) F o l k G r a p h i c Measures (PHI) G r a i n s i z e (mm)
sample D a t e p r o f i l e A n a l y s i s Date Analyz 39 6217507 8 5 0 3 1 5 860616 LSC
x P o s i t i o n : 3300 .00 Y P o s i t i o n : 459 .60
E l e v a t i o n o f Top o f C o r e : -7.27 Length o f Core 0 .00 Depth t o Top o f Sample : 0 . 0 0 Depth t o Bottom o f Sample :
Comments :
s t a r t Weight : 29.530 F i n a l Weight : 29.543 D e v i a t i o n : 0.044 %
PHI MM Weight P e r c n t Cumul P e r c n t ----- ----- ------ ------ ------
-2.75 6.727 0 . 0 0 0 0 .000 0 . 0 0 0 -2.50 5 . 6 5 7 0 . 0 0 0 0 .000 0.000 -2.25 4 . 7 5 7 0 .000 0 .000 0 . 0 0 0
PHI Nn Weight P e r c n t Cumul P e r c n t ----- ------ ------ ------
1 .75 0 .297 2 . 0 2 1 6 . 8 4 1 12.825 2 .00 0 . 2 5 0 3 .282 11 .109 23.935 2 .25 0 .210 5.542 18 .759 42.694
Sample C o n t e n t by Weight P e r c e n t :
G r a v e l s a n d S i l t Clay c o a r s e medium f i n e
Wentworth C l a s s i f i c a t i o n 0 .203 1 .692 22 .039 7 6 . 0 6 5 0 .000 0.000 U n i f i e d C l a s s i f i c . % t i o n 0 .000 0 .203 2 .603 97 .174 0 .020 0.000
S t a n d a r d Statistics : Median Mean Dev. Skew Kur t
Method o f Moments (PHI) 2 .24 0 .49 -1 .58 10.02 Folk G r a p h i c Measures (PHI) 2 . 3 1 2 .27 0.44 -0 .16 1 . 2 2 G r a i n S l z e (nm) 0 .20 0 . 2 1

lacality Type Sample Date Profile Analysis Date Analyz 39 G 6217508 850315 860616 LSC
x Position : 3300 .00 Y Position : 590 .30
Elevation of Top of Core : -6 .48 Length of Core 0 . 0 0 ~epth to Top of Sample : 0 .00 Depth to Bottom of Sample :
Comments :
: 23 .100 Final Weight : 23 .041 Deviation : 0.255 % Start Weight
Weight Percnt Cumul Percnt
PHI
----- 1.75 2.00 2.25 2.50 2.75 3.00 3 .25 3.50 3.75 4.00 4.25 4.50 4 .75 5.00 5 .25 5.50 5.75 6.00
Weight Percnt Cumul Percnt
PHI MM
Sample Content by Weight Percent :
Gravel Sand Silt Clay coarse medium fine
Wentworth Classification 0.000 5 .894 29 .252 64.854 0.000 0 .000 Unified Classification 0 . 0 0 0 0 . 0 0 0 8 .454 9 1 . 4 8 5 0 . 0 6 1 0.000
Standard Statistics : ~edian Mean Dev. Skew Kurt
Method of Moments (PHI) 2.18 0.66 -0.83 3.99 Folk Graphic Measures (PHI) 2.26 2.22 0.65 -0.17 1.02 Grain Size (mm) 0.21 0.22
Sample Date Ty? 6217509 8 5 0 3 1 5
Profile Analysis Date Analyz 3 9 860616 LSC
X Position : 3300.00 Y Position : 749 .50
Elevation of Top of Core : -7 .36 Length of Core 0.00 Depth to Top of Sample : 0 . 0 0 Depth to Bottom of Sample :
Comments :
Start Weight : 26.500 Final Weight : 2 6 . 3 9 1 Deviation : 0 . 4 1 1 %
PHI MM Weight Percnt Cumul PHI MM Weight Percnt Cumul ~ercnt 1 Percnt ----- ----- ------ ------ ------ ----- ----- ------ ------ ------
Sample Content by Weight Percent :
Gravel Sand Silt Clay coarse medium fine
Wentworth Classification 0 . 4 2 1 0 .868 17 .593 81.119 0 .000 0.000 Unified Classification 0 . 0 0 0 0 . 4 2 1 1 . 6 2 9 9 7 . 9 0 1 0 . 0 4 9 0 .000
Standard Statistics : Median Mean Dev. Skew Kurt
Method of Moments (PHI) Folk Graphic Measures (PHI) Grain Size (mm)

L o c a l i t y Type Sample Date P r o f i l e Analysis Date Analyz 39 G 6217510 850315 860616 LS C
X P o s i t i o n : 3300.00 Y P o s i t i o n : 841.60
Eleva t ion of Top of Core : -10.49 Length o f Core 0.00 Depth t o Top o f Sample : 0.00 Depth t o Bottom o f Sample :
Comments : CONCENTRATION OF HEAVIES I N 3.75.4.00 PHI SIEVES
S t a r t Weight : 23.520 F i n a l Weight : 23.490 Deviat ion : 0.128 %
PHI MM Weight Pe rcn t Cumul PHI KM Weight Percnt Cumul Pe rcn t I Percn t
Sample Content by Weight Pe rcen t :
Gravel Sand S i l t Clay c o a r s e medium f i n e
Wentworth C l a s s i f i c a t i o n 0.260 2.252 5.109 92.380 0.000 0.000 Unif ied C l a s s i f i c a t i o n 0.000 0.260 2.593 96.777 0.370 0.000
Standa rd S t a t i s t i c s : Median Mean Dev. Skew Kurt
Method o f Moments (PHI) 2.63 0.58 -2.36 13.41 Folk Graphic measures (PHI) 2.70 2.69 0.44 -0.11 1.19 Grain s i z e (mm) 0.15 0.16
L o c a l i t y Type Sample Date P r o f i l e Analysis Date Analyz 3 9 G 6217511 850315 860616 LSC
X P o s i t i o n : 3300.00 Y P o s i t i o n : 985.30
Eleva t ion o f Top o f Core : -12.37 Length o f Core 0.00 Depth t o Top o f Sample : 0.00 Depth t o Bottom o f Sample :
Comments :
S t a r t Weight : 20.500 F i n a l Weight : 20.461 Deviat ion : 0.190 %
PHI MM Weight P e r c n t Cumul P e r c n t ----- ----- ------ ------ ------
PHI MM Weight Pe rcn t Cumul Pe rcn t ----- ----- ------ ------ ------
Sample Content by Weight Pe rcen t :
Gravel Sand S i l t Clay c o a r s e medium f i n e
W e n t w o r t h c l a s s i f i c a t i o n 1.618 1.056 2.248 95.078 0.000 0.000 Unif ied C l a s s i f i c a t i o n 0.000 1.618 1.207 96.594 0.582 0.000
Standa rd S t a t i s t i c s :
Method o f Moments (PHI) Folk Graphic Measures (PHI) Grain S i z e (mm)
Median Mean Dev. Skew Kurt
2.66 0.70 -3.93 23.26 2.75 2.74 0.38 -0.08 1.22 0.15 0.16

Laca l l t y Type Sample Date P r o f i l e Ana lys l s Date Analyz 3 9 G 6217512 850315 860616 LSC
x ~ o s l t i o n : 3300.00 Y P o s i t i o n : 1235.00
Eleva t ion of Top of Core : -13.4 5 Length of Core 0.00 Depth t o Top of Sample : 0.00 Depth t o Bottom o f Sample :
Comments :
S t a r t Weight : 35.780 F i n a l Weight : 35.650 Deviat ion : 0.363 %
PHI MM Weight Pe rcn t Cumul Pe rcn t ----- ----- ------ ------ ------
PHI m Weight Pe rcn t Cumul Pe rcn t ----- ----- ------ ------ ------
Sample Content by Weight Pe rcen t :
ioo. ooo 100.000 100.000 100.000 100.000 100.000 100.000
Gravel sand S i l t Clay c o a r s e medium f i n e
W e n t w o r t h c l a s s i f i c a t i o n 0.000 0.000 0.390 99.610 0.000 0.000 Unif ied C l a s s i f i c a t i o n 0.000 0.000 0.000 99.781 0.219 0.000
Standard S t a t i s t i c s : Median Mean Dev. Skew Kurt
Method of Moments (PHI) Folk Graphic Measures (PHI) Grain S i z e (mm)
m a l i t y Type Sample o a t e p r o f i l e Ana lys i s Date Analyz 3 9 G 6217513 850315 860616 LSC
X P o s i t i o n : 3300.00 Y P o s i t i o n : 1474.20
Eleva t ion of Top o f c o r e : -15.49 Length of Core 0.00 Depth t o Top of Sample : 0.00 Depth t o Bottom o f Sample :
Comments :
S t a r t Weight : 25.900 Fina l Weight : 25.761 Deviat ion : 0.537 %
PHI MH Weight Pe rcn t Cumul Pe rcn t ----- ----- ------ ------ ------
Sample c o n t e n t by Weight Pe rcen t :
PHI MM Weight P e r c n t Cumul Pe rcn t ----- ----- ------ ------ ------
Gravel Sand S i l t Clay c o a r s e medium f i n e
W e n t w o r t h c l a s s i f i c a t i o n 0.000 0.000 0.889 99.111 0.000 0.000 Unif ied C l a s s i f i c a t i o n 0.000 0.000 0.000 99.798 0.202 0.000
Standard S t a t i s t i c s : Median Mean Dev. Skew Kurt
Method of Moments (PHI) 2 . 6 6 0.31 0.42 3.50 Folk Graphic Measures (PHI) 2 . 6 4 2.65 0.31 0.08 0.97 Grain S i z e (mm) 0.16 0.16

Locality Type Sample Date Profile Analysis Date Analyz 3 9 G 6217514 850315 860616 LSC
X Position : 3300.00 Y Position : 1727.10
Elevation of Top of Core : -18.35 Length of Core 0.00 Depth to Top of Sample : 0.00 Depth to Bottom of Sample :
Comments :
Start Weight
PHI MH
: 24.810 Final Weight
Weiqht Percnt Cumul Percnt ------ ------ ------
0.000 0.000 0.000 0.000 0.000 0.000 0.000 0.000 0.000 0.000 0.000 0.000 0.000 0.000 0.000 0.000 0.000 0.000 0.000 0.000 0.000 0.000 0.000 0.000 0.000 0.000 0.000 0.000 0.000 0.000 0.000 0.000 0.000 0.000 0.000 0.000 0.000 0.000 0.000 0.000 0.000 0.000 0.000 0.000 0.000 0.000 0.000 0.000 0.000 0.000 0.000 0.000 0.000 0.000
PHI m Deviation : 0.399 %
Weight Percnt Cumul Percnt ------ ------ ------
0.000 0.000 0.000 0.000 0.000 0.000 0.151 0 . 6 1 1 0.611 1.300 5.261 5.872 7.030 28.449 34.321 9 . 7 0 1 39.258 73.579 4.739 19.178 92.756 1.231 4.982 97.738 0.450 1 .821 99.559 0.109 0.441 100.000 0.000 0.000 100.000 0.000 0.000 100.000 0.000 0.000 100.000 0.000 0.000 100.000 0.000 0.000 100.000 0.000 0.000 100.000 0.000 0.000 100.000 0.000 0.000 100.000
Sample Content by Weight Percent :
Gravel Sand Silt Clay coarse medium fine
Wentworth Classification 0.000 0.000 0.000 100.000 0.000 0.000 Unified Classification 0.000 0.000 0.000 99.559 0 .441 0.000
Standard Statistics : Median Mean Dev. Skew Kurt
Method of Moments (PHI) Folk Graphic Measures (PHI) Grain Size (mm)
Locality Type Sample Date Profile Analysis Date Analyz 3 9 G 6217515 850315 860616 LSC
X Position : 3300.00 Y Position : 1977.20
Elevation of Top of Core : -20.65 Length of Core 0.00 Depth to Top of Sample : 0.00 Depth to Bottom of Sample :
Comments :
Start Weight : 36.560 Final Weight : 36.450 Deviation : 0.301 %
PHI HH Weiqht Percnt Cumul Percnt ----- ----- ------ ------ ------
PHI MM Weight Percnt Cumul Percnt
Sample Content by Weight Percent :
Gravel Sand Silt Clay coarse medium fine
Wentworth Classification 0.000 0.000 0.000 100.000 0.000 0.000 Unified Classification 0.000 0.000 0.000 98.840 1.160 0.000
Standard Statistics : Median Mean ~ e v . Skew Kurt
Method of Moments (PHI) Folk Graphic Measures (PHI) Grain Size (mm)

Locality Type Sample Date Profile Analysis Date Analyz 3 9 G 6217516 850315 860616 LSC
X Position : 3300.00 Y Position : 2431.90
Elevation of Top of Core : -23.61 Mngth of core 0.00 Depth to Top of Sample : 0.00 Depth to Bottom of Sample :
Comments :
Start Weight
PHI MM
: 20.890 Final Weight Deviation : 0.278 %
Weight Percnt Cumul Percnt ------ ------ ------
0.000 0.000 0.000 0.000 0.000 0.000 0.040 0.192 0.192 0.240 1.152 1.344 1.421 6.821 8.165 6.199 29.757 37.922 8.070 38.738 76.661 2.950 14.161 90.822 1.429 6.860 97.681 0.483 2.319 100.000 0.000 0.000 100.000 0.000 0.000 100.000 0.000 0.000 100.000 0.000 0.000 100.000 0.000 0.000 100.000 0.000 0.000 100.000 0.000 0.000 100.000 0.000 0.000 100.000
Weight Percnt Cumul Percnt 1 PHI MM
Sample Content by Weight Percent :
Gravel Sand coarse medium fine
Silt clay
Wentworth Classification 0.000 0.000 0.000 100.000 0.000 0.000 Unified Classification 0.000 0.000 0.000 97.681 2.319 0.000
Standard Statistics : Median Mean Dev. Skew Kurt
Method of Moments (PHI) Folk Graphic Measures (PHI) Grain Size (mm)
Locality Sample Date Profile Analysis Date Analyz 3 9 6217517 850315 860616 LSC
x Position : 3300.00 Y position : 2935.50
Elevation of Top of Core : -26.48 Length of Core 0.00 Depth to Top of Sample : 0.00 Depth to Bottom of Sample :
Comments : CONCENTFATION OF HEAVIES IN 4.00/PAN
Start Weight : 20.880 Final Weight : 20.801 Deviation : 0.378 %-
PHI Weight Percnt m u 1 Percnt
PHI
----- 1.75 2.00 2.25 2.50 2.75 3.00 3.25 3.50 3.75 4.00 4.25 4.50 4.75 5.00 5.25 5.50 5.75 6.00
Weight Percnt
------ 0.000 0.000 0.192 1.389 7.360
32.321 34.378 13.797 7.601 2.961 0.000 0.000 0.000 0.000 0.000 0.000 0.000 0.000
Cumul Percnt
sample content by Weight Percent :
Gravel coarse
Sand Silt Clay medium fine
Wentworth Classification 0.000 0.000 Unified Classification 0.000 0.000
Standard Statistics : Median Mean Dev. Skew Kurt
Hethod of Moments (PHI) folk Graphic Measures (PHI) 3.06 Grain Size (mm) 0.12

Sample Content by Weight Percent :
Locality Type Sample Date Profile Analysis Date Analyz 39 G 6217903 850509 860617 LSC
X Position : 3300.00 Y Position : 232.51
Elevation of Top of Core : 11.92 Length of Core 0.00 Depth to Top of Sample : 0.00 Depth to Eottom of Sample :
Comments :
Start Weight : 57.050 Final Weight : 56.981 Deviation : 0.121 %
Gravel Sand Silt Clay coarse medium fine
PHI MM Weight Percnt Cumul Percnt ----- ----- ------ ------ ------
-2.75 6.727 0.000 0.000 0.000 -2.50 5.657 0.000 0.000 0.000 -2.254.757 0.000 0.000 0.000 -2.00 4.000 0.000 0.000 0.000 -1.75 3.364 0.000 0.000 0.000 -1.50 2.828 0.131 0.230 0.230 -1.25 2.378 0.148 0.260 0.490 -1.00 2.000 0.131 0.230 0.720 -0.75 1.682 0.462 0.811 1.530 -0.501.414 2.701 4.740 6.271 -0.25 1.189 4.758 8.350 14.621 0.00 1.000 4.900 8.599 23.220 0.25 0.841 6.405 11.241 34.461 0.50 0.707 4.011 7.039 41.500 0.75 0.595 4.581 8.040 49.539 1.00 0.500 5.162 9.059 58.598 1.25 0.420 3.652 6.409 65.008 1.50 0.354 3.801 6.671 71.678
Wentworth Classification 0.720 57.879 30.721 10.681 0.000 0.000 Unified Classification 0.000 0.720 64.288 34.992 0.000 0.000
PHI MM Weight Percnt Cumul Percnt ----- ----- ------ ------ ------
1.75 0.297 5.140 9.021 80.699 2.00 0.250 4.912 8.620 89.319 2.25 0.210 3.459 6.070 95.390 2.50 0.177 1.801 3.161 98.550 2.75 0.149 0.638 1.120 99.670 3.00 0.125 0.160 0.281 99.951 3.25 0.105 0.028 0.049 100.000 3.50 0.088 0.000 0.000 100.000 3.75 0.074 0.000 0.000 100.000 4.00 0.063 0.000 0.000 100.000 4.25 0.053 0.000 0.000 100.000 4.50 0.044 0.000 0.000 100.000 4.75 0.037 0.000 0.000 100.000 5.00 0.031 0.000 0.000 100.000 5.25 0.026 0.000 0.000 100.000 5.50 0.022 0.000 0.000 100.000 5.75 0.019 0.000 0.000 100.000 6.00 0.016 0.000 0.000 100.000
Standard Statistics : Median Mean Dev. Skew Kurt
Method of Moments (PHI) Folk Graphic Measures (PHI) Grain Size (mm)
Locality Type Sample Date Profile Analysis Date Analyz 39 G 6217904 850509 860617 LSC
X Position : 3300.00 Y Position : 260.10
Elevation of Top of core : Length of Core Depth to Top of Sample : Depth to Bottom of Sample :
Comments :
Start Weight : 28.810 Final Weight : 28.830 Deviation : 0.069 %
PHI MH Weight Percnt Cumul Percnt ----- ----- ------ ------ ------
-2.75 6.727 0.000 0.000 0.000 -2.50 5.657 0.000 0.000 0.000 -2.25 4.757 0.000 0.000 0.000 -2.00 4.000 0.461 1.599 1.599 -1.75 3.364 0.000 0.000 1.599 -1.50 2.828 0.320 1.110 2.709 -1.25 2.378 0.381 1.322 4.031 -1.00 2.000 0.389 1.349 5.380 -0.75 1.682 0.349 1.211 6.590
PHI HM Weight Percnt Cumul Percnt ----- ----- ------ ------ ------
Sample Content by Weight Percent :
Gravel Sand Silt Clay coarse medium fine
Wentworth Classification 5.380 7.582 42.508 44.530 0.000 0.000 Unified Classification 0.000 5.380 10.291 84.308 0.021 0.000
Standard Statistics : Median Mean Dev. Skew xurt
Method of Moments [PHI) 1.65 1.04 -2.07 6.78 folk Graphic ~easu;es (PHI) 1.94 1.85 0.83 -0.43 2.35 Grain Size (m) 0.26 0.32
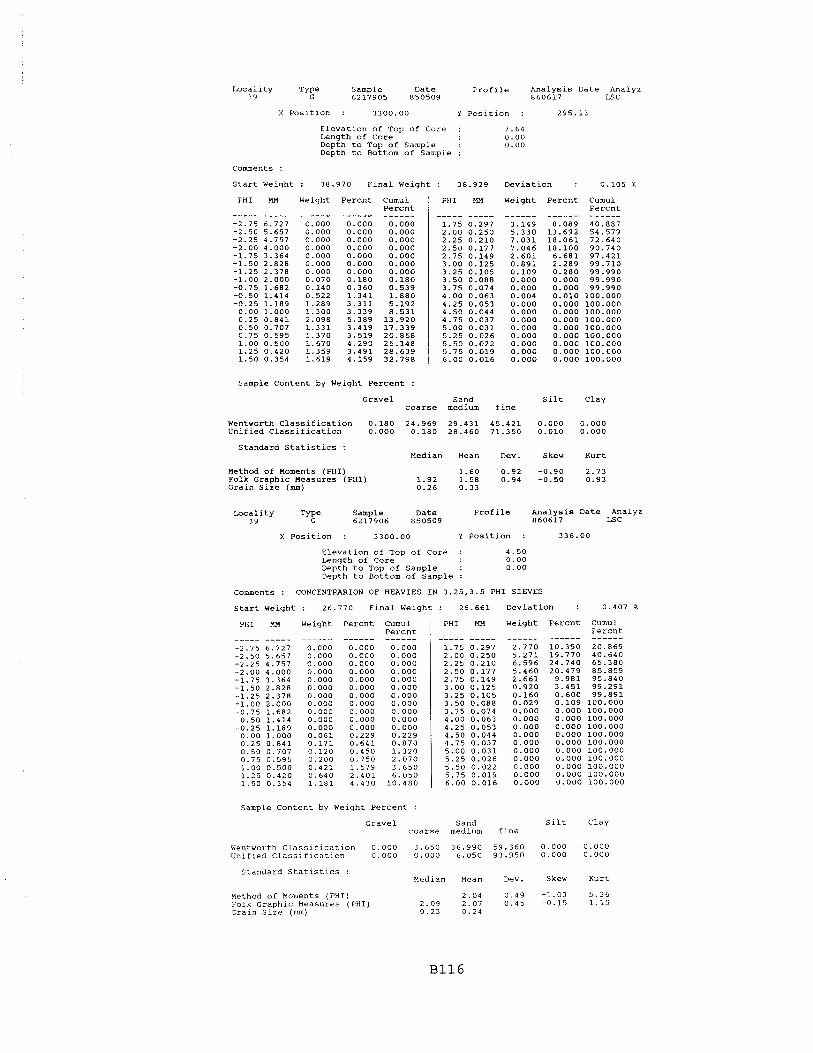
Locality 3 3
Sample 6217905
Date 850509
Analysis Date Analyz 860617 LSC
X Posltion : 3300.00 Y Position : 295.13
Elevation of Top of Core : 7.64 Length of Core 0.00 Depth to Top of Sample : 0.00 Depth to Bottom of Sample :
Comments :
Start Weight : 38.970 Final Weiqht : 38.929 Deviation : 0.105 %
PHI m Weight Percnt Cumul PHI En? Weight Percnt Cumul ~ercnt 1 Percnt ----- ----- ------ ------ ------ ----- ----- ------ ------ ------
Sample Content by Weight Percent :
Gravel Sand Silt Clay coarse medium fine
Wentvorth Classification Unified Classification
Standard Statistics : Median Mean Dev. Skew Kurt
Hethcd of Moments (PHI) 1.60 0.92 -0.90 2.73 ~ o l k Graphic neasu;es '(PHI) 1.92 i.5~ 0.94 -0.50 0.93 Grain size (mm) 0.26 0.33
Sample Content by Weiqht Percent :
mality Type Sample Date Profile Analysis Date Analyz 39 G 6217906 850509 860617 LSC
X Position : 3300.00 Y Position : 336.00
Elevation of Top of Core : 4.50 Length of Core 0.00 Depth to Top of Sample : 0.00 Depth to Bottom of Sample :
Comments : CONCENTRARION OF HEAVIES IN 3.25,3.5 PHI SIEXES
Start Weight : 26.770 Final Weight : 26.661 Deviation : 0.407 %
Gravel Sand Silt Clay coarse medium fine
PHI MM Weight Percnt Cumul Percnt ----- ----- ------ ------ ------
-2.75 6.727 0.000 0.000 0.000 -2.50 5.657 0.000 0.000 0.000 -2.25 4.757 0.000 0.000 0.000 -2.00 4,000 0.000 0.000 0.000 -1.75 3.364 0.000 0.000 0.000 -1.50 2.828 0.000 0.000 0.000 -1.25 2.378 0.000 0.000 0.000 -1.00 2.000 0.000 0.000 0.000 -0.75 1.682 0.000 0.000 0.000 -0.50 1.414 0.000 0.000 0.000 -0.25 1.189 0.000 0.000 0.000 0.00 1.000 0.061 0.229 0.229 0.25 0.841 0.171 0.641 0.870 0.50 0.707 0.120 0.450 1.320 0.75 0.595 0,200 0.750 2.070 1.00 0.500 0.421 1.579 3.650 1.25 0.420 0.640 2.401 6.050 1.50 0.354 1.181 4.430 10.480
Wentworth Classification 0.000 3.650 36.990 59.360 0.000 0.000 Unifled Classification 0.000 0.000 6.050 93.950 0.000 0.000
PHI m Weight Percnt Cumul Percnt ----- ----- ------ ------ ------
1.75 0.297 2.770 10.390 20.869 2.00 0.250 5.271 19.770 40.640 2.25 0.210 6.596 24.740 65.380 2.50 0.177 5.460 20.479 85.859 2.75 0.149 2.661 9.981 95.840 3.00 0.125 0.920 3.451 99.291 3.25 0.105 0.160 0.600 99.891 3.50 0.088 0.029 0.109 100.000 3.75 0.074 0.000 0.000 100.000 4.00 0.063 0.000 0.000 100.000 4.25 0.053 0.000 0.000 100.000 4.50 0.044 0.000 0.000 100.000 4.75 0.037 0.000 0.000 100.000 5.00 0.031 0.000 0.000 100.000 5.25 0.026 0.000 0.000 100.000 5.50 0.022 0.000 0.000 100.000 5.75 0.019 0.000 0.000 100.000 6.00 0.016 0.000 0.000 100.000
Standard Statistics : Median Mean Dev. Skew Kurt
Method of Moments (PHI) 2.04 0.49 -1.03 5.36 Folk ~raphic Measures (PHI) 2.09 2.07 0.45 -0.15 1.15 Grain Size (mm) 0.23 0.24

Locality Type Sample Date Profile Analysis Date Analyz 39 G 6217907 850509 860617 LSC
X Position : 3300.00 Y Position : 446.90
Elevation of Top of Core : -4.62 Lenqth of Core 0.00 Depth to Top of Sample : 0.00 Depth to Bottom of Sample :
Comments :
Start Weight : 21.800 Final Weight : 21.630 Deviation : 0.780 %
PHI MM Weight Percnt Cumul Percnt ----- ----- ------ ------ ------
Sample Content by Weight Percent :
PHI m Weight Percnt Cumul Percnt ----- ----- ------ ------ ------
Gravel Sand Silt clay coarse medium fine
Wentworth Classification 0.231 0.231 8.918 90.620 0.000 0.000 Unified Classification 0.000 0.231 0.601 99.126 0.042 0.000
Standard Statistics : Median Hean Dev. Skew Kurt
Method of Moments (PHI) 2.43 0.39 -2.15 19.31 Folk Graphic Measures (PHI) 2.44 2.44 0.34 -0.04 1.16 Grain Size (mm) 0.18 0.19
bcality Sample Date 6217908 850509
Profile Analysis Date Analyz 3 9 860617 LSC
X Position : 3300.00 Y Position : 580.74
Elevation of Top of Core : -6.86 Length of Core 0.00 Depth to Top of Sample : 0.00 Depth to Bottom of Sample :
Comments : PINKISH TINT, CONCEN. OF HEAVIES IN 3.25,3.50,3.75
Startweight: 36.760 Finalweight: 36.678 Deviation : 0.223 %
PHI m Weight Percnt Cumul PHI m Weight Percnt Cumul percnt I Percnt ----- ----- ------ ------ ------ ----- ----- ------ ------ ------
Sample Content by Weight Percent :
Gravel Sand Silt Clay coarse medium fine
Wentworth Classification 0.218 3.921 37.000 58.861 0.000 0.000 Unified Classification 0.000 0.218 6.241 93.522 0.019 0.000
Standard Statistics : Median Mean Dev. Skew Kurt
Method of Moments (PHI) 7.n6 0.56 -1 51 R 59
F O I ~ Graphic ~eaiu;& :PHI) Grain Size (m)
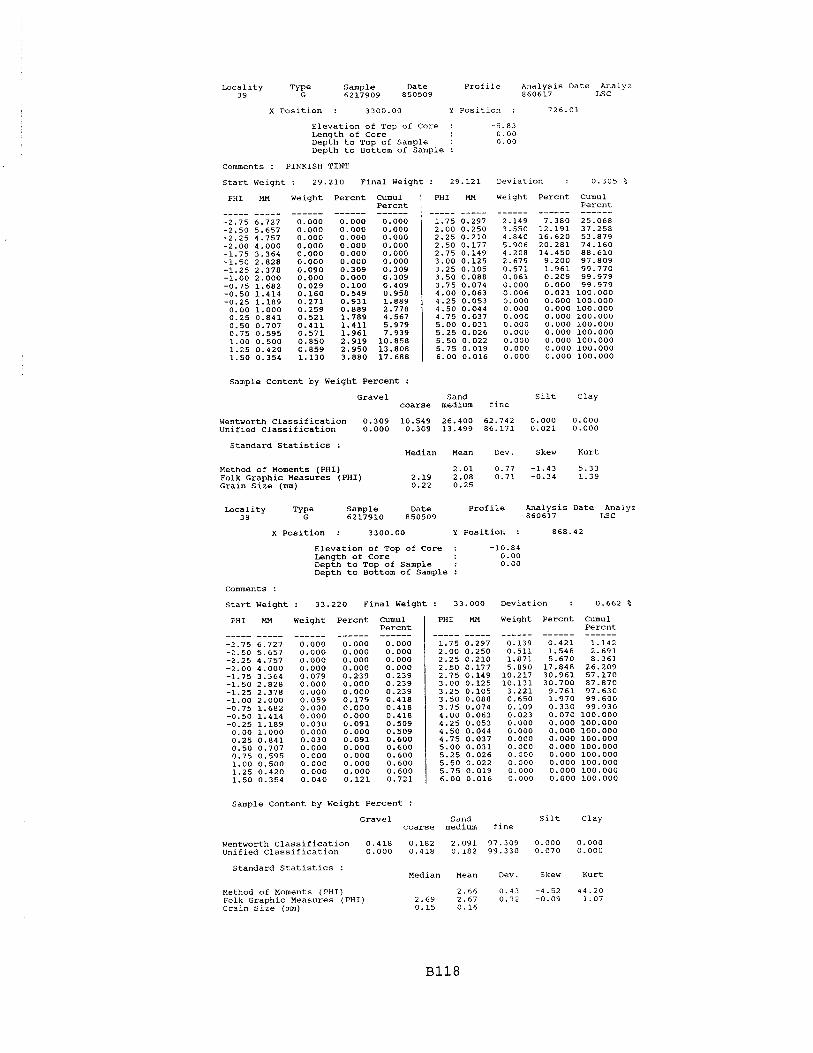
Locality Type Sample Date Profile Analysis Date Analyz 3 9 G 6217909 850509 860617 LSC
X Position : 3300.00 Y Position : 726.01
Elevation of Top of Core : -5.83 Length of Core 0.00 nepth to TOP of Sample : 0.00 Depth to Bottom of Sample :
Comments : PINKISH TINT
Start Weight : 29.210 Final Weight : 29.121 Deviation : 0.305 %
PHI Weight
------ Percnt
------ Cumul Percnt ------ 0.000 0.000 0.000 0.000 0.000 0.000 0.309 0.309 0.409 0.958 1.889 2.778 4.567 5.979 7.939 10.858 13.808 17.688
PHI
----- 1.75 2.00 2.25 2.50 2.75 3.00 3.25 3.50 3.75 4.00 4.25 4.50 4.75 5.00 5.25 5.50 5.75 6.00
Weight Percnt Cumul Percnt
Sample content by Weight Percent :
Gravel Sand silt Clay coarse medium fine
Wentworth Classification 0.309 10.549 26.400 62.742 0.000 0.000 Unified Classification 0.000 0.309 13.499 86.171 0.021 0.000
Standard Statistics : Median Mean Dev. Skew Kurt
Method of Moments (PHI) Folk Graphic Measures (PHI) Grain site (mm)
Lacality Sample Date Profile Analysis Date Analyz 39 Ty? 6217910 850509 860617 LSC
x Position : 3300.00 Y Position : 868.42
Elevation of Top of Core : -10.84 Length of Core 0.00 Depth to Top of Sample : 0.00 Depth to Bottom of Sample :
Comments :
Start Weight : 33.220 Final Weight : 33.000 Deviation : 0.662 %
PHI HM Weight Percnt Cumul Percnt ----- ----- ------ ------ ------
PHI MN Weight Percnt Cumul Percnt ----- ----- ------ ------ ------
Sample Content by Weight Percent :
Gravel Sand Silt Clay coarse medium fine
Wentworth Classification 0.418 0.182 2.091 97.309 0.000 0.000 Unified Classification 0.000 0.418 0.182 99.330 0.070 0.000
Standard Statistics : Median Mean Dev. Skew Kurt
Method of Moments (PHI) 2.66 0.43 -4.52 44.20 Folk Graphic Measures (PHI) 2.69 2.67 0.32 -0.09 1.07 Grain Size (mm) 0.15 0.16

Locality Type Sample Date Profile Analysis Date Analyz 39 G 6217912 850509 860617 LSC
x position : 3300.00 Y Position : 1202.15
Elevation of TOP of core : -13.02 Length of Core 0.00 Depth to Top of Sample : 0.00 Depth to Bottom of Sample :
Comments :
start Weight : 24.970 Final Weight : 24.838 Deviation : 0.529 %
PHI MM Weight Percnt Cumul Percnt
PHI MM Weight Percnt Cumul Percnt ----- ------ ------ ------
Sample Content by Weight Percent :
Gravel Sand Silt Clay coarse medium fine
WentworthClassification 0.600 3.036 5.790 90.575 0.000 0.000 Unified Classification 0.000 0.600 3.555 95.507 0.338 0.000
Standard Statistics : Median Mean Dev. Skew Kurt
Method of Moments (PHI) Folk ~raphic Measures (PHI) Grain Size (mm)
Sample Date Profile Analysis Date Analyz 3 9 6217913 850509 860617 LSC
x Position : 3300.00 Y Position : 1494.33
Elevation of Top of Core : -15.00 Length of Core 0.00 Depth to Top of Sample : 0.00 Depth to Bottom of Sample :
Comments :
Start Weight
PHI MM
: 32.150 Final Weight : 32.018
Weight Percnt Cumul PHI MM Percnt I
Deviation : 0.411 %
Weight Percnt Cumul Percnt ------ ------ ------
0.269 0.840 2.877 1.140 3.560 6.437 4.419 13.802 20,239 8.789 27.450 47.689
Sample Content by Weight Percent :
Gravel Sand Silt Clay coarse medium fine
Wentworth Classification 0.659 0.968 4.810 93.563 0.000 0.000 Unified classification 0.000 0.659 1.127 98.095 0.119 0.000
Standard Statistics : Median Mean Dev. Skew Kurt
Method of Moments (PHI) Folk Graphic Measures (PHI) Grain Size (m)

Loca l i t y Type Sample Date P r o f i l e A n a l y s i s Date Analyz 39 G 6217914 850509 860617 ISC
Sample Content by Weight Pe rcen t :
X P o s i t i o n : 3300.00 Y P o s i t i o n : 1712.86
Eleva t ion of Top of Core : -17.80 Length of Core 0.00 Depth t o Top of Sample : 0.00 Depth t o Bottom of Sample :
Comments :
S t a r t Weight : 32.220 Fina l Weight : 31.980 Devia t ion : 0.745 %
Gravel Sand S i l t Clay c o a r s e medium f i n e
PHI UM Weight Pe rcn t Cumul Pe rcn t _--_- __--- -__--- _----- ---_-_
-2.756.727 0.000 0.000 0.000 -2.50 5.657 0.000 0.000 0.000 -2.25 4.757 0.000 0.000 0.000 -2.00 4.000 0.000 0.000 0.000 -1.75 3.364 0.000 0.000 0.000 -1.50 2.828 0.051 0.159 0.159 -1.25 2.378 0.080 0.250 0.410 -1.00 2.000 0.000 0.000 0.410 -0.75 1.682 0.029 0.091 0.500 -0.50 1.414 0.000 0.000 0.500 -0.25 1.189 0.000 0.000 0.500 0.00 1.000 0.000 0.000 0.500 0.25 0.841 0.000 0.000 0.500 0.50 0.707 0.000 0.000 0.500 0.75 0.595 0.000 0.000 0.500 1.00 0.500 0.000 0.000 0,500 1.25 0.420 0.000 0.000 0.500 1.50 0.354 0.000 0.000 0.500
W e n t w o r t h C l a s s i f i c a t i o n 0.410 0.091 0.650 98.849 0.000 0.000 Unif ied C l a s s i f i c a t i o n 0.000 0.410 0.091 99.190 0.310 0.000
PHI m Weight P e r c n t Cumul Percn t ----- --_-- -__--- ------ ------
1.750.297 0.029 0.091 0.591 2.00 0.250 0.179 0.560 1.151 2.25 0.210 1.039 3.249 4.400 2.50 0.177 5.481 17.139 21.538 2.75 0.149 11.100 34.709 56.248 3.00 0.125 9.102 28.462 84.709 3.25 0.105 3.160 9.881 94.590 3.50 0.088 1.190 3.721 98.311 3.75 0.074 0.441 1.379 99.690 4.00 0.063 0.099 0.310 100.000 4.25 0.053 0.000 0-000 100.000 4.50 0.044 0.000 0.000 100.000 4.75 0.037 0.000 0.000 100.000 5.00 0.031 0.000 0.000 100.000 5.25 0.026 0.000 0.000 100.000 5.50 0.022 0.000 0.000 100.000 5.75 0.019 0.000 0.000 100.000 6.00 0.016 0.000 0.000 100.000
Standard S t a t i s t i c s : Median Mean Dev. Skew Kurt
Uethod o f Moments (PHI) 2.71 0.42 -4.30 45.41 Folk Graphic Measures (PHI) 2.70 2.71 0.30 0.06 1.07 Grain S i z e (mm) 0.15 0.15
Loca l i t y T sample Date P r o f i l e Ana lys i s D a t e Analyz 39 6217915 850509 860617 LSC
X P o s i t i o n : 3300.00 Y P o s i t i o n : 1956.94
Eleva t ion of Top of Core : -20.31 Length of Core 0.00 Depth t o Top o f Sample : 0.00 Depth t o Bottom of Sample :
Comments :
S t a r t Weight
PHI MM Weight
420 F i n a l Weight
Pe rcn t Cumul Percn t ------ ------
0.000 0.000 0.000 0.000 0.000 0.000 0.000 0.000 0.000 0.000 0.270 0.270 0.000 0.270 0.000 0.270 0.000 0.270 0.000 0.270
: 26.249 Devia t ion : 0.647%
PHI HM Weight P e r c n t Cumul Pe rcn t ----- ----- ------ ------ ------
1.75 0.297 0.000 0.000 0.270 2.00 0.250 0.039 0.149 0.419 2.25 0.210 0.181 0.690 1.109 2.50 0.177 1.110 4.229 5.337 2.75 0.149 4.699 17.902 23.239 3.00 0.125 10.111 38.520 61.759 3.25 0.105 6.639 25.292 87.051 3.50 0.088 2.210 8.419 95.470 3.75 0.074 0.879 3.349 98.819 4.00 0.063 0.310 1.181 100.000
Sample Content by Weight Pe rcen t :
Gravel Sand S i l t Clay c o a r s e medium f i n e
Wentworth C l a s s i f i c a t i o n 0.270 0.000 0.149 99.581 0.000 0.000 Unified C l a s s i f i c a t i o n 0.000 0.270 0.000 98.549 1.181 0.000
Standard S t a t i s t i c s : Median Mean Dev. Skew Kurt
Method of Moments (PHI) 2.93 0.38 -4.37 56.13 Folk Graphic Measures (PHI) 2.92 2.93 0.30 0.08 1.12 Grain S i z e (m) 0.13 0.13

Locality Type Sample Date Profile Analysis Date Analyz 3 9 G 6217916 850509 860617 LSC
x Position : 3300.00 Y Position : 2423.52
Elevation of Top of Core : -23.43 Length of Core 0.00 Depth to Top of Sample : 0.00 Depth to Bottom of Sample :
Comments : CONCENTRATION OF HEAVIES IN 3.75,4.00/PAN PHI SIEV
Start Weight : 37.480 Final Weight : 37.371 Deviation : 0.291 %
PHI MM Weight Percnt Cumul PHI Mn Weight Percnt Cumul ~ercnt I Percnt ----- ----- ------ ------ ------ ----- ----- ------ ------ ------
Sample Content by Weight Percent :
Gravel Sand Silt Clay coarse medium fine
Wentworth Classification 0.000 0.000 0.000 100.000 0.000 0.000 Unified Classification 0.000 0.000 0.000 97.739 2.261 0.000
Standard Statistics : Median Mean Dev. Skew Kurt
Method of Moments (PHI) 3.07 0.29 0.48 3.54 Folk Graphic Measures (PHI) 3.05 3.07 0.29 0.16 1.12 Grain Size (mm) 0.12 0.12
Sample Date Profile Analysis Date Analyz 3 9 6217917 850509 860617 LSC
X Position : 3300.00 Y Position : 2942.58
Elevation of Top of Core : -26.24 Length of Core 0.00 Depth to Top of Sample : 0.00 Depth to Bottom of Sample :
Comments :
start Weight : 7.840 Final Weight : 7.750 Deviation : 1.148 %
PHI HM Weight Percnt Cumul PHI MM Weight Percnt Cumul percnt 1 Percnt ----- ----- ------ ------ ------ ----- ----- ------ ------ ------
Sample Content by Weight Percent :
Gravel Sand Silt Clay coarse medium fine
Wentworth Classification 0.000 0.000 0.000 100.000 0.000 0.000 Unified Classification 0.000 0.000 0.000 96.710 3.290 0.000
Standard Statistics : Median Mean Dev. Skew Kurt
Method of Moments (PHI) Folk Graphic Measures (PHI) Graln Size (mm)

Locality Sample Date Profile Analysis Date Analyz 39 6218003 850531 870701 LLS
x Position : 3300.00 Y Position : 232.32
Elevation of Top of Core : 11.99 Length of Core 0.00 Depth to Top of Sample : 0.00 Depth to Bottom of Sample :
Comments :
Start Weight : 58.990 Final Weight : 58.909 Deviation : 0.137 %
PHI MM Weight Percnt Cumul PHI HH Weight Percnt Cumul Percnt ----- ----- ------ ------ ---_- ----- ------ ------ ------
sample Content by Weight Percent :
Gravel Sand Silt Clay coarse medium fine
Wentworth Classification 0.399 54.469 31.501 13.631 0.000 0.000 Unified Classification 0.000 0.399 59.650 39.951 0.000 0.000
Standard Statistics : Median Mean Dev. Skew Kurt
Method of Moments (PHI) Folk Graphic Measures (PHI) Grain Size (mm)
Iacality Sample Date Profile Analysis Date Analyz 3 9 6218004 850531 870701 LLS
X Position : 3300.00 Y Position : 261.24
Elevation of TOP of core : Length of Core Depth to Top of Sample : ~epth to ~ottom of Sample :
Comments :
Startweight: 62.360 Finalweight: 62.288 Deviation : 0.115%
PHI l4M Weight Percnt Cumul PHI MM Weight Percnt Cumul Percnt I Percnt
Sample Content by Weight Percent :
Gravel Sand Silt Clay coarse medium fine
Wentworth Classification 0.828 14.060 48.171 36.940 0.000 0.000 Unified Classification 0.000 0.828 18.090 81.081 0.000 0.000
Standard Statistics : Median Mean Dev. Skew Kurt
Method of Moments (PHI) Folk Graphic Measures (PHI) Grain size (mm)

Locality Type Sample Date Profile Analysis Date Analyz 39 G 6218005 6 5 0 5 3 1 870702 LLS
X Position : 3300.00 Y Position : 294.23
Elevation of Top of Core : Length of Core Depth to Top of Sample : Depth to Bottom of Sample :
Comments :
start Weight : 57.820 Final Weight : 57 .919 Deviation : 0.171 %
PHI MM Weight Percnt Cumul Percnt ------
0.000 0.000 0 .000 0 .000 0 .000 0.000 0.140 0.230 0.440
PHI MM Weight Percnt Cumul Percnt ----- ----- ------ ------ ------
Sample Content by Weight Percent :
Gravel Sand Silt Clay coarse medium fine
Wentworth Classification 0 .230 11.362 43.559 44 .849 0 .000 0 .000 Unified Classification 0 .000 0.230 14 .092 8 5 . 6 7 8 0.000 0 .000
standard Statistics : Median Mean Dev. Skew Kurt
Method of Moments (PHI) 1 .82 0 . 7 1 -1.49 5.77 Folk Graphic Measures (PHI) 1.95 1 . 9 0 0 .65 -0.28 1 . 6 0 Grain Size (mm) 0 . 2 6 0 . 2 8
Sample Date Profile Analysis Date Analyz 3 9 6218006 8 5 0 5 3 1 870702 LIS
X Position : 3300.00 Y Position : 325.85
Elevation of Top of Core : Length of Core Depth to Top of Sample : Depth to Bottom of Sample :
. Comments : Start Weight : 54.490 Final Weight : 54 .429 Deviation : 0.112 %
PHI MM Weight Percnt CumUl Percnt ------
0 .000 0 .000 0 .000 0 .000 0 .000 0 .000 0 .200 0 .770 1 .620 3 .750
PHI MM Weight Percnt Cumul Percnt ----- ----- ------ ------ ------
Sample Content by Weight Percent :
Gravel Sand Silt Clay coarse medium fine
Wentworth Classification 0 .770 3 7 . 2 6 1 4 1 . 0 3 0 2 0 . 9 3 9 0 . 0 0 0 0 .000 Unified Classification 0.000 0 .770 4 3 . 1 4 1 5 6 . 0 9 0 0 . 0 0 0 0 . 0 0 0
Standard Statistics : Median Mean Dev. Skew Kurt
Method of Moments (PHI) Folk Graphic Measures (PHI) Grain Size (mm)

Uxality Type Sample Date Profile Analysis Date Analyz 39 G 6218007 850530 870702 LLS
x Position : 3300.00 Y Position : 452.35
Elevation of Top of Core : -6.48 Length of Core 0 .00 Depth to Top of Sample : 0.00 Depth to Bottom of Sample :
Coments :
start Weight : 56 .510 Final Weight : 56.539 Deviation : 0 . 0 5 1 %
PHI MM Weight Percnt Curnul Percnt
PHI MM Weight Percnt Cumul Percnt ----- ----- ------ ------ ------
Sample Content by Weight Percent :
Gravel Sand Silt Clay coarse medium fine
Wentworth Classification 0 . 2 7 1 1 . 8 5 9 2 5 . 7 6 1 72.110 0 . 0 0 0 0 . 0 0 0 Unified Classification 0.000 0 . 2 7 1 2.688 9 6 . 6 0 1 0 .440 0 . 0 0 0
Standard Statistics : Median Mean Dev. Skew Kurt
Hethod of Homents (PHI) Folk Graphic Measures (PHI) Grain Size (mm)
Locality Type Sample Date Profile Analysis Date Analyz 3 9 G 6218008 850530 8 7 0 7 0 2 LLS
X Position : 3300 .00 Y Position : 5 9 2 . 6 6
Elevation of Top of tore : -5.08 Length of Core 0 .00 Depth to Top of Sample : 0.00 Depth to Bottom of Sample :
Comments :
Start Weight : 58 .350 Final Weight : 58.390 Deviation : 0.069 %
PHI MM Weight Percnt Cumul PHI MM Weight Percnt Cumul Percnt ----- ----- ------ ------ ----- ----- ------ ------ ------
Sample Content by Weight Percent :
Gravel Sand Silt Clay coarse medlum fine
Wentworth Classification 0 . 1 6 1 2.259 22 .870 74 .710 0.000 0 . 0 0 0 Cnified Classification 0 . 0 0 0 0 . 1 6 1 3.459 96 .340 0 . 0 3 9 0 .000
Standard Statistics : Median Mean Dev. Skew Kurt
Method of Moments (PHI) 2 .24 0 .51 -1.57 9 .64 Folk Graphic Measures (PHI) 2 . 3 2 2.27 0 .45 -0.19 1 .16 Graln Size (mm) 0 .20 0 . 2 1

Locality Type Sample Date Profile Analysis Date Analyz 39 G 6218009 850530 870702 LLS
X Position : 3300.00 Y Position : 732.25
Elevation of Top of Core : -7.00 Length of Core 0.00 Depth to Top of Sample : 0.00 Depth to Bottom of Sample :
Comments :
Start Weight : 51.140 Final Weight : 51.122 Deviation : 0.035 %
PHI MM Weight Percnt Cumul Percnt
PHI MM Weight Percnt Cumul Percnt
Sample Content by Weight Percent :
Gravel Sand Silt Clay coarse medium fine
Wentworth Classification 0.141 0.262 6.050 93.547 0.000 0.000 Unified Classification 0.000 0.141 0.442 99.266 0.151 0.000
Standard Statistics :
Method of Moments (PHI) Folk Graphic Measures (PHI) Grain Size (mm)
Locality 3 9
Sample 6218010
Median Mean Dev. Skew Kurt
2.48 0.37 -1.93 22.45 2.47 2.51 0.31 0.11 1.19 0.18 0.18
Date 850530
Profile Analysis Date Analyz 870702 LLS
X Position : 3300.00 Y Position : 840.01
Elevation of Top of Core : -10.83 Length of Core 0.00 Depth to Top of Sample : 0.00 Depth to Bottom of Sample :
Comments :
Start Weight
PHI MM
: 52.440 Final Weight
Weight Percnt Cumul Percnt ------ ------ ------
0.000 0.000 0.000 0.000 0.000 0.000 0.000 0.000 0.000 0.718 1.369 1.369 0.231 0.441 1.810 0.267 0.509 2.319 0.388 0.740 3.059 0.252 0.481 3.540 0.199 0.380 3.919
PHI MM
Deviation : 0.017 %
Weight Percnt Cumul Percnt ------ ------ ------
0.645 1.230 8.760 1.568 2.991 11.751 3.691 7.040 18.790 10.318 19.679 38.470 20.883 39.829 78.299 7.188 13.709 92.009 2.910 5.550 97.559 0.682 1.301 98.859 0.488 0.931 99.790 0.100 0.191 99.981 0.010 0.019 100.000 0.000 0.000 100.000 0.000 0.000 100.000 0.000 0.000 100.000 0.000 0.000 100.000 0.000 0.000 100.000 0.000 0.000 100.000 0.000 0.000 100.000
Sample Content by Weight Percent :
Gravel Sand Silt Clay coarse medium fine
WentworthClassification 3.540 3.120 5.090 88.230 0.019 0.000 unified Classlfication 0.000 3.540 3.481 92.770 0.210 0.000
Standard Statistics : Median Mean Dev. Skew Kurt
Method of Moments (PHI) Folk Graphic Measures (PHI) Grain Size (mm)
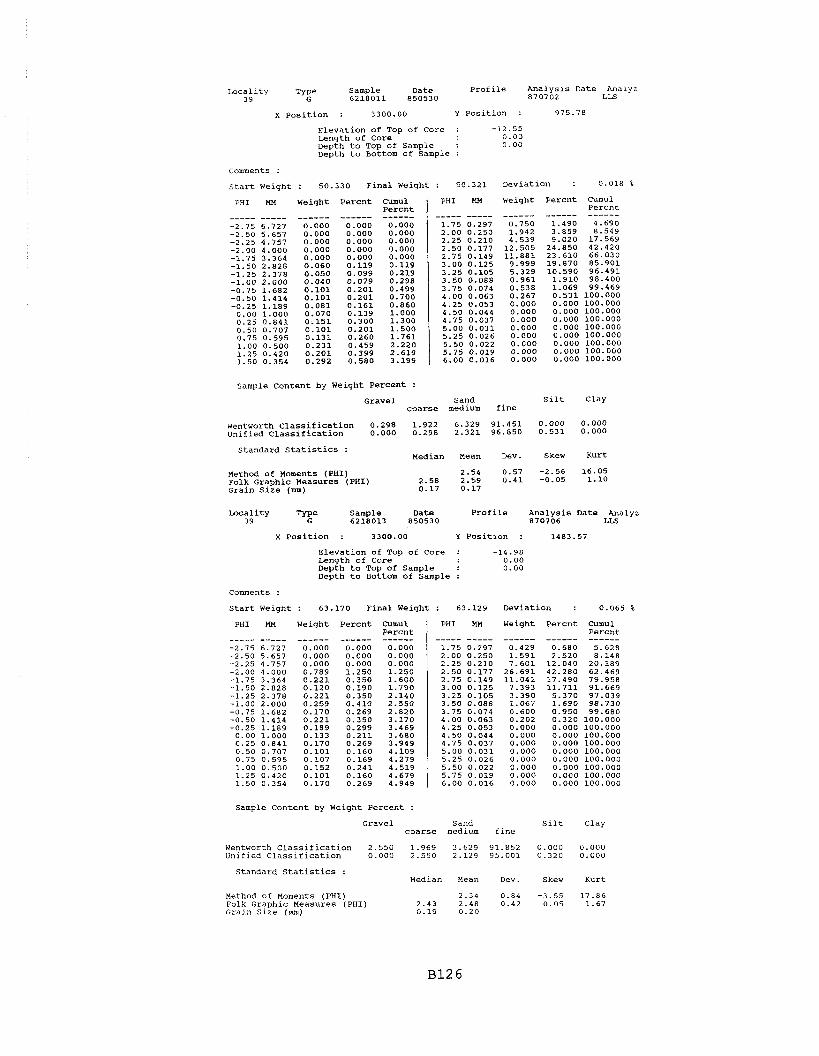
Locality Type Sample Date Profile Analysis Date Analyz 39 G 6218011 850530 870702 LLS
x Position : 3300.00 Y Position : 975.78
Elevation of Top of Core : -12.55 Length of Core 0.00 Depth to Top of Sample : 0.00 Depth to Bottom of Sample :
Comments :
: 50.330 Final Weight : 50.321 0.018 \
Cumul Percnt ------ 4.690 8.549 17.569 42.420 66.030 85.901 96.491 98.400 99.469 100.000 100.000 100.000 100.000 100.000 100.000 100.000 100.000 100.000
start Weight
Weight Percnt Cumul PHI MM Percnt 1 Weight Percnt PHI MH
Sample Content by Weight Percent :
Gravel Sand Silt Clay coarse medium fine
Wentworth Classification 0.298 1.922 6.329 91.451 0.000 0.000 Unified Classification 0.000 0.298 2.321 96.850 0.531 0.000
Standard Statistics : Median Mean Dev. Skew Kurt
Method of Moments (PHI) 2.54 0.57 -2.56 16.05 Folk Graphic Measures (PHI) 2.58 2.59 0.41 -0.05 1.10 Grain Size (mm) 0.17 0.17
Locality Type sample Date Profile Analysis Date Analyz 3 9 G 6218013 850530 870706 LL5
x Position : 3300.00 Y Position : 1483.57
Elevation of Top of Core : -14.98 Length of Core 0.00 Depth to Top of Sample : 0.00 Depth to Bottom of Sample :
Comments :
start Weight : 63.170 Final Weight Deviation : 0.065 %
Cumul Percnt ------ 5.628 8.148 20.189 62.469 79.958 91.669 97.039 98.730 99.680 100.000 100.000 100.000 100.000 100.000 100.000 100.000 100.000 100.000
PHI MM Weight Percnt Cumul Percnt ------ ------ ------
0.000 0.000 0.000 0.000 0.000 0.000 0.000 0.000 0.000 0.789 1.250 1.250 0.221 0.350 1.600 0.120 0.190 1.790 0.221 0.350 2.140 0.259 0.410 2.550
PHI MM Weight Percnt
Sample Content by Weight Percent :
Gravel Sand silt Clay coarse medium fine
Wentworth Classification 2.550 1.969 3.629 91.852 0.000 0.000 Unified Classification 0.000 2.550 2.129 95.001 0.320 0.000
Standard Statistics : Median Mean Dev. Skew Kurt
Method of Moments (PHI) 2.34 0.84 -3.55 17.86 Folk Graphic Measures (PHI) 2.43 2.48 0.42 0.05 1.67 Grain Size (mm) 0.19 0.20
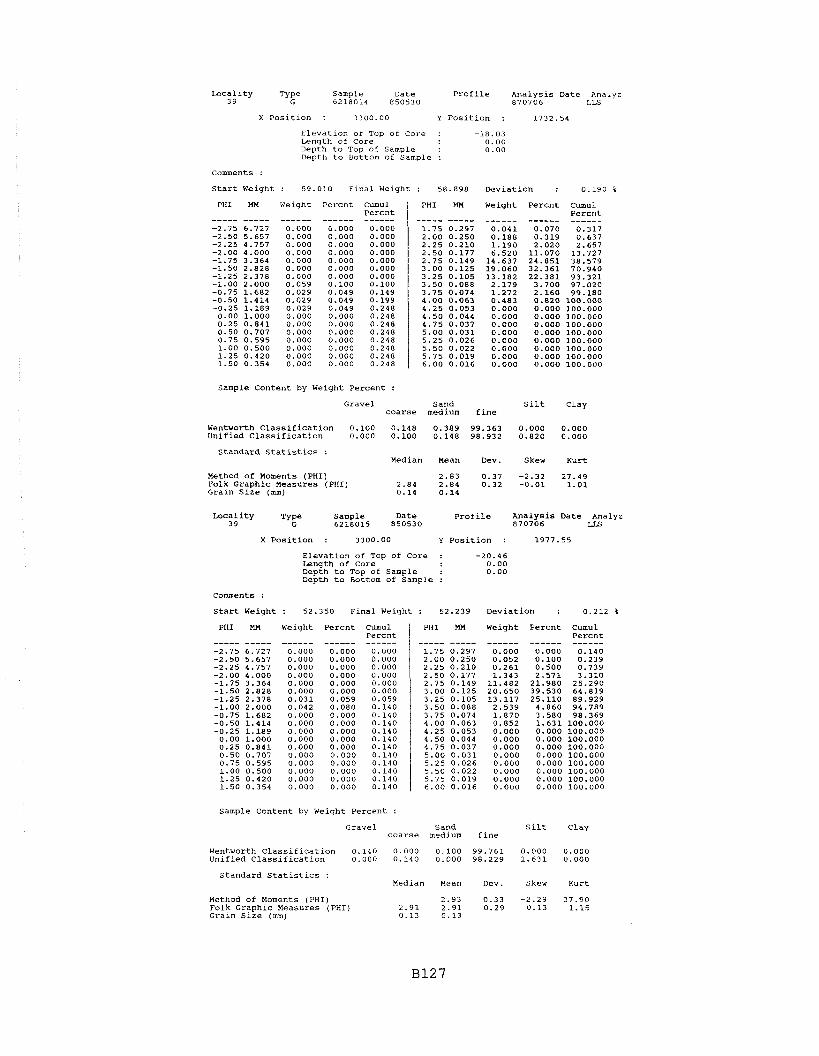
Locality Type Sample Date Profile Analysis Date Analyz 39 G 6218014 850530 870706 LLS
X Position : 3300.00 Y Position : 1732.54
Elevation of Top of Core : -18.03 Length of Core 0.00 Depth to Top of Sample : 0.00 Depth to Bottom of Sample :
Comments :
Start Weight : 59. ,010 Final Weiqht Deviation : 0.190 i;
PHI MM Weight Percnt Cumul Percnt ------ ------
0.000 0.000 0.000 0.000 0.000 0.000 0.000 0.000 0.000 0.000 0.000 0.000 0.000 0.000 0.100 0.100 0.049 0.149 0.049 0.199 0.049 0,248 0.000 0.248
PHI MM Weiqht Percnt Cumul Percnt ------ 0.317 0.637 2.657 13.727 38.579 70.940 93.321 97.020 99.180 100.000
ioo. 000 100.000 100.000 100.000 100.000
Sample Content by Weight Percent :
Gravel Sand Silt Clay coarse medium fine
Wentworth Classification 0.100 0.148 0.389 99.363 0.000 0.000 Unified Classification 0.000 0.100 0.148 98.932 0.820 0.000
Standard Statistics : Median Mean Dev. Skew Kurt
Method of Moments (PHI) Folk Graphic Measures (PHI) Grain Size (mn)
Locality ~ y p e sample Date profile Analysis Date Analyz 39 G 6218015 850530 870706 LLS
X Position : 3300.00 Y Position : 1977.55
Elevation of Top of Core : -20.46 Length of Core 0.00 Depth to Top of Sample : 0.00 Depth to Bottom of Sample :
Comments :
start Weight : 52.350 Final Weiqht : 52.239 Deviation : 0.212 %
PHI MM Weight Percnt Cumul Percnt ----- ----- ------ ------ ------
PHI MI4 Weight Percnt Cumul Percnt ----- ----- ------ ------ ------
Sample Content by Weiqht Percent :
Gravel Sand Silt Clay coarse medium fine
WentworthClassification 0.140 0.000 0.100 99.761 0.000 0.000 Unified Classification 0.000 0.140 0.000 98.229 1.631 0.000
Standard Statistics : Median Mean Dev. Skew Kurt
Method of Moments (PHI) Folk Graphic Measures (PHI) Grain Size (mm)
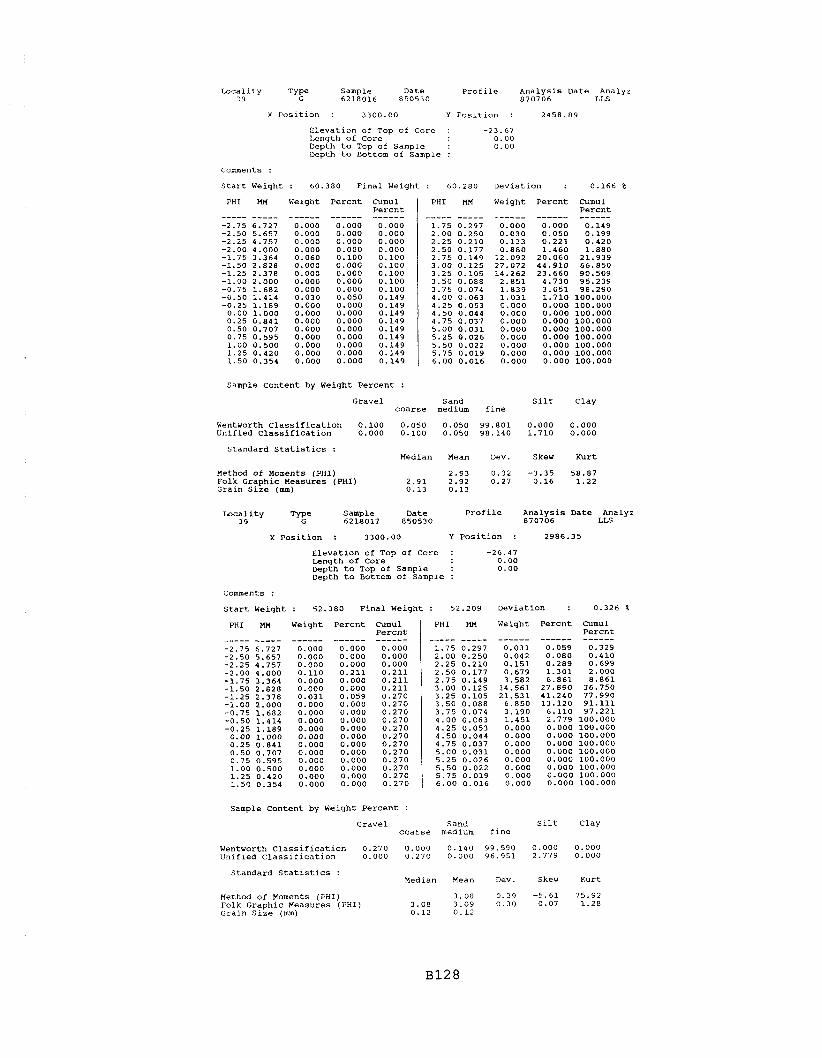
Loca l i t y Type Sample Date P r o f i l e Ana lys i s Date Analyz 29 G 6218016 850530 870706 LLS
x Pos i t i on : 3300.00 Y P o s i t i o n : 2458.89
Eleva t ion of Top of Core : -23.67 t eng th of Core 0.00 Depth t o Top of Sample : 0.00 Depth t o Bottom of Sample :
s t a r t Weight : 60.380 F i n a l Weight : 60.280 Deviat ion : 0.166 %
PHI MN Weight Pe rcn t Cumul P e r c n t ----- ----- ------ ------ ------
-2.75 6.727 0.000 0.000 0.000 -2.50 5.657 0.000 0.000 0.000 -2.25 4.757 0.000 0.000 0.000
PHI mf Weight P e r c n t Cumul Pe rcn t ----- ------ ------
1.75 0.297 0.000 0.000 0.149 2.00 0.250 0.030 0.050 0.199 2.25 0.210 0.133 0.221 0.420 2.50 0.177 0.880 1.460 1.880 2.75 0.149 12.092 20.060 21.939 3.00 0.125 27.072 44.910 66.850 3.25 0.105 14.262 23.660 90.509 3.50 0.088 2.851 4.730 95.239 3.75 0.074 1.839 3.051 98.290 4.00 0.063 1.031 1.710 100.000
Sample c o n t e n t by Weight Pe rcen t :
Gravel Sand S i l t c l a y c o a r s e medium f i n e
W e n t v o r t h c l a s s i f i c a t i o n 0.100 0.050 0.050 99.801 0.000 0.000 Unif ied C l a s s i f i c a t i o n 0.000 0.100 0.050 98.140 1.710 0.000
s t anda rd S t a t i s t i c s : Median Mean Dev. Skew Kurt
Method o f Moments (PHI) 2.93 0.32 -3.35 58.87 Folk Graphic Measures (PHI) 2.91 2.92 0.27 0.16 1.22 Grain S i z e (mm) 0.13 0.13
~ o c a l i t y Sample Date P r o f i l e Ana lys i s Date Analyz 3 9 6218017 850530 870706 LLS
x p o s i t i o n : 3300.00 Y P o s i t i o n : 2986.35
Eleva t ion of Top of Core : -26.47 Length o f Core 0.00 Depth t o Top of Sample : 0.00 Depth t o Bottom o f Sample :
Comments :
S t a r t Weight : 52.380 F i n a l Weight : 52.209 Deviat ion : 0.326 %
PHI HH Weight Pe rcn t ~ u m u l PHI m Weight P e r c n t Cumul Pe rcn t I P e r c n t
Sample Content by Weight Pe rcen t :
Gravel Sand S i l t Clay c o a r s e medium f i n e
W e n t v o r t h c l a s s i f i c a t i o n 0.270 0.000 0.140 99.590 0.000 0.000 Unif led C l a s s i f i c a t i o n 0.000 0.270 0.000 96.951 2.779 0.000
Standard S t a t i s t i c s : Median Mean Dev. Skew Kurt
Method o f Moments (PHI) 3.08 0.39 -5.61 75.92 Folk Graphic Measures (PHI) 3.08 3.09 0.30 0.07 1.28 Grain S i z e (mm) 0.12 0.12

Locality Type Sample Date Profile Analysis Date Analyz 39 G 6218102 850620 870706 LLS
x Position : 3300.00 Y Position : 195.13
Elevation of Top of Core : 18.27 Length of Core 0.00 Depth to Top of Sample : 0.00 Depth to Bottom of Sample :
Comments :
Start Weight
PHI MH
: 57.360 Final Weiqht
Weight Percnt Cumul Percnt ------ ------ ------
0.000 0.000 0.000 0.000 0.000 0.000 0.000 0.000 0.000 0.000 0.000 0.000 0.000 0.000 0.000 0.000 0.000 0.000 0.000 0.000 0.000 0.000 0.000 0.000 0.000 0.000 0.000 0.000 0.000 0.000 0.069 0.121 0.121 0.149 0.260 0.381 0.458 0.800 1.181 0.801 1.400 2.581 1.952 3.411 5.992 8.207 14.340 20.332 7.039 12.299 32.631 10.382 18.141 50.771
PHI MM
Deviation :
Weiqht Percnt Cumu 1 Percnt
Sample Content by Weight Percent :
Gravel Sand Silt Clay coarse medium fine
Wentworth Classification 0.000 20.332 66.279 13.390 0.000 0.000 Unified Classification 0.000 0.000 32.631 67.359 0.010 0.000
Standard Statistics : Median Mean Dev. Skew Kurt
Method of Uoments (PHI) 1.46 0.50 -0.08 3.18 Folk Graphic Measures (PHI) 1.49 1.46 0.50 -0.06 0.93 Grain Size (mm) 0.36 0.36
Locality Sample Date Profile Analysis Date Analyz 3 9 6218103 850620 870706 LLS
x Position : 3300.00 Y Position : 229.50
Elevation of Top of Core : 12.58 Length of Core 0.00 Depth to Top of Sample : 0.00 Depth to Bottom of Sample :
Comments :
Start Weight : 59.540 Final Weight : 59.420 Deviation : 0.202 %
Sample Content by Weight Percent :
PHI NH Weight Percnt Cumul Percnt ----- ----- ------ ------ ------
-2.75 6.727 0.000 0.000 0.000 -2.50 5.657 0.000 0.000 0.000
Gravel sand Silt Clay coarse medium fine
PHI MM Weight Percnt Cumul Percnt ----- ----- ------ ------ ------
1.75 0.297 5.538 9.320 77.661 2.00 0.250 5.657 9.520 87.181
Wentworth Classification 0.380 55.581 31.220 12.819 0.000 0.000 Unified Classification 0.000 0.380 60.931 38.679 0.010 0.000
Standard Statistics :
Method of Moments (PHI) Folk Graphic Measukes ?PHI) Grain size (mm)
Median Mean Dev. Skew Kurt

Locality Type Sample Date Profile Analysis Date Analyz 39 G 6218105 850620 870713 LLS
X Position : 3300.00 Y Position : 294.29
Elevation of Top of Core : 8.24 Length of Core 0.00 Depth to Top of Sample : 0.00 Depth to Bottom of Sample :
comments :
Start Weight : 83.960 Final Weight : 83.919 Deviation : 0.049 %
PHI Weight Percnt
------ cumu1 Percnt ------ 0.000 0.000 0.000 0.041 0.091 0.091 0.150 0.200 0.430
PHI
----- 1.75 2.00 2.25 2.50 2.75 3.00 3.25 3.50 3.75 4.00 4.25 4.50 4.75 5.00 5.25 5.50 5.75 6.00
Weight Percnt Cumul Percnt
Sample Content by Weight Percent :
Gravel Sand Silt Clay coarse medium fine
Wentworth Classification 0.200 8.750 48.350 42.700 0.000 0.000 Unified Classification 0.000 0.200 12.300 87.500 0.000 0.000
Standard Statistics : Median Mean Dev. Skew Kurt
Method of Moments (PHI) 1.83 0.63 -1.60 7.49 Folk Graphic Measures (PHI) 1.93 1.88 0.54 -0.25 1.54 Grain size (mm) 0.26 0.28
Locality Type sample Date Profile Analysis Date Analyz 3 9 G 6218106 850620 870713 LLS
x Position : 3300.00 Y Position : 329.57
Elevation of Top of Core : Length of core Depth to Top of Sample : Depth to Bottom of Sample :
Comments :
Start Weight : 59.660 Final Weight : 59.530 Deviation : 0.218 %
PHI MM Weight Percnt Cumul PHI MM Weight Percnt Cumul Percnt
Sample Content by Weight Percent :
Gravel Sand Silt Clay coarse medium fine
Wentworth Classification 5.090 23.279 28.481 43.150 0.000 0.000 Cnlfied Classification 0.000 5.090 25.080 69.830 0.000 0.000
Standard Statistics : Median Mean Dev. Skew Kurt
Kethod of Moments (PHI) 1.37 1.21 -0.98 2.52 Folk Graphic Measures (PHI) 1.90 1.29 1.24 -0.63 0.87 Grain Size (mm) 0.27 0.39

Locality Type Sample Date Profile Analysis Date Analyz 39 G 6218107 850620 870713 LIS
X Position : 3300.00 Y position : 483.27
Elevation of Top of Core : -6.78 Length of Core 0.00 Depth to Top of Sample : 0.00 wpth to Bottom of Sample :
Comments :
Start Weight : 56.110 Final Weight : 56.030 Deviation : 0.143 %
PHI Weight
------ Percnt
------ Cumul Percnt ------ 0.000
PHI
----- 1.75 2.00 2.25 2.50 2.75 3. 00 3.25 3.50 3.75 4.00 4.25 4.50 4.75 5.00 5.25 5.50 5.75 6.00
Weight Percnt Cumul Percnt ------ 27.098 51.769 75.609 90.710 96.900 99.020 99.720 99.930 100.000 100.000 100.000 100.000 100.000 100.000 100.000 100.000 100.000 100.000
Sample Content by Weight Percent :
Gravel Sand Silt Clay coarse medium fine
Wentworth Classification 0.498 7.819 43.452 48.231 0.000 0.000 Unified Classification 0.000 0.498 10.750 88.752 0.000 0.000
Standard Statistics : Median Mean Dev. Skew Kurt
Method of Homents (PHI) 1.88 0.64 -1.89 9.38 Folk Graphic Heasures (PHI) 1.98 1.95 0.54 -0.22 1.54 Grain size (mm) 0.25 0.27
Locality Sample Date Profile Analysis Date Analyz 39 l?? 6218108 850620 870713 LLS
X Position : 3300.00 Y Position : 622.81
Elevation of Top of Core : -6.19 Length of Core 0.00 Depth to Top of Sample : 0.00 Depth to Bottom of Sample :
Comments .: Start Weight : 50.130 Final Weight : 49.971 Deviation : 0.317 %
PHI HH Weight Percnt Cumul PHI MH Weight Percnt Cumul ~ercnt I Percnt
Sample Content by Weight Percent :
Gravel Sand Silt Clay coarse medium fine
Wentworth Classification 0.220 1.461 12.441 85.858 0.020 0.000 Unified Classification 0.000 0.220 2.141 97.559 0.080 0.000
Standard Statistics : Median Mean Dev. Skew Kurt
Method of Homents (PHI) Folk Graphic Measures (PHI) Grain Size (mm)

Sample Content by Weight Percent :
Locality Type Sample Date Profile Analysis Date Analyz 3 9 G 6218109 850620 870713 L I S
X Position : 3300.00 Y Position : 729.73
Elevation of Top of Core : -5.93 Length of Core 0.00 Depth to Top of Sample : 0.00 Depth to Bottom of Sample :
Comments :
Start Weight : 51.520 Final Weight : 51.338 Deviation : 0.353 %
Gravel Sand Silt Clay coarse medium fine
PHI MM Weight Percnt Cumul Percnt ----- ----- ------ ------ ------
-2.75 6.727 0.000 0.000 0.000 -2.50 5.657 0.000 0.000 0.000 -2.25 4.757 0.000 0.000 0.000 -2.00 4.000 0.000 0.000 0.000 -1.75 3.364 0.031 0.060 0.060 -1.50 2.828 0.082 0.160 0.220 -1.25 2.378 0.159 0.310 0.530 -1.00 2.000 0.041 0.080 0.610 -0.75 1.682 0.098 0.191 0.801 -0.50 1.414 0.221 0.430 1.231 -0.25 1.189 0.272 0.530 1.761 0.00 1.000 0.231 0.450 2.211 0.25 0.841 0.477 0.929 3.140 0.50 0.707 0.431 0.840 3.980 0.75 0.595 0.498 0.970 4.950 1.00 0.500 0.780 1.519 6.469 1.25 0.420 0.570 1.110 7.579 1.50 0.354 0.852 1.660 9.239
Wentworth Classification 0.610 5.859 13.740 79.781 0.010 0.000 unified Classification 0.000 0.610 6.969 92.411 0.010 0.000
PHI MM Weight Percnt Cumul Percnt ----- ----- ------ ------ ------
1.75 0.297 1.530 2.980 12.219 2.00 0.250 4.102 7.990 20.209 2.25 0.210 8.240 16.050 36.260 2.50 0.177 12.465 24.280 60.540 2.75 0.149 12.429 24.210 84.750 3.00 0.125 5.991 11.670 96.420 3.25 0.105 1.561 3.041 99.460 3.50 0.088 0.190 0.370 99.831 3.75 0.074 0.082 0.160 99.990 4.00 0.063 0.000 0.000 99.990 4.25 0.053 0.005 0.010 100.000 4.50 0.044 0.000 0.000 100.000 4.75 0.037 0.000 0.000 100.000 5.00 0.031 0.000 0.000 100.000 5.25 0.026 0.000 0.000 100.000 5.50 0.022 0.000 0.000 300.000 5.75 0.019 0.000 0.000 100.000 6.00 0.016 0.000 0.000 100.000
Standard Statistics : Median Mean Dev. Skew Kurt
Method of Moments (PHI) Folk Graphic Measures (PHI) Grain Size (mm)
Locality Type Sample Date Profile Analysis Date Analyz 39 G 870713 L I S 6218110 850620
X Position : 3300.00 Y Position : 835.01
Elevation of Top of Core : -10.61 Length of Core 0.00 Depth to Top of Sample : 0.00 Depth to Bottom of Sample :
Comments :
Start Weight : 53.220 Final Weight : 53.040 Deviation : 0.338 %
PHI MM Weight Percnt Cumul Percnt ----- ----- ------ ------ ------
PHI Hn Weight Percnt Cumul Percnt ----- ----- ------ ------ ------
Sample Content by Weight Percent :
Gravel Sand Silt Clay coarse medium fine
WentworthClassification 0.339 0.381 5.040 94.170 0.070 0.000 Unified Classification 0.000 0.339 0.551 98.831 0.279 0.000
Standard Statistics : Median Mean Dev. Skew Kurt
'lethod of Moments (PHI) Folk Graphic Measures (PHI) Grain Size (mm)

Loca l i t y Type Sample Date P r o f i l e Analysis Date Analyz 39 G 6218111 850620 870713 LLS
X P o s l t i o n : 3300.00 Y P o s i t i o n : 962.98
Eleva t ion of Top of Core : -12.56 Length of Core 0.00 Depth t o Top of Sample : 0.00 Depth t o Bottom of Sample :
Comments :
S t a r t Weight : 52.900 F i n a l Weight : 52.791 Deviat ion : 0.206 %
PHI
----- -2.75 -2.50 -2.25 -2.00 -1.75 -1.50 -1.25 -1.00 -0.75 -0.50 -0.25 0.00 0.25 0.50 0.75 1.00 1.25 1.50
Weight Pe rcn t
------ CumUl P e r c n t ------ 0.000 0.000 0.000 0.000 0.229 0.229 0.229 0.320 0.430
PHI
----- 1.75 2.00 2.25 2.50 2.75 3.00 3.25 3.50 3.75 4.00 4.25 4.50 4.75 5.00 5.25 5.50 5.75 6.00
Weight Percnt
------ 1.330 3.959 8.520 19.210 36.150 17.450 6.609 1.589 0.991 0.320 0.150 0.000 0.000 0.000 0.000 0.000 0.000 0.000
CUmUl Pe rcn t
Sample Content by Weight Pe rcen t :
Gravel Sand S i l t Clay c o a r s e medium f i n e
W e n t w o r t h c l a s s l f i c a t l o n 0.320 2.302 6.389 90.839 0.150 0.000 Unlf led C l a s s l f l c a t l o n 0.000 0.320 2.722 96.488 0.470 0.000
Standard S t a t i s t i c s : Median Mean Dev . Skew K u r t
Method of Moments (PHI) 2.51 0.57 -2.89 18.28 Folk Graphic Measures (PHI) 2.59 2.57 0.39 -0.14 1.36 Grain s i z e (mm) 0.17 0.18
Loca l i t y Type Sample Date p r o f i l e Analysis Date Analyz 3 9 G 6218112 850620 870713 LLS
X P o s i t i o n : 3300.00 Y P o s i t i o n : 1253.09
Eleva t ion o f Top o f Core : -13.18 Length of Core 0.00 Depth t o Top o f Sample : 0.00 Depth t o Bottom of Sample :
Comments :
S t a r t Weight : 50.700 F i n a l Weight : 50.499 Deviat ion : 0.396 %
PHI HH Weight Pe rcn t Cumul P e r c n t ----- ----- ------ ------ ------
PHI MM Weight Pe rcn t Cumul Pe rcn t ----- ----- ------ ------ ------
Sample Content by Weight Pe rcen t :
Gravel Sand S i l t Clay c o a r s e medium f i n e
Wentworth C l a s s i f i c a t i o n 0.160 3.358 7.939 88.483 0.059 0.000 U n i f i e d c l a s s i f i c a t i o n 0.000 0.160 3.909 95.592 0.339 0.000
Standard S t a t i s t i c s : Median Mean Dev. Skew Kurt
Method of Moments (PHI) 2.45 0.59 -2.07 10.91 Folk Graphic Measures (PHI) 2.53 2.51 0.46 -0.14 1.40 Grain S i z e (mm) 0.17 0.18

Locality Type Sample Date Profile Analysis Date Analyz 3 9 G 6218113 850620 870713 LLS
X Position : 3300.00 Y Position : 1470.25
Elevation of Top of Core : -14.90 Length of Core 0.00 Depth to Top of Sample : 0.00 Depth to Bottom of Sample :
Comments :
Start Weight : 58.280 Final Weight : 58.062 Deviation : 0.374 %
PHI HH Weight Percnt Cum1.11 PHI MH Weight Percnt Cumul ~ercnt I Percnt
----- ---__ --__-_ --__-- ------ --_-- _--__ ------ ------ ------
Sample Content by Weight Percent :
Gravel Sand Silt Clay coarse medium fine
Wentworth Classification Unified Classification
standard Statistics : Median Mean Dev. Skew Kurt
Method of Moments (PHI) 2.47 0.59 -3.86 25.18 Folk Graphic Measures (PHI) 2.53 2.52 0.34 -0.04 1.19 Grain Size (mm) 0.17 0.18
Locality Type Sample Date Profile Analysis Date Analyz 3 9 G 6218114 850620 870713 SJT
X Position : 3300.00 Y Position : 1765.23
Elevation of Top of Core : -18.46 Length of Core 0.00 Depth to Top of Sample : 0.00 Depth to Bottom of Sample :
Comments :
Start Weight : 58.730 Final Weight : 58.549 Deviation : 0.308 %
PHI MM Weight Percnt Cumul Percnt ----- ----- ------ ------ ------
PHI MM Weight Percnt Cumul Percnt ----- ----- ------ ------ ------
Sample Content by Weight Percent :
Gravel Sand Silt Clay coarse medium fine
Wentworth Classification 0.161 0.050 0.369 99.221 0.200 0.000 Unified Classification 0.000 0.161 0.050 98.980 0.810 0.000
Standard Statistics : Median Mean Dev. Skew Kurt
Method of Moments (PHI) 2.75 0.38 -2.47 37.15 Folk Graphic Measures (PHI) 2.70 2.76 0.32 0.28 1.09 Grain size (mm) 0.15 0.15

lacality Type Sample Date Profile Analysis Date Analyz 3 9 G 6218115 850620 870713 SJT
X Position : 3300.00 Y Position : 2 0 1 4 . 3 3
Elevation of Top of Core : -20 .74 Length of Core 0.00 ~epth to Top of Sample : 0.00 Depth to Bottom of Sample :
Comments :
Start Weight
PHI MI4
: 50 .240 Final Weight
Weight Percnt Cumul Percnt ------ ------ ------
0.000 0.000 0.000 0.000 0.000 0.000 0.000 0.000 0.000 0.000 0.000 0.000 0.000 0.000 0.000 0.000 0.000 0.000 0.050 0.100 0.100 0.000 0.000 0.100 0.000 0.000 0.100 0.000 0.000 0.100 0.000 0.000 0.100 0.000 0.000 0.100 0.000 0.000 0.100 0.000 0.000 0.100 0.000 0.000 0.100 0.000 0.000 0.100 0.000 0.000 0.100 0.000 0.000 0.100
PHI MI4
Deviation :
Weight Percnt Cumul Percnt
Sample Content by Weight Percent :
Gravel Sand silt Clay coarse medium fine
Wentworth Classification 0.100 0.000 0.080 9 9 . 4 3 1 0.389 0.000 unified Classification 0.000 0.100 0.000 98 .491 1.409 0.000
Standard Statistics : Median Mean Dev. Skew Kurt
Method of Moments (PHI) Folk Graphic Measures (PHI) Grain Size (mm)
Locality Type sample Date Profile Analysis Date Analyz 3 9 G 870714 LLS 6218116 850620
Xposition : 3300.00 Y Position : 0.00
Elevation of Top of Core : -23.60 Length of Core 0.00 Depth to Top of Sample : 0.00 Depth to Bottom of Sample :
Comments :
Startweight: 58.060 Finalweight: 57.971 Deviation : 0.153 %
PHI MM Weight Percnt Cumul Percnt ----- ----- ------ ------ ------
PHI HM Weight Percnt Cumul Percnt ----- ----- ------ ------ ------
Sample Content by Weight Percent :
Gravel Sand Silt Clay coarse medium fine
Wentworth Classification 0.000 0.000 0.071 99.489 0 . 4 4 0 0.000 Unified Classification 0.000 0.000 0.000 98.649 1.351 0.000
Standard Statistics : Median Mean ~ e v . Skew Kurt
Method of Moments (PHI) 2 .85 0 .28 1 . 4 5 6 . 3 1 Folk Graphic Measures (PHI) 2.81 2 . 8 3 0 .26 0 .24 1.15 Grain Size (mm) 0 . 1 4 0.14

sample Content by Weight Percent :
Locality Type Sample Date Profile Analysis Date Analyz 3 9 G 6218117 850620 870714 LLS
X Position : 3300.00 Y Positlon : 2927.14
Elevation of Top of Core : -26.29 Length of Core 0.00 Depth to Top of Sample : 0.00 Depth to Bottom of Sample :
Comments :
Start Weight : 55.660 Final Weight : 55.610 Deviation : 0.090 %
Gravel Sand Silt Clay coarse medium fine
PHI Mn Weight Percnt Cumul Percnt ----- ----- ------ ------ ------
-2.75 6.727 0.000 0.000 0.000 -2.50 5.657 0.000 0.000 0.000 -2.25 4.757 0.000 0.000 0.000 -2.00 4.000 0.000 0.000 0.000 -1.75 3.364 0.072 0.129 0.129 -1.50 2.828 0.000 0.000 0.129 -1.25 2.378 0.000 0.000 0.129 -1.00 2.000 0.000 0.000 0.129 -0.75 1.682 0.000 0.000 0.129 -0.50 1.414 0.000 0.000 0.129 -0.25 1.189 0.000 0.000 0.129 0.00 1.000 0.000 0.000 0.129 0.25 0.841 0.000 0.000 0.129 0.50 0.707 0.000 0.000 0.129 0.75 0.595 0.000 0.000 0.129 1.00 0.500 0.000 0.000 0.129 1.25 0.420 0.000 0.000 0.129 1.50 0.354 0.000 0.000 0.129
Standard Statistics :
Method of Moments (PHI)
PHI MM Weight Percnt Cumul Percnt ----- ----- ------ ------ ------
1.750.297 0.000 0.000 0.129 2.00 0.250 0.028 0.050 0.180 2.25 0.210 0.122 0.219 0.399 2.500.177 0.701 1.261 1.660 2.75 0.149 11.178 20.101 21.760 3.00 0.125 24.441 43.951 65.711 3.25 0.105 11.411 20.520 86.231 3.50 0.088 3.809 6.849 93.080 3.750.074 2.669 4.799 97.880 4.00 0.063 0.840 1.511 99.390 4.25 0.053 0.339 0.610 100.000 4.500.044 0.000 0.000 100.000 4.75 0.037 0.000 0.000 100.000 5.00 0.031 0.000 0.000 100.000 5.25 0.026 0.000 0.000 100.000 5.50 0.022 0.000 0.000 100.000 5.75 0.019 0.000 0.000 100.000 6.00 0.016 0.000 0.000 100.000
~ o l k Graphic Measures PHI) Grain size (mm)
Median Mean Dev. Skew Kurt
2.95 0.35 -2.71 50.05 2.91 2.94 0.30 0.22 1.26 0.13 0.13
sample Content by Weight Percent :
Locality Type Sample Date Profile Analysis Date Analyz 39 G 6218202 850715 870714 LLS
X Position : 3300.00 Y Position : 196.20
Elevation of Top of Core : 17.89 Length of Core 0.00 Depth to Top of Sample : 0.00 Depth to Bottom of Sample :
Comments :
Start Weight : 55.880 Final Weight : 55.810 Deviation : 0.125 %
Gravel Sand Silt Clay coarse medium fine
PHI MM Weight Percnt Cumul Percnt ----- ----- ------ ------ ------
-2.75 6.727 0.000 0.000 0.000 -2.50 5.657 0.000 0.000 0.000 -2.25 4.757 0.000 0.000 0.000 -2.00 4.000 0.000 0.000 0.000 -1.75 3.364 0.000 0.000 0.000 -1.50 2.828 0.000 0.000 0.000 -1.25 2.378 0.000 0.000 0.000 -1.00 2.000 0.000 0.000 0.000 -0.75 1.682 0.000 0.000 0.000 -0.50 1.414 0.073 0.131 0.131 -0.25 1.189 0.167 0.299 0.430 0.00 1.000 0.218 0.391 0.821 0.25 0.841 0.647 1.159 1.980 0.50 0.707 1.150 2.061 4.040 0.75 0.595 2.082 3.731 7.771 1.00 0.500 7.562 13.550 21.321 1.25 0.420 7.049 12.630 33.951 1.50 0.354 9.437 16.909 50.860
wentworth Classification Unified Classification
PHI MM Weight Percnt Cumul Percnt ----- ----- ------ ------ ------
1.75 0.297 10.096 18.090 68.950 2.00 0.250 9.069 16.250 85.200 2.25 0.210 4.247 7.610 92.810 2.50 0.177 2.701 4.840 97.649 2.75 0.149 0.999 1.790 99.439 3.00 0.125 0.240 0.430 99.869 3.25 0.105 0.073 0.131 100.000 3.50 0.088 0.000 0.000 100.000 3.75 0.074 0.000 0.000 100.000 4.00 0.063 0.000 0.000 100.000 4.25 0.053 0.000 0.000 100.000 4.50 0.044 0.000 0.000 100.000 4.75 0.037 0.000 0.000 100.000 5.00 0.031 0.000 0.000 100.000 5.25 0.026 0.000 0.000 100.000 5.50 0.022 0.000 0.000 100.000 5.75 0.019 0.000 0.000 100.000 6.00 0.016 0.000 0.000 100.000
Standard Statistics : Median Mean Dev. Skew Kurt
Nethod of Moments (PHI) 1.46 0.55 -0.22 3.28 Folk Graphlc ~easukes ;PHI) 1.49 1.46 0.54 -0.06 0.96 Graln slze (mm) 0.36 0.36

Locality Type Sample Date Profile Analysis Date Analyz 39 G 6218203 850715 870714 LLS
X Position : 3300.00 Y Position : 230.92
Elevation of Top of Core : 12.41 Length of Core 0.00 Depth to Top of Sample : 0.00 Depth to Bottom of Sample :
Comments :
Start Weight : 61.850 Final Weight : 61.841 Deviation : 0.015 %
PHI MM Weight Percnt C u m U l Percnt
PHI MM Weiqht Percnt
------ 6.551 8.181 5.320 3.671 1.329 0.260 0.050 0.000 0.000 0.000 0.000 0.000 0.000 0.000 0.000 0.000 0.000 0.000
Cumul Percnt ------ 81.189 89.370 94.690 98.360 99.690 99.950 100.000 100.000 100.000 100.000
Sample Content by Weight Percent :
Gravel Sand Silt Clay coarse medium fine
Wentworth Classification 0.949 64.469 23.952 10.630 0.000 0.000 Unified Classification 0.000 0.949 68.689 30.362 0.000 0.000
Standard Statistics : Median Mean Dev. Skew Kurt
Method of Moments (PHI) Folk Graphic Measures (PHI) Grain Size (mm)
Sample Content by Weight Percent :
Locality Type Sample Date Profile Analysis Date Analyz 39 G 6218204 850715 870714 SJT
X Position : 3300.00 Y Position : 263.27
Elevation of Top of Core : 8.75 Length of Core 0.00 Depth to Top of Sample - 0.00 Depth to Bottom of Sample I
Comments :
Start Weiqht : 63.200 Final Weight : 63.191 Deviation : 0.014 %
Gravel Sand Silt Clay coarse medium fine
PHI MM Weight Percnt Cumul Percnt ----- ----- ------ ------ ------
-2.75 6.727 0.000 0.000 0.000 -2.50 5.657 0.000 0.000 0.000 -2.25 4.757 0.000 0.000 0.000 -2.00 4.000 0.133 0.210 0.210 -1.75 3.364 0.379 0.600 0.810 -1.50 2.828 0.701 1.109 1.920 -1.25 2.378 0.480 0.760 2.679 -1.00 2.000 0.531 0.840 3.519 -0.75 1.682 0.973 1.540 5.059 -0.50 1.414 1.409 2.230 7.289 -0.25 1.189 1.788 2.830 10.119 0.00 1.000 1.567 2.480 12.598 0.25 0.841 2.509 3.971 16.569 0.50 0.707 2.357 3.730 20.299 0.75 0.595 2.092 3.311 23.609 1.00 0.500 3.520 5.570 29.180 1.25 0.420 2.553 4.040 33.220 1.50 0.354 4.013 6.351 39.571
Wentworth Classification 3.519 25.660 40.800 30.020 0.000 0.000 Unified Classification 0.000 3.519 29.700 66.780 0.000 0.000
Standard Statistics : Median Mean Dev. Skew Kurt
PHI MM Weight Percnt Cumul Percnt ----- ----- ------ ------ ------
1.75 0.297 6.761 10.699 50.270 2.00 0.250 12.455 19.710 69.980 2.25 0.210 7.349 11.630 81.610 2.50 0.177 7.520 11.900 93.510 2.75 0.149 3.248 5.140 98.650 3.00 0.125 0.682 1.079 99.729 3.25 0.105 0.133 0.210 99.940 3.50 0.088 0.038 0.060 100.000 3.75 0.074 0.000 0.000 100.000 4.00 0.063 0.000 0.000 100.000 4.25 0.053 0.000 0.000 100.000 4.50 0.044 0.000 0.000 100.000 4.75 0.037 0.000 0.000 100.000 5.00 0.031 0.000 0.000 100.000 5.25 0.026 0.000 0.000 100.000 5.50 0.022 0.000 0.000 100.000 5.75 0.019 0.000 0.000 100.000 6.00 0.016 0.000 0.000 100.000
Method of Moments (PHI) Folk Graphic Measures (PHI) Grain Size (mm)
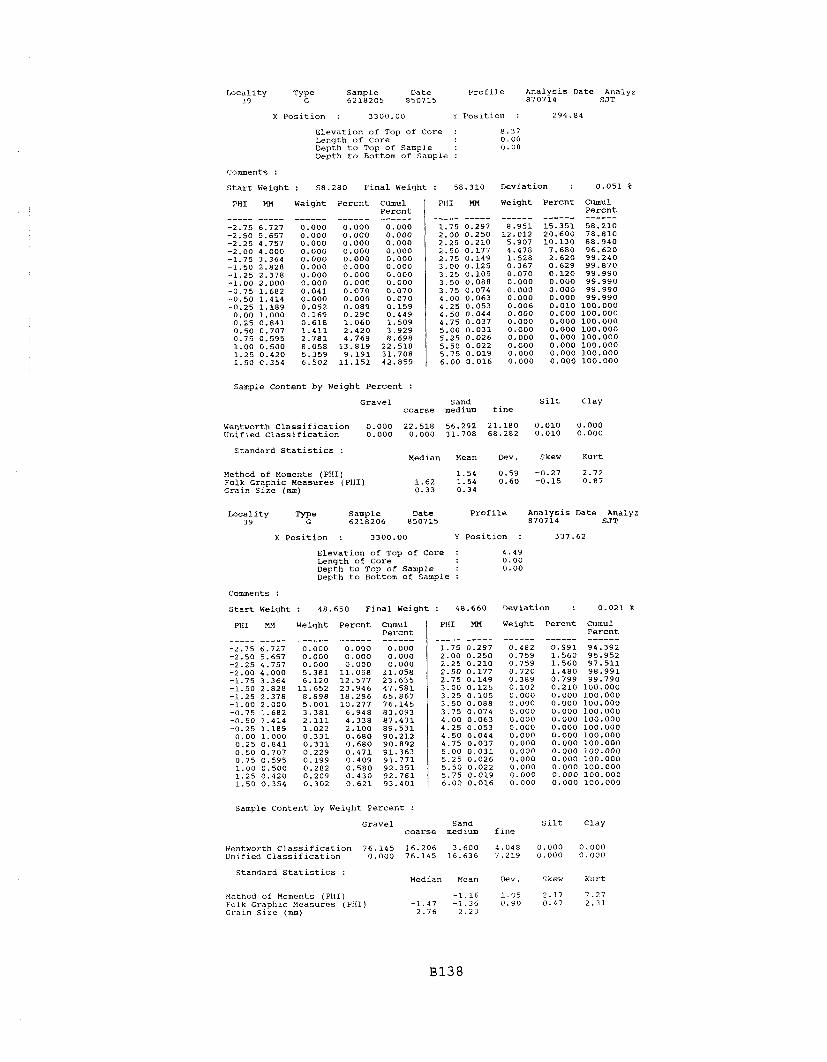
Locality Type Sample Date Profile Analysis Date Analyz 3 9 G 6218205 850715 870714 SJT
X Position : 3300.00 Y Position : 294.84
Elevation of Top of Core : 8.37 Length of Core 0.00 Depth to Top of Sample : 0.00 Depth to Bottom of Sample :
Comments :
start Weiqht : 58.280 final Weiqht : 58.310 Deviation : 0.051 %
PHI MM Weight Percnt Cumul Percnt ----- ----- ------ ------ ------
PHI
----- 1.75 2.00 2.25 2.50 2.75 3.00 3.25 3.50 3.75 4.00 4.25 4.50 4.75 5.00 5.25 5.50 5.75 6.00
Weight Percnt Cumul Percnt
Sample Content by Weight Percent :
Gravel sand Silt Clay coarse medium fine
Wentworth Classification 0.000 22.518 56.292 21.180 0.010 0.000 Unified Classification 0.000 0.000 31.708 68.282 0.010 0.000
Standard Statistics : Median Mean Dev. Skew Kurt
Method of Moments (PHI) 1.54 0.59 -0.27 2.72 Folk Graphic Measures (PHI) 1.62 1.54 0.60 -0.15 0.87 Grain Size (mm) 0.33 0.34
Locality T Sample Date Profile Analysis Date Analyz 3 9 6218206 850715 870714 SJT
x Position : 3300.00 Y Position : 337.62
Elevation of Top of Core : 4.49 Length of Core 0.00 Depth to Top of Sample : 0.00 Depth to Bottom of Sample :
Comments :
start Weight : 48.650 Final Weight : 48.660 Deviation : 0.021 %
PHI m4 Weight Percnt Cumul Percnt ----- ----- ------ ------ ------
PHI
----- 1.75 2.00 2.25 2.50 2.75 3.00 3.25 3.50 3.75 4.00 4.25 4.50 4.75 5.00 5.25 5.50 5.75 6.00
Weight Percnt
------ 0.991 1.560 1.560 1.480 0.799 0.210 0.000 0.000 0.000 0.000 0.000 0.000 0.000 0.000 0.000 0.000 0.000 0.000
Cumul Percnt
Sample Content by Weiqht Percent :
Gravel sand Silt Clay coarse medium fine
Wentworth Classification 76.145 16.206 3.600 4.048 0.000 0.000 Unified Classification 0.000 76.145 16.636 7.219 0.000 0.000
Standard Statistics : Median Mean Dev. Skew Kurt
Method of Moments (PHI) -1.16 1.05 2.17 7.27 Folk Graphic Measures (PHI) -1.47 -1.36 0.90 0.47 2.31 Grain Size (mm) 2.76 2.23
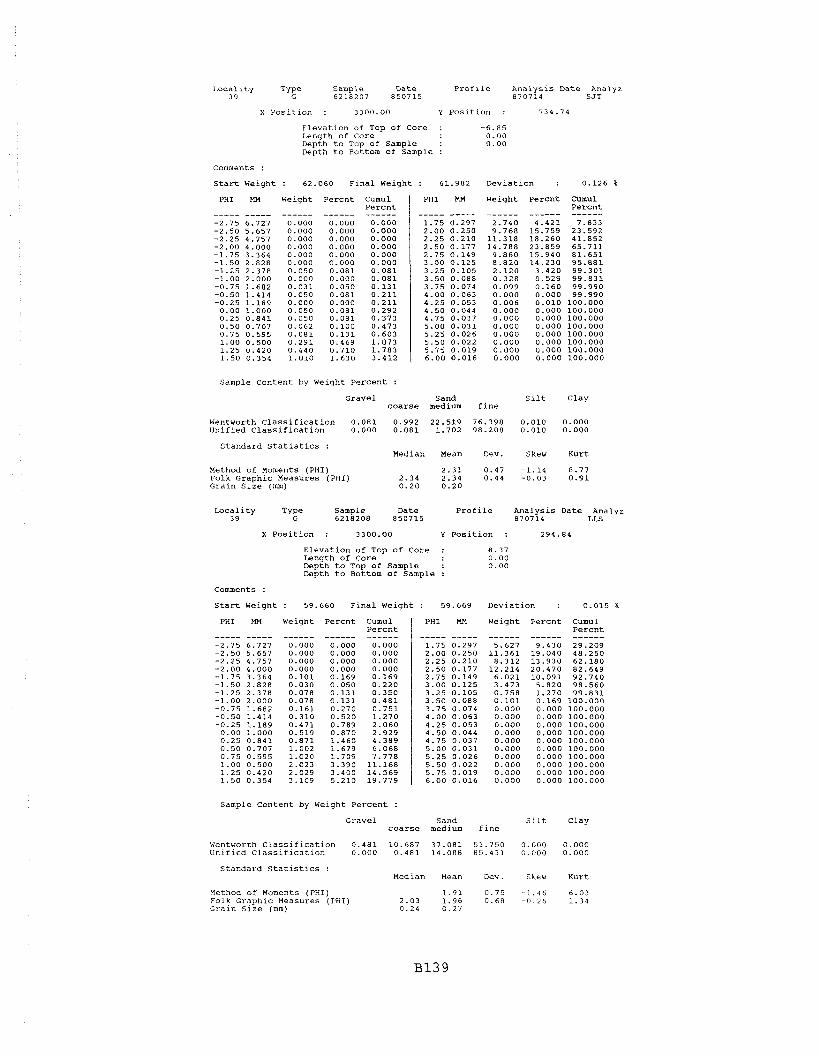
Locality Type Sample Date Proflle Analysis Date Analyz 39 G 6218207 850715 870714 SJT
x Position : 3300.00 Y Posltion : 734.74
Elevation of Top of Core : Length of Core Depth to Top of Sample : Depth to Bottom of Sample :
Comments :
Start Weight : 62.060 Final Weight : 61 .982 Deviation : 0.126 %
PHI MM Weight Percnt Cumul PHI MM Weight Percnt Cumul ~ercnt I Percnt
Sample Content by Weight Percent :
Gravel Sand Silt Clay coarse medium fine
Wentworth classification 0 . 0 8 1 0.992 22.519 76 .398 0 .010 0 . 0 0 0 Unified Classification 0 .000 0 . 0 8 1 1 .702 98.208 0 .020 0.000
Standard Statistics : Median Mean Dev. Skew Kurt
Method of Moments (PHI) 2 . 3 1 0 .47 -1.14 8 .77 Folk Graphic Measures (PHI) 2.34 2.34 0 .44 -0.03 0 . 9 1 Grain Size (mm) 0.20 0.20
Locality Type Sample Date Profile ~nalysis Date Analyz 3 9 G 6218208 850715 870714 LLS
X Position : 3300 .00 Y Position : 294.84
Comments :
Start Weight
PHI MM
Elevation of Top of Core : Length of Core Depth to Top of Sample : Depth to Bottom of Sample :
: 59.660 Final Weight
Weight Percnt Cumul Percnt ------ ------ ------
0 .000 0 .000 0.000 0 .000 0 .000 0 . 0 0 0 0.000 0 .000 0 .000 0 .000 0 .000 0 . 0 0 0 0 . 1 0 1 0 .169 0 .169 0 .030 0 .050 0 . 2 2 0 0.078 0 . 1 3 1 0 .350 0.078 0 . 1 3 1 0 . 4 8 1 0 . 1 6 1 0 .270 0 . 7 5 1 0 .310 0.520 1 .270 0 . 4 7 1 0 .789 2 .060 0 .519 0 .870 2 .929 0 . 8 7 1 1 .460 4 .389 1.002 1 .679 6 .068 1 .020 1 .709 7.778 2 .023 3.390 11 .168 2.029 3.400 1 4 . 5 6 9 3.109 5 .210 19 .779
Sample Content by Weight Percent :
PHI MM
Gravel coarse
Wentworth Classification 0 . 4 8 1 10 .687 unified Classification 0 . 0 0 0 0 . 4 8 1
Standard Statistics : Median
Method of Moments (PHI) Folk Graphic Measures (PHI) 2.03 Grain size (mm) 0 .24
Deviation :
Weight Percnt
0.015 %
Cumul Percnt ------ 29.209 48 .250 62 .180 82.649 92 .740 98 .560 9 9 . 8 3 1
100 .000 1 0 0 . 0 0 0 100 .000 100 .000 100 .000 100 .000 100 .000 1 0 0 . 0 0 0 100.000 100 .000 100 .000
Sand Silt Clay medium fine
Mean Dev. Skew Kurt

Locality Type Sample Date Profile Analysis Date Analyz 39 G 6218209 850715 870714 L I S
X posltion : 3300 .00 Y Position : 605 .73
Elevation of Top of Core : -4 .23 Length of Core 0.00 Depth to Top of Sample : 0.00 Depth to Bottom of Sample :
Comments : 1 ROCK 1 CN
Start Weight : 63 .820 Final Weight : 63.789 Deviation : 0.049 %
PHI MM Weight Percnt Cumul PHI HH Weight Percnt Cumul Percnt I Percnt
Sample Content by Weight Percent :
Gravel Sand silt Clay coarse medium fine
Wentvorth Classification 0.680 1.159 24 .721 7 3 . 4 3 1 0.009 0.000 Unified Classification 0 .000 0 .680 2.239 97.072 0 .009 0.000
standard Statistics : Median Mean Dev. Skew Kurt
Method of Moments (PHI) 2.25 0.56 -2.86 20.77 Folk Graphic Measures (PHI) 2 . 3 1 2.29 0 .44 -0 .10 1 . 0 0
0 . 2 1 Grain size (mm) 0.20
Locality Type Sample Date Profile Analysis Date Analyz 3 9 G 6218210 850715 870714 LLS
X Position : 3300 .00 Y Position : 882.23
Elevation of Top of Core : - 1 1 . 8 1 Length of Core 0 .00 Depth to Top of Sample : 0 . 0 0 Depth to Bottom of Sample :
Comments :
Start Weight : 5 3 . 7 5 0 Final Weight : 53.664 Deviation : 0.160 %
PHI
----- -2 .75 -2 .50 -2.25 -2.00 -1.75 -1 .50 -1.25 -1.00 -0 .75 -0.50 -0 .25
0.00 0.25 0 .50 0 . 7 5 1 .00 1 . 2 5 1 . 5 0
Weight
------ Percnt CumUl
Percnt ------ 0.000 0.000 0 .000 0 .000 0 . 3 7 1 0.442 0 .572 0 . 7 2 1
PHI
----- 1 .75 2 .00 2 . 2 5 2.50 2.75 3 .00 3 .25 3 .50 3 .75 4 .00 4.25 4 . 5 0 4 .75 5 . 0 0 5 .25 5 .50 5 .75 6 .00
Weiqht
------ Percnt
------ 0 . 8 9 1 2 . 6 1 1 5 .590
1 4 . 9 4 9 46.377 1 9 . 5 6 8
4 . 5 8 0 1 .420 0 . 6 7 1 0 . 1 7 0 0 .050 0 . 0 0 0 0 .000 0 .000 0 .000 0 .000 0 . 0 0 0 0 .000
Cumul Percnt ------
Sample Content by Weight Percent :
Gravel Sand Silt Clay coarse medium fine
WentvorthClassification 0 . 7 2 1 1.811 4.092 9 3 . 3 2 5 0.050 0.000 Unified Classification 0 . 0 0 0 0 . 7 2 1 2 . 0 3 1 9 7 . 0 2 8 0 . 2 2 0 0 .000
Standard Statistics : Median Mean Dev. Skew Kurt
Uethod of Moments (PHI) 2.54 0 .59 - 4 . 0 8 26 .27 Folk Graphic Measures (PHI) 2 .62 2 . 6 1 0 .33 -0 .16 1.69 Grain Size (mm) 0 . 1 6 0 . 1 7

Locality Type Sample Date Profile Analysis Date Analyz 3 9 G 6218211 850715 870714 SJT
X Positlon : 3300.00 Y Position : 965.49
Elevation of Top of Core : -12.58 Length of Core 0.00 Depth to Top of Sample : 0.00 Depth to Bottom of Sample :
Comments :
Start
PHI
Weight
MM
----- 6.727 5.657 4.757 4.000 3.364 2.828 2.378 2.000 1.682 1.414 1.189 1.000 0.841 0.707 0.595 0.500 0.420 0.354
: 62.
Weight
------ 0.000 0.000 0.000 0.000 0.000 0.000 0.000 0.000 0.000 0.000 0.000 0.000 0.031 0.050 0.062 0.100 0.050 0.100
410 Final Weight Deviation :
Percnt cumul Percnt - - - - - - - - - - - -
0.000 0.000 0.000 0.000 0.000 0.000 0.000 0.000 0.000 0.000 0.000 0.000 0.000 0.000 0.000 0.000 0.000 0.000 0.000 0.000 0.000 0.000 0.000 0.000 0.050 0.050 0.080 0.130 0.100 0.230 0.161 0.391 0.080 0.471 0.161 0.632
PHI MM Weight Percnt cumu1 Percnt ------
Sample Content by Weight Percent :
Gravel Sand Silt Clay coarse medium fine
Wentworth Classification 0.000 0.391 1.771 97.138 0.701 0.000 Unified Classification 0.000 0.000 0.471 97.718 1.811 0.000
Standard Statistics : Median Mean Dev. Skew Kurt
Method Of Moments (PHI) 2.77 0.41 -0.22 6.69 Folk Graphic Measures (PHI) 2.74 2.76 0.38 0.12 1.14 Grain Size (mm) 0.15 0.15
Sample Date Profile Analysis Date Analyz 39 6218212 850715 870714 SJT
X Position : 3300.00 Y Position : 1224.82
Elevation of Top of Core : -13.17 Length of Core 0.00 Depth to Top of Sample : 0.00 Depth to ~ottom of sample :
Comments :
Start Weight : 57
Weight
.890 Final Weight
Percnt Cumul Percnt ------ ------
0.000 0.000 0.000 0.000 0.000 0.000 0.000 0.000 0.140 0.140 0.000 0.140 0.240 0.380 0.169 0.550 0.140 0.690 0.310 0.999 0.420 1.420 0.349 1.769
Deviation :
PHI MM PHI HM Weiqht Percnt CumUl Percnt
Sample Content by Weiqht Percent :
Gravel Sand Silt Clay coarse medium fine
Wentworth Classification 0.550 3.830 7.280 88.131 0.209 0.000 Unified C1ass;fication 0.000 0.550 4.441 94.190 0.820 0.000
Standard Statistics : Median Mean Dev. Skew Kurt
Method of Moments (PHI) 2.51 0.71 -2.31 11.76 Folk Graphic Measures (PHI) 2.60 2.58 0.54 -0.18 1.57 Grain Size (mm) 0.16 0.18

Locality Type Sample Date Profile Analysis Date Analyz 3 9 G 6218213 850715 870715 LLS
X Position : 3300.00 Y Position : 1472.89
Elevation of Top of Core : -15.07 Length of Core 0.00 Depth to Top of Sample : 0.00 Depth to Bottom of Sample :
Comments :
Start Weight : 50.190 Final Weight : 50.138 Deviation : 0.104 %
PHI
----- -2.75 -2 .SO -2.25 -2.00 -1.75 -1.50 -1.25 -1.00 -0.75 -0.50 -0.25 0.00 0.25 0.50 0.75 1.00 1.25 1.50
Weight Percnt Cumul Percnt ------ 0.000 0.000
PHI Weight Percnt
------ 0.780 3.530 18.431 29.451 22.851 12.960 5.110 1.039 0.979 0.160 0.050 0.000 0.000 0.000 0.000 0.000 0.000 0.000
Cumul Percnt
Sample Content by Weight Percent :
Gravel Sand Silt Clay coarse medium fine
Wentworth Classification 1.580 2.581 4.809 90.981 0.050 0.000 Unified Classification 0.000 1.580 2.800 95.411 0.209 0.000
Standard Statistics : Median Mean Dev. Skew Kurt
Hethod of Moments (PHI) 2.36 0.74 -3.25 16.74 folk Graphic Measures (PHI) 2.44 2.46 0.41 -0.02 1.28 Grain size (mm) 0.18 0.19
Locality sample Date profile Analysis Date Analyz 39 6218214 850715 870715 LLS
X Position : 3300.00 Y Position : 1731.34
Elevation of Top of Core : -18.12 Length of Core 0.00 Depth to Top of Sample . 0.00 Depth to Bottom of Sample
Comments :
Start Weight : 53.700 Final Weight
Weight Percnt Cumul Percnt ------ ------ ------
0.000 0.000 0.000 0.000 0.000 0.000 0.000 0.000 0.000 0.000 0.000 0.000 0.059 0.110 0.110 0.000 0.000 0.110 0.032 0.060 0.170 0.112 0.209 0.380 0.037 0.069 0.449 0.000 0.000 0.449 0.000 0.000 0.449 0.000 0.000 0.449 0.000 0.000 0.449 0.000 0.000 0.449 0.000 0.000 0.449 0.000 0.000 0.449 0.000 0.000 0.449 0.000 0.000 0.449
Deviation : 0.410 %
cumu1 Percnt ------ 0.539 0.948 3.547 21.588 68.878 90.568 96.668 98.168 99.478 99.869 100.000 100.000 100.000 100.000 100.000 100.000 100.000 100.000
PHI MM PHI HM Weight Percnt
Sample Content by Weight Percent :
Gravel Sand Silt Clay coarse medium fine
Wentworth Classification 0.380 0.069 0.499 98.921 0.131 0.000 Unified Classification 0.000 0.380 0.069 99.030 0.522 0.000
Standard Statistics : Median Mean Dev. Skew Kurt
Kethod of Moments (PHI) 2.66 0.39 -4.55 54.28 Folk Graphic Measures (PHI) 2.65 2.67 0.26 0.13 1.23 Grain size (mm) 0.16 0.16

Locality Type Sample Date Profile Analysis Date Analyz 39 G 6218215 850715 870715 LLS
X Position : 3300.00 Y Position : 1975.56
Elevation of Top of Core : -20.54 Length of Core 0.00 Depth to Top of Sample : 0.00 Depth to Bottom of Sample :
Comments :
Start Weight : 60.070 Final Weight : 59.772 Deviation : 0.496 %
PHI MM Weight Percnt Cumul PHI MM Weight Percnt Cumul ~ercnt I Percnt ----- ----- ------ ------ ------ ----- ----- ------ ------ ------
Sample Content by Weight Percent :
Gravel Sand Silt Clay coarse medium fine
Wentworth Classification 0.201 0.050 0.181 99.418 0.151 0.000 Unified Classification 0.000 0.201 0.050 99.148 0.601 0.000
Standard Statistics : Median Mean Dev. Skew Kurt
Method of Moments (PHI) 2.73 0.32 -4.27 67.09 Folk Graphic Measures (PHI) 2.69 2.73 0.21 0.34 1.08 Grain size (mm) 0.15 0.15
Locality Type Sample Date Profile Analysis Date Analyz 3 9 G 6218216 850715 870715 S JT
x Position : 3300.00 Y Position : 2470.64
Elevation of Top of Core : -23.81 Length of Core 0.00 Depth to Top of Sample : 0.00 Depth to Bottom of Sample :
Comments :
Start Weight : 55.940 Final Weight : 55.631 Deviation : 0.552 %
PHI MM Weight Percnt Cumu 1 Percnt
PHI MM Weight Percnt Cumul Percnt ----- ----- ------ ------ ------
1.75 0.297 0.000 0.000 0.050 2.00 0.250 0.028 0.050 0.101 2.25 0.210 0.150 0.270 0.370
Sample Content by Weight Percent :
Gravel Sand Silt Clay coarse medium fine
Wentworth Classification 0.050 0.000 0.050 99.338 0.561 0.000 Unified Classification 0.000 0.050 0.000 98.078 1.871 0.000
Standard Statistics : Median Mean Dev. Skew Kurt
Method of Moments (PHI) Folk Graphic Measures (PHI) Grain Slze (mm)

Loca l i t y Type Sample Date P r o f i l e Ana lys i s Date Analyz 3 9 G 6218217 850715 870715 SJT
X P o s i t i o n : 3300 .00 Y P o s i t i o n : 2941.00
Eleva t ion of Top of Core : - 2 6 . 2 4 Length of Core 0.00 Depth t o Top of Sample : 0.00
Comments :
S t a r t Weight : 52.010 F i n a l Weight : 52.000 Deviat ion : 0.019 %
PHI m Weight Percnt Cumul PHI m Weight P e r c n t Cumul Percn t I P e r c n t
Sample Content by Weight Pe rcen t :
Gravel Sand S i l t Clay c o a r s e medium f i n e
W e n t w o r t h ~ l a s s i f i c a t i o n 0.060 0.000 0.000 99.000 0.940 0.000 Unif ied C l a s s i f i c a t i o n 0.000 0.060 0.000 96.869 3.071 0.000
Standard S t a t i s t i c s : Median Mean Dev. Skew Kurt
Method of Moments (PHI) Folk Graphic Measures (PHI) Grain s i z e (mm)
~ o c a l i t y Type sample Date p r o f i l e Analysis Date Analyz 3 9 G 6 2 1 8 4 0 1 850715 870715 SJT
X P o s i t i o n : 3300.00 Y P o s i t i o n : 167.60
of Top of Core : 19.50
Comments : ABUNDANT ORGANIC DEBRIS
S t a r t Weight : 60.770 F i n a l Weight : 60.390 Deviat ion : 0.625 %
PHI MM Weight Pe rcn t Cumul Pe rcn t ----- ----- ------ ------ ------
PHI MM Weight Pe rcn t Cumul P e r c n t ----- ----- ------ ------ ------
Sample Content by Weight Pe rcen t :
Gravel Sand S i l t c l a y c o a r s e medium f i n e
Wentvorth C l a s s i f i c a t i o n 0.000 34 .779 50 .651 14.570 0.000 0.000 Unif ied C l a s s i f i c a t i o h 0.000 0.000 47.629 5 2 . 3 7 1 0.000 0.000
Standard S t a t i s t i c s : Median Mean Dev. Skew Kurt
Method of Moments (PHI) Folk Graphic Measures (PHI) Grain S i z e (mm)

Locality Type Sample Date Profile Analysis Date Analyz 3 9 G 6218402 850808 870715 LLS
X Position : 3300.00 Y Position : 194.84
Elevation of Too of Core : 19.41 a - -
Length of Core 0.00 Depth to Top of Sample : 0.00 Depth to Bottom of Sample :
Comments :
Start Weight : 62.010 Final Weight : 61.581 Deviation : 0.692 %
PHI MM Weight Percnt Cumul PHI MM Weight Percnt Cumul ~ercnt I Percnt
Sample Content by Weight Percent :
Gravel Sand Silt Clay coarse medium fine
Wentworth Classification 0.050 32.340 55.470 12.140 0.000 0.000 Unified Classification 0.000 0.050 47.279 52.670 0.000 0.000
Standard Statistics : Median Mean Dev. Skew Kurt
Method of Moments (PHI) 1.28 0.65 -0.41 3.11 Folk Graphic Measures (PHI) 1.30 1.31 0.63 -0.05 1.02 Grain Size (mm) 0.41 0.41
Locality Type Sample Date Profile halysis Date Analyz 39 G 6218403 850808 870715 LLS
X Position : 3300.00 Y Position : 225.66
Elevation of i Top of Core : 14.08
Comments :
Start Weight
PHI MM
~ ~ - - - -. Length of Core Depth to Top of Sample : Depth to Bottom of Sample :
: 58.720 Final Weight
Weight Percnt Cumul Percnt I PHI MM
Deviation : 0.732 %
Weight Percnt Cumul Percnt ------ ------ ------
8.231 14.121 66.629 9.338 16.020 82.649 5.742 9.851 92.500
sample Content by Weight Percent :
Gravel sand Silt Clay coarse medium fine
Wentworth Classification 0.499 28.269 53.881 17.351 0.000 0.000 Unified classification 0.000 0.499 40.599 58.902 0.000 0.000
Standard Statistics : Median Mean Dev. Skew Kurt
Method of Moments (PHI) 1.36 0.71 -0.79 4.14 Folk Graphic Measures (PHI) 1.45 1.42 0.67 -0.14 1.00 Grain Size (m) 0.37 0.39

Locality Type Sample Date Profile Analysis Date Analyz 3 9 G 6218404 850808 870715 LLS
X Position : 3300.00 Y Position : 263.80
Elevation of Top of Core : 8 .95 Length of Core 0 .00 Depth to Top of Sample : 0.00 Depth to Bottom of Sample :
Comments :
Start Weight : 5 8 . 8 4 0 Final Weight : 58 .370 Deviation : 0.799 %
PHI MM Weight Percnt Cumul Percnt ----- ----- ------ ------ ------
PHI
----- 1 . 7 5 2.00 2.25 2 .50 2 .75 3 .00 3.25 3 .50 3.75 4.00 4 .25 4.50 4.75 5.00 5.25 5.50 5.75 6 .00
Weight Percnt CumUl Percnt
Sample Content by Weight Percent :
Gravel Sand Silt Clay coarse medium fine
Wentworth Classification 0 . 6 0 0 14.470 4 5 . 3 6 1 39.570 0.000 0.000 Unified Classification 0 . 0 0 0 0.600 19 .390 80 .010 0 .000 0.000
Standard Statistics : Median Mean Dev. Skew Kurt
Method of Moments (PHI) Folk Graphic Measures (PHI) Grain Size (mm)
Locality Sample Date Profile Analysis Date Analyz 3 9 6218405 850807 870715 LLS
x Position : 3300 .00 Y Position : 292 .50
Elevation of Top of Core : Length of Core Depth to Top of Sample : Depth to Bottom of Sample :
Comments :
start Weight : 6 1 . 7 6 0 Final Weight : 6 1 . 2 4 0 Deviation : 0.842 %
PHI m Weight Percnt Cumul Percnt ----- ----- ------ ------ ------
PHI MM Weight Percnt Cumul Percnt ----- ----- ------ ------ ------
Sample Content by Weight Percent :
Gravel Sand Silt Clay coarse medium fine
Wentworth Classification 0 . 1 6 0 32.082 45 .668 22 .090 0 . 0 0 0 0 .000 Unified Classification 0 . 0 0 0 0.160 4 1 . 3 9 1 58 .419 0 .000 0 . 0 0 0
Standard Statistics : Median Mean Dev. Skew Kurt
Method of Moments (PHI) 1 .37 0 .75 -0.54 2.85 Folk Graphic Measures (PHI) 1.49 1 . 4 1 0.74 - 0 . 1 9 0 .89 Grain size (mm) 0.36 0 . 3 9
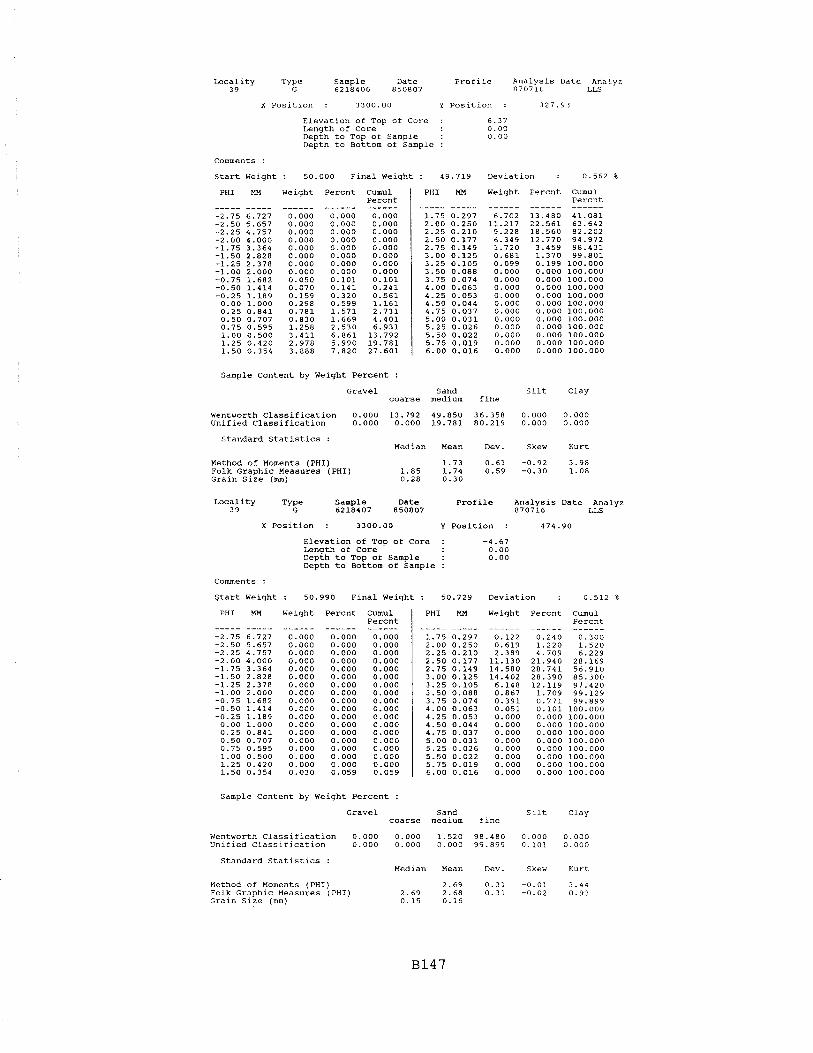
Locality Type Sample Date Profile Analysls Date Analyz 3 9 G 6218406 850807 870716 LLS
X Position : 3 3 0 0 . 0 0 Y Position : 327.93
Elevation of Top of Core : Length of Core Depth to Top of Sample : Depth to Bottom of Sample :
Comments :
Start Weight : 50 .000 Final Weight : 49 .719 Deviation : 0.562 %
PHI
----- -2.75 - 2 . 5 0 -2.25 -2.00 -1.75 -1.50 -1.25 -1.00 -0.75 -0.50 -0.25
0 .00 0 .25 0 .50 0 .75 1 . 0 0 1.25 1.50
Weight Percnt Cumu 1 Percnt ------
0 .000 0 .000 0.000 0 .000 0 .000 0 .000 0.000 0 .000 0 . 1 0 1 0 . 2 4 1
PHI Weight Percnt
------ 13 .480 22 .561 18 .560 12 .770
3.459 1 .370 0.199 0.000 0.000 0 .000 0 .000 0 . 0 0 0 0 . 0 0 0 0 . 0 0 0 0 .000 0 .000 0.000 0 .000
Cumul Percnt
Sample Content by Weight Percent :
Gravel Sand Silt Clay coarse medium fine
Wentworth Classification 0 . 0 0 0 13.792 49.850 36.358 0 .000 0 .000 Unified Classification 0.000 0 .000 1 9 . 7 8 1 80.219 0 .000 0 . 0 0 0
Standard Statistics : Median Mean Dev. Skew Kurt
Method of Moments (PHI) Folk Graphic Measures (PHI) Grain Size (mm)
Locality Sample Date Profile Analysis Date Analyz 39 6218407 850807 870716 LIS
X Position : 3300.00 Y Position : 474 .90
Elevation of Top of Core : -4.67 Length of Core 0 .00 Depth to Top of Sample : 0 .00 Depth to Bottom of Sample :
Comments :
Start Weight : 50 .990 Final Weight : 50.729 Deviation : 0.512 %
PHI MM Weight Percnt Cumul Percnt ----- ----- ------ ------ ------
-2 .75 6.727 0 .000 0.000 0 .000 -2 .50 5.657 0 .000 0 .000 0 . 0 0 0 -2 .25 4.757 0.000 0.000 0 . 0 0 0
PHI MM Weight Percnt Cumul Percnt ----- ----- ------ ------ ------
1 . 7 5 0.297 0 .122 0 .240 0 .300 2 .00 0 .250 0 . 6 1 9 1 .220 1.520 2.25 0.210 2.389 4 .709 6.229
Sample Content by Weight Percent :
Gravel Sand Silt Clay coarse medium fine
wentworthclassification 0 . 0 0 0 0 . 0 0 0 1 . 5 2 0 98.480 0.000 0 .000 unified Classification 0 . 0 0 0 0 .000 0 . 0 0 0 99 .899 0 . 1 0 1 0 . 0 0 0
Standard Statistics : Median Mean Dev. Skew Kurt
Method of Moments (PHI) 2 .69 0 . 3 1 - 0 . 0 1 3.44 Folk Graphic Measures (PHI) 2.69 2 . 6 8 0 . 3 1 -0 .02 0 . 9 3 Grain Size (mm) 0 . 1 5 0 .16
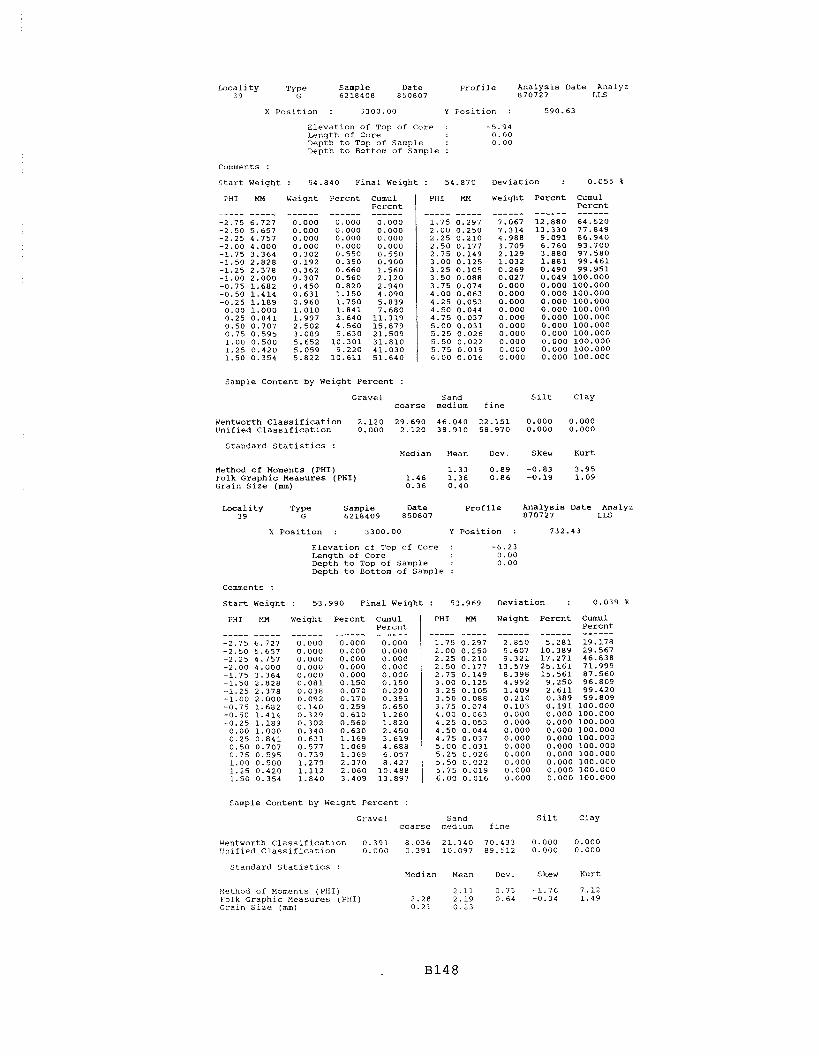
sample Content by Weight Percent :
Locality Type Sample Date profile Analysis Date Analyz 3 9 G 6218408 850807 870727 L I S
X Positlon : 3300.00 Y Position : 590.63
Elevation of Top of Core : -5.94 Length of Core 0 . 0 0 Depth to Top of Sample : 0 . 0 0 Depth to Bottom of Sample :
Comments :
Start Weight : 54 .840 Final Weiqht : 54.870 Deviation : 0.055 %
Gravel Sand Silt Clay coarse medium fine
PHI MM Weight Percnt Cumul Percnt ----- ----- ------ ------ ------
-2 .75 6.727 0 . 0 0 0 0 . 0 0 0 0 . 0 0 0 - 2 . 5 0 5 . 6 5 7 0.000 0 . 0 0 0 0 .000 -2.25 4 .757 0.000 0 .000 0 .000 -2.00 4 .000 0 . 0 0 0 0 .000 0 . 0 0 0 -1.75 3 .364 0 .302 0.550 0.550 -1.50 2.828 0 .192 0 .350 0 . 9 0 0 -1.25 2 .378 0 .362 0 . 6 6 0 1.560 -1.00 2 .000 0 .307 0 .560 2 .120 -0.75 1 .682 0.450 0 .820 2 .940 -0.50 1 . 4 1 4 0 . 6 3 1 1 .150 4 .090 -0.25 1 . 1 8 9 0.960 1 .750 5.839
0.00 1 . 0 0 0 1 . 0 1 0 1 . 8 4 1 7.680 0.25 0 . 8 4 1 1 .997 3 .640 11 .319 0.50 0 .707 2 .502 4 . 5 6 0 15.879 0 . 7 5 0 .595 3 .089 5 .630 21.509 1 . 0 0 0 . 5 0 0 5.652 1 0 . 3 0 1 31 .810 1.25 0.420 5.059 9 .220 41 .030 1 .50 0 .354 5 .822 10 .611 51.640
Wentworth Classification 2.120 29 .690 46 .040 22 .151 0 . 0 0 0 0.000 Unified Classification 0,000 2 .120 38 .910 58.970 0.000 0 . 0 0 0
PHI M3 Weight Percnt Cumul Percnt ----- ----- ------ ------ ------
1 . 7 5 0.297 7.067 12 .880 6 4 . 5 2 0 2 .00 0.250 7 .314 13 .330 77 .849 2.25 0.210 4.988 9 . 0 9 1 86 .940 2 .50 0.177 3 .709 6 . 7 6 0 93 .700 2.75 0.149 2 .129 3 .880 9 7 . 5 8 0 3 .00 0.125 1 . 0 3 2 1 . 8 8 1 9 9 . 4 6 1 3 .25 0 .105 0 .269 0 .490 9 9 . 9 5 1 3 .50 0.088 0.027 0.049 100 .000 3.75 0.074 0.000 0.000 100 .000 4 . 0 0 0 .063 0 . 0 0 0 0 .000 1 0 0 . 0 0 0 4 .25 0 .053 0.000 0 . 0 0 0 100 .000 4 . 5 0 0.044 0.000 0 . 0 0 0 100 .000 4 .75 0 .037 0 . 0 0 0 0.000 100 .000 5 .00 0 . 0 3 1 0.000 0 . 0 0 0 100 .000 5.25 0 .026 0 .000 0.000 100 .000 5 .50 0.022 0.000 0 . 0 0 0 1 0 0 . 0 0 0 5 .75 0 .019 0 . 0 0 0 0 . 0 0 0 100 .000 6 .00 0.016 0 . 0 0 0 0 . 0 0 0 100 .000
Standard Statistics : Median Mean Dev. Skew Kurt
Method of Moments (PHI) 1 .33 0.89 -0.83 3.95 Folk Graphic Measures (PHI) 1.46 1.38 0.86 -0.19 1.09 Grain Size (mm) 0.36 0 .40
Locality Sample Date profile Analysis Date Analyz 3 9 6218409 850807 870727 LIS
X Position : 3300.00 Y Position : 732.43
Elevation of Top of Core : -6.23 Length of Core 0 .00 Depth to Top of Sample : 0 .00 Depth to Bottom of Sample :
Comments :
Start Weight
PHI MM
: 5 3 . 9 9 0 Final Weight
Weight Percnt Cumul Percnt ------ ------ ------
0 . 0 0 0 0.000 0 . 0 0 0 0 . 0 0 0 0 .000 0 . 0 0 0 0 . 0 0 0 0.000 0 .000 0 . 0 0 0 0.000 0 .000 0 . 0 0 0 0 .000 0 . 0 0 0 0 . 0 8 1 0 .150 0.150 0 .038 0.070 0 . 2 2 0 0.092 0.170 0 . 3 9 1 0 . 1 4 0 0 .259 0 .650 0 .329 0 . 6 1 0 1 . 2 6 0
PHI MM Weight Percnt CUmUl Percnt
Sample Content by Weight Percent :
Gravel Sand Silt Clay coarse nedium fine
Wentworth Classification 0 . 3 9 1 8 .036 21 .140 7 0 . 4 3 3 0 . 0 0 0 0.000 Unlfied Classification 0 . 0 0 0 0 . 3 9 1 10 .097 89 .512 0 .000 0.000
Standard Statistics : Median Mean Dev. Skew Kurt
Kethod of Moments (PHI) Folk Graphic Measures (PHI) Grain Size (mm)

Iacality Type Sample Date Profile Analysis Date Analyz 39 G 6218410 850807 870727 LIS
X Position : 3300.00 Y Position : 847.91
Elevation of Top of Core : -10.63 Length of Core 0.00 wpth to Top of Sample : 0.00 Depth to Bottom of Sample :
Comments :
Start Weiqht : 56.670 Final Weight : 56.669 Deviation : 0.002 b
PHI Weight Percnt
------ Cumul Percnt ------ 0.000 0.000 0.000 0.000 0.229 0.229 0.229 0.279 0.369 0.418 0.418 0.468 0.517 0.517 0.588 0.678 0.768 0.948
PHI
----- 1.75 2.00 2.25 2.50 2.75 3.00 3.25 3.50 3.75 4.00 4.25 4.50 4.75 5.00 5.25 5.50 5.75 6.00
Weight Percnt
------ 0.480 1.541 5.190 20.881 31.730 22.430 12.741 2.280 1.500 0.191 0.090 0.000 0.000 0.000 0.000 0.000 0.000 0.000
Cumul Percnt
Sample Content by Weight Percent :
Gravel Sand Silt Clay coarse medium fine
Standard Statistics : Median Mean Dev. Skev Kurt
Method of Moments (PHI) 2.66 0.45 -3.45 33.73 Folk Graphic Measures (PHI) 2.67 2.67 0.34 0.02 1.02 Grain size (nm) 0.16 0.16
Locality Sample Date Profile Analysis Date ~nalyz 3 9 6218411 850807 870716 LI5
X Position : 3300.00 Y Position : 992.59
Elevation of Top of Core : -12.62 Length of Core 0.00 Depth to Top of Sample : 0.00 Depth to Bottom of Sample :
Comments :
Start Weight : 57.390 Final Weight : 57.092 Deviation : 0.519 %
PHI MM Weight Percnt Cumul Percnt ----- ----- ------ ------ ------
PHI MM Weight Percnt Cumul Percnt ----- ----- ------ ------ ------
Sample Content by Weight Percent :
Gravel Sand Silt Clay coarse medium fine
Wentworth Classification 0.051 0.312 1.189 97.628 0.820 0.000 Unified C!assification 0.000 0.051 0.363 97.947 1.639 0.000
Standard Statistics : Median Mean Dev. Skew Kurt
Method of Moments (PHI) Folk Graphic Measures (PHI) Grain Size (nm) 0.14 0.14

Sample 6218412
Date 850807
Analys i s Date Analyz 870727 MCP
x P o s i t i o n : 3300.00 Y P o s i t i o n : 1230.15
Eleva t ion o f Top of Core : -13.30 Length of Core 0.00 Depth t o Top o f Sample : 0.00 Depth t o Bottom of Sample :
Comments :
S t a r t Weight : 56.950 F i n a l Weight : 56.838 Deviat ion : 0.197 %
PHI MM Weight Pe rcn t Cumul MM Weight Pe rcn t Cumul D ~ ~ ~ ~ + 1 Percn t
Sample Content by Weight Pe rcen t :
Gravel Sand S i l t Clay c o a r s e medium f i n e
W e n t w o r t h c l a s s i f i c a t i o n 0.139 0.890 3.709 95.102 0.160 0.000 Unif ied C l a s s i f i c a t i o n 0.000 0.139 1.070 98.191 0.600 0.000
Standard S t a t i s t i c s : Median Mean Dev. Skew Kurt
Method of Moments (PHI) 2.58 0.48 -1.76 16.30 Folk Graphic Measures (PHI) 2.57 2.60 0.39 0.15 1.17 Grain S i z e (mm) 0.17 0.17
Loca l i t y Type Sample Date P r o f i l e Ana lys i s Date Analyz 3 9 G 6218413 850807 870727 MCP
X P o s i t i o n : 3300.00 Y P o s i t i o n : 1475.28
Eleva t ion of Top of Core : -15.33 Length o f Core 0.00 Depth t o Top of Sample : 0.00 Depth t o Bottom of Sample :
Comments :
S t a r t w e i g h t : 57.090 F i n a l w e i g h t : 57.068 Deviat ion : 0.039%
PHI MM Weight P e r c n t Cumul Pe rcn t ----- ----- ------ ------ ------
PHI m Weight P e r c n t Cumul Pe rcn t ----- ----- ------ ------ ------
Sample Content by Weight Pe rcen t :
Gravel Sand S i l t Clay c o a r s e medium f i n e
Wentworth C l a s s i f i c a t i o n 0.280 1.447 3.449 94.594 0.230 0.000 Unif ied C l a s s i f i c a t i o n 0.000 0.280 1.637 97.393 0.690 0.000
Standard S t a t i s t i c s : Median Mean Dev. Skew Kurt
Method of Moments (PHI) Folk Graphic Measures (PHI) Grain S i z e (mm)

Locality Type Sample Date Profile Analysis Date Analyz 3 9 G 6 2 1 8 4 1 4 850807 870727 MCP
x Position : 3300.00 Y Position : 992 .59
Elevation of Top of Core : - 1 2 . 6 2 Length of Core 0.00 Depth to Top of Sample : 0.00 Depth to Bottom of Sample :
Comments :
Start Weight : 4 6 . 4 2 0 Final Weight : 46 .390 Deviation : 0.065 %
PHI MH Weight Percnt Cumul PHI HM Weight Percnt Cumul percnt 1 Percnt ----- ----- ------ ------ ------ ----- ----- ------ ------ ------
Sample Content by Weight Percent :
Gravel Sand Silt Clay coarse medium fine
Wentworth Classification 0.060 0.000 0.129 99.211 0.599 0.000 Unified Classification 0.000 0.060 0.000 98 .310 1.630 0.000
Standard Statistics : Median Mean DeV. Skew Kurt
Method of Moments (PHI) Folk Graphic Measures (PHI) Grain Size (mm)
Locality sample Date Profile Analysis Date Analyz 3 9 6218415 850807 870716 LLS
x Position : 3300.00 Y Position : 1959.52
Elevation of Top of Core : -20 .36 Length of Core 0.00 Depth to Top of Sample : 0.00 Depth to Bottom of Sample :
Comments :
Start Weight : 48.920 Final Weight : 48.670 Deviation : 0.511 %
PHI HM Weight Percnt Cumul Percnt ------ ------
PHI MM Weight Percnt Cumul Percnt ------ ------ ------
Sample Content by Weight Percent :
Gravel Sand Silt Clay coarse medium fine
Wentworthclassification 1.001 0.000 0.230 98.110 0.660 0.000 Unified Classification 0.000 1 . 0 0 1 0.000 9 6 . 9 4 1 2.059 0.000
Standard Statistics : Median Mean Dev. Skew Kurt
Method of Moments (PHI) Folk Graphic Measures (PHI) Grain Size (mm)

Sample 6 2 1 8 4 1 6
Date 850807
P r o f i l e A n a l y s i s D a t e Anal 870727 MCP
X P o s i t i o n : 3 3 0 0 . 0 0 Y P o s i t i o n : 2 4 4 4 . 6 5
E l e v a t i o n o f Top o f c o r e : - 2 3 . 7 1 Length o f Core 0.00 Depth t o Top o f Sample : 0.00 Depth t o Bottom o f Sample :
Comments :
S t a r t Weight : 5 1 . 3 1 0 F i n a l Weiqht : 5 1 . 2 4 9 D e v i a t i o n : 0.119 %
PHI MM Weiqht P e r c n t Cumul P e r c n t ----- ----- ------ ------ ------
-2.75 6.727 0.000 0.000 0.000 -2.50 5.657 0.000 0.000 0.000
Sample C o n t e n t by Weight P e r c e n t :
PHI MM Weight P e r c n t Cumul P e r c n t ----- ----- ------ ------ ------
1.75 0.297 0.000 0.000 0.060 2 .00 0.250 0 .031 0.060 0 . 1 2 1
G r a v e l Sand s i l t C l a y c o a r s e medium f i n e
Wentworth C l a s s i f i c a t i o n 0.060 0.000 0.060 99.159 0.720 0.000 U n i f i e d C l a s s i f i c a t i o n 0.000 0.060 0.000 97 .820 2.119 0.000
s t a n d a r d S t a t i s t i c s : Medlan Mean Dev. Skew K u r t
Method o f Moments (PHI) 3 .08 0.33 -1 .40 28.08 Folk G r a p h i c Measures (PHI) 3.07 3.09 0 .31 0.10 1.23 G r a i n S i z e (mm) 0.12 0.12
L o c a l i t y 3 9
s a m p l e 6218417
Date 850807
P r o f i l e A n a l y s i s D a t e Analyz 870716 LLS
x P o s i t i o n : 3300.00 Y P o s i t i o n : 2957.20
E l e v a t i o n o f Top o f Core : -26.53 L e n g t h o f C o r e 0.00 Depth t o Top o f Sample : 0.00 Depth t o Bottom o f Sample :
Comments :
S t a r t Weiqht : 3 4 . 1 1 0 F i n a l Weight : 33.859 D e v i a t i o n : 0.736 %
PHI MM Weight P e r c n t Cumul PHI m Weight P e r c n t Cumul P e r c n t I P e r c n t
Sample C o n t e n t by Weight P e r c e n t :
G r a v e l Sand S i l t C l a y c o a r s e medium f i n e
W e n t w o r t h C l a s s i f i c a t i o n 0.000 0.000 0.000 99 .200 0.800 0.000 C n l f i e d C l a s s i f i c a t i o n 0 . 0 0 0 0.000 0.000 97 .159 2 . 8 4 1 0.000
S t a n d a r d S t a t i s t i c s : Medlan Mean Dev. S k e v K u r t
ge thod o f Moments (PHI) Folk G r a p h i c Measures (PHI) G r a i n S l z e (pa)

Locality Type Sample Date Profile Analysis Date Analyz 3 9 G 6 2 1 8 6 0 1 8 5 0 8 2 1 870715 LLS
x Position : 3300 .00 Y Position : 0.00
Elevation of Top of Core : 2 0 . 1 1 Length of Core 0.00 Depth to Top of Sample : 0.00 Depth to Bottom of Sample :
Comments :
Start Weight
PHI MM
: 56.
Weight
160 Final Weight
Percnt Cumul Percnt ------
0.000 0.000 0.000 0.000 0.000 0.000 0.000 0.000
Sample Content by Weight Percent :
PHI MM
Gravel coarse
Wentworth Classification 0.000 3 0 . 4 5 1 Unified Classification 0.000 0.000
Standard Statistics : Median
Method of Moments (PHI) Folk Graphic Measures (PHI) 1.35 Grain Size (mm) 0.39
Deviation :
Weight Percnt
0.678 %
Cumul Percnt ------ 7 3 . 1 7 1 87.372 9 4 . 6 1 1 98.370 99.480 99.930
100.000 100.000 100.000 100.000 100.000 100.000 100.000 100.000 100.000 100.000 100.000 100.000
Sand Silt Clay medium fine
Mean Dev. Skew Kurt
Sample Date Tyr 6218602 850821 Profile Analysis Date Analyz
3 9 870716 LLS
X Position : 3300.00 Y Position : 196.85
Elevation of Top of Core : 17.89 Length of Core 0.00 Depth to TOP of Sample : 0.00 Depth to Bottom of Sample :
Comments :
Start Weight : 59.950 Final Weight : 59.870 Deviation : 0.133 %
PHI MM Weight Percnt Cumul PHI ME4 Weight Percnt Cumul Percnt Percnt ----- ----- ------ ------ ------ ----- ----- ------ ------ ------
-2.75 6.727 0.000 0.000 0.000 1.75 0.297 9.657 16.130 67.850
Sample Content by Weight Percent :
Gravel Sand Silt Clay coarse medium fine
Wentworth Classification 0.000 21.119 6 3 . 4 4 1 1 5 . 4 4 0 0 .000 0.000 Unified Classification 0.000 0.000 36 .820 63 .180 0.000 0.000
Standard Statistics : Median Mean Dev. Skew Kurt
Method of Moments (PHI) 1 . 4 7 0 .52 - 0 . 0 1 2 . 6 9 Folk Graphic Measures (PHI) 1 . 4 7 1 . 4 6 0 .52 -0.00 0 .85 Grain slze (mm) 0.36 0 . 3 6

Loca l i t y Type sample Date P r o f i l e Ana lys i s Date Analyz 3 9 G 6218603 8 5 0 8 2 1 870716 LIS
X P o s i t i o n : 3300.00 Y P o s i t i o n : 2 2 9 . 9 3
Eleva t ion of Top of Core : 1 2 . 4 9 Length of c o r e 0.00 Depth t o Top o f Sample : 0.00 Depth t o Bottom of Sample :
Comments :
s t a r t Weight : 53.590 F i n a l Weight : 53 .331 Deviat ion : 0 .483 "6
PHI MM Weight P e r c n t Cumul Pe rcn t ----- ----- ------ ------ ------
PHI HM Weight P e r c n t Cumul Pe rcn t ----- ----- ------ ------ ------
sample Content by Weight Pe rcen t :
c rave1 Sand s i l t Clay c o a r s e medium f i n e
wentworth C l a s s i f i c a t i o n 1.892 63.790 24.777 9.540 0.000 0.000 u n i f i e d C l a s s i f i c a t i o n 0.000 1.892 69.299 28.809 0.000 0.000
Standard S t a t i s t i c s : Median Hean Dev. Skew Kurt
Method of Moments (PHI) ~ o l k Graphic Measures (PHI) Grain S i z e (mm)
Sample Date P r o f i l e Ana lys i s Date Analyz 3 9 6218604 850821 870716 LLS
x p o s i t i o n : 3300.00 Y P o s i t i o n : 260.88
Eleva t ion of Top of Core : 8 .84 Length of Core 0.00 m p t h t o TOP of Sample : 0.00 Depth t o Bottom of Sample :
Comments :
S t a r t Weight
PHI MM
: 62.430 F i n a l Weight
Weight P e r c n t Cumul Percnt ------ ------ ------
0.000 0.000 0.000 0.000 0.000 0.000 0.000 0.000 0.000 0.000 0.000 0.000 0.050 0.080 0.080 0.137 0.220 0.300 0.243 0.390 0.690 0 . 3 6 1 0.580 1.270 0.517 0.830 2.100 0 .772 1 .239 3 .339 0.660 1.060 4.399 0.542 0.870 5.269 0.978 1.570 6.839 0.710 1.140 7.979 1 .240 1 . 9 9 1 9.970 2 . 7 9 1 4 . 4 8 1 14 .450 3.233 5.190 1 9 . 6 4 1 4.292 6.890 2 6 . 5 3 1
PHI HH
Devia t ion :
Weight P e r c n t
0.226 %
CumUl Pe rcn t ------ 38 .471 62.640 82 .451 94 .511 98 .330 99.690 99.950
100.000 100.000 100.000 100.000 100.000
Sample Content by Weight Pe rcen t :
Gravel Sand S i l t Clay c o a r s e medium f i n e
Wentworth C l a s s i f i c a t i o n 1 . 2 7 0 1 3 . 1 8 0 48 .190 37 .360 0.000 0.000 c n i f i e d C l a s s i f i c a t i o n 0.000 1 . 2 7 0 1 8 . 3 7 1 80.359 0.000 0.000
s t anda rd S t a t i s t i c s : Median Mean Dev. Skew Kurt
Method of Moments (PHI) Folk Graphic Measures ( P H I ) Grain s i z e (mm)
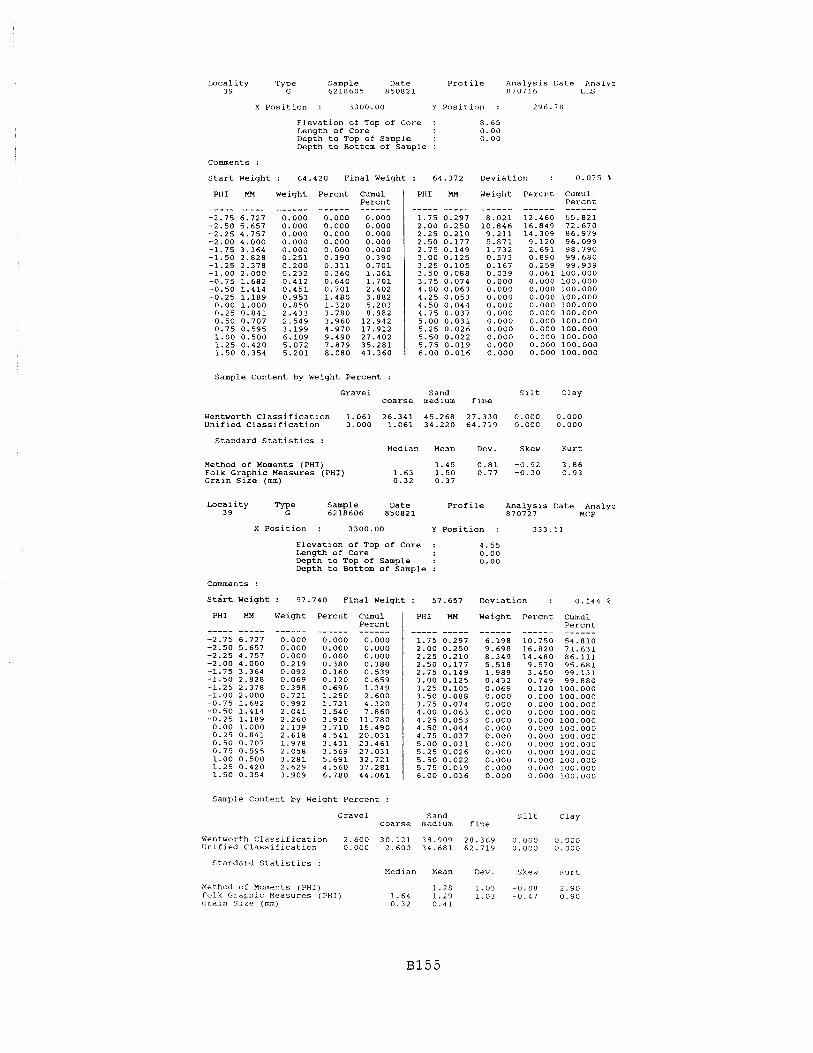
Locality Type Sample Date Profile Analysis Date Analyz 39 G 6218605 8 5 0 8 2 1 870716 LLS
X Position : 3300 .00 Y Position : 296.78
Elevation of Top of Core : Length of Core Depth to Top of Sample : Depth to Bottom of Sample :
Comments :
Start Weight : 64.420 Final Weight
PHI MM Weight Percnt Cumul Percnt ----- ----- ------ ------ ------
- 2 . 7 5 6 . 7 2 7 0 .000 0 .000 0 .000 -2.50 5 .657 0.000 0 .000 0 .000 -2.25 4 .757 0 .000 0 .000 0 . 0 0 0 -2 .00 4 .000 0 . 0 0 0 0.000 0 .000 -1.75 3.364 0.000 0 .000 0.000 -1.50 2 . 8 2 8 0 .251 0 .390 0 .390 -1.25 2.378 0.200 0 . 3 1 1 0 . 7 0 1 -1 .00 2 .000 0 .232 0 .360 1 .061 -0 .75 1 .682 0 .412 0.640 1 . 7 0 1 -0.50 1.414 0 .451 0 .701 2.402 -0.25 1 . 1 8 9 0 .953 1.480 3 .882
0.00 1 .000 0 .850 1 .320 5.203 0 .25 0 . 8 4 1 2.433 3 .780 8 .982
PHI HM
Deviation : 0.075 %
Weight Percnt Cumul Percnt
Sample Content by Weight Percent :
Gravel Sand Silt Clay coarse medium fine
Wentworth Classification 1 .061 26 .341 45.268 27.330 0 . 0 0 0 0 . 0 0 0 Unified Classification 0 .000 1 . 0 6 1 34 .220 64.719 0 . 0 0 0 0 . 0 0 0
Standard Statistics : Median Mean Dev. Skew Kurt
Method of Moments (PHI) 1.45 0 . 8 1 -0.92 3 . 8 6 Folk Graphic Measures (PHI) 1.63 1 . 5 0 0 .77 -0 .30 0.93 Grain size (mm) 0.32 0.37
Locality Type Sample Date Profile Analysis Date Analyz 3 9 G 6218606 8 5 0 8 2 1 870727 MCP
X Position : 3300 .00 Y Position : 333.11
Elevation of Top of Core : 4.55 Length of Core 0.00 Depth to Top of Sample : 0 .00 Depth to Bottom of Sample :
Comments :
stirt Weight : 57 .740 Final Weight : 57.657 Deviation : 0 .144 %
PHI MM Weight Percnt Cumul Percnt ----- ----- ------ ------ ------
PHI HM Weight Percnt Cumul Percnt ----- ----- ------ ------ ------
Sample Content by Weight Percent :
Gravel Sand Silt Clay coarse medium fine
Wentworth Classification 2 .600 3 0 . 1 2 1 38.909 2 8 . 3 6 9 0 . 0 0 0 0 . 0 0 0 Unified Classification 0 .000 2 . 6 0 0 3 4 . 6 8 1 62 .719 0 . 0 0 0 0 . 0 0 0
Standard Statistics : Median Mean Dev. Skew Kurt
Method of Moments (PHI) 1.28 1.03 -0.88 2 .90 Folk Graphic Measures (PHI) 1.64 1.29 1.03 - 0 . 4 7 0 . 9 0 Grain Size (nn) 0 . 3 2 0 . 4 1
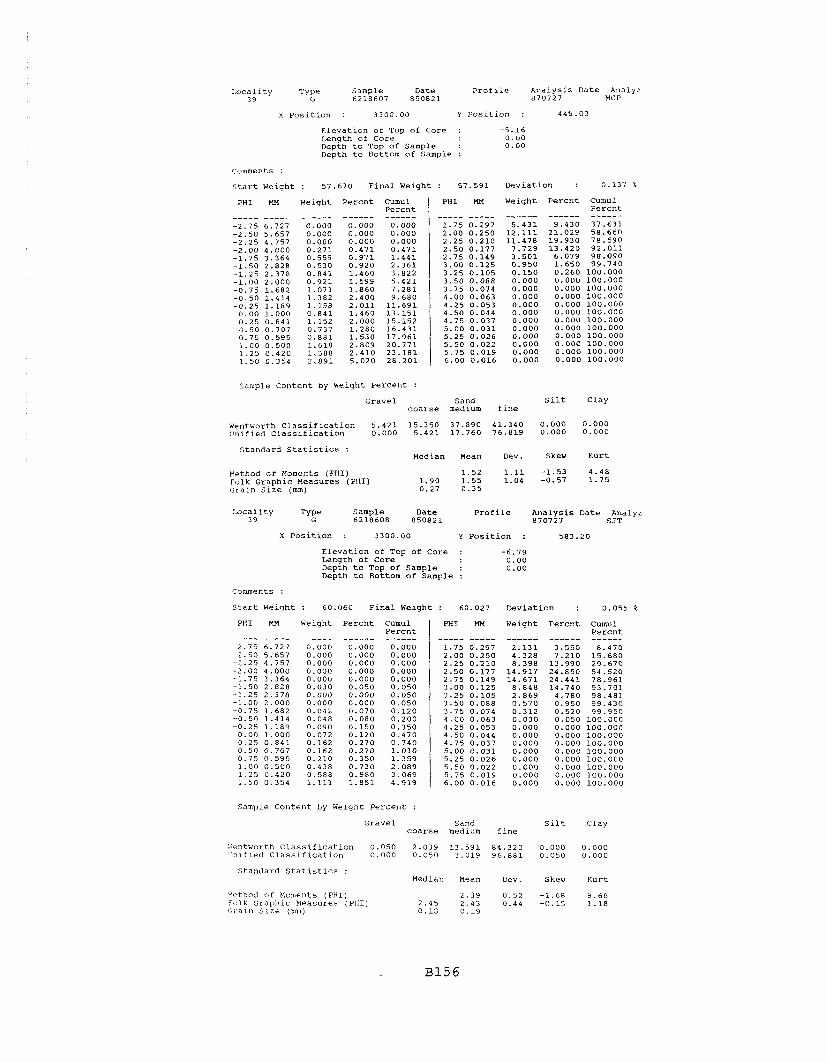
sample Content by weight Percent :
Locality Type Sample Date Profile Analysis Date Analyz 3 9 G 6218607 8 5 0 8 2 1 870727 MCP
X Positlon : 3300 .00 Y position : 449 .03
Elevation of Top of Core : -5 .16 Length of Core 0 .00 Depth to Top of Sample : 0 . 0 0 Depth to Bottom of Sample :
Comments :
Start Weight : 57.670 Final Weight : 57 .591 Deviation : 0.137 %
Gravel Sand silt Clay coarse medium fine
PHI Hn Weiqht Percnt Cumul Percnt ___-_ _ _ _ _ _ _ - _ _ _ _ -_--_- -_____
-2 .75 6.727 0 .000 0 . 0 0 0 0 .000 -2 .50 5.657 0 .000 0 .000 0 .000 -2 .25 4.757 0 .000 0.000 0 . 0 0 0 -2 .00 4 .000 0 . 2 7 1 0 . 4 7 1 0 . 4 7 1 -1.75 3.364 0.559 0 . 9 7 1 1 . 4 4 1 - 1 . 5 0 2 . 8 2 8 0 .530 0 .920 2 . 3 6 1 -1.25 2.378 0 . 8 4 1 1.460 3.822 -1.00 2 .000 0 . 9 2 1 1 .599 5 . 4 2 1 -0 .75 1.682 1 . 0 7 1 1 .860 7 . 2 8 1 -0 .50 1 .414 1 .382 2 .400 9 .680 -0.25 1.189 1 . 1 5 8 2 . 0 1 1 1 1 . 6 9 1
0 . 0 0 1 .000 0 . 8 4 1 1 . 4 6 0 1 3 . 1 5 1 0 . 2 5 0 . 8 4 1 1 .152 2 . 0 0 0 15 .152 0 .50 0 .707 0.737 1 .280 16 .431 0.75 0 . 5 9 5 0 . 8 8 1 1 .530 1 7 . 9 6 1 1 .00 0 .500 1 .618 2 .809 2 0 . 7 7 1 1 . 2 5 0 .420 1 . 3 8 8 2 . 4 1 0 2 3 . 1 8 1 1 . 5 0 0 .354 2 . 8 9 1 5 . 0 2 0 2 8 . 2 0 1
Wentworth Classification 5 . 4 2 1 15.350 37 .890 41 .340 0.000 0 . 0 0 0 Unified Classification 0 .000 5 . 4 2 1 17.760 76 .819 0 . 0 0 0 0 . 0 0 0
PHI Hn Weight Percnt Cumul Percnt _---_ __-__ --_--- _----- ------
1 . 7 5 0 .297 5 . 4 3 1 9 . 4 3 0 37 .631 2 .00 0 .250 1 2 . 1 1 1 2 1 . 0 2 9 58 .660 2.25 0 . 2 1 0 11.478 19.930 7 8 . 5 9 0 2.50 0.177 7.729 1 3 . 4 2 0 9 2 . 0 1 1 2.75 0 .149 3 . 5 0 1 6 .079 9 8 . 0 9 0 3 . 0 0 0 . 1 2 5 0.950 1.650 9 9 . 7 4 0 3 .25 0 .105 0 . 1 5 0 0.260 100 .000 3 .50 0.088 0 . 0 0 0 0.000 1 0 0 . 0 0 0 3 .75 0.074 0.000 0 . 0 0 0 100 .000 4.00 0.063 0 . 0 0 0 0.000 100 .000 4.25 0 .053 0.000 0 .000 100 .000 4 . 5 0 0.044 0 . 0 0 0 0.000 1 0 0 . 0 0 0 4.75 0 .037 0.000 0.000 1 0 0 . 0 0 0 5 .00 0 . 0 3 1 0 .000 0.000 100 .000 5.25 0 .026 0 .000 0.000 1 0 0 . 0 0 0 5 .50 0 . 0 2 2 0 .000 0 .000 1 0 0 . 0 0 0 5.75 0 .019 0 . 0 0 0 0.000 100 .000 6.00 0.016 0 .000 0.000 1 0 0 . 0 0 0
Standard Statistics : Median Mean Dev. Skew Kurt
uethod of Moments (PHI) Folk Graphic Measures (PHI) Graln size (mm)
Locality Type Sample Date Profile Analysis Date Analyz 39 G 6218608 8 5 0 8 2 1 870727 SJT
X Position : 3300 .00 Y Position : 583.20
Elevation of Top of Core : -6 .79 Length of Core 0 . 0 0 Depth to Top of Sample : 0 .00 Depth to Bottom of Sample :
Comments :
Start Weight : 60.060 Final Weight : 60.027 Deviation : 0 . 0 5 5 %
PHI MH Weiqht Percnt Cumul Percnt ----- ----- ------ ------ ------
-2 .75 6 .727 0 .000 0 . 0 0 0 0 . 0 0 0
PHI HN Weiqht Percnt Cumul Percnt ----- ----- ------ ------ ------
1 . 7 5 0 . 2 9 7 2 . 1 3 1 3 .550 8.470
sample Content by Weight Percent :
Gravel Sand Silt Clay coarse medlum fine
'Gentworth Classification 0 .050 2.039 1 3 . 5 9 1 8 4 . 3 2 0 0 .000 0 . 0 0 0 '.'nlfled Classification 0 .000 0 .050 3.019 9 6 . 8 8 1 0 . 0 5 0 0 . 0 0 0
Standard Statistics : Median Mean Dev. Skew Kurt
Yethod of Moments (PHI) 2.39 0 . 5 2 -1 .68 9 . 6 6 :elk Graphic Measures (PHI) 2.45 2.43 0.44 - 0 . 1 5 1 . 1 8 Craln Slze (mm) 0 .18 0 . 1 9

Locality Type sample Date Profile Analysis Date Analyz 3 9 G 6218609 850821 870727 S JT
X Position : 3300.00 Y Position : 703.41
Elevation of Too of Core : -7.04 Length of Core 0.00 Depth to Top of Sample : 0.00 Depth to Bottom of Sample :
Comments :
Start Weight : 57.810 Final Weight : 57.690 Deviation : 0.208 %
PHI MM Weight Percnt Cumul PHI MM Weight Percnt Cumul ~ercnt I Percnt
Sample Content by Weight Percent :
Gravel Sand Silt Clay coarse medium fine
Wentworth Classification 0.050 0.390 9.229 90.331 0.000 0.000 Unified Classification 0.000 0.050 0.751 99.199 0.000 0.000
Standard Statistics : Median Mean Dev. Skew Kurt
Method of Moments (PHI) Folk Graphic Measures (PHI) Grain size (mm)
Locality Type Sample Date Profile Analysis Date Analyz 39 G 6218610 850821 870716 LLS
X Position : 3300.00 Y Position : 857.50
Elevation of Too of Core : -11.45 Length of Core 0.00 Depth to Top of Sample : 0.00 Depth to Bottom of Sample :
Comments :
Start Weight : 51.190 Final Weight : 50.931 Deviation : 0.506 %
PHI MM Weight Percnt Cumul Percnt
PHI HM Weight Percnt Cumul Percnt ----- ----- ------ ------ ------
Sample Content by Weight Percent :
Gravel Sand Silt Clay coarse medium fine
Wentworth Classification 0.000 0.542 3.542 95.657 0.259 0.000 Unified Classification 0.000 0.000 0.723 98.649 0.628 0.000
Standard Statistics :
Method of Moments (PHI) Folk Graphic Measures (PHI) Grain Size (mm)
Median Mean Dev. Skew Kurt
2.68 0.43 -1.00 9.32 2.70 2.69 0.38 -0.06 0.93 0.15 0.16

Locality Type Sample Date Profile Analysis Date Analyz 39 G 6 2 1 8 6 1 1 8 5 0 8 2 1 870727 SJT
sample Content by Weight Percent :
X Position : 3300 .00 Y Position : 9 7 9 . 0 0
Elevation of Top of Core : -12.64 Length of Core 0 . 0 0 Depth to Top of Sample : 0 .00 Depth to Bottom of Sample :
Comments :
Start Weight : 54.500 Final Weight : 54.410 Deviation : 0.165 %
Gravel sand Silt Clay coarse medium fine
PHI MN Weight Percnt Cumul Percnt ----- ---__ ------ ------ -_----
- 2 . 7 5 6 . 7 2 7 0 .000 0 .000 0 . 0 0 0 -2.50 5.657 0.000 0.000 0 .000 - 2 . 2 5 4 . 7 5 7 0 .000 0 .000 0 . 0 0 0 -2.00 4 .000 0.000 0 .000 0 . 0 0 0 -1.75 3 .364 0.000 0.000 0.000 -1 .50 2 .828 0 .033 0 .061 0 . 0 6 1 -1.25 2 .378 0 .000 0.000 0 . 0 6 1 -1.00 2.000 0 .000 0.000 0 . 0 6 1 -0.75 1 .682 0.038 0 .070 0 . 1 3 0 -0.50 1 .414 0 .049 0.090 0 . 2 2 1 -0.25 1 .189 0 . 0 0 0 0.000 0 . 2 2 1
0 .00 1.000 0 .049 0 . 0 9 0 0 . 3 1 1 0.25 0 . 8 4 1 0 .082 0 . 1 5 1 0 . 4 6 1 0.50 0.707 0.049 0 .090 0 . 5 5 1 0 . 7 5 0.595 0 .092 0 .169 0.720 1 . 0 0 0 . 5 0 0 0 .109 0 . 2 0 0 0 . 9 2 1 1 .25 0 . 4 2 0 0.082 0 .151 1 . 0 7 1 1 .50 0 .354 0 .098 0 .180 1 .252
Wentworth Classification 0 . 0 6 1 0 . 8 6 0 2.152 96.427 0.500 0 . 0 0 0 Unified Classification 0 .000 0 .061 1 . 0 1 1 97 .708 1 . 2 2 0 0.000
PHI MM Weight Percnt CUmUl Percnt ----- -__-- ------ ------ ------
1 . 7 5 0 . 2 9 7 0 .229 0 . 4 2 1 1.672 2 .00 0 .250 0.762 1 . 4 0 0 3.073 2 . 2 5 0 . 2 1 0 2.399 4.409 7 .482 2.50 0.177 7.748 14 .240 21.722 2 .75 0.149 14.848 27.289 49 .011 3.00 0.125 11 .257 20.689 69.700 3.25 0 .105 10.202 18 .750 88 .451 3 .50 0.088 2.900 5 .330 93 .781 3 . 7 5 0 . 0 7 4 2.720 4 .999 98.780 4 .00 0.063 0 .392 0.720 99.500 4.25 0 .053 0 .272 0 .500 100.000 4.50 0.044 0 . 0 0 0 0.000 100.000 4 .75 0.037 0.000 0.000 100.000 5 .00 0 .031 0.000 0 . 0 0 0 100 .000 5 . 2 5 0 .026 0 .000 0 . 0 0 0 1 0 0 . 0 0 0 5 . 5 0 0.022 0.000 0 . 0 0 0 100.000 5 .75 0 .019 0 . 0 0 0 0 . 0 0 0 100.000 6.00 0 .016 0 .000 0 . 0 0 0 100 .000
Standard Statistics : Median Mean Dev. Skew Kurt
Method of Moments (PHI) 2 .78 0.49 -1.65 14.09 Folk Graphic Measures (PHI) 2.76 2.78 0.42 0.09 1 . 1 0 Grain Size (mm) 0.15 0.15
Locality Type Sample Date Profile Analysis Date Analyz 3 9 G 6218612 8 5 0 8 2 1 8 7 0 7 2 8 LLS
x Position : 3300.00 Y Position : 1229 .31
Elevation of Top of Core : -13.39 Length of Core 0 .00 Depth to Top of Sample : 0.00 Depth to Bottom of Sample :
comments :
Start Weight : 51.340 Final Weight : 51.261 Deviation : 0.154 %
PHI MM
----- ----- Weight Percnt CumUl
Percnt PHI KM Weight Percnt
------ 0 . 7 0 0 2.380 7 .610
24 .479 29 .030 1 5 . 8 4 1 11.059
4.760 2.320 0 .570 0.140 0.000 0.000 0.000 0 .000 0 .000 0.000 0 . 0 0 0
Cumul Percnt ------
Sample Content by Weight Percent :
Gravel Sand Silt Clay coarse medium fine
Wentworth Classification 0 .000 0 .702 3 .490 95.667 0 .140 0.000 Unified Classification 0 .000 0 .000 0 .862 9 8 , 4 2 8 0 . 7 1 0 0 .000
Standard Statistics : Median Mean Dev. Skew Kurt
Method of Moments (PHI) ~ o l k Graphic Measures (PHI) Graln Size (nm)

Locality Type Sample Date Profile Analysis Date Analyz 3 9 G 6218613 850821 870728 LLS
X Position : 3300.00 Y Position : 1452.41
Elevation of Top of Core : -15.06 Length of Core 0.00 Depth to Top of Sample : 0.00 Depth to Bottom of Sample :
Comments :
Start Weight : 54.810 Final Weight : 54.820 Deviation : 0.018 %
PHI MM Weight Percnt Cumul Percnt ----- ----- ------ ------ ------
PHI MM Weight Percnt Cumul Percnt ----- ----- ------ ------ ------
Sample Content by Weight Percent :
Gravel Sand Silt Clay coarse medium fine
Wentworth Classification 0.089 1.390 3.480 94.971 0.069 0.000 Unified Classification 0.000 0.089 1.571 98.001 0.339 0.000
Standard Statistics : Median Mean Dev. Skew Kurt
Method of Moments (PHI) 2.56 0.48 -2.18 17.23 Folk Graphic Measures (PHI) 2.55 2.59 0.36 0.13 1.02 Grain Size (mm) 0.17 0.17
Locality Type Sample Date Profile Analysis Date Analyz 3 9 G 6218614 850821 870728 LLS
x Position : 3300.00 Y Position : 1729.46
Elevation of Top of Core : -18.22 Length of Core 0.00 kpth to Top of Sample : 0.00 Depth to Bottom of Sample :
Comments :
start Weight : 49.700 Final Weight : 49.530 Deviation : 0.342 %
PHI MM Weight Percnt Cumul Percnt
sample Content by Weight Percent :
Gravel Sand Silt Clay coarse medium fine
wentworthclassificatlon 0.000 0.000 0.481 99.019 0.501 0.000 Unified Classification 0.000 0.000 0.000 98.429 1.571 0.000
Standard Statistics : Median Mean Dev. Skew Kurt
Method of Moments (PHI) Folk Graphic Measures (PHI) Grain size (mm)

zcality Type Sample Date Proflle Analysis Date Analyz 39 G 6218615 850821 8 7 0 7 2 8 L I S
X Position : 3300 .00 Y Position : 1957 .83
Elevation of Top of Core : -20 .52 Length of Core 0.00 Depth to Top of Sample : 0 .00 Depth to Bottom of Sample :
Comments :
Start Weiqht : 52.350 Final Weight : 52 .289 Deviation : 0.117 %
PHI
----- -2.75 -2.50 - 2 . 2 5 -2 .00 -1.75 -1 .50 -1.25 -1.00 -0.75 -0.50 -0 .25
0.00 0 .25 0 .50 0.75 1 - 0 0 1 . 2 5 1 . 5 0
Weight Percnt Cumu 1 Percnt ------
0.000 0.000 0.000 0.000 0.000 0.000 0.000 0.000 0.080 0.080 0.080 0.080 0.080 0.080 0.080 0.080 0.080 0.080
PHI MM Weight Percnt Cumul Percnt ----- ----- ------ ------ ------
Sample Content by Weight Percent :
Gravel Sand Silt Clay coarse medium fine
Xentworth Classification 0.000 0.080 0.170 99.350 0.400 0.000 Znified Classification 0.000 0.000 0 .080 98 .330 1.589 0.000
Standard Statistics : Median Mean Dev. Skew Kurt
Yethod of Moments (PHI) 2.97 0 .34 -0.80 1 5 . 7 1 Folk Graphic Measures (PHI) 2.95 2 .95 0 .32 0.08 1.04 Grain Size (mm) 0.13 0.13
Locality Sample Date Profile Analysis m t e Analyz 3 9 6218616 850821 870728 LLS
x Position : 3300.00 Yposition : 2448 .57
Elevation of Top of Core : -23 .74 Length of Core 0.00 Depth to Top of Sample : 0.00 Depth to Bottom of Sample :
Comments :
Start Weiqht : 57.450 Final Weight : 5 7 . 3 5 1 Deviation : 0 .172 %
PHI MM Weight Percnt Cumul Percnt ----- ----- ------ ------ ------
PHI MM Weiqht Percnt Cumul Percnt ------ ------ ------
0.000 0.000 0 . 0 5 1 0.052 0.091 0 . 1 4 1
sample Content by Weight Percent :
Gravel Sand Silt Clay coarse medium fine
uentworth Classification Lnlfied Classification
Standard Statistics : Median Mean Dev. Skew Kurt
Xethod of Moments (PHI) 3 . 0 4 0 . 3 1 -0.60 1 5 . 6 4 Folk Graphic Measures (PHI) 3 . 0 2 3 .04 0.30 0 .12 1 . 1 4 Grain Size (mm) 0.12 0.12

Iacality Type Sample Date Profile Analysis Date Analyz 3 9 G 6218617 850821 870728 LLS
X Position : 3300.00 Y Position : 2949.47
Elevation of Top of core : -26.48 Length of Core 0.00 Depth to Top of Sample : 0.00 Depth to Bottom of Sample :
Comments :
Start
PHI
Weight
Mn
: 21.090 Final Weight Deviation :
Weight Percnt Cumul Percnt I PHI MM Weight Percnt Cumul
Percnt
Sample Content by Weight Percent :
Gravel Sand Silt clay coarse medium fine
Wentworth Classification 0.000 0.000 0.000 99.188 0.812 0.000 Unified Classification 0.000 0.000 0.000 96.998 3.002 0.000
Standard Statistics : Median Mean Dev. Skew Kurt
3.11 0.31 0.33 3.70 3.10 3.11 0.31 0.08 1-13 0.12 0.12
Method of Moments (PHI) Folk Graphic Measures (PHI) Grain Size (mm)
Iacality Type Sample Date Profile Analysis Date Analyz 39 G 6218802 850906 870716 LLS
x Position : 3300.00 Y Position : 191.00
Elevation of Too of Core : Length of Core Depth to Top of Sample : Depth to Bottom of Sample :
Comments :
Start Weight : 62.380 Final Weight : 62.139 Deviation : 0.386 %
PHI MN Weight Percnt Cumul PHI HH Weight Percnt Cumul Percnt ----- ----- ------ ------ ----- ----- ------ ------ ------
Sample Content by Weight Percent :
Gravel Sand Silt Clay coarse medium fine
Wentworth Classification 0.000 20.171 65.320 14.509 0.000 0.000 Unified Classification 0.000 0.000 39.011 60.989 0.000 0.000
Standard Statistics : Median Mean Dev. Skew Kurt
Method of Moments (PHI) Folk Graphic Measures (PHI) Grain Size (mm)

Lacality Type Sample Date Profile Analysis Date Analyz 3 9 G 6218803 850906 870716 LLS
X Position : 3 3 0 0 . 0 0 Y Position : 299.16
Elevation of Top of Core : 8 . 4 9 Length of Core 0.00 Depth to Top of Sample : 0.00 Depth to Bottom of Sample :
Comments :
Start Weight : 56.870 Final Weight : 56 .440 Deviation : 0.756 %
PHI MM Weight Percnt Cumul Percnt ----- ----- ------ ------ ------
PHI
----- 1.75 2.00 2.25 2.50 2.75 3.00 3.25 3.50 3.75 4.00 4.25 4 .50 4.75 5.00 5.25 5.50 5.75 6.00
Weight Percnt CumUl Percnt
Sample Content by Weight Percent :
Gravel Sand Silt Clay coarse medium fine
Wentworth Classification 1.019 55.710 29.750 13 .521 0.000 0.000 Unified Classification 0.000 1.019 61.221 37.760 0.000 0.000
Standard Statistics : Median Mean Dev. Skew Kurt
Method of Moments (PHI) 0.84 0.95 0.03 1.97 ~ o l k Graphic Measures (PHI) 0.77 0.84 0.96 0.09 0.70 Grain Size (mm) 0.59 0.56
~ocality Type Sample Date Profile Analysis Date Analyz 3 9 G 6218804 850906 870716 LLS
X Position : 3300.00 Y Position : 230.06
Elevation of Top of Core : 12 .43 Length of Core 0.00 Depth to Top of Sample : 0.00 Depth to Bottom of Sample :
Comments : CONCENTRATION OF SHELLS IN -1.75 SIEVE
Start Weight : 51.390 Final Weight : 51.224 Deviation : 0.323 %
PHI MM Weight Percnt Cumul Percnt ----- ----- ------ ------ ------
PHI HM Weight Percnt Cumul Percnt ----- ----- ------ ------ ------
sample Content by Weight Percent :
Gravel Sand silt Clay coarse medium fine
Wentworth Classification Unified classification
Standard Statistics : Median Mean Dev. Skew Kurt
Xethod of Moments (PHI) 1.64 0.83 -1 .73 6 . 6 5 Folk Graphic Measures (PHI) 1 .85 1 . 7 1 0 .73 - 0 . 4 0 1 . 3 2 Grain Size (mm) 0.28 0 .32

Locality Type Sample Date Profile Analysis Date Analyz 3 9 G 6218805 850906 8 7 0 7 1 6 LLS
X Position : 3 3 0 0 . 0 0 Y Position : 2 6 0 . 0 6
Elevation of Top of Core : 8 .83 Length of Core 0.00 Depth to Top of Sample : 0.00 Depth to Bottom of Sample :
Comments :
Startweight: 5 7 . 6 8 0 Finalweight: 5 7 . 4 5 1 Deviation : 0 . 3 9 7 %
PHI MM Weight Percnt Cumul Percnt ----- ----- ------ ------ ------
PHI MM Weight Percnt Cumul Percnt ----- ----- ------ ------ ------
Sample Content by Weight Percent :
Gravel Sand Silt Clay coarse medium fine
Wentworth Classification 0.050 6 .122 5 7 . 5 2 9 36.299 0.000 0.000 Unified classification 0.000 0 .050 1 1 . 4 1 1 8 8 . 5 3 8 0.000 0.000
Standard Statistics : Median Mean Dev. Skew Kurt
Method of Moments (PHI) Folk Graphic Measures (PHI) Grain size (mm)
Locality 3 9
Sample 6218806
Date 850906
Profile Analysis Date Analyz 870728 LLS
X Position : 3300.00 Y Position : 3 3 5 . 8 1
Elevation of Top of Core : Length of Core Depth to Top of Sample : Depth to Bottom of Sample :
Comments :
Start Weight : 3 1 . 2 3 0 Final Weight : 30.690 Deviation : 1 . 7 2 9 %
'PHI MM Weight Percnt Cumul Percnt ----- ----- ------ ------ ------
PHI MM Weight Percnt Cumul Percnt ----- ----- ------ ------ ------
Sample Content by Weight Percent :
Gravel Sand Silt Clay coarse medium fine
Wentworth Classification 0.000 1.010 2 9 . 6 2 5 69 .365 0.000 0.000 Unified Classification 0.000 0.000 2 .089 9 7 . 9 1 1 0.000 0.000
Standard Statistics : Median Mean Dev. Skew Kurt
Method of Moments (PHI) 2.16 0 . 3 8 - 0 . 6 1 4 . 3 7 Folk Graphic Measures (PHI) 2 . 1 9 2 . 1 7 0 . 3 6 - 0 . 1 2 1 . 0 4 Grain Size (mm) 0 . 2 2 0 . 2 2

Locality Type Sample Date Profile Analysis Date Analyz 39 G 6218807 850906 870728 LLS
X Position : 3300.00 Y Position : 467.80
Elevation of Top of Core : -1.77 Length of Core 0.00 Depth to Top of Sample : 0.00 Depth to Bottom of Sample :
comments :
Start Weight
PHI MU Weight
140 Final Weight
Percnt Cumul Percnt ------ ------
0.000 0.000 0.000 0.000 0.000 0.000
PHI MU
Deviation :
Weight Percnt
0.345 %
Cumul Percnt
Sample Content by Weight Percent :
Gravel Sand silt Clay coarse medium fine
Wentworth Classification 0.148 1.305 9.787 88.669 0.090 0.000 Unified Classification 0.000 0.148 1.766 97.714 0.371 0.000
Standard Statistics : Median Mean Dev. Skew Kurt
Method of Moments (PHI) 2.54 0.53 -1.79 12.43 folk Graphic Measures (PHI) 2.58 2.56 0.45 -0.12 1.13 Grain Size (mm) 0.17 0.17
-lity TyEe Sample Date Profile Analysis Date Analyz 39 6218808 850906 870728 SJT
X Position : 3300.00 Y Position : 595.09
Elevation of Top of Core : -4.77 Length of Core 0.00 Depth to Top of Sample : 0.00 Depth to Bottom of Sample :
Comments :
Start Weight : 43.600 Final Weight : 43.269 Deviation : 0.759 %
PHI MU Weight Percnt Cumul PHI HH Weight Percnt Cumul ~ercnt I Percnt
Sample Content by Weight Percent :
Gravel Sand Silt Clay coarse medium fine
wentworth Classification 0.830 2.480 13.908 82.782 0.000 0.000 Unlfied Classification 0.000 0.830 3.379 95.650 0.141 0.000
Standard Statistics : Median Mean Dev. Skew Kurt
Hethod of Moments (PHI) 2.39 0.66 -2.42 13.82 Folk Graphic Measures (PHI) 2.47 2.45 0.52 -0.13 1.19 Grain Size (mm) 0.18 0.19
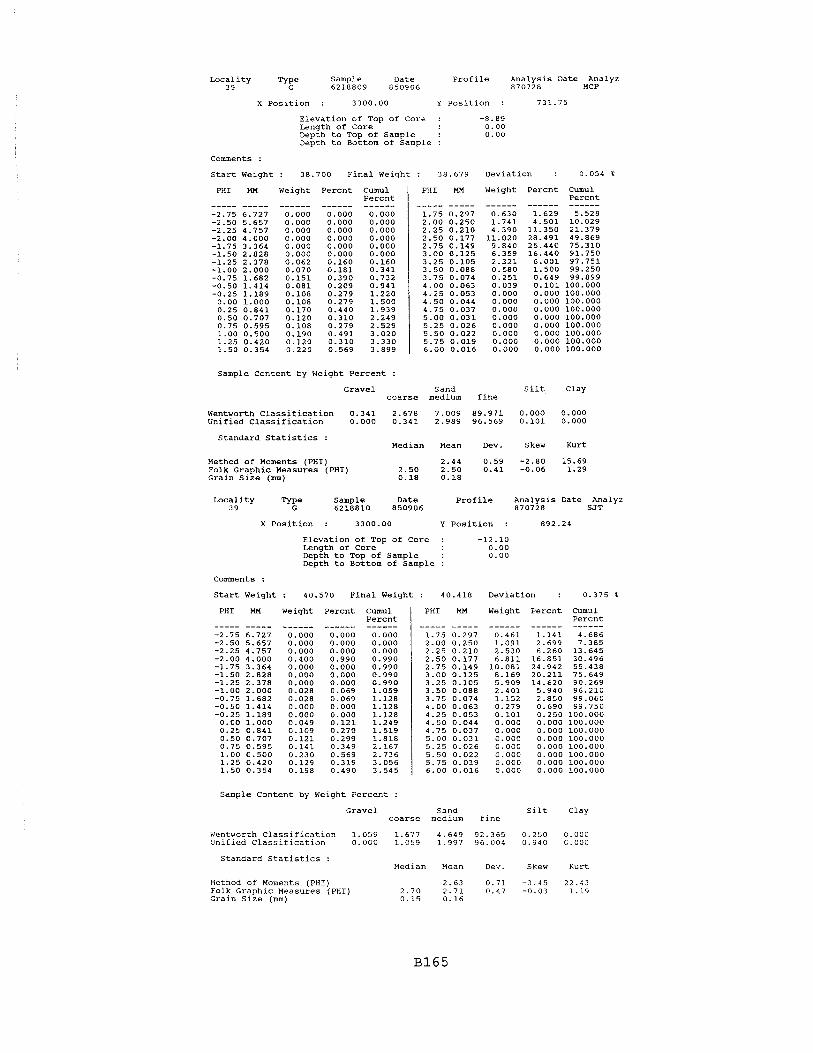
Locality Type Sample Date Profile Analysis Date Analyz 39 G 6218809 850906 870728 MCP
XPosition : 3300.00 Y Position : 731.75
Elevation of Top of Core : -8.89 Length of Core 0.00 mpth to Top of Sample : 0.00 Depth to Bottom of Sample :
Comments :
Start Weight : 38.700 Final Weight : 38.679 Deviation : 0.054 %
PHI HM Weight Percnt Cumul Percnt ----- ----- ------ ------ ------
PHI HN Weight Percnt Cumul Percnt ----- ----- ------ ------ ------
Sample Content by Weight Percent :
Gravel Sand Silt Clay coarse medium fine
Wentworth Classification Unlfied Classification
Standard Statistics : Median Mean Dev. Skew Kurt
Method of Moments (PHI) 2.44 0.59 -2.80 15.69 Folk Graphic Measures (PHI) 2.50 2.50 0.41 -0.06 1.29 Grain size (mm) 0.18 0.18
Locality Type Sample Date Profile Analysis Date Analyz 3 9 G 6218810 850906 870728 SJT
X Position : 3300.00 Y Position : 892.24
Elevation of Top of Core : -12.10 Length of Core 0.00 Depth to Top of Sample : 0.00 Depth to Bottom of Sample :
Comments :
Start Weight : 40.570 Final Weight : 40.418 Deviation : 0.375 %
PHI HN Weight Percnt Cumul PHI MM Weight Percnt Cumul Percnt Percnt ----- ----- ------ ------ ------ ----- ----- ------ ------ ------
-2.75 6.727 0.000 0.000 0.000 1.75 0.297 0.461 1.141 4.686
Sample Content by Weight Percent :
Gravel Sand Silt Clay coarse medium fine
Wentworth Classification 1.059 1.677 4.649 92.365 0.250 0.000 Unified Classification 0.000 1.059 1.997 96.004 0.940 C.OOO
Standard Statistics : Median Mean Dev. Skew Kurt
Method of Moments (PHI) 2.63 0.71 -3.45 22.43 Folk Graphic Measures (PHI) 2.70 2.71 0.47 -0.03 1.19 Grain Size (mm) 0.15 0.16

Locality Type Sample Date Profile Analysis Date Analyz 39 G 6218811 850906 870728 SJT
X Position : 3300.00 Y Position : 1007.03
Elevation of Top of Core : -12.63 Length of Core 0.00 Depth to Top of Sample : 0.00 Depth to Bottom of Sample :
Comments :
Start Weight : 43.470 Final Weight : 43.199 Deviation : 0.623 %
PHI MM Weight Percnt Cumul PHI HM Weight Percnt Cumul Percnt ----- ----- ------ ------ ----- ----- ------ ------ ------
sample Content by Weight Percent :
Gravel Sand Silt Clay coarse medium fine
Wentworth Classification 0.000 0.280 2.470 96.831 0.419 0.000 Unified Classification 0.000 0.000 0.370 97.870 1.759 0.000
Standard Statistics : Median Mean Dev. Skew Kurt
Method of Moments (PHI) Folk Graphic Measures (PHI) Grain Size (mm)
Locality Type Sample Date Profile Analysis Date Analyz 3 9 G 6218812 850906 870728 SJT
XPosition : 3300.00 Y Position : 1251.55
Elevation of TOD of Core : -13.50 -
Length of Core 0.00 Depth to Top of Sample : 0.00 Depth to Bottom of Sample :
Comments :
Start Weight : 35.830 Final Weight : 35.779 Deviation : 0.142 %
PHI Weight Percnt Cumul Percnt
PHI MM Weight Percnt Cumul Percnt ------ ------
Sample Content by Weight Percent :
Gravel Sand silt Clay coarse medium fine
Wentworth Classification 0.640 1.778 7.152 90.321 0.109 0.000 Unified Classification 0.000 0.640 2.169 96.741 0.450 0.000
Standard Statistics : Median Mean Dev. Skew Kurt
Hethod of Moments (PHI) Folk Graphic Measures (PHI) Grain Size (mm)

Locality Type Sample Date Profile Analysis Date Analyz 39 G 6218813 850906 870728 S JT
XPosition : 3300.00 Y Position : 1497.83
Elevation of Top of Core : -15.64 Length of Core 0.00 Depth to Top of Sample : 0.00 wpth to Bottom of Sample :
Comments :
Start Weight : 44.180 Final Weight : 43.810 Deviation : 0.837 %
PHI MM Weight Percnt Cumul Percnt ----- ----- ------ ------ ------
PHI MM Weight Percnt Cumul Percnt ----- ----- ------ ------ ------
Sample Content by Weight Percent :
Gravel Sand Silt Clay coarse medium fine
Wentworth Classification Unified Classification
Standard Statistics : Median Mean Dev. Skew Kurt
Method of Moments (PHI) 2.65 0.48 -3.13 32.82 Folk Graphic Measures (PHI) 2.63 2.66 0.37 0.14 0.96 Grain Size (mm) 0.16 0.16
Locality Type Sample Date Profile Analysis Date Analyz 3 9 G 6218814 850906 870728 SJ T
XPosition : 3300.00 Y Position : 1691.57
Elevation of Top of Core : -17.87 Length of Core 0.00 mpth to Top of Sample : 0.00 mpth to Bottom of Sample :
Comments :
Start Weight : 25.200 Final Weight : 25.231 Deviation : 0.123 %
PHI Kt4 Weight Percnt Cumul PHI MM Weight Percnt Cumul Percnt I Percnt
Sample Content by Weight Percent :
Gravel Sand Silt Clay coarse medium fine
Wentworth Classification 1.241 0.000 0.551 97.769 0.440 0.000 Unified Classification 0.000 1.241 0.000 97.448 1.312 0.000
Standard Statistics : Median Mean Dev. Skew Kurt
Method of Moments (PHI) Folk Graphic Measures (PHI) Grain size (mm)

Locality Type Sample Date Profile Analysis Date Analyz 3 9 G 6218815 850906 870728 SJT
X Position : 3300 .00 Y Position : 1968.82
Elevation of Top of Core : -20 .05 Length of Core 0.00 Depth to Top of Sample : 0.00 Depth to Bottom of Sample :
Comments :
Start Weight : 45.060 Final Weight : 4 4 . 9 7 0 Deviation : 0.200 %
PHI !a Weight Percnt Cumul Percnt
PHI HM Weight Percnt CUmUl Percnt ----- ----- ------ ------ ------
sample Content by Weight Percent :
Gravel Sand Silt Clay coarse medium fine
WentworthClassification 0.000 0.000 0.129 99 .251 0.620 0.000 Unified Classification 0.000 0.000 0.000 97.799 2 . 2 0 1 0.000
Standard Statistics : Median Mean Dev. Skew Kurt
Method of Moments (PHI) 3 . 0 1 0 .33 0.30 3.49 Folk Graphic Measures (PHI) 3 .01 3 .00 0.33 0.02 1.06 Grain size (mm) 0 .12 0.12
Locality Sample Date Profile Analysis Date Analyz 3 9 6218816 850906 870728 SJT
X Position : 3300.00 Y Position : 2482 .01
Elevation of Top of Core : Length of Core Depth to Top of Sample : Depth to Bottom of Sample :
Comments :
start Weight : 3 2 . 1 2 0 Final Weight : 32 .070 Deviation : 0.156 %
PHI !a Weight Percnt Cumul Percnt ----- ----- ------ ------ ------
PHI Mn Weight Percnt Cumul Percnt
Sample Content by Weight Percent :
Gravel Sand Silt Clay coarse medium fine
Wentworth Classification 0.000 0.000 0.000 99 .161 0 . 8 3 9 0.000 Unified Classification 0.000 0.000 0.000 97 .041 2.959 0.000
Standard Statistics : Median Mean Dev. Skew Kurt
Method of Moments (PHI) Folk Graphic Measures (PHI) Grain size (mm)

Locality Type Sample Date Profile Analysis Date Analyz 39 G 6218817 850906 870728 SJT
X Position : 3300 .00 Y Position : 2951 .55
Elevation of Top of Core : -26.37 Length of Core 0 .00 Depth to Top of Sample : 0 . 0 0 Oepth to ~ottom of sample :
Comments :
Start Weight : 29. , 4 6 0 Final Weight Deviation :
PHI MM Weight Percnt Cumul Percnt I PHI MM Weight Percnt Cumul
Percnt ------ 0.000 0.098
Sample Content by Weight Percent :
Gravel coarse
Sand Silt Clay medium fine
Wentworth Classification 0 . 0 0 0 0 .000 Unified Classification 0 . 0 0 0 0.000
Standard Statistics : Median Mean Dev. Skew Kurt
Method of Moments (PHI) Folk Graphic Measures (PHI) 3.08 Grain Size (mm) 0 .12

Waterways Experiment Station Cataloging-in-Publication Data
Stauble, Donald K. Long-term profile and sediment morphodynamics : Field Research
Facility Case history / by Donald K. Stauble, Coastal Engineering Re- search Center ; prepared for Department of the Army, U.S. Army Corps of Engineers.
252p. in various pagings : ill. ; 28 cm. -- (Technical report ; CERC- 92-7)
lncludes bibliographic references. 1. Sediment transport -- Atlantic Coast (N.C.) -- Statistics. 2. Sedi-
mentation and deposition -- Atlantic Coast (N.C.) -- Statistics. 3. Coast changes -- North Carolina. I. United States. Army. Corps of Engineers. I I. Coastal Engineering Research Center (U.S.) Ill. U.S. Army Engineer Waterways Experiment Station. IV. Title. V. Series: Technical report (U.S. Army Engineer Waterways Experiment Station) ; CERC-92-7. TA7 W34 no.CERC-92-7