Report - Department of Infrastructure, Regional … · Web viewIBISWorld Industry Report G3911....
113
Impact analysis of potential changes to the current restrictions on the importation of used motor vehicles into Australia Dealer Group Against Used
Transcript of Report - Department of Infrastructure, Regional … · Web viewIBISWorld Industry Report G3911....
Impact analysis ofpotential changes to the current restrictions on the importation of used motor vehicles into Australia
Dealer Group Against UsedCar Imports
9 September 2014


ContentsExecutive Summary....................................................................................................................i
2 Introduction ....................................................................................................................62.1 Background ...................................................................................................................... 62.2 Structure of report............................................................................................................ 7
3 Market analysis ...............................................................................................................93.1 Overview .......................................................................................................................... 93.2 Market segmentation ....................................................................................................... 93.3 Demand.......................................................................................................................... 143.4 Supply ............................................................................................................................ 163.5 Competition in the retail car market ............................................................................... 193.6 Information and regulation ............................................................................................. 203.7 Key trends in the retail car market .................................................................................. 22
4 Policy driver and regulatory analysis..............................................................................314.1 Legal and regulatory framework...................................................................................... 314.2 Past policy rationale for restricting large scale imports .................................................... 344.3 Current policy rationale for removing import restrictions ................................................ 35
5 Pot5.1
ential impacts to the retail car market......................................................................37New Zealand experience ................................................................................................. 37
5.2 Source markets............................................................................................................... 405.3 International comparison................................................................................................ 425.4 Direct effects .................................................................................................................. 455.5 Implications for the Australian market ............................................................................ 47
Conclusions.............................................................................................................................52
Appendix A – Further charts ....................................................................................................54Limitation of our work ............................................................................................................... 57
Deloitte refers to one or more of Deloitte Touche Tohmatsu Limited, a UK private company limited by guarantee, and its networ k of member firms, each of which is a legally separate and independent entity. Please see w ww . d e l o i t te . c o m / a u / a b o u t for a detailed description of the legal structure of Deloitte Touche Tohmatsu Limited and its member firms.
Liability limited by a scheme approved under Professional Standards Legislation.
© 2014 Deloitte Touche Tohmatsu

Executive Summary
This report has been commissioned by the Dealer Group Against Used Car Imports (DGAUCI) to inform an industry response to suggested changes to existing legislation regulating the large-scale importation of used cars into Australia.
The report analyses potential impacts of removing used car import restrictions on the retail car market. The impetus for this report stems from industry concerns with suggested changes to allow the large-scale importation of used vehicles into Australia presented in a Productivity Commission Review into Australia’s automotive manufacturing industry and the complexities associated with such a change.Currently, the DGAUCI is preparing a response to Motor Vehicle Standards Act (MVSA) review with the aim to inform the review of the complexities of removing used car import restrictions. The NMBDA has engaged Deloitte on behalf of the DGAUCI to prepare a report on the potential impacts of removing used car import restrictions on the Australian retail car market. The analysis in this report was commissioned to help inform the DGAUCI’s response to MVSA review.
This report provides an overview of the Australian retail new car market and an analysis into the potential impacts of regulatory change on the retail car market in Australia.
Market Overview
The Australian retail car market is a $74.0 billion industry which employs over 66,000 people, sells in excess of one million new cars each year and adds nearly $6.4 billion to the Australian economy1. The retail car market in Australia is highly competitive with many buyers and many sellers actively participating in the market. There are over 4,700 car dealers in the Australian market dealing in over 60 different marques. Competition primarily takes place in three market segments: the volume segment, the prestige segment and the luxury segment.
Table 1.1: Market segmentation in new car market, 2013
Volume Prestige LuxuryUnits sold 740,951 277,557 91,006% of units sold 67% 25% 8%Source: Federal Chamber of Automotive Industries (2014)
The volume segment of the market is by far the largest with 67 per cent of new cars sold in2013 being volume cars, followed by prestige with 25 per cent of new cars sold in 2013 being prestige cars and luxury with 8 per cent of new cars sold in 2013 being luxury cars (Table 1.1).
1 Whytcross, D. (2014). Motor Vehicle Dealers in Australia. IBISWorld Industry Report G3911. IBISWorld.i

ii
Mot
or V
ehic
le C
PI
When put in an international context, Australia’s high level of competition in the retail car market becomes more apparent. The number of brands and market share of each of these brands of car are good indicators of the level of competition in a market. Table 1.2 presents a comparison of these indicators in Australia, Canada, the UK and the USA – Australia has both a higher number of brands (67) and a lower market size per brand (16,597 unit sales per brand) than each of these other markets, both indicators suggesting that Australia is the most highly competitive.
Table 1.2: Competitiveness of global car markets, 2013
Australia Canada UK USANumber of brands in Australia 67 49 53 51Sales (car units) 1,112,032 1,620,221 2,249,483 13,040,632Market size per brand (car units) 16,597 33,066 42,443 255,699Source: Department of Industry, Innovation, Climate Change, Science, Research and Tertiary Education (2013),March 2013 Automotive update
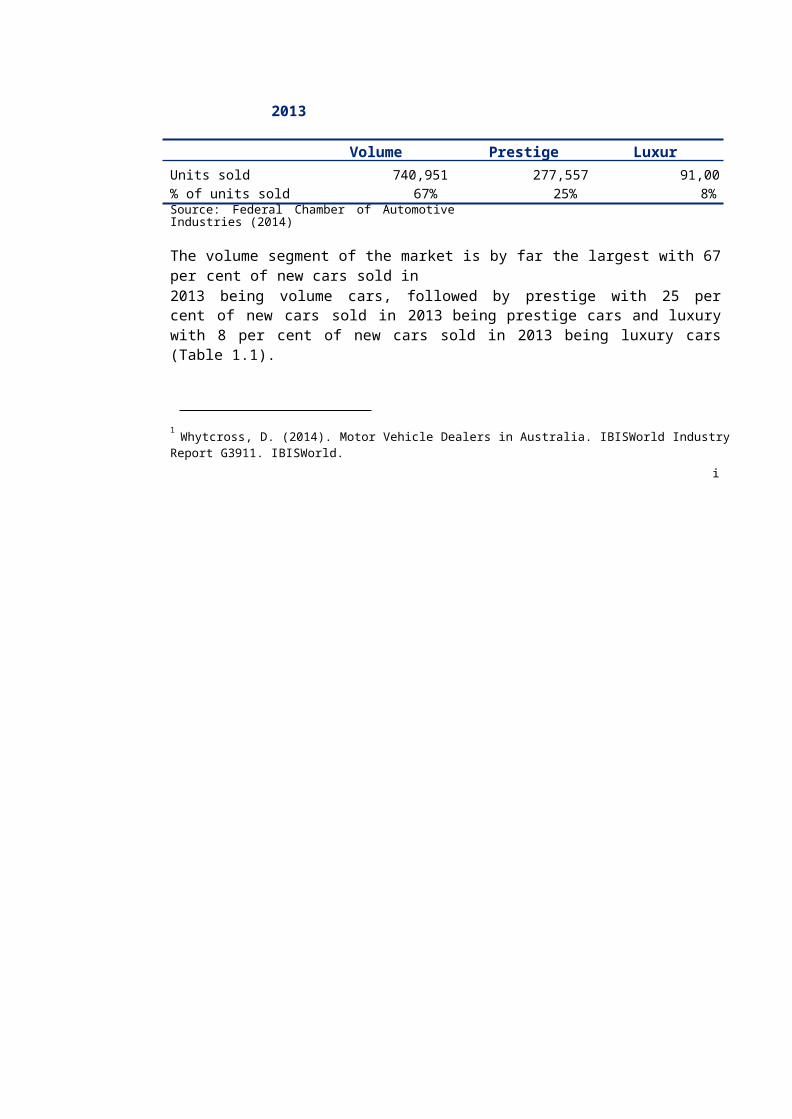
The competitiveness of the Australian retail car market has brought about many positive outcomes for consumers in the past decade. Australia has experienced a significant increase in the affordability of cars over the past decade. There are a range of factors behind this increase including a rising Australian dollar reducing the costs of imported vehicles, increased competition in the local retail car market pushing down prices and a steady increase in the disposable income of the average Australian. Chart 1.1 below shows the decrease in motor vehicle prices as measured by the motor vehicle consumer price index.
Chart 1.1: Decrease in motor vehicle prices, 2003-2013
115
110
105
100
95
90
85
Source: ABS CPI
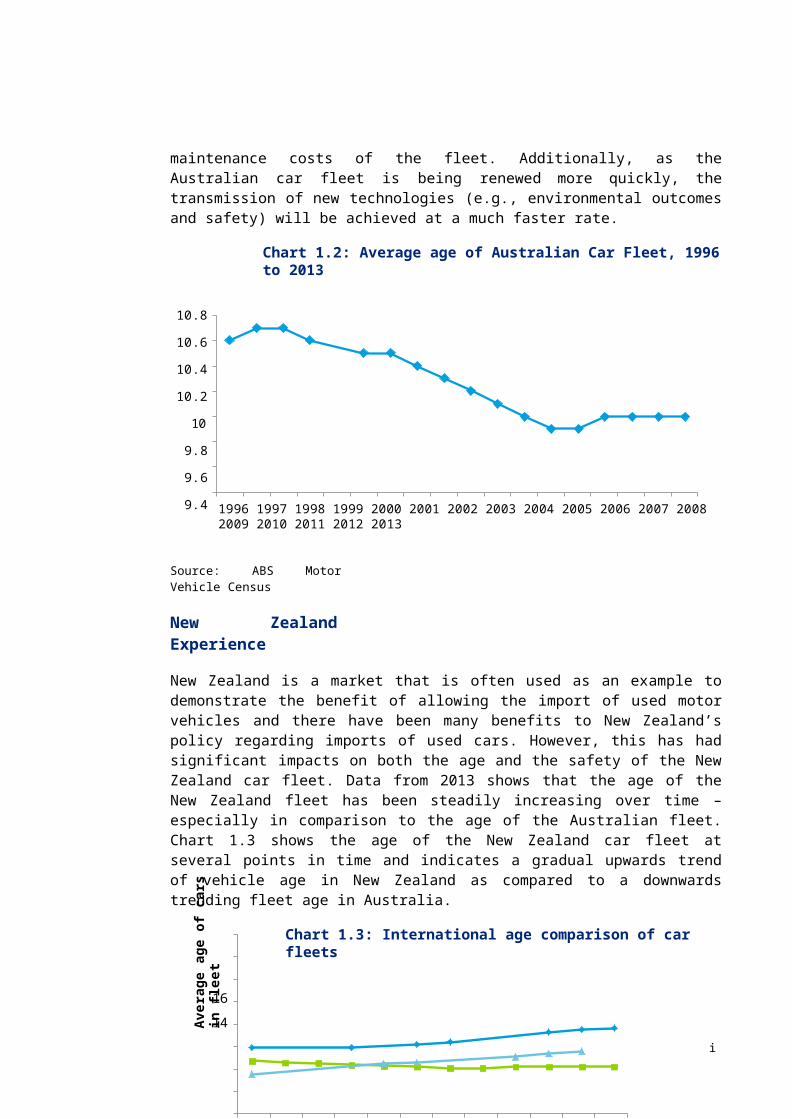
Increased affordability has also had wider benefits for the Australian car fleet. Car ownership has consistently risen in Australia since the 1950s, particularly driven by strong growth in the new car market in the past 10 years. The injection of new cars into the market has had some benefits for the age of the relatively old Australian fleet. This trend of decreasing age of motor vehicles is likely to have productivity benefits and decreased
iii
Aver
age
age
of c
ars i
n fle
et
maintenance costs of the fleet. Additionally, as the Australian car fleet is being renewed more quickly, the transmission of new technologies (e.g., environmental outcomes and safety) will be achieved at a much faster rate.
Chart 1.2: Average age of Australian Car Fleet, 1996 to 2013
10.8
10.6
10.4
10.2
10
9.8
9.6
9.41996 1997 1998 1999 2000 2001 2002 2003 2004 2005 2006 2007 2008 2009 2010 2011 2012 2013
Source: ABS Motor Vehicle Census
New Zealand Experience
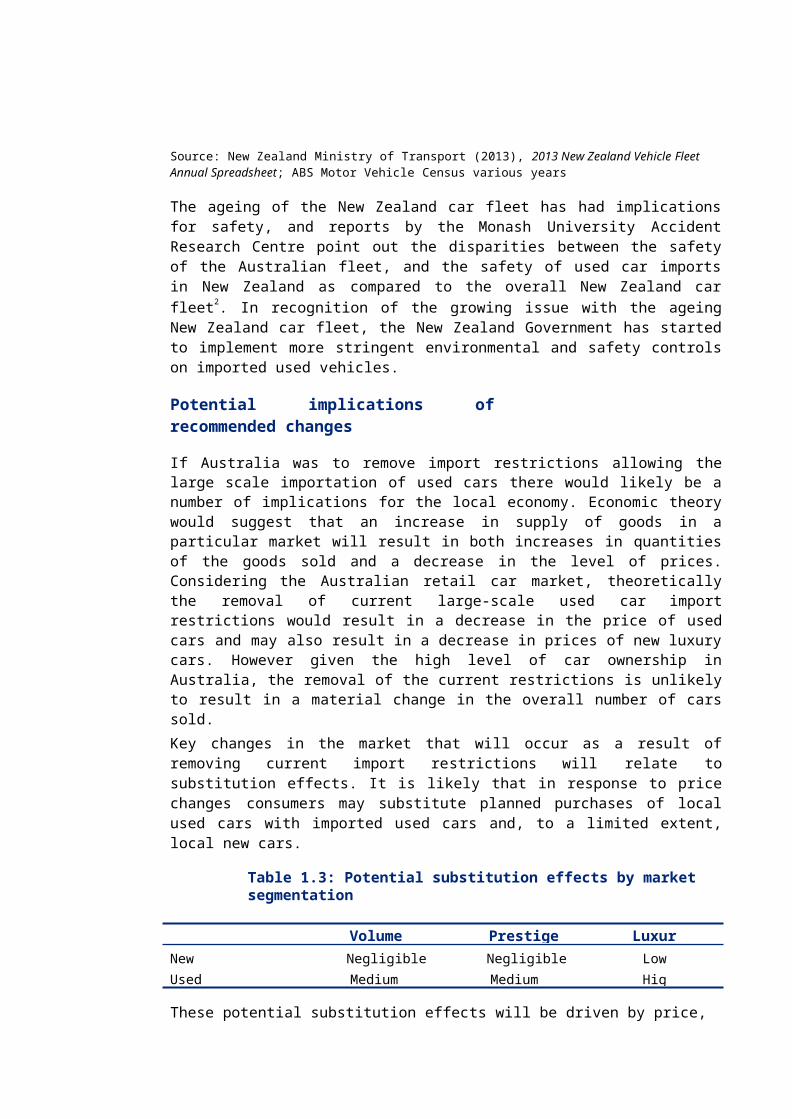
New Zealand is a market that is often used as an example to demonstrate the benefit of allowing the import of used motor vehicles and there have been many benefits to New Zealand’s policy regarding imports of used cars. However, this has had significant impacts on both the age and the safety of the New Zealand car fleet. Data from 2013 shows that the age of the New Zealand fleet has been steadily increasing over time – especially in comparison to the age of the Australian fleet. Chart 1.3 shows the age of the New Zealand car fleet at several points in time and indicates a gradual upwards trend of vehicle age in New Zealand as compared to a downwards trending fleet age in Australia.
Chart 1.3: International age comparison of car fleets
16
14
12
10
8
6
4
2
02002 2003 2004 2005 2006 2007 2008 2009 2010 2011 2012 2013
New Zealand Australia USA
Source: New Zealand Ministry of Transport (2013), 2013 New Zealand Vehicle Fleet Annual Spreadsheet; ABS Motor Vehicle Census various years
The ageing of the New Zealand car fleet has had implications for safety, and reports by the Monash University Accident Research Centre point out the disparities between the safety of the Australian fleet, and the safety of used car imports in New Zealand as compared to the overall New Zealand car fleet2. In recognition of the growing issue with the ageing New Zealand car fleet, the New Zealand Government has started to implement more stringent environmental and safety controls on imported used vehicles.
Potential implications of recommended changes
If Australia was to remove import restrictions allowing the large scale importation of used cars there would likely be a number of implications for the local economy. Economic theory would suggest that an increase in supply of goods in a particular market will result in both increases in quantities of the goods sold and a decrease in the level of prices. Considering the Australian retail car market, theoretically the removal of current large-scale used car import restrictions would result in a decrease in the price of used cars and may also result in a decrease in prices of new luxury cars. However given the high level of car ownership in Australia, the removal of the current restrictions is unlikely to result in a material change in the overall number of cars sold.Key changes in the market that will occur as a result of removing current import restrictions will relate to substitution effects. It is likely that in response to price changes consumers may substitute planned purchases of local used cars with imported used cars and, to a limited extent, local new cars.
Table 1.3: Potential substitution effects by market segmentation
Volume Prestige LuxuryNewUsed
NegligibleMedium
NegligibleMedium
LowHigh
These potential substitution effects will be driven by price, which will depend largely on: The implementation design of the suggested changes to current import restrictions The volume of available vehicles from source markets The new car price differential between Australia and other markets.
The substitution effects will likely have wide reaching implications for the retail car market. It is expected that: In the short run, the suggested changes will have disruptive effects for car dealerships;
however, in the long run, dealerships will likely adjust to the new status quo
2 Newstead, S., Watson, L. and Cameron, M. (2013). Vehicle safety ratings estimated from police reported crash data: 2013 update: Australian and New Zealand crashes during 1987-2011; Newstead, S., Watson, L. and Cameron, M. (2012). Trends in crashworthiness of the New Zealand vehicle fleet by year of manufacture: 1964 to 2010: supplement to Report 313: Vehicle safety ratings estimated from police reported crash data: 2012

update.
Industry Consumers
New car salesNear-new luxury car prices overseas are lower than comparable Australian cars. It is possible that there will be some substitution between new and used luxury cars in Australia; however, this is a small part of the market.Value of existing new stock will decrease as resale value of used cars decreases.Used car salesDealer network will require time to adapt to new sources of supply and adjust pricesPrice of existing used car stock will decrease, devaluing existing stockRecall managementDealers and manufacturers face brand risk if a robust recall management system is not in place for imported used cars.
BenefitsPrice of used cars will likely decrease and there may be an increase in the number of models and variants available.CostsLikely to be higher operating costs associated with imported used cars. Australian dealers have noted that this will be due to higher parts and servicing costs and higher insurance.The value of existing cars held by consumers will fall.Information asymmetriesInformation asymmetry may lead to consumers not making the best choice they can.Cognitive biasesConsumers, when facing complex decisions, make mental shortcuts and may base their decision on factors that they easily relate to. These could include factors such as make of car, or how expensive the same model is in Australia. If the specification is different this may not be the best choice for the consumer.
Consumers will gain some benefit from reduced prices of used cars, however, the extent of these decreases is unclear. Additionally, consumers may face information asymmetries and cognitive bias issues.
Government will need to consider consumer protection issues, policy issues and the fiscal costs of such a policy.
These implications are described in further detail in Table 1.4 below.
Table 1.4 Potential implications of removing large scale import restrictions of used cars
Government
Consumer protection issuesThe recall system needs to be able to cope with an increased number of used imports. Additionally, Government may need to assess the adequacy of the current policy framework to deal with issues such as potential odometer fraud.Policy issuesFleet safety improvement – allowing large scale importation of used cars could increase the age of the fleet and slow the spread of safety technologies.Environmental protection – likely to be an increase in scrapped cars and possibility of imported cars not meeting emissions standardsImplementation, compliance and enforcement of new regulation may be difficult and costly for government.Fiscal costsThere may also be implications for luxury car tax and stamp duty revenues depending on the extent to which the policy change results in a decrease in car prices and the volume of new luxury cars sold.
2 IntroductionThis chapter provides background for the report and sets out the structure for the remainder of the report.
2.1 BackgroundThis report has been commissioned by the Dealer Group Against Used Car Imports (DGAUCI) to inform an industry response to suggested changes to existing legislation regulating the large-scale importation of used cars into Australia. The report analyses potential impacts of removing used car import restrictions on the retail car market. The impetus for this report stems from industry concerns with suggested changes to allow the large-scale importation of used vehicles into Australia presented in a Productivity Commission Review into Australia’s automotive manufacturing industry and the complexities associated with such a change.
Productivity commission review
In October 2013, the Minister for Industry tasked the Productivity Commission (PC) to conduct a review into government support for Australia’s automotive manufacturing industry. The broader focus of the review was on the sustainability of Australia’s automotive manufacturing industry, however, the PC also considered Australia’s current policy regarding the importation of used motor vehicles. The review has now been completed and the PC has publicly released both a preliminary findings report and a positions paper.
In the position paper released in January 2014, the PC came to a draft finding regardingAustralia’s used car import policy:
Draft Finding 3.2
The policy rationale for prohibiting the large-scale importation of second-hand vehicles into Australia is weak. However, appropriate regulatory measures are required to ensure that consumer protection, community safety, and environmental performance standards are maintained before the restrictions are removed. These concerns are best dealt with directly, through regulatory standards applicable to all vehicles sold in Australia.
The $12 000 specific duty on imported second-hand vehicles appears to be largely redundant, providing a prima facie case for its removal.
Following the completion of our report, the PC has since released their final review report. The core finding recommending the removal of large scale used car import restrictions was reiterated in the final inquiry report in Recommendation 5.4, though the PC’s stance on this appeared to have weakened. It is important to note that though the analysis of our report was carried out in reference to the position paper, our conclusions are not changed regarding the potential impacts of removing used car import restrictions in Australia.

7
2014 review of the Motor Vehicle Standards Act 1989
In January 2014, the Assistant Minister for Infrastructure and Regional Development approved the commencement of a comprehensive review of the Motor Vehicle Standards Act 1989 (MVSA) with a specific focus to: Reduce the regulatory burden on business Improve the safety provisions of the legislation Improve the environmental provisions of the legislation Improve the anti-theft provisions of the legislation.The review is tasked with identifying options for addressing the above concerns, which will be formally assessed in a Regulatory Impact Statement (RIS). Our understanding is that if the Government were looking to remove restrictions on large-scale importation of used vehicles, that this would be considered as part of the review of the MVSA.
Dealer Group Against Used Car ImportsThe Dealer Group Against Used Car Imports (DGAUCI) is an association of retail car dealer associations in Australia who oppose the import of used cars into Australia. The group is formed by six national car dealership groups: National Mercedes-Benz Dealers Association BMW National Dealer Council Nissan National Dealer Council Mazda Dealer Association of NSW Hyundai National Dealer Council.
Currently, the DGAUCI is preparing a response to MVSA review with the aim to inform the review of the complexities of removing used car import restrictions. The NMBDA has engaged Deloitte on behalf of the DGAUCI to prepare a report on the potential impacts of removing used car import restrictions on the Australian retail car market. The analysis in this report was commissioned to help inform the DGAUCI’s response to MVSA review.
2.2 Structure of reportThis report provides an overview of the Australian retail new car market and an analysis of the potential impacts of regulatory change on the retail car market in Australia. The report is structured as follows: Chapter 3 summarises the Australian retail car market and includes detailed
descriptions of market segmentation, key market participants, the dealership business model, and key market trends.
Chapter 4 describes the regulatory and legislative framework governing the retail car market, and analyses the policy rationale behind historical regulation of used imports and the current policy rationale for the suggested removal of used car import restrictions.
8
• Chapter 5 is a detailed analysis of the potential implications of removing used car import restrictions on the retail car market.
9
3 Market analysisThis chapter provides an analysis of the retail car market and discusses past, current and future trends.
3.1 OverviewThe Australian retail car market is a $74.0 billion industry which employs over 66,000 people, sells in excess of one million new cars each year and adds nearly $6.4 billion to the Australian economy3. The retail car market can be defined as the market in which the buying and selling of new and used motor vehicles between retail dealerships and consumers, companies and government entities takes place. Products sold in the market are slightly differentiated with different market segments focused on selling volume (low end), prestige (middle range) and luxury (high end) cars. With many buyers and sellers in the market, recent years have seen high levels of competition in the retail car market resulting in lower prices, higher vehicle specifications and diversification of the dealership business model. These features of the retail car market are described in further detail in the following sections. Although the retail car market also facilitates the trade for commercial vehicles, this report focuses on passenger vehicles.
3.2 Market segmentationThe retail market for cars in Australia can be broadly segmented into passenger vehicles and commercial vehicles. This report has a particular focus on passenger vehicles and as such, when looking at passenger vehicles, we apply a more granular lens of segmentation.
3.2.1 Passenger vehicles
The retail car market offers a broad range of passenger vehicles that vary significantly in price and in target market. As such, it is useful to break the market for passenger vehicles down into segments to allow a more detailed analysis. This segmentation groups each make of car into categories based on the marketing strategy of the manufacturer. The specific criteria used to segment brands are based on the manufacturer’s in-market positioning in regards to volume and unit gross margin. Under the Deloitte system of segmentation, each brand is classified as volume, prestige or luxury, where: Volume brands sell a high volume of cars at a low gross margin per unit. Prestige brands sell a medium volume of cars at a mid-range gross margin per unit Luxury brands sell a low volume of cars at a high gross margin per unit.
Deloitte’s Motor Industry Services Group maintains a market segmentation database with information on each of the relevant brands. As brands can adjust their in-market strategy and move between market segments, this segmentation is only approximate and based on
3 Whytcross, D. (2014). Motor Vehicle Dealers in Australia. IBISWorld Industry Report G3911. I BISWorld.

10
currently available data. Table 3.1 shows a sample breakdown of our most recently available data.
Table 3.1: Market segmentation of brands, sample
Volume Prestige LuxuryFord Alfa Romeo AudiHolden Chrysler BMWHyundai Citroen JaguarKia Dodge Land RoverMitsubishi Fiat Mercedes-BenzNissan Honda VolvoSource: Deloitte Motor Industry Services data (2014)
3.2.2 Volume
Volume brands, in addition to the segmentation criteria, generally can be described as brands which are priced at a lower price range and occupy the majority of the market. Some notable volume brands operating in Australia include Toyota, Ford and Holden. In2013, in total there were 721,616 new volume brand vehicles sold, an increase of 4,888from 2012. Most of the gross profit of volume dealerships comes from new cars (28.8 per cent) and service (27.1 per cent). For a more detailed discussion of the dealership business model see subsection 3.4.1.
Table 3.2: Departmental contribution to gross profit, Volume (2012-13)
Department Contribution to gross profit (%)
New 28.8
Used 13.5
Parts 12.3
Service 27.1
Finance and insurance 18.3
Source: Deloitte Motor Industry Services data (2014)
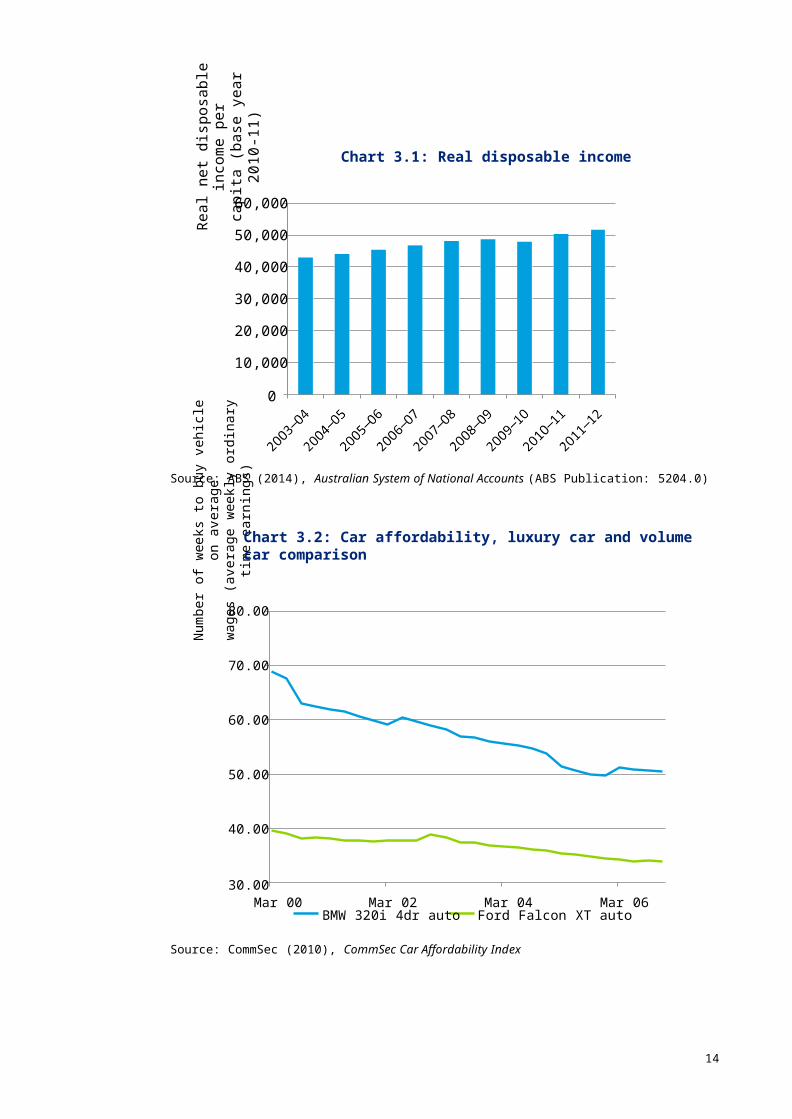
Over the past 10 years, there has been a decline in demand for Volume cars; this is likely a result of an increase in income per capita (see Chart 3.1) and a decrease in prices of prestige and luxury cars relative to volume cars (see Chart 3.2) leading to consumers being able to afford more expensive cars.

Num
ber o
f wee
ks to
buy
veh
icle
on
aver
age
wag
es (a
vera
ge w
eekl
y or
dina
ry ti
me
earn
ings
)Re
al n
et d
ispo
sabl
e in
com
e pe
rca
pita
(bas
e ye
ar 2
010-
11)
11
Chart 3.1: Real disposable income
60,000
50,000
40,000
30,000
20,000
10,000
0
Source: ABS (2014), Australian System of National Accounts (ABS Publication: 5204.0)
Chart 3.2: Car affordability, luxury car and volume car comparison
80.00
70.00
60.00
50.00
40.00
30.00Mar 00 Mar 02 Mar 04 Mar 06
BMW 320i 4dr auto Ford Falcon XT auto
Source: CommSec (2010), CommSec Car Affordability Index
12
3.2.3 Prestige
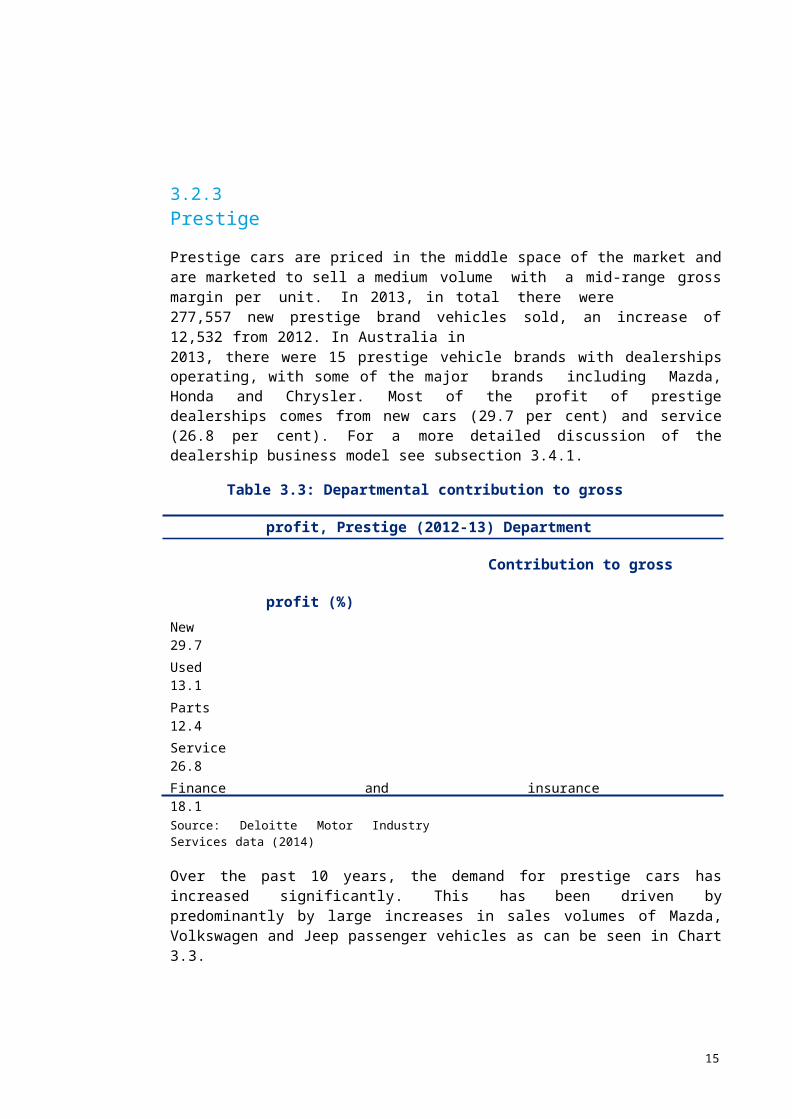
Prestige cars are priced in the middle space of the market and are marketed to sell a medium volume with a mid-range gross margin per unit. In 2013, in total there were277,557 new prestige brand vehicles sold, an increase of 12,532 from 2012. In Australia in2013, there were 15 prestige vehicle brands with dealerships operating, with some of the major brands including Mazda, Honda and Chrysler. Most of the profit of prestige dealerships comes from new cars (29.7 per cent) and service (26.8 per cent). For a more detailed discussion of the dealership business model see subsection 3.4.1.
Table 3.3: Departmental contribution to gross profit, Prestige (2012-13)
Department Contribution to gross profit (%)New 29.7Used 13.1Parts 12.4Service 26.8Finance and insurance 18.1Source: Deloitte Motor Industry Services data (2014)
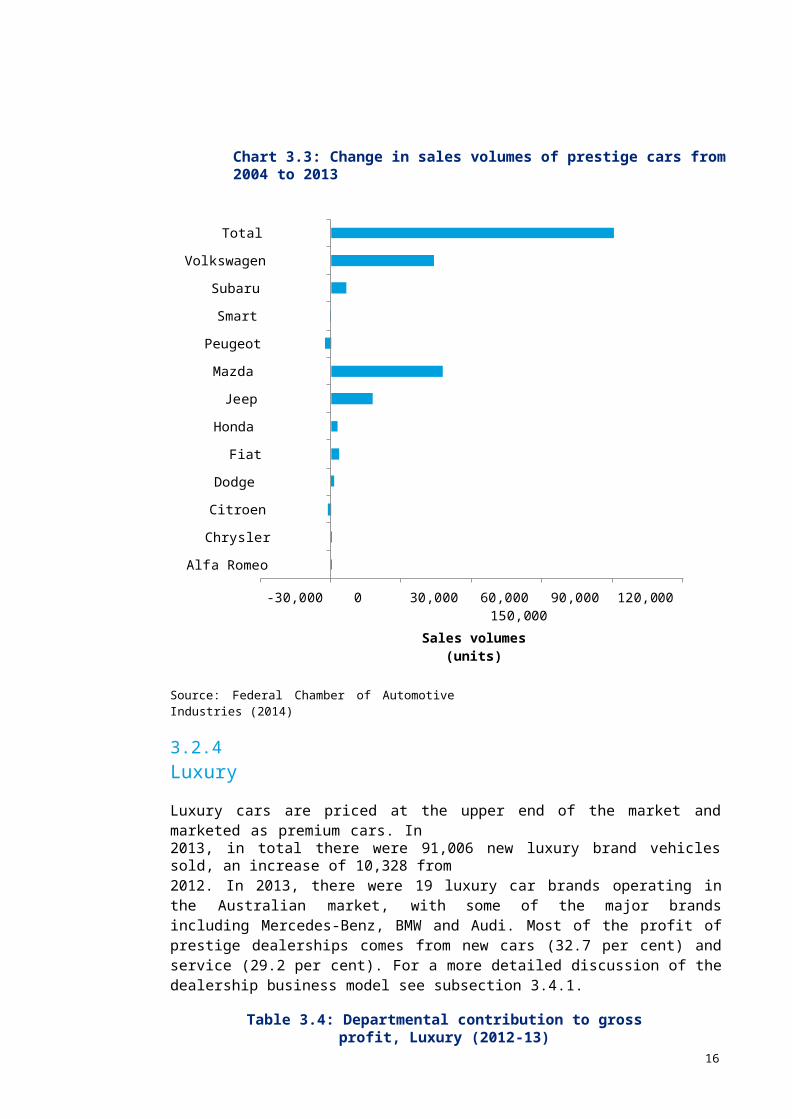
Over the past 10 years, the demand for prestige cars has increased significantly. This has been driven by predominantly by large increases in sales volumes of Mazda, Volkswagen and Jeep passenger vehicles as can be seen in Chart 3.3.
13
Chart 3.3: Change in sales volumes of prestige cars from 2004 to 2013
Total
Volkswagen
Subaru
Smart
Peugeot
Mazda
Jeep
Honda
Fiat
Dodge
Citroen
Chrysler
Alfa Romeo
-30,000 0 30,000 60,000 90,000 120,000 150,000Sales volumes (units)
Source: Federal Chamber of Automotive Industries (2014)
3.2.4 Luxury
Luxury cars are priced at the upper end of the market and marketed as premium cars. In2013, in total there were 91,006 new luxury brand vehicles sold, an increase of 10,328 from2012. In 2013, there were 19 luxury car brands operating in the Australian market, with some of the major brands including Mercedes-Benz, BMW and Audi. Most of the profit of prestige dealerships comes from new cars (32.7 per cent) and service (29.2 per cent). For a more detailed discussion of the dealership business model see subsection 3.4.1.
Table 3.4: Departmental contribution to gross profit, Luxury (2012-13)
Department Contribution to gross profit (%)New 32.7Used 10.1Parts 14.3Service 29.2F&I 13.7Source: Deloitte Motor Industry Services data (2014)

Sale
s vol
umes
(uni
ts)
14
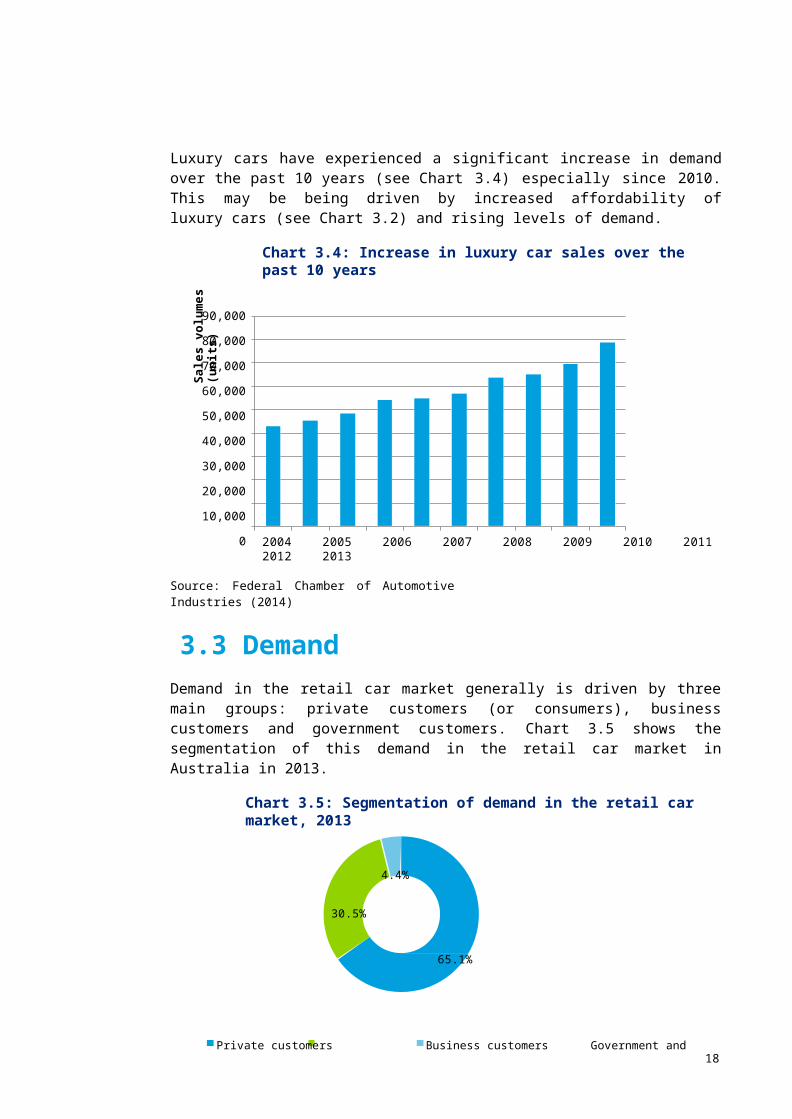
Luxury cars have experienced a significant increase in demand over the past 10 years (see Chart 3.4) especially since 2010. This may be being driven by increased affordability of luxury cars (see Chart 3.2) and rising levels of demand.
Chart 3.4: Increase in luxury car sales over the past 10 years
90,000
80,000
70,000
60,000
50,000
40,000
30,000
20,000
10,000
02004 2005 2006 2007 2008 2009 2010 2011 2012 2013
Source: Federal Chamber of Automotive Industries (2014)
3.3 DemandDemand in the retail car market generally is driven by three main groups: private customers (or consumers), business customers and government customers. Chart 3.5 shows the segmentation of this demand in the retail car market in Australia in 2013.
Chart 3.5: Segmentation of demand in the retail car market, 2013
4.4%
30.5%
65.1%
Private customers Business customers Government and other customers
Source: Whytcross, D. (2014). Motor Vehicle Dealers in Australia. IBISWorld Industry Report G3911. IBISWorld.

6 Ibid.
15
3.3.2 Buyers
Private customers
Private customer spending accounts for more than 65 per cent of revenue in the retail car market4. Generally speaking, the core reason private customers purchase cars is to satisfy a transport need, however, the decision to buy a specific car is driven by a number of factors including disposable income, price, personal preference, brand loyalty and social norms. Once a private customer has made the decision to purchase a vehicle, they will often set a mental budget and aim to get the ‘best’ possible car for this price. This practice is likely a contributing factor in the rise of prestige and luxury cars in the past 10 years – as Australian consumers’ disposable incomes have increased and car prices decreased, instead of purchasing the same cars at a lower price, consumers have sought a higher quality car.
Within the group of private customers, there are several subgroups who behave distinctly differently from each other. Those aged 25 years and younger5, are typically buyers of‘volume’ vehicles as they have a high need for transport and a limited capacity to pay. Families and couples tend to purchase multiple vehicles as they generally have higher disposable income and a need for flexible transport.
The decision to buy a car is essentially an economic one, in which a consumer evaluates their need for the benefit of private transport and weighs this up against the cost of purchasing and maintaining a vehicle. Once the decision to buy a car is made, a subsequent choice is made between a new or used vehicle. This choice is generally guided by financial constraints as although most consumers would prefer to purchase a new vehicle, if they cannot afford to do so, they will purchase a used vehicle.
Businesses
Spending by businesses on cars contributes more than 30 per cent of the revenue6 to the retail car market. Businesses generally buy cars for specific purposes. The types of vehicles vary widely and can include passenger vehicles and commercial vehicles. Business demand for passenger vehicles is generally limited to the volume and prestige vehicles as luxury cars are not economical for businesses. Important drivers of business demand for cars include: Government taxes and incentives Business confidence Economic growth.Government incentives to businesses proved to be a strong driver of business demand for cars in the aftermath of the GFC as businesses could claim up to 50 per cent of the cost back in tax deductions.
4 Whytcross, D. (2014). Motor Vehicle Dealers in Australia. IBISWorld Industry Report G3911. IBISWorld.5 Ibid.

7 Ibid.
16
Government
Spending from government in the retail car market is relatively small (4.4 per cent of total revenue)7, however, government still has a significant role as a buyer in the market as it has the ability to make large purchases of a single model of car. These large purchases are often guided by government strategic direction and policy and in Australia have historically been directed by policy issues such as support for the Australian car manufacturing industry and/or environmental considerations.
3.3.3 Price elasticity of demand
The price elasticity of demand plays an important role in the retail car market. Price elasticity, or the sensitivity of demand to price changes, describes how consumers behave when there is a price change in a good. High price elasticity means that consumers are highly reactive to price changes and that a small change in the price (whether upwards or downwards) will result in a proportionally larger change in how much of that good is demanded by consumers. Low price elasticity means that consumers are not very reactive to changes in price and a change in the price of a good will result in a proportionally smaller change in consumer demand for the good. The price elasticity of demand generally depends on several factors including: Availability of substitutes – goods that are easily substituted by other goods generally
have a higher price elasticity of demand Proportion of income – consumers are generally less responsive to price changes in
goods that only require a low proportion of income, and more responsive to price changes in goods that require a high proportion of income.
Necessity – the more reliant a consumer is on a certain good, the less responsive the consumer will be to changes in price of that good.
Brand loyalty – customers who are loyal to a particular brand will be less likely to respond to price incentives, so the higher the brand loyalty is for a particular good the lower the price elasticity of demand is for that good.
Demand in the retail car market is generally elastic as there are a wide range of almost identical substitutes and the cost of a car represents a large proportion of an average income.
3.4 Supply3.4.1 The business model
The retail car market in Australia is dominated by the dealership business model. Under this model, independent car dealers purchase franchise rights from motor vehicle manufacturers or local importer companies that allow the dealers to: Use the manufacturers’ branding Sell the manufacturers’ cars Employ authorised service staff.
17
As part of the franchise agreement, dealers have to pay a franchise fee of up to $2 million8
(for larger dealerships) and have a range of obligations including: Meet sales targets Satisfy performance measures Maintain high working capital.
Retail car dealers operate on very thin margins: the average Australian dealer achieved a net profit of 1.9 per cent over the 20139 calendar year.
In section 3.2, it was noted that for volume, prestige and luxury car dealers, new car sales and service were the most profitable departments. However, after accounting for overhead expenses, this pattern changes. Chart 3.6 shows a breakdown of an average dealer’s 2013 profit after overhead costs have been allocated to each department on the basis of gross contribution. From this we can see that dealers can maximise profit by focusing on “Other Income” and “Finance and Insurance”. Other Income largely relates to factory incentives that are not directly attributed to a vehicle model. These can be associated with the overall dealership performance as well maintaining brand standards. Note, Chart 3.6 shows that after allocating overhead expenses, new vehicle and used vehicles sales actually make a loss and a negative contribution to net profit.
Chart 3.6 Contribution of departments to total net profit
100%
80%
60%
40%
20%
0%
-20%
-40%
-60%
-80%
New Vehicles
Used Vehicles
Parts
Service
F&I
Other Income
* Overhead expenses allocated using departmental contribution to total gross profit
Source: Deloitte Motor Industry Services data (2013)
The dealership business is fundamentally based on the sale of new vehicles but, as Chart3.6 depicts, this area of the business typically generates little to no profit for the business. However, by generating sales volumes, dealers create opportunities to build customer relationships which result in a future stream of revenue. Such revenue includes adding and installing aftermarket accessories10 on the new vehicle sale, dealership finance and
8 Whytcross, D. (2014). Motor Vehicle Dealers in Australia. IBISWorld Industry Report G3911. IBISWorld.9 Based on the 800 dealers across Australia that report to Deloitte ProfitFocus system, the average dealer achieved a net profit of 1.9 per cent.10 Aftermarket refers to additional services such as extended warranty and accessories refer to additional features such as tinted windows.
insurance (F&I), and servicing the customer’s vehicle throughout the life of the car. This stream of revenue is completed when the car is traded in for another new vehicle.
The profit structure described above is driven by a whole-of-industry dynamic. The ultimate goal of a manufacturer is to wholesale a vehicle to every member of their target market. As these target markets become less targeted and more volume driven (in the pursuit of greater profits) dealers are expected to take these additional vehicles and find customers for them. As a result of these greater volumes the industry has been experiencing a supply push market for the last couple of years.
As a way of aligning dealers with the manufacturers’ overall business strategy the manufacturers create incentives programmes. These targets are generally set at three levels. The first promotes volume and depending on the strategy of a franchise they may choose to reward based on vehicles sold or registered, share of PMA, sales only with in the PMA or wholesale take up. The second layer of incentives generally addresses customer satisfaction and relates to both front end and aftersales customers (i.e. new car buyers and service customers). Finally, the third layer of incentives is in place to ensure brand standards, corporate identity and overall business management is on par with franchise requirements.
There are a large number of ways that these incentives are implemented and measured. In particular the first layer of incentives, which encourages the sale of vehicles, is applied by each brand for each dealership several ways. In the recent years with the supply push market, a trend has emerged in the retail car market which is commonly known as “the gamification of the industry”. With the aim of first driving new car volumes and then, later, addressing stock concerns, the franchises have changed the way dealerships earn profits at the retail level by introducing complex bonus and incentives programmes. The profit outcomes of these programmes for dealers are often unpredictable. Manufacturers are now awarding monthly, quarterly and annual bonuses for achievement of targets.
Multi-franchise dealers (over 90 per cent of the dealers in Australia) need to invest significant amounts of time and effort to maintain a current understanding of all the programs in place across all their brands as programmes change on a monthly basis. In addition to understanding the available incentive programs, dealers need to calculate the most profitable path for their dealership to take through overlapping, and sometimes conflicting, incentives. However, there are benefits to be had for those who can successfully work through the programs on offer and choose the ones most likely to pay off for their dealership. Dealers who do successfully play the variable margin game fare much better than those who either do not or cannot.
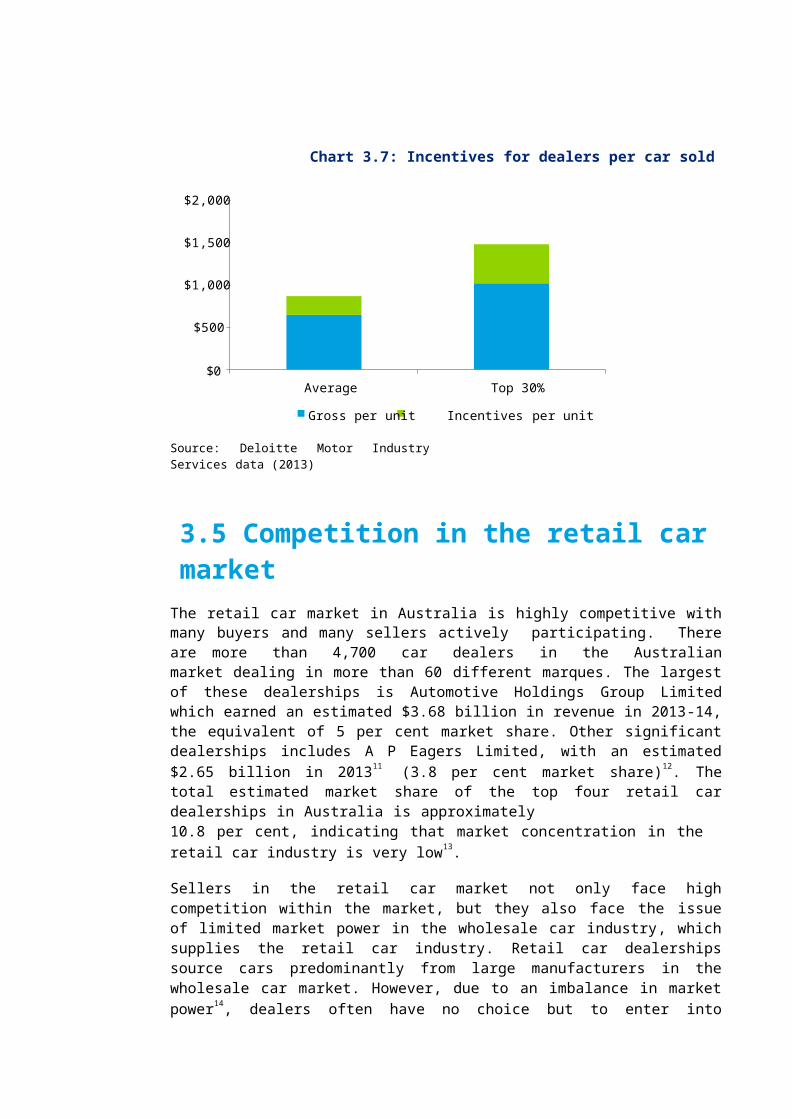
The average dealer in Australia during 2013 received around $220 worth of incentives for each new vehicle they sold. However, the top 30 per cent of dealers – those who played the incentive game well – received more than double that at $460 per unit.

Chart 3.7: Incentives for dealers per car sold
$2,000
$1,500
$1,000
$500
$0Average Top 30%
Gross per unit Incentives per unit
Source: Deloitte Motor Industry Services data (2013)
3.5 Competition in the retail car marketThe retail car market in Australia is highly competitive with many buyers and many sellers actively participating. There are more than 4,700 car dealers in the Australian market dealing in more than 60 different marques. The largest of these dealerships is Automotive Holdings Group Limited which earned an estimated $3.68 billion in revenue in 2013-14, the equivalent of 5 per cent market share. Other significant dealerships includes A P Eagers Limited, with an estimated $2.65 billion in 201311 (3.8 per cent market share)12. The total estimated market share of the top four retail car dealerships in Australia is approximately10.8 per cent, indicating that market concentration in the retail car industry is very low13.
Sellers in the retail car market not only face high competition within the market, but they also face the issue of limited market power in the wholesale car industry, which supplies the retail car industry. Retail car dealerships source cars predominantly from large manufacturers in the wholesale car market. However, due to an imbalance in market power14, dealers often have no choice but to enter into franchise agreements which tend to favour the manufacturer.
11 Year end for A P Eagers Limited is in December.12 Whytcross, D. (2014). Motor Vehicle Dealers in Australia. IBISWorld Industry Report G3911. IBISWorld.13 According to the Australian Competition and Consumer Merger Guidelines 2008, an industry is considered to be concentrated if the Herfindal-Hirschman Index (HHI) value of the industry is greater than 2000. Using the above market shares to calculate HHI for the retail car market gives a maximum score of approximately 100, well below the level that would be considered concentrated.14 The combined market share of the top 4 manufacturers is approximately 39 per cent, nearly four times larger

than the combined market share of the top 4 dealers, which is approximately 10.8 per cent. Whytcross, D. (2014). Motor Vehicle Wholesaling in Australia. IBISWorld Industry Report F3501. IBISWorld.
Competition in an international context
When put in an international context, Australia’s high level of competition in the retail car market becomes more apparent. The number of brands and market share of each of these brands of car are good indicators of the level of competition in a market. Table 3.5 presents a comparison of these indicators in Australia, Canada, the UK and the USA – Australia has both a higher number of brands (67) and a lower market size per brand (16,597 unit sales per brand) than each of these other markets, both indicators suggesting that Australia is highly competitive.
Table 3.5: Competitiveness of global car markets, 2013
Australia Canada UK USANumber of brands in Australia 67 49 53 51Sales (car units) 1,112,032 1,620,221 2,249,483 13,040,632Market size per brand (car units) 16,597 33,066 42,443 255,699Source: Department of Industry, Innovation, Climate Change, Science, Research and Tertiary Education (2013),March 2013 Automotive update
3.6 Information and regulationThe Australian retail car market is a well-developed market with many consumer protections that have been integrated through industry self-regulation and government regulation. High levels of competition in the retail car market have made self-regulation possible as car dealers and manufacturers (who supply the dealers) place a high value on the ‘brand’ of their business and will go to lengths to maintain this.
3.6.1 Information asymmetries
In the retail car industry where such a complex product is being sold, there is a natural risk of information asymmetry. Information asymmetry is defined as the imbalance of information between a buyer and a seller of a particular good, which leads to an economic advantage for either the buyer or seller. An example of this would be if a car dealer was selling a car to a customer and the dealer falsely informed the customer that the particular car was very popular and had high resale value – if the customer had no access to genuine information regarding the popularity and resale information of the car, they may believe the dealer and be willing to pay a higher price than they would if they knew the truth. Cars are generally complex products and often consumers are unable to understand or compare competing claims.
In the Australian retail car market there are numerous consumer protections in place to alleviate problems of information asymmetry. This is especially important for the used car market. As new cars tend to have extensive documentation on specifications produced by car manufacturers, it is possible for customers to research the car that they are interested in buying rebalancing the information asymmetry. Third part sources such as newspapers, magazines and speciality car sales websites publish information and often compare competing vehicles. The quality of a used car, however, is affected by many factors that only the previous owner knows of – as such there is much regulation in place that protects
consumers from issues of information asymmetries when purchasing used cars. An
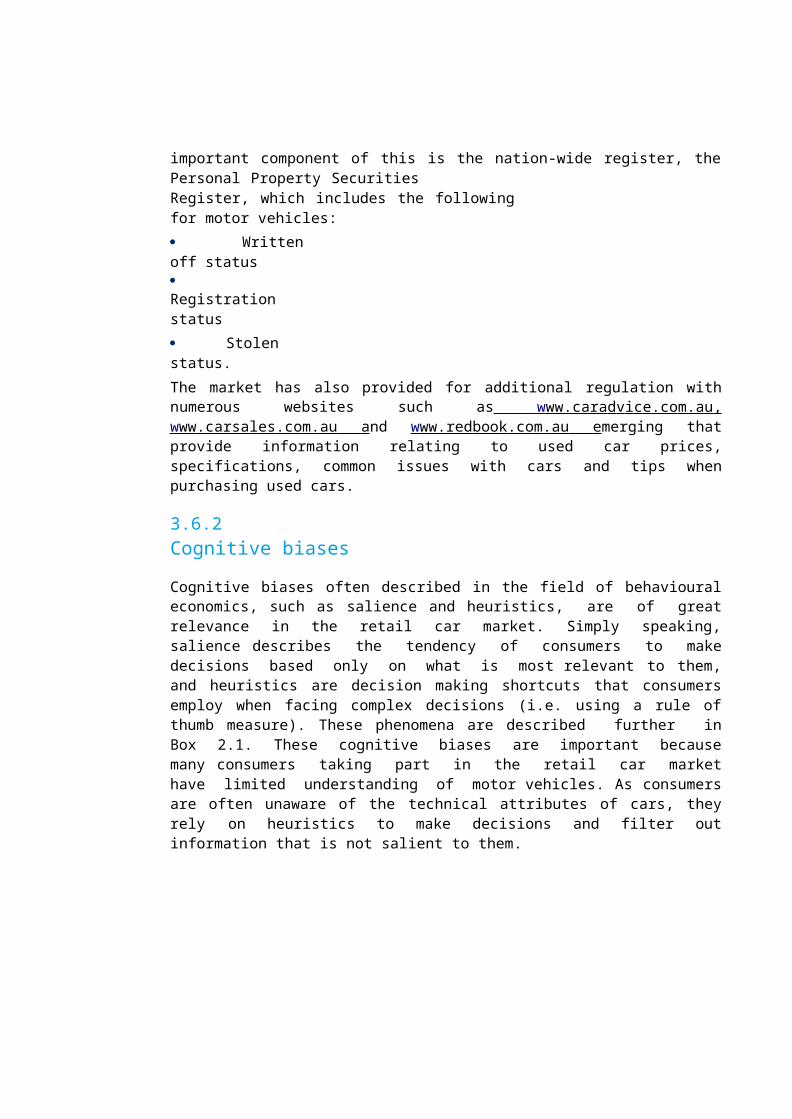
important component of this is the nation-wide register, the Personal Property SecuritiesRegister, which includes the following for motor vehicles: Written off status Registration status Stolen status.The market has also provided for additional regulation with numerous websites such as w w w . c ara d v i c e . c o m . a u , w w w . c arsa l e s . c o m . au and w w w . red boo k . c o m . au emerging that provide information relating to used car prices, specifications, common issues with cars and tips when purchasing used cars.
3.6.2 Cognitive biases
Cognitive biases often described in the field of behavioural economics, such as salience and heuristics, are of great relevance in the retail car market. Simply speaking, salience describes the tendency of consumers to make decisions based only on what is most relevant to them, and heuristics are decision making shortcuts that consumers employ when facing complex decisions (i.e. using a rule of thumb measure). These phenomena are described further in Box 2.1. These cognitive biases are important because many consumers taking part in the retail car market have limited understanding of motor vehicles. As consumers are often unaware of the technical attributes of cars, they rely on heuristics to make decisions and filter out information that is not salient to them.

Box 2.1 Salience and Heuristics
Salience
The concept of salience explains the cognitive bias that occurs where people filter out complex information and only consider information that is relevant to them. Examples of this effect can include the bias where the size of government expenditure on benefits of particular government reform are much more understandable to consumers or taxpayers if they are expressed in amount per capita rather than as the overall amount. Other examples may include the tendency for consumers to filter out trailing digits of numbers. This has been found in the United States where consumers purchasing used cars tend to overemphasise the increase in mileage where the first few digits change and overlook increases in mileage where the trailing digits change. This was shown where the valuation of a used car was not greatly different between a car with a mileage of 49,000 mi and49,500 mi but the valuation would suddenly drop if the mileage of a car increased from49,500 mi to 50,000 mi.
Heuristics
Consumers display another type of cognitive bias where, in order to make sense of complicated information, consumers may rely on rules-of-thumb or maintain consumer brands/products with which they are most familiar. Using rules-of-thumb and familiarity as a basis for choice can closely approximate the optimal choice process assumed in the consumer theory of economics. Some examples of heuristics include: deciding that a particular brand of cars is more reliable than other brand because it is more popular, deciding that a luxury car has higher specifications than a non-luxury car, or deciding that a person is more believable and/or trustworthy because they have the title of Doctor.
It is important to note that using heuristics to make decisions is not necessarily wrong, however, in some cases consumers may not be choosing or deciding what they think they are.
Source: Busse and Lacetera et al. (2013), Estimating the effect of Salience in Wholesale and Retail Car Markets; Office of Best Practice Regulation (2012)
3.7 Key trends in the retail car marketTo gain a better understanding of the retail car market, it is important to look at key trends and changes that have been occurring over time. This is important as it can give insight into how the retail car market has reacted to changes in the past and, hence where it may be headed in the future.
Key overview statistics
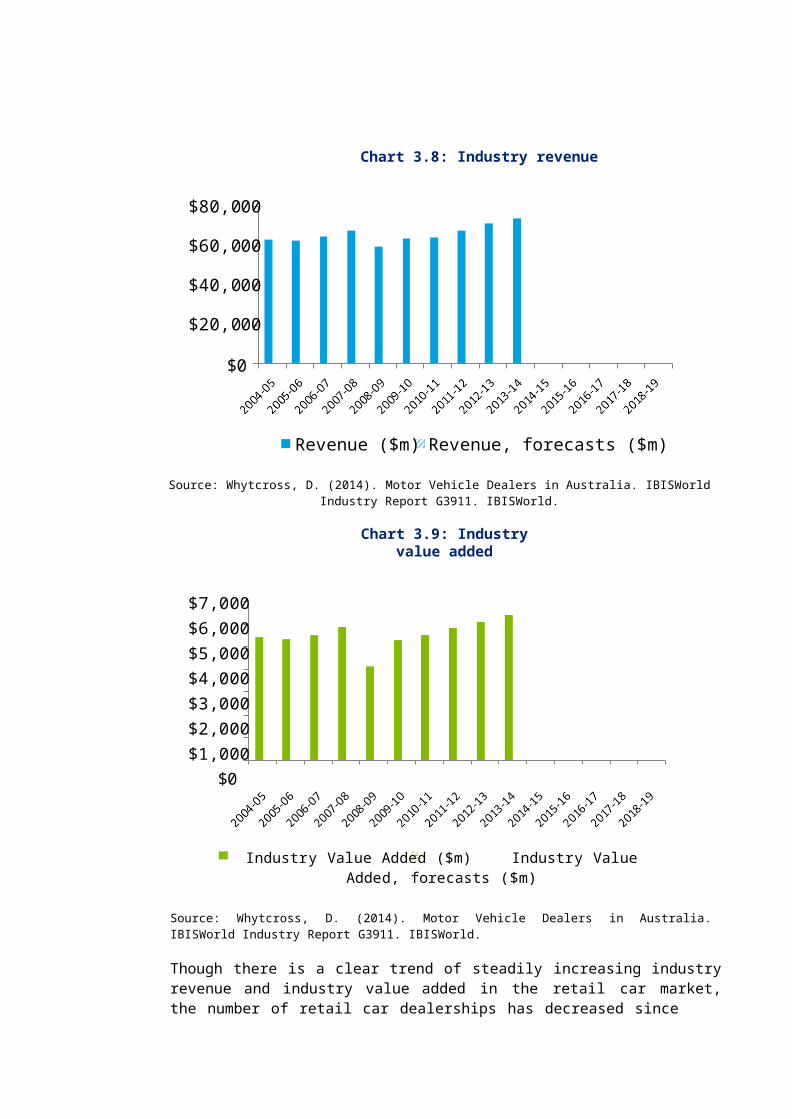
The retail car market has experienced overall growth over the past 10 years as evidenced by steadily increasing industry revenue and industry value added (see Chart 3.8 and Chart3.9). During the global financial crisis in 2008-09 industry revenue and industry value added experienced a dip, most likely as a result of consumers delaying large expenses. Forecasts for the next five years are predicting stable growth with minor increases in both industry
revenue ($0.3m increase) and industry value added ($0.1m increase).

Chart 3.8: Industry revenue
$80,000
$60,000
$40,000
$20,000
$0
Revenue ($m) Revenue, forecasts ($m)
Source: Whytcross, D. (2014). Motor Vehicle Dealers in Australia. IBISWorld Industry Report G3911. IBISWorld.
Chart 3.9: Industry value added
$7,000$6,000$5,000$4,000$3,000$2,000$1,000
$0
Industry Value Added ($m) Industry Value Added, forecasts ($m)
Source: Whytcross, D. (2014). Motor Vehicle Dealers in Australia. IBISWorld Industry Report G3911. IBISWorld.
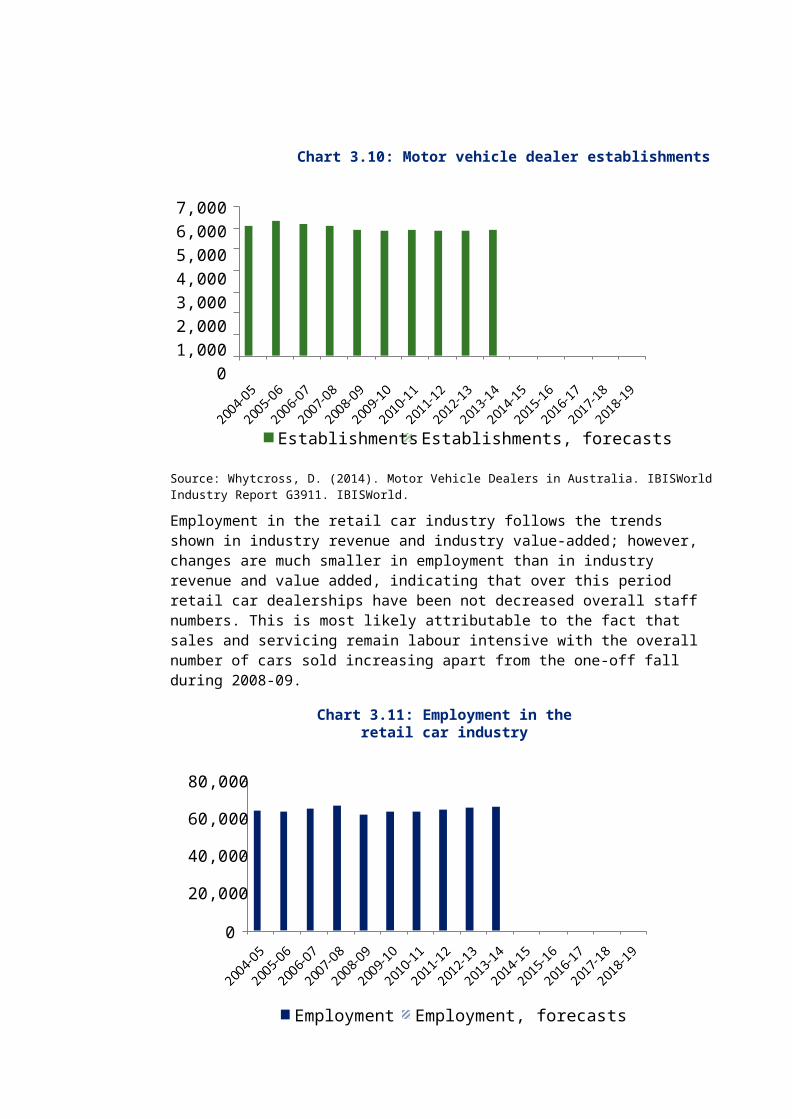
Though there is a clear trend of steadily increasing industry revenue and industry value added in the retail car market, the number of retail car dealerships has decreased since2004-05. After peaking in 2005-06, the number of car dealerships has decreased from 6,342 to 5,915. The beginning of the decrease in the number of retail car dealerships preceded the global financial crisis but was likely exacerbated by it. As industry revenue and value added have increased above pre-GFC levels, it is likely that, as retail car dealerships have found new sources of revenue and profit, the equilibrium number of car dealerships has changed.

Chart 3.10: Motor vehicle dealer establishments
7,0006,0005,0004,0003,0002,0001,000
0
Establishments Establishments, forecasts
Source: Whytcross, D. (2014). Motor Vehicle Dealers in Australia. IBISWorld Industry Report G3911. IBISWorld.
Employment in the retail car industry follows the trends shown in industry revenue and industry value-added; however, changes are much smaller in employment than in industry revenue and value added, indicating that over this period retail car dealerships have been not decreased overall staff numbers. This is most likely attributable to the fact that sales and servicing remain labour intensive with the overall number of cars sold increasing apart from the one-off fall during 2008-09.
Chart 3.11: Employment in the retail car industry
80,000
60,000
40,000
20,000
0
Employment Employment, forecasts
Source: Whytcross, D. (2014). Motor Vehicle Dealers in Australia. IBISWorld Industry Report G3911. IBISWorld.
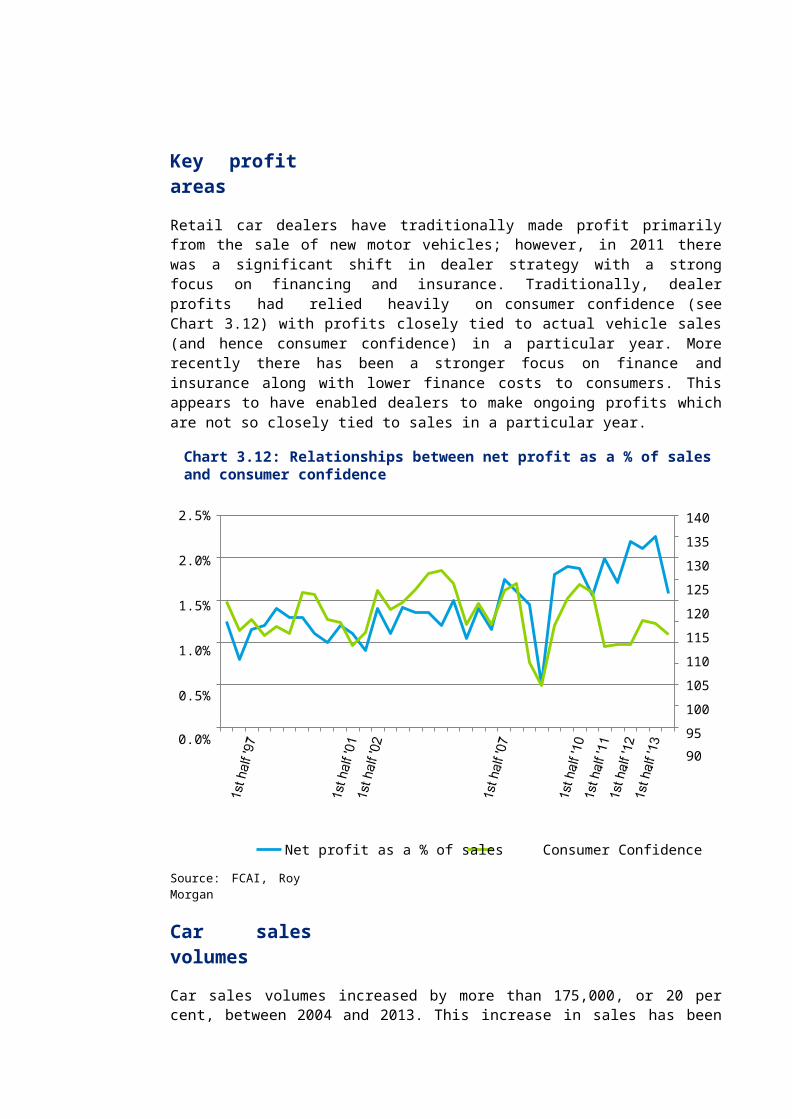
Key profit areas
Retail car dealers have traditionally made profit primarily from the sale of new motor vehicles; however, in 2011 there was a significant shift in dealer strategy with a strong focus on financing and insurance. Traditionally, dealer profits had relied heavily on consumer confidence (see Chart 3.12) with profits closely tied to actual vehicle sales (and hence consumer confidence) in a particular year. More recently there has been a stronger focus on finance and insurance along with lower finance costs to consumers. This appears to have enabled dealers to make ongoing profits which are not so closely tied to sales in a particular year.
Chart 3.12: Relationships between net profit as a % of sales and consumer confidence
2.5%
2.0%
1.5%
1.0%
0.5%
0.0%
1401351301251201151101051009590
Net profit as a % of sales Consumer Confidence
Source: FCAI, Roy Morgan
Car sales volumes
Car sales volumes increased by more than 175,000, or 20 per cent, between 2004 and 2013. This increase in sales has been predominantly driven by increases in sales of prestige cars (68 per cent of the increase) and luxury cars (23 per cent of the increase). The increase in car sales volumes is likely an indication of the increasing affordability of cars, especially luxury and prestige cars – this is discussed further in the following section. For more detailed breakdowns of sales unit volumes see Appendix A.
Mot
or V
ehic
le C
PI
Source: FCAI
Affordability
Chart 3.13: Unit sales volumes by market segment
Australia has experienced a significant increase in the relative affordability of cars over the past decade. There are a range of factors behind this increase including the appreciation of the Australian dollar reducing the costs of imported vehicles, increased competition in the local retail car market pushing down prices and a steady increase in the disposable income of the average Australian. Chart 3.14 shows the decrease in motor vehicle prices as measured by the consumer price index. The consumer price index (CPI) is the primary measure of inflation (or overall increase in nominal prices over time) and is made up of many smaller indices which measure specific types of goods and services. The motor vehicle CPI sub-index acts as a good measure of the general increase in prices of commonly purchased vehicles.
Chart 3.14: Decrease in motor vehicle prices, 2003-2013
115
110
105
100
95
90
85
Source: ABS CPI

In addition to looking at the motor vehicle CPI, it useful to examine the specific price decreases in individual car models. Table 3.6 shows the change in prices of nine common passenger cars from June 2003 to June 2013. Four of these nine models of cars have experienced nominal price decreases over the 10 year period and on average there is a 0.5 per cent decrease in prices of these cars. Accounting for inflation15 over this period, a decrease in prices becomes apparent across the board – all models have experienced an average 23.9 per cent decrease in price over 10 years, whilst vehicle quality, safety and features have all improved.
Table 3.6: New car prices over past decade
June 2003 June 2013 Nominal change
Real change
(%) (%)Ford Falcon, auto $34,660 $37,235 7.4 -17.9Holden Commodore, Acclaim/Omega auto $37,510 $39,990 6.6 -18.5Toyota Corolla conquest/Ascent 1.8 $21,840 $22,990 5.3 -19.5Mitsubishi Lancer GLXi/ES 2L manual $20,990 $19,990 -4.8 -27.2Audi TT 2.0L Coupe $74,100 $75,050 1.3 -22.6BMW 320i 2L auto $65,500 $58,600 -10.5 -31.6Mercedes E240 Classic/E220 Elegance $89,900 $84,800 -5.7 -27.9Lexus IS200/IS250 $53,490 $55,800 4.3 -20.3Porsche Carrera 911 manual $225,300 $206,500 -8.3 -29.9Consumer Price Index 78.6 102.8 30.8 N/ASource: Commsec Car Affordability Index (2013)
It is important to note that this decrease in prices is likely a result of both increased competition between different car manufacturers and the increase in value of the Australian dollar from 2003 to 2013. Chart 3.15 shows the trade weighted index, an overall measure of the value of the Australian dollar, from 2003 to 2013. Except for a drop in the value of the currency in 2008-09, the Australian dollar has steadily risen in value increasing approximately 15 points. This increase in the value of the Australian dollar makes imports of cars from other countries into Australia cheaper over time.
15 Inflation here is measured by CPI. The CPI differs from the motor vehicle CPI, which is a subindex

and component of the more general CPI.
Trad
e W
eigh
ted
Inde
xRe
al n
et d
ispo
sabl
e in
com
e pe
r cap
ita
Chart 3.15: Change in the Trade Weighted Index, 2003-2013
90.080.070.060.050.040.030.020.010.0
0.0
Source: Reserve Bank of Australia (2014)
In addition to the decrease in prices of cars in Australia, over the past decade disposable incomes have risen significantly. Chart 3.16 shows that an average Australian’s disposable income16 has increased $8,741 in real terms over the period 2003-04 to 2011-12. This increase equates to a 20 per cent increase in disposable income – allowing Australians’ discretionary spending to significantly increase.
Chart 3.16: Rise in disposable incomes, 2003-04 to 2011-12
60,000
50,000
40,000
30,000
20,000
10,000
02003–04 2004–05 2005–06 2006–07 2007–08 2008–09 2009–10 2010–11 2011–12
Source: ABS (2014), Australian System of National Accounts (ABS Publication: 5204.0)
Ownership
Australia has traditionally had a very high level of car ownership. There are a range of reasons for this including geography and climate, low population density, the focus on suburban development in town planning and a strong cultural affinity with cars. Ownership of cars in Australia largely increased in the post-World War II era from 234 cars per 1,000

16 Measured by real net disposable income per capita.
29
Cars
per
1,0
00 p
opul
atio
n
population in 1955 to its current high levels of 756 cars per 1,000 population in 2014 (see Chart 3.17). Australia has a very high level of car ownership by global standards and in 2011 had the ninth highest level of car ownership globally17. It is likely that car ownership will continue to increase in Australia as the number of new cars purchased every year continues to increase.
Chart 3.17: Car ownership in Australia, 1955 to 2014
800
700
600
500
400
300
200
100
0
Source: ABS Motor Vehicle Census
Age of fleet
The Australian car fleet has traditionally been a relatively old fleet with no specific regulations limiting the age of vehicles, however, in recent years the age of the Australian fleet has decreased to a relatively low level compared to other markets such as the US, Canada and New Zealand. This trend of decreasing age of motor vehicles is likely to have productivity benefits and decreased maintenance costs of the fleet. Additionally, as the Australian car fleet is being renewed more quickly, the transmission of new technologies (for example to improve environmental and safety outcomes) will be achieved at a much faster rate.
17 World Bank World Development Indicators
30
Chart 3.18: Average age of Australian Car Fleet, 1996 to 2013
10.8
10.6
10.4
10.2
10
9.8
9.6
9.41996 1997 1998 1999 2000 2001 2002 2003 2004 2005 2006 2007 2008 2009 2010 2011 2012 2013
Source: ABS Motor Vehicle Census
4 Policy driver and regulatoryanalysis
This chapter provides context for regulation in the retail car market and analyses the key policy rationale driving potential changes to import restrictions of used cars.
4.1 Legal and regulatory frameworkStandards in the Australian retail car market are primarily regulated by the following pieces of legislation and regulation: Motor Vehicle Standards Act 1989 (MVSA) Motor Vehicle Standards Regulations 1989 (MVSR) Australian Design Rules (ADRs) Registered Automotive Workshop Scheme (RAWS) Competition and Consumer Act 2010.
Other important pieces of legislation for the retail car market are related to the regulation of car dealership businesses and consumer protection. These include: Motor Dealers Act 1974 (NSW) Motor Vehicle Dealers Act 1973 (WA) Motor Car Traders Act 1986 (VIC) Property Agents and Motor Dealers Regulation 2001 (QLD) Motor Vehicle Regulations 1996 (SA) Second-Hand Vehicle Dealers Act 1995 (SA) Motor Vehicle (Accident Towing Roster Scheme) Regulations 2001 (SA) Consumer Affairs and Fair Trading Act (NT) Australian Consumer Law (Cwth).
Motor Vehicle Standards Act 1989 and Motor Vehicle StandardsRegulations 1989
The MVSA is the broad legislative framework which governs standards of motor vehicles sold in Australia. The objects of this legislation include achieving uniform vehicle standards for new vehicles in Australia and regulating the ‘first supply to the market of used imported vehicles’. One of the key drivers in the initial development of the MVSA was evidence that demonstrated imported used cars offered lower levels of safety than cars that had been built to comply with the ADRs. The MVSA also has the benefit of removing the need for multiple vehicle inspection, certification schemes and approval regimes across different jurisdictions in Australia.

One of the major concerns that the Government had at the time of the drafting of the MVSA was that large scale importation of used motor vehicles would have negative safety implications for the Australian car fleet. To this end the Government noted that the MVSA would ‘enable the Federal Government to establish and apply nationally uniform standards for motor vehicle safety and environmental equality as expected by the community.18
The mechanism through which the importation of used vehicles is restricted is set out in sections 13, 16, 17, 18, 19 and 20 of the MVSA19. Though the MVSA restricts the large scale importation of used vehicles, there is allowance made for the importation of specialty and/or personal vehicles. Importation of specialty vehicles is carried out through a Registered Automotive Workshop (RAW).
The MVSR20 is guided by the intent of the MVSA and is the instrument through which the Government sets up detailed provision for both import restrictions of used cars and concessions for particular vehicles. Some specific regulations included in the MVSR include: Provision for a register of specialist and enthusiast vehicles Provision for a review panel to govern the specialist and enthusiast vehicle register Rules around the import of used vehicles for personal vehicles Rules around the import of used vehicles for specialty vehicles Rules around the import of used vehicles of a certain age Application criteria to become a RAW21.
Australian Design Rules
The ADRs are rules which set out national standards for vehicle safety, anti-theft and emissions. The ADRs set performance based standards for vehicles including occupant safety, structures, lighting, noise, emissions and braking. After having gone through several review processes and jurisdictional changes, the ADRs are currently in the third edition. The first edition of the ADRs was developed as a discussion paper and was not legally binding in any Australian jurisdiction. However, the second edition of the ADRs was selectively applied as a legally binding standard in certain States and Territories in 1969.
The third edition of the ADRs was developed between 1983 and 1986 and became effective from 1988 as a national standard for vehicle design. The third edition of the ADRs was developed for the purposes of the MVSA and in 1989 gained national application when the MVSA was implemented. Since the implementation of the MVSA, the ADRs are continually updated and revised and are also subject to a full review every ten years to ensure that they are relevant, cost effective and do not become a barrier to importation of safer vehicles and vehicle components.22
18 Second reading speech of the MVSA, as quoted in Consultation Paper on the Motor Vehicle Standards Act1989, 201319 Motor Vehicle Standards Act 198920 Motor Vehicle Standards Regulations 198921 Ibid.22 Infrastructure.gov.au, (2014). Australian Design Rules. [online] Available at:

htt p:/ /www. i nf rast ructure. gov. au/ roads/ mot or/desi gn/ [Accessed 7 Aug. 2014].
Current Australian Government policy is to harmonise the national vehicle safety standards with international regulations, with special reference to the United Nations Economic Commission for Europe’s (UNECE) international regulations.
Some examples of Australian Design Rules are provided in Table 4.1. Note that as the specification of the design rules are extensive, we have not included the full specification, but a description of the purpose of each rule.
Table 4.1: Sample of Australian Design Rules
Design Rule DescriptionADR 1 – Reversing lamps The function of this Australian Design Rule is to
specify the photometric requirements for reversing lamps which will warn pedestrians and other road users that the vehicle is about to move or is moving in the reverse direction, and which during the hours of darkness will aid the driver in reversing manoeuvres.
ADR 2 – Side door latches and hinges The function of this Australian Design Rule is to specify requirements for side door retention components, including latches, hinges, and other supporting means, to minimise the likelihood of occupants being thrown from a vehicle as aresult of impact.
ADR 3 – Seats and seat anchorages The function of this Australian Design Rule is to specify requirements for 'Seats', theirattachment assemblies, their installation and any head restraint fitted to minimise the possibilityof occupant injury due to forces acting on the‘Seat’ as a result of vehicle impact.
ADR 4 – Seatbelts The function of this Australian Design Rule is to specify requirements for seatbelts to restrain vehicle occupants under impact conditions, facilitate fastening and correct adjustment, assist the driver to remain in his ‘Seat’ in an emergency situation and thus maintain control of thevehicle, and protect against ejection in anaccident situation.
Source: Infrastructure.gov.au, (2014). Third Edition Australian Design Rules. [online] Available at: h tt p : / / ww w . i n f ra s t r uc t u r e . go v . a u / r o a d s / m o t o r / de s i g n / a d r _ on l i n e . a s px [Accessed 8 Aug. 2014]. Low Volume Scheme
The Low Volume Scheme was established with the MVSA in 1989 with the intent of providing an avenue for motor enthusiasts to gain access to specialist and enthusiast vehicles (SEVs). Initially, the low volume scheme was effective in providing concessions for the importation of SEVs, however, in the 1999 review of the MVSA it was found that the Low Volume Scheme had become an avenue for people to import used vehicles into Australia that could not be classified as a SEV and generally had low safety standards. In response to this, an amendment was passed for the MVSA in 2001 that established the RAW Scheme.

Registered Automotive Workshop Scheme
The RAW Scheme was implemented in 2001 in response to evidence that the Low Volume Scheme was not being used for its original purpose of importing SEVs. The RAWS allowed for the designation of registered workshops which, under amendments to the MVSA, were the only entity through which the import of used SEVs could take place. It is unclear how successful the RAW scheme has been in limiting the import growth of used vehicles. Chart4.1 shows a longitudinal view of used vehicle imports and it appears that though there wasa brief period of time where used imports decreased, there is still strong growth in the area with more than 50,000 imports of used motor vehicles in 2011-12. The Non-RAW scheme imports shown in Chart 4.1 are either vehicles which were manufactured prior to 1989 (and hence predate the MVSA), or are personal vehicle imports – it is unclear what is driving this growth.
Chart 4.1: Imports of used vehicles
70,000
60,000
50,000
40,000
30,000
20,000
10,000
01991-92 1996-97 2001-02 2006-07 2011-12
Raws imports Non-Raws imports
Source: Department of Infrastructure and Regional Development (2013), Consultation Paper on the MotorVehicle Standards Act 1989, Australia
4.2 Past policy rationale for restricting large scale imports
The policy rationale behind the initial restriction of large scale imports of used cars into Australia has primarily been based on safety concerns. At the time of drafting the MVSA, the Government was concerned with used car imports not complying with ADRs and as a result not meeting the standards that Australians had come to expect of motor vehicle safety. Maintaining safe driving conditions is a primary concern of government and the main focus of the MVSA (see Figure 4.1). Unsafe vehicles have both personal injury and broader economic implications. During the development of the MVSA, it was also noted by Government that ‘each year in Australia some 2,800 people are killed on our roads and30,000 seriously injured. In addition to the trauma and suffering which results from these

crashes, the aftermath of this carnage costs the Australian community some $5,700mannually.’ 23
Figure 4.1: Objects, Outcomes and Objectives of the Act
What the Act does… which leads to… which contributes to…
Object of the Act – 3 (a)
Uniform NationalStandards
OutcomeSafe vehicles
Outcome Environment-
friendly and secure vehicles
Primary policy objective Road
safety
Policy objective Reduced environmental
degradation and theft
Object of the Act – 3 (a)
Regulation of imported used vehicles
OutcomeAccess to market
Policy objectiveChoice
Source: Consultation Paper on the Motor Vehicle Standards Act 1989, 2013
4.3 Current policy rationale for removing import restrictions
Productivity commission review
In October 2013, the Productivity Commission (PC) was requested to undertake a review into government support for Australia’s automotive manufacturing industry. The inquiry considered the feasibility of government policies designed to assist the automotive manufacturing industry in Australia. These policies include direct budgetary support policies wherein the government subsidises certain activities of the automotive manufacturing industry, and indirect policies where government employs regulation to benefit the automotive manufacturing industry.
One such regulatory policy is the restriction of importation of second-hand vehicles through the MVSA. This regulatory policy has the primary aim of ensuring high safety standards in imported second-hand cars, and achieves this through both limiting the number of second- hand cars that can be imported by an entity each year, and by applying a specific customs duty of $12,000.
23 Second reading speech of the MVSA, as quoted in Consultation Paper on the Motor Vehicle Standards Act
1989, 2013

The PC came to the view in the position paper that restrictions on the importation of second-hand vehicles, particularly the barriers to large-scale importation of such vehicles, reduces competition in the car market and removal of such restrictions would benefit the community as a whole. In support of this view, the PC released a draft finding in relation to the restriction of importation of second-hand vehicles:
Draft Finding 2.2
The policy rationale for prohibiting the large-scale importation of second-hand vehicles into Australia is weak. However, appropriate regulatory measures are required to ensure that consumer protection, community safety, and environmental performance standards are maintained before the restrictions are removed. These concerns are best dealt with directly, through regulatory standards applicable to all vehicles sold in Australia.
The $12 000 specific duty on imported second-hand vehicles appears to be largely redundant, providing a prima facie case for its removal.
Following the completion of our report, the PC has since released their final review report. The core finding recommending the removal of large scale used car import restrictions was reiterated in the final inquiry report in Recommendation 5.4, though the PC’s stance on this appeared to have weakened. It is important to note that though the analysis of our report was carried out in reference to the position paper, our conclusions are not changed regarding the potential impacts of removing used car import restrictions in Australia.
Policy rationale for removing import restrictions
The policy rationale behind the PC’s recommendation is one of free market competition improving consumer outcomes. The PC points to New Zealand’s experience and argues that as a result of removing large scale import restrictions of used vehicles, there weresignificant benefits for New Zealand consumers in terms of price and choice. Economictheory suggests that removing market distortions (e.g. import restrictions) will increase the supply of a good in a particular market and result in increased competition, lower prices and higher choice of goods. It must be noted that the outcomes of such microeconomic reform may not be straightforward if there are issues such as market failures or non-rational behaviour of consumers (including bounded rationality – i.e., that the rationality of consumer decisions is limited by available information and their understanding of that information available).
5 Potential impacts to the retail carmarket
This chapter provides context for regulation in the retail car market and analyses the key policy rationale driving potential changes to import restrictions of used cars.
5.1 New Zealand experienceA useful starting place for the analysis of potential implications for the suggested policy changes is a brief analysis of New Zealand’s experience with the same policy move in 1986. New Zealand is a useful comparison to Australia as the government, culture and income per capita of both countries are similar24.
New Zealand’s decision to remove import tariffs and open up the domestic market to the large scale import of used vehicles was primarily driven by the desire to improve affordability of motor vehicles in New Zealand. In the 1970s and 1980s car ownership in New Zealand was anecdotally very low, and prices of motor vehicles were high. In addition to this, the New Zealand car fleet was aged, of a low specification, and facing sustainability problems. The New Zealand government responded to these issues by removing import tariffs on used car imports, effectively allowing the large scale importation of used cars.
Following the removal of import tariffs, the number of registered motor vehicles in New Zealand increased dramatically. Chart 5.1 shows the number of registered cars in New Zealand and the number of registered imported used cars in New Zealand. Up until 1986 the number of used imports was very low, a likely outcome of the import restrictions that New Zealand had in place prior to 1986; however, after 1986 the number of used imports dramatically increased and became the predominant type of registered cars in the market. Anecdotally, this paradigm change in the New Zealand car market came about because prior to 1986 the car fleet was ageing and of poor quality, so when relatively new cars with high specification could be imported there was a high substitution of both new and used cars.
24There are some differences in terms of car affordability and the history of car manufacturing, however, of all

countries which import used cars, New Zealand is the most comparable.
25 Additional factors also influence the age of the car fleet including new car affordability and other government policies.
38
Uni
ts o
f car
s
Chart 5.1: Car registrations
250,000
200,000
150,000
100,000
50,000
01960 1965 1970 1975 1980 1985 1990 1995 2000 2005 2010
Total number of registered cars Ex-overseas cars
Source: New Zealand Transport Agency (2014), MVR Statistics Book 2013
Currently there is a high level of approximately 700 cars per thousand populations – one of the highest rates of car ownership in the world; this is likely a direct result of allowing used imports.
There have been many benefits from New Zealand’s policy regarding imports of used cars; however, this may have been at the cost of both the age and the safety of the New Zealand car fleet25. Data from 2013 shows that the age of the New Zealand fleet has been steadily increasing over time – especially in comparison to the age of the Australian fleet. Chart 5.2 shows the age of the car fleet at several points in time and indicates a clear upwards trend of vehicle age in New Zealand as compared to a downwards trending fleet age in Australia.

39
Aver
age
age
of c
ars i
n fle
et
Chart 5.2: International age comparison of car fleets
16
14
12
10
8
6
4
2
02002 2003 2004 2005 2006 2007 2008 2009 2010 2011 2012 2013
New Zealand Australia USA
Source: New Zealand Ministry of Transport (2013), 2013 New Zealand Vehicle Fleet Annual Spreadsheet; ABS Motor Vehicle Census various years
One of the major concerns associated with an ageing vehicle fleet is safety. Though it is possible that the initial introduction of the New Zealand policy to remove large scale used car import restrictions resulted in a short term increase in safety of the New Zealand fleet, the long run effects appear to have had the opposite effect. Studies undertaken by the Monash University Accident Research Centre (MUARC) into the crashworthiness of vehicles have found that vehicle age in New Zealand has a statistically significant effect upon safety26. In addition to this, MUARC constructed models of crashworthiness for the overall New Zealand fleet as compared to used car imports; it was found that there is a distinct difference in the safety of these vehicles with imported used vehicles having a higher risk of crash including a higher risk of injury and death27. Chart 5.3 shows the crashworthiness of the New Zealand fleet comparing the overall fleet to used imports.
26 Newstead, S., Watson, L. and Cameron, M. (2013). Vehicle safety ratings estimated from police reported crash data: 2013 update: Australian and New Zealand crashes during 1987-2011;27 Newstead, S., Watson, L. and Cameron, M. (2012). Trends in crashworthiness of the New Zealand vehicle fleet by year of manufacture: 1964 to 2010: supplement to Report 313: Vehicle safety ratings estimated from police reported crash data: 2012 update.

Prob
abili
ty o
f cra
sh (%
)
40
Chart 5.3: Crashworthiness of the NZ fleet, overall vs used imports
60
50
40
30
20
10
01964 1969 1974 1979 1984 1989 1994 1999 2004 2009
Overall NZ vehicles Imported used vehicles
Source: Newstead, S., Watson, L. and Cameron, M. (2012). Trends in crashworthiness of the New Zealand vehicle fleet by year of manufacture: 1964 to 2010: supplement to Report 313: Vehicle safety ratings estimated from police reported crash data: 2012 update.
In recognition of the growing issue with the ageing New Zealand car fleet, the New Zealand Government has started to implement more stringent environmental and safety controls on imported used vehicles. Some of these new regulations include or are expected to include: Fuel quality standards28
Electronic Stability Control29.
It has been questioned30 as to whether or not the implementation of these regulations will effectively represent to restrict the import of used vehicles as regulations such as mandating ESC on used imports could greatly decrease the available supply of used vehicles.
5.2 Source marketsIn order to identify the potential implications for the Australian retail car market of large scale used car imports, it is important to identify possible supply markets. With an understanding of the likely supply markets, we are able to infer the age and specification of cars likely to be imported into Australia.
28 Nzta.govt.nz, (2014). Land Transport Rule - Vehicle Exhaust Emissions 2007 | NZ Transport Agency. [online] Available at: h tt p : / / nz t a . go v t . nz / r e s o u r ce s / r u l e s / v e h i c l e - e x h a u s t - e m is s i on s - 2007 . h t m l [Accessed 7 Aug. 2014].29 Globalncap.org, (2014). New Zealand makes ESC mandatory on all imports. [online] Available at:htt p:/ /www. globalncap. org/ new - zeal and - makes -es c- mandat ory- on- all -i mports / [Accessed 7 Aug. 2014].30 Whitehead, V. (2010). Used imports at threat from ESC move. [online] Autotalk. Available at:htt p:/ /aut ot al k. co. nz/ news /us ed -i mport s -at -t hreat -f rom- esc- move [Accessed 7 Aug. 2014].

41
5.2.1 Possible source markets
The first condition for a country to be considered a supply market is that the jurisdiction is a right hand drive market. This limits the possible supply markets to 14 possible markets. The next step in identifying possible source markets is to limit possible markets to those with a high car population and a high level of gross domestic product (GDP) per capita. High car population gives an indication as to the depth of supply in a market and high GDP per capita gives an indication of the ability of consumers to frequently change cars – these are both drivers of the supply of used cars in a market.
Table 5.1: Possible import source markets
Country Population Cars per 1,000 population
Car population
Australia 23,130,900 703 16,256,773Cyprus 1,141,166 529 604,029Hong Kong 7,187,500 80 575,103Indonesia 249,865,631 69 17,283,456Ireland 4,595,281 491 2,254,037Japan 127,338,621 588 74,868,544Malaysia 29,716,965 378 11,224,089Malta 423,282 709 300,001New Zealand 4,470,800 708 3,166,581Singapore 5,399,200 151 815,649South Africa 52,981,991 165 8,749,369Thailand 67,010,502 172 11,498,516Trinidad andTobago 1,341,151
353 473,723
United Kingdom 64,097,085 516 33,045,547Source: World Bank (2014), World Development Indicators
From analysis of World Bank World Development Indicators data (in Table 5.1 above), we have identified that the United Kingdom and Japan are right hand drive markets that both have high car populations and high GDP per capita and hence are likely supply markets. An analysis of supply markets for the New Zealand used car imports (see Table 5.2) confirms that both the United Kingdom and Japan are important supply markets, with most of the supply of used imports in New Zealand being sourced from Japan. Interestingly, another supply market for New Zealand is Australia – this may indicate that the price of Australian used cars is comparable to that of used imports from the UK and Japan.
Table 5.2: Country of Origin of New Zealand Used Imports, 2013
Country of origin % of total used imports
Australia 1.41Japan 94.09
United Kingdom 3.01
Other 1.49Source: www.nzt a. govt .nz/ res oruces/ mot or - vehicl e- regi st rat ion -s tati sti cs/ docs/ 2013. pdf
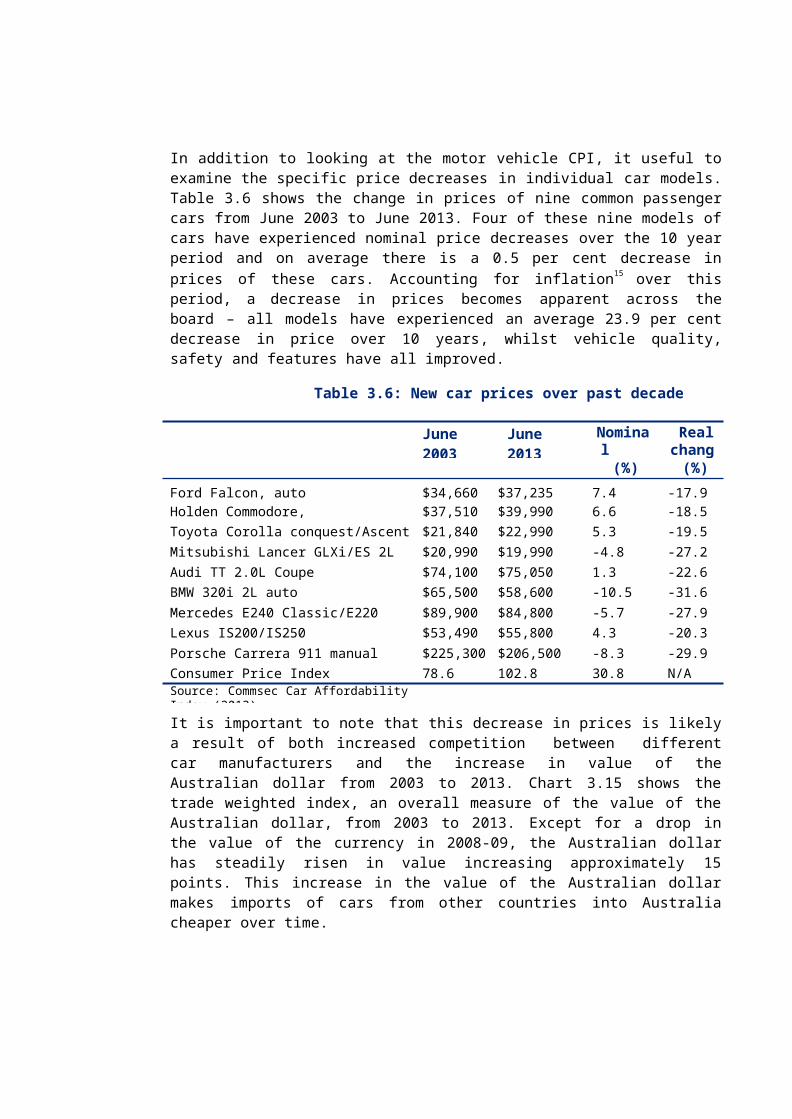
42
Perhaps the most important factor behind the high supply of Japanese used cars to the global market is Japanese Government regulation in the domestic retail car market which effectively makes owning a car that is six years or older cost prohibitive. Registration and inspection costs in Japan are linked to the age of a vehicle and increase steeply when a vehicle is older than six years.
5.3 International comparisonAs discussed in the Chapter 3, there have been significant improvements in the specification of Australian new cars relative to other right hand drive markets such as Japan and the UK. The higher level of specification in Australian cars partially explains price differentials that can be observed between new cars sold in the Australian retail car market and other countries. These specification differences primarily relate to comfort and aesthetic features. We have provided three examples of these specification differences below, these examples are provided to show clear evidence of a difference in specification between the same car model in different countries.
5.3.1 Nissan 370z Coupe
The first car forming part of this analysis, the Nissan 370z is sold in the Australian, UK and Japanese car markets. The specification options of each of these vehicles differ in each market. Table 5.3 presents a comparison of each of these features.
Table 5.3: Nissan 370z specification comparison
Specification option Australia UK JapanRain Sensing Wipers NO YES NOBi-Xenons with Headlamp Washer YES YES NOAutomatic headlamps YES YES YESIntelligent Key YES YES YESElectrically foldable, adjustable and heated mirrors YES YES YESAdvance Drive Assist Display YES YES YESFully Auto A/C with Climate Control YES YES YESABS, EBD and Brake Assist YES YES YESESP with Deactivation Switch YES YES YESViscous Limited Slip Differential YES YES YESVehicle Dynamic Control with Deactivation Switch YES YES YESDriver, Passenger, Side and Curtain Airbags YES YES YESRear Camera with Predictive Path Technology YES NO NOCruise Control YES NO NOLeather Seat Trim YES NO NO4-way Driver Seat Adjustment with Power Slide YES NO NOSatellite Navigation YES NO NOHeated Front Seats YES NO NOBOSE 8 Speakers YES NO NOFront Seat Belt with Load Limiters and Pre-tensioner YES YES YES

43
Engine Immobiliser & Alarm YES YES YESDaytime Running Lights YES YES YESTyre Pressure Detection NO YES NOSource: BMW Dealer Council of Australia
From Table 5.4 it is apparent that the Australian model of the BMW 320i generally has a higher level of specification than the UK model and the Japan model. It is assumed that any features not included in the above analyses are identical in each model.
5.3.2 Mercedes-Benz C-Class C200
The second model of car that will form part of this analysis is the Mercedes-Benz C200. This model of vehicle is sold in the Australian, Japanese and UK car markets, however, it has different levels of specification in each of these markets. The marketing strategy and branding for this vehicle also differs slightly in each market. In the Australian market, the base model of the C200 is marketed as a luxury vehicle In the UK, the C200 is marketed as a prestige vehicle In Japan, the C200 is marketed as a luxury vehicle.The specification options of each of these vehicles, like the branding, all differ slightly. Table5.4 presents a comparison of each of these features.
Table 5.4: Mercedes-Benz C200 specification comparison
Specification option Australia Japan UKAdaptive brakes YES YES YES
9 Airbags YES OPTIONAL OPTIONAL
Anti-lock Braking System (ABS) YES YES YES
Attention assist YES YES YES
Audible warning for front seat passengers seatbelts YES YES YES
Automatic locking doors with emergency opening YES YES YES
Brake assist program (BAS) YES YES YES
Electronic immobilizer (ELCODE) YES YES YES
Electronic Stability Program (ESC) YES YES YES
Emergency spare wheel YES YES YES
First aid kit YES YES YES
Flashing adaptive brake light YES YES YES
Neck pro crash responsive front head restraints YES YES YES
Pre-safe system YES YES YES
Safety steering column YES YES YES
Seat occupancy sensor for front passenger seat YES OPTIONAL OPTIONAL
Warning triangle in boot lid YES YES YES
Reversing camera (in conjunction with coman) YES OPTIONAL OPTIONAL
Intelegant headlamp control YES YES OPTIONAL
Telephone prewiring with hands free facility YES OPTIONAL OPTIONAL
Source: National Mercedes-Benz Dealers Association

44
From Table 5.4 it is apparent that the Australian model of the Mercedes-Benz C200 has a higher level of specification than both the UK and the Japanese version of the base model.
5.3.3 BMW F30 320i
The third car forming part of this analysis, the BMW 320i is sold in the Australian and UK car markets. Like the Mercedes-Benz C200, the BMW 320i is marketed differently in each market and has a different level of specification. In the Australian market, the base model of the 320i is marketed as a luxury vehicle In the UK, the 320i is marketed as a prestige vehicle.The specification options of each of these vehicles, like the branding, all differ slightly. Table5.5 presents a comparison of each of these features.
Table 5.5: BMW 320i specification comparison
Specification option Australia UKServotronic YES OPTIONALElectric seats with memory function YES OPTIONAL
Navigation System Business YES OPTIONAL
Through loading system YES OPTIONAL
Extended storage package YES OPTIONAL
Front Armrest YES OPTIONAL
Rear seat folding headrests YES OPTIONAL
PDC front and rear YES OPTIONAL
Lights package YES OPTIONAL
Sensatec YES OPTIONAL
Auto Transmission YES OPTIONAL
Tyre pressure monitoring NO YESDAB + NO YESSource: BMW Dealer Council of Australia
From Table 5.4 it is apparent that the Australian model of the BMW 320i generally has a higher level of specification than the UK model. It is assumed that any features not included in the above analyses are identical in each model.
5.3.4 Price comparison
The Federal Chamber of Automotive Industries has recently released a comparison of international car prices. Case studies were undertaken of fully optioned popular Australian car models and similarly optioned models in the UK and New Zealand. The FCAI analysis indicated that for many models of car Australian prices were at least comparable and in many cases cheaper than overseas market. An important caveat on the analysis is that prices reported were manufacturers’ list prices and excluded stamp duty and registration costs.

45
Table 5.6: Price comparison
Australia New Zealand UKToyota Corolla Ascent Sport Hatch AUD $23,540 NZ$37,490 AUD$24,250Mazda 3 Neo HatchBMW 3 series 320iMercedes-Benz ML350 BlueTec Diesel
AUD$23,792AUD$69,400AUD$102,236
NZ$32,795NZ$88,900
AUD$31,405AUD$68,808AUD$100,410
Source: FCAI (2014), Vehicle price and specification comparison, Available online ath tt p : / / ww w .f c a i . c o m . a u / s pe c i f i c a t i o n / v e h i c l e - p r i c e - a n d - s pec i f i c a t i o n - co m p ar i s on
5.4 Direct effectsIf Australia was to remove import restrictions allowing the large scale importation of used cars there would likely be a number of implications for the local economy. Economic theory would suggest that an increase in supply of goods in a particular market will result in both increases in quantities of the goods sold and a decrease in the level of prices. Considering the Australian retail car market, theoretically the removal of current large-scale used car import restrictions would result in a decrease in the price of used cars and may also result in a decrease in prices of new luxury cars. However given the high level of car ownership in Australia, the removal of the current restrictions is unlikely to result in a material change in the overall number of cars sold.Key changes in the market that will occur as a result of removing current import restrictions will relate to substitution effects. It is likely that in response to price changes consumers may substitute planned purchases of local used cars with imported used cars and, to a limited extent, local new cars.
5.4.1 Price impacts
If the Australian Government was to remove current restrictions on large scale importation of used cars, it is likely that there will be an effect on prices; given the complexities31, estimation of the magnitude of such a change is difficult. However, as the following analysis requires an indication of how price might change, we have considered an indicative range of price changes based on case studies of markets similar to Australia (see Table 5.6). It is likely that prices for cars in the prestige and luxury end of the market will experience the greatest drop in price, we consider that this will be most applicable for luxury cars priced at over $150,000.
An important consideration when looking at price impacts is that if Australians start importing used cars from countries such as Japan and the UK, demand pressures may cause the price of used imports to rise. Although New Zealand enjoyed relatively free access to the Japanese supply of used cars in the 1980s and 1990s, in recent years there have been
31 Government regulation is likely to be a strong factor driving prices for used car imports as there are many consumer and environmental concerns that Government would need to address in implementation of such a policy. At this early stage where the Government has not yet publicly released possible policy changes this
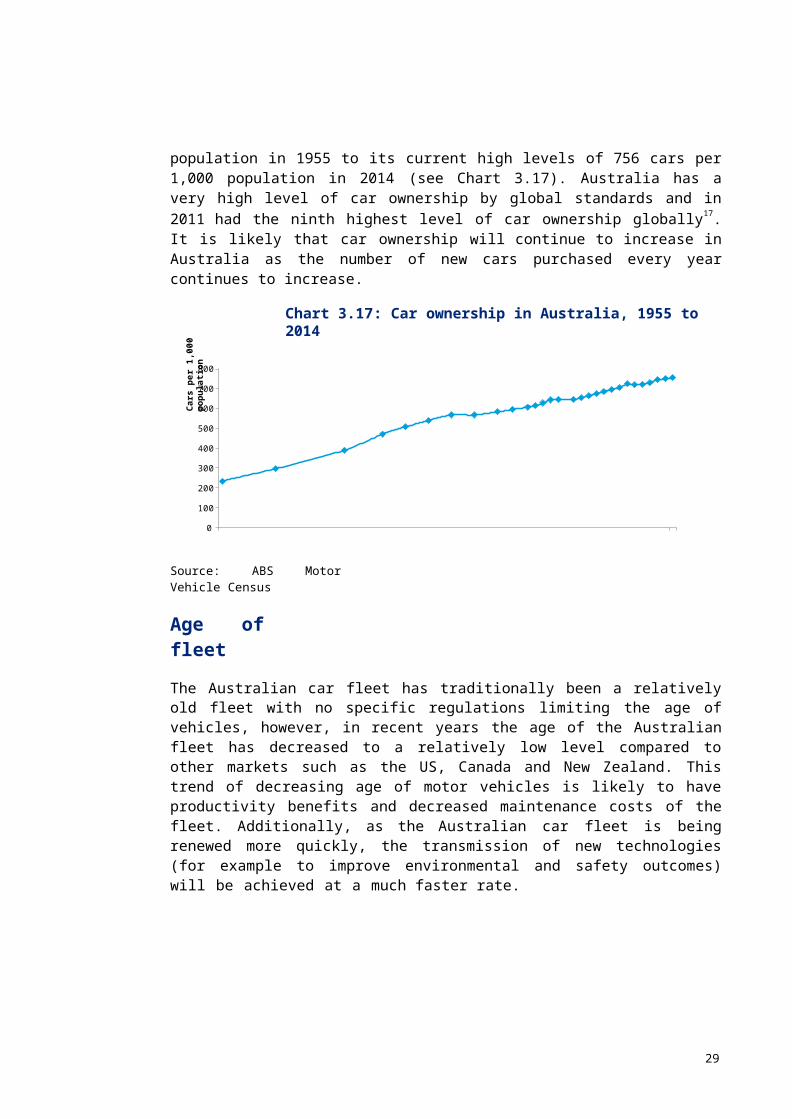
46
leads to many unknowns.

47
an increasing numbers of competitors for this supply resulting in price increases32. Given that Australia has over five times the population of New Zealand, if Australia were to start competing for this supply as well it is conceivable that, for many parts of the market, consumers would not have access to significantly lower prices.
As used cars are a substitute good for new cars, changes in the prices of used cars are likely to affect the prices of new cars. However, as used cars are not a perfect substitute for new cars, this change in price is likely to have a lower magnitude than the change in price of used cars.
Considering the above, indicative price changes for the retail car market may include: No significant change for new cars in the volume segment of the market Minor price decreases for used cars in the volume segment of the market No significant change for new cars in the prestige segment of the market Minor price decreases for used cars in the prestige segment of the market Low to medium price decreases for some new cars in the luxury segment of the market Medium price decreases for used cars in the luxury segment of the market.
5.4.2 Quantity impacts
Although it is not expected that there will be a material change in the overall number of cars sold, it is likely that consumers will substitute planned purchases of local used cars with imported used cars for local used cars and, to a limited extent, local new cars. In explaining these changes it is useful to differentiate between two types of demand in the Australian retail car market: Replacement of the existing fleet Expansion of the existing fleet.
Replacement of the existing fleet occurs as consumers trade in and upgrade their existing cars. This occurs usually as either a result of a desire for a lifestyle improvement or a need to replace an ageing car. It is expected that the rate of replacement will remain the same, however, substitution will occur between imported used cars and local used cars and local new cars.
Expansion of the existing fleet occurs as wealth increases over time, more people are able to purchase cars and some people are able to purchase multiple cars. As described in Chapter 3, in recent years increasing affordability of cars has strongly contributed to the expansion of the Australian car fleet to the point that for every 10 Australian residents there are nearly 8 cars33. Given that a certain portion of the Australian population is not able or not willing to drive34 it is likely that this level of car ownership is close to a level of‘full car ownership’. In light of this, it is not expected that a price decrease brought about by
32 RIA Novosti, (2014). Right-hand Drive Fuels Revolution in Russia’s Far East. [online] Available at:htt p:/ /en. ri a. ru/ anal ysi s/ 20121003/ 176382673. ht ml [Accessed 7 Aug. 2014].33 ABS (2013), Motor Vehicle Census34 Including those who cannot legally hold a driver’s license.

48
used vehicle imports will drive a material increase in demand for cars in the Australian market.
5.4.3 Substitution effects
As discussed above, it is expected that if restrictions on the large scale importation of used cars were to be removed that there would be a degree of substitution between purchases of: Imported used cars and Australian used cars Imported used cars and Australian new cars.Assuming the approximate levels of price changes described in 5.4.1, it is likely that there will be the following substitution effects in the Australian car market. A low level of substitution between Australian new cars and used imports, mostly in the
luxury car segment of the market A medium to high level of substitution between Australian used cars and used imports. These substitution effects will have a range of outcomes for the Australian car market: Volume of cars in the fleet – as discussed previously, this is not expected to change as a
result of the suggested policy change. The ratio of new to used cars transacted each year – the ratio of new to used cars is
expected to decrease, indicating that there will be an increase in the age of the fleet. This effect is likely to be small as substitution effects between local new cars and imported used cars are expected to be small.
The age profile of the fleet – changes in the overall age of the Australian car fleet are highly dependent upon the age of cars being imported from source markets. It is possible that the average age of the Australian fleet will decrease if imported used cars are younger than similar Australian used cars being sold in the market, however, if used cars being imported are older than similar Australian cars being sold in the market this could result in an ageing of the Australian fleet. The ratio of new to used cars transacted each year will also influence the overall age of the Australian fleet as any substitution between new and used cars will result in an ageing of the fleet. On balance, it is likely that there will be some degree of ageing of the Australian fleet, however, the extent of this is highly dependent upon the age of used imports.
Dilution of cars built for Australian market – cars built specifically for the Australian market have been designed to handle the Australian climate, roads and fuel. If there is a high degree of substitution between cars built for the Australian market (Australian used and Australian new) and imported used cars, there may be a decline in the safety, security, reliability and environmental standards of the Australian fleet. Assuming a medium level of substitution between imported used cars and cars made for the Australian market, it is likely that there will be a significant dilution effect having a range of implications for the Australian market.
5.5 Implications for the Australian marketOutcomes discussed in the previous section refer to observable changes in the structure of the Australian car fleet that may occur as a result of removing restrictions on large scale importation of used cars into Australia. These outcomes, in and of themselves, are not of

49
concern, however, changes in these outcomes have important implications for the Australian retail car market. These implications are described below, each from the perspective of a stakeholder: industry, consumers and the government.
5.5.1 Industry
Any change to existing arrangements regarding import restrictions of used cars is likely to disrupt the retail car dealerships in Australia. One of the strongest disruptions would be in the area of quantity and price. It is expected that in the short term, dealerships will suffer losses to profitability as prices may decrease and sales of the local new and used cars decrease. This loss in profitability is likely to be exacerbated by thin profit margins and the reliance of dealerships on the sale of a new or used car to generate a stream of future revenue. In the medium to long run, it is expected that dealerships will be able to adapt and may even diversify their existing business model to include used car imports, however, this will require dealerships to cope with disruption to their business model. Other implications for dealerships include the: Devaluation of stock – Any decrease in market prices of new and used cars will result in
a devaluation of existing dealerships’ car stock. Depending on the level of stock holding this could be a significant cost for some dealerships.
Recall management issues – Current recall management systems do not have processes in place for dealing with recall of used imported vehicles. This may result in significant brand costs for dealerships (and manufacturers) as when recalls occur, owners of recalled used import vehicles will not likely be informed of a recall and as a result are likely to have a negative perception of a particular car brand. Currently, recall management systems are managed effectively through industry self-regulation and failsafe government regulation.
The above effects are likely to be more pronounced in the luxury car segment as it is here estimated that substitution between purchases of new cars and used imports will occur.
5.5.2 Consumers
Implications for consumers of the removal of restrictions on the large scale importation of used cars are complex. It is reasonable to expect that such a policy will have some benefits to customers; however, there are also other considerations that need to be taken into account including increased operating costs, and consumer protection issues.
Benefits likely to be derived for consumers relate to decreases in car prices and an increased choice of cars (there are often different models available in other countries). The size of benefits accruing to consumers is likely to be determined by the magnitude of price changes and the availability of genuinely different car models35.
Though there are many upfront financial benefits of used import vehicles, it is likely that used import cars will have higher operating costs than similar cars in the Australian market. These costs are likely to stem from three major areas: parts and servicing and insurance.
35 Consumers are unlikely to derive additional benefits of increased choice unless there is availability of used import models which are substantially different from models available on the Australian market. If this is not the case, consumers may in fact incur higher search costs for when purchasing vehicles.

50
In the short run, it is likely that there will be limited local availability of some parts for used import cars and as such servicing costs will be higher as these parts will need to be supplied from the source market. According to Australian motor vehicle dealers, given a lack of scale, it is probable that costs of importing parts will be very high. Experience from New Zealand has suggested that this is so much of a problem that often, in order to obtain unavailable parts, mechanics will resort to taking apart other used import cars for parts. In the long run, it is possible that a parts market will emerge to service used imports in Australia, however, this has not been the case in New Zealand36 (possible due to its small market size).
Insurance costs are another factor which may significantly increase the operating costs of used import cars. Currently, insurance arrangements in Australia for Specialist and Enthusiast Vehicles (SEVs) are handled by specialty insurance firms which charge very high premiums to insure used imports. Another possible problem related to insurance is that, as has been the case in New Zealand, some insurers will not offer insurance for imported used vehicles.
Consumer decision making
As identified in Chapter 5.3, cars sold in Australia often have a higher specification as compared to international markets such as the UK and Japan. This difference in specification can cause confusion for consumers when comparing car prices in Australia to overseas markets. This confusion can be captured and described by the concepts of information asymmetry, heuristic decision making, and salience.
If import restrictions on used cars were to be removed, information asymmetries may arise in the short run as it is unlikely that there will be sufficient information for consumers to be aware of differences in the same model of a car when it is sourced from different markets around the world. Such information asymmetries may lead to consumers overestimating the value of cars they are purchasing and making a sub-optimal purchasing decision. In the long run, it is likely that information issues would be resolved through experience and through information available on car purchasing.
Regardless of whether information asymmetries are resolved in the long run, consumers face a behavioural issue relating to salience and heuristic decision making. As articulated previously, consumers when faced with complex choices (such as purchasing a car) tend to make a decision based on what is meaningful to them, and employ mental shortcuts to arrive at a decision.
An example illustrates this concept effectively. In the UK, the BMW 3 series is sold as a prestige fleet model car, whereas the same model is sold as a luxury private car in Australia. Correspondingly, the BMW 320i is at a much higher specification in Australia than in the UK but also has a much higher price tag. For a consumer considering the purchase of such a luxury car in Australia, two of the main considerations that are salient (or relevant) to the consumer are brand, model and price. As brand and model are more salient to a customer they are likely to make the following heuristics based decisions: BMW is a luxury brand in Australia, so a BMW from the UK is also a luxury car
36 Consultation with Deloitte New Zealand Motoring Industry Services Team.
51
The model of the used import is the same as the model as the Australian version, hence they have the same level of features.
Such a decision process will likely lead a consumer thinking that a used import of a BMW320i from the UK is the luxury car good that they are interested in and then make a decision to purchase the car entirely on price. This would lead the consumer to buying the UK used import even if it may not be the car they wanted to purchase.
5.5.3 Government
Removing restrictions on used imports will have implications for the Government in a number of areas. These implications can be grouped into consumer protection issues, policy issues and fiscal issues.
Consumer protection issues
Government has a community responsibility to make certain arrangements for consumer protection and safety. One important area of this is product recalls. Currently, product recalls in the retail car market are mainly handled by the car industry regulating itself, however, if large scale importation of used cars were to be allowed this level of regulation would likely not be sufficient. In the case of a consumer individually importing a vehicle, they may be responsible for any product recalls. Such a system is not likely to work.Most imported used cars are unlikely to have warranties attached as they are generally restricted to the market of original sale. Even in the case where an imported used car may have a global warranty, local dealers are not required to pay for repair and replacement. Our understanding is that if a consumer imports a used luxury car that is covered under a global warranty, the consumer will have to pay for costs of repair up front and then claim the costs back from the manufacturer (as an Australian dealership is not obligated to pay the costs up front). One example of this is if a consumer takes an imported used Mercedes- Benz to get the engine replaced, they may have to pay up to $80,000 up front. Such high costs could be cost prohibitive and prevent consumers from benefiting from a warranty. This has implications for recall regulation and consumer protection generally.
Fiscal issues
Stamp duty is levied on the sale price of all vehicles, the lower the price of vehicles sold, the lower that stamp tax revenue will be. This may have implications for state and territory governments.
There may also be implications for luxury car tax revenue, however, this will be determined by the extent to which the removal of current restrictions affects the number of new luxury cars sold. We note that in its final report, the PC recommended the removal of the luxury car tax and the import tariffs, which would have material impact for the prices of new cars and related tax and stamp duty revenue.
52
Policy issues
Policy issues further complicate the suggested changes. Government is committed to increasing the safety37 of the Australian car fleet and improving environmental outcomes – objectives which could potentially be hindered by allowing the import of used cars. As discussed previously, a likely outcome of allowing used car imports is the ageing of the Australian fleet as well as an increase in number of cars that are not manufactured for the Australian market. These changes in fleet outcomes have been found to be related to negative safety outcomes. A study by the MUARC in 2013, found that an ageing vehicle fleet has a statistically significant relationship with the risk of crash, injuries sustained in car crashes and deaths from car crashes.
Some of these issues can be resolved through regulation, however, implementation and enforcement is likely to be difficult and costly. Due to the nature of used imports, quality and compliance checking cannot be performed through ‘type testing’ or ‘batch sample’ testing; this could lead to very high costs of enforcement.
37 Motor Vehicle Standards Act 1989
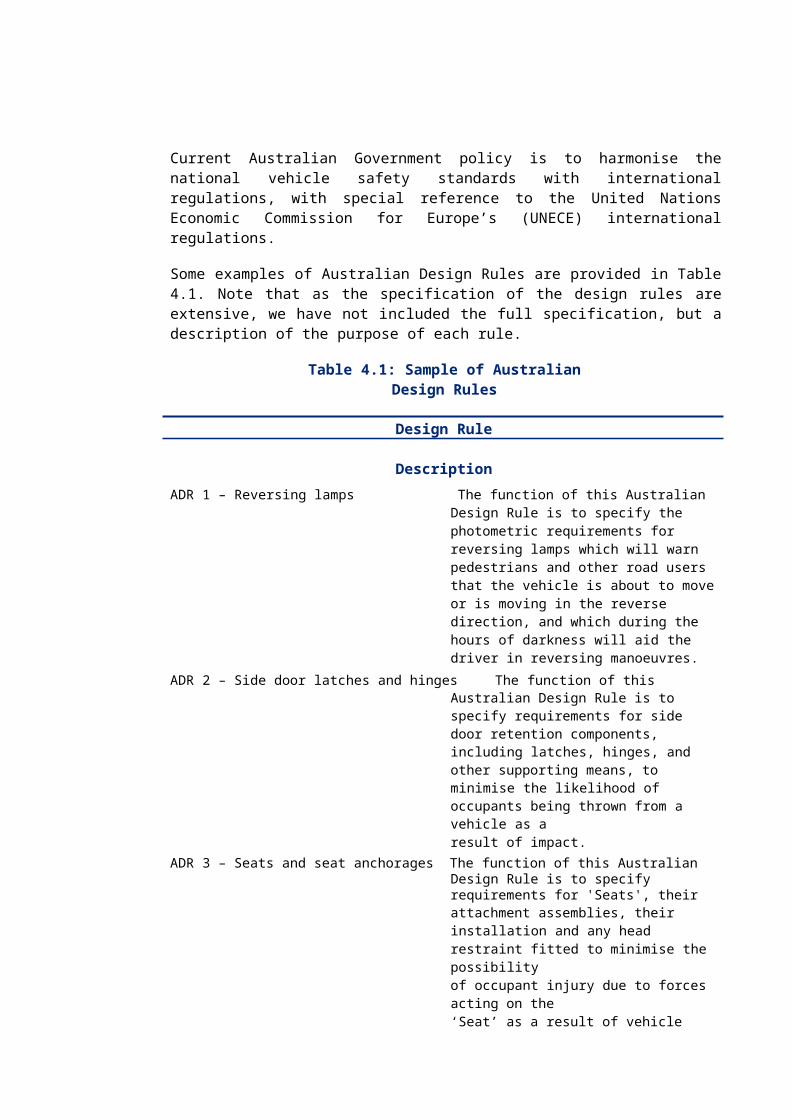
53
Conclusions
The Australian retail car market is a highly competitive market. There are over 4,700 car dealers in the Australian market dealing in over 60 different marques with over 350 different models being sold. Competition primarily takes place in three market segments: the volume segment, the prestige segment and the luxury segment.
Table 5.7: Market segmentation in new car market, 2013
Volume Prestige LuxuryUnits sold 740,951 277,557 91,006% of units sold 67% 25% 8%Source: Federal Chamber of Automotive Industries (2014)
The volume segment of the market is by far the largest with 67 per cent of new cars sold in2013 being volume cars, followed by prestige with 25 per cent of new cars sold in 2013 being prestige cars and luxury with 8 per cent of new cars sold in 2013 being luxury cars (Table 1.1). This competition has had a number of implications for the market in recent years including forcing motor vehicle dealerships to change their existing business model and contributing to downward pressure on the prices of new vehicles in Australia. As a result of the decrease in prices of new cars and the recent increases in Australians’ disposable incomes, affordability of new cars has greatly increased. This increase in affordability of new cars is also likely to have put pressure on prices of used cars and will continue to do so. Concurrent to the increase in affordability of new cars, competition in the retail car market has also led to improvements in the specifications of Australian cars, elevating the standards of Australian cars above many comparable markets such as the UK, New Zealand and Japan.
Though it can appear that Australian car prices are much higher than car prices in similar markets, the magnitude of this price differential may not be that large. After taking into account relevant taxes and the higher specification of Australian cars, it appears that Australian car prices are, only to a limited extent, higher than prices in some other markets, and in some cases may be lower than in other markets.
The MVSA was introduced in Australia in 1989 to ensure common national motor vehicle standards and to restrict imports of used cars; the overarching intent of this piece of legislation was to improve safety and environmental outcomes for the Australian car fleet. It appears that the MVSA has to some degree been successful in achieving those outcomes as the Australian car fleet has been found to be safer and more modern than similar markets such as New Zealand38.
If the current restrictions on the large scale importation of used cars were removed, there would likely be some benefits to consumers; however, such a policy change would have implications for the current market structure including:
38 Newstead, S., Watson, L. and Cameron, M. (2013). Vehicle safety ratings estimated from police reported crash data: 2013 update: Australian and New Zealand crashes during 1987-2011.
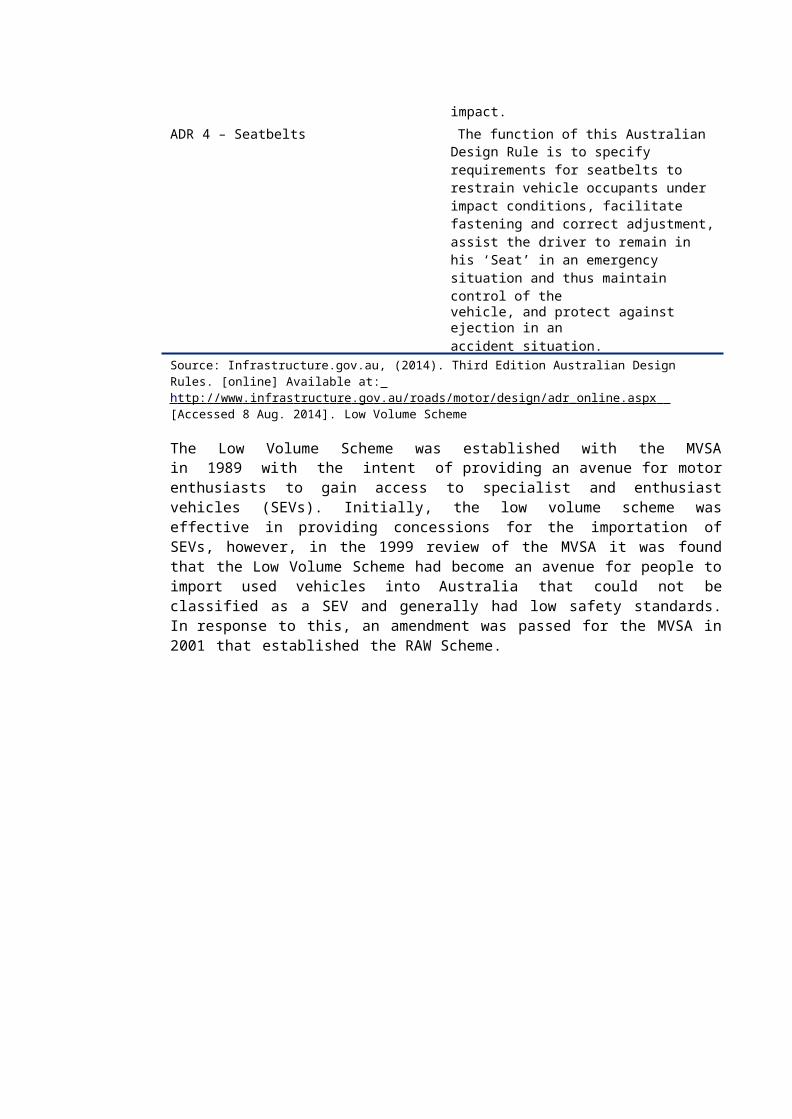
Industry Consumers
New car salesNear-new luxury car prices overseas are lower than comparable Australian cars. It is possible that there will be some substitution between new and used luxury cars in Australia; however, this is a small part of the market.Value of existing new stock will decrease as resale value of used cars decreases.Used car salesDealer network will require time to adapt to new sources of supply and adjust prices.Price of existing used car stock will decrease, devaluing existing stock.Recall managementDealers and manufacturers face brand risk if a robust recall management system is not in place for imported used cars.
BenefitsPrice of used cars will likely decrease and there may be an increase in the number of models and variants available.CostsLikely to be higher operating costs associated with imported used cars. Australian dealers have noted that this will be due to higher parts and servicing costs and higher insurance.The value of existing cars held byconsumers will fall.
Information asymmetriesInformation asymmetry may lead to consumers not making the best choice they can.Cognitive biasesConsumers, when facing complex decisions, make mental shortcuts and may base their decision on factors that they easily relate to. These could include factors such as make of car, or how expensive the same model is in Australia. If the specification is different this may not be the best choice for the consumer.
54
Motor vehicle dealerships would likely not benefit in the short term but are likely to adapt their business model in the long run to incorporate imported used cars.
Consumers would face issues of higher operating costs with imported used cars, and are likely to face adverse selection issues as a result of information asymmetries and cognitive bias.
Government would likely be required to implement a range of consumer protection processes. In addition to this may have an adverse impact on some policy outcomes such as improving safety outcomes of the Australian car fleet and ensuring environmental standards of Australian cars.
A summary of these implications is provided in Table 5.8.
Table 5.8 Summary of market implications of removing large scale used car import restrictions
Government
Consumer protection issuesThe recall system needs to be able to cope with an increased number of used imports. Additionally, Government may need to assess the adequacy of the current policy framework to deal with issues such as potential odometer fraud.Policy issuesFleet safety improvement – allowing large scale importation of used cars could increase the age of the fleet and slow the spread of safety technologies.Environmental protection – likely to be an increase in scrapped cars and possibility of imported cars not meeting emissions standardsImplementation, compliance and enforcement of new regulation may be difficult and costly for government.Fiscal costsThere may also be implications for luxury car tax and stamp duty revenues depending on the extent to which the policy change results in a decrease in car prices and the volume of new luxury cars sold.
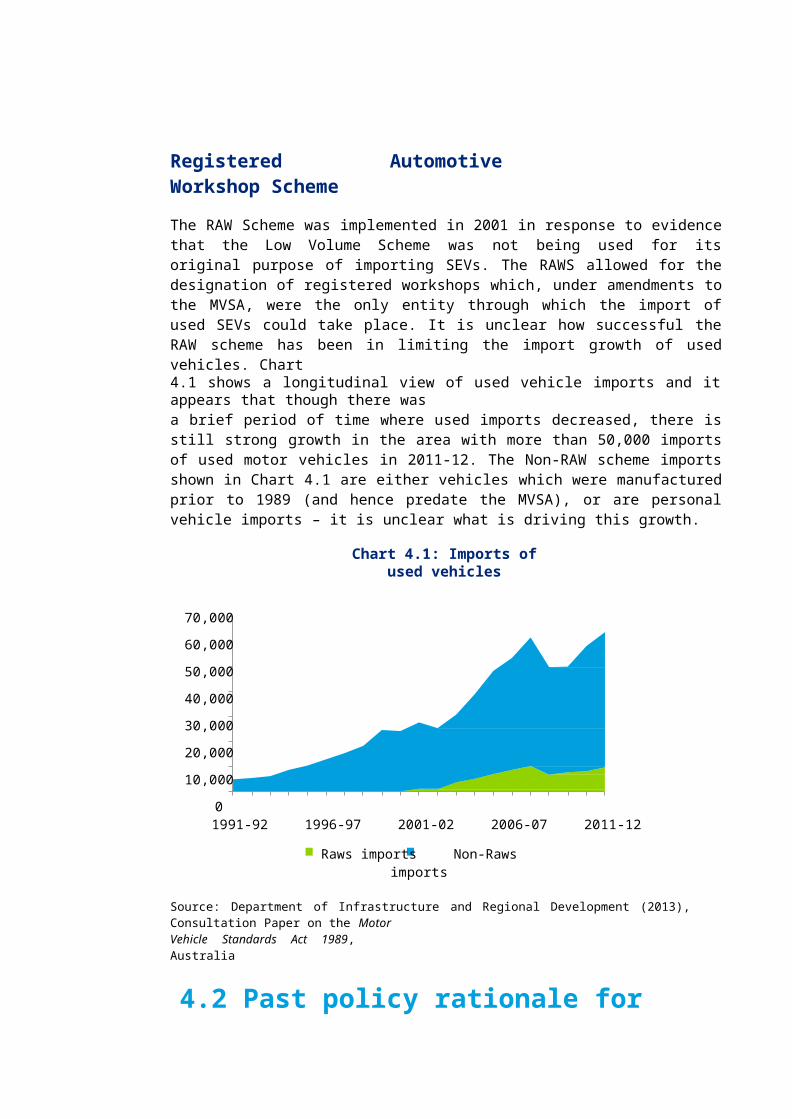
55
Appendix A– Further charts
Chart 5.4: Volume car segment - unit sales volumes
Toyota
Holden
Hyundai
Ford
Nissan
Mitsubishi
Kia
Suzuki
Isuzu UTE
Renault
Great Wall
Skoda
Ssangyong
Chery
Proton
Daihatsu
Daewoo
Marque
2013
2004
0 50,000 100,000 150,000 200,000 250,000
Source: FCAI

Chart 5.5: Prestige car segment - unit sales volumes
Mazda Volkswagen
Subaru Honda
JeepPeugeot
Fiat Chrysler
Alfa Romeo Dodge
Opel Citroen
Smart Saab
MG RoverMarque
2013
2004
0 20,000 40,000 60,000 80,000 100,000 120,000
Source: FCAI
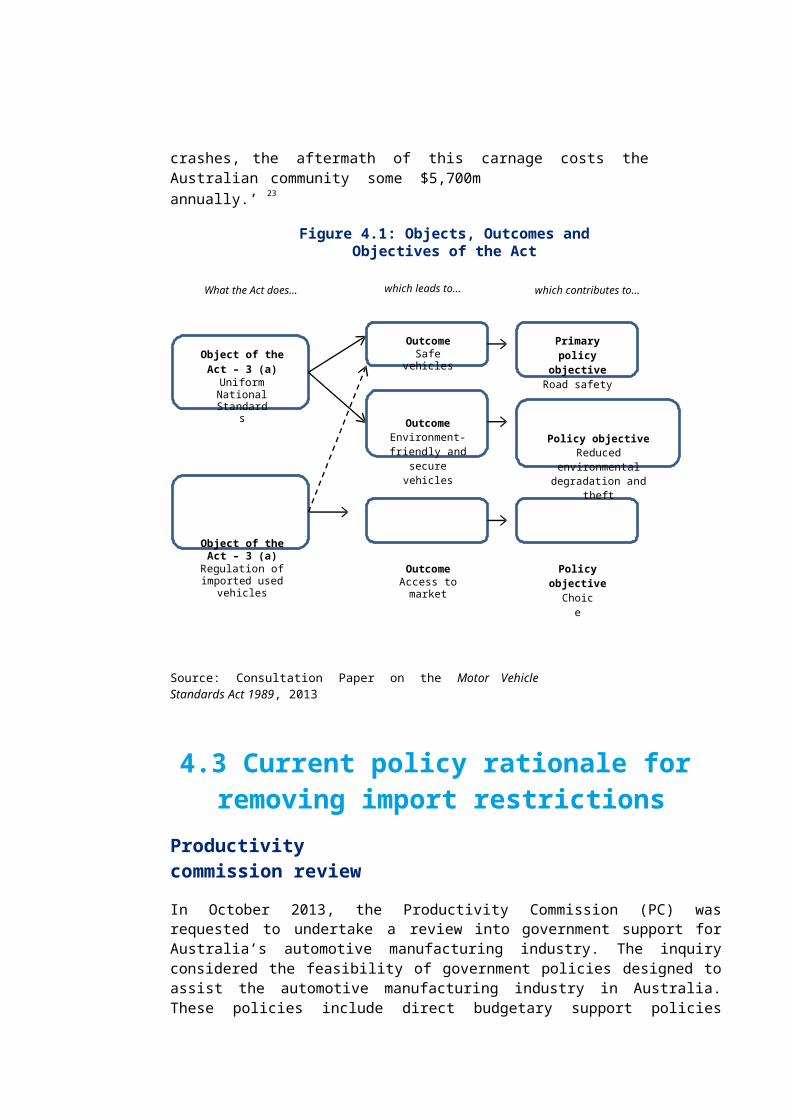
Chart 5.6: Luxury car segment - unit sales volumes
Mercedes-Benz BMW Audi
Land Rover Lexus
Volvo Car MINI
Porsche Jaguar Infiniti
Maserati Bentley Ferrari
Aston Martin Rolls-Royce
Morgan McLaren
Maybach Lotus
LamborghiniHummer
2013
2004
0 5,000 10,000 15,000 20,000 25,000 30,000
Source: FCAI
Limitation of our workGeneral use restriction
This report is prepared solely for the use of the National Mercedes Benz Dealer Council. This report is not intended to and should not be used or relied upon by anyone else and we accept no duty of care to any other person or entity. The report has been prepared for the purpose set out in our engagement letter dated 3 June 2014. You should not refer to or use our name or the advice for any other purpose.
Contact usDeloitte Touche TohmatsuACN: 149 633 116
550 Bourke StreetMelbourne Victoria 3000Australia
Tel: +61 2 9671 7000
www . d e l o i t t e . c o m . au
About Deloitte
Deloitte provides audit, tax, consulting, and financial advisory services to public and private clients spanning multiple industries. With a globally connected network of member firms in more than 150 countries, Deloitte brings world- class capabilities and deep local expertise to help clients succeed wherever they operate. Deloitte's approximately 170,000 professionals are committed to becoming the standard of excellence.
About Deloitte Australia
In Australia, the member firm is the Australian partnership of Deloitte Touche Tohmatsu. As one of Australia’s leading professional services firms.Deloitte Touche Tohmatsu and its affiliates provide audit, tax, consulting, and financial advisory services through approximately 5,400 peopleacross the country. Focused on the creation of value and growth, and known as an employer of choice for innovative human resources programs, we are dedicated to helping our clients and our people excel. For more information, please visit our web site at ww w . d e l o i tt e . co m . a u .
Liability limited by a scheme approved underProfessional Standards Legislation.
Member of Deloitte Touche Tohmatsu Limited
© 2014 Deloitte Touche Tohmatsu