IBISWorld Industry Report 53112 Commercial...
40
IBISWorld Industry Report 53112 Commercial Leasing in the US June2011 RobertJ.Andrews New lease on growth: Vacancies will slowly fill as consumer spending and corporate profit return 2 AboutthisIndustry 2 Industry Definition 2 Main Activities 2 Similar Industries 3 Additional Resources 4 IndustryataGlance 5 IndustryPerformance 5 Executive Summary 5 Key External Drivers 6 Current Performance 9 Industry Outlook 12 Industry Life Cycle 14 Products&Markets 14 Supply Chain 14 Products & Services 15 Demand Determinants 16 Major Markets 18 International Trade 19 Business Locations 21 CompetitiveLandscape 21 Market Share Concentration 21 Key Success Factors 22 Cost Structure Benchmarks 24 Basis of Competition 24 Barriers to Entry 25 Industry Globalization 26 MajorCompanies 26 Simon Property Group Inc. 27 General Growth Properties Inc. 29 Vornado Realty Trust 30 Brookfield Properties Corporation 33 OperatingConditions 33 Capital Intensity 34 Technology & Systems 34 Revenue Volatility 35 Regulation & Policy 36 Industry Assistance 37 KeyStatistics 37 Industry Data 37 Annual Change 37 Key Ratios 38 Jargon&Glossary www.ibisworld.com|1-800-330-3772 | info @ ibisworld.com
Transcript of IBISWorld Industry Report 53112 Commercial...
WWW.IBISWORLD.COM� Commercial�Leasing�in�the�US June 2011 1
IBISWorld Industry Report 53112Commercial Leasing in the USJune�2011� Robert�J.�Andrews
New lease on growth: Vacancies will slowly fill as consumer spending and corporate profit return
2� About�this�Industry2 Industry Definition
2 Main Activities
2 Similar Industries
3 Additional Resources
4� Industry�at�a�Glance
5� Industry�Performance5 Executive Summary
5 Key External Drivers
6 Current Performance
9 Industry Outlook
12 Industry Life Cycle
14� Products�&�Markets14 Supply Chain
14 Products & Services
15 Demand Determinants
16 Major Markets
18 International Trade
19 Business Locations
21� Competitive�Landscape21 Market Share Concentration
21 Key Success Factors
22 Cost Structure Benchmarks
24 Basis of Competition
24 Barriers to Entry
25 Industry Globalization
26� Major�Companies26 Simon Property Group Inc.
27 General Growth Properties Inc.
29 Vornado Realty Trust
30 Brookfield Properties Corporation
33� Operating�Conditions33 Capital Intensity
34 Technology & Systems
34 Revenue Volatility
35 Regulation & Policy
36 Industry Assistance
37� Key�Statistics37 Industry Data
37 Annual Change
37 Key Ratios
38� Jargon�&�Glossary
www.ibisworld.com��|��1-800-330-3772��| ��[email protected]

WWW.IBISWORLD.COM� Commercial�Leasing�in�the�US June 2011 2
Operators within this industry act as lessors of buildings that are not used as residences or dwellings. Industry participants include owner-lessors of nonresidential buildings; establishments that rent real estate and
then act as lessors in subleasing it to others; and establishments that provide full service office space. The industry does not include general warehousing and storage companies, such as self-storage businesses.
The�primary�activities�of�this�industry�are
Renting or leasing office property
Renting or leasing retail property
Renting or leasing industrial property
Renting or leasing arena, convention or stadium property
49311 Public�Storage�&�Warehousing�in�the�USClassifies establishments that primarily operate merchandise warehousing and storage facilities. These establishments generally hand goods in containers, such as boxes, barrels and drums.
53111 Apartment�Rental�in�the�USClassifies establishments that primarily act as lessors of buildings used as residences or dwellings.
53113 Storage�&�Warehouse�Leasing�in�the�USClassifies establishments primarily engaged in renting or leasing space for self-storage.
53119 Mobile�Home�Site�&�Other�Leasing�in�the�USContains establishments that primarily act as lessors of non-fixed structure real estate properties (i.e. not buildings), including manufactured home (i.e. mobile home) sites and vacant lots.
53131 Property�Management�in�the�USClassifies establishments that primarily act as managers of real estate property that is owned by others.
71133 Concert�&�Event�Promotion�in�the�USClassifies establishments that are primarily engaged in organizing, promoting and/or managing live performance and sporting events. Industry participants also manage and operate theaters and stadiums.
Industry�Definition
Main�Activities�
Similar�Industries
About�this�Industry
The�major�products�and�services�in�this�industry�are
Gross rent – industrial buildings
Gross rent – office buildings
Gross rent – other non-residential properties
Gross rent – retail buildings
Net gains and losses from real property sales
Property management fees
Real estate brokerage fees and commissions
WWW.IBISWORLD.COM� Commercial�Leasing�in�the�US June 2011 3
About�this�Industry
For�additional�information�on�this�industry
www.aaspo.org�American Association of Small Property Owners
www.bls.gov�Bureau of Labor Statistics
www.federalreserve.gov�The Federal Reserve
www.reit.com�The National Association of Real Estate Investment Trusts (NAREIT)
www.census.gov�US Census Bureau
Additional�Resources
�IBISWorld writes over 700 US industry reports that are updated up to four times a year. To see all reports, go to www.ibisworld.com

WWW.IBISWORLD.COM� Commercial�Leasing�in�the�US June 2011 4
% c
hang
e
30
−20
−10
0
10
20
1705 07 09 11 13 15Year
Corporate profit
SOURCE: WWW.IBISWORLD.COM
% c
hang
e
10
−10
−5
0
5
1703 05 07 09 11 13 15Year
Revenue Employment
Revenue vs. employment growth
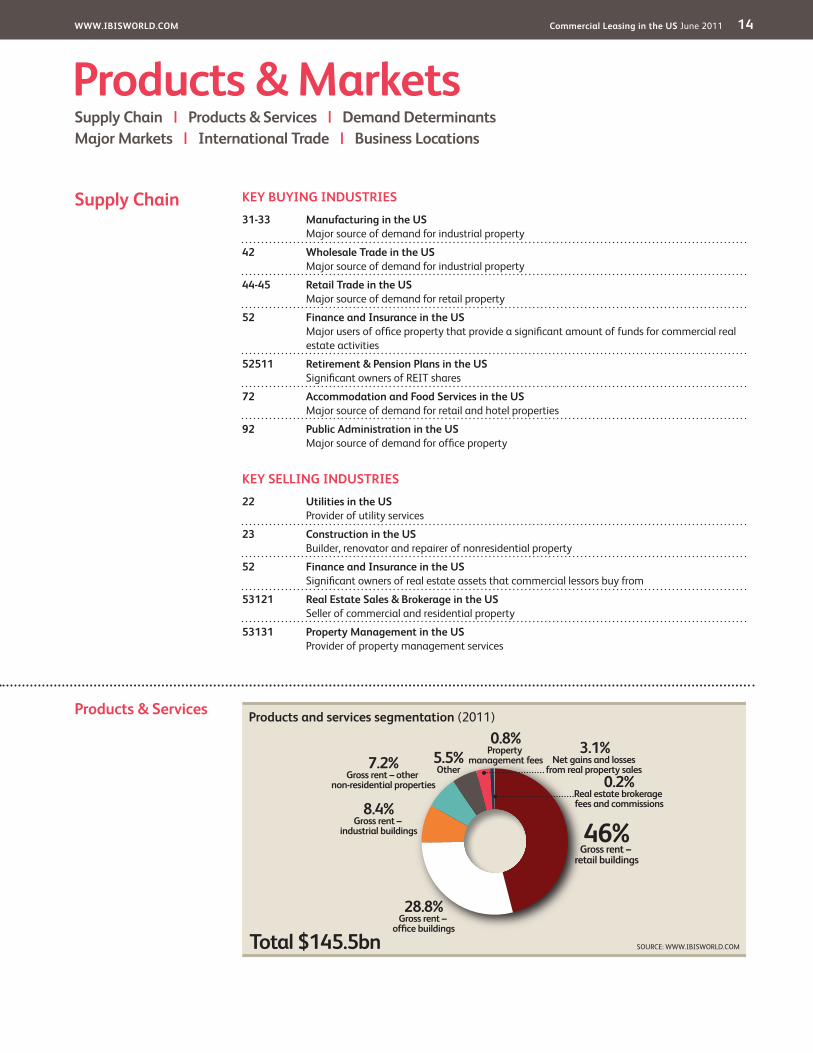
Products and services segmentation (2011)
46%Gross rent –
retail buildings
3.1%Net gains and losses
from real property sales
28.8%Gross rent –
office buildings
0.8%Property
management fees
0.2%Real estate brokerage fees and commissions
8.4%Gross rent –
industrial buildings
7.2%Gross rent – other
non-residential properties
5.5%Other
SOURCE: WWW.IBISWORLD.COM
Key�Statistics�Snapshot
Industry�at�a�GlanceCommercial�Leasing�in�2011
Industry�Structure Life Cycle Stage Mature
Revenue Volatility Medium
Capital Intensity High
Industry Assistance Low
Concentration Level Low
Regulation Level Medium
Technology Change Medium
Barriers to Entry Low
Industry Globalization Low
Competition Level High
Revenue
$145.5bnProfit
$62.6bnWages
$14.8bnBusinesses
214,806
Annual�Growth�11-16
4.8%Annual�Growth�06-11
-3.2%
Key�External�DriversCorporate�profitYield�on�10-year�Treasury�bondNumber�of�businessesNational�unemployment�ratePer�capita�disposable�income
Market�ShareSimon Property Group Inc. 3.0%
General Growth Properties Inc. 2.3%
Vornado Realty Trust 2.2%
p. 26
p. 5
FOR ADDITIONAL STATISTICS AND TIME SERIES SEE THE APPENDIX ON PAGE 37
SOURCE: WWW.IBISWORLD.COM
WWW.IBISWORLD.COM� Commercial�Leasing�in�the�US June 2011 5
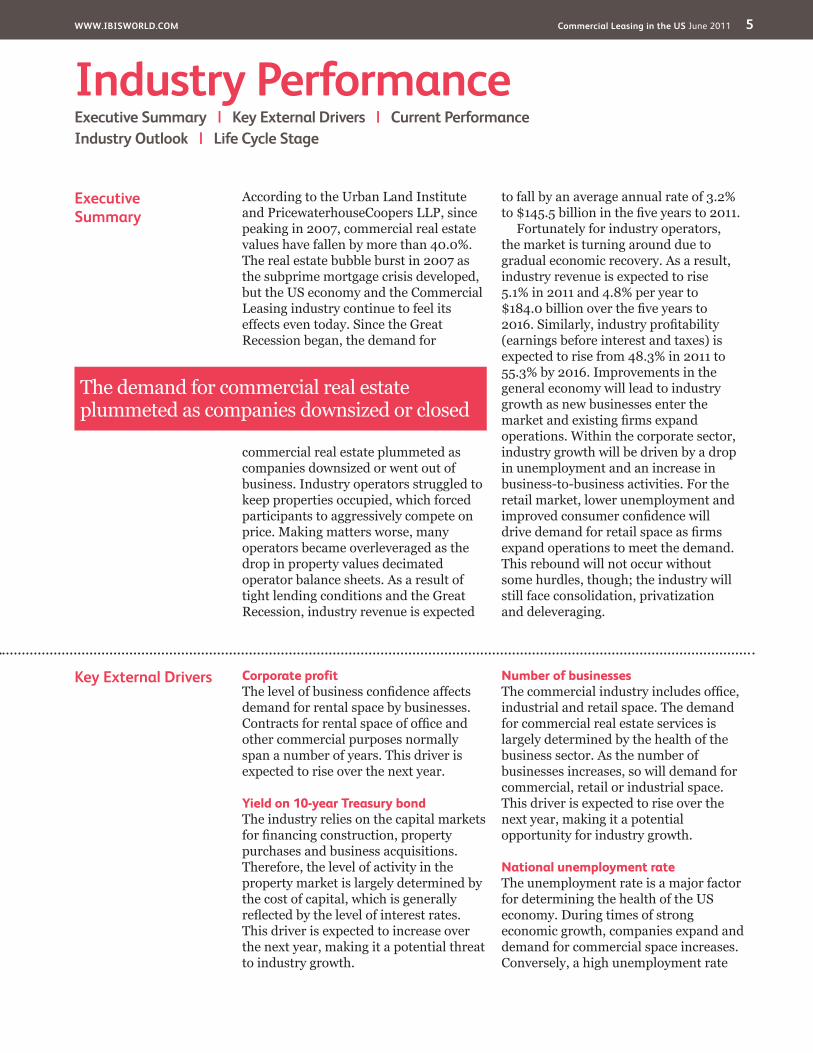
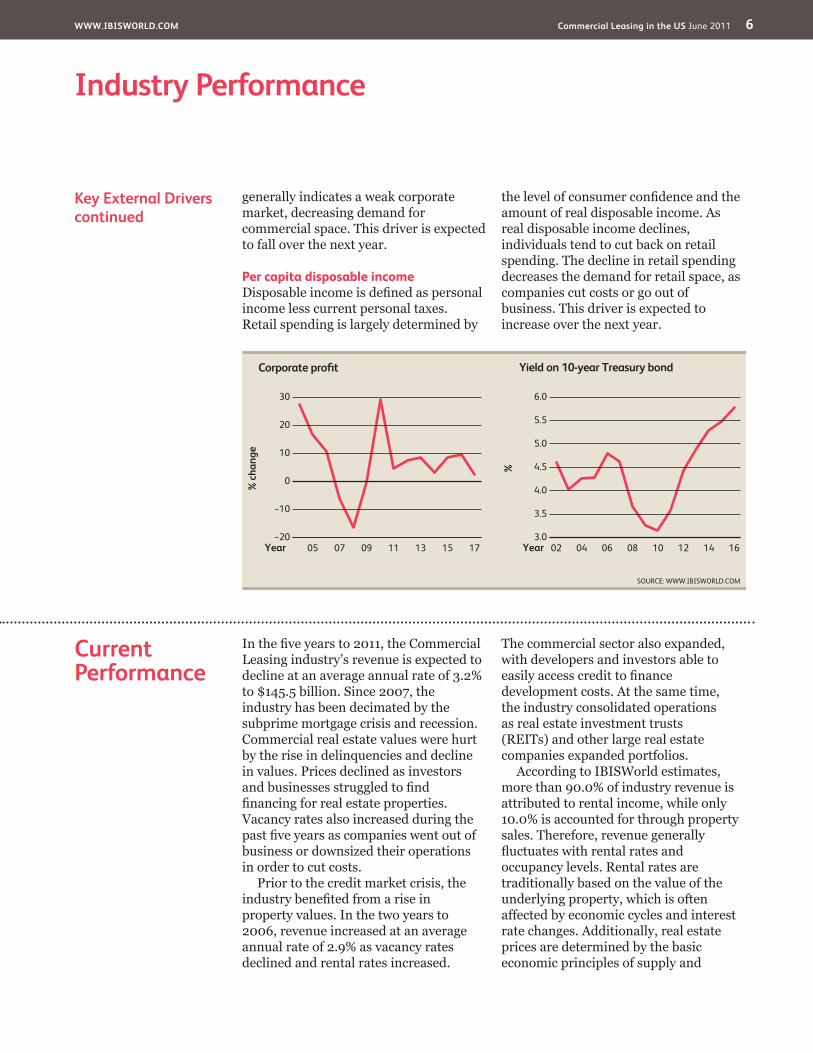
Key�External�Drivers Corporate profitThe level of business confidence affects demand for rental space by businesses. Contracts for rental space of office and other commercial purposes normally span a number of years. This driver is expected to rise over the next year.
Yield on 10-year Treasury bondThe industry relies on the capital markets for financing construction, property purchases and business acquisitions. Therefore, the level of activity in the property market is largely determined by the cost of capital, which is generally reflected by the level of interest rates. This driver is expected to increase over the next year, making it a potential threat to industry growth.
Number of businessesThe commercial industry includes office, industrial and retail space. The demand for commercial real estate services is largely determined by the health of the business sector. As the number of businesses increases, so will demand for commercial, retail or industrial space. This driver is expected to rise over the next year, making it a potential opportunity for industry growth.
National unemployment rateThe unemployment rate is a major factor for determining the health of the US economy. During times of strong economic growth, companies expand and demand for commercial space increases. Conversely, a high unemployment rate
Executive�Summary
According to the Urban Land Institute and PricewaterhouseCoopers LLP, since peaking in 2007, commercial real estate values have fallen by more than 40.0%. The real estate bubble burst in 2007 as the subprime mortgage crisis developed, but the US economy and the Commercial Leasing industry continue to feel its effects even today. Since the Great Recession began, the demand for
commercial real estate plummeted as companies downsized or went out of business. Industry operators struggled to keep properties occupied, which forced participants to aggressively compete on price. Making matters worse, many operators became overleveraged as the drop in property values decimated operator balance sheets. As a result of tight lending conditions and the Great Recession, industry revenue is expected
to fall by an average annual rate of 3.2% to $145.5 billion in the five years to 2011.
Fortunately for industry operators, the market is turning around due to gradual economic recovery. As a result, industry revenue is expected to rise 5.1% in 2011 and 4.8% per year to $184.0 billion over the five years to 2016. Similarly, industry profitability (earnings before interest and taxes) is expected to rise from 48.3% in 2011 to 55.3% by 2016. Improvements in the general economy will lead to industry growth as new businesses enter the market and existing firms expand operations. Within the corporate sector, industry growth will be driven by a drop in unemployment and an increase in business-to-business activities. For the retail market, lower unemployment and improved consumer confidence will drive demand for retail space as firms expand operations to meet the demand. This rebound will not occur without some hurdles, though; the industry will still face consolidation, privatization and deleveraging.
Industry�PerformanceExecutive�Summary�� |�� Key�External�Drivers�� |�� Current�PerformanceIndustry�Outlook�� |�� Life�Cycle�Stage
� The demand for commercial real estate plummeted as companies downsized or closed
WWW.IBISWORLD.COM� Commercial�Leasing�in�the�US June 2011 6
Industry�Performance
Current�Performance
In the five years to 2011, the Commercial Leasing industry’s revenue is expected to decline at an average annual rate of 3.2% to $145.5 billion. Since 2007, the industry has been decimated by the subprime mortgage crisis and recession. Commercial real estate values were hurt by the rise in delinquencies and decline in values. Prices declined as investors and businesses struggled to find financing for real estate properties. Vacancy rates also increased during the past five years as companies went out of business or downsized their operations in order to cut costs.
Prior to the credit market crisis, the industry benefited from a rise in property values. In the two years to 2006, revenue increased at an average annual rate of 2.9% as vacancy rates declined and rental rates increased.
The commercial sector also expanded, with developers and investors able to easily access credit to finance development costs. At the same time, the industry consolidated operations as real estate investment trusts (REITs) and other large real estate companies expanded portfolios.
According to IBISWorld estimates, more than 90.0% of industry revenue is attributed to rental income, while only 10.0% is accounted for through property sales. Therefore, revenue generally fluctuates with rental rates and occupancy levels. Rental rates are traditionally based on the value of the underlying property, which is often affected by economic cycles and interest rate changes. Additionally, real estate prices are determined by the basic economic principles of supply and
Key�External�Driverscontinued
generally indicates a weak corporate market, decreasing demand for commercial space. This driver is expected to fall over the next year.
Per capita disposable incomeDisposable income is defined as personal income less current personal taxes. Retail spending is largely determined by
the level of consumer confidence and the amount of real disposable income. As real disposable income declines, individuals tend to cut back on retail spending. The decline in retail spending decreases the demand for retail space, as companies cut costs or go out of business. This driver is expected to increase over the next year.
%
6.0
3.0
3.5
4.0
4.5
5.0
5.5
1602 04 06 08 10 12 14Year
Yield on 10-year Treasury bond
SOURCE: WWW.IBISWORLD.COM
% c
hang
e
30
−20
−10
0
10
20
1705 07 09 11 13 15Year
Corporate profit
WWW.IBISWORLD.COM� Commercial�Leasing�in�the�US June 2011 7
Industry�Performance
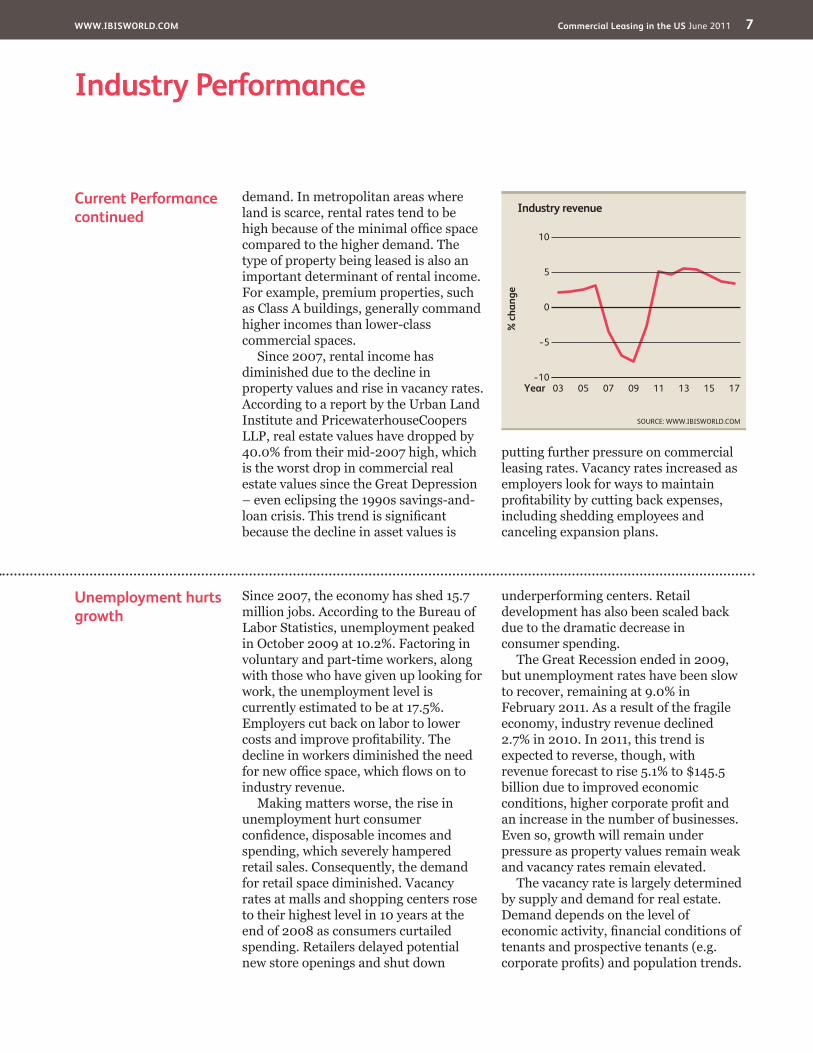
Current�Performancecontinued
demand. In metropolitan areas where land is scarce, rental rates tend to be high because of the minimal office space compared to the higher demand. The type of property being leased is also an important determinant of rental income. For example, premium properties, such as Class A buildings, generally command higher incomes than lower-class commercial spaces.
Since 2007, rental income has diminished due to the decline in property values and rise in vacancy rates. According to a report by the Urban Land Institute and PricewaterhouseCoopers LLP, real estate values have dropped by 40.0% from their mid-2007 high, which is the worst drop in commercial real estate values since the Great Depression – even eclipsing the 1990s savings-and-loan crisis. This trend is significant because the decline in asset values is
putting further pressure on commercial leasing rates. Vacancy rates increased as employers look for ways to maintain profitability by cutting back expenses, including shedding employees and canceling expansion plans.
Unemployment�hurts�growth
Since 2007, the economy has shed 15.7 million jobs. According to the Bureau of Labor Statistics, unemployment peaked in October 2009 at 10.2%. Factoring in voluntary and part-time workers, along with those who have given up looking for work, the unemployment level is currently estimated to be at 17.5%. Employers cut back on labor to lower costs and improve profitability. The decline in workers diminished the need for new office space, which flows on to industry revenue.
Making matters worse, the rise in unemployment hurt consumer confidence, disposable incomes and spending, which severely hampered retail sales. Consequently, the demand for retail space diminished. Vacancy rates at malls and shopping centers rose to their highest level in 10 years at the end of 2008 as consumers curtailed spending. Retailers delayed potential new store openings and shut down
underperforming centers. Retail development has also been scaled back due to the dramatic decrease in consumer spending.
The Great Recession ended in 2009, but unemployment rates have been slow to recover, remaining at 9.0% in February 2011. As a result of the fragile economy, industry revenue declined 2.7% in 2010. In 2011, this trend is expected to reverse, though, with revenue forecast to rise 5.1% to $145.5 billion due to improved economic conditions, higher corporate profit and an increase in the number of businesses. Even so, growth will remain under pressure as property values remain weak and vacancy rates remain elevated.
The vacancy rate is largely determined by supply and demand for real estate. Demand depends on the level of economic activity, financial conditions of tenants and prospective tenants (e.g. corporate profits) and population trends.
% c
hang
e
10
−10
−5
0
5
1703 05 07 09 11 13 15Year
Industry revenue
SOURCE: WWW.IBISWORLD.COM

WWW.IBISWORLD.COM� Commercial�Leasing�in�the�US June 2011 8
Industry�Performance
Unemployment�hurts�growthcontinued
Supply trends tend to lag behind demand because of the forecasting and planning involved in property construction. While slowing economic growth is reducing the demand for space, the continuing supply of new buildings on the market is contributing to the rising vacancy rate. As a result, the national office vacancy rate has steadily
risen since the Great Recession began in 2008, with current estimates totaling 16.6% as of September 2010, up from 10.6% in 2007, according to CBRE Econometric Advisors (CBRE-EA). Similarly, the industrial availability rate totaled 14.0% in September 2010, while retail availability totaled 13.2%, according to CBRE-EA.
Low�demand�hits�industrial�sector
The levels of imports and exports have significant bearing on industrial vacancy rates. The drop in consumer spending has lowered demand for imports. In addition, companies have reduced inventory in an attempt to cut overhead and operational costs. The decline in consumer demand and the drop in inventory have decreased the need for warehouse and distribution space. Additionally, apart from being decimated by the economic downturn, the US manufacturing sector has continued to move its operations to low-cost offshore destinations in China and India.
Meanwhile, the automotive sector is going through a downturn and
restructuring program. General Motors and Chrysler announced plans to downsize their operations and sell off brands in an attempt to cut costs and improve profitability after filing for bankruptcy in 2009. Consequently, both companies have closed several major plants, and areas like Detroit have experienced significant declines in the demand for commercial property.
Profit,�participation�dwindle
The industry’s profitability (earnings before interest and taxes) has diminished in the five years to 2011, falling from 55.7% in 2006 to an estimated 48.3% in 2011. The Great Recession and the real estate market collapse decimated profit margins as higher vacancy rates and lower demand forced operators to aggressively compete on price. Industry margins were also hampered by higher financing costs, particularly in the two years to 2009.
During this period, financing costs increased because banks and other financial institutions were reluctant to take risks after suffering massive losses from write downs and defaults due to
the subprime mortgage crisis. As a result, interest rates rose, which increased capital costs for industry operators. This trend reversed as the credit crisis softened in 2009, though, allowing industry operators to benefit from lower rates, particularly toward the end of 2009 and throughout most of 2010. As a result, margins have slowly rebounded from cyclical lows in 2009.
In addition to profit margins, the industry’s size has also dwindled. The industry has consolidated over the five years to 2011, with the number of enterprises decreasing at an estimated 3.7% per year to 214,806, while employment dropped by 2.7% per year
� Demand for retail buildings fell as consumers cut back on their retail spending
WWW.IBISWORLD.COM� Commercial�Leasing�in�the�US June 2011 9
Industry�Performance
Profit,�participation�dwindlecontinued
to 361,950 people. Prior to the recession, REITs aggressively expanded their real estate portfolios by leveraging assets and issuing equity. At the same time, smaller companies looked to reduce risk by diversifying operations. These entities diversified their businesses by expanding operations beyond their traditional regional markets through
corporate acquisitions and property purchases. Larger firms are generally able to raise capital more efficiently then smaller independently owned businesses. As a result, industry operators consolidated in order to improve their ability to raise capital, particularly as the credit markets tightened between 2008 and 2010.
Industry�Outlook
The US Commercial Leasing industry is expected to continue to expand throughout 2012, when revenue is forecast to rise by about 4.7% to $152.3 billion. During the year, industry operators will benefit from improvements in the general economy as unemployment falls and the need for space begins to rise. As the economy continues to recover and businesses and retailers expand operations, the demand for commercial leasing will grow steadily. Overall, industry revenue is projected to rise at an average annual rate of 4.8% to $184.0 billion in the five years to 2016. In addition to revenue, industry earnings before interest and taxes are forecast to rise from 48.3% in 2011 to 55.3% in 2016, driven by lower vacancy rates and higher rental prices.
Because the need for commercial space is generally aligned with business growth and corporate expansions, industry growth will be driven by the general economic recovery. At the same
time, industry operators are expected to benefit from improvements in lending conditions and consolidation activity that occurred in the five years to 2011. During that period, well-capitalized operators were often able to purchase properties below-market values as banks and competitors desperately tried to unload real estate assets to generate capital. Meanwhile, tight lending conditions forced many operators to consolidate with larger better-capitalized firms. Making matters worse, the real estate market also became oversaturated and overbuilt, which further added to the supply of real estate properties that were already available for sale.
Expansion�on�the�horizon
As a result of these factors, in the three years to 2011, the number of firms diminished, revenue growth stalled and profit margins fell. Despite the overall drop in industry growth, these factors are expected to be major drivers of industry growth and improved profitability over the five years to 2016. Distressed assets, bankruptcies and
overbuilding allowed well-capitalized operators to acquire assets at below-market values. Consequently, as the market recovers, vacancy rates will fall and asset values will improve.
The industry underwent consolidation over the three years to 2011, but this trend is expected to reverse over the next five years. During this period, the number
� The economic recovery will let companies resume expansion plans, boosting industry demand
WWW.IBISWORLD.COM� Commercial�Leasing�in�the�US June 2011 10
Industry�Performance
Expansion�on�the�horizoncontinued
of enterprises is forecast to rise at an average annual rate of 3.5% to 255,080 in 2016, while employment is projected to increase 2.5% annually to 410,252 people. The growth in industry operators and employees will be supported by improved profit margins and increased demand for commercial leasing. Larger operators, however, are anticipated to
benefit the most from these factors because these firms are able to capitalize on distressed purchases and other below-market sales that occurred in the three years to 2011. Consequently, the number of firms is not expected to increase at the same rate as industry revenue due to accelerated growth from larger operators.
Trends�come�and�go Despite solid growth over the next five years, there are several factors that will have gradual but adverse effects on commercial leasing demand, including more people working from home, office sharing and reductions in office space per employee. In a period of slower economic growth (when business confidence tends to be low), firms are more likely to closely examine their office space requirements. Large corporations, such as banks and business service firms, are engaging facilities managers to increase efficiency in the use of their owned and leased property portfolios. There has also been a transfer of back-office functions, including call center, processing and software development activities, to low labor-cost countries, such as India.
Growth in direct ordering (telephone and internet shopping) will also have an adverse effect on demand for retail tenancies, such as video rental stores. The internet and broadband will also provide opportunities for productivity gains in the office sector. There will be greater opportunities for working from home, which could negatively affect demand for office space. E-commerce is expected to improve supply chain management and reduce inventory requirements, which may reduce some warehousing space needs; although internet shopping has special warehousing needs. The grocery store environment is changing constantly, and increased competition from supercenters
like Walmart and industry consolidation could result in grocery store closings.
Among tenants, there is a growing awareness of the costs and risks associated with property leasing. In some market segments, there is growing demand for shorter leases and more tenants are looking to advisors when negotiating leases. Over the next five years, tenants will seek more flexible arrangements from lessors; if the tenants are successful, this would increase property owners’ risks.
The industry is also expected to be more conservative in terms of managing debt and leveraging assets. The fallout from the subprime crisis was a reminder of the importance of maintaining a strong balance sheet. The decrease in leveraging is expected to reduce risk, but it will also lower returns.
Other trends over the next five years include greater demand for lifestyle centers and Leadership in Energy and Environmental Design-certified (LEED-certified) buildings. And with the baby-boomer generation retiring, many individuals are demanding that retail centers transition from traditional
� The growth of online shopping will dampen demand for brick-and-mortar retail tenancies

WWW.IBISWORLD.COM� Commercial�Leasing�in�the�US June 2011 11
Industry�Performance
Trends�come�and�gocontinued
shopping-oriented plazas into destination and leisure-centric places. The demand for mixed-use properties where retail,
residential and commercial space reside under one development has been on the rise and will continue.

WWW.IBISWORLD.COM� Commercial�Leasing�in�the�US June 2011 12
Industry�PerformanceIndustry performance is highly dependent on underlying economic growth
There is no appreciable increase in the number of players entering the industry
New product offerings do not significantly increase industry growth
Life�Cycle�Stage
SOURCE: WWW.IBISWORLD.COM
30
25
20
15
10
5
0
–5
–10–10 100 20–5 155 25 30
%�G
row
th�o
f�pro
fi�t/G
DP
%�Growth�of�establishments
DeclineCrash or Grow?
Potential�Hidden�GemsFuture Industries
Quality�GrowthHigh growth in economic importance; weaker companies close down; developed technology and markets
Time�WastersHobby Industries
MaturityCompany consolidation;level of economic importance stable
Shake-out
Shake-out
Quantity�GrowthMany new companies; minor growth in economic importance; substantial technology change
Key�Features�of�a�Mature�Industry
Revenue grows at same pace as economyCompany numbers stabilize; M&A stageEstablished technology & processesTotal market acceptance of product & brandRationalization of low margin products & brands
Public�Storage�&�Warehousing
Apartment�RentalStorage�&�Warehouse�Leasing
Real�Estate�Sales�&�Brokerage
Mobile�Home�Site�&�Other�LeasingCommercial�Leasing
WWW.IBISWORLD.COM� Commercial�Leasing�in�the�US June 2011 13
Industry�Performance
Industry�Life�Cycle The Commercial Leasing industry value-added is expected to increase by about 0.6% annually in the 10 years to 2016. In comparison, US GDP is forecast to rise at an average annual rate of about 2.0% over this same period, according to IBISWorld estimates and the Bureau of Economic Analysis data. As a result, the industry is considered to still be in the mature phase of its life cycle. An industry’s life cycle measures the development phase of an industry, with growth categorized by a 10-year period in which industry revenue growth outpaces US economic activity or Real GDP. In contrast, a decline phase occurs when industry revenue declines or grows slower than real GDP, while a mature phase occurs when changes in industry revenue generally mirror total economic output over a 10-year period. In the five years to 2011, US GDP has far outpaced industry revenue, as GDP is forecast to rise by an annual rate of 1.0%, while revenue is expected to decline by 3.2%. However, this recent fall does not signal an industry in a decline cycle, as revenue is expected to rebound in the five years to 2016. Over the next five years, industry revenue is forecast to increase by about 4.8% annually.
The industry is cyclical in nature, with troughs experienced in the early 1990s, and to a lesser extent again in 2001 and 2002 related to the dot-com bust. The major players within the industry are all REIT companies and trusts. Over the 1990s the popularity of REITs grew and by 2002 there were more than 300 REITs listed on public stock exchanges. REITs gained in popularity during this period due to the regulatory changes that allowed REITs to manage their own properties directly. New regulatory adjustments also allowed pension funds to invest in REITs, which was previously not allowed. Despite the rise in popularity of the REIT investment
vehicles, the industry has not changed drastically over the last five years.
Prior to the recession, REITs aggressively expanded their real estate portfolios by leveraging assets and issuing equity. At the same time, smaller companies looked to reduce risk by diversifying operations. These entities diversified their businesses by expanding operations beyond their traditional regional market through corporate acquisitions and property purchases. In addition, larger firms are generally able to raise capital more efficiently then smaller independently owned businesses. As a result, industry participants also consolidated operations in an attempt to improve their ability to raise capital.
Generally, new innovations tend to generate opportunities for industry growth, but this is not expected to push the industry into a growth phase in the future. In the 1970s, the industry grew significantly due to the introduction of suburban shopping centers. More recently, industry innovations such as green buildings (LEED Certified) and open aired shopping and lifestyle centers have emerged as new types of real estate developments, but these are not expected to drastically increase industry growth.
Other advances such as interactive communication technologies (refer to Technology and Systems) may have an adverse effect on the future of tenant demand, as these systems improve the employees’ abilities to effectively work from home. Other internet services and e-commerce websites may also cut down on the demand for retail shopping centers, as individuals increasingly look to the internet to fulfill their shopping needs. On the other hand, certain types of property may benefit from these trends (e.g. broadband-enabled shopping centers and some types of warehouse property).
�This industry is Mature
WWW.IBISWORLD.COM� Commercial�Leasing�in�the�US June 2011 14
Products�&�Services
�Products�&�MarketsSupply�Chain�� |�� Products�&�Services�� |�� Demand�DeterminantsMajor�Markets�� |�� International�Trade�� |�� Business�Locations
KEY�BUYING�INDUSTRIES
31-33� Manufacturing�in�the�US�Major source of demand for industrial property
42� Wholesale�Trade�in�the�US�Major source of demand for industrial property
44-45� Retail�Trade�in�the�US�Major source of demand for retail property
52� Finance�and�Insurance�in�the�US�Major users of office property that provide a significant amount of funds for commercial real estate activities
52511� Retirement�&�Pension�Plans�in�the�US�Significant owners of REIT shares
72� Accommodation�and�Food�Services�in�the�US�Major source of demand for retail and hotel properties
92� Public�Administration�in�the�US�Major source of demand for office property
KEY�SELLING�INDUSTRIES
22� Utilities�in�the�US�Provider of utility services
23� Construction�in�the�US�Builder, renovator and repairer of nonresidential property
52� Finance�and�Insurance�in�the�US�Significant owners of real estate assets that commercial lessors buy from
53121� Real�Estate�Sales�&�Brokerage�in�the�US�Seller of commercial and residential property
53131� Property�Management�in�the�US�Provider of property management services
Supply�Chain
Products and services segmentation (2011)
Total $145.5bn
46%Gross rent –
retail buildings
3.1%Net gains and losses
from real property sales
28.8%Gross rent –
office buildings
0.8%Property
management fees
0.2%Real estate brokerage fees and commissions8.4%
Gross rent – industrial buildings
7.2%Gross rent – other
non-residential properties
5.5%Other
SOURCE: WWW.IBISWORLD.COM

WWW.IBISWORLD.COM� Commercial�Leasing�in�the�US June 2011 15
Products�&�Markets
DemandDeterminants
The demand for commercial real estate by tenants and investors is largely dependent on the health of the general economy, as the demand for real estate rises with corporate expansion. Additionally, consumer spending indirectly influences industry demand, as retailers and manufacturers cater services to this segment. Overall, the demand for the commercial sector can be divided into three distinct groups: office, retail and industrial.
Office sectorThe demand for office space is largely determined by general economic cycles, as business expansion traditionally coincides with strong market growth. The office segment is comprised of a variety of different industries and segments, including finance,
healthcare, insurance, communications, law and entertainment. As a result, the demand for office space is largely determined by general economic cycles. Typically, demand peaks during periods of strong economic growth, because the need for space rises as new businesses enter the market and existing firms expand operations.
At the same time, it is important to note that the demand for space can vary within the office segment, as properties are classified into three main segments: Class A, Class B and Class C. (These segments are detailed in the Major Markets section of this report.) The demand for office space is also impacted by corporate policies and trends, such as telecommuting, which reduces the need for space as employees are allowed to work from home.
Products�&�Servicescontinued
The three main sources of industry revenue are rental income, net gains from property sales and real estate brokerage fees. According to US Census data and IBISWorld estimates, approximately 90.4% of industry income is associated with property rents. Rental rates are generally determined by the type, class and location of the property that is being leased. Other factors that are important for rental rates include general economic growth and property valuations. Economic growth is important because the demand for commercial real estate increases as businesses expand. Retail property demand is also dependent on the spending activity of individual consumers, which is largely affected by unemployment rates, consumer confidence and disposable income rates.
Net realized gains from sales and property management/brokerage fees account for approximately 3.1% and 1.0% respectively. Similar to rental rates, these
fees often fluctuate with the general economic cycles as the demand and valuation of real estate is often based on business growth, consumer spending and corporate profits. Property valuations are also important for determining fees as most fees are a percentage of real estate values or lease rates.
In the five years to 2011, real estate brokerage fees and net gains from real estate sales have dramatically fallen from 6.0% of industry in 2006 (1.2% from brokerage fees and 5.8% from realized gains) to 3.3% in 2011 (0.2% in brokerage fees and 3.1% in gains) due to the rapid decline in real estate values that has occurred since the real estate bubble burst in 2007. In contrast to realized gains and brokerage fees, gross rents have remained relatively resilient only falling by 3.0% from 2006 to 90.4% in 2011. Despite fluctuations in economic activity, rent is relatively stable due to the long-term nature of most commercial leases.
WWW.IBISWORLD.COM� Commercial�Leasing�in�the�US June 2011 16
Products�&�Markets
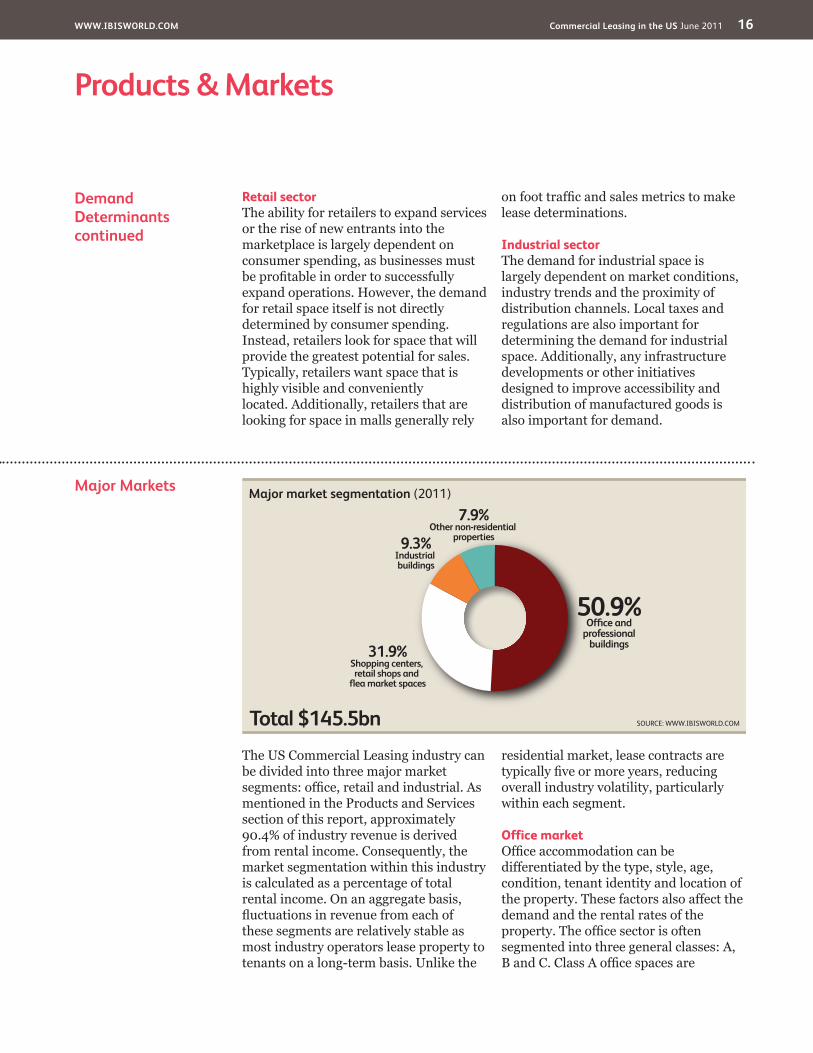
Major�Markets
The US Commercial Leasing industry can be divided into three major market segments: office, retail and industrial. As mentioned in the Products and Services section of this report, approximately 90.4% of industry revenue is derived from rental income. Consequently, the market segmentation within this industry is calculated as a percentage of total rental income. On an aggregate basis, fluctuations in revenue from each of these segments are relatively stable as most industry operators lease property to tenants on a long-term basis. Unlike the
residential market, lease contracts are typically five or more years, reducing overall industry volatility, particularly within each segment.
Office marketOffice accommodation can be differentiated by the type, style, age, condition, tenant identity and location of the property. These factors also affect the demand and the rental rates of the property. The office sector is often segmented into three general classes: A, B and C. Class A office spaces are
DemandDeterminantscontinued
Retail sectorThe ability for retailers to expand services or the rise of new entrants into the marketplace is largely dependent on consumer spending, as businesses must be profitable in order to successfully expand operations. However, the demand for retail space itself is not directly determined by consumer spending. Instead, retailers look for space that will provide the greatest potential for sales. Typically, retailers want space that is highly visible and conveniently located. Additionally, retailers that are looking for space in malls generally rely
on foot traffic and sales metrics to make lease determinations.
Industrial sectorThe demand for industrial space is largely dependent on market conditions, industry trends and the proximity of distribution channels. Local taxes and regulations are also important for determining the demand for industrial space. Additionally, any infrastructure developments or other initiatives designed to improve accessibility and distribution of manufactured goods is also important for demand.
Major market segmentation (2011)
Total $145.5bn
50.9%Office and
professional buildings31.9%
Shopping centers, retail shops and
flea market spaces
9.3%Industrial buildings
7.9%Other non-residential
properties
SOURCE: WWW.IBISWORLD.COM

WWW.IBISWORLD.COM� Commercial�Leasing�in�the�US June 2011 17
Products�&�Markets
Major�Marketscontinued
generally characterized as buildings that are managed professionally and have high-quality tenants, an excellent location and high-quality building materials and common areas. These properties are often occupied by banks, high-priced law firms, investment banking companies and other high-profile companies. These buildings are also normally four stories or more tall. Class B buildings are often slightly lower in quality and craftsmanship in comparison to Class A structures. Class B buildings are usually newer, wood-framed buildings or older, former Class A buildings. These buildings are also not located in “excellent” locations. Instead, Class B office buildings are often found in the suburbs or less-pricey business districts. These buildings are generally three stories or less. Class C buildings are the cheapest buildings to rent and are typically 15 to 25 years old. Many Class C office spaces are not true office buildings. Instead, they consist of walk-up office spaces above retail or service operators.
Retail sectorThe retail sector can be divided into shopping centers and non-shopping centers. According to the US Census, a shipping center is defined as “a group of architecturally unified commercial establishments built on a site that is planned, developed, owned and managed as an operating unit related in its location, size and type of shops to the trade area that it services.” Under this definition, shopping centers account for approximately 49.8% (or 6,060 million square feet) of the total retail gross leasable area (GLA) in the United States, according to the Global Retail Real Estate Industry. Furthermore, based on Census estimates there are approximately 48,695 shopping centers in the United States.
Similar to office buildings, regional shopping malls can be categorized by property class. However, classes are
determined by sale per square foot. The three property classes are Class A tenant sales of at least $400 per square foot, Class B tenant sales of less than $400 per square foot, and Class C tenant sales of less than $250 per square foot. Simon Property Group and General Growth Properties are the two largest Class A shopping center owners in the country.
Industrial marketThe industrial market is diverse, with a wide variety of user requirements and property characteristics. Industrial properties are generally categorized into two distinct property segments, depending on the type of activity that is being conducted at the site. The two segments are called “light” and “heavy” industrial zones. A light industrial facility usually employs fewer than 500 people and has an emphasis on activities other than manufacturing. Typically, light industrial activities include printing plans, material testing laboratories, assemblers of data processing equipment and power stations. All of light industrial facilities are also free-standing and devoted to a specific use.
In contrast, heavy industrial facilities usually have a higher number of employees per industrial plant and could also be categorized as manufacturing plants. The distinction between heavy and light industrial property is vague, but the heavy industrial zones generally involve the manufacturing of large items. Overall, industrial tenants are engaged in a wide variety of businesses, including manufacturing, retail, wholesale trade, distribution and professional services. Prospective tenants usually seek property in areas located close to suppliers, customers and staff. In addition, industrial properties generally have convenient access to major transportation systems, including interstate highways, railroad and airports.

WWW.IBISWORLD.COM� Commercial�Leasing�in�the�US June 2011 18
Products�&�Markets
International�Trade The US Commercial Leasing industry is comprised of commercial properties that are domiciled in the US. Therefore, international trade is not applicable. For
more information on industry globalization and foreign investment, please see the Industry Globalization section of this report.
WWW.IBISWORLD.COM� Commercial�Leasing�in�the�US June 2011 19
�Products�&�Markets
Business�Locations�2011
MO2.2
West
West
West
Rocky Mountains Plains
Southwest
Southeast
New England
Great Lakes
VT0.2
MA2.4
RI0.4
NJ3.3
DE0.3
NH0.4
CT1.4
MD1.5
DC0.4
1
5
3
7
2
6
4
8 9
Additional�States�(as marked on map)
AZ1.4
CA12.3
NV1.1
OR1.4
WA2.5
MT0.4
NE0.6
MN1.2
IA0.8
OH2.7 VA
2.2
FL8.1
KS0.7
CO1.7
UT0.8
ID0.4
TX7.2
OK1.0
NC2.4
AK0.3
WY0.3
TN1.4
KY1.1
GA2.8
IL3.0
ME0.5
ND0.2
WI1.2 MI
2.5 PA3.0
WV0.7
SD0.3
NM0.6
AR0.6
MS0.5
AL1.1
SC0.9
LA1.4
HI0.8
IN1.5
NY14.0 5
67
8
321
4
9
SOURCE: WWW.IBISWORLD.COM
Mid- Atlantic
Establishments�(%)�
� Less�than�3%� 3%�to�less�than�10%� 10%�to�less�than�20%� 20%�or�more

WWW.IBISWORLD.COM� Commercial�Leasing�in�the�US June 2011 20
�Products�&�Markets
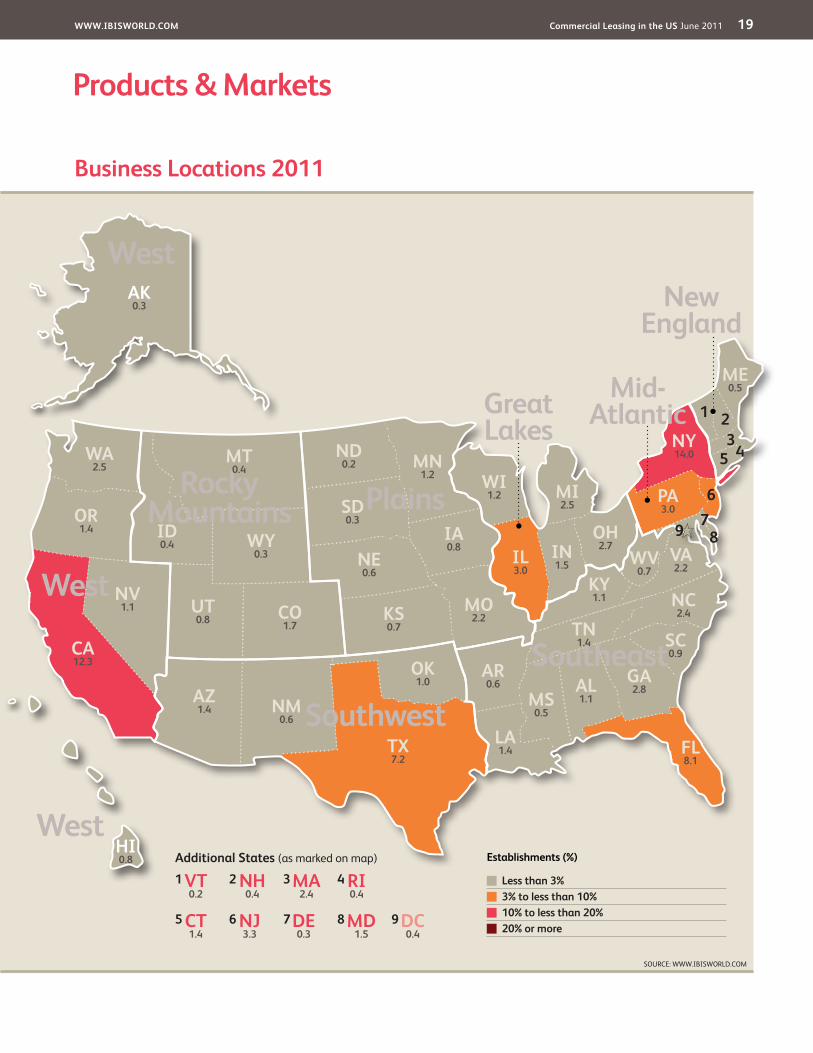
Business�Locations The geographical distribution of the Commercial Leasing industry is largely reflected by the size and distribution of the US population, which is mainly driven by economic activity. Additionally, local regulations and tax laws also influence the distribution of establishments. As a result, the majority of industry participants are located in the Mid-Atlantic, Southeast and West regions. The largest states in terms of establishments and employment include New York, California, Texas and Florida.
California, Texas and New York have the highest percentage of industry establishments due to the size and value of their local economies and populations. California is currently the eighth-largest economy in the world (largest in the United States) and the most populated state in the country, according to the California Legislative Analyst’s Office. Texas is the 15th-largest economy in the world (second in the United States) and it is also the location of the majority of the Fortune 500 company headquarters. New York is the 16th-largest economy in the world (third in the United States) and is home to the most expensive commercial real estate in the United States. New York is also
the epicenter of the global financial market, including the Federal Reserve, NYSE and NASDAQ trading floors.
Areas such as California and New York account for 19.1% and 20.4% of revenue, respectively, but only 12.3% and 14.0% of establishments. Similarly, states such as Florida account for 5.4% of revenue, but 8.1% of establishments as property values and rents are cheaper.
%
30
0
10
20
Sout
hwes
t
Wes
t
Gre
at L
akes
Mid
-Atla
ntic
New
Eng
land
Plai
ns
Rock
y M
ount
ains
Sout
heas
t
EstablishmentsPopulation
Establishments vs. population
SOURCE: WWW.IBISWORLD.COM

WWW.IBISWORLD.COM� Commercial�Leasing�in�the�US June 2011 21
Key�Success�Factors Ability to effectively communicate and negotiateA strong negotiating position with tenants can assist industry participants in retaining existing clients, obtaining favorable lease agreements and maximizing rents.
Financial structure of the companyAll risks should be considered (e.g. quality of tenants, length of tenant leases, rent escalation) when acquiring investment property and when determining equity/debt levels.
Good project management skillsThe ability to efficiently manage developments, renovations and repairs can reduce operation costs and increase profit margins for industry participants.
Management of a high quality assets portfolioTenants tend to have a preference for properties in prime locations and where tenant demand is less volatile. Lessors
should have skills in identifying local economic, demographic and social trends.
Maintenance of excellent customer relationsUnderstanding the needs of and having good relationships with existing and prospective tenants can assist in gaining and retaining tenants as well as assist in negotiating higher rents.
Superior financial management and debt managementA significant amount of capital and debt is used to finance property acquisitions. Therefore, companies must be able to properly manage cash flows, cash reserves and debt levels to grow and manage property portfolios.
Proximity to key locationsLocation is everything in this industry, as tenants generally pay a premium for buildings located near business centers, transportation hubs and entertainment venues. Buildings in areas of densely
Market�Share�Concentration
The Commercial Leasing industry is largely comprised of small independent lessor firms. According to the US Census Bureau and IBISWorld estimates, 86.2% of industry establishments are non-employers. At the same time, these firms account for a much smaller percentage of industry revenue as employer firms generate an estimated 65.7% of industry revenue despite only accounting for 13.8% of industry establishments.
The largest companies within the industry are associated with Real Estate Investment Trusts (REITs). To qualify as a REIT, a company or trust must distribute at least 90% of taxable income to shareholders annually in the form of dividends. REITs act as investment vehicles for investors who want to own commercial property, but may not have
the means to acquire property on their own. Over the five years to 2011, the industry has consolidated operations. Prior to the recession, REITs aggressively expanded their real estate portfolios by leveraging assets and issuing equity. At the same time, smaller companies looked to reduce risk by diversifying operations. These entities diversified their businesses by expanding operations beyond their traditional regional market through corporate acquisitions and property purchases. In addition, larger firms are generally able to raise capital more efficiently then smaller, independently owned businesses. As a result, industry participants consolidated operations in an attempt to improve their ability to raise capital.
Competitive�LandscapeMarket�Share�Concentration�� |�� Key�Success�Factors�� |�� Cost�Structure�BenchmarksBasis�of�Competition�� |�� Barriers�to�Entry�� |�� Industry�Globalization
Level��Concentration in this industry is Low
�IBISWorld identifies 250 Key Success Factors for a business. The most important for this industry are:
WWW.IBISWORLD.COM� Commercial�Leasing�in�the�US June 2011 22
Competitive�Landscape
Cost�Structure�Benchmarks
The largest firms within the industry are Real Estate Investment Trusts (REITs), so the cost analysis will focus on this group. However, it is important to note that the cost structure is largely reflective of smaller privately owned organizations, particularly in regard to interest and mortgage expenses, maintenance costs and profit margins. Larger private firms also have similar cost structures in regard to wages. In addition to the expenses detailed below, other industry expenses include property taxes, insurance costs and legal fees. These costs have remained relatively steady despite the credit crisis.
Earnings before interest and taxes (EBIT)The industry’s profitability (EBIT) is expected to diminish in the five years to 2011, falling from 59.5% in 2006 to about 43.0% in 2011. The main reason for the decline in net income is largely attributed to the fallout of the subprime mortgage crisis that began in 2007. Disregarding interest, the industry’s operating profit has fallen from 23.6% of revenue in 2006 to 11.0% in 2011, while interest expenses have remained relatively flat despite spiking in late 2008 and early 2009 due to the credit market crisis. Since then, rates have steadily fallen as the Federal Reserve has aggressively cut interest rates to promote economic growth.
Interest expenses include costs associated with debt including mortgages and bonds. Commercial lessors generally leverage a large portion of their real estate holdings in an attempt to raise capital for daily
operations, acquisitions and property development. It is also important to note that REITs are required to distribute at least 90% of their taxable income to be properly categorized as a REIT. As a result, interest expenses tend to be the highest portion of a REIT’s cost structure because firms need to issue debt or take out mortgages to expand operations, acquire property or develop land. The exception to this rule is if REITs or other publicly traded company’s issue additional equity instead of debt to raise capital.
DepreciationCommercial and investment real estate properties receive a tax deduction for annual wear and tear or loss of utility, so companies depreciate real estate assets over time to account for this deduction. However, the depreciation of real estate unfairly reduces net income because real estate assets generally do not lose value over an outlook period; instead, prices generally appreciate. Consequently, investors evaluating a commercial lessor’s performance often look at a firm’s fund from operations (FFO). FFO is calculating by adding depreciation and amortization back to net income. The depreciation expense category also includes amortization. Amortization is the gradual elimination of a liability, such as a mortgage from a company’s balance sheet. Amortization expenses generally are periodic or regular payments that take place over a specific period of time. It is important to note
Key�Success�Factorscontinued
populated metropolitan areas have higher rental income.
Densely populated areasLessors generally benefit from owning property in densely
populated areas due to the scarcity of land. The supply and demand for real estate drives rental income and metropolitan areas tend to have a lot of demand for real estate and not enough supply.

WWW.IBISWORLD.COM� Commercial�Leasing�in�the�US June 2011 23
Competitive�Landscape
Cost�Structure�Benchmarkscontinued
that amortization expenses have increased since the start of the subprime mortgage crisis, as firms have paid down debt in an attempt to reduce leverage and improve lending rates.
Property maintenance and repairsProperty maintenance and repair costs are expected to account for about 11.6% of industry revenue in 2011, about the same as 2006. Property maintenance and repair is a significant item for the commercial real estate industry. Some rental agreements allow firm’s to recover a significant portion of maintenance and repair costs from tenants.
Maintenance and repair costs can also be impacted by weather conditions, regulation requirements and property conditions. Older properties tend to have higher maintenance costs then newer buildings so it is important to look at the age of the real estate portfolio.
WagesIn 2011, industry wages are projected to account for about 10.2% of industry revenue, up from 9.9% in 2005. Wages consist of employee costs associated with property management, acquisition and development. Companies generally employ highly educated individuals who are experts in the real estate industry. As
a result, employees tend to be highly paid. It is important to note that wage costs are much lower for non-employer establishments. Payroll expenses can be reduced by outsourcing the management of properties to companies that specialize in this field.
OtherOther expenses mainly include amortization (8.0% of industry revenue in 2011), advertising and promotion (2.2%), general and administrative (3.7%). Amortization expenses generally are periodic or regular payments that take place over a specific period of time. Since the subprime crisis erupted in 2007, amortization has steadily increased, as firms have aggressively paid off debts to decrease leverage ratios and improve liquidity. As a result, amortization is expected to account for about 8.0% of industry revenue in 2011, up from 6.5% in 2006.
Impairments occur when the carrying amount of an asset may not be recoverable. If an asset it is impaired, the assets fair value is less than its carrying value. Impairments have increased since the subprime crisis due to challenges associated with property values, particularly in regards to the development of future multifamily communities.
Industry�Costs�and�Average�Sector�Costs■�Profi�t■�Rent■�Utilities■�Depreciation■�Other■�Wages■�Purchases
Industry�Costs�(2011)�
Average�Costs�of�all�Industries�in�sector�(2011)�
43.0Profit
10.238.33.0
3.5
0.5
24.9Profit
10.319.235.16.6
2.4
1.6
SOURCE: WWW.IBISWORLD.COM
0 100%1.5
WWW.IBISWORLD.COM� Commercial�Leasing�in�the�US June 2011 24
Competitive�Landscape
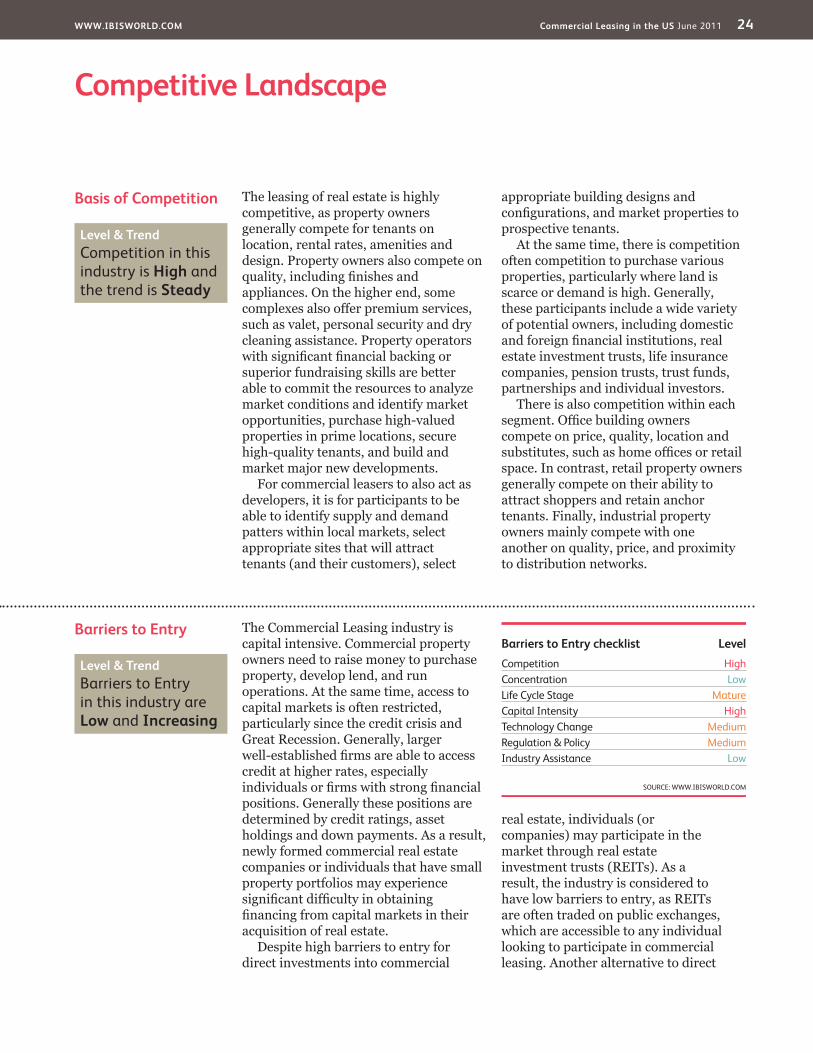
Barriers�to�Entry The Commercial Leasing industry is capital intensive. Commercial property owners need to raise money to purchase property, develop lend, and run operations. At the same time, access to capital markets is often restricted, particularly since the credit crisis and Great Recession. Generally, larger well-established firms are able to access credit at higher rates, especially individuals or firms with strong financial positions. Generally these positions are determined by credit ratings, asset holdings and down payments. As a result, newly formed commercial real estate companies or individuals that have small property portfolios may experience significant difficulty in obtaining financing from capital markets in their acquisition of real estate.
Despite high barriers to entry for direct investments into commercial
real estate, individuals (or companies) may participate in the market through real estate investment trusts (REITs). As a result, the industry is considered to have low barriers to entry, as REITs are often traded on public exchanges, which are accessible to any individual looking to participate in commercial leasing. Another alternative to direct
Basis�of�Competition The leasing of real estate is highly competitive, as property owners generally compete for tenants on location, rental rates, amenities and design. Property owners also compete on quality, including finishes and appliances. On the higher end, some complexes also offer premium services, such as valet, personal security and dry cleaning assistance. Property operators with significant financial backing or superior fundraising skills are better able to commit the resources to analyze market conditions and identify market opportunities, purchase high-valued properties in prime locations, secure high-quality tenants, and build and market major new developments.
For commercial leasers to also act as developers, it is for participants to be able to identify supply and demand patters within local markets, select appropriate sites that will attract tenants (and their customers), select
appropriate building designs and configurations, and market properties to prospective tenants.
At the same time, there is competition often competition to purchase various properties, particularly where land is scarce or demand is high. Generally, these participants include a wide variety of potential owners, including domestic and foreign financial institutions, real estate investment trusts, life insurance companies, pension trusts, trust funds, partnerships and individual investors.
There is also competition within each segment. Office building owners compete on price, quality, location and substitutes, such as home offices or retail space. In contrast, retail property owners generally compete on their ability to attract shoppers and retain anchor tenants. Finally, industrial property owners mainly compete with one another on quality, price, and proximity to distribution networks.
Level�&�Trend��Competition in this industry is High and the trend is Steady
Barriers�to�Entry�checklist� LevelCompetition HighConcentration LowLife Cycle Stage MatureCapital Intensity HighTechnology Change MediumRegulation & Policy MediumIndustry Assistance Low
SOURCE: WWW.IBISWORLD.COM
Level�&�Trend��Barriers to Entry in this industry are Low and Increasing

WWW.IBISWORLD.COM� Commercial�Leasing�in�the�US June 2011 25
Competitive�Landscape
Industry�Globalization
There is no established global real estate player. Instead, this industry is highly fragmented with the majority of companies operating solely in a specified region or country. While many of the opportunities to add value to assets require knowledge of local real estate markets, investment capital from foreign investors continues to increase. This trend is largely reflective of the globalization of the financial market sector. In the five years to 2015, foreign investment is projected
to continue to increase as the value of the US dollar diminishes. The US dollar is expected to depreciate due to large deficit spending and lower interest rates associated with the credit crisis and recession. This trend is important because American assets become more affordable as the dollar depreciates. Countries with stronger currencies, including the euro and pound, are expected to be the largest foreign investors in American commercial real estate assets.
Barriers�to�Entrycontinued
investment in commercial leasing are partnerships, which can vary in size.
Finally, it is important to note barriers to entry within the real estate markets themselves. Areas that are over-developed are harder to penetrate due to scarcity of land, resources and potential tenants. For example, a major existing shopping center with long term lease agreements and good anchor
tenants may make it not difficult for a new entrant to successfully enter the market. Additionally, high vacancy rates in a market (e.g. for offices, a downtown area) may also reduce the viability of introducing new space into a market. New entrants may be prohibited from entering a real estate market due to permit requirements or zoning restrictions.
Level�&�Trend��Globalization in this industry is Low and the trend is Increasing

WWW.IBISWORLD.COM� Commercial�Leasing�in�the�US June 2011 26
Player�Performance Simon Property Group is the largest public real estate company in the United States with 256 million square feet of leasable space in 379 properties across the United States (201 million square feet), Asia and Europe. The firm is listed on the New York Stock Exchange under the symbol SPG and is also part of the S&P 500.
Simon specializes in retail centers, including regional malls, shopping centers and strip malls. The company’s investments tend to be in metropolitan areas with high consumer traffic. The company’s portfolio is largely comprised of retail centers which consist of both anchor department stores and smaller retailers. Since Simon’s holdings are mainly retail properties, it is particularly affected by consumer shopping habits. This is especially true of smaller retail store tenants at Simon’s malls, as many of these establishments have short-term leases in comparison to anchor stores. Short-term leases generally range from several months to years while long-term leases are generally five to 10 years long.
The company’s five major platforms are regional malls, Premium Outlet Centers, The Mills, community/lifestyle centers and international operations. The company’s regional malls division consists of 171 centers ranging in size from 400,000 to 2.0 million square feet. The Premium Outlet Centers group contains 36 centers ranging in size from 200,000 to 600,000 square feet. These centers are located in tourist destinations and near large metropolitan areas such as
New York City, Los Angeles and Boston. The Community or Lifestyle Centers are designed to service neighborhoods and communities by taking advantage of existing mall operations. These centers feature entertainment options, retail stores, condominium complexes and office space all in one development. Simon has also expanded its operations outside the US with joint ventures in Italy, Poland and France. Other foreign joint venture investments include Premium Outlet Centers in Mexico, Japan, South Korea and China.
Financial performanceDespite the fallout associated with the Great Recession and credit crisis, Simon’s revenue is expected to increase by an average annual rate of 5.8% to $4.4 billion in the five years to 2011, including estimated growth of 8.4% in 2011. Simon has been able to increase revenue during this period due to an aggressive expansion strategy. In 2010, the firm’s revenue is estimated to have risen by 7.9% due to improved economic conditions, as businesses and retailers finally begin to expand operations.
In 2009, revenue remained relatively flat in comparison to 2008, while net income fell by 30.9% to $320.2 million. The decline in net income continued the trend that started in 2008, when profit declined by 5.6% to $463.6 million. During this period, net income has been hurt by the Great Recession, as businesses have closed or cut-back operations due to a severe decline in consumer spending.
�Major�CompaniesSimon�Property�Group�Inc.�� |�� General�Growth�Properties�Inc.Vornado�Realty�Trust�� |�� Brookfield�Properties�Corporation�� |�� Other�Companies
90.8%Other
Simon�Property�Group�Inc.�3.0%
General�Growth�Properties�Inc.�2.3%
Vornado�Realty�Trust�2.2%
Brookfield�Properties�Corporation�1.7%
SOURCE: WWW.IBISWORLD.COM
Major�players(Market share)
Simon�Property�Group�Inc.��Market share: 3.0%

WWW.IBISWORLD.COM� Commercial�Leasing�in�the�US June 2011 27
Major�Companies
Player�Performance General Growth Properties (GGP) is the second largest REIT in the US with 2011 revenue estimated at $3.3 billion. The company owns or manages over 200 regional shopping malls in 44 states and international operations in Brazil Costa Rica and Turkey. In addition, the firm has stakes in lifestyle centers, office buildings and residential communities. The company is known for its symbolic properties and tourist destinations, including Faneuil Hall Marketplace in Boston, South Street Seaport in New York City and Water Tower Place in Chicago. Similar to
Simon, GGP is vulnerable to economic fluctuations because of its large exposure to the retail sector. The firm also has about 18,000 acres of pre-planned residential properties, making it particularly susceptible to the subprime mortgage crisis and the current residential real estate collapse.
On April 16, 2009 GGP filed the biggest real estate bankruptcy in US history after it became unable to manage its debt. The company amassed $27.3 billion of debt during a growth spree that turned it into the second largest shopping mall owner behind Simon
Player�Performancecontinued
The majority of Simon’s holdings are retail properties which are particularly vulnerable to the cycles and risks inherent to the retail environment. Consumer spending, confidence and the seasonality of the retail sector all affect retailers’ ability to lease space in shopping centers. However, Simon is in a strong position despite the recent decline in net income brought on by the recession and decline in consumer spending. The company has been able to manage its debt, making it less susceptible to the credit market crisis.
The ability to manage debt levels has allowed it to refinance existing loans and
purchase properties from other real estate companies that are over leveraged. The manageable debt levels at Simon are particularly important in today’s credit climate, which has been tight since the subprime crisis in 2008. In 2009, Simon’s loan-to-value ratio (LTV) is estimated at 71.1% with company debt totaling $17.9 billion and assets estimated at $25.0 billion. The LTV ratio is relatively low in comparison to other firms such as General Growth Properties, which had to file for bankruptcy because it was over leveraged and could not keep up with its mortgage payments.
Simon�Property�Group�Inc.�–�fi�nancial�performance
YearRevenue�
($ million) (% change)Net�Income�
($ million) (% change)Assets�
($ million) (% change)
2006 3,332.2 5.2 563.4 59.4 22,084.5 4.5
2007 3,651.0 9.6 491.2 -12.8 23,605.7 6.9
2008 3,783.0 3.6 463.6 -5.6 23,596.7 0.0
2009 3,773.7 -0.2 320.3 -30.9 26,169.5 10.9
2010* 4,072.5 7.9 507.2 58.4 27,504.1 5.1
2011* 4,416.3 8.4 561.4 10.7 28,824.3 4.8
*EstimateSOURCE: ANNUAL REPORT AND IBISWORLD
General�Growth�Properties�Inc.���Market share: 2.3%

WWW.IBISWORLD.COM� Commercial�Leasing�in�the�US June 2011 28
Major�Companies
Player�Performancecontinued
Property Group. Under its Chapter 11 filing, the company listed $29.5 billion in assets and $27.3 billion in debt. The company will continue to operate its properties as it tries to refinance and decrease its debt levels.
The company’s collapse was brought on by a combination of over leveraging, the subprime crisis, the credit crunch and the drop in property values. The CEO of the firm blamed the credit market crisis and recession for the company’s demise, but prior to the economic downtown it was the highest leveraged REIT. According to Green Street Advisors, Inc. GGP had a leverage ratio or liabilities as a percentage of current value of assets of more than 83%. Prior to the bankruptcy, the firm was listed on the NYSE under the symbol GGP and was also part of the S&P 500. Since then, the company has been taking off the market and has also fallen out of the S&P 500 index.
The firm collapsed under too much debt, but is expected to recover under a reorganization plan presented under its bankruptcy filing. According to GGP’s President Thomas Nolan, the company intends to emerge from bankruptcy as a leaner company with less leverage. The
firm’s biggest shareholder Hedge Fund Pershing Square Capital Management has helped the reorganization process by pledging $375 million to help finance and run the company during the Chapter 11 process.
Financial performance In the five years to 2011, GGP’s revenue is expected to increase by an average annual rate of 0.4% to $3.3 billion. However, it is important to note that the majority of its growth has been diminished by the company’s 2009 bankruptcy filing. Since then, the company has looked to downsize or sell its operations in an attempt to pay its creditors. In contrast, disregarding 2007, net income rather sharply during this period. The decline in net income is largely attributed to the rise in financing costs associated with the company’s acquisition spree. The gain in 2007 was the result of a one-time income tax benefit, resulting from the adoption of FIN 48. The firm has recently made headlines in relation to the sale of its entire business. Several companies are said to be interested, including Simon Properties, Vornado Realty Trust and Brookfield Asset Management.
General�Growth�Properties�Inc.�–�fi�nancial�performance
Year*Revenue�
($ million) (% change)Net�Income�
($ million) (% change)Assets�
($ million) (% change)
2005-06 3,256.3 6.0 59.3 -21.6 25,241.4 -0.3
2006-07 3,261.8 0.2 288.0 385.7 28,814.3 14.2
2007-08 3,361.3 3.1 26.3 -90.9 29,557.3 2.6
2008-09 3,198.8 -4.8 -896.4 N/C 29,042.1 -1.7
2009-10 3,228.2 0.9 -91.2 N/C 27,299.6 -6.0
2010-11** 3,325.0 3.0 10.9 N/C 26,753.6 -2.0
*Year-end�September,�**EstimateSOURCE: ANNUAL REPORT AND IBISWORLD

WWW.IBISWORLD.COM� Commercial�Leasing�in�the�US June 2011 29
Major�Companies
Player�Performance Vornado Realty Trust is the third largest REITs in the United States with a portfolio of approximately 64 million square feet of leasable property in the Washington DC and New York areas. According to 2011 IBISWorld estimates, Vornado is expected to generate $3.2 billion in revenue on assets of $22.5 billion. The NY-based firm primarily makes money by developing, renting and selling real estate. However, unlike Simon and GGP the firm does not concentrate on a particular real estate market or sector. Instead, Vornado holds a diverse portfolio of commercial properties, including office, retail, warehouses and industrial buildings. The company is listed on the NYSE under the ticker symbol VNO and has a market capitalization of approximately $10.8 billion.
The company is organized into four major platforms, including the New York City Office, Washington DC Office, Retail Properties and Merchandise Marts. The largest sector is the NY group, which contains 28 office properties totaling 16.0 million square feet in midtown Manhattan. Vornado’s other investments include a 32.8% interest in the REIT Alexander’s and a 32.8% interest in Toy’s R Us. In addition, the firm owns various interests in mezzanine loans and other public companies that manage office, industrial and retail properties.
Financial performanceIn the five years to 2011, Vornado’s revenue is expected to increase by an average annual rate of 11.0% to $3.2 billion. However, it is important to note that the growth in revenue does not include revenue generated by Americold Realty Trust, which Vornado owned from 2004 through March 30, 2008. The company’s 47.6% interest in Americold generated revenues from $779.1 million to $847.0 million from 2005 through 2007. Americold specializes in temperature controlled logistics and contains over 90 cold storage warehouses nationwide. Vornado sold its Americold interest for $220 million to Yucaipa Companies.
Net income increased steadily until the subprime mortgage crisis erupted in 2008. Consequently, net income declined by 33.9% to $338.0 million in 2008. The two biggest reasons for the decline were losses from partially owned entities and an increase in depreciation and amortization expenses. In 2009, revenue is expected to further decline due to a dramatic rise in investment and interest losses.
However, the decline is not necessary reflective of continued operations because the company’s 2008 profit margin was artificially inflated by a one-time tax benefit of $212.4 million.
Vornado�Realty�Trust�–�fi�nancial�performance
YearRevenue�
($ million) (% change)Net�Income�
($ million) (% change)Assets�
($ million) (% change)
2006 1,909.1 14.1 502.6 1.9 17,954.3 31.7
2007 2,410.5 26.3 511.7 1.8 22,478.9 25.2
2008 2,697.1 11.9 338.0 -33.9 21,418.2 -4.7
2009 2,732.3 1.3 127.9 -62.2 22,350.5 4.4
2010* 2,934.9 7.4 553.2 332.5 23,199.9 3.8
2011* 3,212.1 9.4 537.2 -2.9 23,872.6 2.9
*EstimateSOURCE: ANNUAL REPORT AND IBISWORLD
Vornado�Realty�Trust��Market share: 2.2%
WWW.IBISWORLD.COM� Commercial�Leasing�in�the�US June 2011 30
Major�Companies
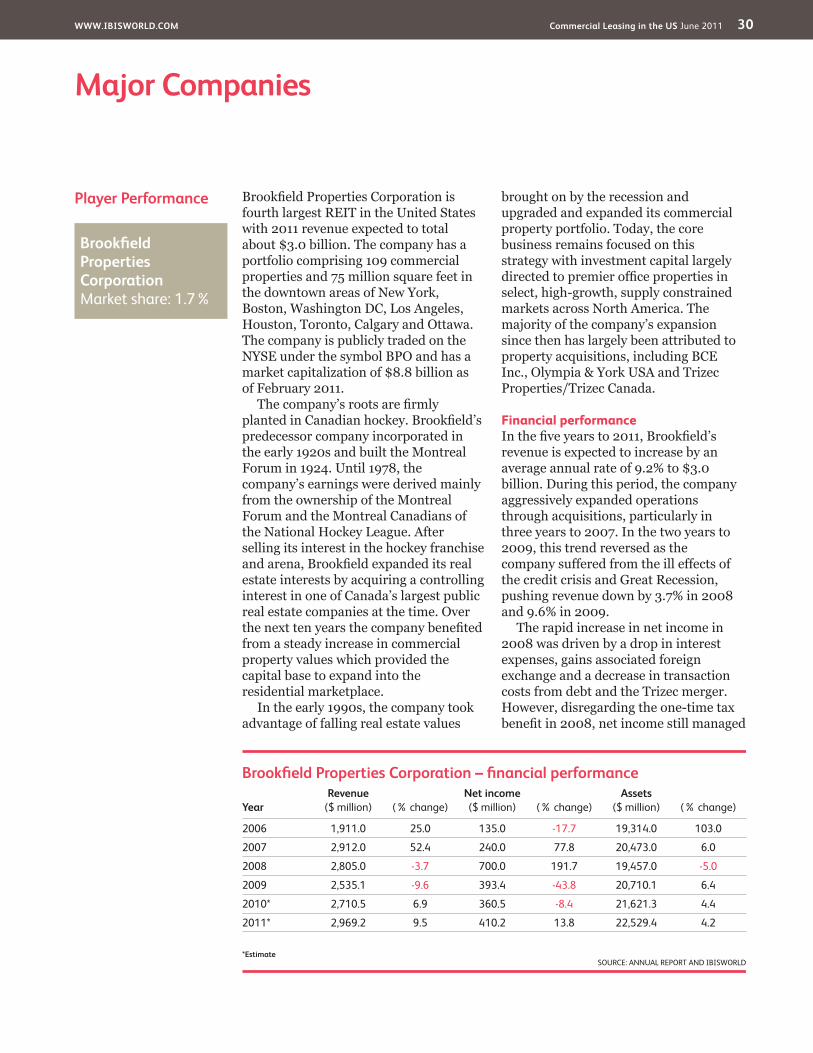
Player�Performance Brookfield Properties Corporation is fourth largest REIT in the United States with 2011 revenue expected to total about $3.0 billion. The company has a portfolio comprising 109 commercial properties and 75 million square feet in the downtown areas of New York, Boston, Washington DC, Los Angeles, Houston, Toronto, Calgary and Ottawa. The company is publicly traded on the NYSE under the symbol BPO and has a market capitalization of $8.8 billion as of February 2011.
The company’s roots are firmly planted in Canadian hockey. Brookfield’s predecessor company incorporated in the early 1920s and built the Montreal Forum in 1924. Until 1978, the company’s earnings were derived mainly from the ownership of the Montreal Forum and the Montreal Canadians of the National Hockey League. After selling its interest in the hockey franchise and arena, Brookfield expanded its real estate interests by acquiring a controlling interest in one of Canada’s largest public real estate companies at the time. Over the next ten years the company benefited from a steady increase in commercial property values which provided the capital base to expand into the residential marketplace.
In the early 1990s, the company took advantage of falling real estate values
brought on by the recession and upgraded and expanded its commercial property portfolio. Today, the core business remains focused on this strategy with investment capital largely directed to premier office properties in select, high-growth, supply constrained markets across North America. The majority of the company’s expansion since then has largely been attributed to property acquisitions, including BCE Inc., Olympia & York USA and Trizec Properties/Trizec Canada.
Financial performanceIn the five years to 2011, Brookfield’s revenue is expected to increase by an average annual rate of 9.2% to $3.0 billion. During this period, the company aggressively expanded operations through acquisitions, particularly in three years to 2007. In the two years to 2009, this trend reversed as the company suffered from the ill effects of the credit crisis and Great Recession, pushing revenue down by 3.7% in 2008 and 9.6% in 2009.
The rapid increase in net income in 2008 was driven by a drop in interest expenses, gains associated foreign exchange and a decrease in transaction costs from debt and the Trizec merger. However, disregarding the one-time tax benefit in 2008, net income still managed
Brookfi�eld�Properties�Corporation�–�fi�nancial�performance
YearRevenue�
($ million) (% change)Net�income�($ million) (% change)
Assets�($ million) (% change)
2006 1,911.0 25.0 135.0 -17.7 19,314.0 103.0
2007 2,912.0 52.4 240.0 77.8 20,473.0 6.0
2008 2,805.0 -3.7 700.0 191.7 19,457.0 -5.0
2009 2,535.1 -9.6 393.4 -43.8 20,710.1 6.4
2010* 2,710.5 6.9 360.5 -8.4 21,621.3 4.4
2011* 2,969.2 9.5 410.2 13.8 22,529.4 4.2
*EstimateSOURCE: ANNUAL REPORT AND IBISWORLD
Brookfield�Properties�Corporation��Market share: 1.7%
WWW.IBISWORLD.COM� Commercial�Leasing�in�the�US June 2011 31
Major�Companies
Other�Companies The Commercial Leasing industry is only comprised of operators that primarily act as lessors of buildings that are not used as residences or dwellings. As a result, pension funds and other financial institutions are not included within this industry, despite being some of the largest investors in the US commercial real estate market. In addition, the smaller companies listed below are all publicly traded REITs, because industry market share is based on revenue. However, the industry is still dominated by smaller regional players and private companies. Some smaller private industry participants include Helmsley Enterprises, Lincoln Property Company and JMB Realty Corporation.
Boston PropertiesEstimated market share: 1.2%Boston Properties is publicly traded on the NYSE under the ticker symbol BXP. The company develops, owns and manages office buildings. The vast majority of its portfolio is comprised of high valued grade-A office space but the company also owns two hotels, an industrial center and a land bank in the Northeast that contains 10 million square feet of development space. According to IBISWorld estimates, the company is projected to have revenue of $1.7 billion in 2011.
Boston Properties owns 138 properties in five metropolitan areas in the US including Midtown Manhattan, Boston, Washington DC, San Francisco and Princeton, New Jersey. These areas traditionally provide higher returns and greater resistance to recession than other real estate markets due to the scarcity of land and dense population. These dense business centers also shield the company from its competitors due to the high barriers of entry associated with these locations. At the same time, the company specializes in grade-A office buildings which generally rent a premium to tenants with strong credit records. Tenants generally sign long-term contracts, which insolate the firm from revenue fluctuations. Consequently, the firm has not been decimated by the current credit market crisis and recession.
ProLogisEstimated market share: Less than 1.0%ProLogis is the world’s largest industrial REIT with $17.4 billion in assets containing 512.2 million square feet of rentable property. ProLogis rentable space is nearly double the square footage of any other industrial REIT, including its closest competitor, ING. The company trades on the NYSE under the symbol PLD and has an estimated market capitalization of $5.5 billion. The company’s main operations are located in
Player�Performancecontinued
to grow despite the onset of the Great Recession and credit crisis as the firm was able to increase in both occupancy rates and rent prices.
Prior to 2008, revenue increase rapidly as the firm benefited from the acquisition of Trizec Properties, strong occupancy rates and an increase in development. In 2007, revenue grew by 52.4% to $2.9 billion due to both residential and commercial
developments, including the Bay Adelaide Centre in Toronto, Four Allen Center in Houston and Bankers Court in Calgary. It is important to note that the majority of these developments are associated with the Trizec Properties acquisition. Most of the developments are also located in Canada, but the income is still distributed to the REIT shareholders despite being generated outside of the US.

WWW.IBISWORLD.COM� Commercial�Leasing�in�the�US June 2011 32
Major�Companies
Other�Companiescontinued
North America, but it also has properties in Europe and Asia. Recently, the company has looked to downsize its international presence in an attempt to focus on its core business. As a result, the firm has sold a number of international properties and has exited China altogether. ProLogis also sold a 20 percent interest in its Japanese property funds for $1.3 billion and slowed development in South Korea.
ProLogis is structured different than most REITs. Unlike typical REITs, ProLogis joint-owns and manages property funds in addition to its traditional REIT operations. These funds are generally organized in collaboration with institutional investors, allowing the company to acquire properties more aggressively than a traditional REIT structure. Traditional REITs are required to distribute 90% of their table income as dividends; forcing company’s who need to raise additional capital to look toward creditors or the equity marketplace. On the other hand, ProLogis’ property funds are able to generate capital from institutional investors and partners.
The company’s three business segments are property operations, investment management and development/CDFS. The company’s largest business unit is property operations, which includes revenues associated with property leases. The investment management division includes revenue from property funds, management of actual properties owned by the property funds and from interest
generated on advances to the property funds. Finally, the Development or CDFS division includes income from the sale of developed or rehabilitated real estate owned by property funds or distributed to third parties. It is important to note that the company’s revenue structure is relatively unique due to the inclusion of income associated with the firm’s property funds. Disregarding mutual fund income, the firm is only estimated to generate about $1.4 billion in revenue in 2011.
Kimco Realty CorporationEstimated market share: Less than 1.0%Kimco Realty Corporation is a retail REIT that specializes in the acquisitions, development and management of neighborhood and community shopping centers. The company was formed in 1960 with its first development opening in southern Florida. Since then, the company has grown substantially and now owns interests in 1,950 properties comprising 182 million square feet of leasable space across 45 states, Puerto Rico, Canada, Mexico and South America. The company specializes in acquiring properties with below market rate leases and turning them into profitable enterprises. In 1998, the company merged with Price REIT which expanded its portfolio with West Coast shopping Centers. In 1999, the company formed Kimco Income REIT. In 2011, the company is projected generate revenue of $739.0 million, according to IBISWorld estimates.

WWW.IBISWORLD.COM� Commercial�Leasing�in�the�US June 2011 33
Capital�Intensity The Commercial Leasing industry is capital intensive. Industry participants directly own and operate various real estate assets, so capital is needed to buy property, develop land and refurbish buildings. Commercial property is also very expensive, particularly in regards to large buildings or property that is near major metropolitan areas. Wage costs tend to be low as companies can generally outsource property management and operational costs. Investment requirements for establishments that do not own buildings, but sublease space, tend to be very low. Capital costs are generally limited to computer equipment and systems to manage tenants, rental payments and receipts and building services.
A key measure of an industry’s capital intensity is the ratio of labor costs (i.e. employee compensation) to depreciation
�Operating�ConditionsCapital�Intensity�� |�� Technology�&�Systems�� |�� Revenue�VolatilityRegulation�&�Policy�� |�� Industry�Assistance
Tools�of�the�Trade:�Growth�Strategies�for�Success
SOURCE: WWW.IBISWORLD.COM
Labo
r�Int
ensi
veCapital�Intensive
Change�in�Share�of�the�Economy
New�Age�Economy
Recreation,�Personal�Services,�Health�and�Education. Firms benefi t from personal wealth so stable macroeconomic conditions are imperative. Brand awareness and niche labor skills are key to product differentiation.
Traditional�Service�Economy
Wholesale�and�Retail. Reliant on labor rather than capital to sell goods. Functions cannot be outsourced therefore fi rms must use new technology or improve staff training to increase revenue growth.
Old�Economy
Agriculture�and�Manufacturing.�Traded goods can be produced using cheap labor abroad. To expand fi rms must merge or acquire others to exploit economies of scale, or specialize in niche, high-value products.
Investment�Economy
Information,�Communications,�Mining,�Finance�and�Real�Estate.�To increase revenue fi rms need superior debt management, a stable macroeconomic environment and a sound investment plan.
Public�Storage�&�Warehousing
Apartment�Rental
Storage�&�Warehouse�Leasing
Real�Estate�Sales�&�Brokerage
Mobile�Home�Site�&�Other�Leasing
Commercial�Leasing
Capital intensity
0.5
0.0
0.1
0.2
0.3
0.4
SOURCE: WWW.IBISWORLD.COMDotted line shows a high level of capital intensity
Capital units per labor unit
Commercial Leasing
Real Estate and Rental and
Leasing
Economy
Level��The level of capital intensity required is High

WWW.IBISWORLD.COM� Commercial�Leasing�in�the�US June 2011 34
Operating�Conditions
Revenue�Volatility In the five years to 2011, industry revenue is expected to fluctuate by about 4.7%. Revenue volatility is largely affected by general economic conditions. Revenue is mainly generated by rental income, interest income and capital gains. During times of economic growth
real estate assets appreciate and rental income rises. Rental prices are largely dependent on the value of underlying real estate assets and occupancy rates. Strong asset values and occupancy rates lead to higher rental income due to the basic economic principles of supply and
Technology&�Systems
Technology is used to manage back-office functions including accounting, bookkeeping and operations. The industry has benefited from the improvements in technology associated with storing, processing and accessing information. Automated services associated with accounts receivable have improved collectivity rates. The improvements in technology have also lowered costs associated with processing payments and analyzing data. This trend is expected to continue, especially as technology systems decrease in value. Investment real estate (IRE) software systems provide sophisticated transaction processing and analysis tools. IRE systems can be broken down into two categories: operational programs and decision-making support systems. Operational systems support day-to-day activities and are transactional in nature (e.g. property maintenance, management and accounting), while decisional support systems consolidate operational data with industry benchmarks and market assumptions to enable a strategic analysis of an asset portfolio (e.g. to
measure performance, forecast cash flows and support investment decisions).
The industry has also improved technologies related to energy efficiency. The US Green Building Council established guidelines and standards for producing energy efficient buildings. These standards are often referred to as the Leadership in Energy and Environment Design (LEED). LEED-certified buildings are energy efficient and green certified, because they substantially reduce operating costs, particularly in regards to utilities such as power and water. It is also important to note that some technology developments have the potential to hurt industry participants. Computer and communication technologies such as telecommuting have the potential to hurt the office market as more individuals are able to work from home. Computer, telephone and mail-based home shopping will command an increasing share of retail sales, reducing the space requirements of some retail stores. Factories and warehouses may also need less space as computer systems efficiently manage inventories and purchases.
Capital�Intensitycontinued
charges, as this shows the amount of industry revenue absorbed by labor inputs and capital inputs. Industry depreciation charges are estimated to account for about 3.0% of industry revenue in 2011, while wages are
expected to account for about 10.2% of industry income. As a result, the industry’s capital intensity ratio is expected to be about 0.69:1 in 2011, meaning for every dollar spent on labor only $0.69 was spent on capital.
Level��The level of Technology Change is Medium
Level��The level of Volatility is Medium

WWW.IBISWORLD.COM� Commercial�Leasing�in�the�US June 2011 35
Operating�Conditions
Regulation�&�Policy Industry participants are required to meet various building and safety codes to rent commercial real estate to companies and individuals. Regulations generally relate to handicap accessibility, fire codes, zoning restrictions and general construction standards. Environmental controls and zoning ordinances and restrictions are also relevant for the Commercial Leasing industry. In addition, various laws and regulations impose liability on real property owners or operators for the cost of investigating, cleaning up and removing property contamination caused by hazardous or toxic substances. A strong example of this type of regulation relates to the use and cleanup of asbestos, particularly within buildings that are old and/or outdated.
REIT sectorReal estate companies and developers can elect to be taxed as a REIT under Section 856 through 860 of the Internal Revenue Code. As a REIT, these organizations must distribute, at a minimum, an amount equal to 90.0% of taxable income and must distribute 100.0% of taxable income to avoid paying corporate federal income taxes. REITs are also subject to a number of organizational and operational requirements to retain their REIT status. They must be structured as a corporation, business trust, or similar association, and be managed by a board of directors or trustees. They must derive at least 75.0% of their gross income from rents or mortgage interests and at least
Revenue�Volatilitycontinued
demand. At the same time, capital gains improve because commercial lessors are able to sell property at a premium to the original purchase price.
Industry revenue is largely stable on a year-to-year basis due to its reliance on rental income which is locked up by lease agreements. Leases help maintain a steady stream of income due to the length of the contracts. Commercial
property leases generally range from 1 year to 25 years. However, a decline in economic activity lowers rental income over time due to the decrease in demand for both residential and commercial space. Commercial real estate demand decreases during economic downturns as companies generally downsize operations, cut expansion plans or go out of business.
SOURCE: WWW.IBISWORLD.COM
Volatility�vs�Growth
Reve
nue�
vola
tility
*�(%
)�1000
100
10
1
0.1
Five�year�annualized�revenue�growth�(%)�–30 –10 10 30 50 70
Hazardous
Stagnant
Rollercoaster
Blue�Chip
* Axis is in logarithmic scale
A higher level of revenue volatility implies greater industry risk. Volatility can negatively affect long-term strategic decisions, such as the time frame for capital investment.
When a fi rm makes poor investment decisions it may face underutilized capacity if demand suddenly falls, or capacity constraints if it rises quickly.
Commercial�Leasing
Level�&�Trend��The level of Regulation is Medium and the trend is Steady
WWW.IBISWORLD.COM� Commercial�Leasing�in�the�US June 2011 36
Operating�Conditions
Industry�Assistance The industry does not receive any type of direct subsidiaries or industry assistance. Instead, the industry has benefited indirectly from government programs that have focused on improving lending. These programs largely arose in response to the subprime mortgage crisis and the subsequent collapse of the credit markets. To improve lending, the government launched the $700 billion Trouble Asset Relief Program (TARP), which focused on strengthening the financial sector by purchasing assets and equity from financial institutions.
In addition to TARP, the Federal Reserve launched the $1 trillion Term Asset-Backed Securities Loan Facility (TALF) in November 2008. TALF was originally designed to support the issuance of asset-backed securities collateralized by student loans, auto loans, credit card loans and loans guaranteed by the Small Business
Administration. However, in May 2009, the Federal Reserve expanded the provisions of the program to include commercial mortgage-backed securities (CMBS). The program offers five-year loans to buy new AAA-rated new commercial mortgage-backed securities. This “lifeline” is an attempt to boost the downtrodden commercial property sector by making older loans eligible for an emergency program and revive troubled credit markets.
Lastly, the government has increasingly entered into sale and leaseback contracts with commercial real estate companies. This has benefited the industry because the sale and leaseback of property by various government agencies increases the demand for non-residential property. Government tenants are also low risk and considered secure creditors, which is important in assessing property values for commercial properties that contain long-term leases.
Regulation�&�Policycontinued
75.0% of their total investment assets must be in real estate. If an organization fails to qualify as a REIT in any taxable year, the organization will be subject to federal income tax on taxable income at regular corporate tax rates. Even if the organization qualifies for taxation as a REIT, it may be subject to state and local income taxes and to federal income tax and excise tax on its undistributed income.
In 1999, Congress passed the REIT Modernization Act (RMA). The RMA went into effect in 2001 and its primary goal was to strengthen the REIT market. REITs are now able to own up to 100.0% of the stock of a Taxable REIT Subsidiary. The act also lowered the distribution requirement of REITs from 95.0% to 90.0% of net income. The RMA benefits REITs because
companies are now allowed to retain a greater portion of its earnings for investment by allocating a portion of income to the subsidiary. However, transactions between a REIT and the subsidiary must be conducted on an arm’s length basis or there will be a 100.0% excise tax imposed on the exchange. An “arm’s length” basis refers to a transaction between two related or affiliated parties that is conducted as if they were unrelated, so that there is no question of a conflict of interest. There are also additional requirements that must be met for a REIT to properly manage a taxable subsidiary, including debt levels, ownership values and voting rights. For example a REIT will not be able to own more than 10.0%, voting or value, of securities of a non-REIT C Corporation.
Level�&�Trend��The level of Industry Assistance is Low and the trend is Steady
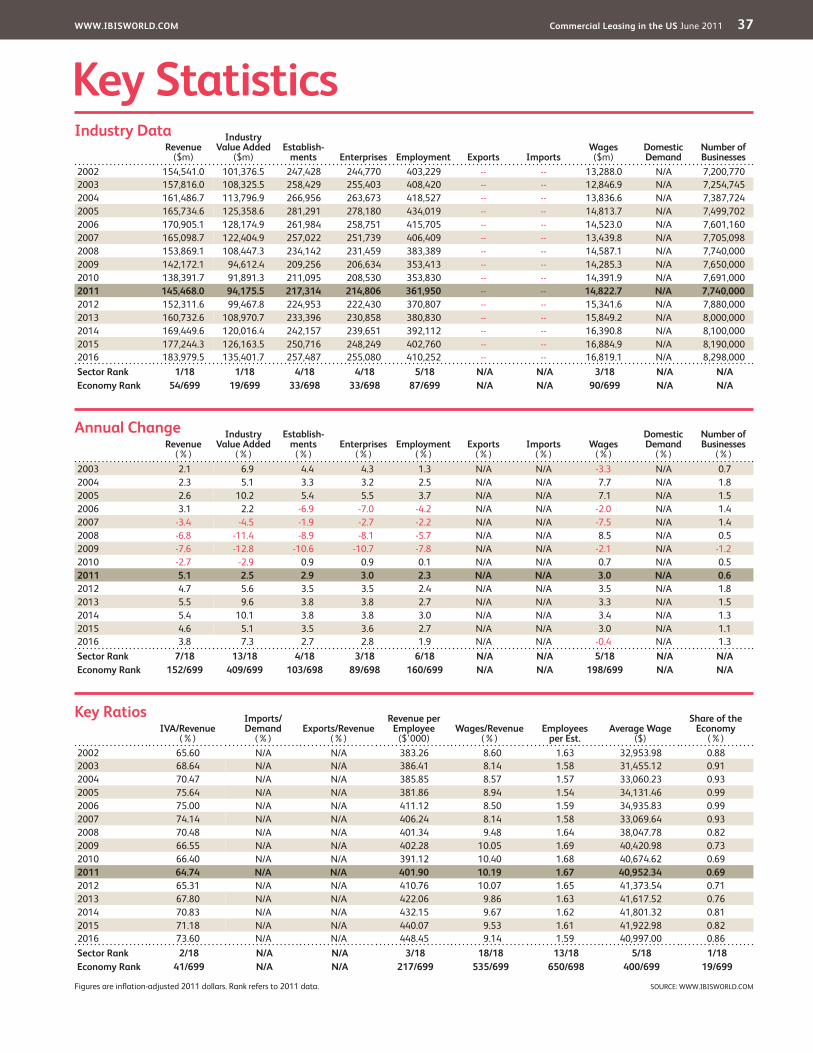
WWW.IBISWORLD.COM� Commercial�Leasing�in�the�US June 2011 37
�Key�StatisticsRevenue�
($m)
Industry�Value�Added�
($m)Establish-
ments Enterprises Employment Exports ImportsWages�($m)
Domestic�Demand
Number�of�Businesses
2002 154,541.0 101,376.5 247,428 244,770 403,229 -- -- 13,288.0 N/A 7,200,7702003 157,816.0 108,325.5 258,429 255,403 408,420 -- -- 12,846.9 N/A 7,254,7452004 161,486.7 113,796.9 266,956 263,673 418,527 -- -- 13,836.6 N/A 7,387,7242005 165,734.6 125,358.6 281,291 278,180 434,019 -- -- 14,813.7 N/A 7,499,7022006 170,905.1 128,174.9 261,984 258,751 415,705 -- -- 14,523.0 N/A 7,601,1602007 165,098.7 122,404.9 257,022 251,739 406,409 -- -- 13,439.8 N/A 7,705,0982008 153,869.1 108,447.3 234,142 231,459 383,389 -- -- 14,587.1 N/A 7,740,0002009 142,172.1 94,612.4 209,256 206,634 353,413 -- -- 14,285.3 N/A 7,650,0002010 138,391.7 91,891.3 211,095 208,530 353,830 -- -- 14,391.9 N/A 7,691,0002011 145,468.0 94,175.5 217,314 214,806 361,950 -- -- 14,822.7 N/A 7,740,0002012 152,311.6 99,467.8 224,953 222,430 370,807 -- -- 15,341.6 N/A 7,880,0002013 160,732.6 108,970.7 233,396 230,858 380,830 -- -- 15,849.2 N/A 8,000,0002014 169,449.6 120,016.4 242,157 239,651 392,112 -- -- 16,390.8 N/A 8,100,0002015 177,244.3 126,163.5 250,716 248,249 402,760 -- -- 16,884.9 N/A 8,190,0002016 183,979.5 135,401.7 257,487 255,080 410,252 -- -- 16,819.1 N/A 8,298,000Sector�Rank 1/18 1/18 4/18 4/18 5/18 N/A N/A 3/18 N/A N/AEconomy�Rank 54/699 19/699 33/698 33/698 87/699 N/A N/A 90/699 N/A N/A
IVA/Revenue�(%)
Imports/Demand�
(%)Exports/Revenue�
(%)
Revenue�per�Employee�
($’000)Wages/Revenue�
(%)Employees�
per�Est.Average�Wage�
($)
Share�of�the�Economy�
(%)2002 65.60 N/A N/A 383.26 8.60 1.63 32,953.98 0.882003 68.64 N/A N/A 386.41 8.14 1.58 31,455.12 0.912004 70.47 N/A N/A 385.85 8.57 1.57 33,060.23 0.932005 75.64 N/A N/A 381.86 8.94 1.54 34,131.46 0.992006 75.00 N/A N/A 411.12 8.50 1.59 34,935.83 0.992007 74.14 N/A N/A 406.24 8.14 1.58 33,069.64 0.932008 70.48 N/A N/A 401.34 9.48 1.64 38,047.78 0.822009 66.55 N/A N/A 402.28 10.05 1.69 40,420.98 0.732010 66.40 N/A N/A 391.12 10.40 1.68 40,674.62 0.692011 64.74 N/A N/A 401.90 10.19 1.67 40,952.34 0.692012 65.31 N/A N/A 410.76 10.07 1.65 41,373.54 0.712013 67.80 N/A N/A 422.06 9.86 1.63 41,617.52 0.762014 70.83 N/A N/A 432.15 9.67 1.62 41,801.32 0.812015 71.18 N/A N/A 440.07 9.53 1.61 41,922.98 0.822016 73.60 N/A N/A 448.45 9.14 1.59 40,997.00 0.86Sector�Rank 2/18 N/A N/A 3/18 18/18 13/18 5/18 1/18Economy�Rank 41/699 N/A N/A 217/699 535/699 650/698 400/699 19/699
Figures are inflation-adjusted 2011 dollars. Rank refers to 2011 data.
Revenue�(%)
Industry�Value�Added�
(%)
Establish-ments�
(%)Enterprises�
(%)Employment�
(%)Exports�
(%)Imports�
(%)Wages�
(%)
Domestic�Demand�
(%)
Number�of�Businesses�
(%)2003 2.1 6.9 4.4 4.3 1.3 N/A N/A -3.3 N/A 0.72004 2.3 5.1 3.3 3.2 2.5 N/A N/A 7.7 N/A 1.82005 2.6 10.2 5.4 5.5 3.7 N/A N/A 7.1 N/A 1.52006 3.1 2.2 -6.9 -7.0 -4.2 N/A N/A -2.0 N/A 1.42007 -3.4 -4.5 -1.9 -2.7 -2.2 N/A N/A -7.5 N/A 1.42008 -6.8 -11.4 -8.9 -8.1 -5.7 N/A N/A 8.5 N/A 0.52009 -7.6 -12.8 -10.6 -10.7 -7.8 N/A N/A -2.1 N/A -1.22010 -2.7 -2.9 0.9 0.9 0.1 N/A N/A 0.7 N/A 0.52011 5.1 2.5 2.9 3.0 2.3 N/A N/A 3.0 N/A 0.62012 4.7 5.6 3.5 3.5 2.4 N/A N/A 3.5 N/A 1.82013 5.5 9.6 3.8 3.8 2.7 N/A N/A 3.3 N/A 1.52014 5.4 10.1 3.8 3.8 3.0 N/A N/A 3.4 N/A 1.32015 4.6 5.1 3.5 3.6 2.7 N/A N/A 3.0 N/A 1.12016 3.8 7.3 2.7 2.8 1.9 N/A N/A -0.4 N/A 1.3Sector�Rank 7/18 13/18 4/18 3/18 6/18 N/A N/A 5/18 N/A N/AEconomy�Rank 152/699 409/699 103/698 89/698 160/699 N/A N/A 198/699 N/A N/A
Annual�Change
Key�Ratios
Industry�Data
SOURCE: WWW.IBISWORLD.COM

WWW.IBISWORLD.COM� Commercial�Leasing�in�the�US June 2011 38
Jargon�&�Glossary
BARRIERS�TO�ENTRY Barriers to entry can be High, Medium or Low. High means new companies struggle to enter an industry, while Low means it is easy for a firm to enter an industry.
CAPITAL/LABOR�INTENSITY An indicator of how much capital is used in production as opposed to labor. Level is stated as High, Medium or Low. High is a ratio of less than $3 of wage costs for every $1 of depreciation; Medium is $3 – $8 of wage costs to $1 of depreciation; Low is greater than $8 of wage costs for every $1 of depreciation.
CONSTANT�PRICES The dollar figures in the Key Statistics table, including forecasts, are adjusted for inflation using 2011 as the base year. This removes the impact of changes in the purchasing power of the dollar, leaving only the ‘real’ growth or decline in industry metrics. The inflation adjustments in IBISWorld’s reports are made using the US Bureau of Economic Analysis’ implicit GDP price deflator.
DOMESTIC�DEMAND The use of goods and services within the US; the sum of imports and domestic production minus exports.
EARNINGS�BEFORE�INTEREST�AND�TAX�(EBIT)� IBISWorld uses EBIT as an indicator of a company’s profitability. It is calculated as revenue minus expenses, excluding tax and interest.
EMPLOYMENT The number of working proprietors, partners, permanent, part-time, temporary and casual employees, and managerial and executive employees.
ENTERPRISE A division that is separately managed and keeps management accounts. The most relevant measure of the number of firms in an industry.
ESTABLISHMENT The smallest type of accounting unit within an Enterprise; usually consists of one or more locations in a state or territory of the country in which it operates.
EXPORTS The total sales and transfers of goods produced by an industry that are exported.
IMPORTS The value of goods and services imported with the amount payable to non-residents.
INDUSTRY�CONCENTRATION IBISWorld bases concentration on the top four firms. Concentration is identified as High, Medium or Low. High means the top four players account for over 70% of revenue; Medium is 40 –70% of revenue; Low is less than 40%.
INDUSTRY�REVENUE The total sales revenue of the industry, including sales (exclusive of excise and sales tax) of goods and services; plus transfers to other firms of the same business; plus subsidies on production; plus all other operating income from outside the firm (such as commission income, repair and service income, and rent, leasing and hiring income); plus capital work done by rental or lease. Receipts from interest royalties, dividends and the sale of fixed tangible assets are excluded.
INDUSTRY�VALUE�ADDED The market value of goods and services produced by an industry minus the cost of goods and services used in the production process, which leaves the gross product of the industry (also called its Value Added).
INTERNATIONAL�TRADE The level is determined by: Exports/Revenue: Low is 0 –5%; Medium is 5 –20%; High is over 20%. Imports/Domestic Demand: Low is 0 –5%; Medium is 5 –35%; and High is over 35%.
Industry�Jargon
IBISWorld�Glossary
CLASS�A�BUILDING A commercial office building that commands the highest rent due to the attractiveness and prestige associated with its location, tenancy, amenities and overall desirability.
FUNDS�FROM�OPERATIONS�(FFO)� A measurement used to define cash flow from operations for REITs and calculated by adding depreciation and amortization expenses to earnings.
LEADERSHIP�IN�ENERGY�AND�ENVIRONMENT�DESIGN�(LEED)� An environmental building certificate program established under the US Green Building Council that certifies buildings meet energy-efficiency and green requirements.
LOAN-TO-VALUE�RATIO�(LTV)� A ratio used to determine how much of a property is being financed or leveraged. For example, a $100,000 house with a mortgage of $80,000 has an LTV ratio of 80.0%.
MEZZANINE�FINANCING Financing that has debt and equity characteristics, consisting of equity-based options, such as warrants, combined with lower-priority subordinate debt.
OCCUPANCY�RATE The rate of available spots at a center or a building that are filled. A rate of at least 70.0% is necessary for a center to be profitable.
REAL�ESTATE�INVESTMENT�TRUST�(REIT)� A legal entity that uses pooled investor capital to purchase and manage income property or mortgage loans. To qualify as a REIT, the entity must distribute at least 90.0% of taxable income.
RENT�AGREEMENT An agreement that is similar to a lease but does not have a set period of occupancy. Landlords and tenants are free to make changes to the contract at the end of each 30-day period.
VACANCY�RATE The amount of real estate space unoccupied as a percentage of total available space.

WWW.IBISWORLD.COM� Commercial�Leasing�in�the�US June 2011 39
Jargon�&�Glossary
LIFE�CYCLE All industries go through periods of Growth, Maturity and Decline. An average life cycle lasts 70 years. Maturity is the longest stage at 40 years with Growth and Decline at 15 years each.
NON-EMPLOYING�ESTABLISHMENT Businesses with no paid employment and payroll are known as non-employing establishments. These are mostly set-up by self employed individuals.
VOLATILITY The level of volatility is determined by the percentage change in revenue over the past five years. Volatility levels: Very High is greater than ±20%; High Volatility is between ±10% and ±20%; Moderate Volatility is between ±3% and ±10%; and Low Volatility is less than ±3%.
WAGES The gross total wages and salaries of all employees of the establishment.
IBISWorld�Glossarycontinued

Disclaimer
This product has been supplied by IBISWorld Inc. (‘IBISWorld’) solely for use by its authorized licenses strictly in accordance with their license agreements with IBISWorld. IBISWorld makes no representation to any other person with regard to the completeness or accuracy of the data or information contained herein, and it accepts no responsibility and disclaims all liability (save for liability which cannot be lawfully disclaimed) for loss or damage whatsoever suffered or incurred by any other person resulting from the use
of, or reliance upon, the data or information contained herein. Copyright in this publication is owned by IBISWorld Inc. The publication is sold on the basis that the purchaser agrees not to copy the material contained within it for other than the purchasers own purposes. In the event that the purchaser uses or quotes from the material in this publication – in papers, reports, or opinions prepared for any other person – it is agreed that it will be sourced to: IBISWorld Inc.
At IBISWorld we know that industry intelligence is more than assembling factsIt is combining data with analysis to answer the questions that successful businesses askIdentify�high�growth,�emerging�&�shrinking�marketsArm�yourself�with�the�latest�industry�intelligenceAssess�competitive�threats�from�existing�&�new�entrantsBenchmark�your�performance�against�the�competitionMake�speedy�market-ready,�profit-maximizing�decisions
Who�is�IBISWorld?We are strategists, analysts, researchers, and marketers. We provide answers to information-hungry, time-poor businesses. Our goal is to provide real world answers that matter to your business in our 700 US industry reports. When tough strategic, budget, sales and marketing decisions need to be made, our suite of Industry and Risk intelligence products give you deeply-researched answers quickly.
IBISWorld�MembershipIBISWorld offers tailored membership packages to meet your needs.
Copyright 2011 IBISWorld Inc
www.ibisworld.com��|��1800-330-3772��| ��[email protected]