
REPORT & ACCOUNTS 2017 DERWENT LONDON PLC · £50 per sq ft. During 2017 we let the remaining...
107
REPORT & ACCOUNTS 2017 DERWENT LONDON PLC
Transcript of REPORT & ACCOUNTS 2017 DERWENT LONDON PLC · £50 per sq ft. During 2017 we let the remaining...

REPORT & ACCOUNTS 2017
DERWENT LONDON PLC
Derwent London plc Report &
Accounts 2017
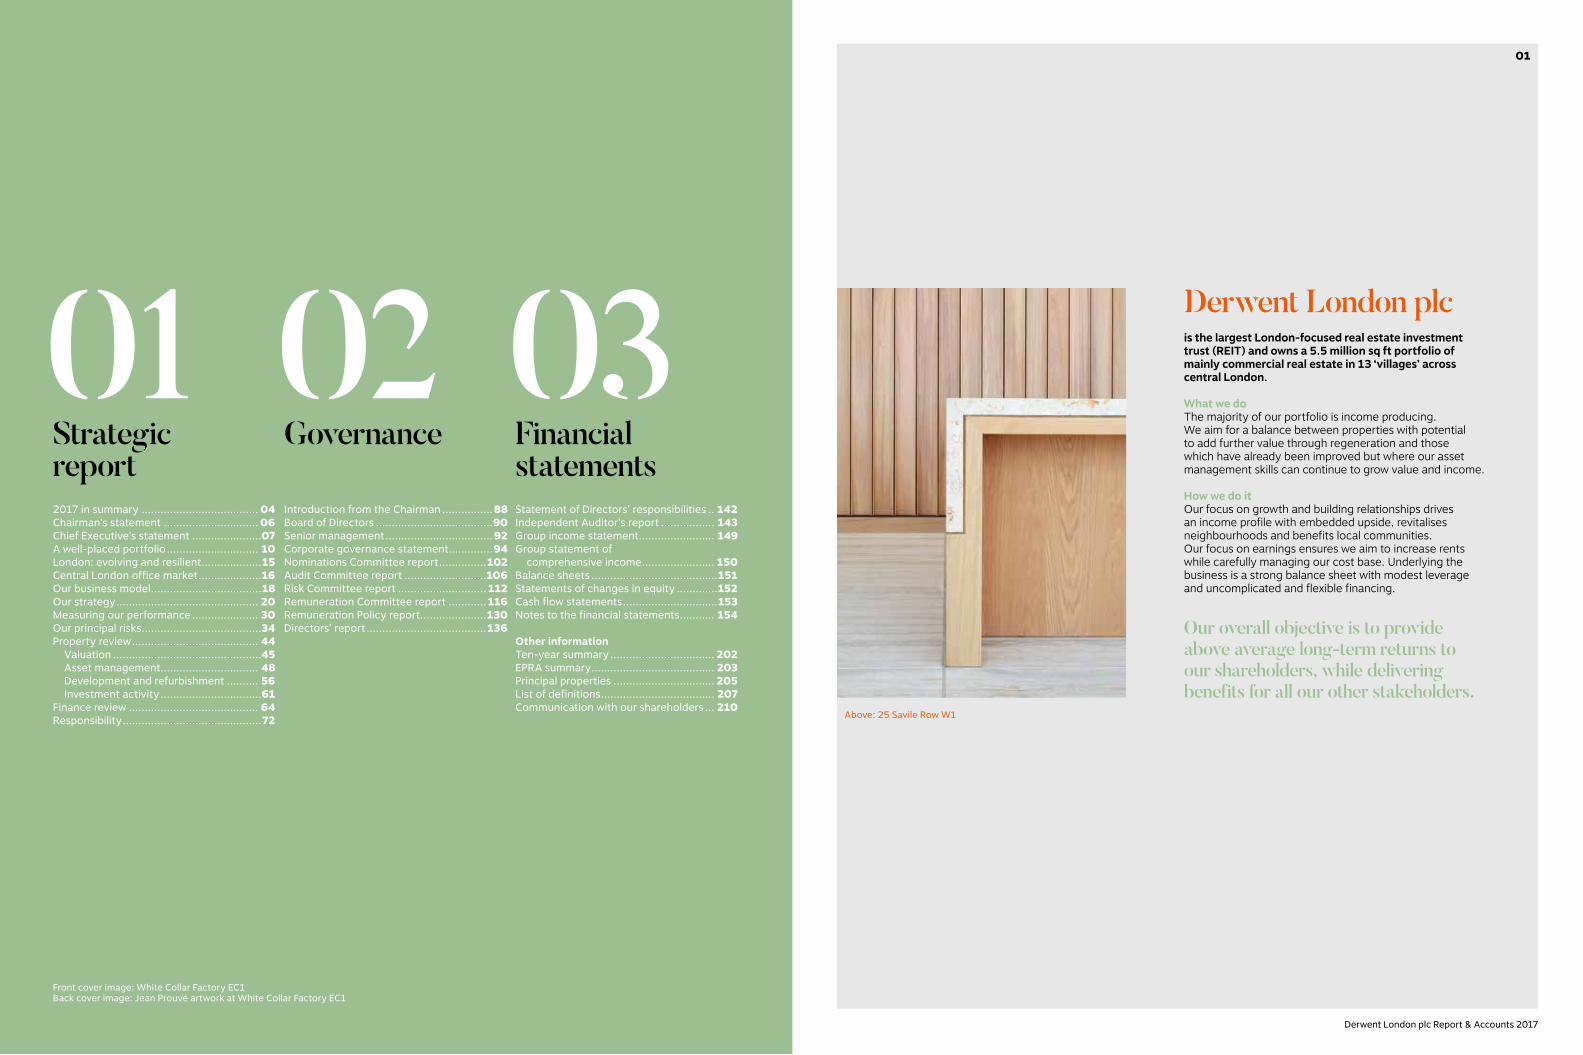
is the largest London-focused real estate investment trust (REIT) and owns a 5.5 million sq ft portfolio of mainly commercial real estate in 13 ‘villages’ across central London.
What we doThe majority of our portfolio is income producing. We aim for a balance between properties with potential to add further value through regeneration and those which have already been improved but where our asset management skills can continue to grow value and income.
How we do itOur focus on growth and building relationships drives an income profile with embedded upside, revitalises neighbourhoods and benefits local communities. Our focus on earnings ensures we aim to increase rents while carefully managing our cost base. Underlying the business is a strong balance sheet with modest leverage and uncomplicated and flexible financing.
Derwent London plc
Our overall objective is to provide above average long-term returns to our shareholders, while delivering benefits for all our other stakeholders.
Front cover image: White Collar Factory EC1Back cover image: Jean Prouvé artwork at White Collar Factory EC1
Above: 25 Savile Row W1
Strategic report
Governance Financial statements
01 02 032017 in summary .....................................04Chairman’s statement ..............................06Chief Executive’s statement ......................07A well-placed portfolio ............................. 10London: evolving and resilient ...................15Central London office market ....................16Our business model ...................................18Our strategy ............................................. 20Measuring our performance ..................... 30Our principal risks ......................................34Property review ........................................ 44 Valuation ...............................................45 Asset management ............................... 48 Development and refurbishment .......... 56 Investment activity ................................61Finance review ......................................... 64Responsibility ............................................72
Introduction from the Chairman ................88Board of Directors .....................................90Senior management ..................................92Corporate governance statement..............94Nominations Committee report ...............102Audit Committee report ..........................106Risk Committee report ............................112Remuneration Committee report ............116Remuneration Policy report .....................130Directors’ report ......................................136
Statement of Directors’ responsibilities .. 142Independent Auditor’s report ................. 143Group income statement ........................ 149Group statement of
comprehensive income ....................... 150Balance sheets ........................................151Statements of changes in equity .............152Cash flow statements ..............................153Notes to the financial statements ........... 154
Other informationTen-year summary .................................202EPRA summary ....................................... 203Principal properties ................................205List of definitions .................................... 207Communication with our shareholders ... 210
01
Derwent London plc Report & Accounts 2017

Strategic report
012017 in summary .....................................04 Chairman’s statement ..............................06 Chief Executive’s statement ......................07A well-placed portfolio ............................. 10London: evolving and resilient ...................15Central London office market ....................16 Our business model ...................................18 Our strategy ............................................. 20 Measuring our performance ..................... 30Our principal risks ......................................34 Property review ........................................ 44 Valuation ...............................................45 Asset management ............................... 48 Development and refurbishment .......... 56 Investment activity ................................61 Finance review ......................................... 64 Responsibility ............................................72
Above and left: The Copyright Building W1
Derwent London plc Report & Accounts 2017
02
Derwent London plc Report & Accounts 2017
03
Our responsibility– Our carbon intensity down 15%– Supported 19 local community projects– 99% of staff surveyed ‘proud to work
for Derwent London’p.06 Chairman’s statement
p.72 Responsibility
p.75 Case study: 25 Savile Row W1
p.76 Case study: COP21
Our central London market– Good levels of take-up– Economic and political uncertainty
p.16 Central London office market
Our portfolio– Underlying capital value rose 3.9%– Vacancy rate halved to 1.3%
p.10 A well-placed portfolio
Our main priorities for 2017All achieved– To deliver on our schemes– To de-risk our pipeline via pre-letting
and fixing our construction costs– To monitor for asset management
and disposal opportunitiesp.20 Our strategy
p.54 Case study: Asset management
Our performancep.30 KPIs
p.116 Remuneration
Our balanced risk profilep.34 Our principal risks
p.87 Governance
2017 in summary
Property reviewp.44
Case study: 80 Charlotte Streetp.52Property reviewp.44
Asset management
Development
& refurbishment
Investment activity
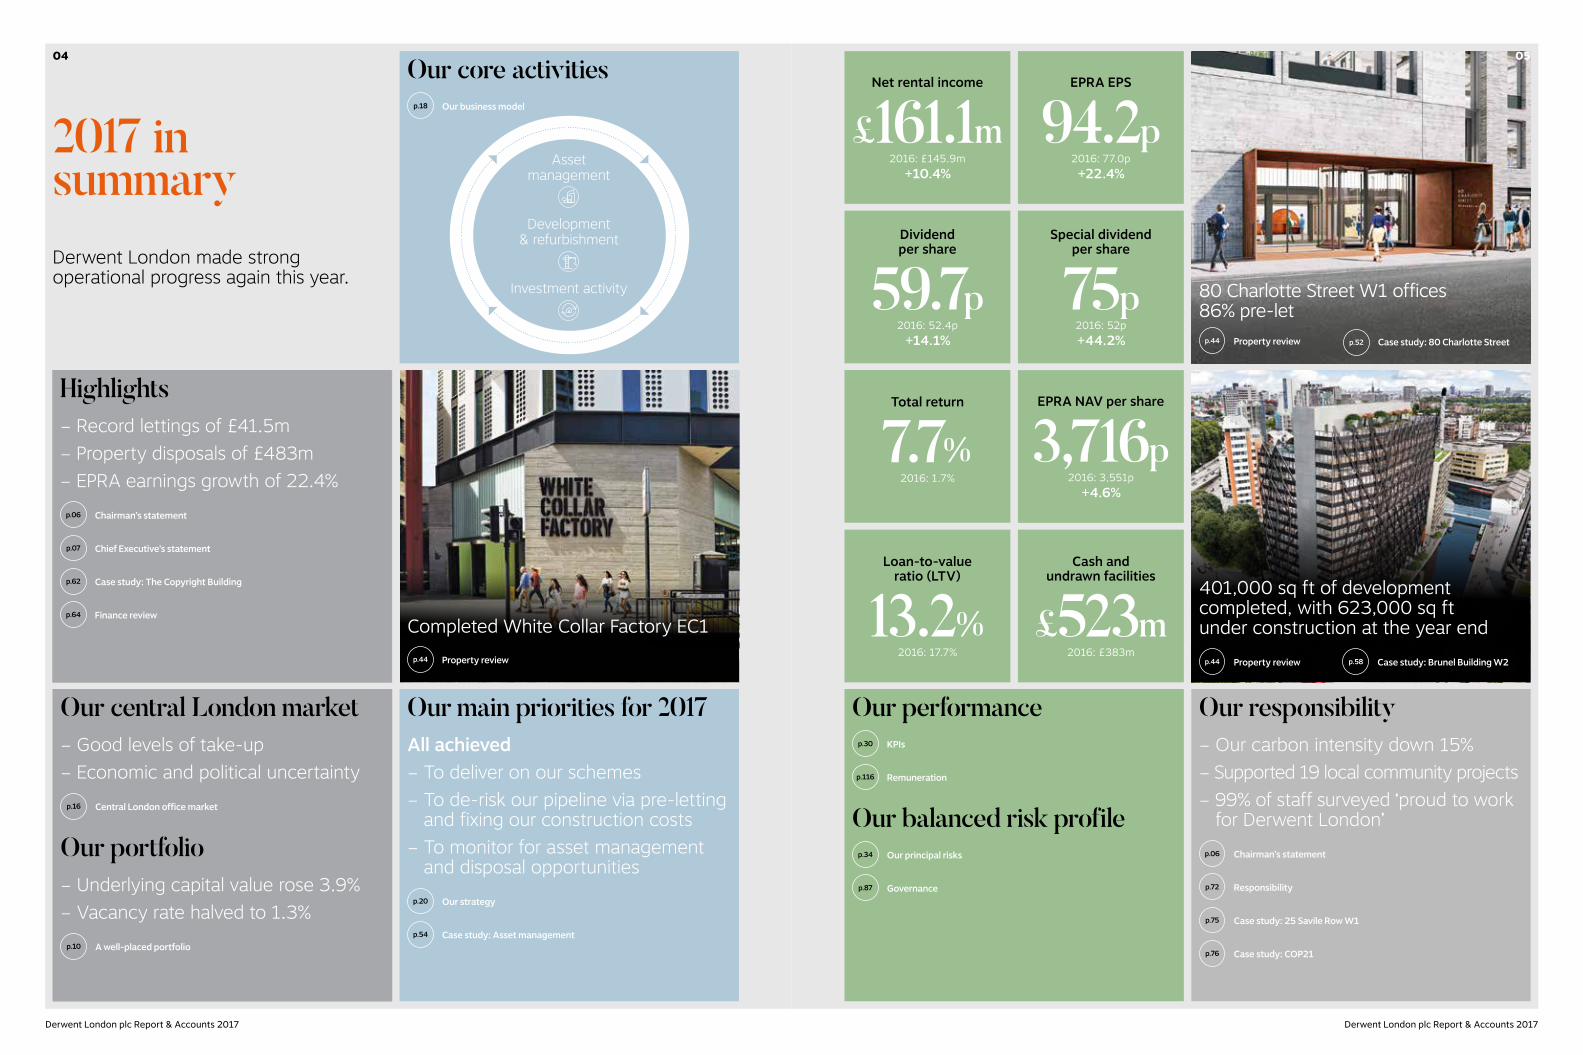
Completed White Collar Factory EC1
80 Charlotte Street W1 offices 86% pre-let
Derwent London made strong operational progress again this year.
Highlights– Record lettings of £41.5m– Property disposals of £483m– EPRA earnings growth of 22.4%
p.06 Chairman’s statement
p.07 Chief Executive’s statement
p.62 Case study: The Copyright Building
p.64 Finance review
Our core activitiesp.18 Our business model
401,000 sq ft of development completed, with 623,000 sq ft under construction at the year end
p.44 Property review p.58 Case study: Brunel Building W2
EPRA NAV per share
3,716p2016: 3,551p
+4.6%
Dividend per share
59.7p2016: 52.4p
+14.1%
Special dividend per share
75p2016: 52p+44.2%
Net rental income
£161.1m2016: £145.9m
+10.4%
EPRA EPS
94.2p2016: 77.0p+22.4%
Loan-to-value ratio (LTV)
13.2%2016: 17.7%
Total return
7.7%2016: 1.7%
Cash and undrawn facilities
£523m2016: £383m
04
Derwent London plc Report & Accounts 2017 Derwent London plc Report & Accounts 2017
05

Operationally we have had another excellent year, setting a record for new lettings with £41.5m achieved. During the year we completed White Collar Factory EC1, a demonstration of how we regenerate important locations through the creation of innovative office space.
In addition we extended a number of leases, notably on our major assets at Angel Building EC1 and Tea Building E1. These management activities have had the impact of increasing income while £482.8m of property disposals reduced debt levels. Together these provided further evidence of the attractions of the Derwent London brand to both occupiers and property investors.
London office values have firmed during the last year and our NAV rose 4.6% to 3,716p per share in 2017. Our underlying earnings grew more strongly, up 22.4% to 94.2p per share principally due to recent development completions. After a 25% rise in the 2016 final dividend, this earnings growth enabled us to raise the 2017 interim dividend by 25% too. We have now reverted to a growth rate closer to our long term trend and propose raising the 2017 final dividend by 10.1% to 42.4p per share. The final dividend will be paid on 8 June 2018 to investors on the share register on 4 May 2018. In the nine years since our first full year as a UK REIT, our annual compound growth in net assets, earnings and dividends per share has been 13.2%, 17.7% and 10.4%, respectively.
The London office market remained resilient in 2017 as both occupier and investor demand has been strong. Although leasing incentives have increased in some instances and deals take longer to complete, prices remain firm.
Longer term demand will depend on the continuing strength of the London economy, the impact of the UK’s final Brexit settlement and what actions the UK subsequently takes.
While our developments continue to take the limelight with their design flair and pre-letting successes, it is equally important we actively manage our income-producing assets which represent 86% of the portfolio. These divide into core income and properties earmarked for future development. In 2017 we had significant success extending leases and raising income, and this year we have opportunities to do more of the same.
Our focus on designing office space with the flexibility that today’s occupiers require in improving areas and at middle-market rents continues to serve us well. The average ‘topped-up’ rent on our London office portfolio is an undemanding £50 per sq ft. During 2017 we let the remaining available space at The White Chapel Building E1 and all of the White Collar Factory tower, as well as pre-letting or placing under option virtually all of our largest project ever at 80 Charlotte Street W1. The latter has been committed to by major international companies, Arup and The Boston Consulting Group, nearly two years ahead of expected completion.
Robert RayneChairman
Chairman’s statement
Chief Executive’s statementJohn BurnsChief Executive
p.08 Continued p.09 Continued
0706
Derwent London plc Report & Accounts 2017 Derwent London plc Report & Accounts 2017

This performance does not include last year’s 52.0p per share special dividend, which was paid out in response to a number of value enhancing transactions announced with our last full year’s results.
We have continued to make highly profitable disposals which, together with rising underlying property values, have seen our loan-to-value ratio (LTV) move to exceptionally low levels. As a result the Board has decided to propose another special dividend totalling 75.0p per share or £84m which will be paid with the final dividend in June 2018.
Our developments continue to win awards and our Annual Sustainability Report to be published simultaneously with our Annual Report demonstrates our commitment to the environment and wider stakeholders. Highlights from 2017 include White Collar Factory achieving a BREEAM ‘Outstanding’ and LEED ‘Platinum’ on completion, the highest levels possible. Our managed portfolio achieved a significant reduction in energy consumption, and the Derwent London Community Fund has been established for over five years during which time it has invested in 56 different local projects and grass roots initiatives.
Helen Gordon, CEO of Grainger plc, was appointed as an independent non-executive Director with effect from 1 January 2018. We welcome her and her extensive knowledge of the real estate market. Tim Kite, who was appointed Company Secretary in 1995, retired in October 2017 and we wish to thank him for his valued assistance over the years. His successor, David Lawler, brings with him considerable experience in a similar role.
We have a strategically placed property portfolio and considerable financial resources which are greatly enhanced through the skills of our people and their relationships with occupiers, investors, local communities, suppliers and advisors. I would like to thank the Derwent London team for ensuring that we continue to make the most of our available opportunities in a way that also allows other businesses to thrive and creates long term value for the communities in which we operate, as well as achieving above average long-term returns for our investors.
Robert RayneChairman
27 February 2018
Our product and locations are also attractive to investors as we made £482.8m of investment sales last year, 11.8% above December 2016 values. These deals, together with important lease extensions, show the ongoing appeal of our buildings which continue to anticipate the trends in tenants’ occupational requirements.
In addition to 80 Charlotte Street, the Brunel Building, Paddington W2 is our other major scheme due for completion in 2019 and together these total 623,000 sq ft. We have largely pre-let the former and are seeing good occupier interest in the latter. During 2017 we received resolutions to grant planning consent for an additional 443,000 sq ft of development at 19-35 Baker Street W1 and Holden House W1 which means that at the year end we had 853,000 sq ft1 of consented potential schemes. Included in this is Soho Place W1, where we took possession in January 2018 and have now started preliminary works on one of central London’s most prominent sites located over the new Tottenham Court Road Elizabeth line station.
Our developments represent the major contributor to our income growth. At the year end we had £110m of portfolio reversion of which 40% related to rent free periods and minimum uplifts. This means that £44.2m is already taken into account in our reported earnings. Therefore earnings growth will be driven principally by the remaining £65.8m of potential upside. The letting of developments and refurbishments represents 74% of this growth.
With an EPRA vacancy rate of only 1.3%, we start 2018 with less immediate space available than last year. Our current development pipeline, including Soho Place, totals 908,000 sq ft and is 30% pre-let, and we have a further 165,000 sq ft under refurbishment which is 54% pre-let. Our success in letting the available space will be an important indicator of market conditions and determine the timing of the other projects in our substantial long-term pipeline.
Following last year’s major disposals, the Group had cash and undrawn facilities of £523m at the year end. This year’s special dividend will cost £84m and our expected development expenditure over the next four years, including Soho Place, is £574m. Our LTV would rise from 13.2% to a proforma 24% after allowing for this expenditure.
OutlookWe have an exceptional pipeline of existing opportunities, good interest in our product and the business is particularly well placed, despite the ongoing political and economic uncertainty. With a robust financial position, we are under no pressure to make disposals but rather, we are looking to further grow our portfolio. Against this background, we estimate that in 2018 our average ERV growth will be +2% to -3% and property yields will be broadly stable. Given the projects due for delivery in 2019 are already 45% pre-let, we remain confident in our longer term earnings growth. Based on these prospects, we expect to raise our 2018 dividend by 10%. For the longer term, we have started preliminary works at Soho Place and have planning consent for a number of other exciting future projects.
John BurnsChief Executive
27 February 2018
Chairman’s statementcontinued
Chief Executive’s statementcontinued
Strong performanceAbove: White Collar Factory EC1 1 This figure includes 132,000 sq ft attributable
to minority interests
Total property returnMeasures the income and
capital return on our portfolio
+8.0%Exceeding our benchmark,
the MSCI IPD Central London Offices Index, of +7.1%
Total shareholder returnMeasures our share price
and dividend performance
+15.6%Outperforming the
FTSE 350 Real Estate Index return of +13.1%
BREEAM ratingsMeasures environmental impact
of commercial buildings
‘Outstanding’White Collar Factory achieved
‘Outstanding’, exceeding our target of ‘Excellent’
Tenant retention/re-letsMeasures our ability to retain or
re-let space following lease expiry
92%Tenant retention of 57%
was within our target range of 50-75%
Development potentialWe monitor the proportion of our
portfolio with the potential for refurbishment or redevelopment
44%Within our target
range of 35%-45%
Reversionary percentageMeasures the growth in passing
rents, assuming the rent increased to ERV and all current developments
were completed and let
69%Down from 89% in 2016, reflecting strong
letting and disposal activity in 2017
0908
Derwent London plc Report & Accounts 2017 Derwent London plc Report & Accounts 2017
Bond Street
Hyde Park
GreenPark
St James’sPark
RanelaghGardens
KensingtonGardens
SouthwarkPark
Regent’s Park
River �ames
Rive
r �am
es
PADDINGTON
BAKER STREET/MARYLEBONE
MAYFAIR
VICTORIA
ST JAMES’S
SOHO/COVENT GARDEN
FITZROVIA
CLERKENWELLSHOREDITCH
WHITECHAPELHOLBORN
OLD STREET
THE CITY
BLOOMSBURY
ISLINGTON
NORTH OF OXFORD
STREET
Liverpool Street Farringdon
Tottenham Court Road
Paddington
Whitechapel
King’s CrossSt. Pancras
Victoria
Euston
Waterloo
Cannon Street
London Bridge
Blackfriars
Fenchurch Street
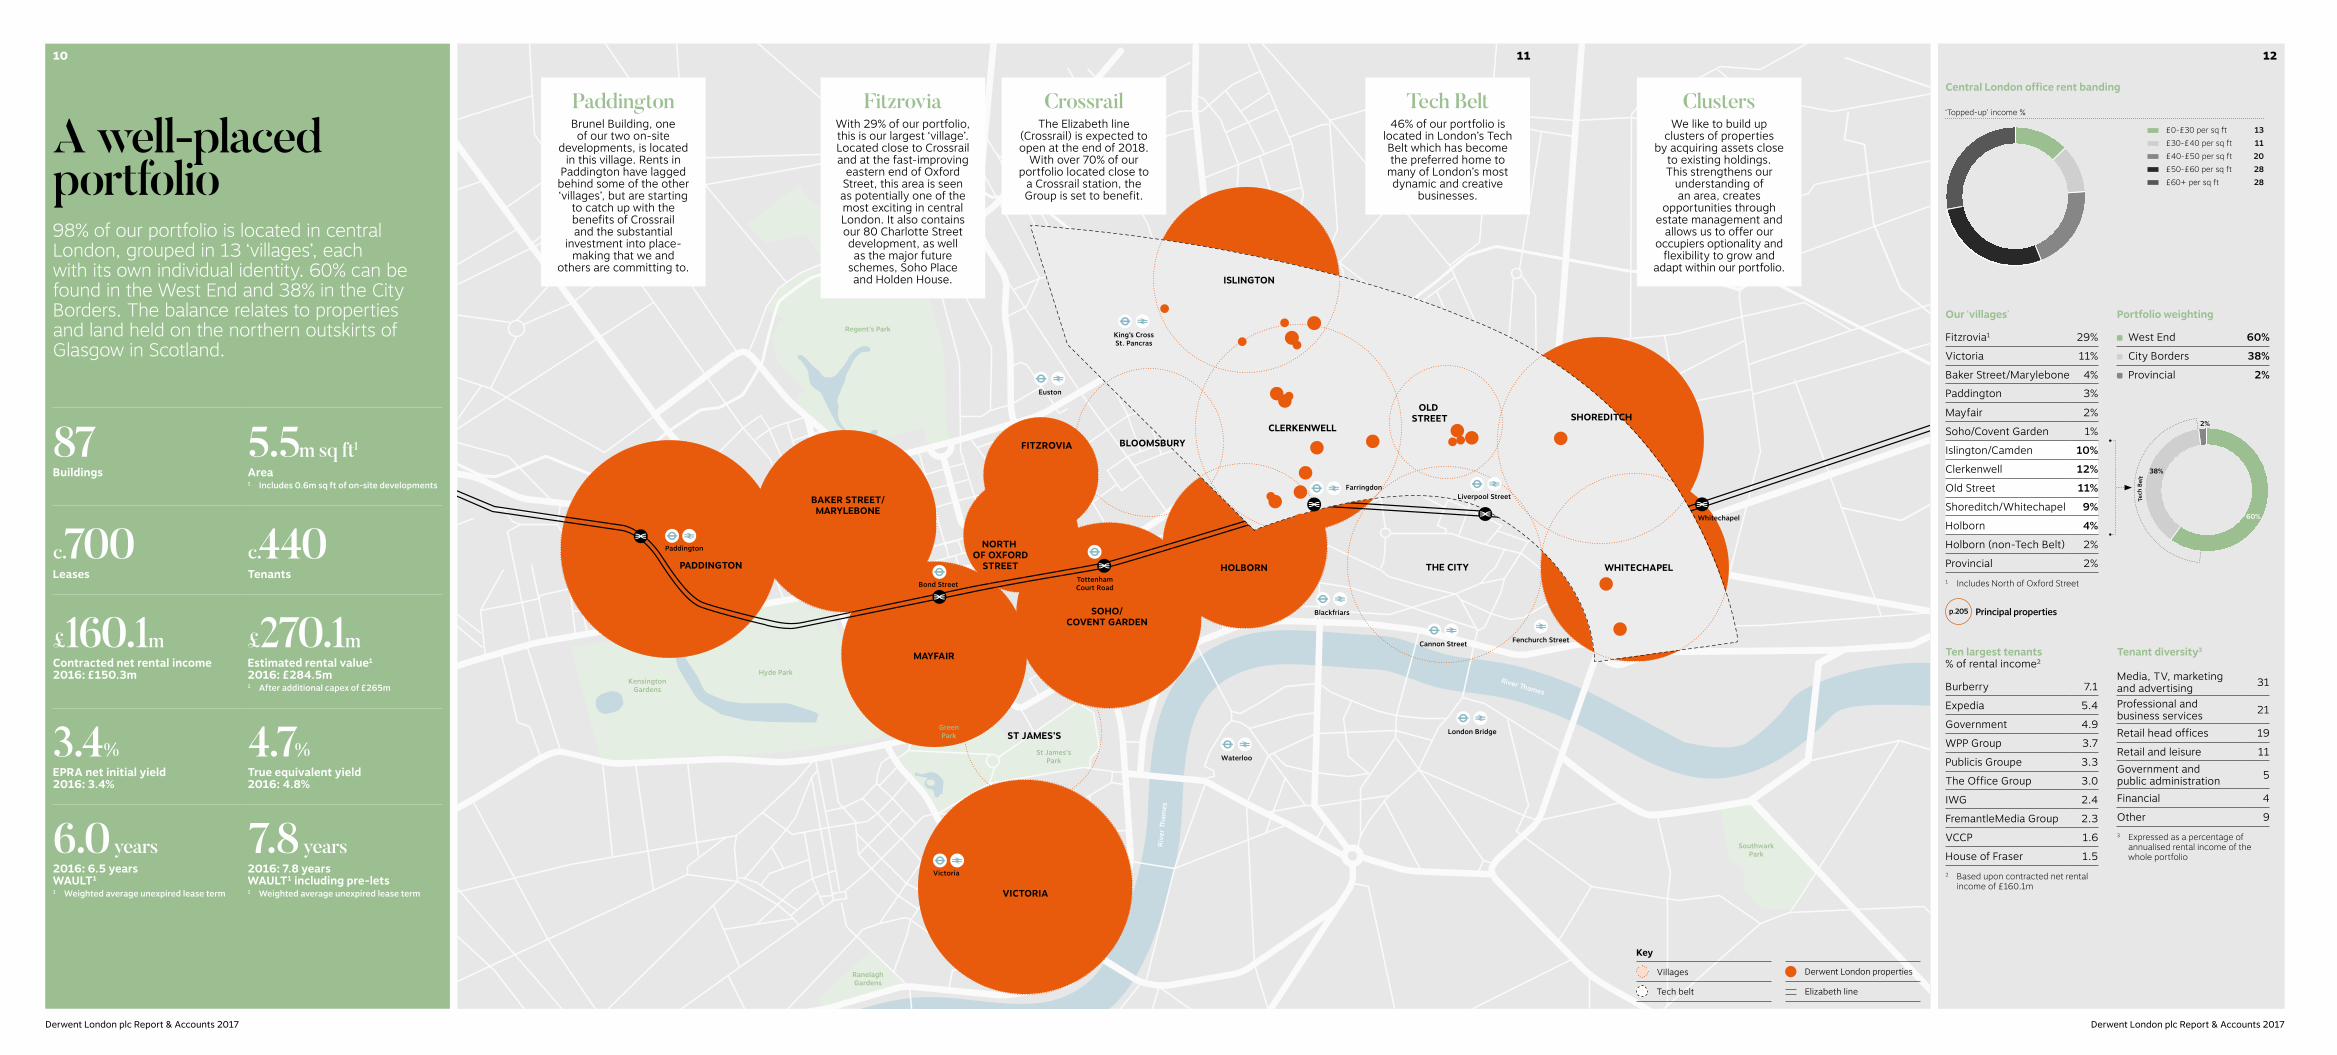
CrossrailThe Elizabeth line
(Crossrail) is expected to open at the end of 2018.
With over 70% of our portfolio located close to
a Crossrail station, the Group is set to benefit.
Tech Belt46% of our portfolio is
located in London’s Tech Belt which has become the preferred home to many of London’s most dynamic and creative
businesses.
ClustersWe like to build up
clusters of properties by acquiring assets close
to existing holdings. This strengthens our
understanding of an area, creates
opportunities through estate management and
allows us to offer our occupiers optionality and
flexibility to grow and adapt within our portfolio.
FitzroviaWith 29% of our portfolio, this is our largest ‘village’. Located close to Crossrail and at the fast-improving
eastern end of Oxford Street, this area is seen as potentially one of the most exciting in central London. It also contains our 80 Charlotte Street development, as well as the major future
schemes, Soho Place and Holden House.
PaddingtonBrunel Building, one of our two on-site
developments, is located in this village. Rents in
Paddington have lagged behind some of the other ‘villages’, but are starting
to catch up with the benefits of Crossrail and the substantial
investment into place-making that we and
others are committing to.
Derwent London plc Report & Accounts 2017Derwent London plc Report & Accounts 2017
Ten largest tenants% of rental income2
Burberry 7.1
Expedia 5.4
Government 4.9
WPP Group 3.7
Publicis Groupe 3.3
The Office Group 3.0
IWG 2.4
FremantleMedia Group 2.3
VCCP 1.6
House of Fraser 1.52 Based upon contracted net rental
income of £160.1m
Portfolio weighting
West End 60%
City Borders 38%
Provincial 2%
Tech
Bel
t
60%
2%
38%
Tenant diversity3
Media, TV, marketing and advertising 31
Professional and business services 21
Retail head offices 19
Retail and leisure 11Government and public administration 5
Financial 4
Other 93 Expressed as a percentage of
annualised rental income of the whole portfolio
Key
Villages Derwent London properties
Tech belt Elizabeth line
Our ‘villages’
Fitzrovia1 29%
Victoria 11%
Baker Street/Marylebone 4%Paddington 3%
Mayfair 2%
Soho/Covent Garden 1%
Islington/Camden 10%
Clerkenwell 12%
Old Street 11%
Shoreditch/Whitechapel 9%
Holborn 4%
Holborn (non-Tech Belt) 2%
Provincial 2%1 Includes North of Oxford Street
Central London office rent banding
£0-£30 per sq ft 13£30-£40 per sq ft 11£40-£50 per sq ft 20£50-£60 per sq ft 28£60+ per sq ft 28
‘Topped-up’ income %
p.205 Principal properties
A well-placed portfolio98% of our portfolio is located in central London, grouped in 13 ‘villages’, each with its own individual identity. 60% can be found in the West End and 38% in the City Borders. The balance relates to properties and land held on the northern outskirts of Glasgow in Scotland.
87Buildings
5.5m sq ft1
Area1 Includes 0.6m sq ft of on-site developments
c.700Leases
c.440Tenants
£160.1mContracted net rental income 2016: £150.3m
£270.1mEstimated rental value1 2016: £284.5m1 After additional capex of £265m
3.4%EPRA net initial yield 2016: 3.4%
4.7%True equivalent yield 2016: 4.8%
6.0 years2016: 6.5 years WAULT1
7.8 years2016: 7.8 years WAULT1 including pre-lets
1 Weighted average unexpired lease term 1 Weighted average unexpired lease term
121110

London: evolving and resilientLondon’s economy and population have grown significantly over the past 30 years, benefitting from deregulation and the subsequent expansion of the financial sector and, more recently, growth from the creative industries.
1 & 2 Stephen Street80 Charlotte Street
Other Derwent London properties across Fitzrovia
Soho Place
A cyclical marketThe London office market has proven cyclical over time responding to a mixture of factors: principally economic demand, supply, interest rates and bank lending exposure. The EU referendum was expected to be a tipping-point by many commentators, but so far its impact can be seen in slower market activity rather than a decline as the other factors have been more benign.
Source: MSCI IPD
150
0
300
50
250
350
Index
1982 1987 1992 1997 2002 2007 2012 2017
200
100
(1980 = 100)
Capital growthRental value growth
As a result rental levels remain high and yields very low compared to previous cycles, which means office capital values per sq ft are relatively high. One reason for this has been the strong demand for income producing assets globally which was, in part, a response to the quantitative easing strategies adopted by many of the major central banks. In addition, political risk remains high.1 London’s Economic Outlook: Autumn 2017,
GLA Economics 2 London Office Policy Review 2017 for Greater
London Authority, CAG consultants and Ramidus Consulting Limited
3 Agiletown: the relentless march of technology and London’s response, Deloitte 2015
4 The Draft New London Plan December, 2017
Solid foundationsWith a population of 8.9 million and 5.8 million jobs1, London is a major global city and one of the largest cities in Europe. Its economy has grown steadily since 2009 benefitting from the expansion of the creative industries following the slowdown in the global financial sector. It is estimated that London has 2.0 million office jobs2. This economic strength has been founded on an ethnically diverse population with the bedrock of a strong legal system, and a strong educational and cultural base. London is also an internationally renowned retail and leisure destination. However, its economic growth has slowed recently along with the UK economy and the uncertainty surrounding Brexit. Despite the threat of some jobs leaving to the EU, the London economy is still predicted to grow and the population is expected to rise to 10.8 million by 2041, with an annual average jobs increase of 49,000.1
Changing work and social patternsThe recent London Office Policy Review2 concluded that headcount growth will outpace savings achieved through greater office use efficiency. However, three additional factors were identified: (1) the adoption of agile working could change locational preferences, building types and specifications; (2) office automation could impact c.30% of London jobs over the next two decades3; and (3) Brexit. The review concluded that the first two factors could potentially ‘dwarf’ any Brexit impact and that London needs ‘more, but different’ office space.
These conclusions need to be assessed within the broader London policy mix put forward in the Draft New London Plan. The London Mayor states that the objective should not be about growth at any cost but there needs to be a rebalancing to ensure that the benefits are more broadly spread with a focus on ‘good growth’ zooming in on the key issues of affordability, accommodation, infrastructure and pollution.4
The context
London office locationsDerwent London’s primary focus is as a provider of central London office space along with ancillary retail and residential. There is currently 225m sq ft of office space in central London, 72% of which is concentrated in the West End or the City. Approximately 75% of West End office stock lies in a conservation area compared to only around 33% in the City. The City and Docklands also hold the highest concentration of office towers and financial occupiers.
Derwent London’s office portfolio totals 5.5m sq ft and represents c.2% of the total market. We have a 60% weighting to the West End market and no exposure to either the City or Docklands.
Sources of London office take-upProfessional and business services have long represented the highest proportion of central London office take-up. More recently the growth in demand from the creative industries has matched the level from financial services.
Derwent London’s product and locations benefit from these recent demand dynamics. We have a much higher proportion of lettings to the creative industries, and the consumer services and leisure sectors than the market as a whole, whereas our lettings to banking and finance have been much lower. JLL has recently reclassified Aldgate, Clerkenwell and Shoreditch (where 21% of our portfolio is located) from ‘just emerged’ to ‘almost mainstream’1.
Changing patterns of workingSignificant changes in working practices such as the fact that 18% of London’s workforce is self-employed (up 33% since 2008)2, or that working densities have increased by over a third since 19973 have meant that the provision of office space has had to evolve too. London is the largest market for flexible office space globally2, and this segment has been the fastest-growing recent source of demand in response to global trends initially driven by technology and the growth of SMEs and self-employment. Although flexible office providers have been a significant source of recent take-up, this segment still represents only c.4% of most global office markets including London4. However, this proportion is expected to grow with a number of major pre-lets already secured and the main operators in expansion mode.
Derwent London’s focus on good design and providing flexible workspace with significant amenities means that we have anticipated these trends. In addition we have employed The Office Group at White Collar Factory, 1 & 2 Stephen Street W1 and Angel Square EC1 as part of a multi-let strategy. We currently have c.5% of our rental income deriving from flexible office providers.
13
1 Digital London Revisited, JLL 20172 The Flexible Revolution, CBRE 2017 3 BCO (British Council for Offices)4 Flexible Workspace, Colliers International 2017
City 32West End 40Midtown 11Southbank 8Docklands 9
Central London o�ce stock
Percentage of �oor area
Source: CBRE
0
100
80
60
40
20
Central London offices (CLO) bybusiness sectorPercentage of London o�ce take-up
Derwent LondonCLO occupiers
Take-up in past�ve years (CBRE)
Business servicesConsumer services & leisure
Creative industries
Public sector
Banking & financeManufacturing
0
Source: Cushman & Wakefield
12
10
6
8
2
4
London’s serviced offices
Floor area (million sq �)
2007 2012 2017
14
Derwent London plc Report & Accounts 2017
“ We see a lot of opportunity in London given the continued growth of ecommerce and technology industries and the strong pool of talent in the city.”
Johan Svanstrom President of Hotels.com brand, part of the Expedia group
15
Derwent London plc Report & Accounts 2017

London and UK economic growth has slowed since the EU referendum result but overall the outcome has been better than initially expected.
Looking forward, most estimates predict ongoing low levels of UK GDP growth in the next couple of years in the order of 1.0% to 1.7% pa, as Brexit and political uncertainty continue to weigh on business decisions. We have seen the first increase in base rates in over 10 years when the Bank of England raised them 0.25% to 0.5% and stated that it expected to continue to move these up gradually over a number of years as the economy recovers.
Continuing economic expansion has seen central London office take-up remain good with CBRE estimating that 13.2m sq ft of space was let in 2017, which was an increase of 7% on 2016. This was in excess of the long-term average but below the recent trend. The West End remained strong with 4.8m sq ft of lettings, the highest level since 2007.
Central London office market
A notable feature last year was the amount of space taken by the serviced office providers in total 16.5% of total market activity. We have a number of leases with The Office Group, whose space aligns with ours and who we have had a relationship with since 2015. Technology and working practices will mean that going forward the serviced office sector will continue to have an important position in the London office market.
The overall vacancy rate rose from 4.1% to 4.7%, and the West End by a lesser amount from 3.3% to 3.7%. Vacancy rates have risen now for two years but still remain below long-term average levels. JLL is estimating current office demand at 12.5m sq ft, which is lower than last year and the long term trend, but active demand of 9.6m sq ft is at its highest level since June 2016.
New office supply of 5.7m sq ft was delivered in 2017, which was 20% lower than predicted one year ago. There is currently c.12m sq ft under construction for completion in the next three years. Given that 47% of the space under construction is pre-let, available new space for delivery in the next three years remains at c.6m sq ft or under 3% of the total market.
The West End, where our current developments are concentrated, has only 1.1m sq ft or c.1% of the local market stock under construction that is available.
CBRE estimates prime central London office rents fell 2.9% in 2017, the first fall in almost seven years. However the performance varied by location. The West End was weakest, down 4.5% led by Mayfair & St James’s and Victoria, but rental levels stabilised here in the second half of the year. At the same time, Fitzrovia and Paddington, where we have substantial interests, saw rents rise by over 3%. GVA estimates that rental incentives have increased to about 20% of headline rent from 15% in most central London locations during 2017. Given the short term outlook for supply and demand, we would expect a similar mixed pattern for 2018 with headline rents continuing to drift but certain markets, particularly those impacted by Crossrail, performing better.
Investment activity rose 26% last year to £16.4bn reversing three years of decreases, but all of the last six years have witnessed very liquid markets with significant foreign investment. Two high profile City deals, each over £1bn and at substantial premiums, took the 2017 headlines and stimulated increased second half supply, as other investors tested the market appetite. Despite widespread demand not all these properties have found buyers but, as there appears limited financial pressure on vendors to sell and there is a lack of income-producing alternatives, we expect to see values remain broadly stable in 2018. Recent reports continue to highlight significant investor appetite from the same regions that were active last year.
5
10
15
20
0
Floor area million sq ft
Source: CBRE
2000 2002 2004 2006 2008 2010 2012 2014 2016
Central London office take-up
Central London averageWest End
Rest of central London
3
6
12
3
6
9 9
12
0 0
Floor area million sq ft Vacancy rate %
Source: CBRE
Completed
2000 2002 2004 2006 2008 2010 2012 2014 2016 2018 2020
Under construction
Proposed Vacancy rate
Completed average
Central London office development pipeline
5
10
15
20
0
£bn
Source: CBRE
2000 2002 2004 2006 2008 2010 2012 2014 2016
Central London office investment transactions
Average
1
2
3
4
8
12
0 0
Floor area million sq ft Vacancy rate %
Source: CBRE
Completed
2000 2002 2004 2006 2008 2010 2012 2014 2016 2018 2020
Under construction
Proposed Vacancy rate
Completed average
West End office development pipeline
Above: White Collar Factory EC1
1716
Derwent London plc Report & Accounts 2017 Derwent London plc Report & Accounts 2017
Our business modelHow we add value to our unique portfolio to deliver long-term benefits for all our stakeholders.
Outputs Outcomes
Investing in our ‘villages’Buildings in vibrant or emerging locations providing both an income-producing portfolio and project pipeline.
Conservative financial baseA strong balance sheet with low gearing and flexible finance.
Experienced teamOur experienced management is supported by teams of experts who specialise in our core activities, in an open and collegiate culture that promotes collaboration.
Proactive occupier relationshipsUnderstanding occupier needs allows us to anticipate market trends and offer tailored leases.
Market leading designOur focus on design and innovation creates sustainable and flexible buildings which meet the needs of our tenants.
Disciplined investment approachWe acquire properties with future regeneration opportunities and dispose of those with limited future potential.
Helping businesses to thriveHelping businesses to thriveOur well-located and competitively priced buildings are characterised by generous volumes and good light and amenities.
Adding value and growing dividendsAdding value and growing dividendsWe aim to create value and grow our income on a robust platform to the benefit of our shareholders and other stakeholders.
Providing benefits to our stakeholdersProviding benefits to our stakeholdersInvesting in our ‘villages’ improves locations, benefits local communities and supports our suppliers and employees.
Distinctively Derwent through...
EPRA total return and EPRA NAV
0
30
20
10
2011 2013 2015 20172010 2012 2014 2016
%
40
30
20
10
£
EPRA total return (%)
EPRA NAV (diluted) (£ per share)
ActivitiesInputs
Enhancing environments and communities
p.20Our strategy
623,000 sq ft under development in 2018 p.56
p.78
KPIs p.30
Risk management p.34
Our assets and resources
Propertiesp.44
Financial resources
p.64
People & relationships
p.72
Adding value for stakeholdersProviding office spaces for today’s businesses
p.44
Delivering above average long-term returns
p.30
Investing in neighbourhoods & communities
p.78
Our core activities
Asset management
p.48
Development & refurbishment
p.56
Investment activity
p.61
1918
Derwent London plc Report & Accounts 2017 Derwent London plc Report & Accounts 2017
For further reading on our values and culture
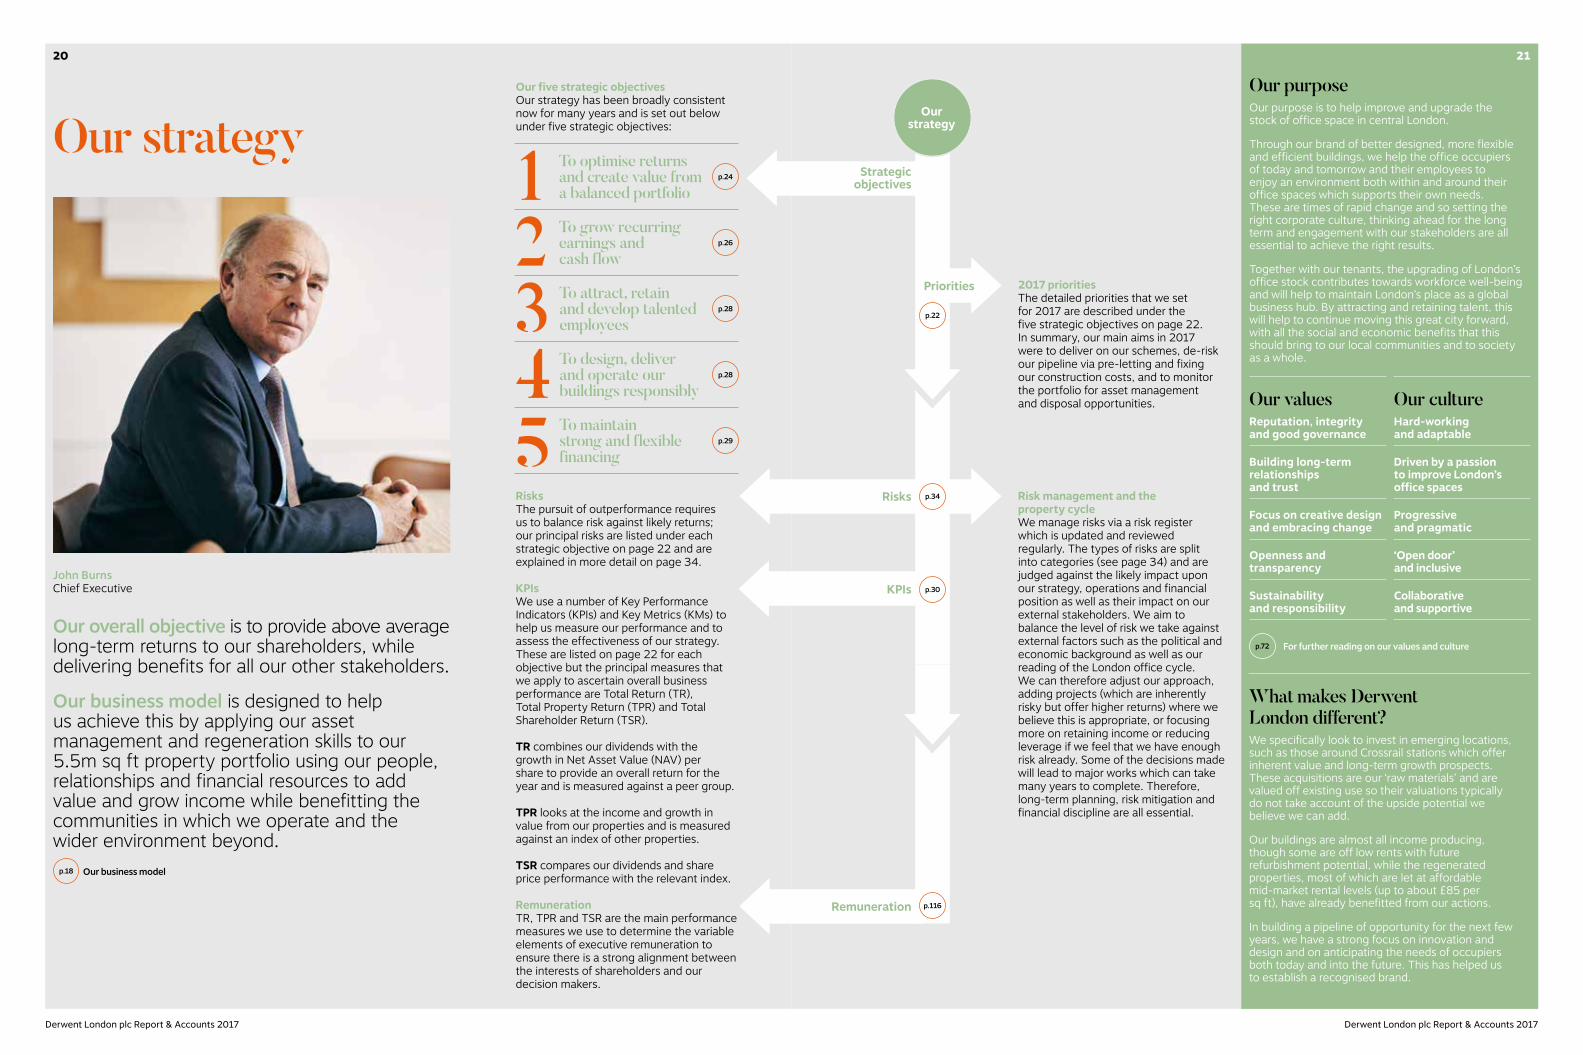
Our five strategic objectivesOur strategy has been broadly consistent now for many years and is set out below under five strategic objectives:
RisksThe pursuit of outperformance requires us to balance risk against likely returns; our principal risks are listed under each strategic objective on page 22 and are explained in more detail on page 34.
KPIsWe use a number of Key Performance Indicators (KPIs) and Key Metrics (KMs) to help us measure our performance and to assess the effectiveness of our strategy. These are listed on page 22 for each objective but the principal measures that we apply to ascertain overall business performance are Total Return (TR), Total Property Return (TPR) and Total Shareholder Return (TSR).
TR combines our dividends with the growth in Net Asset Value (NAV) per share to provide an overall return for the year and is measured against a peer group.
TPR looks at the income and growth in value from our properties and is measured against an index of other properties.
TSR compares our dividends and share price performance with the relevant index.
RemunerationTR, TPR and TSR are the main performance measures we use to determine the variable elements of executive remuneration to ensure there is a strong alignment between the interests of shareholders and our decision makers.
To optimise returns and create value from a balanced portfolio
To grow recurring earnings and cash flow
To attract, retain and develop talented employees
To design, deliver and operate our buildings responsibly
To maintain strong and flexible financing
John BurnsChief Executive
p.24
Our overall objective is to provide above average long-term returns to our shareholders, while delivering benefits for all our other stakeholders.
Our business model is designed to help us achieve this by applying our asset management and regeneration skills to our 5.5m sq ft property portfolio using our people, relationships and financial resources to add value and grow income while benefitting the communities in which we operate and the wider environment beyond.
p.18 Our business model
12345
Our purposeOur purpose is to help improve and upgrade the stock of office space in central London.
Through our brand of better designed, more flexible and efficient buildings, we help the office occupiers of today and tomorrow and their employees to enjoy an environment both within and around their office spaces which supports their own needs. These are times of rapid change and so setting the right corporate culture, thinking ahead for the long term and engagement with our stakeholders are all essential to achieve the right results.
Together with our tenants, the upgrading of London’s office stock contributes towards workforce well-being and will help to maintain London’s place as a global business hub. By attracting and retaining talent, this will help to continue moving this great city forward, with all the social and economic benefits that this should bring to our local communities and to society as a whole.
Our values Reputation, integrity and good governance
Building long-term relationships and trust
Focus on creative design and embracing change
Openness and transparency
Sustainability and responsibility
Our cultureHard-working and adaptable
Driven by a passion to improve London’s office spaces
Progressive and pragmatic
‘Open door’ and inclusive
Collaborative and supportive
What makes Derwent London different?We specifically look to invest in emerging locations, such as those around Crossrail stations which offer inherent value and long-term growth prospects. These acquisitions are our ‘raw materials’ and are valued off existing use so their valuations typically do not take account of the upside potential we believe we can add.
Our buildings are almost all income producing, though some are off low rents with future refurbishment potential, while the regenerated properties, most of which are let at affordable mid-market rental levels (up to about £85 per sq ft), have already benefitted from our actions.
In building a pipeline of opportunity for the next few years, we have a strong focus on innovation and design and on anticipating the needs of occupiers both today and into the future. This has helped us to establish a recognised brand.
p.26
p.28
p.28
p.29
Our strategy
p.72
Risk management and the property cycleWe manage risks via a risk register which is updated and reviewed regularly. The types of risks are split into categories (see page 34) and are judged against the likely impact upon our strategy, operations and financial position as well as their impact on our external stakeholders. We aim to balance the level of risk we take against external factors such as the political and economic background as well as our reading of the London office cycle. We can therefore adjust our approach, adding projects (which are inherently risky but offer higher returns) where we believe this is appropriate, or focusing more on retaining income or reducing leverage if we feel that we have enough risk already. Some of the decisions made will lead to major works which can take many years to complete. Therefore, long-term planning, risk mitigation and financial discipline are all essential.
2017 prioritiesThe detailed priorities that we set for 2017 are described under the five strategic objectives on page 22. In summary, our main aims in 2017 were to deliver on our schemes, de-risk our pipeline via pre-letting and fixing our construction costs, and to monitor the portfolio for asset management and disposal opportunities.
KPIs
Remuneration
Risks
Strategic objectives
Our strategy
Priorities
p.30
p.116
p.34
p.22
20
Derwent London plc Report & Accounts 2017 Derwent London plc Report & Accounts 2017
21

Our strategycontinued
2017 priorities 2017 progress Priorities for 2018 KPIs and key metrics Risks
1 To optimise returns and create value from a balanced portfolio p.24
Seek acquisitions that meet our criteria Limited opportunities were identified in 2017 • Seek acquisitions that meet our criteria• Maintain balance between income
generation and development activity• Progress 80 Charlotte Street, Brunel
Building and Soho Place• De-risk the pipeline through further pre-lets• Advance regeneration opportunities within
the portfolio
• Total property return• Void management• Development potential• Reversionary percentage• Capital return
• Inconsistent strategy• Adverse Brexit settlement• Reputational damage• Increase in property yields• Reduced development returns• Cyber attack• Non-compliance with health and safety legislation• Non-compliance with environmental and sustainability legislation• ‘On-site’ risk• Contractor/subcontractor default• Shortage of key staff• Terrorism or other business interruption
Maintain balance between income generation and development activity Balance maintained with 44% of the portfolio having development potential
Complete White Collar Factory and The Copyright Building Both achieved
Progress 80 Charlotte Street and Brunel Building Both progressing well
Monitor portfolio for further opportunities to recycle capital Property disposals generated net proceeds of £482.8m, at a 11.8% premium to book values
2 To grow recurring earnings and cash flow p.26
Continuously monitor our portfolio for further asset management initiatives
Considerable progress in void management and re-letting vacant spaceNew lettings achieved £41.5m of income, 1.3% above Dec 2016 ERVRent reviews increased income by 42% to £9.1m on 209,500 sq ft
• Continuously monitor portfolio for further asset management initiatives
• Extend income through renewals and re-gears for properties not earmarked for regeneration
• Manage voids and maximise income from good asset management
• Secure further pre-lets
• Total property return• Void management• Tenant receipts• Reversionary percentage• Tenant retention• Capital return
• Inconsistent strategy• Adverse Brexit settlement• Reputational damage• Reduced development returns• Cyber attack• Non-compliance with health and safety legislation• ‘On-site’ risk• Contractor/subcontractor default• Shortage of key staff• Terrorism or other business interruption
Extend income through renewals and re-gears for properties not earmarked for regeneration
Our retention and re-let rate was 92% in 2017Renewals and re-gears increased income by 31% to £29.5m on 562,400 sq ft
De-risk 80 Charlotte Street and Brunel Building through pre-lets Substantially pre-let the office space at 80 Charlotte Street W1
3 To attract, retain and develop talented employees p.28
Review how we can ensure our people and culture are ‘Fit for the Future’ Project launched in early 2017 to review organisational structure and governance, and to maximise individual performance
• Continue the ‘Fit for the Future’ programme• Identify additional well-being initiatives• Establish working group to recommend
improvements to lower scoring areas identified by the staff survey
• Staff satisfaction, which will be introduced as a KPI in 2018
• Reputational damage• Cyber attack• Non-compliance with health and safety legislation• Non-compliance with environmental and sustainability legislation• Other regulatory non-compliance• Shortage of key staff• Terrorism or other business interruption
Conduct employee survey Completed with excellent results
Complete office refurbishment Achieved in May 2017
Focus on staff productivity and well-being Further improvements made, supported by staff survey
Introduce other well-being initiatives New ideas such as cholesterol testing and self-defence classes
4 To design, deliver and operate our buildings responsibly p.28
Achieve BREEAM ‘Outstanding’ and LEED ‘Platinum’ ratings for White Collar Factory Achieved • Develop our framework for health
and well-being in developments• Implement a new carbon analysis
tool to monitor progress against our science-based targets
• Deliver the next rounds of our Community Fund
• Energy performance certificates• BREEAM ratings
• Reputational damage• Cyber attack• Non-compliance with health and safety legislation• Non-compliance with environmental and sustainability legislation• Other regulatory non-compliance• ‘On-site’ risk• Contractor/subcontractor default• Shortage of key staff• Terrorism or other business interruption
Achieve a SKA Gold rating for the refurbishment and fit out of our 25 Savile Row offices Achieved
Set science-based carbon targets to align with the Paris Climate Change Agreement Achieved
Ensure our properties meet the requirements of the forthcoming Minimum Energy Efficiency Standards for buildings Exercise undertaken and work ongoing
Continue to work with local community projects Distributed £108,000 of funding across 19 projects
Obtain stronger validation of our methods Achieved
5 To maintain strong and flexible financing p.29
Refinance £28m secured facility maturing in 2018 Facility renewed until July 2022 • Review refinancing options for the 2019 convertible bonds
• Maintain or strengthen available facilities• Maintain good interest cover
• Interest cover ratio• Gearing and available resources• Reversionary percentage
• Inconsistent strategy• Adverse Brexit settlement• Reputational damage• Increase in property yields• Reduced development returns• Cyber attack• Other regulatory non-compliance• Shortage of key staff• Terrorism or other business interruption
Maintain or strengthen available facilitiesThe £75m revolving bank facility was extended to July 2022 and a £15m development loan, expiring in May 2019, was provided in relation to our Primister joint venture
Maintain good interest cover Interest cover increased to 454% in 2017
Key
Achieved
Still in progress
Not achieved
Total return and total shareholder return measure our performance across all our strategic objectives
p.30 Measuring our performance
p.34 Our principal risks
2322
Derwent London plc Report & Accounts 2017 Derwent London plc Report & Accounts 2017
25
Our strategycontinued
Underappraisal
4%
Future appraisal
20%
Core income
56%
Consented
6%
On-site developments
11%Core income on-site
refurbishments
3%56%
44%
Income producing
86%
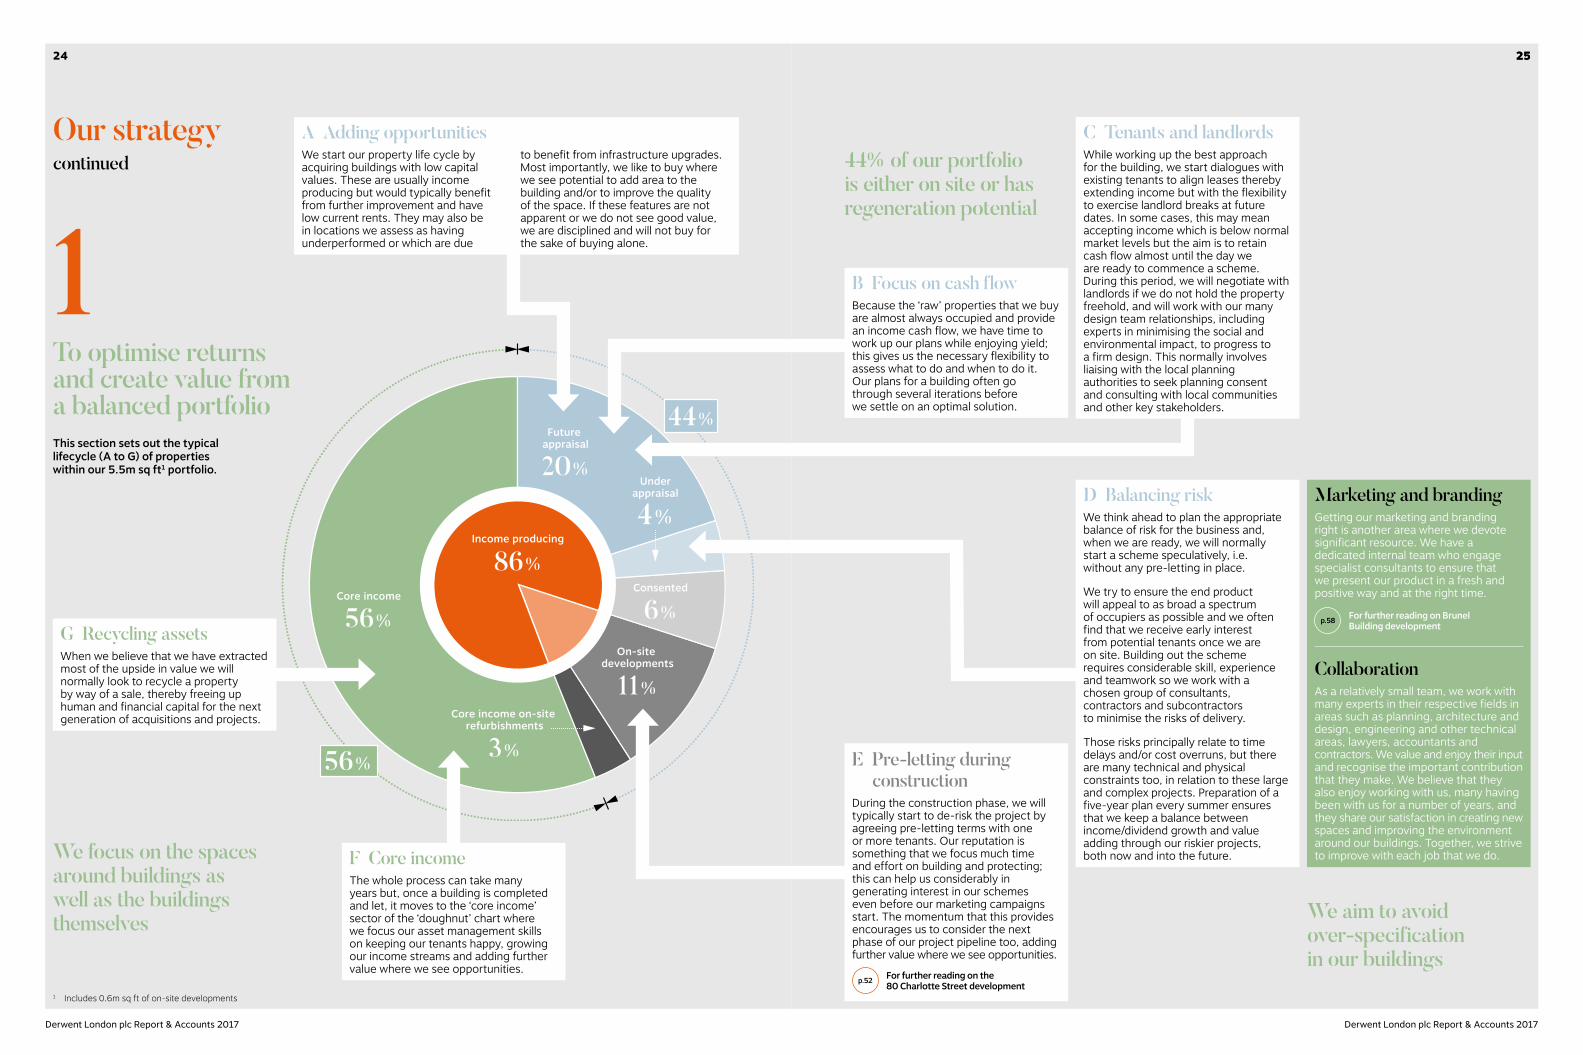
A Adding opportunitiesWe start our property life cycle by acquiring buildings with low capital values. These are usually income producing but would typically benefit from further improvement and have low current rents. They may also be in locations we assess as having underperformed or which are due
to benefit from infrastructure upgrades. Most importantly, we like to buy where we see potential to add area to the building and/or to improve the quality of the space. If these features are not apparent or we do not see good value, we are disciplined and will not buy for the sake of buying alone.
E Pre-letting during construction
During the construction phase, we will typically start to de-risk the project by agreeing pre-letting terms with one or more tenants. Our reputation is something that we focus much time and effort on building and protecting; this can help us considerably in generating interest in our schemes even before our marketing campaigns start. The momentum that this provides encourages us to consider the next phase of our project pipeline too, adding further value where we see opportunities.
p.52 For further reading on the 80 Charlotte Street development
D Balancing riskWe think ahead to plan the appropriate balance of risk for the business and, when we are ready, we will normally start a scheme speculatively, i.e. without any pre-letting in place.
We try to ensure the end product will appeal to as broad a spectrum of occupiers as possible and we often find that we receive early interest from potential tenants once we are on site. Building out the scheme requires considerable skill, experience and teamwork so we work with a chosen group of consultants, contractors and subcontractors to minimise the risks of delivery.
Those risks principally relate to time delays and/or cost overruns, but there are many technical and physical constraints too, in relation to these large and complex projects. Preparation of a five-year plan every summer ensures that we keep a balance between income/dividend growth and value adding through our riskier projects, both now and into the future.
C Tenants and landlordsWhile working up the best approach for the building, we start dialogues with existing tenants to align leases thereby extending income but with the flexibility to exercise landlord breaks at future dates. In some cases, this may mean accepting income which is below normal market levels but the aim is to retain cash flow almost until the day we are ready to commence a scheme. During this period, we will negotiate with landlords if we do not hold the property freehold, and will work with our many design team relationships, including experts in minimising the social and environmental impact, to progress to a firm design. This normally involves liaising with the local planning authorities to seek planning consent and consulting with local communities and other key stakeholders.
B Focus on cash flowBecause the ‘raw’ properties that we buy are almost always occupied and provide an income cash flow, we have time to work up our plans while enjoying yield; this gives us the necessary flexibility to assess what to do and when to do it. Our plans for a building often go through several iterations before we settle on an optimal solution.
F Core incomeThe whole process can take many years but, once a building is completed and let, it moves to the ‘core income’ sector of the ‘doughnut’ chart where we focus our asset management skills on keeping our tenants happy, growing our income streams and adding further value where we see opportunities.
G Recycling assetsWhen we believe that we have extracted most of the upside in value we will normally look to recycle a property by way of a sale, thereby freeing up human and financial capital for the next generation of acquisitions and projects.
To optimise returns and create value from a balanced portfolioThis section sets out the typical lifecycle (A to G) of properties within our 5.5m sq ft1 portfolio.
1Marketing and brandingGetting our marketing and branding right is another area where we devote significant resource. We have a dedicated internal team who engage specialist consultants to ensure that we present our product in a fresh and positive way and at the right time.
p.58 For further reading on Brunel Building development
CollaborationAs a relatively small team, we work with many experts in their respective fields in areas such as planning, architecture and design, engineering and other technical areas, lawyers, accountants and contractors. We value and enjoy their input and recognise the important contribution that they make. We believe that they also enjoy working with us, many having been with us for a number of years, and they share our satisfaction in creating new spaces and improving the environment around our buildings. Together, we strive to improve with each job that we do.
We aim to avoid over-specification in our buildings
We focus on the spaces around buildings as well as the buildings themselves
44% of our portfolio is either on site or has regeneration potential
1 Includes 0.6m sq ft of on-site developments
2524
Derwent London plc Report & Accounts 2017 Derwent London plc Report & Accounts 2017

A The actions that we take
These generally fall into the following categories:
• working with tenants and consultants to arrive at appropriate rent review uplifts;
• extending lease lengths or removing break clauses;
• arranging block dates to enable access to buildings at an appropriate time;
• reviewing levels of ‘grey’ space, i.e. floor area that is let but which is not currently occupied or is being marketed by a tenant;
• reducing irrecoverable costs where it is reasonable and justified (EPRA cost ratio);
• thinking ahead to work with and understand our tenants’ needs, thereby optimising income. Potential examples are fixed or minimum rental uplifts and a flexible approach to dilapidations and alienation clauses in leases; and
• taking a flexible approach at certain buildings, like the Tea Building for example, to keep lease lengths shorter, while at other buildings aiming for longer leases, particularly on larger lettings.
We also grow our earnings in the longer run by adding area and developing spaces.
The value of property is essentially determined by contracted and expected future cash flows. We never forget this.
Creating and then capturing reversionThe benefits of setting the conditions in place for a property’s value to grow are, in the long term, both value creation and increasing cash flow but they can occur at different times of the property cycle. The value creation often comes first as expectations of rental growth emerge and it is this which gives rise to what we call ‘reversion’, i.e. the extent to which we can expect to grow income from its current passing level.
Our strategycontinued
To grow recurring earnings and cash flow
2C Pre-let developments
and refurbishmentsWhere the contracted income will step up on delivery of the scheme and will increase further as rental incentives burn off.
G Estimated rental value (ERV)
Our valuers’ estimate of the total rental value of our portfolio, including developments and refurbishments under construction.
E Developments and refurbishments
Once completed and let, the value of the future income streams will become more certain and will gradually convert to cash flow.
F Marking to current market values
This is the pure ‘reversion’ inherent in the existing leases but is only one component of the full potential uplift in our rental cash flows.
p.24 See strategic objective 1
Like-for-like rental incomeWe use like-for-like rent analysis (see EPRA definitions on page 207) to determine how well we are growing the net and gross rental income within the non-development part of the portfolio and we monitor irrecoverable costs through the EPRA cost ratio and void percentages. We also place considerable focus on growing EPRA earnings and our dividends to shareholders as can be seen by the progress made in recent years.
B Contracted rental upliftsEither from the burning off of rent free or half rent periods, or through fixed or minimum future rental increases.
D Vacant space When let, this will lead to increases in contracted income.
Asset managementThe job of our asset management team is to capture the increased rents through rent reviews, lease re-gears or other lease restructuring. All these activities are underpinned by maintaining strong relationships with occupiers and always with a focus on the needs of our local communities.
ReversionWe measure and monitor the amount of reversion in the portfolio using the chart shown opposite. The main parts of this build-up of estimated rental value are as follows:
Reversioncaptured
Dec 17ERV
Dec 17net rent
Dec 16net rent
Disposals Reviews and expiries
Contractualupli�s
Vacant(available)
Developments and refurbishments
0
£m300
250
150
100
50
200
Our reversion
150.3 (8.6)160.1
270.114.3
18.4
44.2
24.2
2.824.5
Pre-letdevelopments
and refurbishments
2726
Derwent London plc Report & Accounts 2017 Derwent London plc Report & Accounts 2017
Our strategycontinued
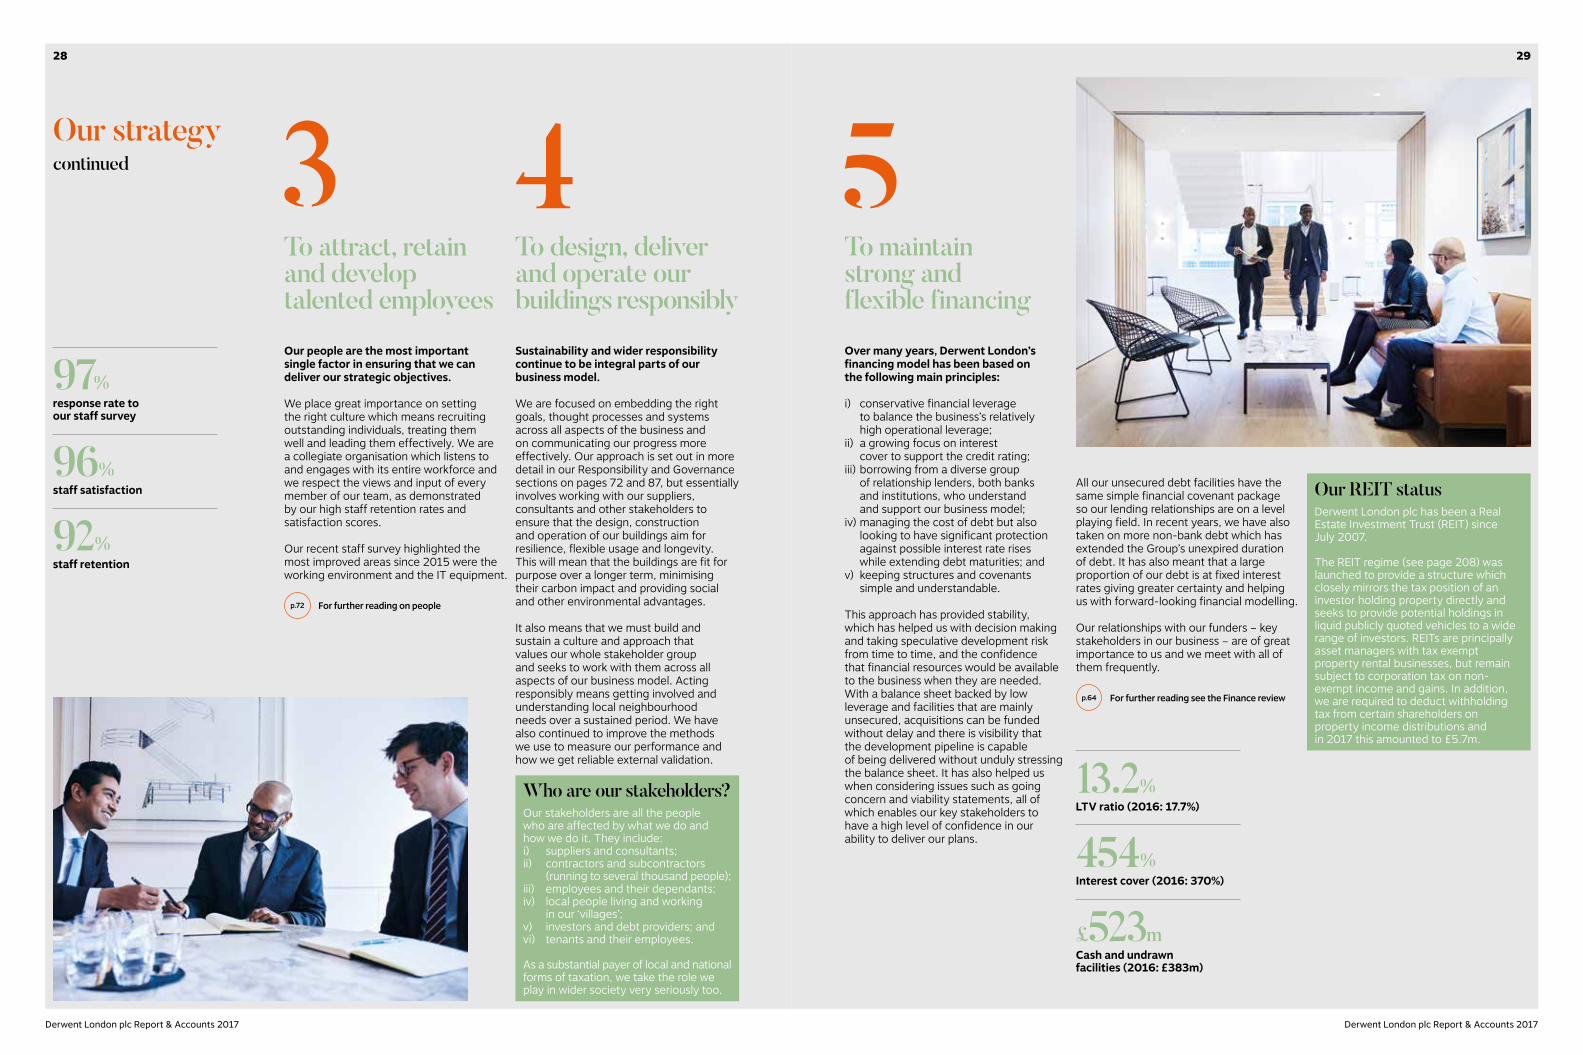
Our people are the most important single factor in ensuring that we can deliver our strategic objectives.
We place great importance on setting the right culture which means recruiting outstanding individuals, treating them well and leading them effectively. We are a collegiate organisation which listens to and engages with its entire workforce and we respect the views and input of every member of our team, as demonstrated by our high staff retention rates and satisfaction scores.
Our recent staff survey highlighted the most improved areas since 2015 were the working environment and the IT equipment.
p.72 For further reading on people
Sustainability and wider responsibility continue to be integral parts of our business model.
We are focused on embedding the right goals, thought processes and systems across all aspects of the business and on communicating our progress more effectively. Our approach is set out in more detail in our Responsibility and Governance sections on pages 72 and 87, but essentially involves working with our suppliers, consultants and other stakeholders to ensure that the design, construction and operation of our buildings aim for resilience, flexible usage and longevity. This will mean that the buildings are fit for purpose over a longer term, minimising their carbon impact and providing social and other environmental advantages.
It also means that we must build and sustain a culture and approach that values our whole stakeholder group and seeks to work with them across all aspects of our business model. Acting responsibly means getting involved and understanding local neighbourhood needs over a sustained period. We have also continued to improve the methods we use to measure our performance and how we get reliable external validation.
Over many years, Derwent London’s financing model has been based on the following main principles:
i) conservative financial leverage to balance the business’s relatively high operational leverage;
ii) a growing focus on interest cover to support the credit rating;
iii) borrowing from a diverse group of relationship lenders, both banks and institutions, who understand and support our business model;
iv) managing the cost of debt but also looking to have significant protection against possible interest rate rises while extending debt maturities; and
v) keeping structures and covenants simple and understandable.
This approach has provided stability, which has helped us with decision making and taking speculative development risk from time to time, and the confidence that financial resources would be available to the business when they are needed. With a balance sheet backed by low leverage and facilities that are mainly unsecured, acquisitions can be funded without delay and there is visibility that the development pipeline is capable of being delivered without unduly stressing the balance sheet. It has also helped us when considering issues such as going concern and viability statements, all of which enables our key stakeholders to have a high level of confidence in our ability to deliver our plans.
All our unsecured debt facilities have the same simple financial covenant package so our lending relationships are on a level playing field. In recent years, we have also taken on more non-bank debt which has extended the Group’s unexpired duration of debt. It has also meant that a large proportion of our debt is at fixed interest rates giving greater certainty and helping us with forward-looking financial modelling.
Our relationships with our funders – key stakeholders in our business – are of great importance to us and we meet with all of them frequently.
p.64 For further reading see the Finance review
4 5To design, deliver and operate our buildings responsibly
To maintain strong and flexible financing
3To attract, retain and develop talented employees
Our REIT statusDerwent London plc has been a Real Estate Investment Trust (REIT) since July 2007.
The REIT regime (see page 208) was launched to provide a structure which closely mirrors the tax position of an investor holding property directly and seeks to provide potential holdings in liquid publicly quoted vehicles to a wide range of investors. REITs are principally asset managers with tax exempt property rental businesses, but remain subject to corporation tax on non-exempt income and gains. In addition, we are required to deduct withholding tax from certain shareholders on property income distributions and in 2017 this amounted to £5.7m.
Who are our stakeholders?Our stakeholders are all the people who are affected by what we do and how we do it. They include:i) suppliers and consultants;ii) contractors and subcontractors
(running to several thousand people);iii) employees and their dependants;iv) local people living and working
in our ‘villages’;v) investors and debt providers; andvi) tenants and their employees.
As a substantial payer of local and national forms of taxation, we take the role we play in wider society very seriously too.
13.2%LTV ratio (2016: 17.7%)
454%Interest cover (2016: 370%)
£523mCash and undrawn facilities (2016: £383m)
97%response rate to our staff survey
96%staff satisfaction
92%staff retention
2928
Derwent London plc Report & Accounts 2017 Derwent London plc Report & Accounts 2017
Measuring our performance
Key performance indicators
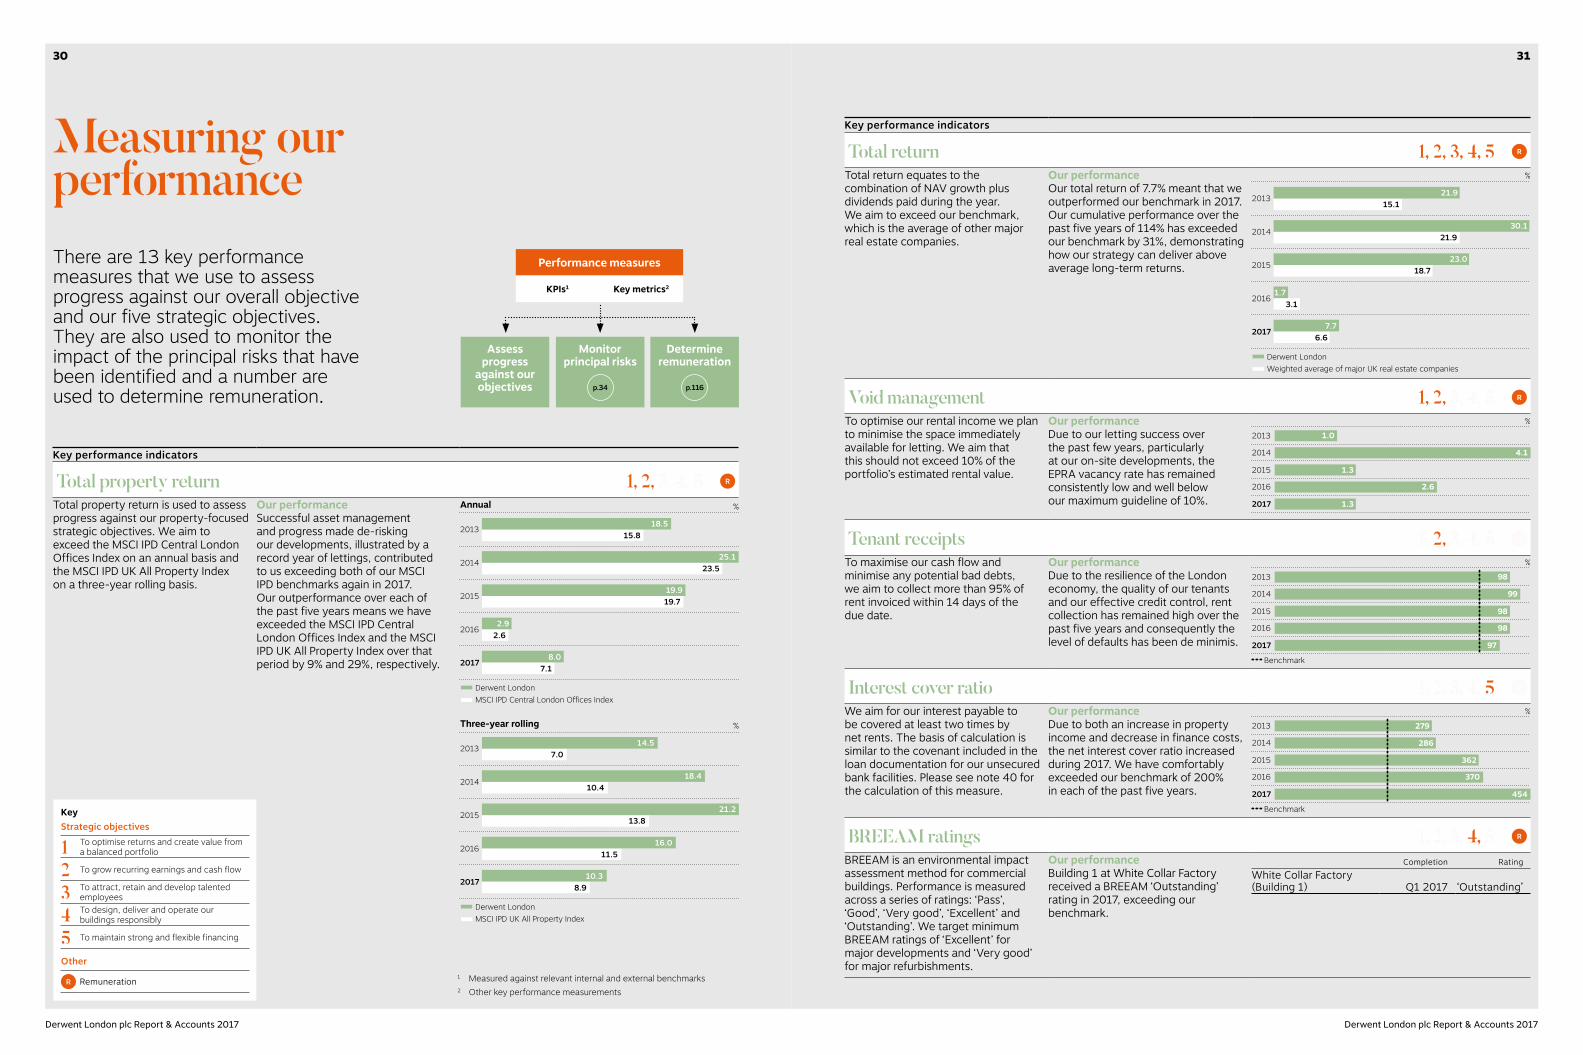
Total return 1, 2, 3, 4, 5 R
Total return equates to the combination of NAV growth plus dividends paid during the year. We aim to exceed our benchmark, which is the average of other major real estate companies.
Our performanceOur total return of 7.7% meant that we outperformed our benchmark in 2017. Our cumulative performance over the past five years of 114% has exceeded our benchmark by 31%, demonstrating how our strategy can deliver above average long-term returns.
2013
2014
2017
2016
2015
21.9 15.1
30.121.9
23.0 18.7
1.7 3.1
7.7 6.6
Derwent LondonWeighted average of major UK real estate companies
%
Void management 1, 2, 3, 4, 5 3, 4, 5 R
To optimise our rental income we plan to minimise the space immediately available for letting. We aim that this should not exceed 10% of the portfolio’s estimated rental value.
Our performanceDue to our letting success over the past few years, particularly at our on-site developments, the EPRA vacancy rate has remained consistently low and well below our maximum guideline of 10%.
%
2013
2014
2017
2016
2015
1.0
4.1
1.3
2.6
1.3
Tenant receipts 1, 1, 2, 3, 4, 5 3, 4, 5 R
To maximise our cash flow and minimise any potential bad debts, we aim to collect more than 95% of rent invoiced within 14 days of the due date.
Our performanceDue to the resilience of the London economy, the quality of our tenants and our effective credit control, rent collection has remained high over the past five years and consequently the level of defaults has been de minimis.
Benchmark
%
2013
2014
2017
2016
2015
98
99
97
98
98
Interest cover ratio 1, 2, 3, 4, 1, 2, 3, 4, 5 R
We aim for our interest payable to be covered at least two times by net rents. The basis of calculation is similar to the covenant included in the loan documentation for our unsecured bank facilities. Please see note 40 for the calculation of this measure.
Our performanceDue to both an increase in property income and decrease in finance costs, the net interest cover ratio increased during 2017. We have comfortably exceeded our benchmark of 200% in each of the past five years.
Benchmark
%
2013
2014
2017
2016
2015
279
286
454
370
362
BREEAM ratings 1, 2, 3, 1, 2, 3, 4, 55 R
BREEAM is an environmental impact assessment method for commercial buildings. Performance is measured across a series of ratings: ‘Pass’, ‘Good’, ‘Very good’, ‘Excellent’ and ‘Outstanding’. We target minimum BREEAM ratings of ‘Excellent’ for major developments and ‘Very good’ for major refurbishments.
Our performanceBuilding 1 at White Collar Factory received a BREEAM ‘Outstanding’ rating in 2017, exceeding our benchmark.
Completion RatingWhite Collar Factory (Building 1) Q1 2017 ‘Outstanding’
Key performance indicators
Total property return 1, 2, 3, 4, 5 3, 4, 5 R
Total property return is used to assess progress against our property-focused strategic objectives. We aim to exceed the MSCI IPD Central London Offices Index on an annual basis and the MSCI IPD UK All Property Index on a three-year rolling basis.
Our performanceSuccessful asset management and progress made de-risking our developments, illustrated by a record year of lettings, contributed to us exceeding both of our MSCI IPD benchmarks again in 2017. Our outperformance over each of the past five years means we have exceeded the MSCI IPD Central London Offices Index and the MSCI IPD UK All Property Index over that period by 9% and 29%, respectively.
2013
2014
2017
2016
2015
18.515.8
25.123.5
19.9 19.7
2.92.6
8.07.1
Derwent LondonMSCI IPD Central London Offices Index
%Annual
2013
2014
2017
2016
2015
14.57.0
18.410.4
21.213.8
16.011.5
10.38.9
Derwent LondonMSCI IPD UK All Property Index
%Three-year rolling
There are 13 key performance measures that we use to assess progress against our overall objective and our five strategic objectives. They are also used to monitor the impact of the principal risks that have been identified and a number are used to determine remuneration.
1 Measured against relevant internal and external benchmarks2 Other key performance measurements
Performance measures
Determine remuneration
p.116
Assess progress
against our objectives
Monitor principal risks
p.34
KPIs1 Key metrics2
Other
R Remuneration
KeyStrategic objectives
1 To optimise returns and create value from a balanced portfolio
2 To grow recurring earnings and cash flow
3 To attract, retain and develop talented employees
4 To design, deliver and operate our buildings responsibly
5 To maintain strong and flexible financing
3130
Derwent London plc Report & Accounts 2017 Derwent London plc Report & Accounts 2017
Measuring our performancecontinued
Key metrics
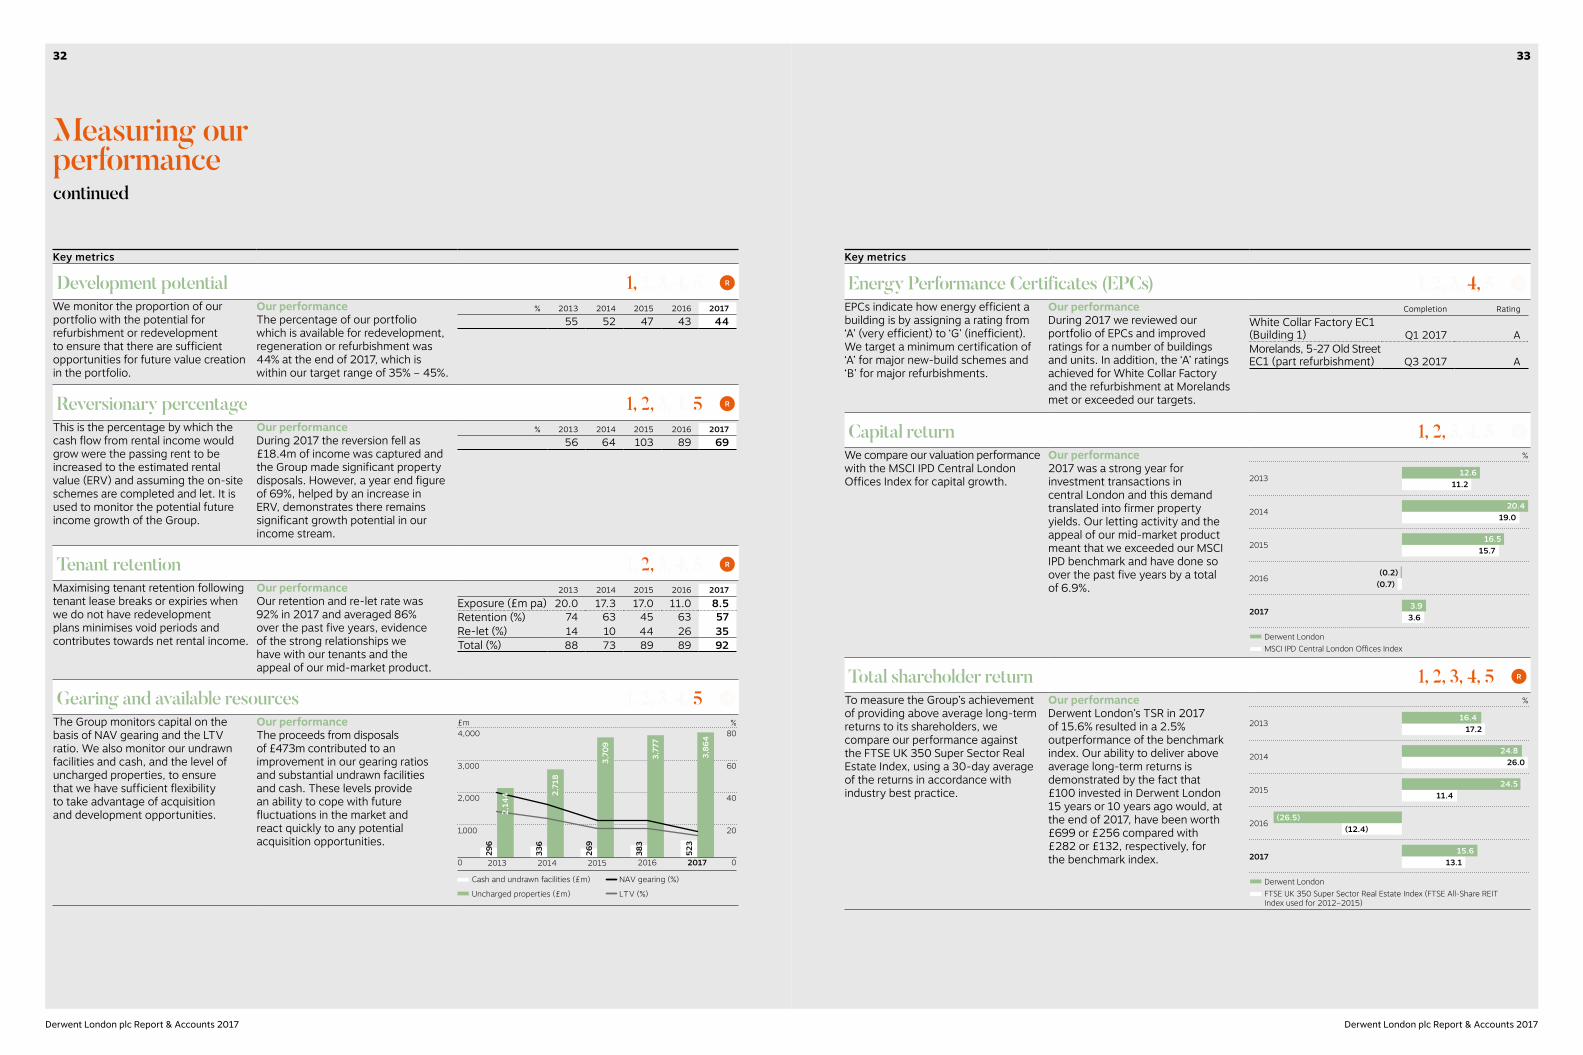
Development potential 1, 2, 3, 4, 5 2, 3, 4, 5 R
We monitor the proportion of our portfolio with the potential for refurbishment or redevelopment to ensure that there are sufficient opportunities for future value creation in the portfolio.
Our performanceThe percentage of our portfolio which is available for redevelopment, regeneration or refurbishment was 44% at the end of 2017, which is within our target range of 35% – 45%.
% 2013 2014 2015 2016 201755 52 47 43 44
Reversionary percentage 1, 2, 3, 4, 3, 4, 5 R
This is the percentage by which the cash flow from rental income would grow were the passing rent to be increased to the estimated rental value (ERV) and assuming the on-site schemes are completed and let. It is used to monitor the potential future income growth of the Group.
Our performanceDuring 2017 the reversion fell as £18.4m of income was captured and the Group made significant property disposals. However, a year end figure of 69%, helped by an increase in ERV, demonstrates there remains significant growth potential in our income stream.
% 2013 2014 2015 2016 201756 64 103 89 69
Tenant retention 1, 1, 2, 3, 4, 5 3, 4, 5 R
Maximising tenant retention following tenant lease breaks or expiries when we do not have redevelopment plans minimises void periods and contributes towards net rental income.
Our performanceOur retention and re-let rate was 92% in 2017 and averaged 86% over the past five years, evidence of the strong relationships we have with our tenants and the appeal of our mid-market product.
2013 2014 2015 2016 2017
Exposure (£m pa) 20.0 17.3 17.0 11.0 8.5Retention (%) 74 63 45 63 57Re-let (%) 14 10 44 26 35Total (%) 88 73 89 89 92
Gearing and available resources 1, 2, 3, 4, 1, 2, 3, 4, 5 R
The Group monitors capital on the basis of NAV gearing and the LTV ratio. We also monitor our undrawn facilities and cash, and the level of uncharged properties, to ensure that we have sufficient flexibility to take advantage of acquisition and development opportunities.
Our performanceThe proceeds from disposals of £473m contributed to an improvement in our gearing ratios and substantial undrawn facilities and cash. These levels provide an ability to cope with future fluctuations in the market and react quickly to any potential acquisition opportunities.
336
2,71
8
269
383
3,70
9
3,77
7
523
3,86
4 80
60
40
20
02013 2014 2016 20172015
£m %4,000
3,000
2,000
1,000
0
296
Cash and undrawn facilities (£m) NAV gearing (%)
Uncharged properties (£m) LTV (%)
2,14
4
Key metrics
Energy Performance Certificates (EPCs) 1, 2, 3, 1, 2, 3, 4, 5 5 R
EPCs indicate how energy efficient a building is by assigning a rating from ‘A’ (very efficient) to ‘G’ (inefficient). We target a minimum certification of ‘A’ for major new-build schemes and ‘B’ for major refurbishments.
Our performanceDuring 2017 we reviewed our portfolio of EPCs and improved ratings for a number of buildings and units. In addition, the ‘A’ ratings achieved for White Collar Factory and the refurbishment at Morelands met or exceeded our targets.
Completion Rating
White Collar Factory EC1 (Building 1) Q1 2017 AMorelands, 5-27 Old Street EC1 (part refurbishment) Q3 2017 A
Capital return 1, 2, 3, 4, 5 3, 4, 5 R
We compare our valuation performance with the MSCI IPD Central London Offices Index for capital growth.
Our performance2017 was a strong year for investment transactions in central London and this demand translated into firmer property yields. Our letting activity and the appeal of our mid-market product meant that we exceeded our MSCI IPD benchmark and have done so over the past five years by a total of 6.9%.
2013
2014
2017
2016
2015
12.611.2
20.419.0
16.515.7
(0.2)(0.7)
3.93.6
Derwent LondonMSCI IPD Central London Offices Index
%
Total shareholder return 1, 2, 3, 4, 5 R
To measure the Group’s achievement of providing above average long-term returns to its shareholders, we compare our performance against the FTSE UK 350 Super Sector Real Estate Index, using a 30-day average of the returns in accordance with industry best practice.
Our performanceDerwent London’s TSR in 2017 of 15.6% resulted in a 2.5% outperformance of the benchmark index. Our ability to deliver above average long-term returns is demonstrated by the fact that £100 invested in Derwent London 15 years or 10 years ago would, at the end of 2017, have been worth £699 or £256 compared with £282 or £132, respectively, for the benchmark index.
2013
2014
2017
2016
2015
Derwent LondonFTSE UK 350 Super Sector Real Estate Index (FTSE All-Share REITIndex used for 2012–2015)
%
16.417.2
24.826.0
24.511.4
(26.5)(12.4)
15.613.1
3332
Derwent London plc Report & Accounts 2017 Derwent London plc Report & Accounts 2017

Our principal risks
Risk is inherent in running any business and our risk management procedures are routinely reviewed and strengthened to ensure that all foreseeable and emerging risks are identified, understood and managed.
Risk management The role of our Board, with support from the Risk Committee, is to ensure that our risk management and internal controls are robust so that we remain able to swiftly identify and react to new threats and uncertainties. Balanced with the maintenance of a flexible business model and strong financial structure, this better enables us to weather uncertainties and take advantage of opportunities.
Our overall low risk tolerance, alongside a transparent and collaborative work style, ensures that any potential risk is identified quickly. Our approach to risk management is contained on pages 98 to 99. Our risk tolerance is set by the Board and is described in the table on page 98.
At Derwent London we aim to deliver on our strategic objectives for the benefit of our stakeholders while operating within the risk tolerance levels set by our Board.
The risk profile of the GroupAs a predominantly London-based Group, we are particularly sensitive to any factors which impact upon central London’s growth and demand for office space. Any decline in the demand for London office space or a significant increase in supply could negatively impact upon:
• the valuation of our property portfolio; • occupancy rates and, subsequently,
impact on our income; and• availability of properties for acquisition
and the ease of disposal and refinancing.
The London office market has proven to be cyclical and can be impacted by a number of external and internal factors. For example, changes in political agendas or economic factors can impact upon the:
• ease of gaining planning permission for new development projects;
• cost of acquisitions, i.e. stamp duty land tax; and
• value of our properties for overseas investors due to exchange rate fluctuations.
Following the UK decision to leave the EU, there continues to be uncertainty surrounding Brexit negotiations and the potential impact this could have on London as a major global city. Although we remain both committed to London and assured of its resilience (see pages 10 to 17), we are proactively managing the risks that could arise in the short to medium term as the impact of the Brexit negotiations are realised, by:
• seeking pre-lets of our developments with targeted marketing campaigns, including greater use of social media;
• developing properties in locations where there is greatest potential for future demand, such as near Crossrail links;
• anticipating occupier trends by engaging with our current tenants, local communities and advisers;
• designing office space that is innovative and sustainable with communal and break-out spaces that occupiers increasingly demand in order to attract talent; and
• developing and maintaining a strong brand.
Changes to our principal risksThe principal risks and uncertainties facing the Group in 2018 are set out on pages 36 to 43 together with the potential impact and the mitigating actions and controls in place. Our principal risks are not an exhaustive list of all risks facing the Group but are a snapshot of the Company’s main risk profile as at 27 February 2018.
During the year under review, there has been a number of changes to our principal risks:
New principal risks(i) Due to our significant development
pipeline with a number of key projects currently under construction including 80 Charlotte Street and the Brunel Building, the risk of delays to our projects and/or cost overruns (known as ‘on-site’ risk) has been elevated to a principal risk.
(ii) The risk that an act of terrorism interrupts the Group’s operations has now been elevated to a principal risk due to the recent terrorist activity in European cities.
Risk profile
Strategic
Property
CorporateFinancial
2017201620152014
Effect of mitigation actions on our principal risks(See pages 36-43 for risks)
Low High
High
Prob
abilit
y
Impact on the Group
Gross risk basis Net risk basis (post mitigation)
13 1312
12
11
11
10
10
9
9
8
8
7
7
6
65
5
4 4
3
3
2 2
1
1
Viability statementIn accordance with provision C.2.2 of the UK Corporate Governance Code, the Directors and the senior management team have assessed the prospects of the Company over a longer period than the 12 months required by the ‘Going Concern’ Provision, taking account of the Group’s current position and the potential impact of its principal risks.
The Board conducted this viability review over a period of five years to 31 December 2022, which was considered appropriate for the following reasons:
• the Group’s strategic review covers a five-year period;
• for a major scheme five years is a reasonable approximation of the maximum time taken from obtaining planning permission for a development to letting the property; and
• most leases contain a five-year rent review pattern and therefore five years allows for the forecasts to include the reversion arising from those reviews.
The viability review considered a variety of factors including, but not limited to, the Group’s cash flows as identified in the latest five-year strategic review, dividend cover, REIT compliance, financial ratios and stress testing of our business model. We also reviewed potential Brexit negotiation outcomes and the likely impact on London and our business.
This year’s review was carried out in the context of the £473m of property disposals that were made in the past year which further reduced the Group’s loan-to-value ratio to 13.2% and helped increase interest cover to 454%.
In addition, the level of cash and undrawn facilities increased to £523m during the year which meant that the entire committed project pipeline on site was fully funded as at 31 December 2017.
Full details of the process undertaken by the Board is detailed on page 111 of the Audit Committee report.
Based on the Board’s assessment, the Directors have a reasonable expectation that the Company will be able to continue in operation and meet its liabilities as they fall due over the five-year period to 31 December 2022.
(iii) In order to focus our risk management activities, we have split non-compliance with health and safety regulation and with environmental and sustainability legislation from ‘regulatory non-compliance’.
Increasing risks(iv) Partly driven by the economic
uncertainty arising from the decision to leave the EU and the importance of our development pipeline, the risks of reduced development returns and contractor/subcontractor default have increased.
Decreasing risks(v) The risk that the Group is subject
to a cyber attack remains a principal risk (see page 38) but the assessment of this risk has slightly reduced during the year due to the substantial mitigation work being conducted by management and our IT team.
3534
Derwent London plc Report & Accounts 2017 Derwent London plc Report & Accounts 2017
Our principal riskscontinued
Strategic risksThat the Group’s business model and/or strategy does not create the anticipated shareholder value or fails to meet investors’ and other stakeholders’ expectations.
Risk Our key controls Potential impact What we did in 2017 Further mitigating actions for 2018
1. Inconsistent strategyThe Group’s strategy is not met due to poor strategy implementation or a failure to respond appropriately to internal or external factors such as:• an economic downturn and/or the Group’s development programme
being inconsistent with the current economic cycle; and• London losing its global appeal with a consequential impact on
the property investment or occupational markets.
Movement during the year:
The Board considers this risk to have remained broadly the same. Throughout the year, the Group continued to benefit from a resilient central London office market.
• The Group conducts an annual five-year strategic review and prepares a budget and three rolling forecasts covering the next two years.
• The Board considers the sensitivity of the Group KPIs and key metrics to changes in the assumptions underlying our forecasts in light of anticipated economic conditions. If considered necessary, modifications are made.
• The Group’s development pipeline has a degree of flexibility that enables plans for individual properties to be changed to reflect prevailing economic circumstances.
• The Group seeks to maintain income from properties until development commences and has an ongoing strategy to extend income through lease renewals and re-gearing.
• The Group aims to de-risk the development programme through pre-lets.• The Group maintains sufficient headroom in all the Group’s key ratios and financial
covenants and a focus on interest cover.
Strategic objectives • The annual strategic review was performed in May 2017 and reviewed at the Board’s strategy meeting on 23 June 2017.
• The Board considered the sensitivity of our KPIs and metrics to changes in underlying assumptions including interest rates, timing of projects, level of capital expenditure and the extent of capital recycling.
• Three rolling forecasts were prepared. • Pre-lets have been secured at 73% of 80 Charlotte Street,
part of the Group’s record year of lettings when 685,700 sq ft of new lettings were secured.
• During the year the Group’s LTV ratio was further reduced to 13.2%, its net interest cover ratio was above 450% and the REIT ratios were comfortably met.
• De-risk the Brunel Building development through our pre-letting strategy and continued monitoring of construction progress.
• Monitor our portfolio for further asset management activities.
• Extend income through renewals and re-gears for properties not earmarked for regeneration.
• Decision on whether to commit to Soho Place.• Continue with our current controls and
mitigating actions.
1, 2, 5Business model
Could potentially impact on all aspects of our business model.
KPIs and key metrics
• Total return• Total property return
2. Adverse Brexit settlementRisk that negotiations to leave the EU result in arrangements which are damaging to the London economy. As a predominantly London-based Group, we are particularly sensitive to any factors which impact upon London’s growth and demand for office space.Negotiations are likely to be ongoing during 2018 and the operating framework facing UK businesses and the effect on London post-Brexit cannot be accurately predicted.
Movement during the year:
Although some progress on negotiations has been made, the Board considers this risk to have remained broadly the same during the year.
• The Group’s strong financing and covenant headroom enables it to weather a downturn. • The Group’s diverse and high-quality tenant base provides resilience against tenant
default. See page 12 for analysis of the Group’s tenant base.• The Group focuses on good value, middle market rent properties which are less
susceptible to reductions in tenant demand. The Group’s average ‘topped-up’ office rent is only £49.74 per sq ft.
• The Group develops properties in locations where there is greatest potential for future demand, such as near Crossrail stations.
• Income is maintained at future developments for as long as possible.• Ongoing strategy is to extend income through lease renewals and re-gearing and to
de-risk the development programme though pre-lets. • Updates received on occupier trends by engaging with our current tenants and advisers.
Strategic objectives • Brexit risk assessments have been performed to understand how the different scenarios of Brexit could impact on our business model and strategy.
• Monitored Brexit negotiations and discussed potential outcomes with external advisers.
• Monitored letting progress and demand for our buildings.• As at 31 December 2017, the Group had cash and undrawn
facilities of £523m.
• Continue to monitor Brexit negotiations. • We will continue with our current controls
and mitigating actions including operating the business on a basis that balances risk and income generation.
1, 2, 5Business model
Could eventually impact on most aspects of our business model.
KPIs and key metrics
• Total return• Total property return• Total shareholder return
3. Reputational damageThe Group’s reputation is damaged, e.g. through unauthorised and/or inaccurate media coverage or failure to comply with relevant legislation.
Movement during the year:
The Board considers this risk to have remained broadly the same during the year. We have an established and trusted brand. Our strong culture, low overall risk tolerance and established procedures and policies mitigate against the risk of internal wrongdoing. Further information on how we mitigate against the risk of non-compliance with legislation can be found on page 40.
• Close involvement of senior management in day-to-day operations and established procedures for approving all external announcements.
• All new members of staff benefit from an induction programme and are issued with our Group staff handbook.
• The Group employs a Head of Investor and Corporate Communications and retains the services of an external PR agency, both of whom maintain regular contact with external media sources.
• A Group whistleblowing system for staff is maintained to report wrongdoing anonymously.• Social media channels are monitored.• Ongoing engagement with local communities in areas where the Group operates,
see page 78.
Strategic objectives • Monitored investor views and press comments while maintaining contact with other stakeholders.
• Performed a review of our social media activity and agreed a specific social media marketing plan and set advertising budgets for the year.
• Developed a more extensive social media strategy for implementation during 2018.
• Continue with our current controls and mitigating actions.
• Implement the social media strategy including providing our staff with additional social media training.
1, 2, 3, 4, 5Business model
Could potentially impact on all aspects of our business model.
KPIs and key metrics
• Total shareholder return• Total return• Total property returnCould indirectly impact on a number of our other KPIs and key metrics.
Movement during the year
Risk increased
Risk unchanged
Risk decreased
KeyStrategic objectives
1 To optimise returns and create value from a balanced portfolio
2 To grow recurring earnings and cash flow
3 To attract, retain and develop talented employees
4 To design, deliver and operate our buildings responsibly
5 To maintain strong and flexible financing
3736
Derwent London plc Report & Accounts 2017 Derwent London plc Report & Accounts 2017
Financial risksSignificant steps have been taken in recent years to reduce or mitigate the Group’s financial risks such that few are now considered to be principal risks of the Group. The main financial risk is that the Group becomes unable to meet its financial obligations, which is not currently a principal risk. Financial risks can arise from movements in the financial markets in which we operate and inefficient management of capital resources.
Risk Our key controls Potential impact What we did in 2017 Further mitigating actions for 2018
4. Increase in property yieldsIncreasing property yields, which may be a consequence of rising interest rates, would cause property values to fall. Interest rates have remained low for an extended period and are expected to gradually rise over the next few years. Though there is no direct relationship, this may cause property yields to increase.
Movement during the year:
The Board considers this risk to have remained broadly the same during the past year. The underlying value of the properties in our portfolio have remained resilient and in 2017 have increased by 3.9%, despite the continuing economic uncertainties.
• The impact of yield changes is considered when potential projects are appraised.• The impact of yield changes on the Group’s financial covenants and performance are
monitored regularly and are subject to sensitivity analysis to ensure that adequate headroom is preserved.
• The Group’s move towards mainly unsecured financing over the past few years has simplified the management of our financial covenants.
• The Group’s low LTV ratio reduces the likelihood that falls in property values have a significant impact on our business.
Strategic objectives • The Group produced three rolling forecasts during the year which contain detailed sensitivity analyses, including the effect of changes to yields.
• Quarterly management accounts were provided to the Board and included the Group’s performance against the financial covenants.
• Continue with our current controls and mitigating actions.
1, 5Business model
• Our assets and resources• Adding value for stakeholders
KPIs and key metrics
• Interest cover ratio• Total return• Total property return• Gearing and available resources
Operational risksThe Group suffers either a financial loss or adverse consequences due to processes being inadequate or not operating correctly, human factors or other external events.
5. Reduced development returnsThe Group’s development projects do not produce the targeted financial returns due to one or more of the following factors:• delays on site;• increased construction costs; and• adverse letting conditions.For example, delays could lead to penalties payable to pre-let tenants at 80 Charlotte Street.
Movement during the year:
The ongoing economic uncertainty arising from the decision to leave the EU has caused this risk to increase slightly. Although pre-lets have substantially de-risked our schemes, they have also led to greater financial exposure should projects be delivered late.
• Investment appraisals, which include contingencies and inflationary cost increases, are prepared and a sensitivity analysis is undertaken to ensure that an adequate return is made in all likely circumstances.
• The procurement process used by the Group includes the use of highly regarded firms of quantity surveyors and is designed to minimise uncertainty regarding costs.
• Development costs are benchmarked to ensure that the Group obtains competitive pricing and, where appropriate, fixed-price contracts are entered into.
• Procedures carried out before starting work on site, such as site investigations, historical research of the property and surveys conducted as part of the planning application, reduce the risk of unidentified issues causing delays once on site.
• The Group’s pre-letting strategy reduces or removes the letting risk of the development as soon as possible.
• Post-completion reviews are carried out for all major developments to ensure that improvements to the Group’s procedures are identified, implemented and lessons learned.
Strategic objectives • Demand for our developments is evidenced by the significant pre-letting activity in the year.
• Pre-lets were secured in 2017 over 276,900 sq ft (86% of the offices) of 80 Charlotte Street.
• Sale of The Copyright Building for £148.2m, 21% above valuation (see page 63 for further details).
• Closely monitored development programmes.• Construction costs now substantially fixed on all
development projects.
• Further de-risk the Brunel Building development through our pre-letting strategy.
• Continue with our current controls and mitigating actions with a major focus on project monitoring. 1, 2, 5
Business model
• Our core activities • Adding value for stakeholders
KPIs and key metrics
• Total return• Total property return
6. Cyber attackThe Group is subject to a cyber attack that results in it being unable to use its IT systems and/or loses data. This could lead to an increase in costs while a significant diversion of management time would have a wider impact.
Movement during the year:
Risk has slightly decreased due to the controls and procedures implemented during 2017.
• The Group’s Business Continuity Plan is regularly reviewed and tested (further information on page 115).
• Independent internal and external ‘penetration’ tests are regularly conducted to assess the effectiveness of the Group’s security.
• Multifactor authentication exists for remote access to our systems.• Incident response and remediation policies are in place.• The Group’s data is regularly backed up and replicated and our IT systems are
protected by anti-virus software and firewalls that are frequently updated.• Annual staff awareness and training programmes are implemented. • Security measures are regularly reviewed by the IT Steering Committee.
Strategic objectives • Independent internal and external ‘wireless’ penetration tests were conducted to assess the effectiveness of the Group’s security.
• The switchover of the IT systems to the Group’s back up facility was successfully tested.
• Independent benchmarking review of the Group’s cyber security was carried out in November (see page 114 for further information).
• Embedded an AI (Artificial Intelligence) layer into our security defence capability.
• Replaced legacy hardware and redesigned our network as part of the 25 Savile Row redevelopment project.
• Improved data storage retention and security.• Staff awareness and IT policy training in December to make
staff more aware of the techniques that may be used to gain unauthorised access to the Group’s systems.
• Perform an exercise to better understand the potential impact of a cyber attack on our Group.
• Upgrade firewall protection to enhance cyber defences.
• Further develop our incident response plans.• Aim to introduce advanced internet filtering.• Full business continuity test to be conducted.• Review whether the Group would benefit from
cyber insurance.
1, 2, 3, 4, 5Business model
• Could potentially impact on all aspects of our business model
KPIs and key metrics
• Total shareholder return
Our principal riskscontinued
Movement during the year
Risk increased
Risk unchanged
Risk decreased
KeyStrategic objectives
1 To optimise returns and create value from a balanced portfolio
2 To grow recurring earnings and cash flow
3 To attract, retain and develop talented employees
4 To design, deliver and operate our buildings responsibly
5 To maintain strong and flexible financing
3938
Derwent London plc Report & Accounts 2017 Derwent London plc Report & Accounts 2017

Risk Our key controls Potential impact What we did in 2017 Further mitigating actions for 2018
7. Non-compliance with health and safety legislation The Group’s cost base is increased and management time is diverted through an incident or breach of health and safety legislation leading to reputational damage and/or loss of our licence to operate. New principal risk. This risk was previously included within regulatory non-compliance.
• The Group has a qualified health and safety team whose performance is monitored and managed by the Health and Safety Committee (see pages 80 to 81 for further details).
• External advisers (ORSA) appointed to advise on construction health and safety.• When required, external consultants are used on facilities management matters.• The Board and Executive Committee receive regular updates and presentations
on key health and safety matters.• All our properties have health, safety and fire management procedures in place
which are reviewed annually.• External project managers review health and safety on each construction site
on a monthly basis.
Strategic objectives • ORSA presented to the Risk Committee on construction health and safety matters in May.
• Approved the composition and revised terms of reference of the Health and Safety Committee.
• The Risk Committee received regular updates on the Group’s review of insulation cladding and fire protection procedures (see pages 81 and 113 for further information).
• Recruit a new Head of Health and Safety. • Review all our health and safety procedures
and systems, updating them as required.• ORSA to present to the Health and Safety
Committee and Risk Committee.• Perform an independent review of our
health and safety indicators during Q1 2018.• The Health and Safety Committee to receive
regular reports from each external Project Manager on health and safety at each of our construction sites during the year.
1, 2, 3, 4Business model
Could potentially impact on all aspects of our business model.
KPIs and key metrics
• Total shareholder return• A significant diversion of time could
affect a wider range of key metrics.
8. Non-compliance with environmental and sustainability legislationThe Group’s cost base is increased and management time is diverted through a breach of any of the legislation, e.g. Minimum Energy Efficiency Standards (MEES) for buildings. This could lead to damage to our reputation and/or loss of our licence to operate. New principal risk.This risk was previously included within regulatory non-compliance.Further information on page 72.
• The Board and Executive Committee receive regular updates and presentations on environmental and sustainability performance and management matters.
• The Sustainability Committee monitors our performance and management controls.• Employment of a qualified team led by an experienced Head of Sustainability.• The Group benchmarks its environmental, social and governance (ESG) reporting
against various industry benchmarks.• The Group has set long-term, science-based carbon targets aligned with the outcome
of the Paris Climate Change Agreement and the UK Climate Change Act (COP 21). • Production of an Annual Sustainability Report, the key data points and the performance
of which are externally assured (further information on pages 72 to 77).
Strategic objectives • An audit of our entire portfolio in respect of MEES has been conducted. No significant issues were identified.
• Updated our sustainability framework documents to include tougher carbon requirements which align with the Group’s new science-based carbon targets.
• The Group continues to set sustainability targets which are monitored during the year. Further information on pages 72 to 85.
• Project approval forms to be updated to ensure any capital expenditure will not adversely affect our carbon target performance or the EPC rating of the property.
• Implementation of a new carbon measurement tool to help the Group track its performance against new targets.
1, 3, 4Business model
Could potentially impact on all aspects of our business model.
KPIs and key metrics
• Total return• BREEAM rating• EPC rating• A significant diversion of time could
affect a wider range of key metrics.
9. Other regulatory non-complianceThe Group’s cost base is increased and management time is diverted through a breach of any of the legislation that forms the regulatory framework within which the Group operates. This could lead to damage to our reputation and/or loss of our licence to operate.
Movement during the year:
The Board considers this risk to have remained broadly the same during the year.
• The Board and the Risk Committee receive regular reports prepared by the Group’s legal advisers identifying upcoming legislative/regulatory changes. External advice is taken on any new legislation.
• Staff training and awareness programmes.• Group policies and procedures dealing with all key legislation are available
on the Group’s intranet.• A Group whistleblowing system for staff is maintained to report
wrongdoing anonymously.
Strategic objectives • Quarterly review of our anti-bribery and corruption procedures by the Risk Committee (see page 114 for more information).
• Board and Risk Committee received updates on General Data Protection Regulations (GDPR) and preventing the facilitation of tax evasion (further information on page 115).
• As part of our 2017 staff performance appraisals, all employees confirmed they have reviewed and understood Group policies.
• No whistleblowing incidents were reported during the year.
• The Board and Executive Committee will continue to monitor the Group’s implementation of the GDPR project.
• Governance procedures will be reviewed to determine our compliance with the revised UK Corporate Governance Code.
• Continue with our current controls and mitigating actions.
3, 4, 5Business model
Could potentially impact on all aspects of our business model.
KPIs and key metrics
• Total shareholder return• A significant diversion of time could
affect a wider range of key metrics.
Our principal riskscontinued
Movement during the year
Risk increased
Risk unchanged
Risk decreased
KeyStrategic objectives
1 To optimise returns and create value from a balanced portfolio
2 To grow recurring earnings and cash flow
3 To attract, retain and develop talented employees
4 To design, deliver and operate our buildings responsibly
5 To maintain strong and flexible financing
4140
Derwent London plc Report & Accounts 2017 Derwent London plc Report & Accounts 2017
Risk Our key controls Potential impact What we did in 2017 Further mitigating actions for 2018
10. ‘On-site’ riskRisk of project delays and/or cost overruns caused by unidentified issues, e.g. asbestos in refurbishments or ground conditions in developments.For example, delays could lead to penalties payable to pre-let tenants at 80 Charlotte Street. Our pre-let strategy has increased this risk. New principal risk.
• Prior to construction beginning on site we conduct site investigations including the building’s history and various surveys to identify any potential issues.
• Regular monitoring of our contractors’ cash flows.• Off-site inspection of key components to ensure they have been completed to
the requisite quality. • Payments to contractors to incentivise them to achieve agreed project timescale
and damages agreed in the event of delays/cost overruns. • Frequent meetings with key contractors and sub-contractors to review the
work programme.
Strategic objectives • The Board and Executive Committee received regular updates on our principal developments.
• Quarterly cost reports provided an update on development progress from a cost, profitability and programme perspective.
• Our development teams have managed to substantially fix the costs for 80 Charlotte Street and the Brunel Building.
• We will aim to substantially fix the costs and programme for the Soho Place scheme through the appointment of a main contractor.
• Continue with our current controls and mitigating actions.
1, 2, 4Business model
• Our core activities • Adding value for stakeholders
KPIs and key metrics
• Total return• Total property return• Total shareholder return
11. Contractor/subcontractor defaultReturns from the Group’s developments are reduced due to delays and cost increases caused by either a main contractor or major subcontractor defaulting during the project.
Movement during the year:
The risk has slightly increased during the year, partly due to the economic and political uncertainty and the importance of delivering the Group’s key development projects.
• The financial standing of our main contractors is reviewed prior to awarding the project contract.
• Regular monitoring of our contractors’ cash flows is carried out.• Key construction packages are acquired early in the project’s life to reduce the risks
associated with later default. • Whenever possible the Group uses contractors/subcontractors that it has previously
worked with successfully.• Regular on-site supervision by a dedicated Project Manager which monitors contractor
performance and identifies any problems at an early stage thereby enabling remedial action to be taken.
• Performance bonds are sought if considered necessary.• Our main contractors are responsible, and assume the risk, for any subcontractor default.
Strategic objectives • The Board and Executive Committee received regular updates on our principal developments.
• Quarterly cost reports providing an update on development progress from a cost, profitability and programme perspective.
• To mitigate risk at Soho Place, we will be conducting a two-stage procurement process which allows us to assess and have input into the selection of subcontractors.
• Continue with our current controls and mitigating actions.
1, 2, 4Business model
• Our core activities • Adding value for stakeholders
KPIs and key metrics
• Total return• Total property return• Total shareholder return
12. Shortage of key staffThe Group is unable to successfully implement its strategy due to a failure to recruit and retain key staff with appropriate skills and/or inadequate succession planning.
Movement during the year:
The Board considers this risk to have remained broadly the same during the year. As outlined on page 102, the Nominations Committee will be focusing on Board succession in 2018.
• The Nominations Committee considers succession matters at Board level as a standing agenda item.
• Senior management succession is considered during the five-year strategic reviews.• Remuneration packages for all employees are benchmarked regularly. • Six-monthly performance appraisals identify training requirements and career aspirations.
Strategic objectives • Launch of the ‘Fit for the Future’ programme. • The Group recruited 14 new members of staff during 2017
(13 in 2016) and we spent £75,500 on training initiatives.• Arranged the Group’s first staff ‘awayday’ which included
an update on the Group’s strategy.• The Group conducted a second detailed employee survey.
Further information on pages 82 to 84.
• Set up a working group to propose ideas to the Executive Committee on how to address higher priority areas following the second employee survey.
• To continue to cultivate, focus on and manage the ‘talent pipeline’ via the ‘Fit for the Future’ programme, by identifying, assessing and developing key individuals to enable them to be ready and able to take on future key roles.
• Continue to support the Group in creating a working environment that promotes individual well-being and a respectful, inclusive, collaborative and safe culture.
1, 2, 3, 4, 5Business model
Could potentially impact on all aspects of our business model.
KPIs and key metrics
Could impact on any Group KPIs.
13. Terrorism or other business interruption Elevated to a new principal risk due to recent attacks in European capital cities. New principal risk.
• The Group has comprehensive business continuity and incident management procedures both at Group level and for each of our managed buildings which are regularly reviewed and tested (further information on page 115).
• Fire protection and access/security procedures are in place at all of our managed properties.
• Comprehensive property damage and business interruption insurance which includes terrorism.
• At least annually, a fire risk assessment and health and safety inspection is performed for each property in our managed portfolio.
Strategic objectives • Updated our incident management procedures for each of the buildings in the managed portfolio to reflect increased risks.
• Provided training to our building managers on the management of major incidents.
• Continue with our proactive approach to anticipating changes to building regulations from the Dame Judith Hackitt review, such as specifying non-combustible materials where possible.
• Carry out tests of our business continuity and incident management procedures.
• Continue with our current controls and mitigating actions.
1, 2, 3, 4, 5Business model
Could potentially impact on all aspects of our business model.
KPIs and key metrics
Could impact on any Group KPIs.
Our principal riskscontinued
Movement during the year
Risk increased
Risk unchanged
Risk decreased
KeyStrategic objectives
1 To optimise returns and create value from a balanced portfolio
2 To grow recurring earnings and cash flow
3 To attract, retain and develop talented employees
4 To design, deliver and operate our buildings responsibly
5 To maintain strong and flexible financing
4342
Derwent London plc Report & Accounts 2017 Derwent London plc Report & Accounts 2017
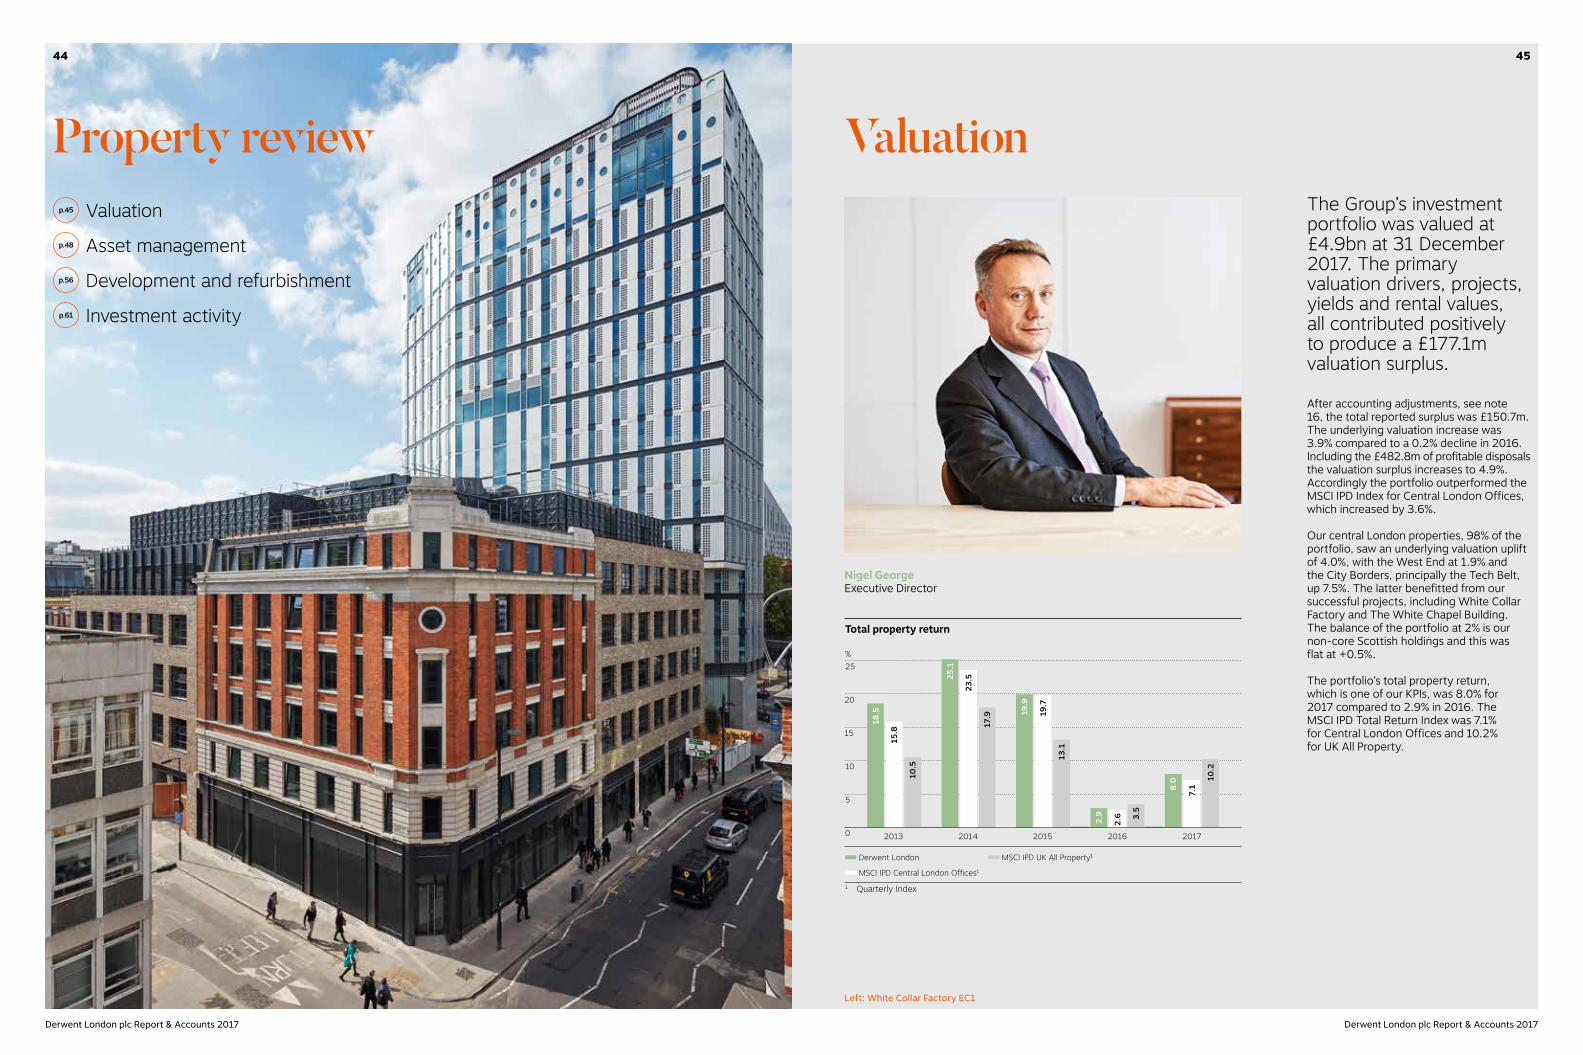
Valuation
Left: White Collar Factory EC1
The Group’s investment portfolio was valued at £4.9bn at 31 December 2017. The primary valuation drivers, projects, yields and rental values, all contributed positively to produce a £177.1m valuation surplus.
After accounting adjustments, see note 16, the total reported surplus was £150.7m. The underlying valuation increase was 3.9% compared to a 0.2% decline in 2016. Including the £482.8m of profitable disposals the valuation surplus increases to 4.9%. Accordingly the portfolio outperformed the MSCI IPD Index for Central London Offices, which increased by 3.6%.
Our central London properties, 98% of the portfolio, saw an underlying valuation uplift of 4.0%, with the West End at 1.9% and the City Borders, principally the Tech Belt, up 7.5%. The latter benefitted from our successful projects, including White Collar Factory and The White Chapel Building. The balance of the portfolio at 2% is our non-core Scottish holdings and this was flat at +0.5%.
The portfolio’s total property return, which is one of our KPIs, was 8.0% for 2017 compared to 2.9% in 2016. The MSCI IPD Total Return Index was 7.1% for Central London Offices and 10.2% for UK All Property.
Nigel GeorgeExecutive Director
0
18.5
15.8
10.5
25.1
23.5
17.9 19
.9
19.7
13.1
2.9
2.6 3.
5
8.0
7.1
10.210
5
20
15
25%
Total property return
2016 2017201520142013
Derwent London
MSCI IPD Central London Offices1
MSCI IPD UK All Property1
1 Quarterly Index
Asset management
Valuation
Development and refurbishment
Investment activity
Property review
p.48
p.45
p.56
p.61
4544
Derwent London plc Report & Accounts 2017 Derwent London plc Report & Accounts 2017
We were particularly active with our four on-site developments at the beginning of 2017. White Collar Factory was completed and is now a core income property. Brunel Building and 80 Charlotte Street, which were valued at £404.7m at December 2017, are not scheduled to complete until 2019. Charlotte Street saw strong pre-letting activity during the year. These three developments delivered a 16.0% valuation uplift in 2017. The other development, The Copyright Building W1, was sold in the second half of the year generating a valuation surplus of 21.0% above book value.
On an EPRA basis the portfolio’s initial yield at December 2017 was 3.4% rising to a ‘topped-up’ 4.4% following the expiry of rent free periods and contractual rental uplifts. For the previous year, these figures were 3.4% and 4.1%, respectively. The true equivalent yield was 4.73%, a 10bp inward
movement over the year which compares favourably with the 31bp yield expansion in 2016. This change reflects stronger investor demand for central London assets.
Our mid-market rental ‘villages’ continued to attract a wide range of occupiers, but the rate of rental growth has slowed. Our EPRA rental value movement was up 1.7%.
As well as our record letting year, our asset management team was busy capturing growth from the core income element of the portfolio through rent reviews, renewals and lease re-gears. There are more details on this activity in the Asset management section (see page 48). These improvements contributed to the 6.5% increase in the annualised contracted rent, from £150.3m to £160.1m. The gain was despite the loss of £8.6m of contracted rent from disposals, which also caused the total ERV to decline 5.1% to £270.1m.
The portfolio reversion at year end was £110.0m. Of this £68.4m is contractual from fixed uplifts, the expiry of rent free periods or pre-lets. The majority of the balance comes from letting vacant space, either available to occupy or under construction. This totalled £27.3m, of which 69% relates to the two on-site developments: Brunel Building and 80 Charlotte Street. The final £14.3m component of the reversion comes from achieving market rents at future rent reviews and lease renewals.
75
0
150
225
300
30
0
60
90
120
Portfolio income potential
20172016201520142013
Reversion %Rental income £m
Contractual rental uplifts (including pre-lets)Available to occupy
Under refurbishment/developmentRent reviews and lease renewalsReversion
Contractual rent
Valuation yields
0
8
6
4
2
2000 2002 2004 2006 2008 2010 2012 2014 2016
%
Derwent London True Equivalent Yield (TEY)Derwent London Initial Yield 10-year Gilt
Average gap (262 bp)Gap between DL TEY and 10-year Gilt
Valuationcontinued
Portfolio statistics – valuation
Valuation£m
Weighting%
Valuation1
performance%
Let floor area2
’000 sq ft
Vacant available
floor area’000 sq ft
Vacant refurbishment floor area
’000 sq ft
Vacant project
floor area’000 sq ft
Total floor area’000 sq ft
West EndCentral 2,438.6 50 0.8 2,174 13 30 348 2,565Borders 480.2 10 7.9 516 0 0 0 516
2,918.8 60 1.9 2,690 13 30 348 3,081CityBorders 1,877.6 38 7.5 1,969 52 67 0 2,088Central London 4,796.4 98 4.0 4,659 65 97 348 5,169
Provincial 101.2 2 0.5 341 2 0 0 343Total portfolio 2017 4,897.6 100 3.9 5,000 67 97 348 5,512
2016 4,980.5 100 (0.2) 4,963 113 163 742 5,9811 Underlying – properties held throughout the year2 Includes pre-lets
Rental income profileRentaluplift
£m
Rentalper annum
£mAnnualised contracted rental income, net of ground rents 160.1Contractual rental increases across the portfolio 44.2Contractual rental from 89,000 sq ft pre-let refurbishment 2.4Contractual rental from 275,000 sq ft pre-lets on developments 21.8Letting 67,000 sq ft available floor area 2.8Completion and letting 97,000 sq ft of refurbishments 5.7Completion and letting 348,000 sq ft of developments 18.8Anticipated rent review and lease renewal reversions 14.3Portfolio reversion 110.0Potential portfolio rental value 270.1
Portfolio statistics – rental incomeNet
contracted rental income per annum
£m
Average rental
income£ per sq ft
Vacant space
rental value per annum
£m
Leasereversions1
per annum£m
Portfolio estimated
rental value per annum
£m
Average unexpired
lease length2
YearsWest EndCentral 78.3 36.21 21.9 38.7 138.9 5.6Borders 15.6 30.27 0.0 11.1 26.7 8.5
93.9 35.07 21.9 49.8 165.6 6.1CityBorders 61.0 31.74 5.4 32.5 98.9 6.2Central London 154.9 33.67 27.3 82.3 264.5 6.2
Provincial 5.2 15.39 0.0 0.4 5.6 3.4Total portfolio 2017 160.1 32.42 27.3 82.7 270.1 6.03
2016 150.3 30.73 58.4 75.8 284.5 6.51 Contractual uplifts, rent review/lease renewal reversion and pre-lets2 Lease length weighted by rental income at year end and assuming tenants break at first opportunity3 7.8 years after adjusting for ‘topped-up’ rents and pre-lets
4746
Derwent London plc Report & Accounts 2017 Derwent London plc Report & Accounts 2017
Asset management
Principal lettings in 2017
Property TenantAreasq ft
Rent£ psf
Totalannual rent
£m
Min/fixed uplift at first review
£ psfLease term
YearsLease break
Year
Rent free equivalent
Months
Q180 Charlotte Street W1 Arup 133,600 72.9 9.71 81.5 20 – 33White Collar Factory EC1 Adobe 14,900 67.5 1.0 74.5 11.5 – 22Angel Building EC1 Expedia 12,500 62.5 0.8 – 13.3 – 18Greencoat & Gordon House SW1 VCCP 12,800 55.0 0.7 – 8.5 – 1320 Farringdon Road EC1 Accenture 11,500 55.0 0.6 – 10 5 9, plus 9
if no break
Q2The White Chapel Building E1 Phase 2 – lower ground floors
Fotografiska 89,000 27.0 2.4 27.7 15 12 30, plus 6if no break
White Collar Factory EC1 Box.com 28,500 75.0 2.1 – 15 10 18, plus 5if no break
The White Chapel Building E1 Wilmington 27,000 52.0 1.4 – 10 – 20The White Chapel Building E1 ComeOn! 12,700 50.0 0.6 – 10 5 11, plus 8
if no breakWhite Collar Factory EC12 Red Badger 7,700 62.5 0.5 65.6 10 5 9.5, plus 5
if no break78 Whitfield Street W1 Made Thought 4,800 63.5 0.3 – 10 4.5 878 Whitfield Street W1 Yoyo Wallet 4,800 63.0 0.3 – 4.5 – 878 Chamber Street E13 NetBooster 6,700 40.0 0.3 – 10 5 10
Q380 Charlotte Street W1 The Boston
Consulting Group123,500 85.5 10.6 – 15 12 Confidential
80 Charlotte Street W1 Arup 19,800 75.0 1.51 83.8 20 – 3390 Whitfield Street W1 Freightliner 12,100 71.0 0.9 – 10 – 22Holden House W1 Russell & Bromley 3,800 – 0.7 – 10 5 312-16 Fitzroy Street W1 Ergonom 8,800 54.0 0.5 57.0 15 10 15White Collar Factory EC1 Egress 6,700 67.5 0.5 – 10 5 9, plus 9
if no break
Q4The Copyright Building W14 Bone Daddies 5,600 – 0.4 – 20 – 14
1 Annual increases of 2.25% for the first 15 years2 Low rise buildings3 Joint venture – Derwent London share4 Since sold
28.2
13.3
24.8
6.6
11.9
15.2
2.4
6.810.5
11.3
7.3
6.0
2.6
14.1
8.0
10
30
20
40
0 2010 2011 2012 2013 2014 2015 2016 2017
£m pa
Letting activity by rental income
Pre-lets
Non pre-lets
Paul WIlliams Executive Director
We continue to make the most of the opportunities provided by the strength of London’s occupational market aligned with our development programme.
During 2017 we let 685,700 sq ft achieving rents of £41.5m (£41.3m net), at an average level of 1.3% above December 2016 ERV. This represents an exceptional level of activity surpassing last year’s previous record by 32%, and it means that we have achieved £56.2m of new lettings in the 18 months since the EU referendum.
Letting activity 2017
Performance against Dec 16 ERV (%)
Areasq ft
Income£m pa
Openmarket Overall1
H1 439,200 23.4 1.8 0.5H2 246,500 18.1 2.4 2.42017 685,700 41.5 2.1 1.31 Includes short-term lettings at properties earmarked
for redevelopment
Our second half 2017 transactions covered 246,500 sq ft and achieved £18.1m of rent at average rents 2.4% above December 2016 ERV, or 1.8% above June 2017 ERV. Of our total lettings for the year, 61% by income came from pre-lets notably at 80 Charlotte Street and The White Chapel Building Phase 2 and a further 15% from lettings at major completions, notably White Collar Factory.
4948
Derwent London plc Report & Accounts 2017 Derwent London plc Report & Accounts 2017
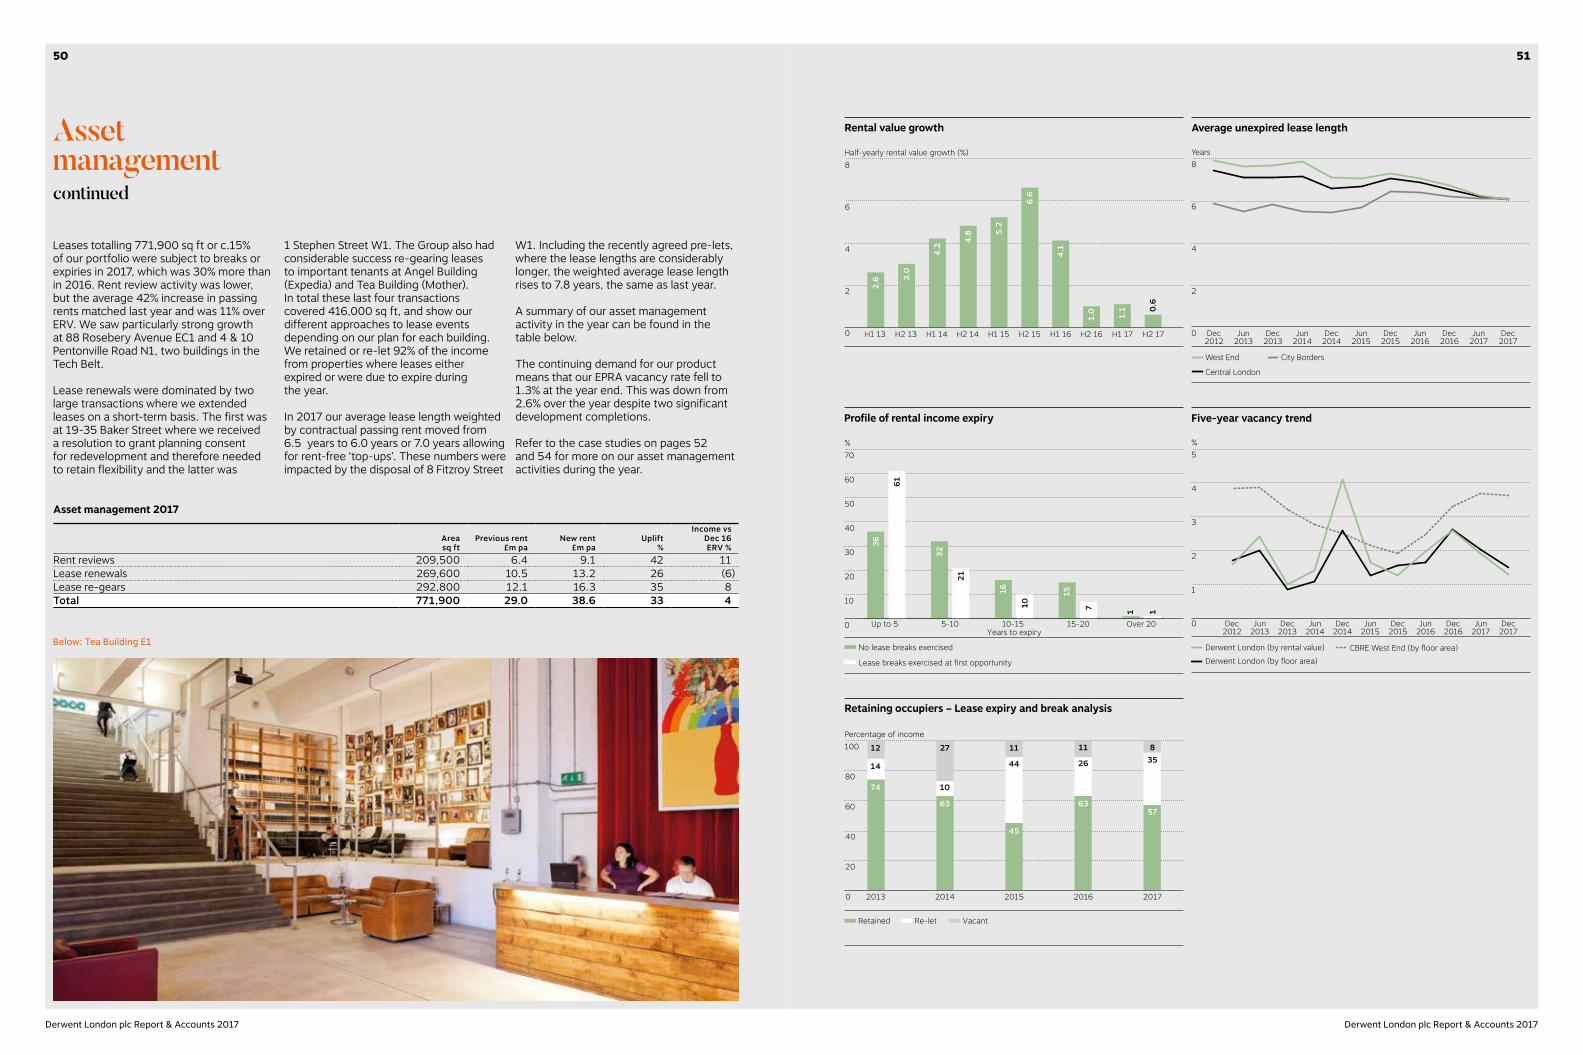
Asset managementcontinued
2
8
4
6
0
Years
Dec2012
Jun2013
Dec2013
Jun2014
Dec2014
Jun2015
Dec2015
Jun2016
Dec2016
Jun2017
Dec2017
Average unexpired lease length
West End City Borders
Central London
36
61
15
7
32
21
16
10
1 1
30
20
50
60
40
70
10
0 Up to 5 5-10 10-15 15-20 Over 20
%
Years to expiry
Profile of rental income expiry
No lease breaks exercised
Lease breaks exercised at first opportunity
1
2
5
3
4
0
%
Dec2012
Jun2013
Dec2013
Jun2014
Dec2014
Jun2015
Dec2015
Jun2016
Dec2016
Jun2017
Dec2017
Five-year vacancy trend
Derwent London (by rental value)Derwent London (by floor area)
CBRE West End (by floor area)
Asset management 2017
Areasq ft
Previous rent£m pa
New rent£m pa
Uplift%
Income vs Dec 16ERV %
Rent reviews 209,500 6.4 9.1 42 11Lease renewals 269,600 10.5 13.2 26 (6)Lease re-gears 292,800 12.1 16.3 35 8Total 771,900 29.0 38.6 33 4
2
0
6
4
8
Rental value growth
Half-yearly rental value growth (%)
H1 17 H2 17H1 13 H2 13 H1 14 H2 14 H1 15 H2 15 H1 16 H2 16
2.6 3.
0
5.2
4.8
6.6
1.1
1.0
4.1
4.2
0.6
Leases totalling 771,900 sq ft or c.15% of our portfolio were subject to breaks or expiries in 2017, which was 30% more than in 2016. Rent review activity was lower, but the average 42% increase in passing rents matched last year and was 11% over ERV. We saw particularly strong growth at 88 Rosebery Avenue EC1 and 4 & 10 Pentonville Road N1, two buildings in the Tech Belt.
Lease renewals were dominated by two large transactions where we extended leases on a short-term basis. The first was at 19-35 Baker Street where we received a resolution to grant planning consent for redevelopment and therefore needed to retain flexibility and the latter was
1 Stephen Street W1. The Group also had considerable success re-gearing leases to important tenants at Angel Building (Expedia) and Tea Building (Mother). In total these last four transactions covered 416,000 sq ft, and show our different approaches to lease events depending on our plan for each building. We retained or re-let 92% of the income from properties where leases either expired or were due to expire during the year.
In 2017 our average lease length weighted by contractual passing rent moved from 6.5 years to 6.0 years or 7.0 years allowing for rent-free ‘top-ups’. These numbers were impacted by the disposal of 8 Fitzroy Street
W1. Including the recently agreed pre-lets, where the lease lengths are considerably longer, the weighted average lease length rises to 7.8 years, the same as last year.
A summary of our asset management activity in the year can be found in the table below.
The continuing demand for our product means that our EPRA vacancy rate fell to 1.3% at the year end. This was down from 2.6% over the year despite two significant development completions.
Refer to the case studies on pages 52 and 54 for more on our asset management activities during the year.
12
14
74
27
10
63
11
44
45
11
26
63
0
20
40
60
80
100
2013 2014 2015 2016
835
57
2017
Retaining occupiers – Lease expiry and break analysis
Percentage of income
Retained Re-let Vacant
Below: Tea Building E1
5150
Derwent London plc Report & Accounts 2017 Derwent London plc Report & Accounts 2017

Asset managementcontinued
Case study: 80 Charlotte Street W1 – de-risking development80 Charlotte Street in the heart of Fitzrovia is Derwent London’s largest scheme to date. The area, known as a centre for the media, advertising and design businesses, has improved rapidly over the past decade due to its close proximity to Crossrail and the core West End. The development, for which we obtained planning permission in 2011, is on an island site and will comprise 332,000 sq ft of offices, 3,000 sq ft of retail and 45,000 sq ft of residential (55 units). This is an increase in floorspace of 62% from the tired 1960s building that previously stood on the site.
When we committed to the scheme at the beginning of 2016 we faced the challenges of delivery and finding an occupier, but with the intention of mitigating these risks as the project proceeded. To ensure this happens, the Group encourages collaboration from its many specialist teams and consultants from the start even though each team has separate responsibilities in the development process.
Lowering construction risk: Derwent London has an experienced team of in-house project managers, cost monitors and development managers responsible for the project’s overall design and construction with Multiplex acting as main contractor. At the outset we believed that a fixed price contract would not be the most cost-effective option. During 2017 the outstanding cost was almost entirely fixed, a process made easier through our relationship with the main contractor as well as engaging directly with the subcontractor supply chain. The main construction risk now resides with delivery with the building due for completion at the end of 2019.
Lowering letting risk: The building boasts good flexibility in terms of offering large, flexible floorplates as well as good multi-let capability, providing varied options in respect of communal and dedicated entrances. On-site amenity has been a common theme throughout our recent developments: 80 Charlotte Street’s offer is significant, with generous terraces (both private and a large communal facility), an in-house café, as well as two restaurant opportunities on the two eastern corners of the site. Our leasing and marketing team has been involved from the beginning helping define the product’s identity.
The attractions of the building and its location were demonstrated in 2017 with the early pre-let of 86% of the office space (with a further 13% under option) to Arup and The Boston Consulting Group (BCG). The transaction with Arup cemented an existing longstanding relationship, whilst that with BCG brings a new and significant tenant to the portfolio. The main letting risk now lies with the leasing or disposal of the residential elements of the scheme.
As a result of our team’s actions, we made meaningful progress in reducing some of the major development risks associated with the property during 2017.
Right: CGI of 80 Charlotte Street W1
“ We are deeply excited to agree space for our future home at 80 Charlotte Street. Derwent and their design team have masterminded a truly spectacular scheme in this quiet and rapidly improving corner of Fitzrovia, close to the buzz of central London. This will be the perfect setting for our people to connect, develop and drive impact through our work.”
Andy Veitch Partner and Managing Director of The Boston Consulting Group
52
Derwent London plc Report & Accounts 2017 Derwent London plc Report & Accounts 2017
53
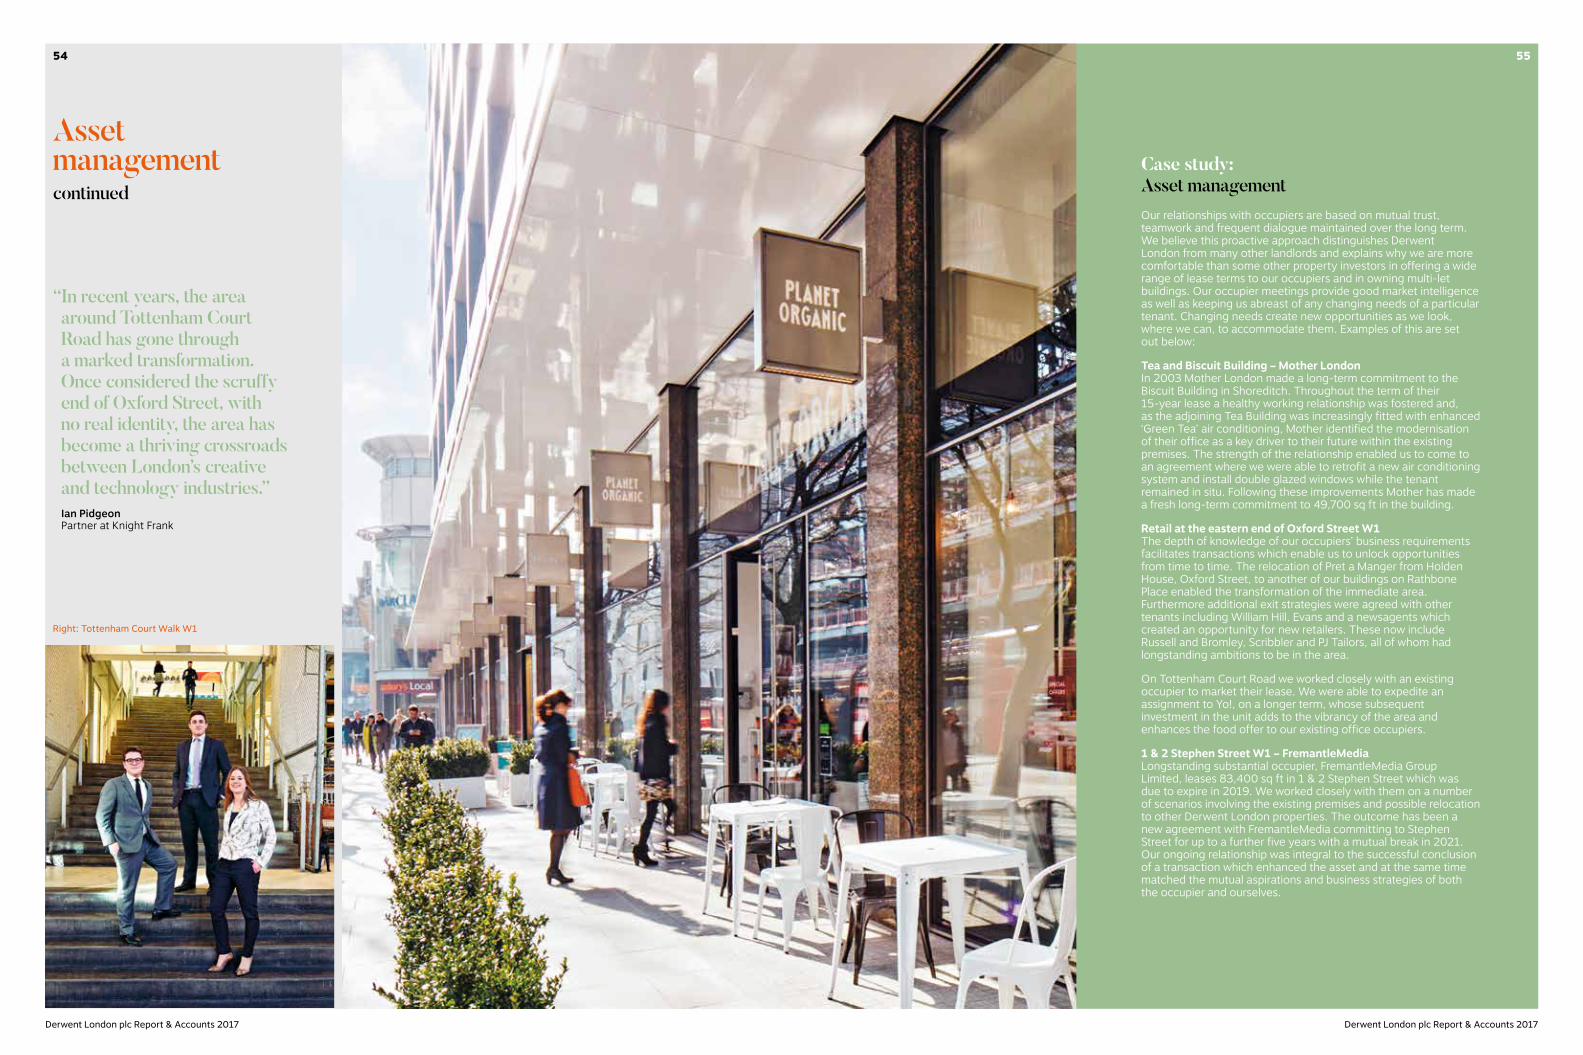
Asset managementcontinued
Case study: Asset managementOur relationships with occupiers are based on mutual trust, teamwork and frequent dialogue maintained over the long term. We believe this proactive approach distinguishes Derwent London from many other landlords and explains why we are more comfortable than some other property investors in offering a wide range of lease terms to our occupiers and in owning multi-let buildings. Our occupier meetings provide good market intelligence as well as keeping us abreast of any changing needs of a particular tenant. Changing needs create new opportunities as we look, where we can, to accommodate them. Examples of this are set out below:
Tea and Biscuit Building – Mother LondonIn 2003 Mother London made a long-term commitment to the Biscuit Building in Shoreditch. Throughout the term of their 15-year lease a healthy working relationship was fostered and, as the adjoining Tea Building was increasingly fitted with enhanced ‘Green Tea’ air conditioning, Mother identified the modernisation of their office as a key driver to their future within the existing premises. The strength of the relationship enabled us to come to an agreement where we were able to retrofit a new air conditioning system and install double glazed windows while the tenant remained in situ. Following these improvements Mother has made a fresh long-term commitment to 49,700 sq ft in the building.
Retail at the eastern end of Oxford Street W1The depth of knowledge of our occupiers’ business requirements facilitates transactions which enable us to unlock opportunities from time to time. The relocation of Pret a Manger from Holden House, Oxford Street, to another of our buildings on Rathbone Place enabled the transformation of the immediate area. Furthermore additional exit strategies were agreed with other tenants including William Hill, Evans and a newsagents which created an opportunity for new retailers. These now include Russell and Bromley, Scribbler and PJ Tailors, all of whom had longstanding ambitions to be in the area.
On Tottenham Court Road we worked closely with an existing occupier to market their lease. We were able to expedite an assignment to Yo!, on a longer term, whose subsequent investment in the unit adds to the vibrancy of the area and enhances the food offer to our existing office occupiers.
1 & 2 Stephen Street W1 – FremantleMediaLongstanding substantial occupier, FremantleMedia Group Limited, leases 83,400 sq ft in 1 & 2 Stephen Street which was due to expire in 2019. We worked closely with them on a number of scenarios involving the existing premises and possible relocation to other Derwent London properties. The outcome has been a new agreement with FremantleMedia committing to Stephen Street for up to a further five years with a mutual break in 2021. Our ongoing relationship was integral to the successful conclusion of a transaction which enhanced the asset and at the same time matched the mutual aspirations and business strategies of both the occupier and ourselves.
Right: Tottenham Court Walk W1
“ In recent years, the area around Tottenham Court Road has gone through a marked transformation. Once considered the scruffy end of Oxford Street, with no real identity, the area has become a thriving crossroads between London’s creative and technology industries.”
Ian Pidgeon Partner at Knight Frank
54
Derwent London plc Report & Accounts 2017 Derwent London plc Report & Accounts 2017
55
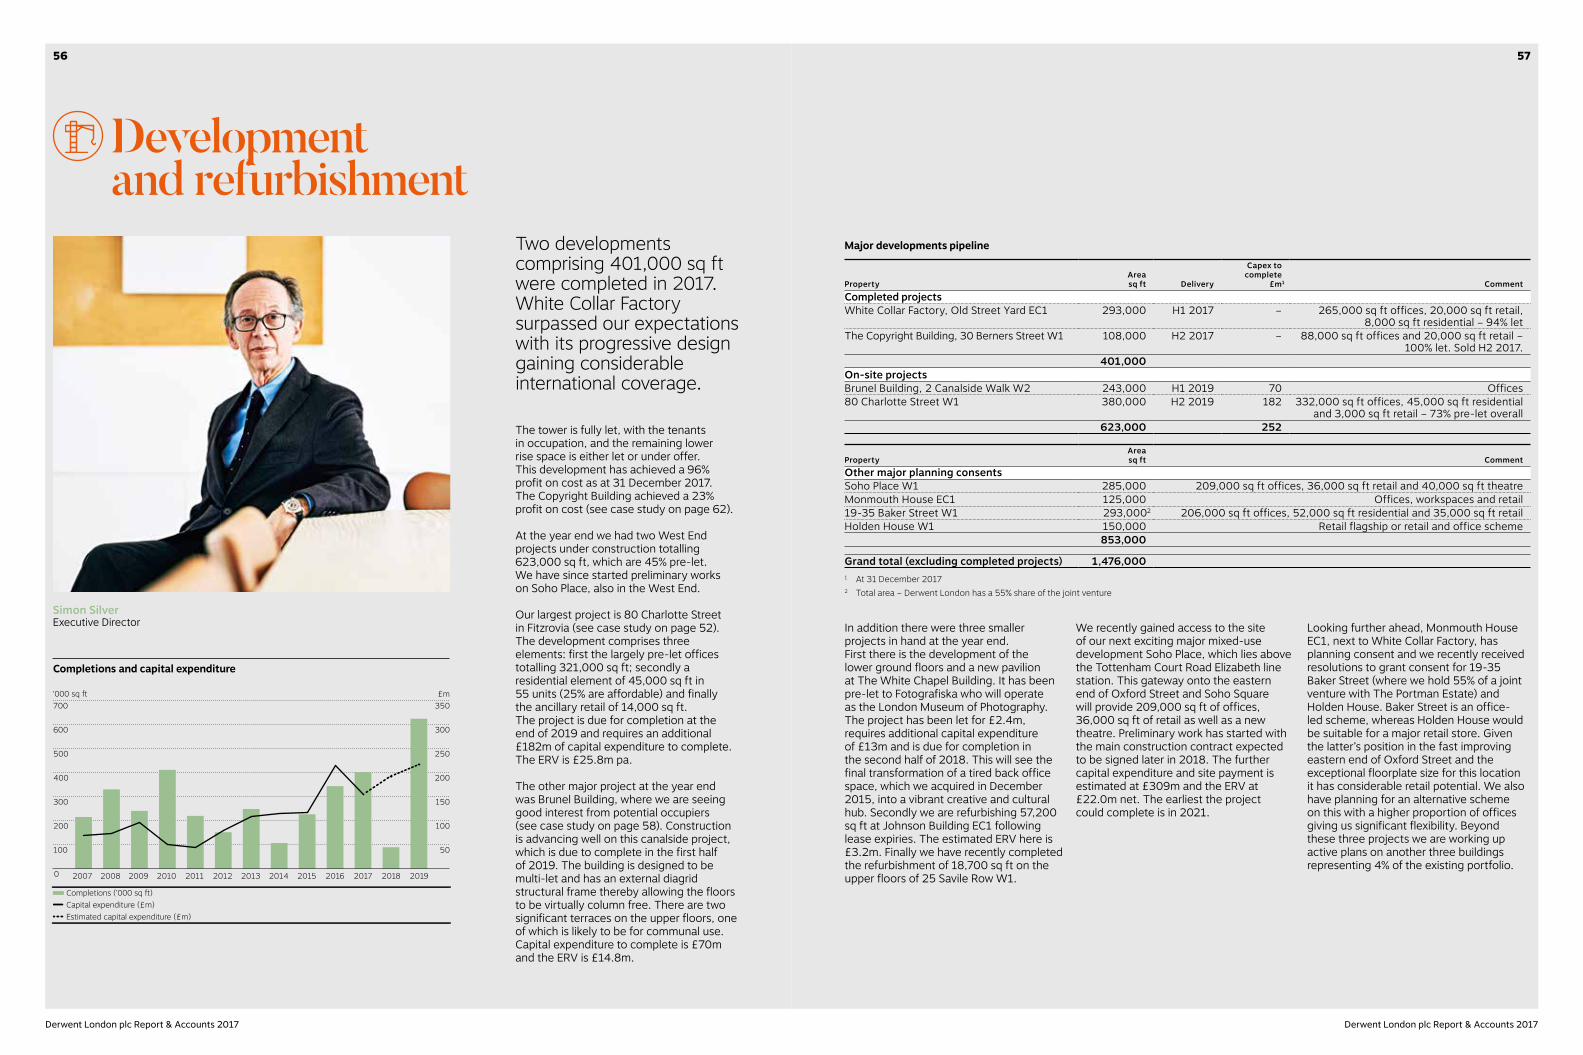
Development and refurbishment
Simon Silver Executive Director
Two developments comprising 401,000 sq ft were completed in 2017. White Collar Factory surpassed our expectations with its progressive design gaining considerable international coverage.
The tower is fully let, with the tenants in occupation, and the remaining lower rise space is either let or under offer. This development has achieved a 96% profit on cost as at 31 December 2017. The Copyright Building achieved a 23% profit on cost (see case study on page 62).
At the year end we had two West End projects under construction totalling 623,000 sq ft, which are 45% pre-let. We have since started preliminary works on Soho Place, also in the West End.
Our largest project is 80 Charlotte Street in Fitzrovia (see case study on page 52). The development comprises three elements: first the largely pre-let offices totalling 321,000 sq ft; secondly a residential element of 45,000 sq ft in 55 units (25% are affordable) and finally the ancillary retail of 14,000 sq ft. The project is due for completion at the end of 2019 and requires an additional £182m of capital expenditure to complete. The ERV is £25.8m pa.
The other major project at the year end was Brunel Building, where we are seeing good interest from potential occupiers (see case study on page 58). Construction is advancing well on this canalside project, which is due to complete in the first half of 2019. The building is designed to be multi-let and has an external diagrid structural frame thereby allowing the floors to be virtually column free. There are two significant terraces on the upper floors, one of which is likely to be for communal use. Capital expenditure to complete is £70m and the ERV is £14.8m.
In addition there were three smaller projects in hand at the year end. First there is the development of the lower ground floors and a new pavilion at The White Chapel Building. It has been pre-let to Fotografiska who will operate as the London Museum of Photography. The project has been let for £2.4m, requires additional capital expenditure of £13m and is due for completion in the second half of 2018. This will see the final transformation of a tired back office space, which we acquired in December 2015, into a vibrant creative and cultural hub. Secondly we are refurbishing 57,200 sq ft at Johnson Building EC1 following lease expiries. The estimated ERV here is £3.2m. Finally we have recently completed the refurbishment of 18,700 sq ft on the upper floors of 25 Savile Row W1.
We recently gained access to the site of our next exciting major mixed-use development Soho Place, which lies above the Tottenham Court Road Elizabeth line station. This gateway onto the eastern end of Oxford Street and Soho Square will provide 209,000 sq ft of offices, 36,000 sq ft of retail as well as a new theatre. Preliminary work has started with the main construction contract expected to be signed later in 2018. The further capital expenditure and site payment is estimated at £309m and the ERV at £22.0m net. The earliest the project could complete is in 2021.
Looking further ahead, Monmouth House EC1, next to White Collar Factory, has planning consent and we recently received resolutions to grant consent for 19-35 Baker Street (where we hold 55% of a joint venture with The Portman Estate) and Holden House. Baker Street is an office-led scheme, whereas Holden House would be suitable for a major retail store. Given the latter’s position in the fast improving eastern end of Oxford Street and the exceptional floorplate size for this location it has considerable retail potential. We also have planning for an alternative scheme on this with a higher proportion of offices giving us significant flexibility. Beyond these three projects we are working up active plans on another three buildings representing 4% of the existing portfolio.
Completions and capital expenditure
0
700
500
300
100
600
400
200
2007 2009 2011 2013 2015 2017 20192008 2010 2012 2014 2016 2018
‘000 sq ft350
250
150
50
300
200
100
£m
Completions (‘000 sq ft)Capital expenditure (£m)Estimated capital expenditure (£m)
Major developments pipeline
PropertyAreasq ft Delivery
Capex tocomplete
£m1 CommentCompleted projectsWhite Collar Factory, Old Street Yard EC1 293,000 H1 2017 – 265,000 sq ft offices, 20,000 sq ft retail,
8,000 sq ft residential – 94% let The Copyright Building, 30 Berners Street W1 108,000 H2 2017 – 88,000 sq ft offices and 20,000 sq ft retail –
100% let. Sold H2 2017.401,000
On-site projectsBrunel Building, 2 Canalside Walk W2 243,000 H1 2019 70 Offices80 Charlotte Street W1 380,000 H2 2019 182 332,000 sq ft offices, 45,000 sq ft residential
and 3,000 sq ft retail – 73% pre-let overall623,000 252
PropertyAreasq ft Comment
Other major planning consentsSoho Place W1 285,000 209,000 sq ft offices, 36,000 sq ft retail and 40,000 sq ft theatreMonmouth House EC1 125,000 Offices, workspaces and retail19-35 Baker Street W1 293,0002 206,000 sq ft offices, 52,000 sq ft residential and 35,000 sq ft retailHolden House W1 150,000 Retail flagship or retail and office scheme
853,000
Grand total (excluding completed projects) 1,476,0001 At 31 December 20172 Total area – Derwent London has a 55% share of the joint venture
5756
Derwent London plc Report & Accounts 2017 Derwent London plc Report & Accounts 2017

Development and refurbishmentcontinued
“ Paddington is, finally, going places. The opening of Crossrail could smooth the last of this area’s rough edges.”
The Times
Case study: Brunel Building, Paddington, W2Derwent London acquired a 95-year leasehold interest in an old warehouse block on Paddington Basin for c.£325 per sq ft in 2001. We retained income from the building prior to redevelopment while we worked on a new design with architects Fletcher Priest, and looked to extend our ownership. Planning was received for a mixed-use development in 2008, and in 2013 we secured an option to regear the leasehold interest thereby unlocking the site for a landmark 243,000 sq ft office building on a 999-year lease. The construction contract price is fixed and the project is on target to complete in H1 2019 with £70m of capital expenditure outstanding.
The main contractor is Laing O’Rourke and the team has performed well, overcoming a number of site-specific challenges such as building adjacent to the Victorian canal and close to the Bakerloo line. The building’s cores are now complete and the external steel diagrid in grey and signature orange is progressing rapidly.
Brunel Building is an eye-catching new addition in Paddington; its striking design, waterfront location and generous floor-to-ceiling heights mean we are expecting to achieve prime rents for the area, especially for the upper floors which benefit from two terraces and impressive views across central London.
Paddington has witnessed a change in tenant types in recent years and the area has been undergoing a transformation in its public amenities. Brunel Building will play its part in opening up the canalside to the public for the first time for at least 45 years. Although Paddington is already well-connected, the arrival of the Elizabeth line later this year will make central London even more accessible with journey times to Tottenham Court Road of just four minutes. All this activity, together with its relative value, means that Paddington has become attractive to a much broader mix of businesses.
Brunel Building will be the next Grade A development to be released in the area. There has been good interest in the building from a number of occupiers with a range of space requirements, which supports our aim of achieving a number of lettings prior to completion. In December 2017 the average ERV on the office space was £62.50 per sq ft.
Right: Brunel Building W2
5958
Derwent London plc Report & Accounts 2017 Derwent London plc Report & Accounts 2017

Investment activity
Development and refurbishmentcontinued
David Silverman Executive Director
We sold three major properties in 2017 for £475m net of costs and rental ‘top-ups’, demonstrating the ongoing depth of demand during 2017.
We have previously reported on all three transactions, and the details are shown in the table below. None of the disposals offered significant opportunities for us to add short-term value. The sale of 132-142 Hampstead Road NW1 was part of the HS2 site assembly, 8 Fitzroy Street was sold to the occupier, Arup, as part of the 80 Charlotte Street pre-let and The Copyright Building was sold to a German fund (see case study on page 62). The level of disposals was above our medium term business targets and has left us in a strong position to recycle the proceeds principally into our development activity, where we currently expect development yields of 6.0% on cost.
We are continually on the hunt for acquisitions but the scarcity of opportunities that match our criteria has meant that our activity has been limited in 2017 to a small acquisition in Victoria SW1 adding to our cluster in that location. Since the year end we have exchanged contracts to sell Porters North N1 (held in a 50% joint venture) for £45.4m net of ‘top-ups’, which is 5% above December 2017 book value.
Capital expenditureAcquisitions
Disposals
0
(400)
200
400
Net investment
2013 2014 2015 2016 2017
(200)
£m
Major disposals in 2017
Property DateAreasq ft
Netproceeds
£m
Netproceeds
£ psf
Net yield topurchaser
%Rent
£m pa132-142 Hampstead Road NW1 Q1 219,700 129.4 590 1.2 1.78 Fitzroy Street W1 Q2 147,900 196.9 1,330 3.4 7.2The Copyright Building W1 Q4 108,000 148.2 1,370 4.2 7.4
Project summary – current
Property
Current net income
£m pa
Pre-scheme area
‘000 sq ft
Proposedarea
‘000 sq ft
2018capex
£m
2019capex
£m
2020+capex
£m
Total capexto complete
£mDelivery
date
Current office c.ERV
psfOn-site developmentsBrunel Building W2 (0.1) 78 243 56 13 1 70 H1 2019 £62.5080 Charlotte Street W1 – 234 380 72 101 9 182 H2 2019 £80.00
(0.1) 312 623 128 114 10 252On-site refurbishmentsThe White Chapel Building E11 – 81 89 12 1 – 13 H2 2018
(0.1) 393 712 140 115 10 265Other projectsSoho Place W1 – – 285 18 75 216 3092
Planning and design – – – 5 3 1 9Other – – – 17 8 11 36
– – 285 40 86 228 354
Total (0.1) 393 997 180 201 238 619Capitalised interest – – – 12 15 12 39Total including interest (0.1) 393 997 192 216 250 658 1 Phase 22 Includes site acquisition cost
Project summary – future
Property
Current net income
£m pa
Pre-scheme area
‘000 sq ft
Proposedarea
‘000 sq ft
Earliestpossession
year CommentConsentedMonmouth House EC11 0.3 69 125 2019 Adjacent to White Collar Factory19-35 Baker Street W12 5.8 146 293 2020 Joint ventureHolden House W1 6.5 90 150 TBC Eastern end of Oxford Street
12.6 305 568
Adjustment for joint venture (2.6) (66) (132)19–35 Baker Street W1
Derwent 55% interest10.0 239 436
Under appraisal3
Premier House SW1 2.2 62 80 2018Network Building W1 3.1 64 100 2021Francis House SW14 3.1 90 130 TBC
8.4 216 310
Consented and appraisals 18.4 455 746On-site projects (0.1) 393 997 Previous tablePipeline 18.3 848 1,743 1 Includes 19–23 Featherstone Street EC12 Includes 88–100 George Street, 30 Gloucester Place and 69–85 Blandford Street W13 Areas proposed are estimated from initial studies 4 Includes 6–8 Greencoat Place SW1
6160
Derwent London plc Report & Accounts 2017 Derwent London plc Report & Accounts 2017

Investment activitycontinued
“ Fitzrovia is currently one of the most dynamic areas of London’s West End.”
Martin Schellein Head of Investment Management Europe at Union Investment
Case study: The Copyright Building W1 – driving returns from acquisition through to saleThe story of The Copyright Building, Berners Street is one of five years’ work focusing on value creation. Our activities ranged from sourcing an interesting opportunity off-market, through a head lease restructure, to obtaining a planning consent for an appealing new high quality office and retail building and securing a major pre-let of the offices. This enabled a forward sale ahead of completion thereby crystallising attractive returns.
25-27 and 29-33 Berners Street were acquired from The Performing Rights Society (PRS) in 2012 for £36.5m. Comprising two post-war office buildings totalling 79,500 sq ft, we acquired 68 year leasehold interests, either side of a smaller building owned by our freeholder, the Berners Allsopp Estate.
The vendor took a short leaseback of the buildings, providing us with income during the planning process. In conjunction with our freeholder and, after considering refurbishment, we won a valuable planning consent to redevelop all three buildings, having regeared the headlease into a new 127-year leasehold interest.
The completed 108,000 sq ft office and retail building was designed by award-winning architects, Piercy & Company and construction began in early 2015 after rebranding it as The Copyright Building.
In early 2016 we secured a major pre-let on the entire office element to Capita plc, on a 20-year lease without breaks, for their new London headquarters at a rent of £90 per sq ft on the best space.
As the development was nearing completion, and in our view seeing limited further opportunities to add value, we agreed a forward sale of our leasehold interest in the building to Union Investment for £148.2m net, reflecting a net initial yield of 4.2%, and a capital value of £1,370 per sq ft. Our profit on cost was 23%.
Right: The Copyright Building W1
62
Derwent London plc Report & Accounts 2017 Derwent London plc Report & Accounts 2017
63

Finance reviewOur financial results for the year ended 31 December 2017 showed a return to meaningful net asset value growth and another strong rise in underlying earnings.
Financial overviewThe continued de-risking of our pipeline of value adding projects, high levels of portfolio occupancy and gearing levels which have fallen again after the receipt of £472.9m from property disposals, have combined to put us in a very strong financial position. However, with continuing political and economic uncertainty making the outlook for the UK and London harder than usual to anticipate, we believed that 2017 was the right time to de-risk the business particularly as there were attractive opportunities to do so. At the same time, demand from occupiers and investors alike has buoyed London’s commercial property values and we found no significant new properties to acquire during the year. At present, we see more attractive returns from investing in our pipeline. We are also recommending a 10.1% increase in the final dividend and, following last June’s 52p special dividend, are proposing to pay out a further ‘special’ in June 2018 of 75p per share.
Presentation of financial resultsThe financial statements have been prepared in accordance with International Financial Reporting Standards (IFRS). In common with usual and best practice in our sector, alternative performance measures have also been provided to supplement IFRS based on the recommendations of the European Public Real Estate Association (EPRA). EPRA Best Practice Recommendations (BPR) have been adopted widely throughout this report and are used within the business when considering our operational performance as well as matters such as dividend policy and elements of our Directors’ remuneration. Full reconciliations between IFRS and EPRA figures are provided in note 38 and all the EPRA definitions are included on page 207.
Net asset valueThough underlying values for the main part of our portfolio were fairly flat in 2017, recent development projects such as White Collar Factory provided strong valuation uplifts and, as a result, the Group’s net asset value grew by almost 5% during the year. Adding back the 108p per share of dividends paid in 2017, including last year’s 52p special dividend, the total return for the year calculated on an EPRA basis was 7.7%. This compares with the 1.7% total return in 2016 when the result of the EU referendum was still reverberating.
The Group’s IFRS net asset value was £4.2bn at 31 December 2017 against just under £4.0bn in 2016 and EPRA NAV per share on a diluted basis increased to 3,716p per share, up 4.6% from 3,551p a year earlier. The main movements in EPRA NAV per share during the year are summarised below compared with 2016:
Damian Wisniewski Finance Director
Summary
2017 2016IFRS NAV £4,193.2m £3,999.4mEPRA NAV per share 3,716p 3,551pProperty portfolio at fair value £4,850.3m £4,942.7mNet rental income £161.1m £145.9mProfit before tax £314.8m £54.5mEPRA earnings per share (EPS) 94.23p 76.99pInterim and final dividend per share 59.73p 52.36pLTV ratio 13.2% 17.7%NAV gearing 15.7% 22.6%Net interest cover ratio 454% 370%
2017p
2016p
Revaluation movement 138 (38)Profit on disposals 45 7EPRA earnings 94 77Interim and final dividend (56) (44)Special dividend (52) –Interest rate swap termination costs (7) (8)Dilutive effect of convertible bonds – 17Non-controlling interest – 7Other 3 (2)
165 16
The uplift in our property valuation through 2017 together with the strong profit booked on property disposals added a combined 183p per share to our net asset value; this compares with a deficit of 31p per share for the same items in 2016. Of the 138p per share revaluation uplift,
77p per share came from The White Chapel Building, White Collar Factory and 80 Charlotte Street alone while another 22p was gained at Angel Building partly due to the Expedia re-gear. In total, the revaluation gain for the year was £150.7m of which £1.0m was a partial reversal of the 2016 write-down in respect of properties held as trading stock and £1.8m came from our new offices at 25 Savile Row; the balance of £147.9m related to the investment property portfolio.
Including £14.8m of letting and legal fees being amortised over their respective lease terms, accrued income from the ‘straight-lining’ of rental income under IAS 17 and SIC-15 was £120.6m at 31 December 2017 (2016: £116.9m). Although the balance increased during the year as we recognised income in advance of cash receipts and incurred letting and legal fees, it also fell by £19.2m due to the property disposals.
Property portfolio value, net assets and gearing
Property portfolio at fair value (£m) LTV ratio (%)
Net assets attributable to equity shareholders (£m)
5,000
4,000
3,000
2,000
1,000
50
40
30
20
10
00
£m %
2,30
4
4,16
8
3,01
2
4,95
5
3,92
3
4,85
0
4,12
8
4,94
3
3,93
2
Dec 2013 Dec 2014 Dec 2015 Dec 2017Dec 2016
3,35
3
6564
Derwent London plc Report & Accounts 2017 Derwent London plc Report & Accounts 2017
Finance reviewcontinued
190
160
175
130
145
115
Prio
r yea
r
Dis
posa
ls
Curr
ent y
ear
lett
ings
Curr
ent y
ear
revi
ews
Prio
r yea
r let
tings
and
revi
ews
Sche
me
void
s
Brea
ks, e
xpiri
esan
d vo
ids
Oth
er
Curr
ent y
ear
156.0
172.2
(11.1)11.3
(1.7)
(0.5)(3.6)
Gross property income
£m
3.318.5
110
100
90
80
70
Prio
r yea
r
Gro
ss p
rope
rty in
com
e
Oth
er in
com
e le
ss o
ther
cos
ts
Prop
erty
expe
nditu
re
Adm
inist
rativ
eex
pens
es
Net
fina
nce
cost
s
Oth
er
Curre
nt y
ear
EPRA earnings
85.7
105.0
16.2 (1.6)2.7 0.7
1.0
0.3
£m
The net carrying value of joint venture investments at 31 December was £39.7m (2016: £36.0m) and the fair value of our 50% share of the two properties held was £47.3m (2016: £37.8m). One of these, Porters North, is due to be sold for £45.4m net of rental ‘top-ups’ in March 2018, at which point our only external joint venture debt will be repaid.
Income statementWe have maintained our focus on raising underlying earnings from our portfolio in 2017. Some of this came from new lettings at the recently completed properties such as White Collar Factory and The White Chapel Building but we have also grown income from the like-for-like portfolio and our costs have reduced too.
Gross rental income increased to £172.1m from £155.4m in 2016 and net rental income was up to £161.1m from £145.9m a year before. These reflect annual increases of 10.7% and 10.4%, respectively, in spite of £482.8m of net property disposals during the year. After taking account of fee income from joint venture projects and the £1.0m partial reversal of a trading property provision booked in 2016, net property and other income increased to £164.8m from £149.2m in 2016. Lettings in 2016 and 2017 added £33.1m of rental income over the year. Breaks, expiries and scheme voids reduced rental income by £5.3m and the disposals removed £11.1m. Irrecoverable property costs increased slightly to £10.3m but remain low at under 6% of rental income due partly to our low vacancy rates.
The overall year end make-up of our portfolio valuation was as follows:
Fair value of property portfolio
Dec 2017 £m
Dec 2016£m
Investment property 4,670.7 4,803.8Owner-occupied property 46.5 34.2Trading property 25.3 11.7Carrying value 4,742.5 4,849.7Accrued income 120.6 116.9Grossing up of headlease liabilities (14.1) (23.9)Revaluation of trading property 1.31 –Fair value of property portfolio 4,850.3 4,942.71 Not included in the IFRS accounts
We saw an 8.7% fall in administration expenses during the year to £28.2m against the background of an increased headcount and our move into newly fitted offices. The reduction was mainly due to substantial falls in amounts booked for variable remuneration. As in previous years, no overheads or property costs were capitalised.
With these lower administration costs, our EPRA cost ratios fell to 20.8% (2016: 24.0%) of gross rental income including direct vacancy costs and to 19.3% (2016: 22.4%) excluding those costs.
Cost ratios
2017%
2016%
EPRA cost ratio, incl. direct vacancy costs 20.8 24.0EPRA cost ratio, excl. direct vacancy costs 19.3 22.4Portfolio cost ratio, incl. direct vacancy costs 0.7 0.8
Investment property disposals during the year amounted to £482.8m after netting off cash ‘top-ups’ for rent-free periods.
This is our largest ever level of annual disposals and gave rise to an IFRS profit in 2017 of £50.3m or 45p per share. £24.9m of this came from the sale of The Copyright Building which was completed in 2017 and where the December 2016 valuation had therefore still factored in significant completion risks and profit to come. It also took account of the sale of 132-142 Hampstead Road NW1 as part of the HS2 site assembly around Euston station and 8 Fitzroy Street to Arup, both of which were announced with our 2016 results.
Total finance costs fell to £27.1m from £27.8m in 2016 despite a £3.6m lower level of interest capitalised; £9.4m was capitalised in 2017 against £13.0m in the previous year. Accordingly, the underlying interest charge has fallen by around 11% compared to 2016.
The mark-to-market cost of our remaining interest rate swaps fell by £9.4m in 2017 partially offset by £7.3m of breakage costs. With lower levels of debt, we decided to break or defer £245m of interest rate swaps in late 2017. Full details are provided under ‘net debt’ overleaf.
Our share of the revaluation surplus in our two small joint ventures was £3.9m in 2017 and they also contributed £1.1m of profits after tax. However, as noted above, the main portfolio revaluation showed a much stronger result than in 2016 with a net uplift after accounting adjustments of £147.9m against a deficit of £37.1m in 2016. The overall IFRS profit for the year was therefore £313.0m compared with £53.6m in 2016. EPRA earnings for 2017, which remove fair value movements and the profits arising on property disposals to arrive at an underlying measure of performance, increased by 23% during the year to £105.0m from £85.7m in 2016; this reflects a 79% rise over the past three years.
A table providing a reconciliation of the IFRS results to EPRA earnings per share is included in note 38.
After adjustments to remove developments, acquisitions and disposals, EPRA like-for-like gross rental income increased by 5.1% during the year with net property income on a similar basis up by 5.2%. A full analysis is shown in the table below.
2016 78.7 4.0 (0.6) 0.1 (0.9) 7.0 (2.6) 85.7 2016 152.0 6.1 5.7 9.3 (5.1) (3.9) (5.3) (2.8) 156.0
EPRA like-for-like rental income
Properties owned
throughout the year
£mAcquisitions
£mDisposals
£m
Development property
£mTotal
£m2017Gross rental income 143.6 – 4.8 23.7 172.1Property expenditure (6.0) – (0.6) (4.4) (11.0)Net rental income 137.6 – 4.2 19.3 161.1Reversal of write-down of trading property – (0.6) – 1.6 1.0Other1 2.7 – – – 2.7Net property income 140.3 (0.6) 4.2 20.9 164.82016Gross rental income 136.6 – 15.6 3.2 155.4Property expenditure (6.2) (0.1) (0.6) (2.6) (9.5)Net rental income 130.4 (0.1) 15.0 0.6 145.9Profit on disposal of trading properties – – 1.9 – 1.9Write-down of trading property – – – (1.6) (1.6)Other1 3.0 – – – 3.0Net property income 133.4 (0.1) 16.9 (1.0) 149.2
Increase based on gross rental income 5.1% 10.7%Increase based on net rental income 5.5% 10.4%Increase based on net property income 5.2% 10.5%1 Includes surrender premiums paid or received, dilapidation receipts and other income
6766
Derwent London plc Report & Accounts 2017 Derwent London plc Report & Accounts 2017
Finance reviewcontinued
Debt facilities
£m Maturity6.5% secured bonds 175 March 20263.99% secured loan 83 October 20241.125% unsecured convertible bonds 150 July 20194.41% unsecured private placement notes 25 January 20294.68% unsecured private placement notes 75 January 20343.46% unsecured private placement notes 30 May 20283.57% unsecured private placement notes 75 May 2031Non-bank debt 613Term – secured 28 July 2022Bilateral revolving credit – unsecured 75 July 2022Club revolving credit – unsecured 450 January 2022Committed bank facilities 553At 31 December 2017 1,166
TaxationThe corporation tax charge for the year ended 31 December 2017 increased to £3.3m in 2017 from £2.0m in the previous year. Part of this increase was due to the reversal of the 2016 write-down on residential apartments held as trading stock and therefore outside the REIT tax environment.
The movement in deferred tax liabilities for the year was a credit of £0.8m. This was made up of £1.5m (2016: £1.1m credit) passing through the income statement due mainly to the revaluation of non-REIT Group properties plus a charge of £0.7m in relation to the property we occupy at 25 Savile Row.
In addition, £5.7m of further tax was paid to HMRC during the year as, in line with other REITs, we are required to withhold tax from certain shareholders on property income distributions.
Net debt and cash flowThe property disposals during the year raised cash proceeds of £472.9m which helped to reduce net debt to £657.9m at 31 December 2017 from £904.8m a year earlier. The Group’s loan-to-value (LTV) ratio fell correspondingly from 17.7% to 13.2% and NAV gearing declined from 22.6% to 15.7%.
The other main cash flow items were the cash generated from operating activities, which increased by 7% to £83.5m, and cash used as we invest in our portfolio. Capital expenditure on projects paid was £165.0m including £9.4m of capitalised interest, both of which were a little lower than the prior year.
Interest cover has shown another strong increase to 454% for the year ended 31 December 2017 from 370% in 2016, calculated on the net basis set out in note 40.
Debt and financing arrangements In the first half of the year, we extended the maturity of our £75m unsecured revolving facility from Wells Fargo by a further year to July 2022. We also cancelled £100m of the £550m revolving bank facility for which we received a fee rebate of £0.75m. The size of this facility, which expires in January 2022, is now £450m. A £40m interest rate swap was terminated as part of these arrangements at a slightly discounted cost of £3.2m. A new short-term £15m development loan facility was also agreed with Barclays for our Primister joint venture but will be repaid upon the sale of the JV’s sole property, Porters North NW1, in March 2018. A £28m loan facility with HSBC secured on assets that we hold with the Portman Estate was also signed in July 2017. This five-year facility has a term to July 2022 replacing the previous facility which had been due to expire in June 2018.
Debt summary
2017£m
2016£m
Bank loansFloating rate 89.0 44.5Swapped 28.0 243.0
117.0 287.5Non-bank debt
3.99% secured loan 2024 83.0 83.06.5% secured bonds 2026 175.0 175.01.125% unsecured convertible bonds 2019 150.0 150.0Unsecured private placement notes 2028 – 2034 205.0 205.0
613.0 613.0Total 730.0 900.5
Hedging profile (%)Fixed 84 68Swaps 4 27
88 95
Percentage of debt that is unsecured (%) 61 68Percentage of non-bank debt (%) 84 68
Weighted average interest rate – cash basis (%) 3.80 3.65Weighted average interest rate – IFRS basis (%) 4.11 3.90
Weighted average maturity of facilities (years) 6.3 6.9Weighted average maturity of borrowings (years) 7.6 7.7
Undrawn facilities and cash 523 383Uncharged properties 3,864 3,777
Gearing and interest cover ratio
2017%
2016%
LTV ratio 13.2 17.7NAV gearing 15.7 22.6Net interest cover ratio 454 370
Net debt
2017£m
2016£m
Cash (87.0) (17.7)Bank facilities 117.0 287.53.99% secured loan 2024 83.0 83.06.5% secured bonds 2026 175.0 175.0Acquired fair value of secured bonds less amortisation 12.9 14.03.46% unsecured private placement notes 2028 30.0 30.04.41% unsecured private placement notes 2029 25.0 25.03.57% unsecured private placement notes 2031 75.0 75.04.68% unsecured private placement notes 2034 75.0 75.01.125% unsecured convertible bonds 2019 150.0 150.0Equity components and unwinding of discounts on convertible bonds (3.5) (5.6)Leasehold liabilities 14.1 23.9Unamortised issue and arrangement costs (8.6) (10.3)Net debt 657.9 904.8
6968
Derwent London plc Report & Accounts 2017 Derwent London plc Report & Accounts 2017
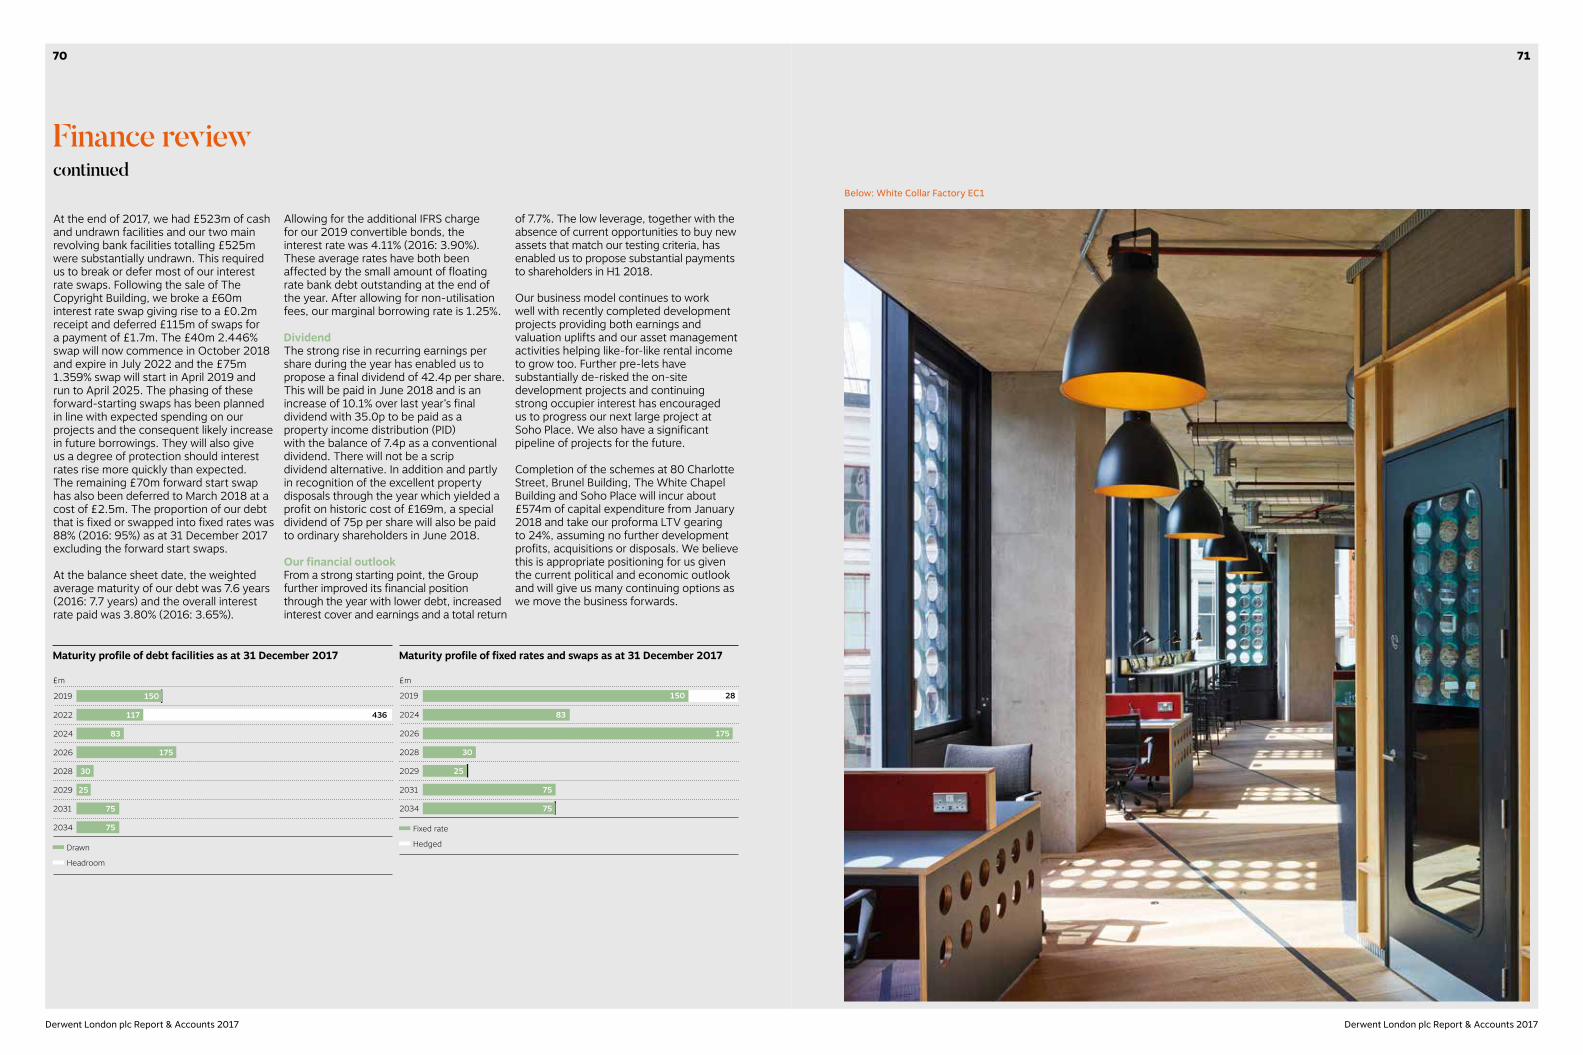
Finance reviewcontinued
At the end of 2017, we had £523m of cash and undrawn facilities and our two main revolving bank facilities totalling £525m were substantially undrawn. This required us to break or defer most of our interest rate swaps. Following the sale of The Copyright Building, we broke a £60m interest rate swap giving rise to a £0.2m receipt and deferred £115m of swaps for a payment of £1.7m. The £40m 2.446% swap will now commence in October 2018 and expire in July 2022 and the £75m 1.359% swap will start in April 2019 and run to April 2025. The phasing of these forward-starting swaps has been planned in line with expected spending on our projects and the consequent likely increase in future borrowings. They will also give us a degree of protection should interest rates rise more quickly than expected. The remaining £70m forward start swap has also been deferred to March 2018 at a cost of £2.5m. The proportion of our debt that is fixed or swapped into fixed rates was 88% (2016: 95%) as at 31 December 2017 excluding the forward start swaps.
At the balance sheet date, the weighted average maturity of our debt was 7.6 years (2016: 7.7 years) and the overall interest rate paid was 3.80% (2016: 3.65%).
Allowing for the additional IFRS charge for our 2019 convertible bonds, the interest rate was 4.11% (2016: 3.90%). These average rates have both been affected by the small amount of floating rate bank debt outstanding at the end of the year. After allowing for non-utilisation fees, our marginal borrowing rate is 1.25%.
DividendThe strong rise in recurring earnings per share during the year has enabled us to propose a final dividend of 42.4p per share. This will be paid in June 2018 and is an increase of 10.1% over last year’s final dividend with 35.0p to be paid as a property income distribution (PID) with the balance of 7.4p as a conventional dividend. There will not be a scrip dividend alternative. In addition and partly in recognition of the excellent property disposals through the year which yielded a profit on historic cost of £169m, a special dividend of 75p per share will also be paid to ordinary shareholders in June 2018.
Our financial outlookFrom a strong starting point, the Group further improved its financial position through the year with lower debt, increased interest cover and earnings and a total return
of 7.7%. The low leverage, together with the absence of current opportunities to buy new assets that match our testing criteria, has enabled us to propose substantial payments to shareholders in H1 2018.
Our business model continues to work well with recently completed development projects providing both earnings and valuation uplifts and our asset management activities helping like-for-like rental income to grow too. Further pre-lets have substantially de-risked the on-site development projects and continuing strong occupier interest has encouraged us to progress our next large project at Soho Place. We also have a significant pipeline of projects for the future.
Completion of the schemes at 80 Charlotte Street, Brunel Building, The White Chapel Building and Soho Place will incur about £574m of capital expenditure from January 2018 and take our proforma LTV gearing to 24%, assuming no further development profits, acquisitions or disposals. We believe this is appropriate positioning for us given the current political and economic outlook and will give us many continuing options as we move the business forwards.
Below: White Collar Factory EC1
2028
2029
2031
2034
2024
2026
2022
2019
Maturity profile of debt facilities as at 31 December 2017
£m
150
117 436
83
175
30
25
75
75
Drawn
Headroom
2028
2029
2031
2034
2024
2026
2019
Maturity profile of fixed rates and swaps as at 31 December 2017
£m
83
175
30
25
75
150 28
75
Fixed rate
Hedged
7170
Derwent London plc Report & Accounts 2017 Derwent London plc Report & Accounts 2017
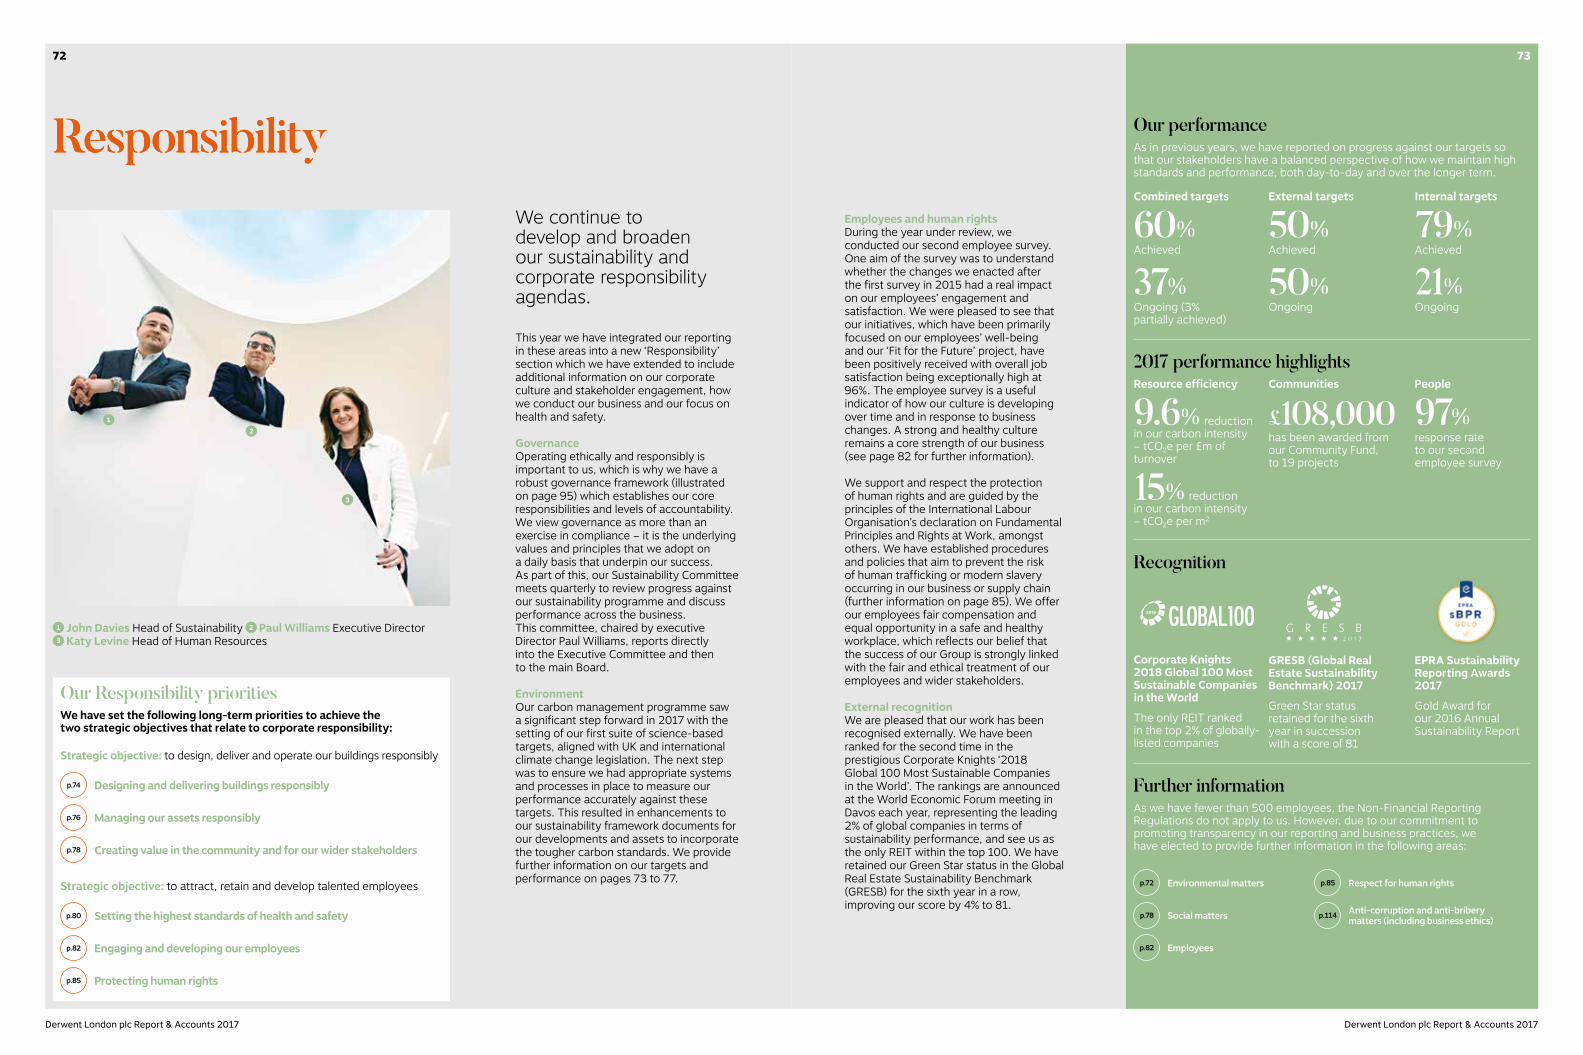
ResponsibilityWe continue to develop and broaden our sustainability and corporate responsibility agendas.
This year we have integrated our reporting in these areas into a new ‘Responsibility’ section which we have extended to include additional information on our corporate culture and stakeholder engagement, how we conduct our business and our focus on health and safety.
GovernanceOperating ethically and responsibly is important to us, which is why we have a robust governance framework (illustrated on page 95) which establishes our core responsibilities and levels of accountability. We view governance as more than an exercise in compliance – it is the underlying values and principles that we adopt on a daily basis that underpin our success. As part of this, our Sustainability Committee meets quarterly to review progress against our sustainability programme and discuss performance across the business. This committee, chaired by executive Director Paul Williams, reports directly into the Executive Committee and then to the main Board.
EnvironmentOur carbon management programme saw a significant step forward in 2017 with the setting of our first suite of science-based targets, aligned with UK and international climate change legislation. The next step was to ensure we had appropriate systems and processes in place to measure our performance accurately against these targets. This resulted in enhancements to our sustainability framework documents for our developments and assets to incorporate the tougher carbon standards. We provide further information on our targets and performance on pages 73 to 77.
1 John Davies Head of Sustainability 2 Paul Williams Executive Director 3 Katy Levine Head of Human Resources
Responsibility
Further informationAs we have fewer than 500 employees, the Non-Financial Reporting Regulations do not apply to us. However, due to our commitment to promoting transparency in our reporting and business practices, we have elected to provide further information in the following areas:
p.72 Environmental matters p.85 Respect for human rights
p.78 Social matters p.114 Anti-corruption and anti-bribery matters (including business ethics)
p.82 Employees
Recognition
2018
Corporate Knights 2018 Global 100 Most Sustainable Companies in the World
The only REIT ranked in the top 2% of globally-listed companies
GRESB (Global Real Estate Sustainability Benchmark) 2017
Green Star status retained for the sixth year in succession with a score of 81
EPRA Sustainability Reporting Awards 2017
Gold Award for our 2016 Annual Sustainability Report
Employees and human rightsDuring the year under review, we conducted our second employee survey. One aim of the survey was to understand whether the changes we enacted after the first survey in 2015 had a real impact on our employees’ engagement and satisfaction. We were pleased to see that our initiatives, which have been primarily focused on our employees’ well-being and our ‘Fit for the Future’ project, have been positively received with overall job satisfaction being exceptionally high at 96%. The employee survey is a useful indicator of how our culture is developing over time and in response to business changes. A strong and healthy culture remains a core strength of our business (see page 82 for further information).
We support and respect the protection of human rights and are guided by the principles of the International Labour Organisation’s declaration on Fundamental Principles and Rights at Work, amongst others. We have established procedures and policies that aim to prevent the risk of human trafficking or modern slavery occurring in our business or supply chain (further information on page 85). We offer our employees fair compensation and equal opportunity in a safe and healthy workplace, which reflects our belief that the success of our Group is strongly linked with the fair and ethical treatment of our employees and wider stakeholders.
External recognitionWe are pleased that our work has been recognised externally. We have been ranked for the second time in the prestigious Corporate Knights ‘2018 Global 100 Most Sustainable Companies in the World’. The rankings are announced at the World Economic Forum meeting in Davos each year, representing the leading 2% of global companies in terms of sustainability performance, and see us as the only REIT within the top 100. We have retained our Green Star status in the Global Real Estate Sustainability Benchmark (GRESB) for the sixth year in a row, improving our score by 4% to 81.
Our Responsibility prioritiesWe have set the following long-term priorities to achieve the two strategic objectives that relate to corporate responsibility:
Strategic objective: to design, deliver and operate our buildings responsibly
p.74 Designing and delivering buildings responsibly
p.76 Managing our assets responsibly
p.78 Creating value in the community and for our wider stakeholders
Strategic objective: to attract, retain and develop talented employees
p.80 Setting the highest standards of health and safety
p.82 Engaging and developing our employees
p.85 Protecting human rights
2017 performance highlightsResource efficiency
9.6% reduction in our carbon intensity – tCO2e per £m of turnover
15% reduction in our carbon intensity – tCO2e per m2
Communities
£108,000has been awarded from our Community Fund, to 19 projects
People
97% response rate to our second employee survey
Our performanceAs in previous years, we have reported on progress against our targets so that our stakeholders have a balanced perspective of how we maintain high standards and performance, both day-to-day and over the longer term.
Combined targets
60%Achieved
37%Ongoing (3% partially achieved)
External targets
50%Achieved
50%Ongoing
Internal targets
79%Achieved
21%Ongoing
12
3
72
Derwent London plc Report & Accounts 2017 Derwent London plc Report & Accounts 2017
73
Responsibilitycontinued
Our objective is to ensure sustainability is considered and implemented at every stage of the design and delivery of our projects.
To help us deliver this objective, we created our Sustainability Framework for Developments (the Development Framework), which established the required standards and performance from all our developments.
The Development Framework requires a Project Sustainability Plan (PS Plan) to be produced and maintained throughout the lifetime of each project. It sets out an action plan for how the key risk areas (shown in the table below) will be addressed and how the project team will achieve the standards and performance required under the Development Framework. The PS Plan is reported to, and subject to scrutiny from, the Sustainability Committee.
Summary of the Project Sustainability Plan
PS Plan sections: Aspect Targets
• Energy Performance Certificate (EPC)
• Environmental assessment methods (BREEAM/LEED)
• Energy and carbon• Water• Waste• Materials• Biodiversity• Community• Transport• Construction impact
Climate change • Minimum of an EPC ‘A’ rating for new build projects• Minimum of an EPC ‘B’ for all major refurbishments
Building assessment methods
• Achieve a minimum of BREEAM ‘Excellent’ for all new build projects• Achieve a minimum of BREEAM ‘Very Good’ for all major refurbishment projects• Achieve a minimum of LEED ‘Silver’ for all major new build projects• Achieve a minimum of Home Quality Mark ‘4 Stars’ on all new residential developments
Energy and carbon
• All new build and major refurbishment projects to undertake a design in-use energy assessment based on CIBSE TM54
Suppliers • Require evidence from our suppliers that they are meeting our Supply Chain Sustainability Standard (see page 85)
Designing and delivering buildings responsibly
Our achievements in 2017• Achieved our first LEED ‘Platinum’
rating at White Collar Factory • Achieved our first SKA ‘Gold’ rating
at 25 Savile Row W1
Our focus areas for 2018• Developing our framework for health
and well-being in developments• Ensure our development pipeline
continues to incorporate our high performance standards
White Collar Factory EC1Formally launched in H1 2017, our White Collar Factory represents many years of research and development, incorporating a series of design principles that enhance its flexibility, utility and sustainability. The outcome of this saw the tower, which is now fully let, achieve ratings of BREEAM ‘Outstanding’, LEED ‘Platinum’, WiredScore ‘Platinum’ and an EPC of ‘A’ making it one of only a few buildings to achieve such broad recognition.
25 Savile Row W1During 2017, we moved into our newly refurbished offices at 25 Savile Row. As part of the design we wanted to ensure, as we do with all our projects, that sustainability was embedded in our fit-out. To measure this we used the Royal Institution of Chartered Surveyors (RICS) SKA environmental assessment method, which focuses solely on fit-out works and assesses projects across a range of sustainability criteria, e.g. energy/carbon, materials, water and occupier well-being. The project achieved the highest rating of ‘Gold’, meaning it is in the top quartile of SKA-assessed projects and the first project of its type to reach this level of performance. 25 Savile Row also received an EPC rating of ‘B’ in line with our targets. For more details of this project, refer to our latest Annual Sustainability Report at: www.derwentlondon.com/sustainability
Above: White Collar Factory EC1Right: 25 Savile Row W1
7574
Derwent London plc Report & Accounts 2017 Derwent London plc Report & Accounts 2017
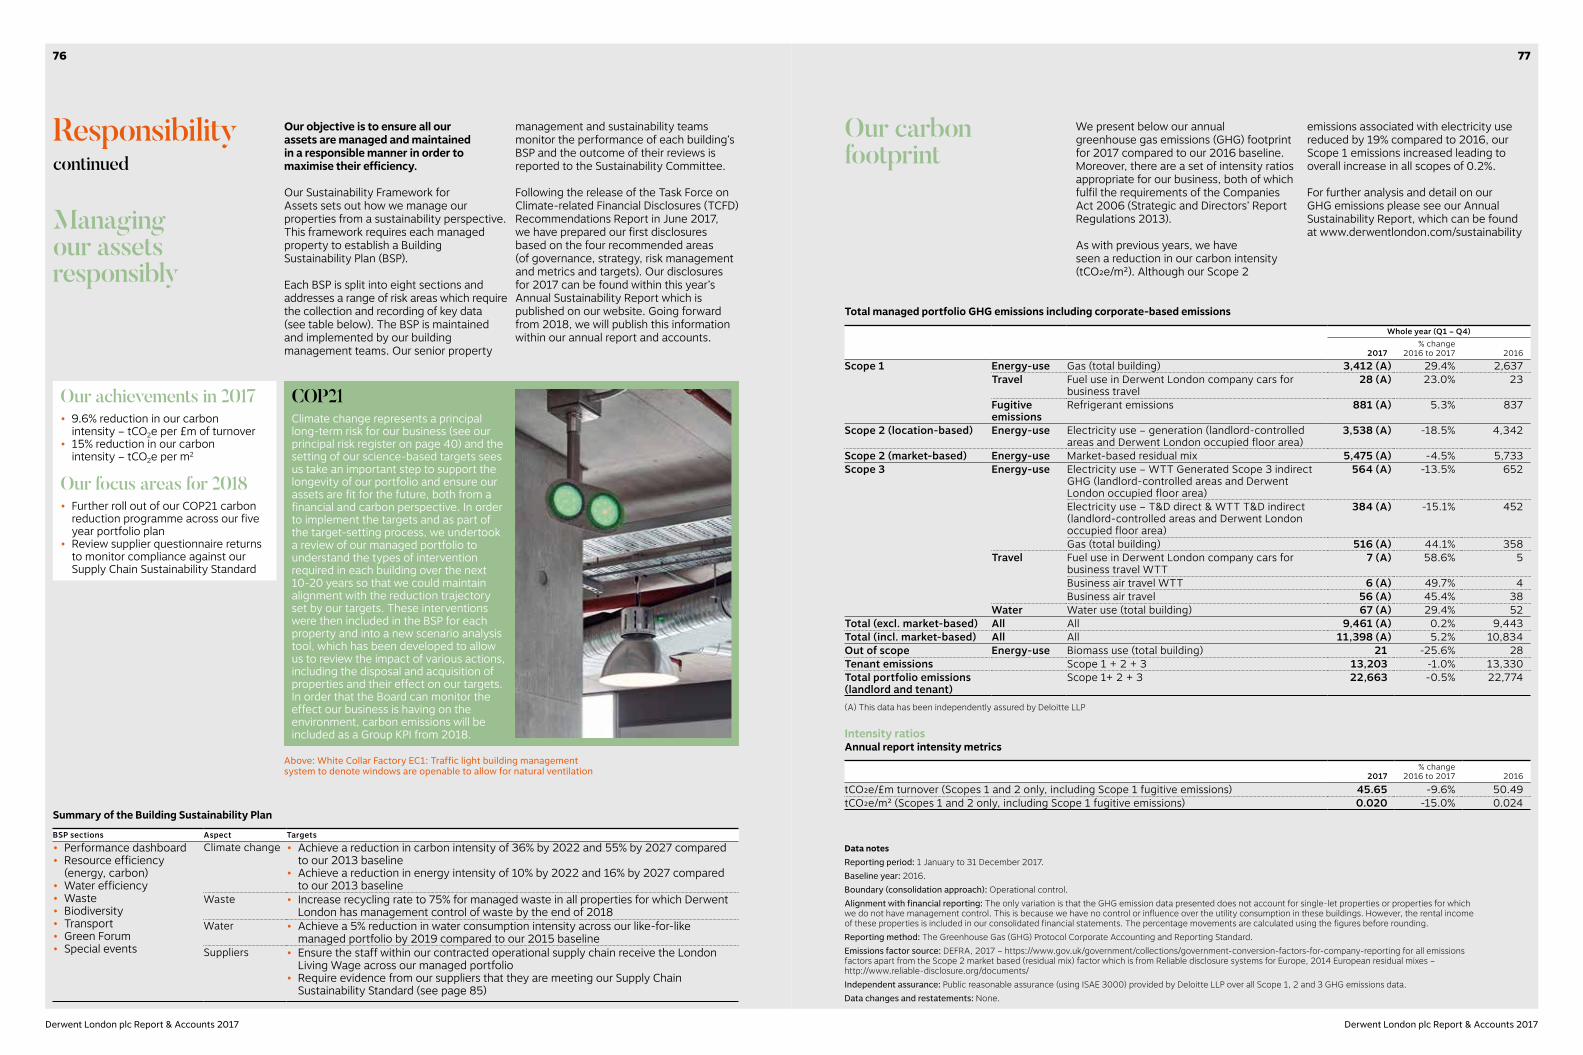
Responsibilitycontinued
Managingour assetsresponsibly
Our objective is to ensure all our assets are managed and maintained in a responsible manner in order to maximise their efficiency.
Our Sustainability Framework for Assets sets out how we manage our properties from a sustainability perspective. This framework requires each managed property to establish a Building Sustainability Plan (BSP).
Each BSP is split into eight sections and addresses a range of risk areas which require the collection and recording of key data (see table below). The BSP is maintained and implemented by our building management teams. Our senior property
management and sustainability teams monitor the performance of each building’s BSP and the outcome of their reviews is reported to the Sustainability Committee.
Following the release of the Task Force on Climate-related Financial Disclosures (TCFD) Recommendations Report in June 2017, we have prepared our first disclosures based on the four recommended areas (of governance, strategy, risk management and metrics and targets). Our disclosures for 2017 can be found within this year’s Annual Sustainability Report which is published on our website. Going forward from 2018, we will publish this information within our annual report and accounts.
Summary of the Building Sustainability Plan
BSP sections Aspect Targets
• Performance dashboard• Resource efficiency
(energy, carbon)• Water efficiency• Waste• Biodiversity• Transport• Green Forum• Special events
Climate change • Achieve a reduction in carbon intensity of 36% by 2022 and 55% by 2027 compared to our 2013 baseline
• Achieve a reduction in energy intensity of 10% by 2022 and 16% by 2027 compared to our 2013 baseline
Waste • Increase recycling rate to 75% for managed waste in all properties for which Derwent London has management control of waste by the end of 2018
Water • Achieve a 5% reduction in water consumption intensity across our like-for-like managed portfolio by 2019 compared to our 2015 baseline
Suppliers • Ensure the staff within our contracted operational supply chain receive the London Living Wage across our managed portfolio
• Require evidence from our suppliers that they are meeting our Supply Chain Sustainability Standard (see page 85)
COP21Climate change represents a principal long-term risk for our business (see our principal risk register on page 40) and the setting of our science-based targets sees us take an important step to support the longevity of our portfolio and ensure our assets are fit for the future, both from a financial and carbon perspective. In order to implement the targets and as part of the target-setting process, we undertook a review of our managed portfolio to understand the types of intervention required in each building over the next 10-20 years so that we could maintain alignment with the reduction trajectory set by our targets. These interventions were then included in the BSP for each property and into a new scenario analysis tool, which has been developed to allow us to review the impact of various actions, including the disposal and acquisition of properties and their effect on our targets. In order that the Board can monitor the effect our business is having on the environment, carbon emissions will be included as a Group KPI from 2018.
Our achievements in 2017• 9.6% reduction in our carbon
intensity – tCO2e per £m of turnover• 15% reduction in our carbon
intensity – tCO2e per m2
Our focus areas for 2018• Further roll out of our COP21 carbon
reduction programme across our five year portfolio plan
• Review supplier questionnaire returns to monitor compliance against our Supply Chain Sustainability Standard
Above: White Collar Factory EC1: Traffic light building management system to denote windows are openable to allow for natural ventilation
Our carbon footprint
We present below our annual greenhouse gas emissions (GHG) footprint for 2017 compared to our 2016 baseline. Moreover, there are a set of intensity ratios appropriate for our business, both of which fulfil the requirements of the Companies Act 2006 (Strategic and Directors’ Report Regulations 2013).
As with previous years, we have seen a reduction in our carbon intensity (tCO2e/m2). Although our Scope 2
emissions associated with electricity use reduced by 19% compared to 2016, our Scope 1 emissions increased leading to overall increase in all scopes of 0.2%.
For further analysis and detail on our GHG emissions please see our Annual Sustainability Report, which can be found at www.derwentlondon.com/sustainability
Total managed portfolio GHG emissions including corporate-based emissions
Whole year (Q1 – Q4)
2017% change
2016 to 2017 2016Scope 1 Energy-use Gas (total building) 3,412 (A) 29.4% 2,637 Travel Fuel use in Derwent London company cars for
business travel28 (A) 23.0% 23
Fugitive emissions
Refrigerant emissions 881 (A) 5.3% 837
Scope 2 (location-based) Energy-use Electricity use – generation (landlord-controlled areas and Derwent London occupied floor area)
3,538 (A) -18.5% 4,342
Scope 2 (market-based) Energy-use Market-based residual mix 5,475 (A) -4.5% 5,733 Scope 3 Energy-use Electricity use – WTT Generated Scope 3 indirect
GHG (landlord-controlled areas and Derwent London occupied floor area)
564 (A) -13.5% 652
Electricity use – T&D direct & WTT T&D indirect (landlord-controlled areas and Derwent London occupied floor area)
384 (A) -15.1% 452
Gas (total building) 516 (A) 44.1% 358 Travel Fuel use in Derwent London company cars for
business travel WTT7 (A) 58.6% 5
Business air travel WTT 6 (A) 49.7% 4 Business air travel 56 (A) 45.4% 38 Water Water use (total building) 67 (A) 29.4% 52 Total (excl. market-based) All All 9,461 (A) 0.2% 9,443 Total (incl. market-based) All All 11,398 (A) 5.2% 10,834 Out of scope Energy-use Biomass use (total building) 21 -25.6% 28 Tenant emissions Scope 1 + 2 + 3 13,203 -1.0% 13,330 Total portfolio emissions (landlord and tenant)
Scope 1+ 2 + 3 22,663 -0.5% 22,774
(A) This data has been independently assured by Deloitte LLP
Intensity ratios Annual report intensity metrics
2017% change
2016 to 2017 2016
tCO2e/£m turnover (Scopes 1 and 2 only, including Scope 1 fugitive emissions) 45.65 -9.6% 50.49tCO2e/m2 (Scopes 1 and 2 only, including Scope 1 fugitive emissions) 0.020 -15.0% 0.024
Data notesReporting period: 1 January to 31 December 2017.Baseline year: 2016.Boundary (consolidation approach): Operational control.Alignment with financial reporting: The only variation is that the GHG emission data presented does not account for single-let properties or properties for which we do not have management control. This is because we have no control or influence over the utility consumption in these buildings. However, the rental income of these properties is included in our consolidated financial statements. The percentage movements are calculated using the figures before rounding.Reporting method: The Greenhouse Gas (GHG) Protocol Corporate Accounting and Reporting Standard.Emissions factor source: DEFRA, 2017 – https://www.gov.uk/government/collections/government-conversion-factors-for-company-reporting for all emissions factors apart from the Scope 2 market based (residual mix) factor which is from Reliable disclosure systems for Europe, 2014 European residual mixes – http://www.reliable-disclosure.org/documents/ Independent assurance: Public reasonable assurance (using ISAE 3000) provided by Deloitte LLP over all Scope 1, 2 and 3 GHG emissions data.Data changes and restatements: None.
7776
Derwent London plc Report & Accounts 2017 Derwent London plc Report & Accounts 2017
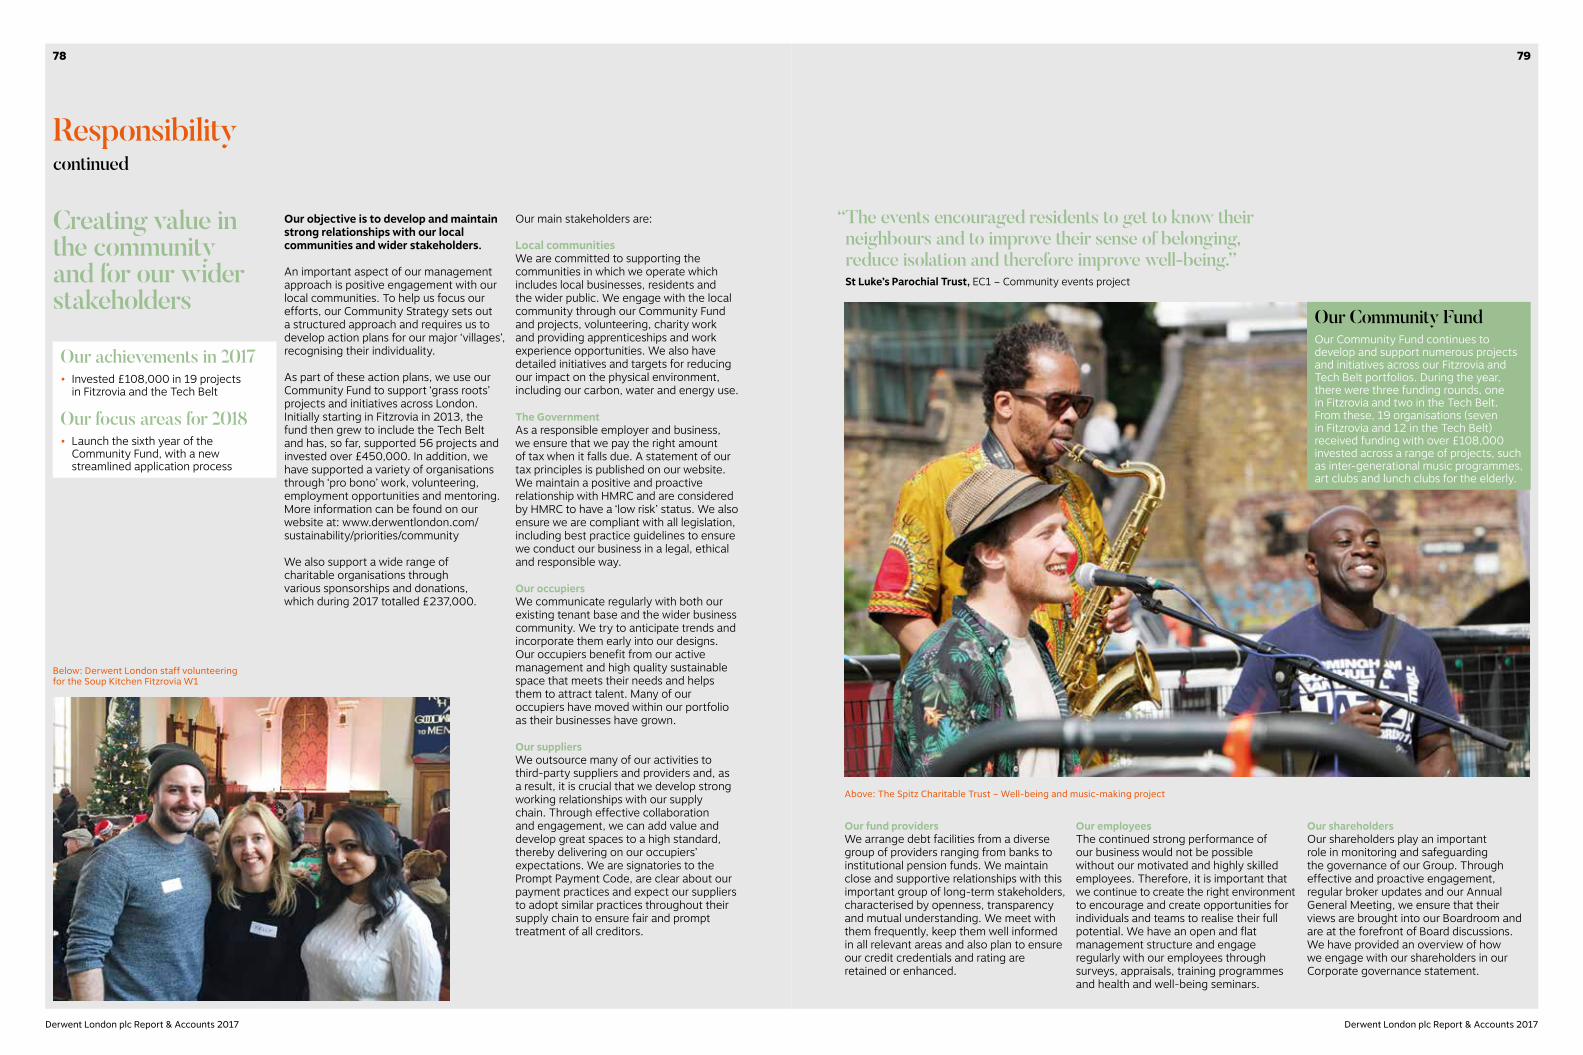
Responsibilitycontinued
Our achievements in 2017• Invested £108,000 in 19 projects
in Fitzrovia and the Tech Belt
Our focus areas for 2018• Launch the sixth year of the
Community Fund, with a new streamlined application process
Our objective is to develop and maintain strong relationships with our local communities and wider stakeholders.
An important aspect of our management approach is positive engagement with our local communities. To help us focus our efforts, our Community Strategy sets out a structured approach and requires us to develop action plans for our major ‘villages’, recognising their individuality.
As part of these action plans, we use our Community Fund to support ‘grass roots’ projects and initiatives across London. Initially starting in Fitzrovia in 2013, the fund then grew to include the Tech Belt and has, so far, supported 56 projects and invested over £450,000. In addition, we have supported a variety of organisations through ‘pro bono’ work, volunteering, employment opportunities and mentoring. More information can be found on our website at: www.derwentlondon.com/sustainability/priorities/community
We also support a wide range of charitable organisations through various sponsorships and donations, which during 2017 totalled £237,000.
Our main stakeholders are:
Local communities We are committed to supporting the communities in which we operate which includes local businesses, residents and the wider public. We engage with the local community through our Community Fund and projects, volunteering, charity work and providing apprenticeships and work experience opportunities. We also have detailed initiatives and targets for reducing our impact on the physical environment, including our carbon, water and energy use.
The Government As a responsible employer and business, we ensure that we pay the right amount of tax when it falls due. A statement of our tax principles is published on our website. We maintain a positive and proactive relationship with HMRC and are considered by HMRC to have a ‘low risk’ status. We also ensure we are compliant with all legislation, including best practice guidelines to ensure we conduct our business in a legal, ethical and responsible way.
Our occupiers We communicate regularly with both our existing tenant base and the wider business community. We try to anticipate trends and incorporate them early into our designs. Our occupiers benefit from our active management and high quality sustainable space that meets their needs and helps them to attract talent. Many of our occupiers have moved within our portfolio as their businesses have grown.
Our suppliersWe outsource many of our activities to third-party suppliers and providers and, as a result, it is crucial that we develop strong working relationships with our supply chain. Through effective collaboration and engagement, we can add value and develop great spaces to a high standard, thereby delivering on our occupiers’ expectations. We are signatories to the Prompt Payment Code, are clear about our payment practices and expect our suppliers to adopt similar practices throughout their supply chain to ensure fair and prompt treatment of all creditors.
Creating value in the community and for our wider stakeholders
Our fund providersWe arrange debt facilities from a diverse group of providers ranging from banks to institutional pension funds. We maintain close and supportive relationships with this important group of long-term stakeholders, characterised by openness, transparency and mutual understanding. We meet with them frequently, keep them well informed in all relevant areas and also plan to ensure our credit credentials and rating are retained or enhanced.
“ The events encouraged residents to get to know their neighbours and to improve their sense of belonging, reduce isolation and therefore improve well-being.”
St Luke’s Parochial Trust, EC1 – Community events project
Below: Derwent London staff volunteering for the Soup Kitchen Fitzrovia W1
Above: The Spitz Charitable Trust – Well-being and music-making project
Our employeesThe continued strong performance of our business would not be possible without our motivated and highly skilled employees. Therefore, it is important that we continue to create the right environment to encourage and create opportunities for individuals and teams to realise their full potential. We have an open and flat management structure and engage regularly with our employees through surveys, appraisals, training programmes and health and well-being seminars.
Our shareholdersOur shareholders play an important role in monitoring and safeguarding the governance of our Group. Through effective and proactive engagement, regular broker updates and our Annual General Meeting, we ensure that their views are brought into our Boardroom and are at the forefront of Board discussions. We have provided an overview of how we engage with our shareholders in our Corporate governance statement.
Our Community FundOur Community Fund continues to develop and support numerous projects and initiatives across our Fitzrovia and Tech Belt portfolios. During the year, there were three funding rounds, one in Fitzrovia and two in the Tech Belt. From these, 19 organisations (seven in Fitzrovia and 12 in the Tech Belt) received funding with over £108,000 invested across a range of projects, such as inter-generational music programmes, art clubs and lunch clubs for the elderly.
7978
Derwent London plc Report & Accounts 2017 Derwent London plc Report & Accounts 2017
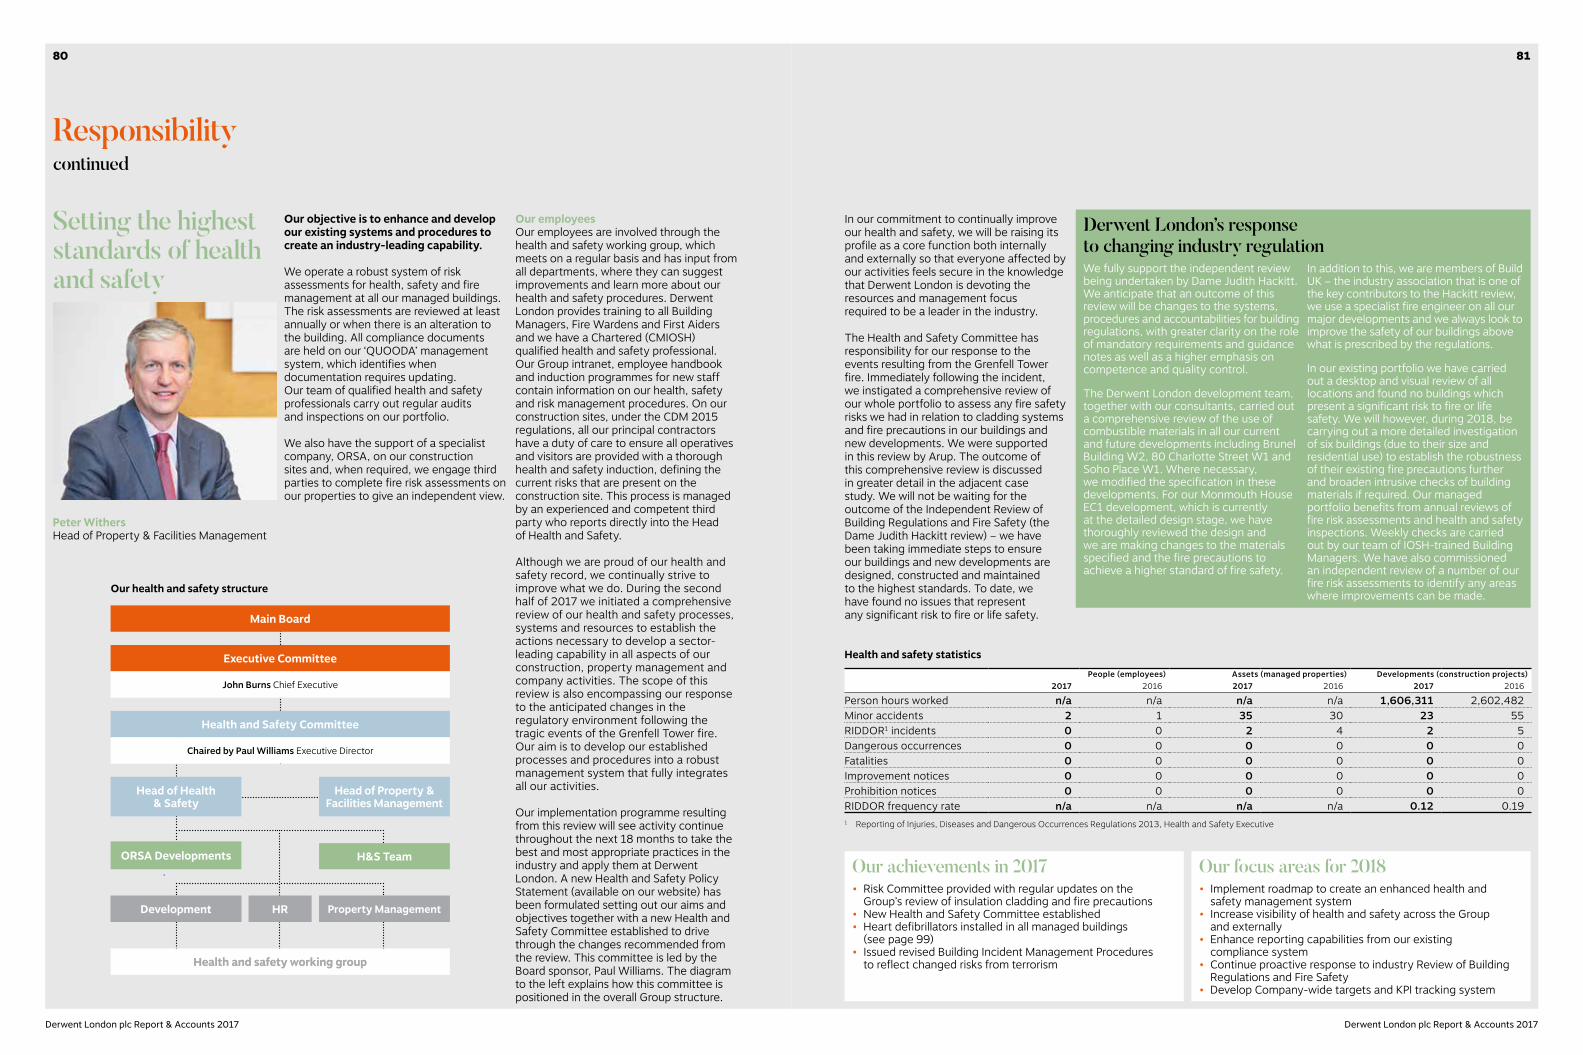
Responsibilitycontinued
Our objective is to enhance and develop our existing systems and procedures to create an industry-leading capability.
We operate a robust system of risk assessments for health, safety and fire management at all our managed buildings. The risk assessments are reviewed at least annually or when there is an alteration to the building. All compliance documents are held on our ‘QUOODA’ management system, which identifies when documentation requires updating. Our team of qualified health and safety professionals carry out regular audits and inspections on our portfolio.
We also have the support of a specialist company, ORSA, on our construction sites and, when required, we engage third parties to complete fire risk assessments on our properties to give an independent view.
Setting the highest standards of health and safety
Our achievements in 2017• Risk Committee provided with regular updates on the
Group’s review of insulation cladding and fire precautions• New Health and Safety Committee established • Heart defibrillators installed in all managed buildings
(see page 99)• Issued revised Building Incident Management Procedures
to reflect changed risks from terrorism
Our focus areas for 2018• Implement roadmap to create an enhanced health and
safety management system• Increase visibility of health and safety across the Group
and externally• Enhance reporting capabilities from our existing
compliance system• Continue proactive response to industry Review of Building
Regulations and Fire Safety • Develop Company-wide targets and KPI tracking system
Our employeesOur employees are involved through the health and safety working group, which meets on a regular basis and has input from all departments, where they can suggest improvements and learn more about our health and safety procedures. Derwent London provides training to all Building Managers, Fire Wardens and First Aiders and we have a Chartered (CMIOSH) qualified health and safety professional. Our Group intranet, employee handbook and induction programmes for new staff contain information on our health, safety and risk management procedures. On our construction sites, under the CDM 2015 regulations, all our principal contractors have a duty of care to ensure all operatives and visitors are provided with a thorough health and safety induction, defining the current risks that are present on the construction site. This process is managed by an experienced and competent third party who reports directly into the Head of Health and Safety.
Although we are proud of our health and safety record, we continually strive to improve what we do. During the second half of 2017 we initiated a comprehensive review of our health and safety processes, systems and resources to establish the actions necessary to develop a sector-leading capability in all aspects of our construction, property management and company activities. The scope of this review is also encompassing our response to the anticipated changes in the regulatory environment following the tragic events of the Grenfell Tower fire. Our aim is to develop our established processes and procedures into a robust management system that fully integrates all our activities.
Our implementation programme resulting from this review will see activity continue throughout the next 18 months to take the best and most appropriate practices in the industry and apply them at Derwent London. A new Health and Safety Policy Statement (available on our website) has been formulated setting out our aims and objectives together with a new Health and Safety Committee established to drive through the changes recommended from the review. This committee is led by the Board sponsor, Paul Williams. The diagram to the left explains how this committee is positioned in the overall Group structure.
Derwent London’s response to changing industry regulation We fully support the independent review being undertaken by Dame Judith Hackitt. We anticipate that an outcome of this review will be changes to the systems, procedures and accountabilities for building regulations, with greater clarity on the role of mandatory requirements and guidance notes as well as a higher emphasis on competence and quality control.
The Derwent London development team, together with our consultants, carried out a comprehensive review of the use of combustible materials in all our current and future developments including Brunel Building W2, 80 Charlotte Street W1 and Soho Place W1. Where necessary, we modified the specification in these developments. For our Monmouth House EC1 development, which is currently at the detailed design stage, we have thoroughly reviewed the design and we are making changes to the materials specified and the fire precautions to achieve a higher standard of fire safety.
In addition to this, we are members of Build UK – the industry association that is one of the key contributors to the Hackitt review, we use a specialist fire engineer on all our major developments and we always look to improve the safety of our buildings above what is prescribed by the regulations.
In our existing portfolio we have carried out a desktop and visual review of all locations and found no buildings which present a significant risk to fire or life safety. We will however, during 2018, be carrying out a more detailed investigation of six buildings (due to their size and residential use) to establish the robustness of their existing fire precautions further and broaden intrusive checks of building materials if required. Our managed portfolio benefits from annual reviews of fire risk assessments and health and safety inspections. Weekly checks are carried out by our team of IOSH-trained Building Managers. We have also commissioned an independent review of a number of our fire risk assessments to identify any areas where improvements can be made.
In our commitment to continually improve our health and safety, we will be raising its profile as a core function both internally and externally so that everyone affected by our activities feels secure in the knowledge that Derwent London is devoting the resources and management focus required to be a leader in the industry.
The Health and Safety Committee has responsibility for our response to the events resulting from the Grenfell Tower fire. Immediately following the incident, we instigated a comprehensive review of our whole portfolio to assess any fire safety risks we had in relation to cladding systems and fire precautions in our buildings and new developments. We were supported in this review by Arup. The outcome of this comprehensive review is discussed in greater detail in the adjacent case study. We will not be waiting for the outcome of the Independent Review of Building Regulations and Fire Safety (the Dame Judith Hackitt review) – we have been taking immediate steps to ensure our buildings and new developments are designed, constructed and maintained to the highest standards. To date, we have found no issues that represent any significant risk to fire or life safety.Main Board
Executive Committee
HR
Health and safety working groupHealth and safety working group
Property Management
Health and Safety Committee
Head of Property & Facilities Management
Head of Health & Safety
John Burns Chief Executive
Chaired by Paul Williams Executive Director
Our health and safety structure
Peter WithersHead of Property & Facilities Management
Development
ORSA Developments H&S Team
Health and safety statistics
People (employees) Assets (managed properties) Developments (construction projects)2017 2016 2017 2016 2017 2016
Person hours worked n/a n/a n/a n/a 1,606,311 2,602,482Minor accidents 2 1 35 30 23 55RIDDOR1 incidents 0 0 2 4 2 5Dangerous occurrences 0 0 0 0 0 0Fatalities 0 0 0 0 0 0Improvement notices 0 0 0 0 0 0Prohibition notices 0 0 0 0 0 0RIDDOR frequency rate n/a n/a n/a n/a 0.12 0.191 Reporting of Injuries, Diseases and Dangerous Occurrences Regulations 2013, Health and Safety Executive
8180
Derwent London plc Report & Accounts 2017 Derwent London plc Report & Accounts 2017
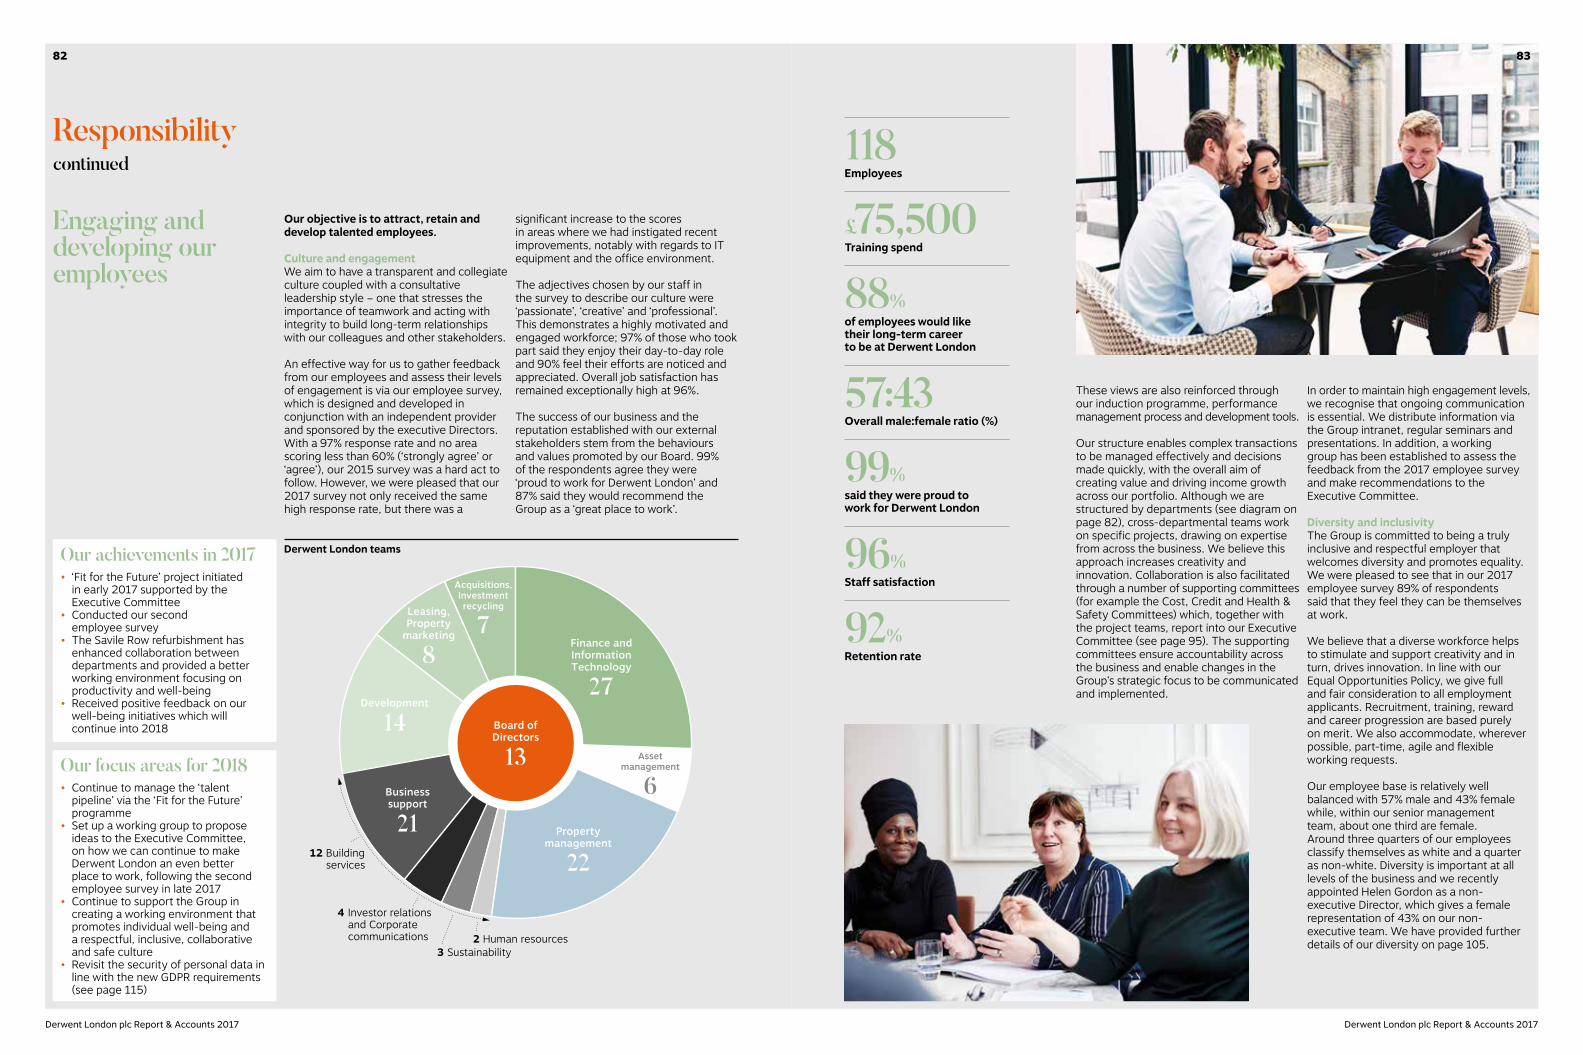
Responsibilitycontinued
Engaging and developing our employees
Our objective is to attract, retain and develop talented employees.
Culture and engagementWe aim to have a transparent and collegiate culture coupled with a consultative leadership style – one that stresses the importance of teamwork and acting with integrity to build long-term relationships with our colleagues and other stakeholders.
An effective way for us to gather feedback from our employees and assess their levels of engagement is via our employee survey, which is designed and developed in conjunction with an independent provider and sponsored by the executive Directors. With a 97% response rate and no area scoring less than 60% (‘strongly agree’ or ‘agree’), our 2015 survey was a hard act to follow. However, we were pleased that our 2017 survey not only received the same high response rate, but there was a
These views are also reinforced through our induction programme, performance management process and development tools.
Our structure enables complex transactions to be managed effectively and decisions made quickly, with the overall aim of creating value and driving income growth across our portfolio. Although we are structured by departments (see diagram on page 82), cross-departmental teams work on specific projects, drawing on expertise from across the business. We believe this approach increases creativity and innovation. Collaboration is also facilitated through a number of supporting committees (for example the Cost, Credit and Health & Safety Committees) which, together with the project teams, report into our Executive Committee (see page 95). The supporting committees ensure accountability across the business and enable changes in the Group’s strategic focus to be communicated and implemented.
Board ofDirectors
13
Acquisitions,Investmentrecycling
7
Assetmanagement
6
Leasing,Property
marketing
8
Propertymanagement
22
Finance andInformationTechnology
27
Businesssupport
21
Development
14
4 Investor relationsand Corporatecommunications 2 Human resources
3 Sustainability
12 Building services
significant increase to the scores in areas where we had instigated recent improvements, notably with regards to IT equipment and the office environment.
The adjectives chosen by our staff in the survey to describe our culture were ‘passionate’, ‘creative’ and ‘professional’. This demonstrates a highly motivated and engaged workforce; 97% of those who took part said they enjoy their day-to-day role and 90% feel their efforts are noticed and appreciated. Overall job satisfaction has remained exceptionally high at 96%.
The success of our business and the reputation established with our external stakeholders stem from the behaviours and values promoted by our Board. 99% of the respondents agree they were ‘proud to work for Derwent London’ and 87% said they would recommend the Group as a ‘great place to work’.
Our achievements in 2017• ‘Fit for the Future’ project initiated
in early 2017 supported by the Executive Committee
• Conducted our second employee survey
• The Savile Row refurbishment has enhanced collaboration between departments and provided a better working environment focusing on productivity and well-being
• Received positive feedback on our well-being initiatives which will continue into 2018
Our focus areas for 2018• Continue to manage the ‘talent
pipeline’ via the ‘Fit for the Future’ programme
• Set up a working group to propose ideas to the Executive Committee, on how we can continue to make Derwent London an even better place to work, following the second employee survey in late 2017
• Continue to support the Group in creating a working environment that promotes individual well-being and a respectful, inclusive, collaborative and safe culture
• Revisit the security of personal data in line with the new GDPR requirements (see page 115)
118Employees
£75,500Training spend
88%of employees would like their long-term career to be at Derwent London
57:43Overall male:female ratio (%)
99%said they were proud to work for Derwent London
96%Staff satisfaction
92%Retention rate
Derwent London teams
In order to maintain high engagement levels, we recognise that ongoing communication is essential. We distribute information via the Group intranet, regular seminars and presentations. In addition, a working group has been established to assess the feedback from the 2017 employee survey and make recommendations to the Executive Committee.
Diversity and inclusivityThe Group is committed to being a truly inclusive and respectful employer that welcomes diversity and promotes equality. We were pleased to see that in our 2017 employee survey 89% of respondents said that they feel they can be themselves at work.
We believe that a diverse workforce helps to stimulate and support creativity and in turn, drives innovation. In line with our Equal Opportunities Policy, we give full and fair consideration to all employment applicants. Recruitment, training, reward and career progression are based purely on merit. We also accommodate, wherever possible, part-time, agile and flexible working requests.
Our employee base is relatively well balanced with 57% male and 43% female while, within our senior management team, about one third are female. Around three quarters of our employees classify themselves as white and a quarter as non-white. Diversity is important at all levels of the business and we recently appointed Helen Gordon as a non-executive Director, which gives a female representation of 43% on our non-executive team. We have provided further details of our diversity on page 105.
8382
Derwent London plc Report & Accounts 2017 Derwent London plc Report & Accounts 2017
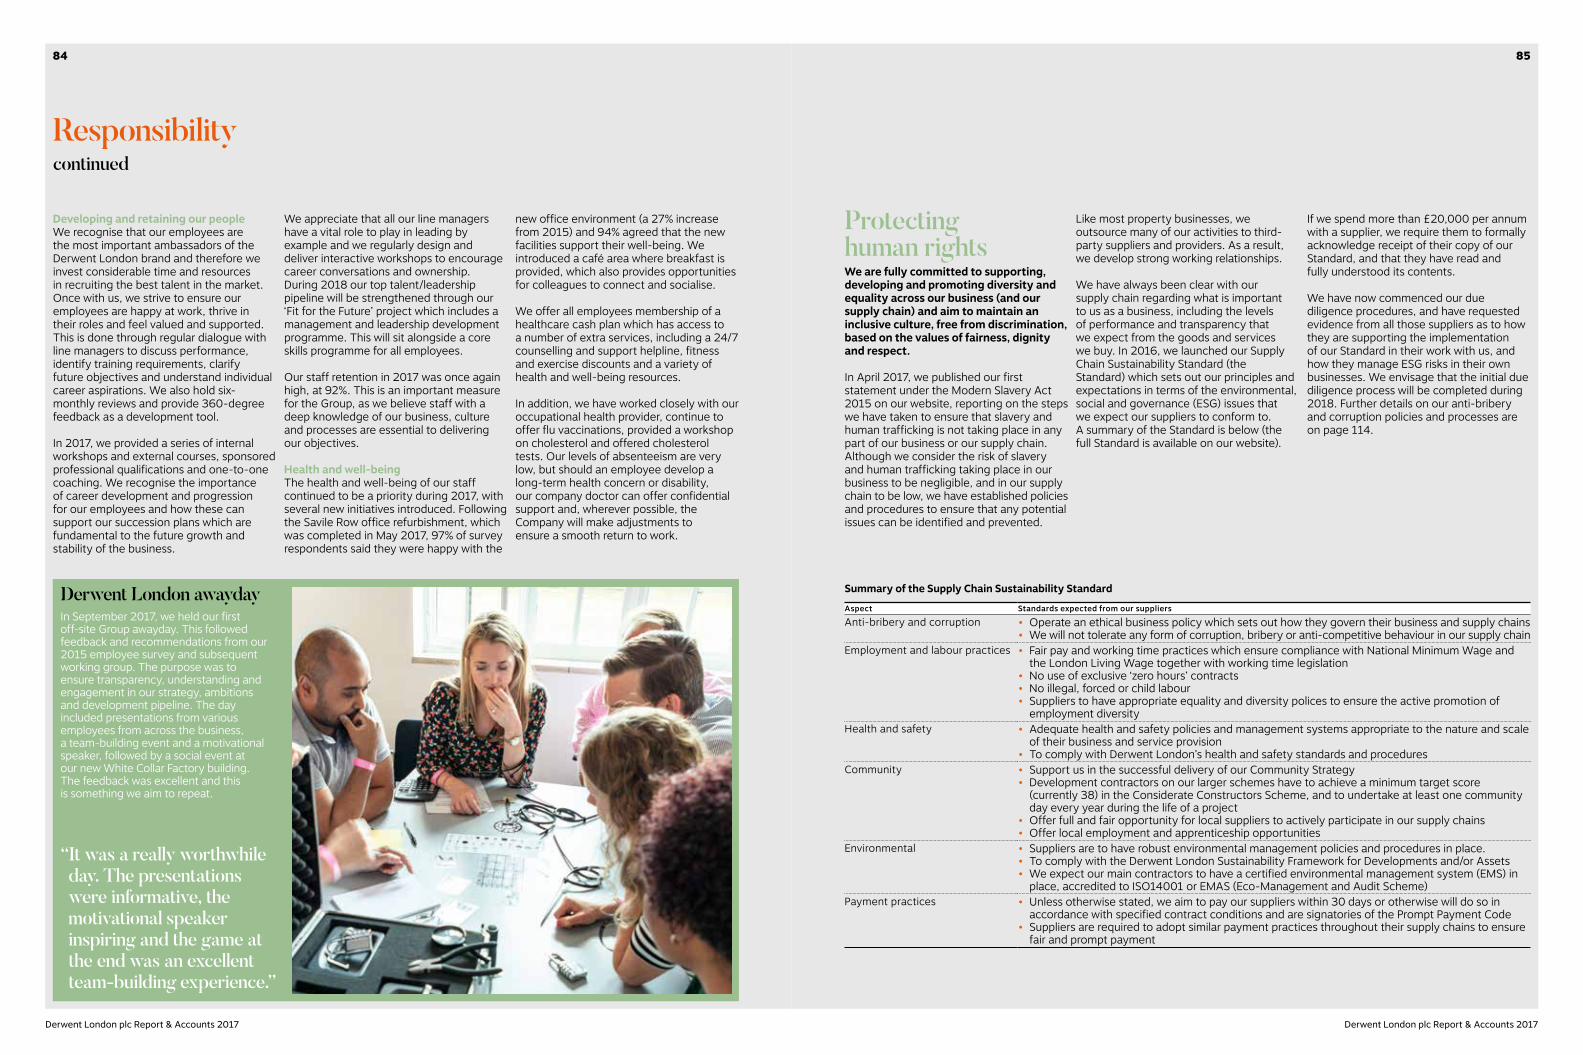
Responsibilitycontinued
Developing and retaining our peopleWe recognise that our employees are the most important ambassadors of the Derwent London brand and therefore we invest considerable time and resources in recruiting the best talent in the market. Once with us, we strive to ensure our employees are happy at work, thrive in their roles and feel valued and supported. This is done through regular dialogue with line managers to discuss performance, identify training requirements, clarify future objectives and understand individual career aspirations. We also hold six-monthly reviews and provide 360-degree feedback as a development tool.
In 2017, we provided a series of internal workshops and external courses, sponsored professional qualifications and one-to-one coaching. We recognise the importance of career development and progression for our employees and how these can support our succession plans which are fundamental to the future growth and stability of the business.
We appreciate that all our line managers have a vital role to play in leading by example and we regularly design and deliver interactive workshops to encourage career conversations and ownership. During 2018 our top talent/leadership pipeline will be strengthened through our ‘Fit for the Future’ project which includes a management and leadership development programme. This will sit alongside a core skills programme for all employees.
Our staff retention in 2017 was once again high, at 92%. This is an important measure for the Group, as we believe staff with a deep knowledge of our business, culture and processes are essential to delivering our objectives.
Health and well-beingThe health and well-being of our staff continued to be a priority during 2017, with several new initiatives introduced. Following the Savile Row office refurbishment, which was completed in May 2017, 97% of survey respondents said they were happy with the
Summary of the Supply Chain Sustainability Standard
Aspect Standards expected from our suppliers
Anti-bribery and corruption • Operate an ethical business policy which sets out how they govern their business and supply chains• We will not tolerate any form of corruption, bribery or anti-competitive behaviour in our supply chain
Employment and labour practices • Fair pay and working time practices which ensure compliance with National Minimum Wage and the London Living Wage together with working time legislation
• No use of exclusive ‘zero hours’ contracts• No illegal, forced or child labour• Suppliers to have appropriate equality and diversity polices to ensure the active promotion of
employment diversityHealth and safety • Adequate health and safety policies and management systems appropriate to the nature and scale
of their business and service provision• To comply with Derwent London’s health and safety standards and procedures
Community • Support us in the successful delivery of our Community Strategy• Development contractors on our larger schemes have to achieve a minimum target score
(currently 38) in the Considerate Constructors Scheme, and to undertake at least one community day every year during the life of a project
• Offer full and fair opportunity for local suppliers to actively participate in our supply chains• Offer local employment and apprenticeship opportunities
Environmental • Suppliers are to have robust environmental management policies and procedures in place.• To comply with the Derwent London Sustainability Framework for Developments and/or Assets• We expect our main contractors to have a certified environmental management system (EMS) in
place, accredited to ISO14001 or EMAS (Eco-Management and Audit Scheme)Payment practices • Unless otherwise stated, we aim to pay our suppliers within 30 days or otherwise will do so in
accordance with specified contract conditions and are signatories of the Prompt Payment Code • Suppliers are required to adopt similar payment practices throughout their supply chains to ensure
fair and prompt payment
We are fully committed to supporting, developing and promoting diversity and equality across our business (and our supply chain) and aim to maintain an inclusive culture, free from discrimination, based on the values of fairness, dignity and respect.
In April 2017, we published our first statement under the Modern Slavery Act 2015 on our website, reporting on the steps we have taken to ensure that slavery and human trafficking is not taking place in any part of our business or our supply chain. Although we consider the risk of slavery and human trafficking taking place in our business to be negligible, and in our supply chain to be low, we have established policies and procedures to ensure that any potential issues can be identified and prevented.
Like most property businesses, we outsource many of our activities to third-party suppliers and providers. As a result, we develop strong working relationships.
We have always been clear with our supply chain regarding what is important to us as a business, including the levels of performance and transparency that we expect from the goods and services we buy. In 2016, we launched our Supply Chain Sustainability Standard (the Standard) which sets out our principles and expectations in terms of the environmental, social and governance (ESG) issues that we expect our suppliers to conform to. A summary of the Standard is below (the full Standard is available on our website).
Protecting human rights
If we spend more than £20,000 per annum with a supplier, we require them to formally acknowledge receipt of their copy of our Standard, and that they have read and fully understood its contents.
We have now commenced our due diligence procedures, and have requested evidence from all those suppliers as to how they are supporting the implementation of our Standard in their work with us, and how they manage ESG risks in their own businesses. We envisage that the initial due diligence process will be completed during 2018. Further details on our anti-bribery and corruption policies and processes are on page 114.
Derwent London awaydayIn September 2017, we held our first off-site Group awayday. This followed feedback and recommendations from our 2015 employee survey and subsequent working group. The purpose was to ensure transparency, understanding and engagement in our strategy, ambitions and development pipeline. The day included presentations from various employees from across the business, a team-building event and a motivational speaker, followed by a social event at our new White Collar Factory building. The feedback was excellent and this is something we aim to repeat.
“ It was a really worthwhile day. The presentations were informative, the motivational speaker inspiring and the game at the end was an excellent team-building experience.”
new office environment (a 27% increase from 2015) and 94% agreed that the new facilities support their well-being. We introduced a café area where breakfast is provided, which also provides opportunities for colleagues to connect and socialise.
We offer all employees membership of a healthcare cash plan which has access to a number of extra services, including a 24/7 counselling and support helpline, fitness and exercise discounts and a variety of health and well-being resources.
In addition, we have worked closely with our occupational health provider, continue to offer flu vaccinations, provided a workshop on cholesterol and offered cholesterol tests. Our levels of absenteeism are very low, but should an employee develop a long-term health concern or disability, our company doctor can offer confidential support and, wherever possible, the Company will make adjustments to ensure a smooth return to work.
8584
Derwent London plc Report & Accounts 2017 Derwent London plc Report & Accounts 2017

Introduction from the Chairman ����������������88Board of Directors �������������������������������������90Senior management ����������������������������������92Corporate governance statement��������������94Nominations Committee report ���������������102Audit Committee report ��������������������������106Risk Committee report ����������������������������112Remuneration Committee report ������������116Remuneration Policy report ���������������������130Directors’ report ��������������������������������������136
Governance 02
Above and left: White Collar Factory EC1
87
Derwent London plc Report & Accounts 2017
86
Derwent London plc Report & Accounts 2017
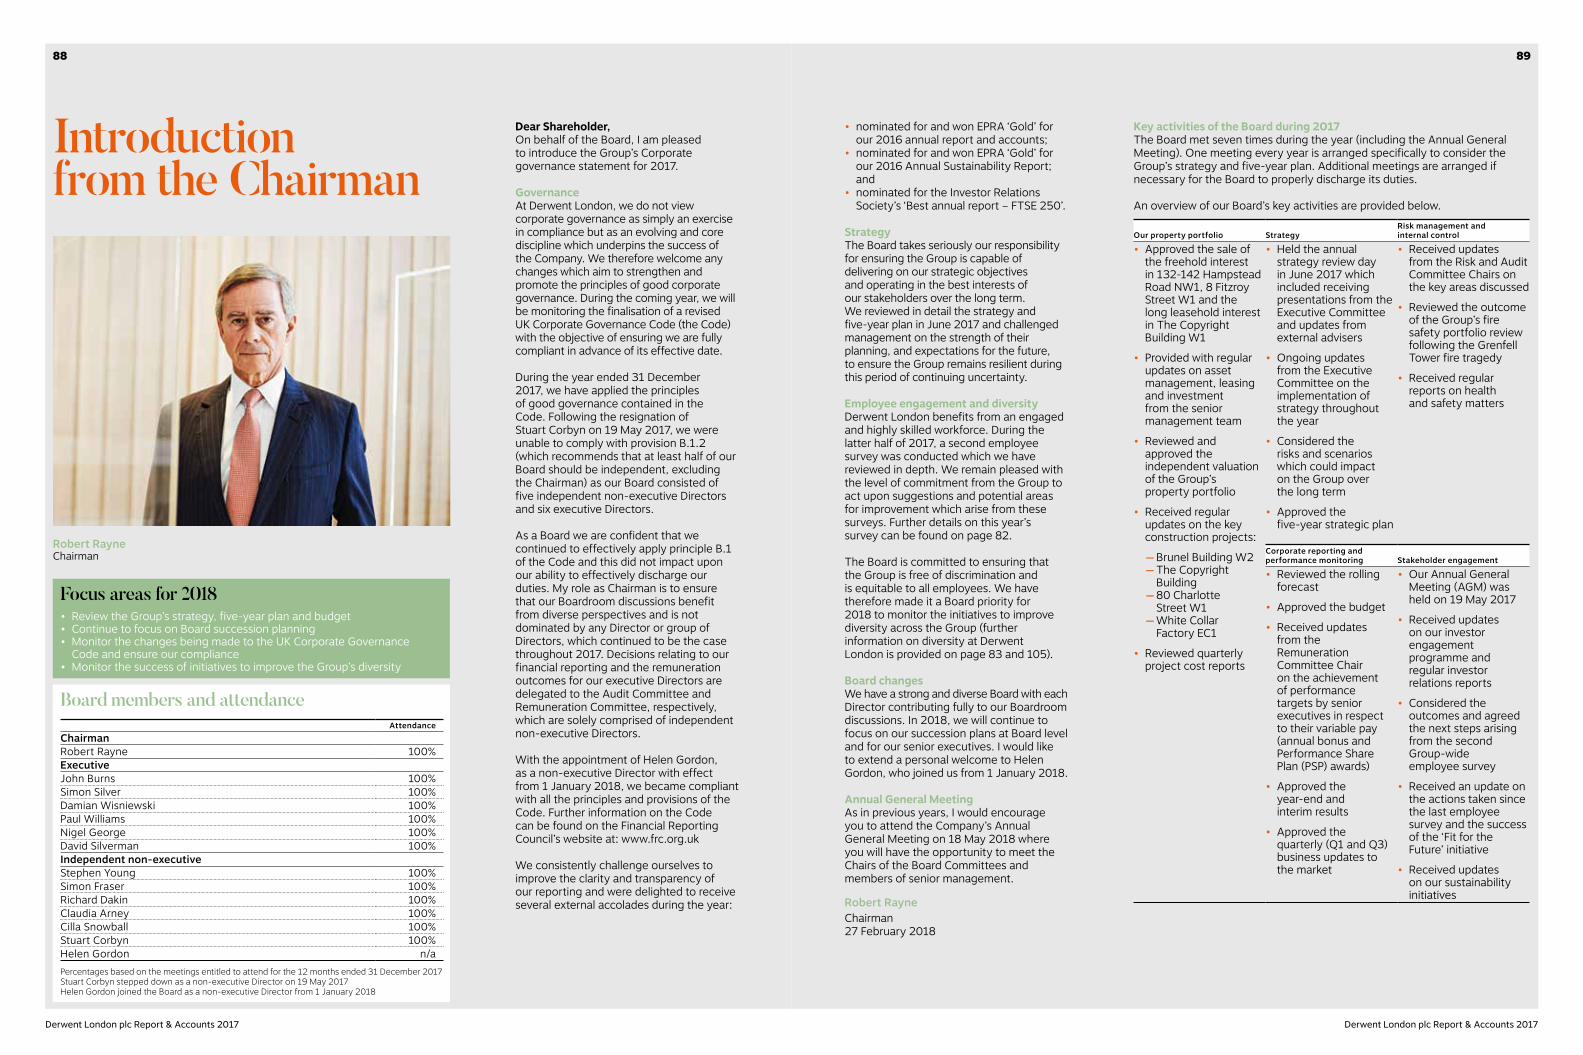
Introduction from the Chairman
Dear Shareholder,On behalf of the Board, I am pleased to introduce the Group’s Corporate governance statement for 2017.
GovernanceAt Derwent London, we do not view corporate governance as simply an exercise in compliance but as an evolving and core discipline which underpins the success of the Company. We therefore welcome any changes which aim to strengthen and promote the principles of good corporate governance. During the coming year, we will be monitoring the finalisation of a revised UK Corporate Governance Code (the Code) with the objective of ensuring we are fully compliant in advance of its effective date.
During the year ended 31 December 2017, we have applied the principles of good governance contained in the Code. Following the resignation of Stuart Corbyn on 19 May 2017, we were unable to comply with provision B.1.2 (which recommends that at least half of our Board should be independent, excluding the Chairman) as our Board consisted of five independent non-executive Directors and six executive Directors.
As a Board we are confident that we continued to effectively apply principle B.1 of the Code and this did not impact upon our ability to effectively discharge our duties. My role as Chairman is to ensure that our Boardroom discussions benefit from diverse perspectives and is not dominated by any Director or group of Directors, which continued to be the case throughout 2017. Decisions relating to our financial reporting and the remuneration outcomes for our executive Directors are delegated to the Audit Committee and Remuneration Committee, respectively, which are solely comprised of independent non-executive Directors.
With the appointment of Helen Gordon, as a non-executive Director with effect from 1 January 2018, we became compliant with all the principles and provisions of the Code. Further information on the Code can be found on the Financial Reporting Council’s website at: www.frc.org.uk
We consistently challenge ourselves to improve the clarity and transparency of our reporting and were delighted to receive several external accolades during the year:
• nominated for and won EPRA ‘Gold’ for our 2016 annual report and accounts;
• nominated for and won EPRA ‘Gold’ for our 2016 Annual Sustainability Report; and
• nominated for the Investor Relations Society’s ‘Best annual report – FTSE 250’.
StrategyThe Board takes seriously our responsibility for ensuring the Group is capable of delivering on our strategic objectives and operating in the best interests of our stakeholders over the long term. We reviewed in detail the strategy and five-year plan in June 2017 and challenged management on the strength of their planning, and expectations for the future, to ensure the Group remains resilient during this period of continuing uncertainty.
Employee engagement and diversityDerwent London benefits from an engaged and highly skilled workforce. During the latter half of 2017, a second employee survey was conducted which we have reviewed in depth. We remain pleased with the level of commitment from the Group to act upon suggestions and potential areas for improvement which arise from these surveys. Further details on this year’s survey can be found on page 82.
The Board is committed to ensuring that the Group is free of discrimination and is equitable to all employees. We have therefore made it a Board priority for 2018 to monitor the initiatives to improve diversity across the Group (further information on diversity at Derwent London is provided on page 83 and 105).
Board changesWe have a strong and diverse Board with each Director contributing fully to our Boardroom discussions. In 2018, we will continue to focus on our succession plans at Board level and for our senior executives. I would like to extend a personal welcome to Helen Gordon, who joined us from 1 January 2018.
Annual General MeetingAs in previous years, I would encourage you to attend the Company’s Annual General Meeting on 18 May 2018 where you will have the opportunity to meet the Chairs of the Board Committees and members of senior management.
Robert Rayne Chairman 27 February 2018
Focus areas for 2018• Review the Group’s strategy, five-year plan and budget• Continue to focus on Board succession planning• Monitor the changes being made to the UK Corporate Governance
Code and ensure our compliance• Monitor the success of initiatives to improve the Group’s diversity
Key activities of the Board during 2017The Board met seven times during the year (including the Annual General Meeting). One meeting every year is arranged specifically to consider the Group’s strategy and five-year plan. Additional meetings are arranged if necessary for the Board to properly discharge its duties.
An overview of our Board’s key activities are provided below.
Our property portfolio StrategyRisk management and internal control
• Approved the sale of the freehold interest in 132-142 Hampstead Road NW1, 8 Fitzroy Street W1 and the long leasehold interest in The Copyright Building W1
• Provided with regular updates on asset management, leasing and investment from the senior management team
• Reviewed and approved the independent valuation of the Group’s property portfolio
• Received regular updates on the key construction projects:
–Brunel Building W2 –The Copyright Building –80 Charlotte Street W1 –White Collar Factory EC1
• Reviewed quarterly project cost reports
• Held the annual strategy review day in June 2017 which included receiving presentations from the Executive Committee and updates from external advisers
• Ongoing updates from the Executive Committee on the implementation of strategy throughout the year
• Considered the risks and scenarios which could impact on the Group over the long term
• Approved the five-year strategic plan
• Received updates from the Risk and Audit Committee Chairs on the key areas discussed
• Reviewed the outcome of the Group’s fire safety portfolio review following the Grenfell Tower fire tragedy
• Received regular reports on health and safety matters
Corporate reporting and performance monitoring Stakeholder engagement
• Reviewed the rolling forecast
• Approved the budget
• Received updates from the Remuneration Committee Chair on the achievement of performance targets by senior executives in respect to their variable pay (annual bonus and Performance Share Plan (PSP) awards)
• Approved the year-end and interim results
• Approved the quarterly (Q1 and Q3) business updates to the market
• Our Annual General Meeting (AGM) was held on 19 May 2017
• Received updates on our investor engagement programme and regular investor relations reports
• Considered the outcomes and agreed the next steps arising from the second Group-wide employee survey
• Received an update on the actions taken since the last employee survey and the success of the ‘Fit for the Future’ initiative
• Received updates on our sustainability initiatives
Robert Rayne Chairman
Board members and attendanceAttendance
ChairmanRobert Rayne 100%ExecutiveJohn Burns 100%Simon Silver 100%Damian Wisniewski 100%Paul Williams 100%Nigel George 100%David Silverman 100%Independent non-executiveStephen Young 100%Simon Fraser 100%Richard Dakin 100%Claudia Arney 100%Cilla Snowball 100%Stuart Corbyn 100%Helen Gordon n/aPercentages based on the meetings entitled to attend for the 12 months ended 31 December 2017 Stuart Corbyn stepped down as a non-executive Director on 19 May 2017 Helen Gordon joined the Board as a non-executive Director from 1 January 2018
8988
Derwent London plc Report & Accounts 2017 Derwent London plc Report & Accounts 2017

Board of Directors1 The Hon. Robert A. Rayne, 69
Non-executive ChairmanAppointed to the Board: 2007Skills and expertise: Robert Rayne was Chief Executive Officer of London Merchant Securities plc and has been on the Boards of a number of public companies, including First Leisure Corporation plc and Crown Sports plc.Other current appointments: Non-executive Director of LMS Capital plc and Richoux Group plc and Chairman of Voreda Capital.
2 John D. Burns, 73Chief ExecutiveAppointed to the Board: 1984Skills and expertise: A chartered surveyor and founder of Derwent Valley Holdings in 1984, John has overall responsibility for Group strategy, business development and day-to-day operations. John is a past Chairman of the Westminster Property Association.Other current appointment: Member of the Strategic Board of the New West End Company Limited.
3 Damian M.A. Wisniewski, 56Finance DirectorAppointed to the Board: 2010Skills and expertise: Damian is a chartered accountant and, prior to joining Derwent London, he held senior finance roles at Treveria Asset Management, Wood Wharf Limited Partnership and Chelsfield plc. He has overall responsibility for financial strategy, treasury, taxation and financial reporting.Other current appointments: Trustee and member of the governing body at the Royal Academy of Music and non-executive Director at the Associated Board of the Royal Schools of Music.
4 Simon P. Silver, 67Executive DirectorAppointed to the Board: 1986Skills and expertise: Co-founder of Derwent Valley Holdings, Simon has overall responsibility for the Group’s development and regeneration programme together with the commissioning of architects. He is also at the forefront of the Company’s brand identity. He is an honorary fellow of the Royal Institute of British Architects.
5 Paul M. Williams, 57Executive DirectorAppointed to the Board: 1998Skills and expertise: Paul is a chartered surveyor who joined the Group in 1987. His responsibilities include portfolio asset management, major leasing
Other current appointment: Managing Director of Capital Advisors LimitedCommittees: Risk (chair), Audit, Nominations.
10 Claudia I. Arney, 47Non-executive DirectorAppointed to the Board: 2015Skills and expertise: Claudia was Group Managing Director of Emap until 2010. Prior to that she held senior roles at HM Treasury, Goldman Sachs and the Financial Times.Other current appointments: Chair of the Governance Committee of Aviva PLC, Chair of the Remuneration Committee of Halfords PLC, and a non-executive Director of the Premier League. Committees: Remuneration (chair), Audit.
11 Dame Cilla D. Snowball, 59Non-executive DirectorAppointed to the Board: 2015Skills and expertise: Cilla is Group Chairman and Group CEO at AMV BBDO and a past Chairman of the Advertising Association and past President of the Thirty Club.Other current appointments: Director of BBDO Worldwide and Chairman of the Women’s Business Council. Committees: Nominations, Risk.
12 Simon W.D. Fraser, 54Senior Independent DirectorAppointed to the Board: 2012Skills and expertise: Simon started his career in the City in 1986 and, from 1997 to his retirement in 2011, worked at Bank of America Merrill Lynch where from 2004 he was Managing Director and co-head of corporate broking. Here he led a variety of transactions including equity raisings and advised company boards on a range of issues.Other current appointments: Non-executive Director of Lancashire Holdings Limited, Cathedral Underwriting Limited and of Legal and General Investment Management Holdings and Trustee of Glyndebourne Estate. Committees: Nominations (chair), Audit, Remuneration.
13 Stephen G. Young, 62Non-executive DirectorAppointed to the Board: 2010Skills and expertise: Stephen is a chartered management accountant. Previously he has held a number of senior positions including Chief Executive of Meggitt PLC and Group Finance Director at Meggitt PLC, Thistle Hotels plc and the Automobile Association.Other current appointment: Non-executive Director of The Weir Group PLC.Committees: Audit (chair), Risk, Remuneration.
transactions, supervision of refurbishment and development projects and sustainability. Other current appointments: Director of The Paddington Partnership, Director of Sadler’s Wells Foundation and member of the Westminster Property Association.
6 Nigel Q. George, 54Executive DirectorAppointed to the Board: 1998Skills and expertise: Nigel is a chartered surveyor who joined the Group in 1988. His responsibilities include acquisitions and disposals and investment analysis.Other current appointment: Director of the Chancery Lane Association Limited.
7 David G. Silverman, 48Executive DirectorAppointed to the Board: 2008Skills and expertise: David is a chartered surveyor who joined the Group in 2002. His responsibilities include overseeing the Group’s investment acquisitions and disposals. David is a past Chairman of the Westminster Property Association.Other current appointment: Chairman of Chicken Shed Property Co.
8 Helen C. Gordon, 58 Non-executive DirectorAppointed to the Board: 2018Skills and expertise: Helen is a chartered surveyor and is Chief Executive Officer of Grainger plc. Previously, she was Global Head of Real Estate Asset Management of Royal Bank of Scotland plc and has held senior property positions at Legal & General Investment Management, Railtrack and John Laing Developments. Other current commitments: Chief Executive Officer of Grainger plc, Junior Vice President of the British Property Federation, Board Member of EPRA (European Public Real Estate Association).Committee: Remuneration.
9 Richard D.C. Dakin, 54Non-executive DirectorAppointed to the Board: 2013Skills and expertise: Richard has been Managing Director of Capital Advisors Limited, part of CBRE, since 2014. Previously, he had been employed at Lloyds Bank since 1982 where he undertook a variety of roles including commercial and corporate banking and leveraged finance, gaining extensive knowledge of property finance and the real estate sector. He is a Fellow of the Royal Institution of Chartered Surveyors and an Associate Member of Corporate Treasurers.
9190
Derwent London plc Report & Accounts 2017 Derwent London plc Report & Accounts 2017
4
13
1
2
10
12
5
11
8
3
9
7
6
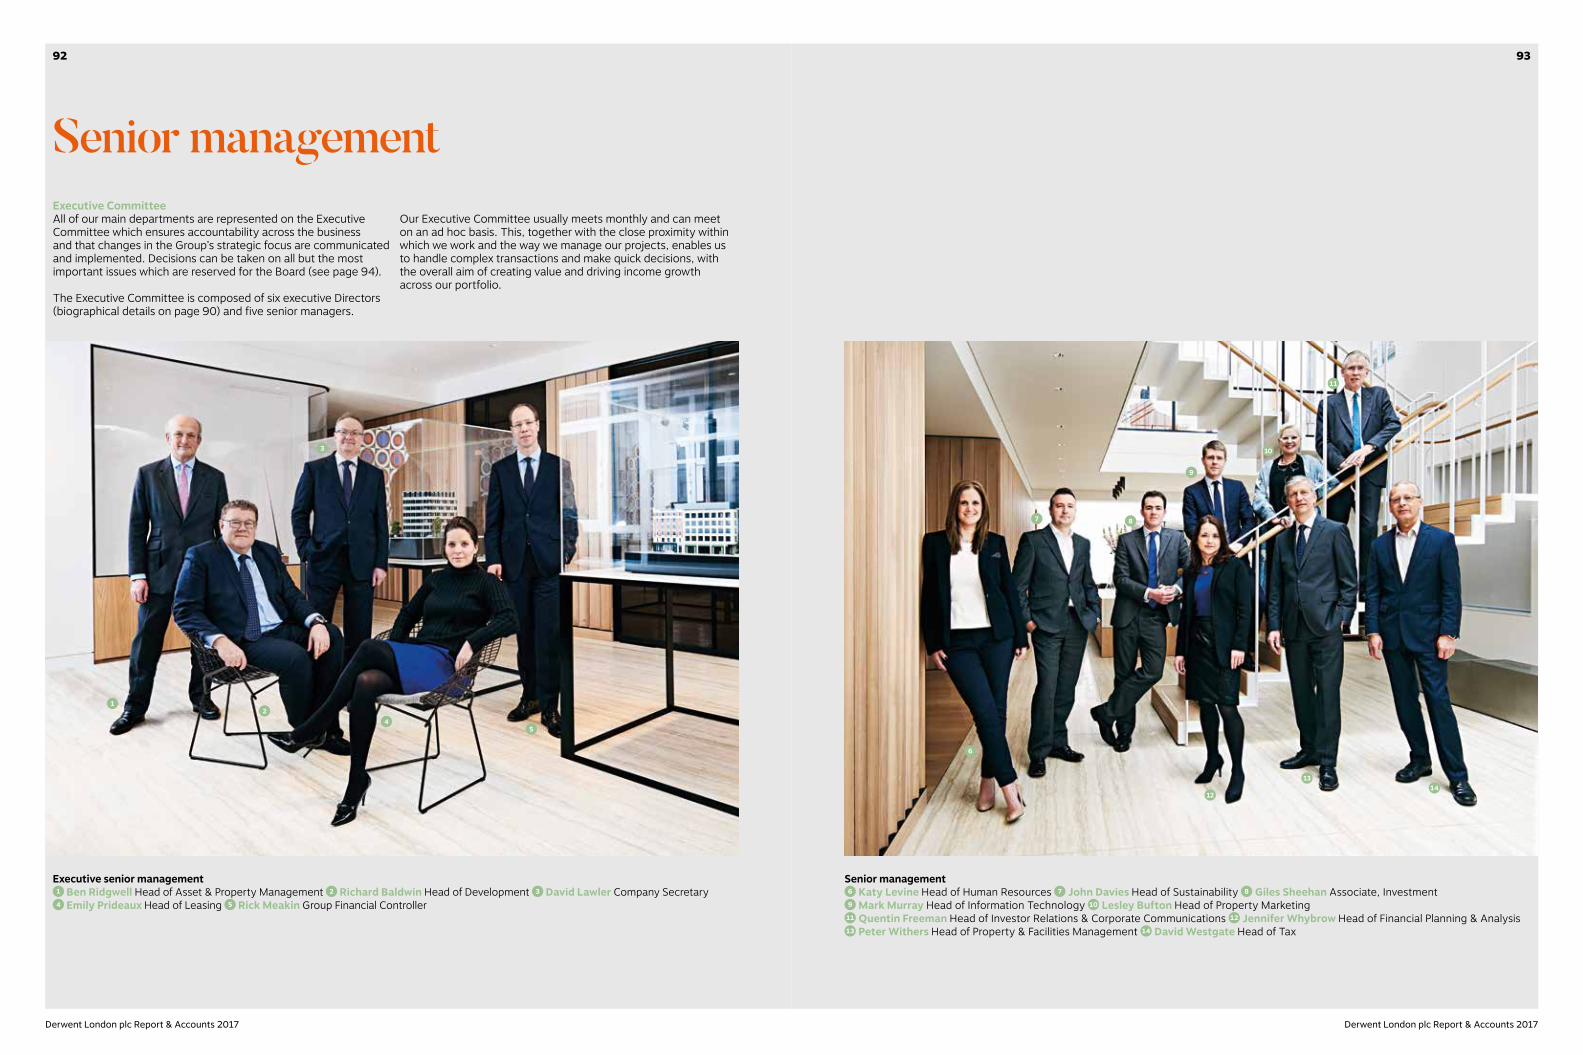
Senior managementExecutive CommitteeAll of our main departments are represented on the Executive Committee which ensures accountability across the business and that changes in the Group’s strategic focus are communicated and implemented. Decisions can be taken on all but the most important issues which are reserved for the Board (see page 94).
The Executive Committee is composed of six executive Directors (biographical details on page 90) and five senior managers.
Our Executive Committee usually meets monthly and can meet on an ad hoc basis. This, together with the close proximity within which we work and the way we manage our projects, enables us to handle complex transactions and make quick decisions, with the overall aim of creating value and driving income growth across our portfolio.
Senior management6 Katy Levine Head of Human Resources 7 John Davies Head of Sustainability 8 Giles Sheehan Associate, Investment 9 Mark Murray Head of Information Technology 10 Lesley Bufton Head of Property Marketing
11 Quentin Freeman Head of Investor Relations & Corporate Communications 12 Jennifer Whybrow Head of Financial Planning & Analysis 13 Peter Withers Head of Property & Facilities Management 14 David Westgate Head of Tax
Executive senior management1 Ben Ridgwell Head of Asset & Property Management 2 Richard Baldwin Head of Development 3 David Lawler Company Secretary 4 Emily Prideaux Head of Leasing 5 Rick Meakin Group Financial Controller
9392
Derwent London plc Report & Accounts 2017 Derwent London plc Report & Accounts 2017
11
3
21
4
7
14
6
9
12
8
10
13
5
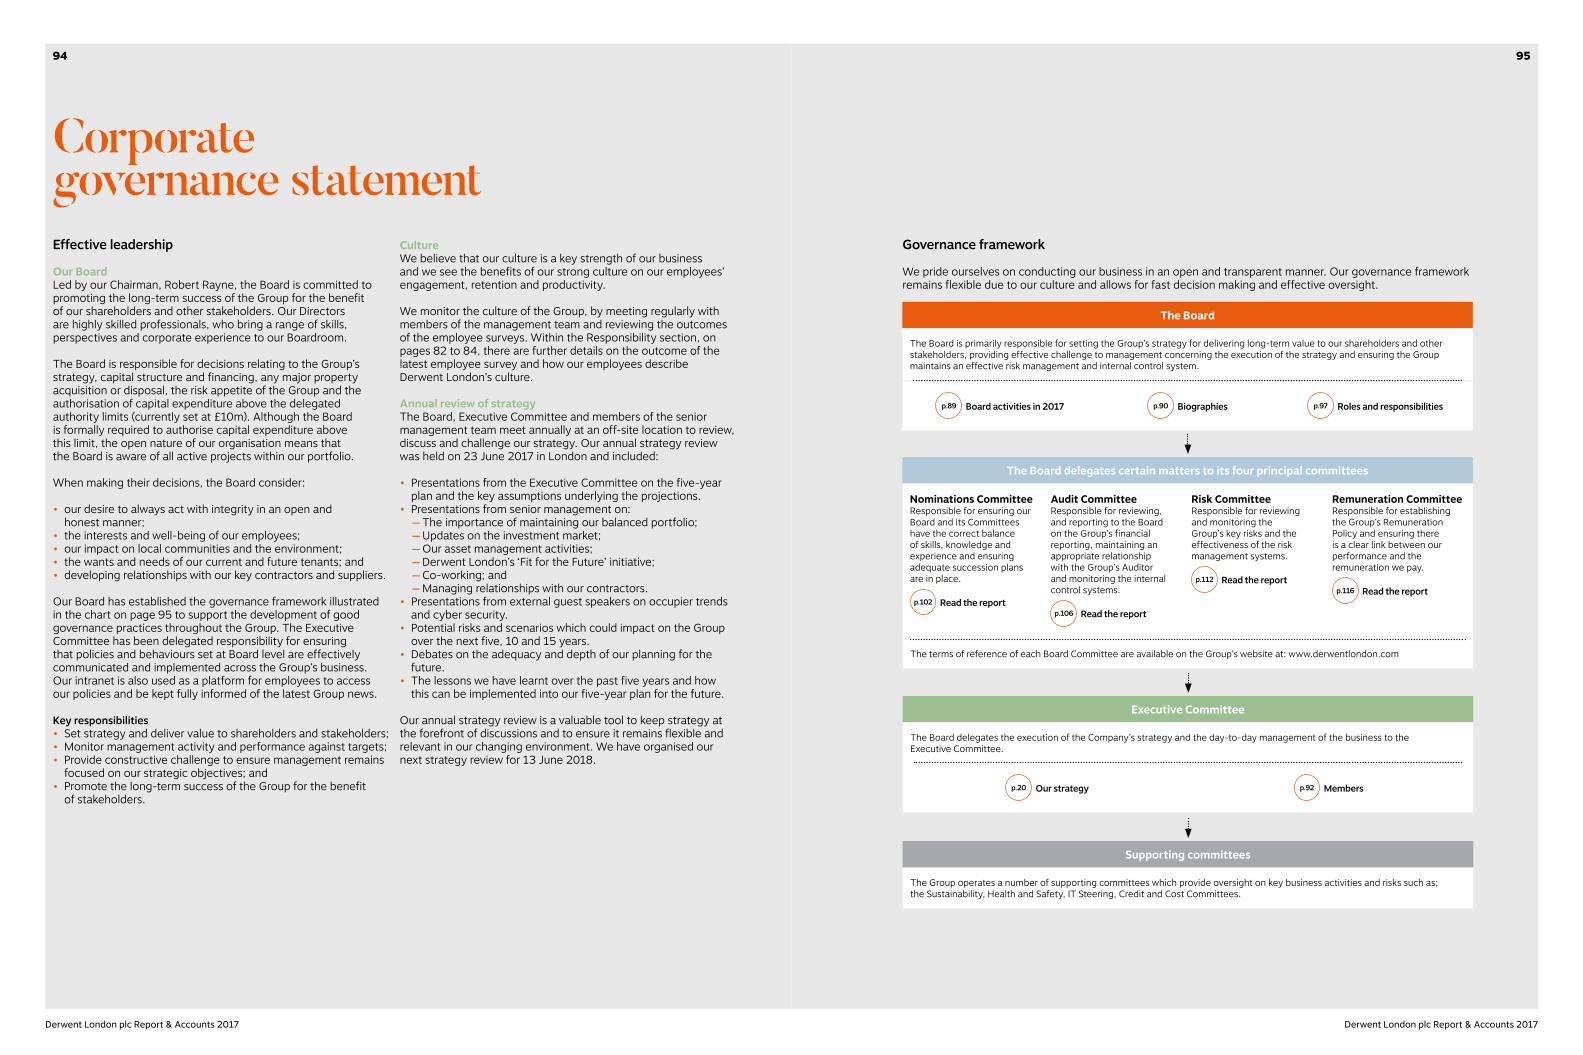
Corporate governance statementEffective leadership
Our BoardLed by our Chairman, Robert Rayne, the Board is committed to promoting the long-term success of the Group for the benefit of our shareholders and other stakeholders. Our Directors are highly skilled professionals, who bring a range of skills, perspectives and corporate experience to our Boardroom.
The Board is responsible for decisions relating to the Group’s strategy, capital structure and financing, any major property acquisition or disposal, the risk appetite of the Group and the authorisation of capital expenditure above the delegated authority limits (currently set at £10m). Although the Board is formally required to authorise capital expenditure above this limit, the open nature of our organisation means that the Board is aware of all active projects within our portfolio.
When making their decisions, the Board consider:
• our desire to always act with integrity in an open and honest manner;
• the interests and well-being of our employees;• our impact on local communities and the environment;• the wants and needs of our current and future tenants; and• developing relationships with our key contractors and suppliers.
Our Board has established the governance framework illustrated in the chart on page 95 to support the development of good governance practices throughout the Group. The Executive Committee has been delegated responsibility for ensuring that policies and behaviours set at Board level are effectively communicated and implemented across the Group’s business. Our intranet is also used as a platform for employees to access our policies and be kept fully informed of the latest Group news.
Key responsibilities• Set strategy and deliver value to shareholders and stakeholders;• Monitor management activity and performance against targets;• Provide constructive challenge to ensure management remains
focused on our strategic objectives; and• Promote the long-term success of the Group for the benefit
of stakeholders.
CultureWe believe that our culture is a key strength of our business and we see the benefits of our strong culture on our employees’ engagement, retention and productivity.
We monitor the culture of the Group, by meeting regularly with members of the management team and reviewing the outcomes of the employee surveys. Within the Responsibility section, on pages 82 to 84, there are further details on the outcome of the latest employee survey and how our employees describe Derwent London’s culture.
Annual review of strategyThe Board, Executive Committee and members of the senior management team meet annually at an off-site location to review, discuss and challenge our strategy. Our annual strategy review was held on 23 June 2017 in London and included:
• Presentations from the Executive Committee on the five-year plan and the key assumptions underlying the projections.
• Presentations from senior management on: –The importance of maintaining our balanced portfolio; –Updates on the investment market; –Our asset management activities; –Derwent London’s ‘Fit for the Future’ initiative; –Co-working; and –Managing relationships with our contractors.
• Presentations from external guest speakers on occupier trends and cyber security.
• Potential risks and scenarios which could impact on the Group over the next five, 10 and 15 years.
• Debates on the adequacy and depth of our planning for the future.
• The lessons we have learnt over the past five years and how this can be implemented into our five-year plan for the future.
Our annual strategy review is a valuable tool to keep strategy at the forefront of discussions and to ensure it remains flexible and relevant in our changing environment. We have organised our next strategy review for 13 June 2018.
Governance framework
We pride ourselves on conducting our business in an open and transparent manner. Our governance framework remains flexible due to our culture and allows for fast decision making and effective oversight.
The Board
The Board delegates certain matters to its four principal committees
Executive Committee
Supporting committees
The Board is primarily responsible for setting the Group’s strategy for delivering long-term value to our shareholders and other stakeholders, providing effective challenge to management concerning the execution of the strategy and ensuring the Group maintains an effective risk management and internal control system.
Nominations Committee Responsible for ensuring our Board and its Committees have the correct balance of skills, knowledge and experience and ensuring adequate succession plans are in place.
p.102 Read the report
Audit CommitteeResponsible for reviewing, and reporting to the Board on the Group’s financial reporting, maintaining an appropriate relationship with the Group’s Auditor and monitoring the internal control systems.
p.106 Read the report
Risk Committee Responsible for reviewing and monitoring the Group’s key risks and the effectiveness of the risk management systems.
p.112 Read the report
Remuneration Committee Responsible for establishing the Group’s Remuneration Policy and ensuring there is a clear link between our performance and the remuneration we pay.
p.116 Read the report
The Board delegates the execution of the Company’s strategy and the day-to-day management of the business to the Executive Committee.
The Group operates a number of supporting committees which provide oversight on key business activities and risks such as; the Sustainability, Health and Safety, IT Steering, Credit and Cost Committees.
p.89 Board activities in 2017 p.90 Biographies p.97 Roles and responsibilities
p.20 Our strategy p.92 Members
The terms of reference of each Board Committee are available on the Group’s website at: www.derwentlondon.com
9594
Derwent London plc Report & Accounts 2017 Derwent London plc Report & Accounts 2017
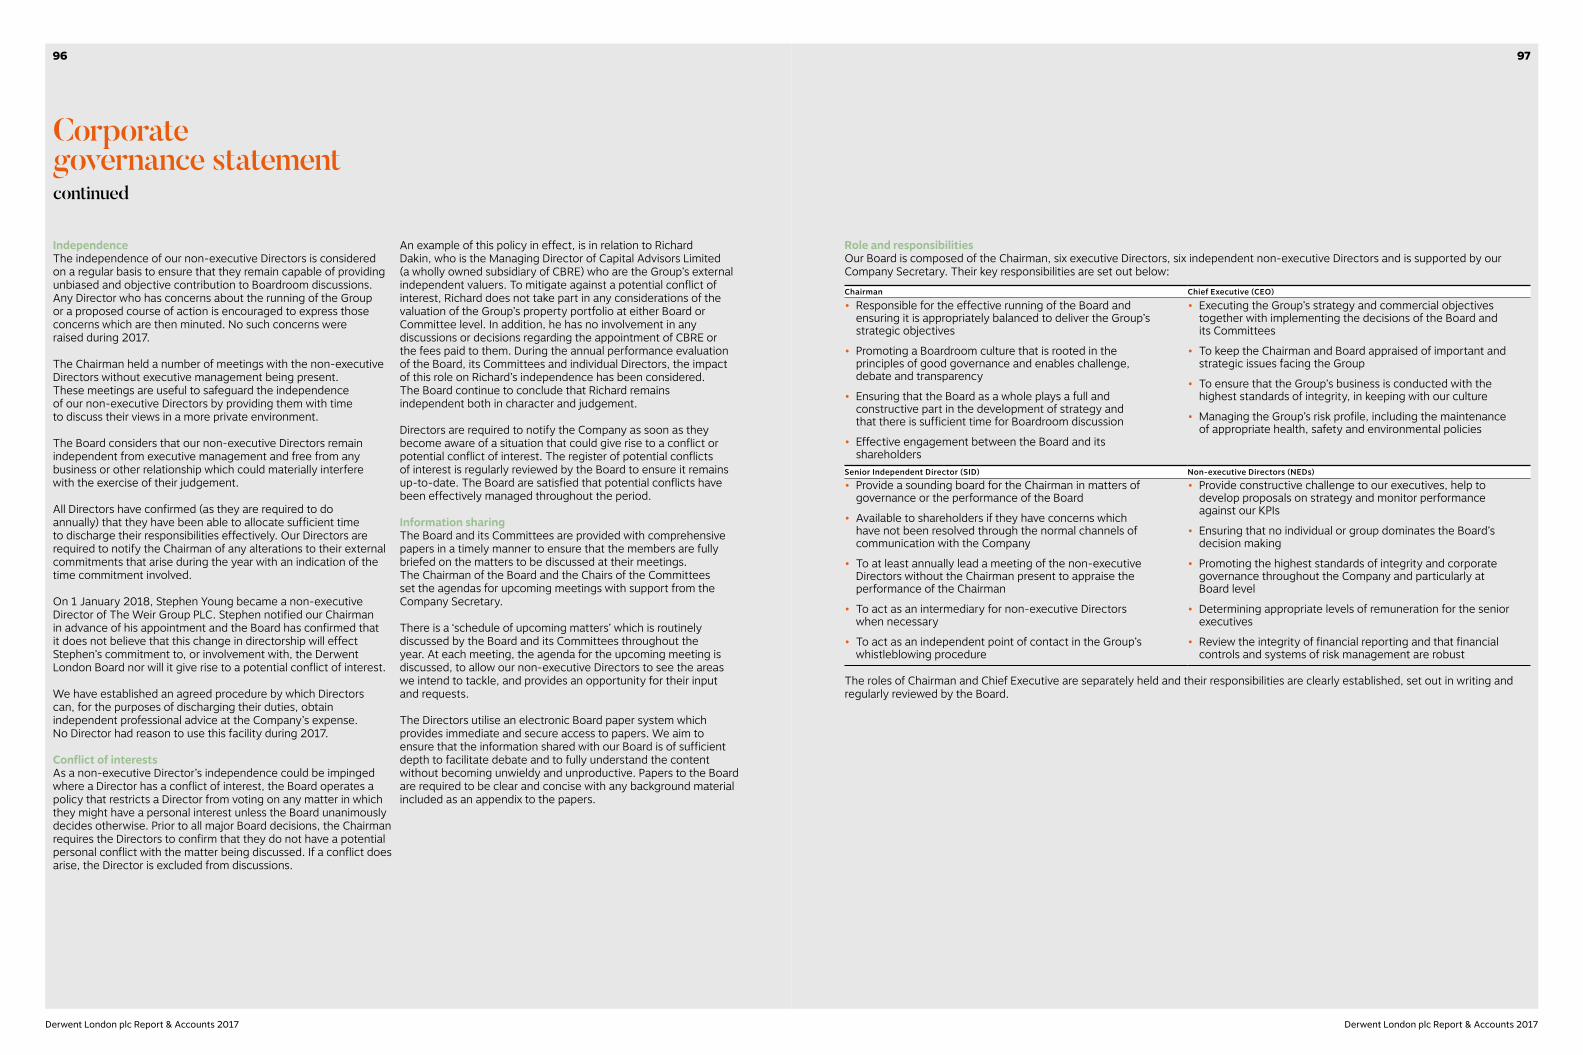
Independence The independence of our non-executive Directors is considered on a regular basis to ensure that they remain capable of providing unbiased and objective contribution to Boardroom discussions. Any Director who has concerns about the running of the Group or a proposed course of action is encouraged to express those concerns which are then minuted. No such concerns were raised during 2017.
The Chairman held a number of meetings with the non-executive Directors without executive management being present. These meetings are useful to safeguard the independence of our non-executive Directors by providing them with time to discuss their views in a more private environment.
The Board considers that our non-executive Directors remain independent from executive management and free from any business or other relationship which could materially interfere with the exercise of their judgement.
All Directors have confirmed (as they are required to do annually) that they have been able to allocate sufficient time to discharge their responsibilities effectively. Our Directors are required to notify the Chairman of any alterations to their external commitments that arise during the year with an indication of the time commitment involved.
On 1 January 2018, Stephen Young became a non-executive Director of The Weir Group PLC. Stephen notified our Chairman in advance of his appointment and the Board has confirmed that it does not believe that this change in directorship will effect Stephen’s commitment to, or involvement with, the Derwent London Board nor will it give rise to a potential conflict of interest.
We have established an agreed procedure by which Directors can, for the purposes of discharging their duties, obtain independent professional advice at the Company’s expense. No Director had reason to use this facility during 2017.
Conflict of interestsAs a non-executive Director’s independence could be impinged where a Director has a conflict of interest, the Board operates a policy that restricts a Director from voting on any matter in which they might have a personal interest unless the Board unanimously decides otherwise. Prior to all major Board decisions, the Chairman requires the Directors to confirm that they do not have a potential personal conflict with the matter being discussed. If a conflict does arise, the Director is excluded from discussions.
Role and responsibilitiesOur Board is composed of the Chairman, six executive Directors, six independent non-executive Directors and is supported by our Company Secretary. Their key responsibilities are set out below:Chairman Chief Executive (CEO)
• Responsible for the effective running of the Board and ensuring it is appropriately balanced to deliver the Group’s strategic objectives
• Promoting a Boardroom culture that is rooted in the principles of good governance and enables challenge, debate and transparency
• Ensuring that the Board as a whole plays a full and constructive part in the development of strategy and that there is sufficient time for Boardroom discussion
• Effective engagement between the Board and its shareholders
• Executing the Group’s strategy and commercial objectives together with implementing the decisions of the Board and its Committees
• To keep the Chairman and Board appraised of important and strategic issues facing the Group
• To ensure that the Group’s business is conducted with the highest standards of integrity, in keeping with our culture
• Managing the Group’s risk profile, including the maintenance of appropriate health, safety and environmental policies
Senior Independent Director (SID) Non-executive Directors (NEDs)
• Provide a sounding board for the Chairman in matters of governance or the performance of the Board
• Available to shareholders if they have concerns which have not been resolved through the normal channels of communication with the Company
• To at least annually lead a meeting of the non-executive Directors without the Chairman present to appraise the performance of the Chairman
• To act as an intermediary for non-executive Directors when necessary
• To act as an independent point of contact in the Group’s whistleblowing procedure
• Provide constructive challenge to our executives, help to develop proposals on strategy and monitor performance against our KPIs
• Ensuring that no individual or group dominates the Board’s decision making
• Promoting the highest standards of integrity and corporate governance throughout the Company and particularly at Board level
• Determining appropriate levels of remuneration for the senior executives
• Review the integrity of financial reporting and that financial controls and systems of risk management are robust
The roles of Chairman and Chief Executive are separately held and their responsibilities are clearly established, set out in writing and regularly reviewed by the Board.
An example of this policy in effect, is in relation to Richard Dakin, who is the Managing Director of Capital Advisors Limited (a wholly owned subsidiary of CBRE) who are the Group’s external independent valuers. To mitigate against a potential conflict of interest, Richard does not take part in any considerations of the valuation of the Group’s property portfolio at either Board or Committee level. In addition, he has no involvement in any discussions or decisions regarding the appointment of CBRE or the fees paid to them. During the annual performance evaluation of the Board, its Committees and individual Directors, the impact of this role on Richard’s independence has been considered. The Board continue to conclude that Richard remains independent both in character and judgement.
Directors are required to notify the Company as soon as they become aware of a situation that could give rise to a conflict or potential conflict of interest. The register of potential conflicts of interest is regularly reviewed by the Board to ensure it remains up-to-date. The Board are satisfied that potential conflicts have been effectively managed throughout the period.
Information sharingThe Board and its Committees are provided with comprehensive papers in a timely manner to ensure that the members are fully briefed on the matters to be discussed at their meetings. The Chairman of the Board and the Chairs of the Committees set the agendas for upcoming meetings with support from the Company Secretary.
There is a ‘schedule of upcoming matters’ which is routinely discussed by the Board and its Committees throughout the year. At each meeting, the agenda for the upcoming meeting is discussed, to allow our non-executive Directors to see the areas we intend to tackle, and provides an opportunity for their input and requests.
The Directors utilise an electronic Board paper system which provides immediate and secure access to papers. We aim to ensure that the information shared with our Board is of sufficient depth to facilitate debate and to fully understand the content without becoming unwieldy and unproductive. Papers to the Board are required to be clear and concise with any background material included as an appendix to the papers.
Corporate governance statementcontinued
9796
Derwent London plc Report & Accounts 2017 Derwent London plc Report & Accounts 2017

Risk management framework
How we identify risk
Risks are identified through workshop debates between the Executive Committee and members of senior management, analytical techniques, independent reviews and use of historical data and lessons learnt.
At the Board’s strategy review on 23 June 2017, scenarios for the future were considered which assisted with the identification of potential risks and how they could impact on our strategy (see page 94). The continuous review of strategy and our environment, ensures that we do not become complacent and that we respond in a timely manner to any changes.
How we assess risk
Following the identification of a potential risk, the Executive Committee undertake a detailed assessment process to:
• gain sufficient understanding of the risk to allow an effective and efficient mitigation strategy to be determined;• allow the root cause of risks to be identified;• estimate the probability of the risk occurring and the potential quantitative and qualitative impacts; and• understand the Group’s current exposure to the risk and the ‘target risk profile’ which will be achieved following the completion
of mitigation plans.
How we monitor risk
Once a risk has been identified and assessed, a risk owner is assigned who is considered to be in the best position to influence and monitor the outcome of the risk.
As part of our risk management procedures, the Executive Committee and Risk Committee routinely conduct monitoring exercises to ensure that risk management activities are being consistently applied across the Group, that they remain sufficiently robust and to identify any weaknesses or enhancements which could be made to the procedures.
Monitoring activities include:
• the regular review and updating of risks and the risk registers;• independent third-party reviews of the risk management process to provide further assurance of its effectiveness;• alerting the Board to new risks and changes to existing risks;• monitoring how the risk profile is changing for the Group; and• providing assurance that risks are being managed effectively and where any assurance gaps are in existence, identifiable
action plans are being implemented.
How we respond to risk
We implement controls and procedures in response to identified risks with the aim of reducing our risk exposure, so that it is aligned or below our risk appetite. The mitigation plans in place for our principal risks are described in greater detail on pages 36 to 43.
Overview of risk appetite:Category Risk toleranceOperational risks
Operational risks include health and safety risks, continuity of the IT systems and retention of the senior management team.
Health and safety LowIT continuity LowStaff retention Medium
Financial risk Other than market-driven movements that are beyond the Group’s immediate control, the Group will not generally accept risks where it is probable that:
• Asset values decline by more than £100m from the Group’s annual budget;• EPRA profit before tax deviates by more than £5m from the Group’s annual budget;• Cost overruns occur on capital projects of more than 5% of the approved capex
budget; and• The Group’s interest cover ratio will fall to within 20% of the level set in the
Group’s borrowing covenants. It is recognised that inherent market risk may result in these financial tolerances, in particular the assets limit, being exceeded. The Board accepts this market risk but seeks to manage and mitigate its impact where possible.
REIT status LowCredit rating LowDecrease in asset value MediumProfits MediumCost overruns MediumInterest cover Medium
Reputational risk
The Group has a low tolerance for risk in connection with reputational risk. In particular, this level of risk tolerance relates to any action that could adversely affect the Derwent London brand.
Brand value Low
Regulatory risk The Group’s tolerance for regulatory risk arising from statute or the UK Corporate Governance Code and from adherence to ‘best practice’ guides.
Statutory LowGovernance Low
Corporate governance statementcontinued
Risk management
Our Board have ultimate responsibility for ensuring the Group have robust risk identification and management procedures in place. The diagram on page 113 illustrates the Group’s risk management structure and how certain risk management activities are delegated to the level that is most capable of overseeing and managing the risks.
The Group’s risk tolerance is set by the Board and is the level of risk we are willing to accept to achieve our strategic objectives. Our overall risk tolerance is low and is contained in our Risk Appetite Statement (see the table below for an overview of this statement). This tolerance, alongside our culture, informs how our staff respond to risk. Due to our openness and collaborative work style, any potential problem, risk or issue is identified quickly so appropriate action can be taken.
Our approach to risk management is based on the International Risk Management Standard ISO31000 and consists of a Risk Management Policy, Risk Appetite Statement and Risk Management Process Document.
At Derwent London, our risk management activities span three focus areas:
• Corporate governance: Protecting our shareholders’ and stakeholders’ interests and to discharge our legal responsibilities;
• Operations: Ensure service delivery is maintained and the long-term viability of the Group; and
• Projects: Ensure that projects are delivered to the required standard, on time, on budget and in accordance with our high standards.
p.34 An overview of the Group’s risk profile
p.36 Principal risks facing the Group
p.112 Risk Committee’s report
DefibrillatorsAs part of our proactive approach to risk management, we decided to install equipment in our managed properties to provide an immediate response to cardiac arrest. With 30,000 people sustaining cardiac arrest each year, a person’s chance of survival falls by approximately 10% for each minute that passes without defibrillation. We installed defibrillator units in the 20 locations where we have a trained on-site resource, which provides our tenants with assurance that we are taking steps to counter such a common medical occurrence. Weekly inspections of the defibrillators are carried out and our staff received training on their use.
9998
Derwent London plc Report & Accounts 2017 Derwent London plc Report & Accounts 2017
Our performance, training and development
Evaluation On an annual basis, an evaluation process is undertaken which considers the effectiveness of the Board, its Committees and individual Directors. This review identifies areas for improvement, informs training plans for our Directors and identifies areas of knowledge, expertise or diversity which should be considered in our succession plans.
The evaluation for the year ended 31 December 2016, was conducted in Q1 2017 and externally facilitated by Lintstock, an independent third party which carries out no other work for the Company. As part of this process, Lintstock conducted confidential interviews with each member of the Board. The Board felt that the interview process allowed matters to be discussed in greater detail and for areas of potential improvement to surface through debate. We anticipate that our next externally facilitated review will be conducted in Q1 2020.
In Q1 2018, the evaluation was completed using a questionnaire which focused on the key themes which arose from the 2017 externally facilitated review. The responses were collated and provided on an anonymous basis to the Chairman of the Board and the Chairs of the Committees. As a result of this evaluation, the Board is satisfied that its structure, balance of skills and operation continues to be satisfactory and appropriate for the Group.
The Board has identified a number of areas which it wishes to focus upon during 2018, including people and talent management, our gender pay gap, succession planning at Board level, our investment programme and compliance matters including General Data Protection Regulation (GDPR).
Training and developmentWith the ever-changing dynamic environment in which Derwent London operates, it is important for our executive and non-executive Directors to remain aware of recent, and upcoming, developments. We require all Directors to keep their knowledge and skills up-to-date and include training discussions with the Chairman in our annual performance reviews.
As required, we invite professional advisers to provide in-depth updates. Updates and training is not solely reserved for legislative developments but aims to cover a range of issues including, but not limited to, market developments and trends, economic, environmental and social considerations. Our Company Secretary provides regular updates to the Board and its Committees on regulatory and corporate governance matters.
During 2018 we have organised presentations for the Board and its Committees on the following topic areas:
• cyber risk management;• regular Audit Committee training sessions (which will include
an update on accounting standards); and• executive remuneration trends and best practice.
All Directors have access to the services of the Company Secretary and any Director may instigate an agreed procedure whereby independent professional advice may be sought at the Company’s expense.
Corporate governance statementcontinued
Engaging with our shareholders
We recognise the importance of clear communication and proactive engagement with our shareholders. A summary of our shareholder engagement programme has been provided below.
Investor meetingsDuring 2017, the Group held over 250 investor meetings with 170 existing and potential investors. Of these, 73 were shareholders at the year end and their ownership represented over 60% of the shares in issue.
Investor meetings are predominantly attended by our CEO, Finance Director and at least one other senior executive. The meetings focused on the Group’s portfolio, strategy and the London office outlook. Where significant views were expressed, either during or following the meetings, these were recorded and circulated to all Directors. In 2017, we held our first sustainability roadshow in the Netherlands.
A calendar of our main shareholder events in 2017January Property conference in LondonFebruary 2016 results presentationMarch Roadshows (Netherlands and UK)
Property conferences (London and New York)Salesforce presentations
April Salesforce presentationMay Annual General Meeting (AGM)
2017 Q1 Business updateSalesforce presentationsSustainability roadshow (Netherlands)
June Property conferences (Amsterdam, Dublin and London)July –August 2017 H1 Results presentation
Roadshow (UK)September Roadshow (Netherlands)
Property conferences (London and New York)October –November 2017 Q3 Business update
Equity conferences (London)Salesforce presentation
December Property conference (Cape Town)
If shareholders have any concerns, which the normal channels of communication to the CEO, Finance Director or Chairman have failed to resolve, or for which contact is inappropriate, then our Senior Independent Director, Simon Fraser, is available to address them.
Institutional shareholders and fund managersOur senior executives maintain regular contact with institutional shareholders and fund managers, through presentations and visits to our Group’s property assets. In 2017, we hosted 60 property tours. The Board receives regular reports on these meetings which includes a summary of any significant issues raised by the shareholders.
Property conferencesIn 2017 we attended 13 property conferences in London, Amsterdam, New York, Cape Town and Dublin.
Remuneration consultationDuring 2016, as part of our comprehensive review of our remuneration structure, we consulted a number of our major shareholders. The Remuneration Committee was grateful for the feedback received which was incorporated into our final Remuneration Policy which received 98.40% votes in favour at our 2017 AGM. The Committee continues to encourage an open and constructive dialogue with shareholders and their representative bodies.
Annual General Meeting (AGM)Our 2017 AGM was held on 19 May 2017 and we were delighted to receive in excess of 89% votes in favour for all of our resolutions. The 2018 AGM is to be held on 18 May at The Westbury hotel, Bond Street, London W1S 2YF and we encourage our shareholders to attend. The AGM provides an opportunity for private shareholders in particular to question the Directors and the Chair of each of the Board Committees.
Annual reportOur annual report and accounts is available to all shareholders. Through our electronic communication initiatives, we aim to make our annual report as accessible as possible for our shareholders, who can opt to receive a hard copy in the post or PDF copies via email or from our website.
Corporate websiteThe Group’s website, www.derwentlondon.com, has a dedicated investor section which includes our annual reports, results presentations (which are made to analysts and investors at the time of the interim and full year results) and our financial and dividend calendar for the upcoming year.
We create websites for specific developments which are used to explain the Group’s current activities in greater detail. For example, you can find further information on the Brunel Building and 80 Charlotte Street here:
• www.brunelbuilding.com • www.80charlottestreet.com
Debtholder engagementOur Finance Director, Damian Wisniewski, hosts the annual meeting of the holders of the London Merchant Securities Limited £175m 6.50% secured bonds 2026 in May or June each year.
Key contacts for our shareholdersWe have included contact details for our Investor Relations Team, Company Secretary and our Registrars on page 210.
101100
Derwent London plc Report & Accounts 2017 Derwent London plc Report & Accounts 2017
Nominations Committee report
Committee membership and attendance
IndependentNumber
of meetings AttendanceSimon Fraser, Chair Yes 4 100%Richard Dakin Yes 4 100%Cilla Snowball Yes 4 100%
The Committee’s role and responsibilities are set out in the terms of reference which are available on the Company’s website at: www.derwentlondon.com/investors/governance/board-committees
Dear Shareholder,I am pleased to present to you the report of the work of the Nominations Committee for 2017.
2017 has been a busy year for the Committee with particular focus on the recruitment of a new independent non-executive Director (NED) following Stuart Corbyn’s decision to step down from the Board in May.
Helen Gordon was our preferred candidate following a rigorous recruitment process and we are delighted that she has joined us. Helen has undergone a comprehensive induction programme which we describe in full on page 103.
In addition to our recruitment activities, we continued to consider succession planning at Board and executive level; further information can be found on page 104 of this report.
The Board will monitor the actions arising from the Company’s second Group-wide employee survey which was conducted in the latter part of 2017 and is described in more detail on pages 82 to 84. We were pleased to note that the overall job satisfaction score was high at 96%.
During 2018, the Committee will continue to focus on succession planning and will review the reappointment of three of our non-executive Directors as they approach the end of their current three-year appointments.
If you wish to discuss any aspect of the Committee’s activities, I will be attending the upcoming AGM on 18 May 2018 and would welcome your questions. I am also available via our Company Secretary, David Lawler (telephone: +44 (0)20 7659 3000 or email: [email protected]).
Simon FraserChair of the Nominations Committee 27 February 2018
Committee compositionOur Committee consists of three independent non-executive Directors. At the request of the Committee, members of the Executive Committee, senior management team and external advisers may be invited to attend all or part of any meeting, as and when appropriate.
Meetings of the Committee During the year under review, the Committee held four meetings (in May, August, November and December) which occurred either before or after a scheduled Board meeting (2016: two meetings).
Board composition As part of the Board’s annual effectiveness review, described on page 101, the Committee considers the composition of the Board and its Committees in terms of its balance of skills, experience, length of service, knowledge of the Group and wider diversity considerations. This review held particular importance in 2017 as it formed the basis for the development of our NED specification which we shared with recruitment specialists, Spencer Stuart, to assist us in sourcing NED candidates.
The skills and experience that we felt would add particular benefit to the Board was an independent non-executive candidate with extensive real estate sector knowledge and executive experience.
The membership of the Committees continues to be appropriate and in accordance with best practice and the UK Corporate Governance Code. Consideration has been given to the Committee(s) which Helen Gordon would join following her appointment. The Committee considered Helen’s skills and experience and recommended that she become a member of the Remuneration Committee.
Recruitment of a new NEDThe Committee led the process to recruit a non-executive Director with support from the entire Board. Spencer Stuart were chosen as our executive search providers due to their specialist knowledge of recruiting at Board level. Spencer Stuart has no other connection with the Group and is a signatory to the Voluntary Code of Conduct of Executive Search Firms.
Spencer Stuart provided a long list of potential candidates and first stage interviews were conducted by the Chair of the Committee. A final shortlist of three candidates was selected for final stage interviews with the Committee members, CEO and Chairman of the Board.
The Committee was unanimous in their final recommendation to the Board of Helen Gordon for the role of non-executive Director, and were delighted to welcome Helen to our Boardroom in January 2018. Helen is an excellent match for our requirements.
p.90 Helen’s full biography p.133 Our policy on NED fees
Focus areas for 2018• Continue to focus on succession planning• Monitor the induction programme for Helen Gordon• Review the reappointment of three of our NEDs as they approach the
end of their current three-year appointments
Induction aims• Gain an insight into the Derwent London portfolio and how
we aim to generate long-term value for our stakeholders• Meet with the Executive Committee and senior management
to understand the day-to-day operations of the business and the culture of the Group
• Have discussions with the CEO on our KPIs, strategic objectives, business model and our plans for the future
We aim to limit the amount of information provided as reading material during an induction process. Helen was provided with access to our electronic Board paper system and Group intranet which provided easy and immediate access to the following key documents:
• The Group’s risk register;• Our 2018 budget and five-year plan;• Recent broker reports and feedback from our shareholder
engagement programme;• Information on our sustainability initiatives;• Recent reports from the external Auditor, PwC; and• Matters reserved for the Board and Committee Terms
of Reference.
Key Induction events5 January 2018 Site tours around our properties within
the Tech Belt with insights provided by our senior management team
9 January 2018 Individual meetings with members of the Executive Committee
19 January 2018 Site tours of our Fitzrovia, Angel and Paddington properties with insights provided by our senior management team
2 February 2018 Meeting with our corporate lawyers, Slaughter & May LLP
14 February 2018 Meeting with the CEO and Finance Director to discuss the implementation of strategy and our plans for the futurePresentations on our key developments in construction: 80 Charlotte Street, Brunel Building and Soho Place W1Individual meetings with members of the Executive Committee
To be arranged in advance of the next Remuneration Committee meeting
Meeting with Claudia Arney, Chair of the Remuneration Committee, to gain an overview of how our Remuneration Policy ensures a clear link between performance and pay for executives
Helen GordonNon-executive Director
Simon Fraser Chair of the Nominations Committee
103102
Derwent London plc Report & Accounts 2017 Derwent London plc Report & Accounts 2017
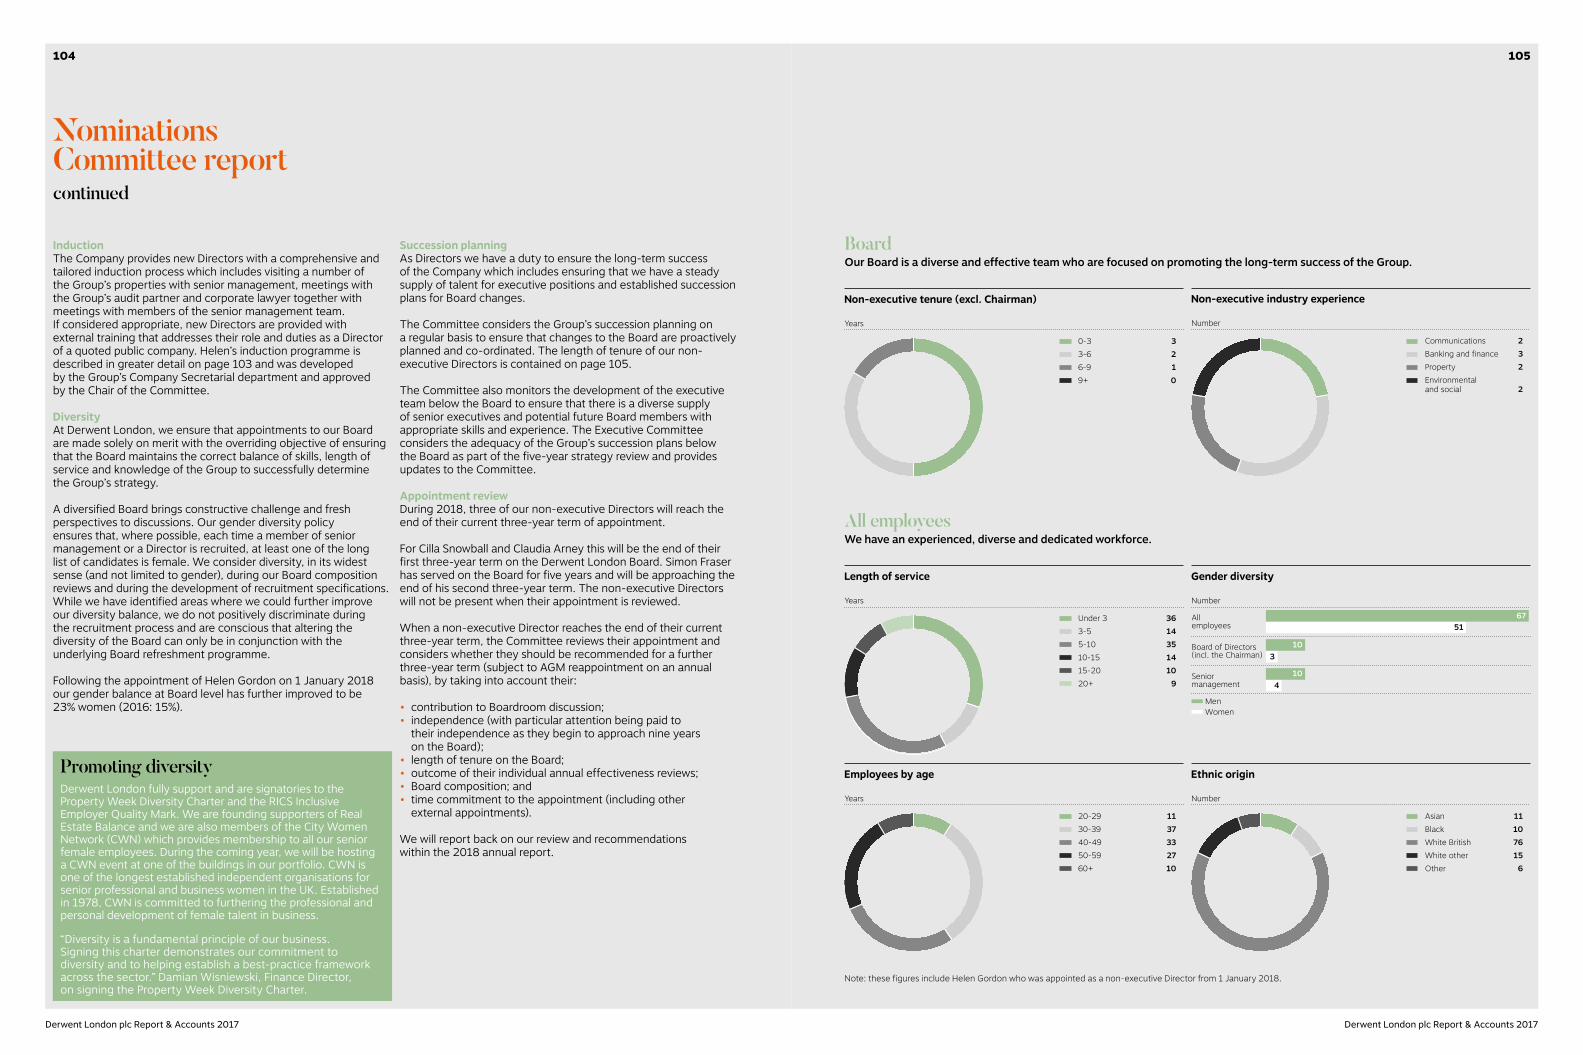
InductionThe Company provides new Directors with a comprehensive and tailored induction process which includes visiting a number of the Group’s properties with senior management, meetings with the Group’s audit partner and corporate lawyer together with meetings with members of the senior management team. If considered appropriate, new Directors are provided with external training that addresses their role and duties as a Director of a quoted public company. Helen’s induction programme is described in greater detail on page 103 and was developed by the Group’s Company Secretarial department and approved by the Chair of the Committee.
DiversityAt Derwent London, we ensure that appointments to our Board are made solely on merit with the overriding objective of ensuring that the Board maintains the correct balance of skills, length of service and knowledge of the Group to successfully determine the Group’s strategy.
A diversified Board brings constructive challenge and fresh perspectives to discussions. Our gender diversity policy ensures that, where possible, each time a member of senior management or a Director is recruited, at least one of the long list of candidates is female. We consider diversity, in its widest sense (and not limited to gender), during our Board composition reviews and during the development of recruitment specifications. While we have identified areas where we could further improve our diversity balance, we do not positively discriminate during the recruitment process and are conscious that altering the diversity of the Board can only be in conjunction with the underlying Board refreshment programme.
Following the appointment of Helen Gordon on 1 January 2018 our gender balance at Board level has further improved to be 23% women (2016: 15%).
Succession planningAs Directors we have a duty to ensure the long-term success of the Company which includes ensuring that we have a steady supply of talent for executive positions and established succession plans for Board changes.
The Committee considers the Group’s succession planning on a regular basis to ensure that changes to the Board are proactively planned and co-ordinated. The length of tenure of our non-executive Directors is contained on page 105.
The Committee also monitors the development of the executive team below the Board to ensure that there is a diverse supply of senior executives and potential future Board members with appropriate skills and experience. The Executive Committee considers the adequacy of the Group’s succession plans below the Board as part of the five-year strategy review and provides updates to the Committee.
Appointment reviewDuring 2018, three of our non-executive Directors will reach the end of their current three-year term of appointment.
For Cilla Snowball and Claudia Arney this will be the end of their first three-year term on the Derwent London Board. Simon Fraser has served on the Board for five years and will be approaching the end of his second three-year term. The non-executive Directors will not be present when their appointment is reviewed.
When a non-executive Director reaches the end of their current three-year term, the Committee reviews their appointment and considers whether they should be recommended for a further three-year term (subject to AGM reappointment on an annual basis), by taking into account their:
• contribution to Boardroom discussion;• independence (with particular attention being paid to
their independence as they begin to approach nine years on the Board);
• length of tenure on the Board;• outcome of their individual annual effectiveness reviews;• Board composition; and• time commitment to the appointment (including other
external appointments).
We will report back on our review and recommendations within the 2018 annual report.
Board Our Board is a diverse and effective team who are focused on promoting the long-term success of the Group.
Nominations Committee report continued
Non-executive tenure (excl. Chairman)
0-3 33-6 26-9 19+ 0
Years
Length of service
Under 3 363-5 145-10 3510-15 1415-20 1020+ 9
Years
Employees by age
20-29 1130-39 3740-49 3350-59 2760+ 10
Years
Gender diversity
MenWomen
All employees
Board of Directors(incl. the Chairman)
Senior management
67 51
10 3
10 4
Number
Non-executive industry experience
Communications 2Banking and finance 3Property 2Environmentaland social 2
Number
Ethnic origin
Asian 11Black 10White British 76White other 15Other 6
Number
All employeesWe have an experienced, diverse and dedicated workforce.
Note: these figures include Helen Gordon who was appointed as a non-executive Director from 1 January 2018.
Promoting diversityDerwent London fully support and are signatories to the Property Week Diversity Charter and the RICS Inclusive Employer Quality Mark. We are founding supporters of Real Estate Balance and we are also members of the City Women Network (CWN) which provides membership to all our senior female employees. During the coming year, we will be hosting a CWN event at one of the buildings in our portfolio. CWN is one of the longest established independent organisations for senior professional and business women in the UK. Established in 1978, CWN is committed to furthering the professional and personal development of female talent in business.
“Diversity is a fundamental principle of our business. Signing this charter demonstrates our commitment to diversity and to helping establish a best-practice framework across the sector.” Damian Wisniewski, Finance Director, on signing the Property Week Diversity Charter.
105104
Derwent London plc Report & Accounts 2017 Derwent London plc Report & Accounts 2017
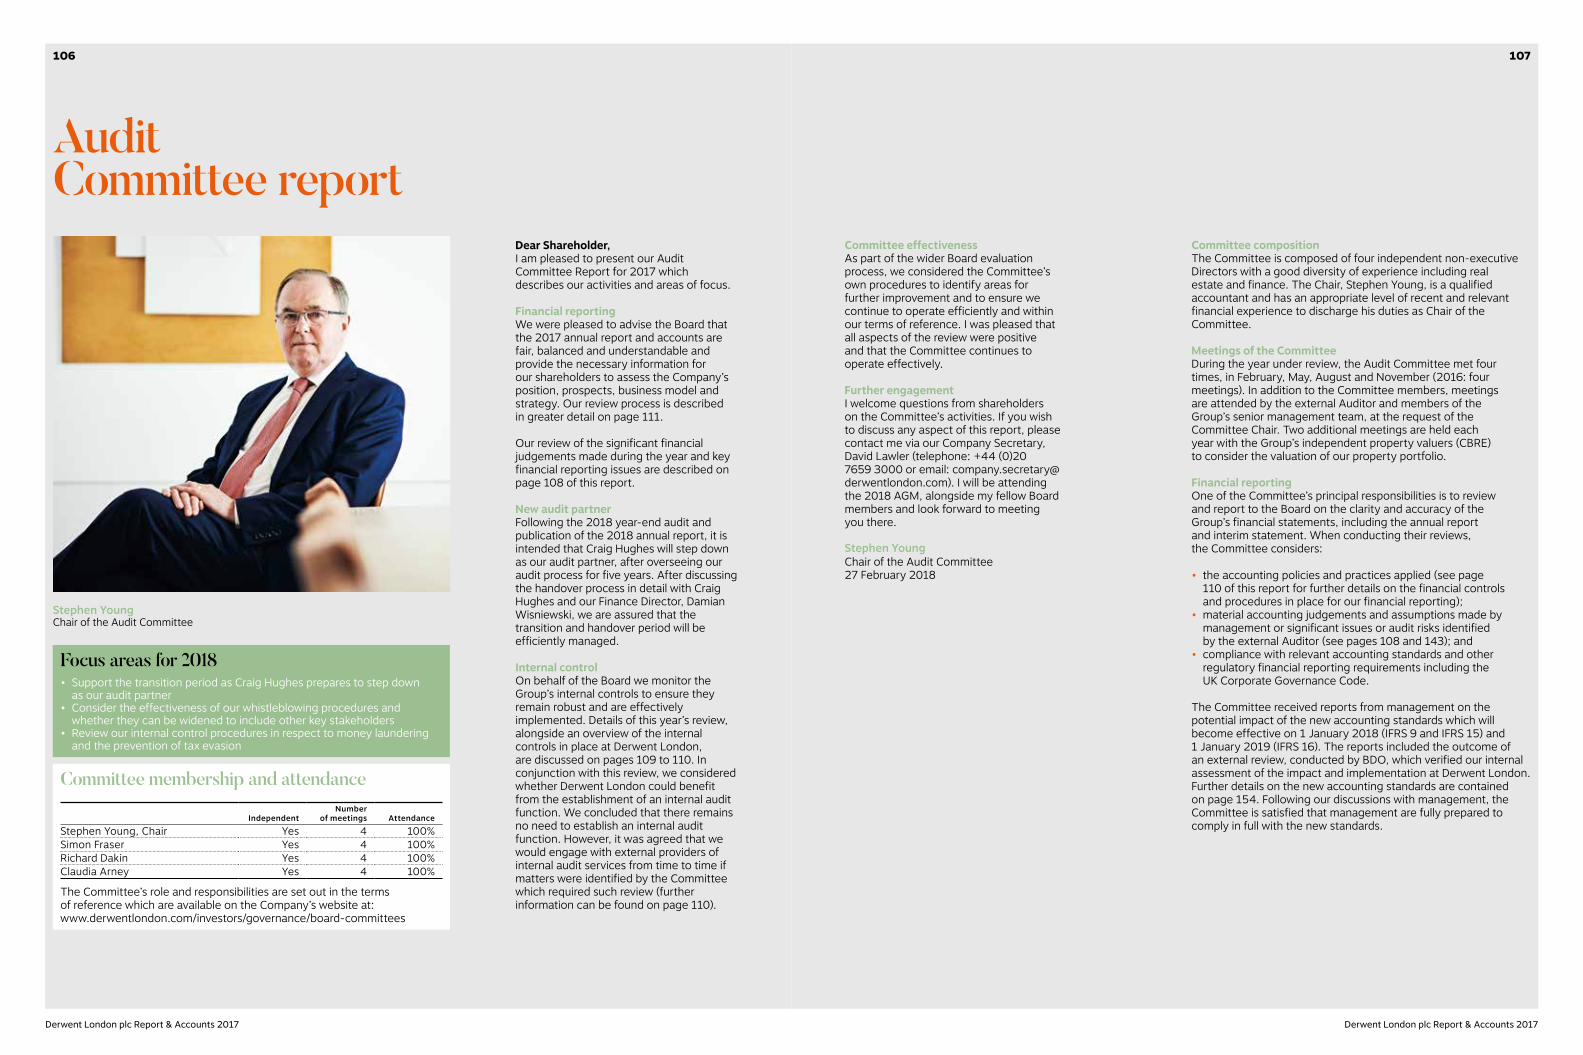
Audit Committee report
Dear Shareholder,I am pleased to present our Audit Committee Report for 2017 which describes our activities and areas of focus.
Financial reporting We were pleased to advise the Board that the 2017 annual report and accounts are fair, balanced and understandable and provide the necessary information for our shareholders to assess the Company’s position, prospects, business model and strategy. Our review process is described in greater detail on page 111.
Our review of the significant financial judgements made during the year and key financial reporting issues are described on page 108 of this report.
New audit partnerFollowing the 2018 year-end audit and publication of the 2018 annual report, it is intended that Craig Hughes will step down as our audit partner, after overseeing our audit process for five years. After discussing the handover process in detail with Craig Hughes and our Finance Director, Damian Wisniewski, we are assured that the transition and handover period will be efficiently managed.
Internal controlOn behalf of the Board we monitor the Group’s internal controls to ensure they remain robust and are effectively implemented. Details of this year’s review, alongside an overview of the internal controls in place at Derwent London, are discussed on pages 109 to 110. In conjunction with this review, we considered whether Derwent London could benefit from the establishment of an internal audit function. We concluded that there remains no need to establish an internal audit function. However, it was agreed that we would engage with external providers of internal audit services from time to time if matters were identified by the Committee which required such review (further information can be found on page 110).
Committee effectivenessAs part of the wider Board evaluation process, we considered the Committee’s own procedures to identify areas for further improvement and to ensure we continue to operate efficiently and within our terms of reference. I was pleased that all aspects of the review were positive and that the Committee continues to operate effectively.
Further engagementI welcome questions from shareholders on the Committee’s activities. If you wish to discuss any aspect of this report, please contact me via our Company Secretary, David Lawler (telephone: +44 (0)20 7659 3000 or email: [email protected]). I will be attending the 2018 AGM, alongside my fellow Board members and look forward to meeting you there.
Stephen YoungChair of the Audit Committee 27 February 2018
Committee compositionThe Committee is composed of four independent non-executive Directors with a good diversity of experience including real estate and finance. The Chair, Stephen Young, is a qualified accountant and has an appropriate level of recent and relevant financial experience to discharge his duties as Chair of the Committee.
Meetings of the CommitteeDuring the year under review, the Audit Committee met four times, in February, May, August and November (2016: four meetings). In addition to the Committee members, meetings are attended by the external Auditor and members of the Group’s senior management team, at the request of the Committee Chair. Two additional meetings are held each year with the Group’s independent property valuers (CBRE) to consider the valuation of our property portfolio.
Financial reporting One of the Committee’s principal responsibilities is to review and report to the Board on the clarity and accuracy of the Group’s financial statements, including the annual report and interim statement. When conducting their reviews, the Committee considers:
• the accounting policies and practices applied (see page 110 of this report for further details on the financial controls and procedures in place for our financial reporting);
• material accounting judgements and assumptions made by management or significant issues or audit risks identified by the external Auditor (see pages 108 and 143); and
• compliance with relevant accounting standards and other regulatory financial reporting requirements including the UK Corporate Governance Code.
The Committee received reports from management on the potential impact of the new accounting standards which will become effective on 1 January 2018 (IFRS 9 and IFRS 15) and 1 January 2019 (IFRS 16). The reports included the outcome of an external review, conducted by BDO, which verified our internal assessment of the impact and implementation at Derwent London. Further details on the new accounting standards are contained on page 154. Following our discussions with management, the Committee is satisfied that management are fully prepared to comply in full with the new standards.
Committee membership and attendance
IndependentNumber
of meetings AttendanceStephen Young, Chair Yes 4 100%Simon Fraser Yes 4 100%Richard Dakin Yes 4 100%Claudia Arney Yes 4 100%
The Committee’s role and responsibilities are set out in the terms of reference which are available on the Company’s website at: www.derwentlondon.com/investors/governance/board-committees
Focus areas for 2018• Support the transition period as Craig Hughes prepares to step down
as our audit partner• Consider the effectiveness of our whistleblowing procedures and
whether they can be widened to include other key stakeholders• Review our internal control procedures in respect to money laundering
and the prevention of tax evasion
Stephen Young Chair of the Audit Committee
107106
Derwent London plc Report & Accounts 2017 Derwent London plc Report & Accounts 2017
Audit Committee reportcontinued
Significant financial judgements Any key accounting issues or judgements made by management are monitored and discussed with the Committee throughout the year. The table below provides information on the key issues discussed with the Committee in 2017 and the judgements adopted.
Key issues JudgementValuation of the Group’s property portfolio
The Committee considers this to be the major area of judgement in determining the accuracy of the financial statements as it is the principal component in determining the Group’s net asset value. The procedures detailed below enabled the Committee to be satisfied with the assumptions and judgements used in the valuation of the Group’s property portfolio.
Taxation and REIT compliance
The Committee was aware that, should the Group not comply with the REIT regulations, it could incur tax penalties or ultimately be expelled from the REIT regime which would have a significant effect on the financial statements. The Committee noted the frequency with which compliance with the regulations was reported to the Board and considered the margin by which the Group complied. Based on this and the level of headroom shown in the latest Group forecasts the Committee agreed that, once again, no further action was required for the current year.
Borrowings and derivatives
Calculation of the fair values of the Group’s financial instruments, such as the 2019 convertible bonds and interest rate swaps, was seen as an area of elevated risk. The Committee noted that the valuations were carried out by an independent third party which had valued the instruments in previous years and that the Auditor used its own treasury specialists to reperform the valuation and to assess the reasonableness thereof. The Auditor subsequently confirmed that no issues had arisen relating to the valuation. The Committee was satisfied with the level of assurance gained from these procedures.
Working with the AuditorThe external Auditor (the lead audit partner and their team) attends the Committee’s meetings to provide insight and challenge and to present their reports on the review of the half-year results and audit of the year end financial statements. To further facilitate open dialogue and assurance, the Committee holds private sessions with the Auditor without members of management being present.
The Committee received a training update from PwC in November 2017 which was tailored to the Committee’s requests and covered areas such as corporate reporting best practice, non-financial reporting, risk reporting and viability. The Committee agreed that the session provided a valuable overview of key issues and requested that a further training session be organised in 2018.
Annual review of the external Auditor Following the year end audit, the Committee assessed the effectiveness of the external Auditor. The assessment took into account the views of senior management and was supported by a questionnaire which covered the Auditor’s resources, objectivity, character, knowledge, organisation, judgements and quality of reporting.
As part of their review, the Committee reviewed the audit plan, which was focused on risk and materiality, and considered the quality of the planning, whether the agreed plan had been met, the extent to which it was tailored to our business and its ability to respond to any changes in the business.
An important aspect of managing the external Auditor relationship is ensuring there are adequate safeguards to protect Auditor objectivity and independence. In assessing this matter the Committee considered the following:
• The Auditor’s independence letter which annually confirms their independence and compliance with the Financial Reporting Council’s (FRC) Ethical Standard.
• The operation, and compliance with, the Group’s policy on non-audit work being performed by the Auditor.
• The tenure of the external Auditor and the lead audit partner.• How the Auditor identified risks to audit quality and how these
were addressed, including the network level controls the Auditor relied upon.
• The outcome of the FRC’s inspection of PwC’s audit quality.
After taking all of these matters into account, the Committee concluded that PwC had performed their audit effectively, efficiently and to a high quality. Accordingly, the Committee has recommended to the Board that PwC be reappointed as Auditor to the Group for the year ending 31 December 2018. Any feedback arising from the annual assessment will be discussed with the external Auditor for implementation into the audit plan for the next year end audit.
Non-audit servicesThe objective of maintaining the Non-Audit Services Policy is to ensure that the provision of such services do not impair the external Auditor’s independence or objectivity. During 2017, PwC provided non-audit services which totalled £43,715 which includes the review of our half-year results (2016: £38,500).
Overview of our Non-Audit Services PolicyUnder the policy, all services provided by the external Auditor (other than the audit itself) are regarded as non-audit services. Our policy draws a distinction between permissible services (which could be provided subject to conditions set by the Committee) and prohibited services (which may not be provided by the external Auditor except in exceptional circumstances when the Auditor has been provided approval by the Financial Conduct Authority). The type of non-audit services deemed to be permissible include: assurance work on non-financial data, tax services including tax advisory, and reporting best practice.
The Committee has provided pre-approval which allows management to appoint the external Auditor to conduct permissible non-audit services if they fall below a set fee level. The Committee review the pre-approval limit on an annual basis and it is currently set at £25,000. Permissible services which are above the pre-approval limit require approval from at least two members of the Audit Committee (including the Committee Chair). When considering if the services should be approved, the Committee will ensure that the Auditor’s objectivity and independence are not threatened. Any non-audit service provided by the external Auditor is reported to the Board. In the unlikely event that the provision of non-audit services would exceed £100,000, the Committee would request Board approval.
Internal controlOn an ongoing basis, the Committee reviews the adequacy and effectiveness of the Group’s system of internal financial controls which are described briefly in the table on page 110.
While Derwent London is a large business in terms of the size of its balance sheet and market capitalisation, we are relatively small when considering the number of people working directly in the business. Almost all of our staff work in the same building and are in close proximity to our Executive Committee members, making close supervision and monitoring easy to apply. Our Group structure is organised to be simple and transparent and our internal control procedures and policies are well established, reviewed annually and subject to external verification from our advisers.
The Committee received detailed reports on the operation and effectiveness of the internal controls from members of the senior management team. The outcome of the external audits (at half year and year end) are reviewed in respect to our internal controls. The Committee also receives updates on the policies and procedures in place and how these are being communicated to and complied with by our staff.
ValuationThe value of our property portfolio is reviewed for our interim and year end results and, as at 31 December 2017, was independently valued at £4.9 billion and principally consists of 87 properties in 13 ‘villages’ across London.
Valuing our portfolio is a significant part of how we assess our success as it underlies our net asset value and subsequently our total return (a KPI – see page 31 – and a performance measure for our executive Directors’ variable remuneration). Due to its significance, the Committee monitors the objectivity and independence of CBRE (our independent property valuers) and host the valuation meetings, without management being present.
The valuation meetings typically occur in February and July prior to the main Audit Committee meetings and, due to his position as Managing Director of Capital Advisors Limited, a wholly-owned subsidiary of CBRE Limited, Richard Dakin does not take part in discussions regarding the valuation of the Group’s property portfolio (further information is provided on page 96).
Key matters discussed during the meetings include the assumptions underlying the valuation, any valuation which required a greater level of judgement than normal, for example development properties, and any valuation movements that were not broadly in line with that of the Investment Property Databank (IPD) benchmark. The assumptions are discussed with the external Auditor and an update on the matters discussed at the meetings are provided to the Board.
External AuditorThe Committee has primary responsibility for overseeing the relationship with the external Auditor including annually assessing their performance, effectiveness and independence and recommending to the Board their reappointment or removal.
Following a comprehensive tender in 2014, PricewaterhouseCoopers LLP (PwC) were appointed as the Group’s Auditor. Prior to this appointment, BDO had been the Group’s Auditor since 1985. The Committee anticipates that the next competitive tender will be conducted no later than 2024 in accordance with current regulation that requires a tender every 10 years. There are no contractual obligations which restrict the Committee’s choice of Auditor or a minimum appointment period.
Craig Hughes will reach the end of his term as audit partner following the 2018 year end audit. The Committee will meet with the new audit partner during the year and will work alongside Craig and our Finance Director to ensure a smooth handover and induction process. The first audit under the supervision of our new audit partner will be the 2019 year end audit.
The Company has complied with the provisions of the Competition and Markets Authority’s Order for the financial year under review in respect to audit tendering and the provision of non-audit services.
£’000 2017 2016Audit of Derwent London plc and subsidiaries 340 330Review of interim results 40 39Other non-audit services 4 0Total fees 384 369
109108
Derwent London plc Report & Accounts 2017 Derwent London plc Report & Accounts 2017
The Committee remains satisfied that the review of internal controls did not reveal any significant weaknesses and they continue to operate effectively. During 2018, the Committee will review the controls on money laundering and the prevention of tax evasion and policies on non-audit services and whistleblowing.Overview of internal controlsGovernance framework
Our governance framework (shown on page 95) supports effective internal control through an approved schedule of matters reserved for decision by the Board and the Executive Committee, supported by defined responsibilities, levels of authority and supporting committees.
Financial reviews and internal procedures
We have comprehensive systems of financial reporting and forecasting which are conducted frequently during the year and include both sensitivity and variance analysis. An annual budgeting exercise is carried out with three rolling forecasts prepared during the year. A five-year strategic review is prepared annually. Break-even and sensitivity analyses are included in both the five-year strategic review and the rolling forecasts.
Risk identification and monitoring
The Risk Committee regularly reviews the Group’s risk register, the schedule of key controls and key risk indicators, for financial and non-financial risks, throughout the year. The schedule of key controls provides evidence of how the controls are being operated and their effectiveness. Our risk management procedures are robust and include initiatives such as a ‘tenant at risk’ register and a back-up IT facility. The Risk Committee report is on pages 112 to 115.
Training and staff awareness
Staff compliance with internal policies are routinely confirmed to the Committee. Staff are aware of the delegated authority limits set by the Board and confirm their understanding of our internal policies which are contained on our Group intranet and in our staff handbook. Staff have six-monthly performance reviews with any training requirements identified and fulfilled within six months. The Group operates a whistleblowing policy which includes access to an external helpline.
External verification
During the year, no matters had been raised by PwC as a result of their controls testing undertaken as part of the annual audit. The Group’s VAT procedures are subject to ongoing periodic review by external advisers. Comprehensive reviews of the Group’s financial controls have also been undertaken with assistance from external advisers. Regular annual credit ratings, including risk assessments, are conducted by Standard & Poor’s. Each year, at renewal, a comprehensive review of the Group’s insurance cover is prepared by its independent insurance adviser.
Internal auditOn an annual basis the Committee considers whether Derwent London would benefit from the establishment of an internal audit function. At their November 2017 meeting, the Committee held discussions on this issue and requested external clarification of which FTSE 250 companies in our sector did have internal audit functions.
In February 2018, the Committee reviewed the Group’s working practices and, due to the relatively small scale and level of complexity of the organisation, the focused nature of the Group’s business and the close involvement of Directors in day-to-day operations, concluded there remains no need to establish an internal audit function. For areas where a high degree of specialist knowledge is required or where there are higher risks, the Committee agreed that external assurance will be sought.
WhistleblowingAs a business we seek to conduct ourselves with honesty and integrity and believe that it is our duty to take appropriate measures to identify and remedy any malpractice within or affecting the Company. All of our employees embrace our high standards of conduct and are encouraged to speak out if they witness any wrongdoing which falls short of those standards.
Our whistleblowing procedures are included within our staff handbook which is provided to all new members of staff and published on our Group intranet and on staff noticeboards. Following our last internal review of the procedures, it was agreed that our Senior Independent Director would act as an independent point of contact for whistleblowing concerns. The Committee felt that having the Senior Independent Director as a point of contact for serious concerns added brevity and independent oversight to the procedures and reassures our employees that their concerns would be handled with sufficient seniority.
Our whistleblowing policy ensures that any significant issues relating to potential fraud, are escalated to the Chair of the Committee immediately. The Committee receives updates from the Company Secretary on the operation of the whistleblowing system. During the year under review, we did not receive any whistleblowing messages (2016: no messages).
The Committee will consider the effectiveness of our whistleblowing procedures during the coming year and will consider whether other key stakeholders could be included in their scope.
Review of the 2017 annual reportAt the request of the Board, the Committee was asked to review the Group’s annual report and accounts and to consider whether, taken as a whole, they were fair, balanced and understandable. In carrying out this review, and subsequently reporting its opinion to the Board, the Committee had regard to the following:
Fairness and balance• Is the report open and honest, are we reporting on our
weaknesses, difficulties and challenges alongside our successes and opportunities?
• Do we provide clear explanations of our KPIs and is there strong linkage between our KPIs and our strategy?
• Do we show our progress over time and is there consistency in our metrics and measurements?
Understandable• Do we explain our business model, strategy and accounting
policies simply using precise and clear language?• Do we break up lengthy narrative with quotes, tables, case
studies and graphics?• Do we have a consistent tone across the annual report?• Are we clearly ‘signposting’ to where additional information
can be found?
Specific consideration for the 2017 annual report• The strategic report was restructured to provide clearer
explanation and linkage between our strategy, business model and KPIs
• The presentation of our business model has been revised to provide greater clarity on how we generate value (see page 18)
• A new Responsibility section has been created which combines our sustainability and corporate responsibility reporting and includes additional information on our corporate culture and stakeholder engagement, how we conduct our business and our focus on health and safety (see pages 72 to 85).
The Committee paid particular attention to these changes to ensure they did not impact on the balance and clarity of the annual report. Following its review, the Committee confirmed to the Board that the 2017 annual report is fair, balanced and provides sufficient clarity for shareholders to understand our business model, strategy and performance.
Viability statementWe have reviewed the process and assessment of the Company’s prospects and viability made by management for the next five years which formed the basis for the viability statement contained on page 35 of the Risk report. Detailed below is an overview of the process.Approach DetailsTime period The Committee challenged management as to whether the five-year time period adopted remains appropriate. Strategic review and sensitivity analysis
A detailed five-year strategic review was conducted which considers the Group’s cash flows, dividend cover, REIT compliance and other key financial ratios over the period. These metrics are subjected to sensitivity analysis to assess the impact of the principal risks to the Group’s ability to deliver its strategic objectives, which are set out on pages 36 to 43, both individually and in unison.
Stress testing our risk resilience
The model was stress tested to consider its resilience specifically to those risks that, if they occurred, were likely to have a significant impact on the Group’s solvency and liquidity over the five-year review period. These risks were identified as those that would affect property values, the availability of finance or the Group’s cash flow and a scenario was modelled that assumed a severe decrease in property values combined with significant letting delays at the Group’s developments and a decrease in rental income. The starting point for the scenario testing has been substantially helped by the actions taken in 2017 to increase recurring earnings and further reduce our loan-to-value (LTV) ratio to only 13.2%, its lowest level for many years. The assumptions were considered extreme but none of the key metrics were breached with our LTV ratio remaining below 50% and net interest cover staying above 280%.
Stress testing our business model
Our business model was also stress tested for a fall in property values. As a result of the substantial £473m of property disposals in 2017 and our actions to grow recurring earnings, NAV gearing was down to 15.7% at December 2017 and interest cover was increased to 4.54 times. In addition, our cash and available undrawn facilities grew to £523m meaning that our committed development pipeline was fully funded. The stress testing established that, all other assumptions remaining unchanged, it would take a fall in values in excess of 65% to cause the Group to breach its financing covenants.
Brexit As a predominantly London-based Group we are particularly susceptible to changes which can adversely impact on London’s future prosperity. We considered a range of Brexit negotiation outcomes and their potential impact on our business model, strategy and viability. Although an adverse Brexit settlement for London would negatively impact on our business, it would be unlikely to affect the long-term viability of the Group.
Review of financing requirements
A comprehensive review of the financing requirements of the Group over the five-year period was carried out, having regard to the level of unutilised facilities at the year end and the assumptions in the five-year review concerning capital recycling.
Audit Committee reportcontinued
111110
Derwent London plc Report & Accounts 2017 Derwent London plc Report & Accounts 2017
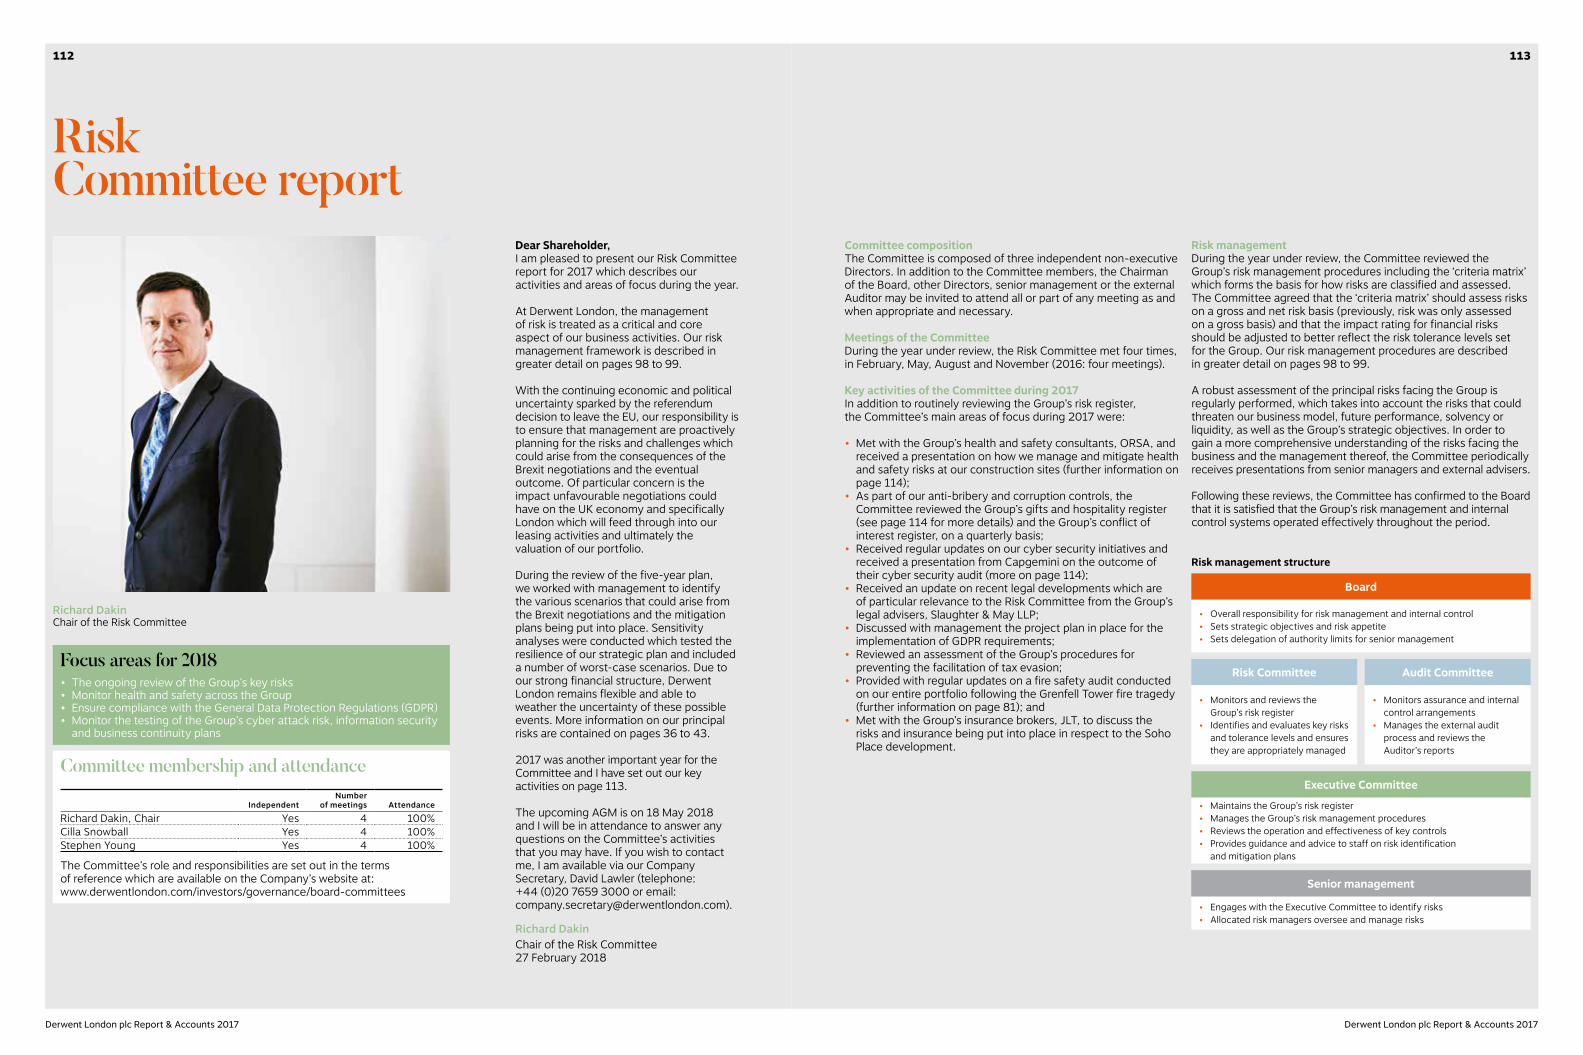
Risk Committee report
Dear Shareholder,I am pleased to present our Risk Committee report for 2017 which describes our activities and areas of focus during the year.
At Derwent London, the management of risk is treated as a critical and core aspect of our business activities. Our risk management framework is described in greater detail on pages 98 to 99.
With the continuing economic and political uncertainty sparked by the referendum decision to leave the EU, our responsibility is to ensure that management are proactively planning for the risks and challenges which could arise from the consequences of the Brexit negotiations and the eventual outcome. Of particular concern is the impact unfavourable negotiations could have on the UK economy and specifically London which will feed through into our leasing activities and ultimately the valuation of our portfolio.
During the review of the five-year plan, we worked with management to identify the various scenarios that could arise from the Brexit negotiations and the mitigation plans being put into place. Sensitivity analyses were conducted which tested the resilience of our strategic plan and included a number of worst-case scenarios. Due to our strong financial structure, Derwent London remains flexible and able to weather the uncertainty of these possible events. More information on our principal risks are contained on pages 36 to 43.
2017 was another important year for the Committee and I have set out our key activities on page 113.
The upcoming AGM is on 18 May 2018 and I will be in attendance to answer any questions on the Committee’s activities that you may have. If you wish to contact me, I am available via our Company Secretary, David Lawler (telephone: +44 (0)20 7659 3000 or email: [email protected]).
Richard DakinChair of the Risk Committee 27 February 2018
Risk managementDuring the year under review, the Committee reviewed the Group’s risk management procedures including the ‘criteria matrix’ which forms the basis for how risks are classified and assessed. The Committee agreed that the ‘criteria matrix’ should assess risks on a gross and net risk basis (previously, risk was only assessed on a gross basis) and that the impact rating for financial risks should be adjusted to better reflect the risk tolerance levels set for the Group. Our risk management procedures are described in greater detail on pages 98 to 99.
A robust assessment of the principal risks facing the Group is regularly performed, which takes into account the risks that could threaten our business model, future performance, solvency or liquidity, as well as the Group’s strategic objectives. In order to gain a more comprehensive understanding of the risks facing the business and the management thereof, the Committee periodically receives presentations from senior managers and external advisers.
Following these reviews, the Committee has confirmed to the Board that it is satisfied that the Group’s risk management and internal control systems operated effectively throughout the period.
Committee membership and attendance
IndependentNumber
of meetings Attendance
Richard Dakin, Chair Yes 4 100%Cilla Snowball Yes 4 100%Stephen Young Yes 4 100%
The Committee’s role and responsibilities are set out in the terms of reference which are available on the Company’s website at: www.derwentlondon.com/investors/governance/board-committees
Committee compositionThe Committee is composed of three independent non-executive Directors. In addition to the Committee members, the Chairman of the Board, other Directors, senior management or the external Auditor may be invited to attend all or part of any meeting as and when appropriate and necessary.
Meetings of the CommitteeDuring the year under review, the Risk Committee met four times, in February, May, August and November (2016: four meetings).
Key activities of the Committee during 2017In addition to routinely reviewing the Group’s risk register, the Committee’s main areas of focus during 2017 were:
• Met with the Group’s health and safety consultants, ORSA, and received a presentation on how we manage and mitigate health and safety risks at our construction sites (further information on page 114);
• As part of our anti-bribery and corruption controls, the Committee reviewed the Group’s gifts and hospitality register (see page 114 for more details) and the Group’s conflict of interest register, on a quarterly basis;
• Received regular updates on our cyber security initiatives and received a presentation from Capgemini on the outcome of their cyber security audit (more on page 114);
• Received an update on recent legal developments which are of particular relevance to the Risk Committee from the Group’s legal advisers, Slaughter & May LLP;
• Discussed with management the project plan in place for the implementation of GDPR requirements;
• Reviewed an assessment of the Group’s procedures for preventing the facilitation of tax evasion;
• Provided with regular updates on a fire safety audit conducted on our entire portfolio following the Grenfell Tower fire tragedy (further information on page 81); and
• Met with the Group’s insurance brokers, JLT, to discuss the risks and insurance being put into place in respect to the Soho Place development.
Focus areas for 2018• The ongoing review of the Group’s key risks• Monitor health and safety across the Group• Ensure compliance with the General Data Protection Regulations (GDPR)• Monitor the testing of the Group’s cyber attack risk, information security
and business continuity plans
Board
Executive Committee
Senior management
Risk Committee Audit Committee
• Overall responsibility for risk management and internal control• Sets strategic objectives and risk appetite• Sets delegation of authority limits for senior management
• Maintains the Group’s risk register• Manages the Group’s risk management procedures• Reviews the operation and effectiveness of key controls• Provides guidance and advice to staff on risk identification
and mitigation plans
• Engages with the Executive Committee to identify risks• Allocated risk managers oversee and manage risks
• Monitors and reviews the Group’s risk register
• Identifies and evaluates key risks and tolerance levels and ensures they are appropriately managed
• Monitors assurance and internal control arrangements
• Manages the external audit process and reviews the Auditor’s reports
Risk management structure
Richard Dakin Chair of the Risk Committee
113112
Derwent London plc Report & Accounts 2017 Derwent London plc Report & Accounts 2017
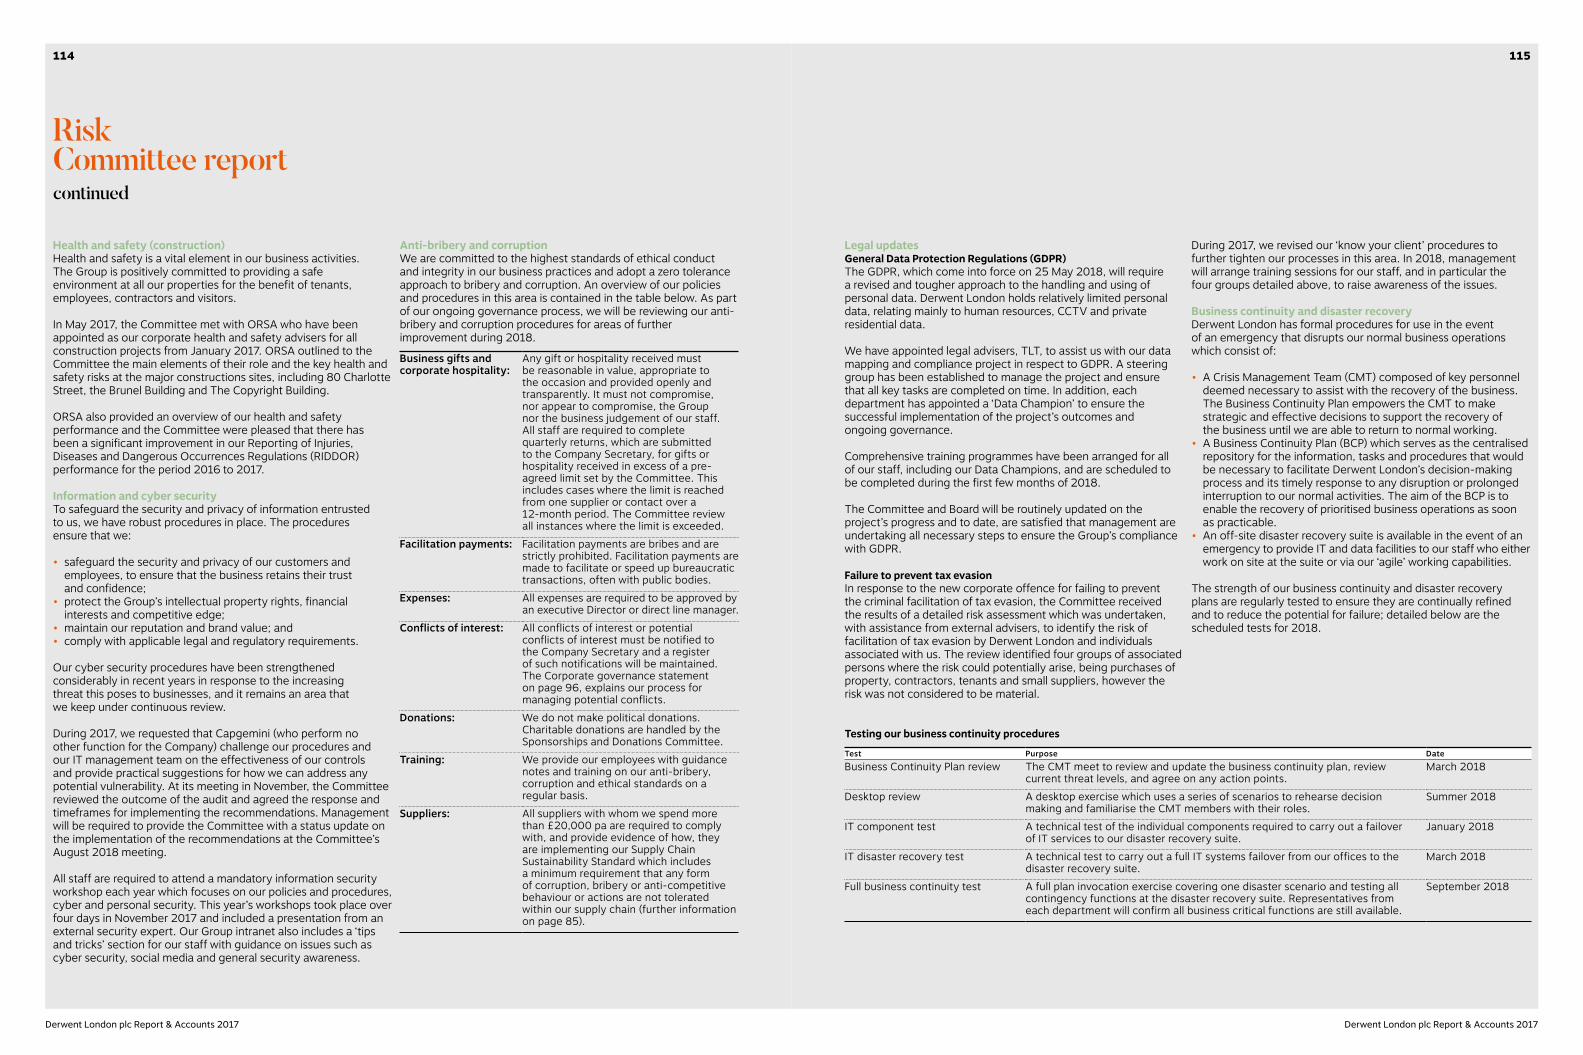
Risk Committee reportcontinued
Health and safety (construction)Health and safety is a vital element in our business activities. The Group is positively committed to providing a safe environment at all our properties for the benefit of tenants, employees, contractors and visitors.
In May 2017, the Committee met with ORSA who have been appointed as our corporate health and safety advisers for all construction projects from January 2017. ORSA outlined to the Committee the main elements of their role and the key health and safety risks at the major constructions sites, including 80 Charlotte Street, the Brunel Building and The Copyright Building.
ORSA also provided an overview of our health and safety performance and the Committee were pleased that there has been a significant improvement in our Reporting of Injuries, Diseases and Dangerous Occurrences Regulations (RIDDOR) performance for the period 2016 to 2017.
Information and cyber securityTo safeguard the security and privacy of information entrusted to us, we have robust procedures in place. The procedures ensure that we:
• safeguard the security and privacy of our customers and employees, to ensure that the business retains their trust and confidence;
• protect the Group’s intellectual property rights, financial interests and competitive edge;
• maintain our reputation and brand value; and• comply with applicable legal and regulatory requirements.
Our cyber security procedures have been strengthened considerably in recent years in response to the increasing threat this poses to businesses, and it remains an area that we keep under continuous review.
During 2017, we requested that Capgemini (who perform no other function for the Company) challenge our procedures and our IT management team on the effectiveness of our controls and provide practical suggestions for how we can address any potential vulnerability. At its meeting in November, the Committee reviewed the outcome of the audit and agreed the response and timeframes for implementing the recommendations. Management will be required to provide the Committee with a status update on the implementation of the recommendations at the Committee’s August 2018 meeting.
All staff are required to attend a mandatory information security workshop each year which focuses on our policies and procedures, cyber and personal security. This year’s workshops took place over four days in November 2017 and included a presentation from an external security expert. Our Group intranet also includes a ‘tips and tricks’ section for our staff with guidance on issues such as cyber security, social media and general security awareness.
Anti-bribery and corruptionWe are committed to the highest standards of ethical conduct and integrity in our business practices and adopt a zero tolerance approach to bribery and corruption. An overview of our policies and procedures in this area is contained in the table below. As part of our ongoing governance process, we will be reviewing our anti-bribery and corruption procedures for areas of further improvement during 2018.
Business gifts and corporate hospitality:
Any gift or hospitality received must be reasonable in value, appropriate to the occasion and provided openly and transparently. It must not compromise, nor appear to compromise, the Group nor the business judgement of our staff.All staff are required to complete quarterly returns, which are submitted to the Company Secretary, for gifts or hospitality received in excess of a pre-agreed limit set by the Committee. This includes cases where the limit is reached from one supplier or contact over a 12-month period. The Committee review all instances where the limit is exceeded.
Facilitation payments: Facilitation payments are bribes and are strictly prohibited. Facilitation payments are made to facilitate or speed up bureaucratic transactions, often with public bodies.
Expenses: All expenses are required to be approved by an executive Director or direct line manager.
Conflicts of interest: All conflicts of interest or potential conflicts of interest must be notified to the Company Secretary and a register of such notifications will be maintained. The Corporate governance statement on page 96, explains our process for managing potential conflicts.
Donations: We do not make political donations. Charitable donations are handled by the Sponsorships and Donations Committee.
Training: We provide our employees with guidance notes and training on our anti-bribery, corruption and ethical standards on a regular basis.
Suppliers: All suppliers with whom we spend more than £20,000 pa are required to comply with, and provide evidence of how, they are implementing our Supply Chain Sustainability Standard which includes a minimum requirement that any form of corruption, bribery or anti-competitive behaviour or actions are not tolerated within our supply chain (further information on page 85).
Legal updatesGeneral Data Protection Regulations (GDPR)The GDPR, which come into force on 25 May 2018, will require a revised and tougher approach to the handling and using of personal data. Derwent London holds relatively limited personal data, relating mainly to human resources, CCTV and private residential data.
We have appointed legal advisers, TLT, to assist us with our data mapping and compliance project in respect to GDPR. A steering group has been established to manage the project and ensure that all key tasks are completed on time. In addition, each department has appointed a ‘Data Champion’ to ensure the successful implementation of the project’s outcomes and ongoing governance.
Comprehensive training programmes have been arranged for all of our staff, including our Data Champions, and are scheduled to be completed during the first few months of 2018.
The Committee and Board will be routinely updated on the project’s progress and to date, are satisfied that management are undertaking all necessary steps to ensure the Group’s compliance with GDPR.
Failure to prevent tax evasionIn response to the new corporate offence for failing to prevent the criminal facilitation of tax evasion, the Committee received the results of a detailed risk assessment which was undertaken, with assistance from external advisers, to identify the risk of facilitation of tax evasion by Derwent London and individuals associated with us. The review identified four groups of associated persons where the risk could potentially arise, being purchases of property, contractors, tenants and small suppliers, however the risk was not considered to be material.
During 2017, we revised our ‘know your client’ procedures to further tighten our processes in this area. In 2018, management will arrange training sessions for our staff, and in particular the four groups detailed above, to raise awareness of the issues.
Business continuity and disaster recoveryDerwent London has formal procedures for use in the event of an emergency that disrupts our normal business operations which consist of:
• A Crisis Management Team (CMT) composed of key personnel deemed necessary to assist with the recovery of the business. The Business Continuity Plan empowers the CMT to make strategic and effective decisions to support the recovery of the business until we are able to return to normal working.
• A Business Continuity Plan (BCP) which serves as the centralised repository for the information, tasks and procedures that would be necessary to facilitate Derwent London’s decision-making process and its timely response to any disruption or prolonged interruption to our normal activities. The aim of the BCP is to enable the recovery of prioritised business operations as soon as practicable.
• An off-site disaster recovery suite is available in the event of an emergency to provide IT and data facilities to our staff who either work on site at the suite or via our ‘agile’ working capabilities.
The strength of our business continuity and disaster recovery plans are regularly tested to ensure they are continually refined and to reduce the potential for failure; detailed below are the scheduled tests for 2018.
Testing our business continuity procedures
Test Purpose DateBusiness Continuity Plan review The CMT meet to review and update the business continuity plan, review
current threat levels, and agree on any action points.March 2018
Desktop review A desktop exercise which uses a series of scenarios to rehearse decision making and familiarise the CMT members with their roles.
Summer 2018
IT component test A technical test of the individual components required to carry out a failover of IT services to our disaster recovery suite.
January 2018
IT disaster recovery test A technical test to carry out a full IT systems failover from our offices to the disaster recovery suite.
March 2018
Full business continuity test A full plan invocation exercise covering one disaster scenario and testing all contingency functions at the disaster recovery suite. Representatives from each department will confirm all business critical functions are still available.
September 2018
115114
Derwent London plc Report & Accounts 2017 Derwent London plc Report & Accounts 2017
Remuneration Committee report
Annual statement
Dear Shareholder,As Chair of the Remuneration Committee and on behalf of the Board, I am pleased to present our report on Directors’ remuneration for 2017.
At the 2017 AGM, shareholders approved our revised Remuneration Policy with 98.4% of votes cast in favour. We were delighted that our shareholders continue to endorse our remuneration framework. This year, rather than reproduce in full the approved policy, we have instead provided extracts from it. A copy of the complete Remuneration Policy can be found on our website at: www.derwentlondon.com/investors/governance /board-committees
The Annual Report on Remuneration, describing how the Remuneration Policy has been applied in practice for the year ended 31 December 2017, is provided on pages 118 to 129 and has been updated to reflect decisions made and outcomes generated during the year.
We will continue to be transparent about how pay and performance is reported at Derwent London and how decisions made by the Committee continue to support the strategic direction of the business.
Pay and performance outcomes in 2017Executive performance is closely aligned to business performance with a high proportion of total remuneration delivered through variable pay designed to reward achievement of long-term strategic targets. In a remuneration context this means rewarding performance that reflects our strategic objectives (which are included on page 20 of the Strategic report).
The Group’s results for 2017 are outlined in the Strategic report and include a total property return of 8.0% and a total return of 7.7%. Both these KPIs are measures of performance used in assessing the level of performance-related pay for the executive Directors.
To ensure that remuneration reflects a balanced performance, a scorecard of additional metrics is taken into account by the Committee when considering the strategic element of the Group’s annual bonus scheme. Taking all these measures into account resulted in a bonus entitlement of 80.4% of base salary being earned.
Conditional awards made to executive Directors in 2015 under the Group’s Performance Share Scheme (PSP) will vest in March 2018. These awards were subject to two performance conditions each over 50% of the award and both measured over the three-year period from 1 January 2015 to 31 December 2017. The first element was based on total shareholder return (TSR) performance compared with that of a group of 12 real estate companies. This measure has been finalised and none of that part of the award will vest. The second part was based on the Group’s total property return compared to properties in the MSCI IPD Central London Offices Total Return Index.
The combined assessment of the two performance measures as at 27 February 2018 was that around 26.5% of the total award will vest.
The Committee believes that the outturn of both the annual bonus and the PSP fairly represents the Group’s financial and share price performance over their respective performance periods.
Further information about the levels of executive remuneration earned in 2017, including details of performance against the relevant targets, are given on pages 122 and 123.
Implementation in 2018The Committee reviewed the performance and development of our executive Directors during the year. In light of performance, the Committee has increased executive Directors’ salaries by 3% from 1 January 2018, which is in line with the general cost of living increases across the Group.
In respect of incentive remuneration, the annual bonus and long-term incentive plan (LTIP) opportunities remain unchanged for 2018. The Committee made some minor changes to the strategic element of the annual bonus, to strengthen the target ranges and to ensure they are aligned with the Group’s strategic objectives and priorities for the coming year; further information is provided on page 125.
The Board believes in share ownership across the broader workforce to align the interests of employees, executive Directors and shareholders. The existing Employee Share Option Plan (ESOP), which currently extends to over 60% of our workforce, will expire this year. At the 2018 AGM, a resolution will seek authority to put in place a similar ESOP to operate for a further 10 years (the Derwent London Employee Share Option Plan 2018). We will also be seeking authority to introduce a Sharesave (SAYE) Plan for 2018, in which all permanent employees, including executive Directors, will be eligible to participate.
Over the coming year, the Board and the Committee will consider the impact on the Company of the proposed changes to the UK Corporate Governance Code and any secondary legislation introduced by the Government. This includes how we might bring the employee voice to the Boardroom and the disclosure of CEO pay ratios. The Committee welcomes the developments in this area. The Board and Committee will also review the Group’s gender pay gap, alongside the initiatives being implemented to reduce the gap.
Shareholder engagementI look forward to receiving your support at our 2018 AGM on Friday 18 May, where I will be available to respond to any questions shareholders may have on this report or in relation to any of the Committee activities. In the meantime if you would like to discuss any aspect of our Remuneration Policy please feel free to contact me through David Lawler, the Company Secretary, (telephone: +44 (0)20 7659 3000 or email: [email protected]).
Claudia Arney Chair of the Remuneration Committee 27 February 2018
Membership and attendance
IndependentNumber
of meetings Attendance
Claudia Arney, Chair Yes 2 100%Simon Fraser Yes 2 100%Stephen Young Yes 2 100%Helen Gordon became a member of the Remuneration Committee from 1 January 2018
The Committee’s role and responsibilities are set out in the terms of reference which are available on the Company’s website at: www.derwentlondon.com/investors/governance/board-committees
Focus areas for 2018• Review the changes being made to the UK Corporate Governance
Code in respect to executive remuneration and the role of the Remuneration Committee
• Receive updates on the implementation of initiatives intended to reduce the gender pay gap
• Conduct a competitive tender process for our independent remuneration consultants
Claudia Arney Chair of the Remuneration Committee
117116
Derwent London plc Report & Accounts 2017 Derwent London plc Report & Accounts 2017

Remuneration Committee reportcontinued
Annual Report on Remuneration
This part of the Directors’ remuneration report explains how we have implemented our Remuneration Policy during 2017. The policy in place for the year was approved by shareholders at the 2017 AGM. This Annual Report on Remuneration will be subject to an advisory vote at our 2018 AGM.
Following a busy year in 2016 with the review of our Remuneration Policy, the Committee only required two meetings in 2017 (in February and December). None of the members who have served during the year had any personal interest in the matters decided by the Committee and are all considered to be independent. The Company Secretary acted as Secretary to the Committee.
Role of the Remuneration Committee The role of the Committee is to determine and recommend to the Board a responsible and transparent remuneration framework, which is clearly linked to our performance and strategy, for rewarding and incentivising the Company’s most senior executives. In doing so, the Committee ensures that our Remuneration Policy is aligned with the Company’s key remuneration principles, which include:
• Rewarding executives for delivering above average long-term returns to shareholders;
• Enabling the Company to recruit, retain and motivate the best people;
• Promoting long-term sustainable performance while ensuring that the structure does not create incentives for management to operate outside the Group’s risk appetite;
• Ensuring the metrics used in incentive schemes remain effectively aligned to business strategy;
• Reflecting developments in evolving best practice and corporate governance; and
• Taking account of wider stakeholders, including employees when determining executive Directors’ remuneration.
The Committee’s composition, responsibilities and operation comply with the principles of good governance (as set out in the UK Corporate Governance Code), with the Listing Rules (of the FCA) and with the Companies Act 2006. The terms of reference for the Committee can be found on the Company’s website at: www.derwentlondon.com/investors/governance/board-committees and were last updated in August 2017. During 2018, the terms of reference will be reviewed to reflect changes to the revised UK Corporate Governance Code.
Advisers to the CommitteeThe Committee has authority to obtain the advice of external independent remuneration consultants. New Bridge Street (a trading name for Aon plc) have been retained as the Committee’s principal consultants since 2002, with the last competitive tender being conducted in 2012. New Bridge Street provide no other services to the Group and subsequently the Committee believe them to be capable of providing appropriate, objective and independent advice.
During the year under review, New Bridge Street provided independent assistance to the Committee on the setting of salaries, updates on market practice and governance, shareholder consultation support and the operation of the Performance Share Plan (PSP) and the annual bonus scheme, which included an independent assessment of PSP vesting and annual bonus performance outcomes. The fees paid to New Bridge Street for these services, based on hourly rates, amount to £32,513 (2016: £82,500).
The Committee have decided to complete a competitive tender process during 2018 for their external independent remuneration consultants.
Shareholder voting and engagementAt the Company’s 2017 AGM, our Remuneration Policy and Annual Report on Remuneration received the following votes from shareholders:
2017 AGM Remuneration PolicyAnnual Report
on RemunerationVotes cast in favour 82.7m 98.40% 83.8m 99.54%Votes cast against 1.3m 1.60% 0.4m 0.46%Votes withheld 0.07m 0.09% 0.0m 0.00%Total votes cast 84.2m 75.5% 84.2m 75.5%
The Committee was extremely pleased with the level of shareholder support, with a 99.54% vote in favour of the Directors’ Annual Report on Remuneration (2016 AGM: 95.47%; 2015 AGM: 99.55%) and 98.40% vote in favour of the Directors’ Remuneration Policy (2014 AGM: 99.53%).
The Committee encourages an open and constructive dialogue with shareholders and their representative bodies, and will consult with major shareholders on any material changes to the Remuneration Policy or to how it is implemented. We are aware that the executive remuneration landscape is evolving and of the potential for change, and will continue to monitor developments as they arise.
Relative importance of the spend on payIn order to give shareholders an understanding of how total expenditure on remuneration (for all employees) compares to certain core financial dispersals of the Company, the table below demonstrates the relative importance of the Company’s spend on employee pay for the period 2016 to 2017.
£m 2017 2016 % changeStaff costs 19.9 24.5 (18.8)Distributions to shareholders 120.1 49.7 141.6Net asset value 4,128 3,932 5.0Note: The net asset value of the Group is shown as it is the primary measure by which investors measure the success of the Group.
Percentage increase in the remuneration of the Chief Executive The table below shows the movement in the salary, benefits and annual bonus for the Chief Executive between the current and previous financial year compared to that for an average employee (excluding Directors).
£’000 2017 2016 % changeChief ExecutiveSalary 638.0 638.0 –Benefits 220.1 215.4 2.2Bonus 513.0 222.5 130.6Average employeeSalary 72.6 70.6 2.8Benefits 14.4 16.3 (11.7)Bonus 27.0 23.3 15.9Note: Benefits includes pension contributions and life assurance, were applicable. Further information on the remuneration paid to our wider workforce is provided on page 126.
Chief Executive pay for performance comparison The graph below shows the value on 31 December 2017, of £100 invested in Derwent London on 31 December 2008 compared to that of £100 invested in the FTSE 350 Super Sector Real Estate Index. The other points plotted are the values at intervening financial year ends. This index has been chosen by the Committee as it is considered the most appropriate benchmark against which to assess the relative performance of the Company for this purpose. The market price of the 5p ordinary shares at 31 December 2017 was £31.18 (2016: £27.72). During the year, they traded in a range between £24.28 and £31.20 (2016: £22.57 and £33.96).
Total shareholder return
100.0
100.0
108.6
181.4223.1
119.5 110.8
229.6
319.2
145.0
211.9
464.1
577.8
237.2
491.1
235.2
424.9
207.9
371.6
175.0
0
100
200
300
400
500
600
700£
Source: Datastream (�omson Reuters)
31 Dec2008
31 Dec2009
31 Dec2010
31 Dec2011
31 Dec2012
31 Dec2013
31 Dec2014
31 Dec2015
31 Dec2017
31 Dec2016
Derwent London FTSE United Kingdom 350 Super Sector Real Estate Index
Note: The TSR chart data is based on the 30-day average over the period 2 December to 31 December for each year.
Remuneration of the Chief Executive 2008–2017
Financial year ended 31/12/2008 31/12/2009 31/12/2010 31/12/2011 31/12/2012 31/12/2013 31/12/2014 31/12/2015 31/12/2016 31/12/2017Total remuneration (single figure) (£’000) 956 1,384 2,304 2,387 2,721 2,478 2,648 2,529 1,403 1,653Annual bonus (% of maximum) 25.6 62.5 87.5 90.0 85.4 95.0 92.6 74.2 23.3 53.6Long-term variable pay (% of maximum) 36.5 47.6 50.0 50.0 83.8 55.2 50.0 65.7 24.9 26.5
119118
Derwent London plc Report & Accounts 2017 Derwent London plc Report & Accounts 2017
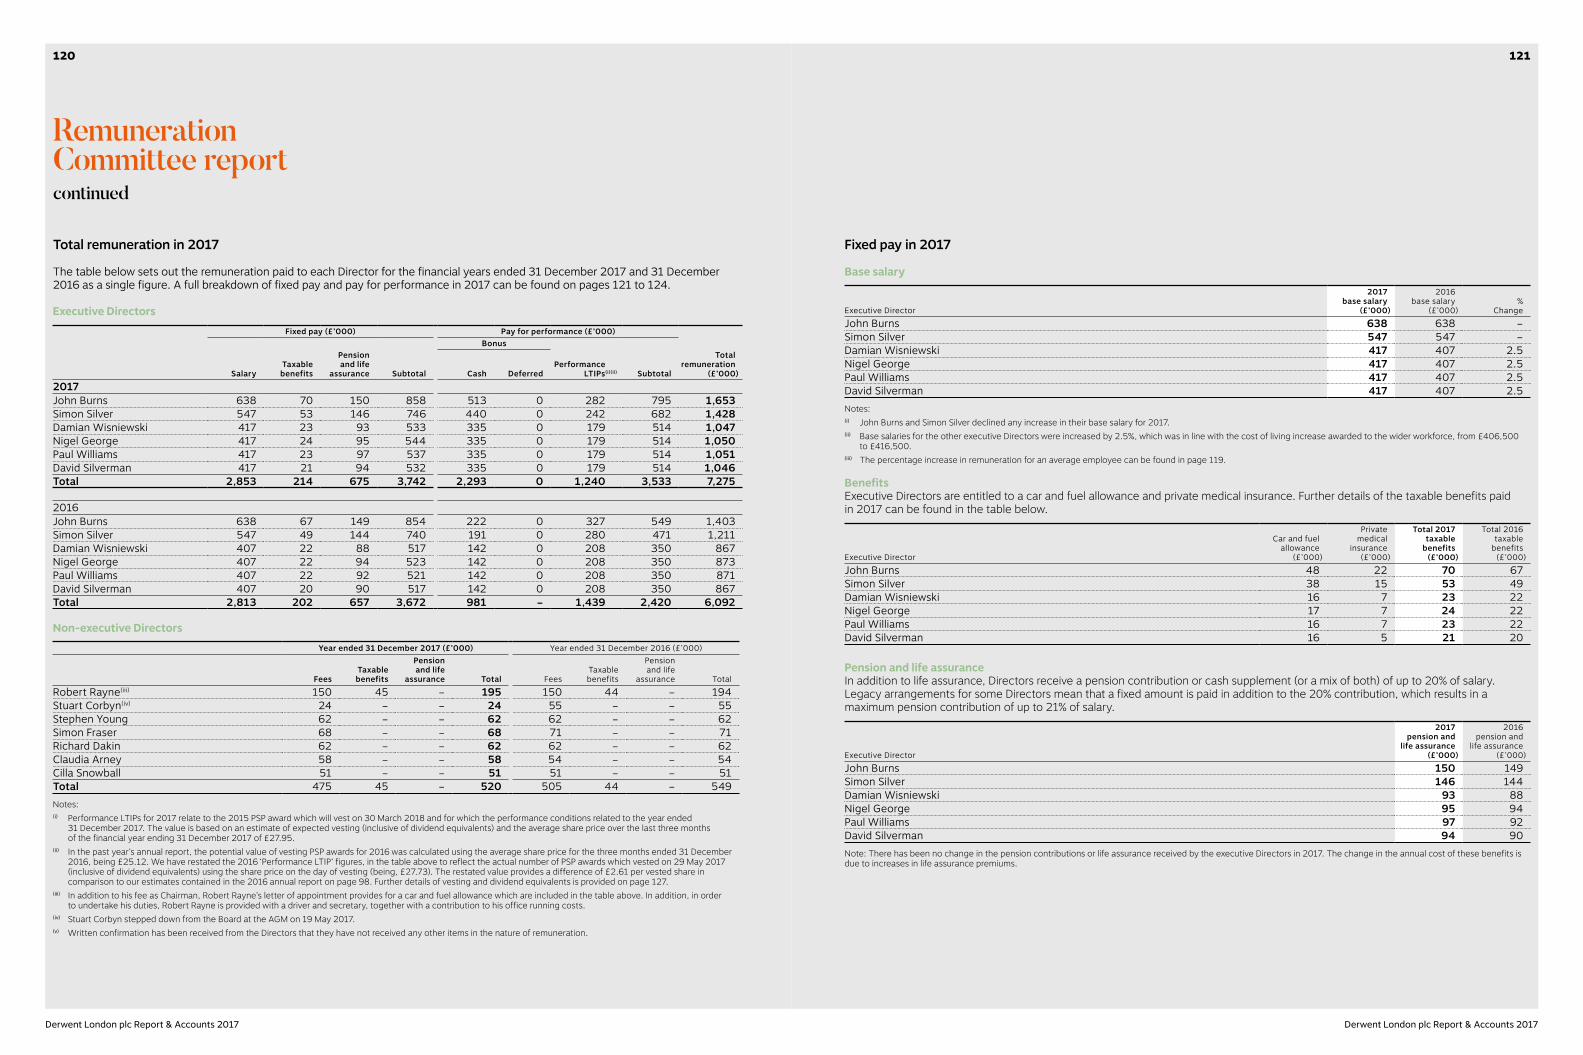
Remuneration Committee reportcontinued
Total remuneration in 2017
The table below sets out the remuneration paid to each Director for the financial years ended 31 December 2017 and 31 December 2016 as a single figure. A full breakdown of fixed pay and pay for performance in 2017 can be found on pages 121 to 124.
Executive DirectorsFixed pay (£’000) Pay for performance (£’000)
Bonus
SalaryTaxable benefits
Pension and life
assurance Subtotal Cash DeferredPerformance
LTIPs(i)(ii) Subtotal
Totalremuneration
(£’000)2017John Burns 638 70 150 858 513 0 282 795 1,653Simon Silver 547 53 146 746 440 0 242 682 1,428Damian Wisniewski 417 23 93 533 335 0 179 514 1,047Nigel George 417 24 95 544 335 0 179 514 1,050Paul Williams 417 23 97 537 335 0 179 514 1,051David Silverman 417 21 94 532 335 0 179 514 1,046Total 2,853 214 675 3,742 2,293 0 1,240 3,533 7,275
2016John Burns 638 67 149 854 222 0 327 549 1,403Simon Silver 547 49 144 740 191 0 280 471 1,211Damian Wisniewski 407 22 88 517 142 0 208 350 867Nigel George 407 22 94 523 142 0 208 350 873Paul Williams 407 22 92 521 142 0 208 350 871David Silverman 407 20 90 517 142 0 208 350 867Total 2,813 202 657 3,672 981 – 1,439 2,420 6,092
Non-executive DirectorsYear ended 31 December 2017 (£’000) Year ended 31 December 2016 (£’000)
FeesTaxablebenefits
Pension and life
assurance Total FeesTaxablebenefits
Pension and life
assurance TotalRobert Rayne(iii) 150 45 – 195 150 44 – 194Stuart Corbyn(iv) 24 – – 24 55 – – 55Stephen Young 62 – – 62 62 – – 62Simon Fraser 68 – – 68 71 – – 71Richard Dakin 62 – – 62 62 – – 62Claudia Arney 58 – – 58 54 – – 54Cilla Snowball 51 – – 51 51 – – 51Total 475 45 – 520 505 44 – 549Notes:(i) Performance LTIPs for 2017 relate to the 2015 PSP award which will vest on 30 March 2018 and for which the performance conditions related to the year ended
31 December 2017. The value is based on an estimate of expected vesting (inclusive of dividend equivalents) and the average share price over the last three months of the financial year ending 31 December 2017 of £27.95.
(ii) In the past year’s annual report, the potential value of vesting PSP awards for 2016 was calculated using the average share price for the three months ended 31 December 2016, being £25.12. We have restated the 2016 ‘Performance LTIP’ figures, in the table above to reflect the actual number of PSP awards which vested on 29 May 2017 (inclusive of dividend equivalents) using the share price on the day of vesting (being, £27.73). The restated value provides a difference of £2.61 per vested share in comparison to our estimates contained in the 2016 annual report on page 98. Further details of vesting and dividend equivalents is provided on page 127.
(iii) In addition to his fee as Chairman, Robert Rayne’s letter of appointment provides for a car and fuel allowance which are included in the table above. In addition, in order to undertake his duties, Robert Rayne is provided with a driver and secretary, together with a contribution to his office running costs.
(iv) Stuart Corbyn stepped down from the Board at the AGM on 19 May 2017.(v) Written confirmation has been received from the Directors that they have not received any other items in the nature of remuneration.
Fixed pay in 2017
Base salary
Executive Director
2017base salary
(£’000)
2016base salary
(£’000)%
ChangeJohn Burns 638 638 –Simon Silver 547 547 –Damian Wisniewski 417 407 2.5Nigel George 417 407 2.5Paul Williams 417 407 2.5David Silverman 417 407 2.5Notes:(i) John Burns and Simon Silver declined any increase in their base salary for 2017. (ii) Base salaries for the other executive Directors were increased by 2.5%, which was in line with the cost of living increase awarded to the wider workforce, from £406,500
to £416,500.(iii) The percentage increase in remuneration for an average employee can be found in page 119.
BenefitsExecutive Directors are entitled to a car and fuel allowance and private medical insurance. Further details of the taxable benefits paid in 2017 can be found in the table below.
Executive Director
Car and fuelallowance
(£’000)
Privatemedical
insurance(£’000)
Total 2017taxable
benefits(£’000)
Total 2016taxable
benefits(£’000)
John Burns 48 22 70 67Simon Silver 38 15 53 49Damian Wisniewski 16 7 23 22Nigel George 17 7 24 22Paul Williams 16 7 23 22David Silverman 16 5 21 20
Pension and life assuranceIn addition to life assurance, Directors receive a pension contribution or cash supplement (or a mix of both) of up to 20% of salary. Legacy arrangements for some Directors mean that a fixed amount is paid in addition to the 20% contribution, which results in a maximum pension contribution of up to 21% of salary.
Executive Director
2017pension and
life assurance(£’000)
2016pension and
life assurance(£’000)
John Burns 150 149Simon Silver 146 144Damian Wisniewski 93 88Nigel George 95 94Paul Williams 97 92David Silverman 94 90Note: There has been no change in the pension contributions or life assurance received by the executive Directors in 2017. The change in the annual cost of these benefits is due to increases in life assurance premiums.
121120
Derwent London plc Report & Accounts 2017 Derwent London plc Report & Accounts 2017

Pay for performance
Determination of 2017 annual bonus outcomeThe performance measures set for the year under review were a combination of financial based metrics (worth 75% of the bonus potential) and strategic targets (worth 25% of the bonus potential). The maximum bonus potential for executive Directors is 150% of salary. Based on actual 2017 performance, the annual bonus payment for executive Directors was 53.6% of the maximum potential (2016: 23.3%; 2015: 74.2%). This has been derived as follows:
Financial based metrics
Performance measureWeighting% of bonus Basis of calculation
Threshold(ii)
%Maximum(iii)
%Actual
%Payable
%Total return 37.5 Total return against
other major real estate companies(i)
6.1 11.6 7.7 16.9
Total property return (TPR) 37.5 Relative to MSCI IPDCentral London Offices
Total Return Index
7.1 10.1 8.0 16.7
Total bonus payable for financial based metrics 33.6Notes:(i) The major real estate companies contained in the comparator group for the 2017 annual bonus are: The British Land Company plc, Great Portland Estates plc, Land Sec
plc, Shaftesbury plc, Big Yellow Group plc, Workspace Group plc, Capital & Regional plc, Capital & Counties Properties plc, Hammerson plc, Intu Properties plc, St Modwen Properties plc and Segro plc.
(ii) For achieving the threshold performance target, i.e. at the MSCI IPD Index or median total return against our sector peers, 22.5% of the maximum bonus opportunity will become payable.
(iii) Total return pay-out accrues on a straight-line basis between the threshold level for median performance and maximum payment for upper quartile performance or better. For TPR, the pay-out accrues on a straight-line basis between the threshold level for index performance and maximum payment for index +3.0%.
Strategic targets
Performance measureTargetrange
Maximumaward
2017achievement
Payable%
Void managementThis is measured by the Group’s average EPRA vacancy rate over the year. More details on this KPI are given on page 31.
0-10% 5.0% 1.3% 4.4
Tenant retentionThis is measured by the percentage of tenants that remain in their space when their lease expires. More details on this key metric are given on page 32.
50-75% 5.0% 57% 1.4
Portfolio’s development potential This is measured by the percentage of the Group’s portfolio by area, where a potential development scheme has been identified. More details on this key metric are given on page 32.
35-45% 2.5% 44% 2.3
Unexpired lease termThis is measured by the ‘topped-up’ weighted average unexpired lease term of the Group’s core income producing portfolio including pre-lets. This key metric is published in the investor presentation for the year ended 31 December 2017 (page 71) which is available on our website.
5-10 years 2.5% 8.8 years 1.9
SustainabilityThis is assessed by the Group’s achievements against the BREEAM benchmark at its new developments or major refurbishments. More details on this KPI are given on page 31.
New build – ‘Excellent’Major refurbishment –
‘Very good’
5.0% All sustainabilitytargets have
been achieved
5.0
Staff satisfactionStaff surveys are used to assess this measure.
70% to >90% of staff to be satisfied or better
5.0% 96% 5.0
Total bonus payable for strategic targets: 20.0Total bonus payable as a percentage of maximum potential (financial and strategic targets): 53.6
Remuneration Committee reportcontinued
The total bonus for each executive is therefore:Bonus payable Deferred bonus
Executive Director% of
maximum% of
salaryCash bonus
payable £% of
salaryJohn Burns 53.6 80.4 513 – –Simon Silver 53.6 80.4 440 – –Other Directors 53.6 80.4 335 – –Note: Other Directors are Damian Wisniewski, Paul Williams, Nigel George and David Silverman, whose base salary and subsequently, annual bonus pay-out will be identical.
In accordance with our Remuneration Policy, bonuses of up to 100% of base salary are paid as cash. Amounts in excess of 100% are deferred into shares of which 50% are released after 12 months and the balance after 24 months. As the bonus achieved for 2017 is below 100% of salary, the entire bonus will be paid as cash with no deferral.
Performance Share Plan (PSP)Vesting of awardsAs shown in the table below, the PSP awards granted in 2015 will vest on 30 March 2018 at 26.5%.
Performance measureWeighting% of award Basis of calculation
Threshold(ii)
%
Threequarter
vesting %Maximum(iii)
%Actual
%
% vesting/estimated
vestingTotal property return (TPR) 50 Relative to MSCI IPD
Central London Offices Total Return Index
8.6 11.1 13.6 10.0 26.5
Total shareholder return (TSR) 50 TSR of major real estate companies(i)
4.3 n/a 45.0 2.6 0
Notes: (i) The major real estate companies contained in the comparator group for determining our TSR performance are: Big Yellow Group plc, The British Land Company plc,
Capital & Regional plc, Capital & Counties Properties plc, Great Portland Estates plc, Hammerson plc, Intu Properties plc, Land Sec plc, Quintain Estates and Development plc, St Modwen Properties plc, Segro plc, Shaftesbury plc, Workspace Group plc. Since the comparator group was agreed in 2015, Quintain Estates and Development plc has delisted. The Remuneration Committee’s approach was to exclude this company from the comparator group when determining TSR performance. The removal of this company from the comparator list had no impact on the outcome.
(ii) For achieving the threshold performance target, i.e. at the MSCI IPD Index or median TSR against our sector peers, 22.5% of the maximum award will vest. (iii) For TSR, the pay-out accrues on a straight-line basis between the threshold level for median performance and maximum payment for upper quartile performance or better.
For TPR, the pay-out accrues on a straight-line basis between the threshold level for index performance, three quarter vesting for index +2.5% and maximum payment for index +5.0%.
As required by the scheme rules, before allowing any vesting, the Committee considered whether these performance measures reflected the Group’s underlying financial performance. Having considered a range of key financial indicators, including profits and NAV performance, the Committee concluded that this was the case.
Therefore, the vesting for each executive will be:
Executive DirectorNumber of
awards granted
Number of shares vestingbased on performance
(26.5%)
Dividend equivalentcash sum(estimate)
Total estimate valueof award on vesting
John Burns 35,750 9,473 £17,050 £281,820 Simon Silver 30,675 8,128 £14,618 £241,795 Other Directors 22,770 6,034 £10,845 £179,495 Note: Other Directors are Damian Wisniewski, Paul Williams, Nigel George and David Silverman, who were granted identical number of awards under the PSP grant in 2015.
The value of the vesting awards is based on the average share price over the last three months of the financial year ended 31 December 2017 being £27.95 and includes a dividend equivalent cash payment. In accordance with the Performance Share Plan (PSP) rules, the Remuneration Committee has discretion to allow PSP participants to receive a payment upon the vesting of their awards, which is equivalent to the value of any dividends paid on those shares between the grant date and the vesting date. The estimated value of the vesting awards has been included within the ‘single figure’ total remuneration table on page 120.
In accordance with the PSP rules, vested awards are subject to a two-year holding period. This means that for any awards which vest under the PSP 2015 Grant, at least the after-tax number of vested shares must be retained by the executive for a minimum of two years from the point of vesting, i.e. until March 2020.
123122
Derwent London plc Report & Accounts 2017 Derwent London plc Report & Accounts 2017
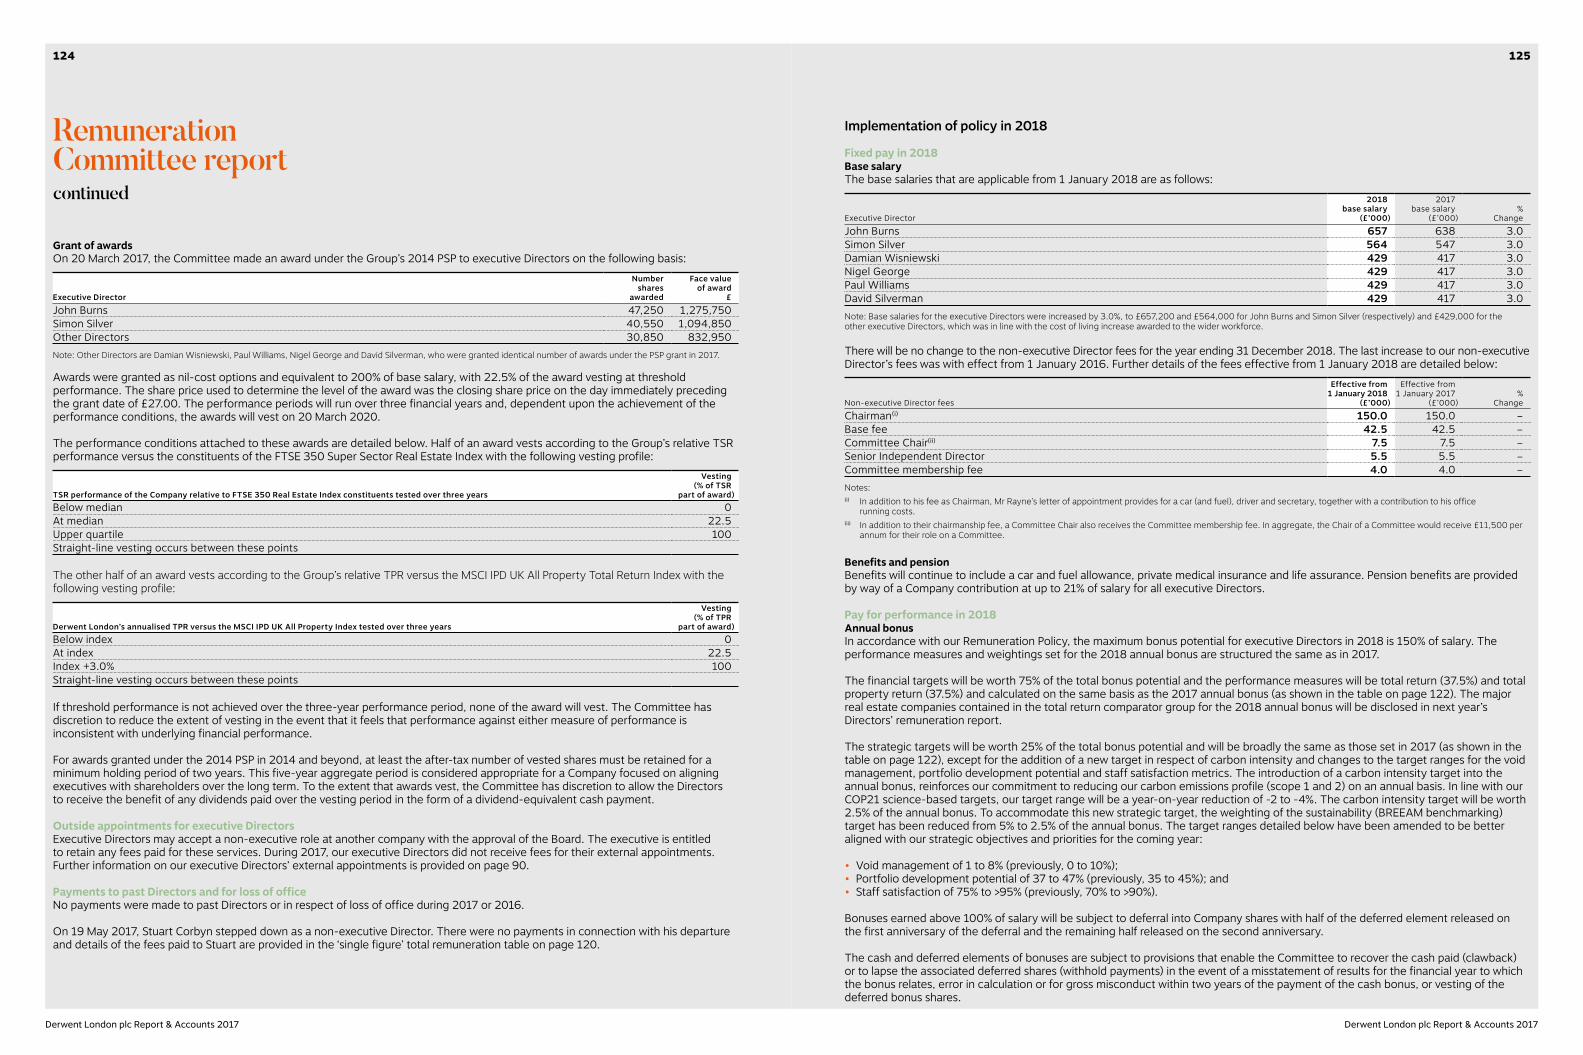
Remuneration Committee reportcontinued
Grant of awardsOn 20 March 2017, the Committee made an award under the Group’s 2014 PSP to executive Directors on the following basis:
Executive Director
Numbershares
awarded
Face value of award
£John Burns 47,250 1,275,750Simon Silver 40,550 1,094,850Other Directors 30,850 832,950Note: Other Directors are Damian Wisniewski, Paul Williams, Nigel George and David Silverman, who were granted identical number of awards under the PSP grant in 2017.
Awards were granted as nil-cost options and equivalent to 200% of base salary, with 22.5% of the award vesting at threshold performance. The share price used to determine the level of the award was the closing share price on the day immediately preceding the grant date of £27.00. The performance periods will run over three financial years and, dependent upon the achievement of the performance conditions, the awards will vest on 20 March 2020.
The performance conditions attached to these awards are detailed below. Half of an award vests according to the Group’s relative TSR performance versus the constituents of the FTSE 350 Super Sector Real Estate Index with the following vesting profile:
TSR performance of the Company relative to FTSE 350 Real Estate Index constituents tested over three years
Vesting(% of TSR
part of award)Below median 0At median 22.5Upper quartile 100Straight-line vesting occurs between these points
The other half of an award vests according to the Group’s relative TPR versus the MSCI IPD UK All Property Total Return Index with the following vesting profile:
Derwent London’s annualised TPR versus the MSCI IPD UK All Property Index tested over three years
Vesting(% of TPR
part of award)Below index 0At index 22.5Index +3.0% 100Straight-line vesting occurs between these points
If threshold performance is not achieved over the three-year performance period, none of the award will vest. The Committee has discretion to reduce the extent of vesting in the event that it feels that performance against either measure of performance is inconsistent with underlying financial performance.
For awards granted under the 2014 PSP in 2014 and beyond, at least the after-tax number of vested shares must be retained for a minimum holding period of two years. This five-year aggregate period is considered appropriate for a Company focused on aligning executives with shareholders over the long term. To the extent that awards vest, the Committee has discretion to allow the Directors to receive the benefit of any dividends paid over the vesting period in the form of a dividend-equivalent cash payment.
Outside appointments for executive DirectorsExecutive Directors may accept a non-executive role at another company with the approval of the Board. The executive is entitled to retain any fees paid for these services. During 2017, our executive Directors did not receive fees for their external appointments. Further information on our executive Directors’ external appointments is provided on page 90.
Payments to past Directors and for loss of officeNo payments were made to past Directors or in respect of loss of office during 2017 or 2016.
On 19 May 2017, Stuart Corbyn stepped down as a non-executive Director. There were no payments in connection with his departure and details of the fees paid to Stuart are provided in the ‘single figure’ total remuneration table on page 120.
Implementation of policy in 2018
Fixed pay in 2018Base salaryThe base salaries that are applicable from 1 January 2018 are as follows:
Executive Director
2018base salary
(£’000)
2017base salary
(£’000)%
ChangeJohn Burns 657 638 3.0Simon Silver 564 547 3.0Damian Wisniewski 429 417 3.0Nigel George 429 417 3.0Paul Williams 429 417 3.0David Silverman 429 417 3.0Note: Base salaries for the executive Directors were increased by 3.0%, to £657,200 and £564,000 for John Burns and Simon Silver (respectively) and £429,000 for the other executive Directors, which was in line with the cost of living increase awarded to the wider workforce.
There will be no change to the non-executive Director fees for the year ending 31 December 2018. The last increase to our non-executive Director’s fees was with effect from 1 January 2016. Further details of the fees effective from 1 January 2018 are detailed below:
Non-executive Director fees
Effective from 1 January 2018
(£’000)
Effective from 1 January 2017
(£’000)%
ChangeChairman(i) 150.0 150.0 –Base fee 42.5 42.5 –Committee Chair(ii) 7.5 7.5 –Senior Independent Director 5.5 5.5 –Committee membership fee 4.0 4.0 –Notes:(i) In addition to his fee as Chairman, Mr Rayne’s letter of appointment provides for a car (and fuel), driver and secretary, together with a contribution to his office
running costs. (ii) In addition to their chairmanship fee, a Committee Chair also receives the Committee membership fee. In aggregate, the Chair of a Committee would receive £11,500 per
annum for their role on a Committee.
Benefits and pensionBenefits will continue to include a car and fuel allowance, private medical insurance and life assurance. Pension benefits are provided by way of a Company contribution at up to 21% of salary for all executive Directors.
Pay for performance in 2018Annual bonusIn accordance with our Remuneration Policy, the maximum bonus potential for executive Directors in 2018 is 150% of salary. The performance measures and weightings set for the 2018 annual bonus are structured the same as in 2017.
The financial targets will be worth 75% of the total bonus potential and the performance measures will be total return (37.5%) and total property return (37.5%) and calculated on the same basis as the 2017 annual bonus (as shown in the table on page 122). The major real estate companies contained in the total return comparator group for the 2018 annual bonus will be disclosed in next year’s Directors’ remuneration report.
The strategic targets will be worth 25% of the total bonus potential and will be broadly the same as those set in 2017 (as shown in the table on page 122), except for the addition of a new target in respect of carbon intensity and changes to the target ranges for the void management, portfolio development potential and staff satisfaction metrics. The introduction of a carbon intensity target into the annual bonus, reinforces our commitment to reducing our carbon emissions profile (scope 1 and 2) on an annual basis. In line with our COP21 science-based targets, our target range will be a year-on-year reduction of -2 to -4%. The carbon intensity target will be worth 2.5% of the annual bonus. To accommodate this new strategic target, the weighting of the sustainability (BREEAM benchmarking) target has been reduced from 5% to 2.5% of the annual bonus. The target ranges detailed below have been amended to be better aligned with our strategic objectives and priorities for the coming year:
• Void management of 1 to 8% (previously, 0 to 10%);• Portfolio development potential of 37 to 47% (previously, 35 to 45%); and• Staff satisfaction of 75% to >95% (previously, 70% to >90%).
Bonuses earned above 100% of salary will be subject to deferral into Company shares with half of the deferred element released on the first anniversary of the deferral and the remaining half released on the second anniversary.
The cash and deferred elements of bonuses are subject to provisions that enable the Committee to recover the cash paid (clawback) or to lapse the associated deferred shares (withhold payments) in the event of a misstatement of results for the financial year to which the bonus relates, error in calculation or for gross misconduct within two years of the payment of the cash bonus, or vesting of the deferred bonus shares.
125124
Derwent London plc Report & Accounts 2017 Derwent London plc Report & Accounts 2017
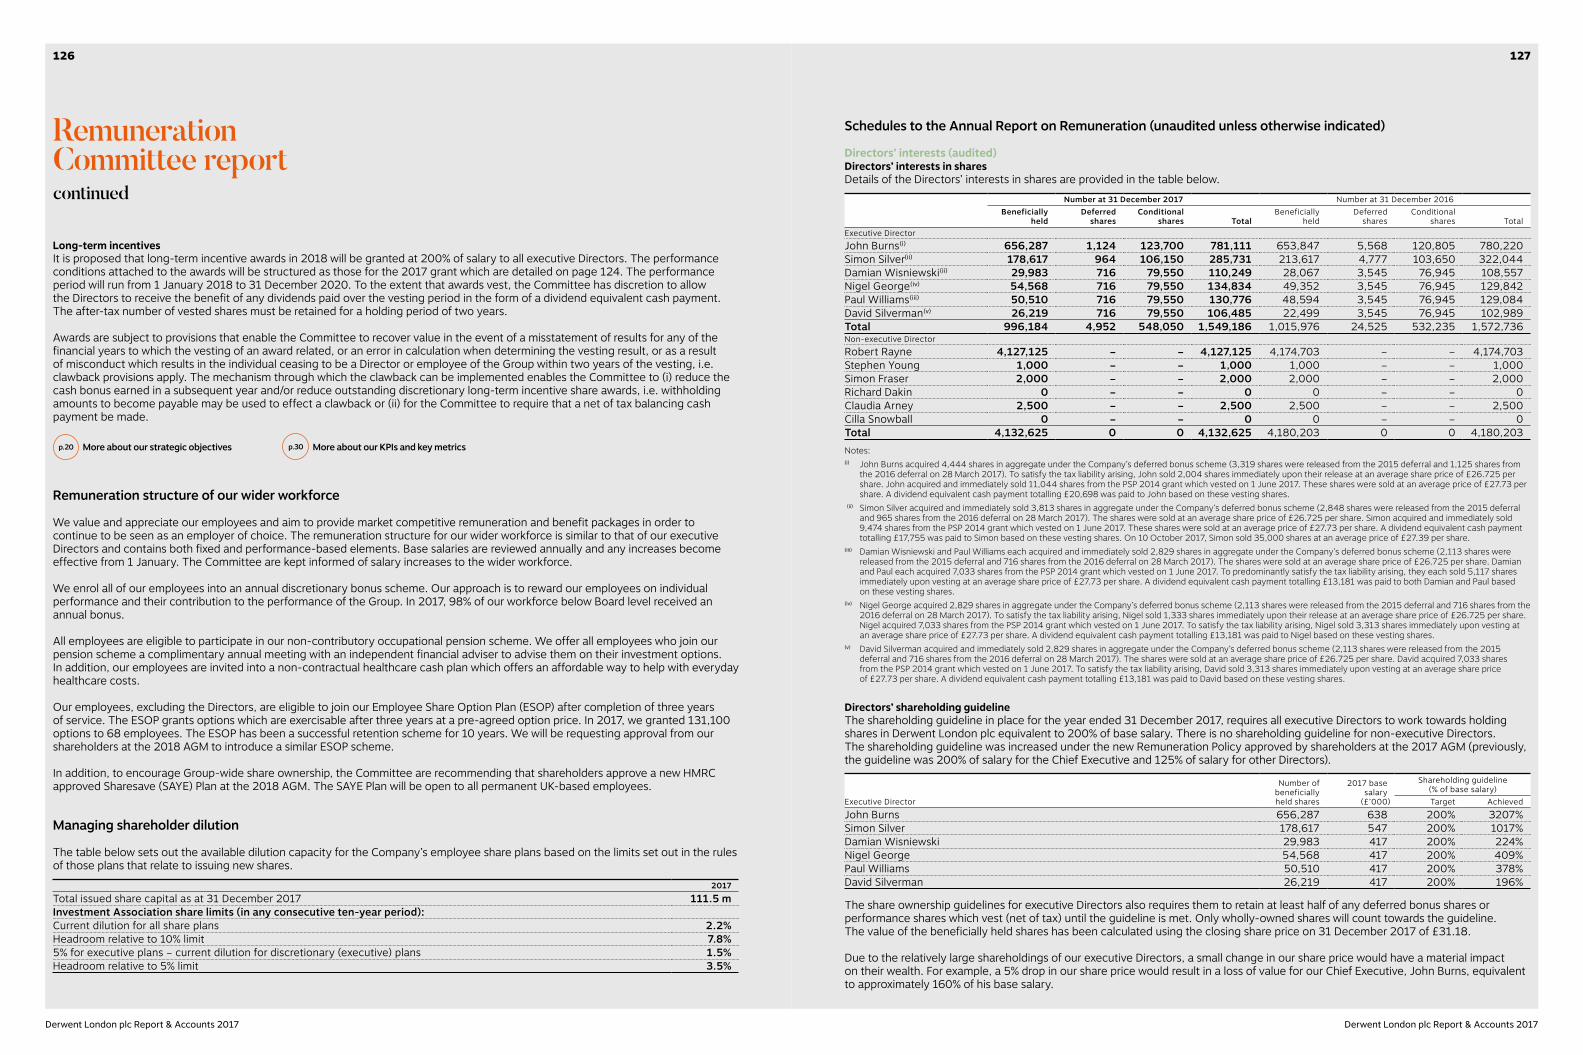
Long-term incentivesIt is proposed that long-term incentive awards in 2018 will be granted at 200% of salary to all executive Directors. The performance conditions attached to the awards will be structured as those for the 2017 grant which are detailed on page 124. The performance period will run from 1 January 2018 to 31 December 2020. To the extent that awards vest, the Committee has discretion to allow the Directors to receive the benefit of any dividends paid over the vesting period in the form of a dividend equivalent cash payment. The after-tax number of vested shares must be retained for a holding period of two years.
Awards are subject to provisions that enable the Committee to recover value in the event of a misstatement of results for any of the financial years to which the vesting of an award related, or an error in calculation when determining the vesting result, or as a result of misconduct which results in the individual ceasing to be a Director or employee of the Group within two years of the vesting, i.e. clawback provisions apply. The mechanism through which the clawback can be implemented enables the Committee to (i) reduce the cash bonus earned in a subsequent year and/or reduce outstanding discretionary long-term incentive share awards, i.e. withholding amounts to become payable may be used to effect a clawback or (ii) for the Committee to require that a net of tax balancing cash payment be made.
p.20 More about our strategic objectives p.30 More about our KPIs and key metrics
Remuneration structure of our wider workforce
We value and appreciate our employees and aim to provide market competitive remuneration and benefit packages in order to continue to be seen as an employer of choice. The remuneration structure for our wider workforce is similar to that of our executive Directors and contains both fixed and performance-based elements. Base salaries are reviewed annually and any increases become effective from 1 January. The Committee are kept informed of salary increases to the wider workforce.
We enrol all of our employees into an annual discretionary bonus scheme. Our approach is to reward our employees on individual performance and their contribution to the performance of the Group. In 2017, 98% of our workforce below Board level received an annual bonus.
All employees are eligible to participate in our non-contributory occupational pension scheme. We offer all employees who join our pension scheme a complimentary annual meeting with an independent financial adviser to advise them on their investment options. In addition, our employees are invited into a non-contractual healthcare cash plan which offers an affordable way to help with everyday healthcare costs.
Our employees, excluding the Directors, are eligible to join our Employee Share Option Plan (ESOP) after completion of three years of service. The ESOP grants options which are exercisable after three years at a pre-agreed option price. In 2017, we granted 131,100 options to 68 employees. The ESOP has been a successful retention scheme for 10 years. We will be requesting approval from our shareholders at the 2018 AGM to introduce a similar ESOP scheme.
In addition, to encourage Group-wide share ownership, the Committee are recommending that shareholders approve a new HMRC approved Sharesave (SAYE) Plan at the 2018 AGM. The SAYE Plan will be open to all permanent UK-based employees.
Managing shareholder dilution
The table below sets out the available dilution capacity for the Company’s employee share plans based on the limits set out in the rules of those plans that relate to issuing new shares.
2017Total issued share capital as at 31 December 2017 111.5 mInvestment Association share limits (in any consecutive ten-year period):Current dilution for all share plans 2.2%Headroom relative to 10% limit 7.8%5% for executive plans – current dilution for discretionary (executive) plans 1.5%Headroom relative to 5% limit 3.5%
Remuneration Committee reportcontinued
Schedules to the Annual Report on Remuneration (unaudited unless otherwise indicated)
Directors’ interests (audited)Directors’ interests in shares Details of the Directors’ interests in shares are provided in the table below. Number at 31 December 2017 Number at 31 December 2016
Beneficially
held Deferred
sharesConditional
shares TotalBeneficially
held Deferred
sharesConditional
shares TotalExecutive Director John Burns(i) 656,287 1,124 123,700 781,111 653,847 5,568 120,805 780,220Simon Silver(ii) 178,617 964 106,150 285,731 213,617 4,777 103,650 322,044Damian Wisniewski(ii) 29,983 716 79,550 110,249 28,067 3,545 76,945 108,557Nigel George(iv) 54,568 716 79,550 134,834 49,352 3,545 76,945 129,842Paul Williams(iii) 50,510 716 79,550 130,776 48,594 3,545 76,945 129,084David Silverman(v) 26,219 716 79,550 106,485 22,499 3,545 76,945 102,989Total 996,184 4,952 548,050 1,549,186 1,015,976 24,525 532,235 1,572,736Non-executive Director Robert Rayne 4,127,125 – – 4,127,125 4,174,703 – – 4,174,703Stephen Young 1,000 – – 1,000 1,000 – – 1,000Simon Fraser 2,000 – – 2,000 2,000 – – 2,000Richard Dakin 0 – – 0 0 – – 0Claudia Arney 2,500 – – 2,500 2,500 – – 2,500Cilla Snowball 0 – – 0 0 – – 0Total 4,132,625 0 0 4,132,625 4,180,203 0 0 4,180,203Notes: (i) John Burns acquired 4,444 shares in aggregate under the Company’s deferred bonus scheme (3,319 shares were released from the 2015 deferral and 1,125 shares from
the 2016 deferral on 28 March 2017). To satisfy the tax liability arising, John sold 2,004 shares immediately upon their release at an average share price of £26.725 per share. John acquired and immediately sold 11,044 shares from the PSP 2014 grant which vested on 1 June 2017. These shares were sold at an average price of £27.73 per share. A dividend equivalent cash payment totalling £20,698 was paid to John based on these vesting shares.
(ii) Simon Silver acquired and immediately sold 3,813 shares in aggregate under the Company’s deferred bonus scheme (2,848 shares were released from the 2015 deferral and 965 shares from the 2016 deferral on 28 March 2017). The shares were sold at an average share price of £26.725 per share. Simon acquired and immediately sold 9,474 shares from the PSP 2014 grant which vested on 1 June 2017. These shares were sold at an average price of £27.73 per share. A dividend equivalent cash payment totalling £17,755 was paid to Simon based on these vesting shares. On 10 October 2017, Simon sold 35,000 shares at an average price of £27.39 per share.
(iii) Damian Wisniewski and Paul Williams each acquired and immediately sold 2,829 shares in aggregate under the Company’s deferred bonus scheme (2,113 shares were released from the 2015 deferral and 716 shares from the 2016 deferral on 28 March 2017). The shares were sold at an average share price of £26.725 per share. Damian and Paul each acquired 7,033 shares from the PSP 2014 grant which vested on 1 June 2017. To predominantly satisfy the tax liability arising, they each sold 5,117 shares immediately upon vesting at an average share price of £27.73 per share. A dividend equivalent cash payment totalling £13,181 was paid to both Damian and Paul based on these vesting shares.
(iv) Nigel George acquired 2,829 shares in aggregate under the Company’s deferred bonus scheme (2,113 shares were released from the 2015 deferral and 716 shares from the 2016 deferral on 28 March 2017). To satisfy the tax liability arising, Nigel sold 1,333 shares immediately upon their release at an average share price of £26.725 per share. Nigel acquired 7,033 shares from the PSP 2014 grant which vested on 1 June 2017. To satisfy the tax liability arising, Nigel sold 3,313 shares immediately upon vesting at an average share price of £27.73 per share. A dividend equivalent cash payment totalling £13,181 was paid to Nigel based on these vesting shares.
(v) David Silverman acquired and immediately sold 2,829 shares in aggregate under the Company’s deferred bonus scheme (2,113 shares were released from the 2015 deferral and 716 shares from the 2016 deferral on 28 March 2017). The shares were sold at an average share price of £26.725 per share. David acquired 7,033 shares from the PSP 2014 grant which vested on 1 June 2017. To satisfy the tax liability arising, David sold 3,313 shares immediately upon vesting at an average share price of £27.73 per share. A dividend equivalent cash payment totalling £13,181 was paid to David based on these vesting shares.
Directors’ shareholding guidelineThe shareholding guideline in place for the year ended 31 December 2017, requires all executive Directors to work towards holding shares in Derwent London plc equivalent to 200% of base salary. There is no shareholding guideline for non-executive Directors. The shareholding guideline was increased under the new Remuneration Policy approved by shareholders at the 2017 AGM (previously, the guideline was 200% of salary for the Chief Executive and 125% of salary for other Directors).
Number ofbeneficiallyheld shares
2017 basesalary
(£’000)
Shareholding guideline(% of base salary)
Executive Director Target AchievedJohn Burns 656,287 638 200% 3207%Simon Silver 178,617 547 200% 1017%Damian Wisniewski 29,983 417 200% 224%Nigel George 54,568 417 200% 409%Paul Williams 50,510 417 200% 378%David Silverman 26,219 417 200% 196%
The share ownership guidelines for executive Directors also requires them to retain at least half of any deferred bonus shares or performance shares which vest (net of tax) until the guideline is met. Only wholly-owned shares will count towards the guideline. The value of the beneficially held shares has been calculated using the closing share price on 31 December 2017 of £31.18.
Due to the relatively large shareholdings of our executive Directors, a small change in our share price would have a material impact on their wealth. For example, a 5% drop in our share price would result in a loss of value for our Chief Executive, John Burns, equivalent to approximately 160% of his base salary.
127126
Derwent London plc Report & Accounts 2017 Derwent London plc Report & Accounts 2017

Long-term incentive plans (audited)Deferred Bonus PlanDetails of the deferred bonus shares held by the Directors are set out in the table below:
At grant During the year
Deferred bonus Date of grant
Market price
at date of grant
(£)
Original Grant
(number)
01 January 2017
(number)Deferred (number)
Released (number)
31 December 2017
(number)
Market price
at date of release
(£)
Value at release £’000
Release date(s)
John Burns
25/03/2015 35.27 6,639 3,319 – 3,319 0 26.725 89 24/03/2016 and 28/03/2017
23/03/2016 31.21 2,249 2,249 – 1,125 1,124 26.725 30 28/03/2017 and 23/03/2018
8,888 5,568 0 4,444 1,124 Simon Silver
25/03/2015 35.27 5,695 2,848 – 2,848 0 26.725 76 24/03/2016 and 28/03/2017
23/03/2016 31.21 1,929 1,929 – 965 964 26.725 26 28/03/2017 and 23/03/2018
7,624 4,777 0 3,813 964 Damian Wisniewski
25/03/2015 35.27 4,227 2,113 – 2,113 0 26.725 57 24/03/2016 and 28/03/2017
23/03/2016 31.21 1,432 1,432 – 716 716 26.725 19 28/03/2017 and 23/03/2018
5,659 3,545 0 2,829 716 Nigel George
25/03/2015 35.27 4,227 2,113 – 2,113 0 26.725 57 24/03/2016 and 28/03/2017
23/03/2016 31.21 1,432 1,432 – 716 716 26.725 19 28/03/2017 and 23/03/2018
5,659 3,545 0 2,829 716 Paul Williams
25/03/2015 35.27 4,227 2,113 – 2,113 0 26.725 57 24/03/2016 and 28/03/2017
23/03/2016 31.21 1,432 1,432 – 716 716 26.725 19 28/03/2017 and 23/03/2018
5,659 3,545 0 2,829 716 David Silverman
25/03/2015 35.27 4,227 2,113 – 2,113 0 26.725 57 24/03/2016 and 28/03/2017
23/03/2016 31.21 1,432 1,432 – 716 716 26.725 19 28/03/2017 and 23/03/2018
5,659 3,545 0 2,829 716 Total 39,148 24,525 0 19,573 4,952 525 Notes:(i) The bonus deferred on 25 March 2015 was released in two tranches; 50% of the award was released 12 months after deferral (on 24 March 2016) and the remaining
balance was released after 24 months (on 28 March 2017). The bonus released in March 2017 has been valued using the middle market share price on the release date. (ii) As the 2016 and 2017 annual bonuses did not reach 100% of base salary, there was no bonus deferral during 2017 or 2018. Further information on the 2017 annual bonus
can be found on page 122.
Performance Share Plan The outstanding PSP awards held by Directors are set out in the table below:
At grant During the year
Performance Share Plan Date of award
Market price
at date of grant
(£)
1 January 2017
(number)Granted
(number)Vested
(number)Lapsed
(number)
31 December 2017
(number)
Market price
at date of vesting
(£)
Value vested (inclusive of
dividend equivalents)
£’000Earliest
vesting dateJohn Burns
29/05/2014 27.12 44,355 – 11,044 33,311 0 27.73 327 29/05/201730/03/2015 34.65 35,750 – – – 35,750 30/03/201804/04/2016 31.35 40,700 – – – 40,700 04/04/201920/03/2017 27.00 – 47,250 – – 47,250 20/03/2020
120,805 47,250 11,044 33,311 123,700 Simon Silver
29/05/2014 27.12 38,050 – 9,474 28,576 0 27.73 280 29/05/201730/03/2015 34.65 30,675 – – – 30,675 30/03/201804/04/2016 31.35 34,925 – – – 34,925 04/04/201920/03/2017 27.00 – 40,550 – – 40,550 20/03/2020
103,650 40,550 9,474 28,576 106,150 Damian Wisniewski
29/05/2014 27.12 28,245 – 7,033 21,212 0 27.73 208 29/05/201730/03/2015 34.65 22,770 – – – 22,770 30/03/201804/04/2016 31.35 25,930 – – – 25,930 04/04/201920/03/2017 27.00 – 30,850 – – 30,850 20/03/2020
76,945 30,850 7,033 21,212 79,550 Nigel George
29/05/2014 27.12 28,245 – 7,033 21,212 0 27.73 208 29/05/201730/03/2015 34.65 22,770 – – – 22,770 30/03/201804/04/2016 31.35 25,930 – – – 25,930 04/04/201920/03/2017 27.00 – 30,850 – – 30,850 20/03/2020
76,945 30,850 7,033 21,212 79,550 Paul Williams
29/05/2014 27.12 28,245 – 7,033 21,212 0 27.73 208 29/05/201730/03/2015 34.65 22,770 – – – 22,770 30/03/201804/04/2016 31.35 25,930 – – – 25,930 04/04/201920/03/2017 27.00 – 30,850 – – 30,850 20/03/2020
76,945 30,850 7,033 21,212 79,550 David Silverman
29/05/2014 27.12 28,245 – 7,033 21,212 0 27.73 208 29/05/201730/03/2015 34.65 22,770 – – – 22,770 30/03/201804/04/2016 31.35 25,930 – – – 25,930 04/04/201920/03/2017 27.00 – 30,850 – – 30,850 20/03/2020
76,945 30,850 7,033 21,212 79,550 Other employees
29/05/2014 27.12 12,745 – 3,174 9,571 0 27.73 94 29/05/201730/03/2015 34.65 10,280 – – – 10,280 30/03/201822/05/2015 34.65 20,510 – – – 20,510 22/05/201804/04/2016 31.35 28,270 – – – 28,270 04/04/201920/03/2017 27.00 – 42,640 – – 42,640 20/03/2020
71,805 42,640 3,174 9,571 101,700 Total 604,040 253,840 51,824 156,306 649,750 1,533 Notes:(i) The PSP award granted on 29 May 2014 vested on 1 June 2017 at a vesting level of 24.9%. The value of the vesting awards was based on the middle market share price
on the vesting date and is inclusive of a dividend equivalents payment made in cash (see note below for further details).(ii) In accordance with the PSP rules, the Remuneration Committee has discretion to allow PSP participants to receive a payment upon the vesting of their awards, which is
equivalent to the value of any dividends paid on those shares between the grant date and the vesting date. For the 2014 PSP grant, this dividend equivalent payment was made in cash and equated to dividends paid between May 2014 and May 2017. The dividend equivalent payment has been included in the table above, within the value of the vesting awards, and equates to £20,698 for John Burns, £17,755 for Simon Silver and £13,181 for the other executive Directors.
(iii) The PSP award granted on 20 March 2017 will vest on 20 March 2020. The performance targets attached to this award are detailed on page 124.
31 December 2017
31 December2016
1 January2016
Weighted average exercise price of PSP awards – – –Weighted average remaining contracted life of PSP awards 1.24 years 1.31 years 1.29 years
At each year end, none of the outstanding awards were exercisable. The weighted average exercise price of awards that either vested or lapsed in 2017 was £nil (2016: £nil). The weighted average market price of awards vesting in 2017 was £27.73 (2016: £32.05).
Remuneration Committee reportcontinued
129128
Derwent London plc Report & Accounts 2017 Derwent London plc Report & Accounts 2017

Remuneration Policy reportDerwent London’s Remuneration Policy remains unchanged from that approved by shareholders at the AGM on 19 May 2017 (which was approved by 98.40% of those shareholders who voted). For convenience, extracts from the policy are included below (with numbers and dates appropriately updated) to provide context for how decisions were made during the year. Our full Remuneration Policy can be found on our website at: www.derwentlondon.com/investors/governance/board-committees
Remuneration for executive Directors comprises the following elements:
Summary of remuneration elements for executive Directors
Fixed payBase salary Benefits PensionPurpose and link to strategyTo help recruit, retain and motivate high calibre executives. Reflects experience and importance to the business.
Purpose and link to strategyTo provide a market-competitive benefits package to help recruit and retain high-calibre executives. Medical benefits to help minimise disruption to business.
Purpose and link to strategyTo help recruit and retain high-calibre executives and reward continued contribution to the business.
Operation Normally reviewed annually. Any increase is normally effective from 1 January. Factors taken into account in the review include:• The role, experience and performance of the individual
and the Company;• Economic conditions;• Increases throughout the rest of the business; and• Levels in companies with similar business
characteristics.Salaries are set after having due regard to the salary levels operating in companies of a broadly similar size and complexity, the responsibilities of each individual role, individual performance and an individual’s experience.
OperationBenefits include, but are not limited to, private medical insurance, car and fuel allowance and life assurance.In certain circumstances, the Committee may also approve additional allowances relating to relocation of an executive Director or other expatriate benefits required to perform the role.The Committee may provide other employee benefits to executive Directors on broadly similar terms to the wider workforce.The Committee has the ability to reimburse reasonable business related expenses and any tax thereon.
OperationThe Company operates a defined contribution pension scheme. Where contributions would exceed either the lifetime or annual contribution limits, cash payments in lieu are made.
MaximumThe current salary levels are detailed in the Annual Report on Remuneration on page 125 and will be eligible for increases during the period that the Directors’ Remuneration Policy operates.During this time, to the extent that salaries are increased, increases will normally be consistent with the policy applied to the workforce generally (in a percentage of salary terms).Increases beyond those linked to the workforce generally (in a percentage of salary terms) may be awarded in certain circumstances such as where there is a change in responsibility, experience or a significant increase in the scale of the role and/or size, value and/or complexity of the Group.The Committee retains the flexibility to set the salary of a new hire at a discount to the market level initially, and to implement a series of planned increases over the subsequent few years, potentially higher than for the wider workforce, in order to bring the salary to the desired position, subject to individual performance.
MaximumThe maximum cost of providing benefits is not pre-determined and may vary from year-to-year based on the overall cost to the Company in securing these benefits for a population of employees (particularly health insurance and death-in-service cover).The only benefit which is considered to be significant in value terms is the provision of a company car (or the provision of cash in lieu of providing a company car). The value of the benefit will be either the taxable value assessed according to HMRC rules when a company car is provided or the cash amount in the case of cash in lieu of a company car. In either case, the provision of this benefit is limited to a cost of £50,000 per annum.The Committee has discretion to approve a higher cost in exceptional circumstances (such as relocation), or where factors outside of the Committee’s control have changed materially (such as increases in insurance premiums).
MaximumDirectors receive a contribution or cash supplement (or a mix of both) of up to 20% of salary.Legacy arrangements for some Directors mean that a fixed amount is paid in addition to the 20% contribution. The continuation of these arrangements for existing employees means that their maximum pension will be up to 21% of salary.
Performance frameworkA broad assessment of personal and corporate performance is considered as part of the salary review.
Performance frameworkNone.
Performance frameworkNone.
Fixed pay Variable pay
Performance-based
Total remuneration
A summary of our policy on fixed pay is on page 131 Fixed pay in 2017 is on page 121
A summary of our policy on variable pay is on page 132 Variable pay in 2017 is on pages 122 and 123
Details on the total remuneration paid to our Directors in 2017 is on page 120
Base salary + Benefits + Pension + Annual bonus + Long-term incentive =
Our aimsThe key aims of the Committee’s Remuneration Policy for senior executives are:
• To ensure that the Company attracts, retains and motivates executives who have the skills and experience necessary to make a significant contribution to the delivery of the Group’s objectives;
• To incentivise key executives through a remuneration package that is appropriately competitive with other real estate companies taking into account the experience and importance to the business of the individuals involved, while also having broad regard to the level of remuneration in FTSE 350 companies of a similar size. The Committee also takes account of the pay and conditions throughout the Company;
• To align, as far as possible, the interests of the senior executives with those of shareholders by providing a significant proportion of the Directors’ total remuneration potential through a balanced mix of short- and long-term performance-related elements that are consistent with the Group’s business strategy;
• To enable executive Directors to accumulate shareholdings in the Company over time that are personally meaningful to them;• To ensure that performance measures under incentive schemes support the Company’s strategy, have appropriately stretching
performance conditions attached and are designed so as to be consistent with best practice; and• To ensure that the Group’s remuneration structure does not encourage management to adopt an unacceptable risk profile for
the business.
131130
Derwent London plc Report & Accounts 2017 Derwent London plc Report & Accounts 2017
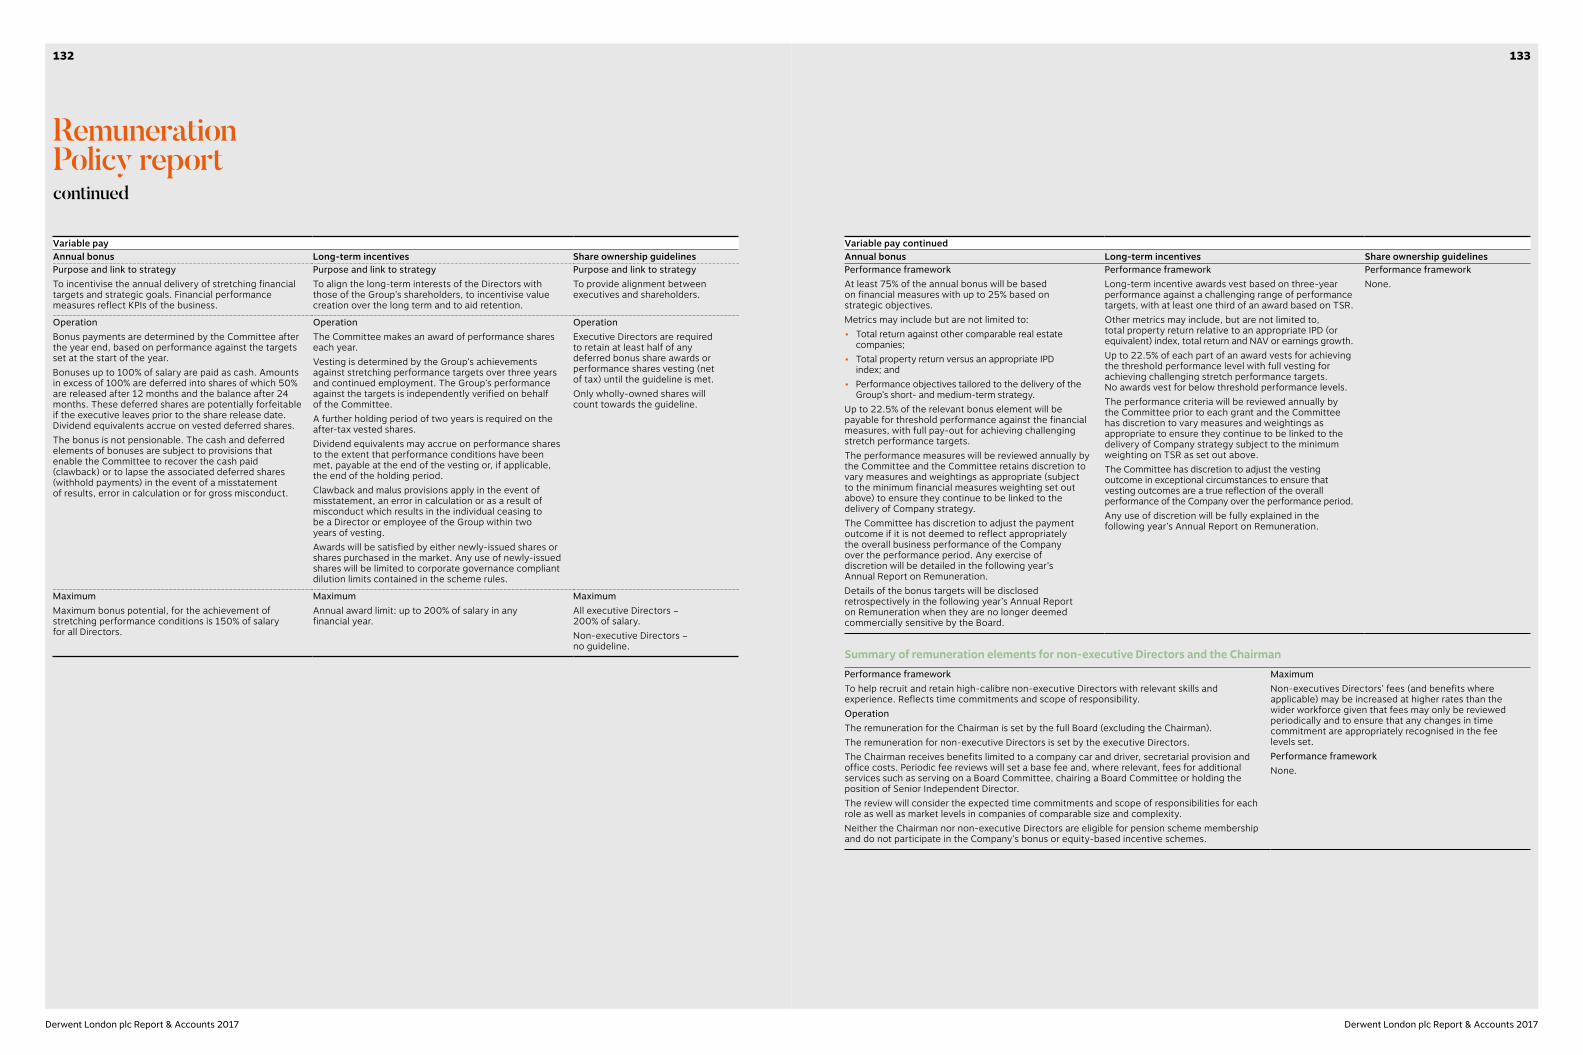
Variable payAnnual bonus Long-term incentives Share ownership guidelinesPurpose and link to strategyTo incentivise the annual delivery of stretching financial targets and strategic goals. Financial performance measures reflect KPIs of the business.
Purpose and link to strategyTo align the long-term interests of the Directors with those of the Group’s shareholders, to incentivise value creation over the long term and to aid retention.
Purpose and link to strategyTo provide alignment between executives and shareholders.
Operation Bonus payments are determined by the Committee after the year end, based on performance against the targets set at the start of the year. Bonuses up to 100% of salary are paid as cash. Amounts in excess of 100% are deferred into shares of which 50% are released after 12 months and the balance after 24 months. These deferred shares are potentially forfeitable if the executive leaves prior to the share release date. Dividend equivalents accrue on vested deferred shares.The bonus is not pensionable. The cash and deferred elements of bonuses are subject to provisions that enable the Committee to recover the cash paid (clawback) or to lapse the associated deferred shares (withhold payments) in the event of a misstatement of results, error in calculation or for gross misconduct.
OperationThe Committee makes an award of performance shares each year. Vesting is determined by the Group’s achievements against stretching performance targets over three years and continued employment. The Group’s performance against the targets is independently verified on behalf of the Committee. A further holding period of two years is required on the after-tax vested shares.Dividend equivalents may accrue on performance shares to the extent that performance conditions have been met, payable at the end of the vesting or, if applicable, the end of the holding period.Clawback and malus provisions apply in the event of misstatement, an error in calculation or as a result of misconduct which results in the individual ceasing to be a Director or employee of the Group within two years of vesting.Awards will be satisfied by either newly-issued shares or shares purchased in the market. Any use of newly-issued shares will be limited to corporate governance compliant dilution limits contained in the scheme rules.
OperationExecutive Directors are required to retain at least half of any deferred bonus share awards or performance shares vesting (net of tax) until the guideline is met.Only wholly-owned shares will count towards the guideline.
MaximumMaximum bonus potential, for the achievement of stretching performance conditions is 150% of salary for all Directors.
MaximumAnnual award limit: up to 200% of salary in any financial year.
MaximumAll executive Directors – 200% of salary.Non-executive Directors – no guideline.
Variable pay continuedAnnual bonus Long-term incentives Share ownership guidelinesPerformance frameworkAt least 75% of the annual bonus will be based on financial measures with up to 25% based on strategic objectives. Metrics may include but are not limited to:• Total return against other comparable real estate
companies; • Total property return versus an appropriate IPD
index; and• Performance objectives tailored to the delivery of the
Group’s short- and medium-term strategy.Up to 22.5% of the relevant bonus element will be payable for threshold performance against the financial measures, with full pay-out for achieving challenging stretch performance targets.The performance measures will be reviewed annually by the Committee and the Committee retains discretion to vary measures and weightings as appropriate (subject to the minimum financial measures weighting set out above) to ensure they continue to be linked to the delivery of Company strategy.The Committee has discretion to adjust the payment outcome if it is not deemed to reflect appropriately the overall business performance of the Company over the performance period. Any exercise of discretion will be detailed in the following year’s Annual Report on Remuneration.Details of the bonus targets will be disclosed retrospectively in the following year’s Annual Report on Remuneration when they are no longer deemed commercially sensitive by the Board.
Performance frameworkLong-term incentive awards vest based on three-year performance against a challenging range of performance targets, with at least one third of an award based on TSR.Other metrics may include, but are not limited to, total property return relative to an appropriate IPD (or equivalent) index, total return and NAV or earnings growth.Up to 22.5% of each part of an award vests for achieving the threshold performance level with full vesting for achieving challenging stretch performance targets. No awards vest for below threshold performance levels.The performance criteria will be reviewed annually by the Committee prior to each grant and the Committee has discretion to vary measures and weightings as appropriate to ensure they continue to be linked to the delivery of Company strategy subject to the minimum weighting on TSR as set out above.The Committee has discretion to adjust the vesting outcome in exceptional circumstances to ensure that vesting outcomes are a true reflection of the overall performance of the Company over the performance period. Any use of discretion will be fully explained in the following year’s Annual Report on Remuneration.
Performance frameworkNone.
Summary of remuneration elements for non-executive Directors and the ChairmanPerformance frameworkTo help recruit and retain high-calibre non-executive Directors with relevant skills and experience. Reflects time commitments and scope of responsibility. OperationThe remuneration for the Chairman is set by the full Board (excluding the Chairman).The remuneration for non-executive Directors is set by the executive Directors. The Chairman receives benefits limited to a company car and driver, secretarial provision and office costs. Periodic fee reviews will set a base fee and, where relevant, fees for additional services such as serving on a Board Committee, chairing a Board Committee or holding the position of Senior Independent Director. The review will consider the expected time commitments and scope of responsibilities for each role as well as market levels in companies of comparable size and complexity.Neither the Chairman nor non-executive Directors are eligible for pension scheme membership and do not participate in the Company’s bonus or equity-based incentive schemes.
MaximumNon-executives Directors’ fees (and benefits where applicable) may be increased at higher rates than the wider workforce given that fees may only be reviewed periodically and to ensure that any changes in time commitment are appropriately recognised in the fee levels set.Performance frameworkNone.
Remuneration Policy reportcontinued
133132
Derwent London plc Report & Accounts 2017 Derwent London plc Report & Accounts 2017

Remuneration Policy reportcontinued
Illustrating the application of the Remuneration PolicyThe Committee aims to provide a significant part of the Directors’ total remuneration through variable pay and the following diagram illustrates the remuneration opportunity provided to the Directors by the remuneration structure at minimum, target and maximum levels of performance.
0
3,500
3,000
2,500
2,000
1,500
1,000
500
Remuneration scenarios for executive Directors
£’000s
Minimum
100%
£859
£1,647
£3,159
52%
30%
27%
31%18%
42%
100%
£730
£2,704
52%
30%
27%
31%18%
42%
100%£539
£1,054
£2,040
52%
30%
27%
31%18%
42%
TargetJohn Burns
Maximum Minimum TargetSimon Silver
Maximum Minimum TargetOther Directors
Maximum
Fixed elements Annual variable element Long-term variable element
£1,407
The potential reward opportunities illustrated above were calculated using base salaries effective from 1 January 2018 (full details of remuneration for 2018 can be found on pages 125 to 126). The assumptions set out below have been made in compiling the above charts:Assumptions Minimum Target MaximumFixed pay Base salary effective 1 January
2018. The value of benefits relates to taxable benefits and is based on the cost of supplying those benefits in the year ended 31 December 2017, as a proxy. Pension value set at 20% of salary.
Base salary effective 1 January 2018. The value of benefits relates to taxable benefits and is based on the cost of supplying those benefits in the year ended 31 December 2017, as a proxy. Pension value set at 20% of salary.
Base salary effective 1 January 2018. The value of benefits relates to taxable benefits and is based on the cost of supplying those benefits in the year ended 31 December 2017, as a proxy. Pension value set at 20% of salary.
Annual bonus No annual bonus payable. 50% of annual bonus payable (equivalent to 75% of base salary).
Maximum annual bonus (100% of bonus potential equivalent to 150% of base salary).
PSP No LTIP awards vest. 22.5% vesting of the LTIP awards. Full vesting (100% of award equivalent to 200% of base salary).
Notes:Amounts have been rounded to the nearest £1,000.Share price growth on vesting and any dividends payable on vesting shares have been ignored.Non-taxable benefits (life assurance) are excluded.Other Directors are: Damian Wisniewski, Paul Williams, Nigel George and David Silverman, whose salary, annual bonus and LTIP arrangements for 2018 are identical. The benefit value for the ‘other Directors’ is based on the highest benefit received in the year ended 31 December 2017.
Service contracts and compensation for loss of officeAs part of the major review of the Directors’ remuneration structure undertaken in 2013/2014, all the executive Directors entered into new service contracts dated 16 May 2014. Executive Directors’ service contracts are terminable either by the Company providing 12 months’ notice or by the executive providing six months’ notice. Contracts include a payment in lieu of notice clause which provides for monthly-phased payments throughout the notice period which include pro-rated salary, benefits and pension only and are subject to mitigation. In addition, the Company may also make payments in relation to any statutory claim against the Company or make a modest provision in respect of legal costs or outplacement fees. The new service contracts have no change of control provisions and all other elements were brought up-to-date in line with best practice.
With regard to annual bonus for a departing executive Director, if employment ends by reason of death, retirement, injury, ill-health, disability, redundancy or transfer of employment outside the Group, or any other reason as determined by the Committee, i.e. the individual is a ‘good leaver’, the executive Director may be considered for a bonus payment. If the termination is for any other reason, any entitlement to bonus would normally lapse. Under any circumstance, it is the Committee’s policy to ensure that any bonus payment reflects the departing executive Director’s performance. Any bonus payment will normally be delayed until the performance conditions have been determined for the relevant period and be subject to a pro-rata reduction for the portion of the relevant bonus year that the individual was employed. Deferred bonus share awards will normally lapse on cessation of employment, however, in the case of good leavers, awards typically vest on the normal vesting date (or on cessation in the event of death).
With regards to PSP awards, if a participant resigns voluntarily, the award lapses. The 2014 PSP rules provide standard ‘good leaver’ definitions for death, retirement, injury, ill-health, disability, redundancy or transfer of employment outside the Group, or any other reason at the Committee’s discretion, whereby awards will vest at their original vesting date subject to performance criteria being achieved and time pro-rating to reduce vested awards for time served in the relevant period. The Committee can decide not to pro-rate an award if it regards it as inappropriate to do so in the particular circumstances. Alternatively, for a ‘good leaver’, the Committee can decide that the award will vest on cessation subject to the performance conditions measured at that time and the same pro-rating described above. Such treatment will apply in the case of death.
In the event of a change of control, the treatment detailed above for good leavers would apply albeit with performance tested over the shortened performance period, and early vesting (if appropriate).
The non-executive Directors listed below do not have service contracts but are appointed for three-year terms which expire as follows:
Non-executive DirectorDate of latest
appointment letter Expiry dateClaudia Arney 17 April 2015 31 May 2018Simon Fraser 27 July 2016 31 August 2018Cilla Snowball 26 May 2015 31 August 2018Robert Rayne 25 March 2016 25 March 2019Stephen Young 2 February 2017 31 July 2019Richard Dakin 2 February 2017 31 July 2019Helen Gordon 8 November 2017 1 January 2021Note: Helen Gordon’s appointment commenced on 1 January 2018.
Robert Rayne has a letter of appointment, which runs for three years, expiring on 25 March 2019. In addition to his fee as Chairman, it provides for a car (and fuel allowance), driver and secretary, together with a contribution to his office running costs. His letter of appointment also contains provisions relating to payment in lieu of notice.
Recruitment and promotion policyThe complete policy on recruitment and promotion is contained in the Policy Report on our corporate website and in the 2016 Annual Report and Accounts. Below is an abbreviated version of our policy.
When facilitating an external recruitment or an internal promotion the Committee will apply the same principles as contained in the ‘Executive Director policy table’ on pages 131 to 133 of this report. In addition to these elements, the Committee may pay relevant relocation and legal expenses in order to facilitate a recruitment. Annual bonus payments will be pro-rated for the period of employment and, depending on the nature and timing of an appointment, the Committee reserves the right to set different performance measures, targets and weightings for the first bonus plan year if considered appropriate. In respect to an internal hire, existing long-term incentive awards would continue over their original vesting period and remain subject to their terms as at the date of grant.
Should it be the case that the Remuneration Committee considers it necessary to buy out remuneration which an individual would forfeit on leaving their current employer, such compensation would be structured so that the terms of the buy-out would have a fair value no higher than that of what is being forfeited and would generally be determined on a comparable basis taking into account the form, structure and vesting schedule of the remuneration being replaced as well as the probability of vesting. The Committee has the discretion to determine the type of replacement award (cash, shares), the vesting period and whether or not performance conditions apply. Where possible this will be accommodated under the Company’s existing incentive plans, but it may be necessary to utilise the exemption under rule 9.4.2 of the Listing Rules. Shareholders will be informed of any such payments in the following year’s Annual Report on Remuneration.
135134
Derwent London plc Report & Accounts 2017 Derwent London plc Report & Accounts 2017
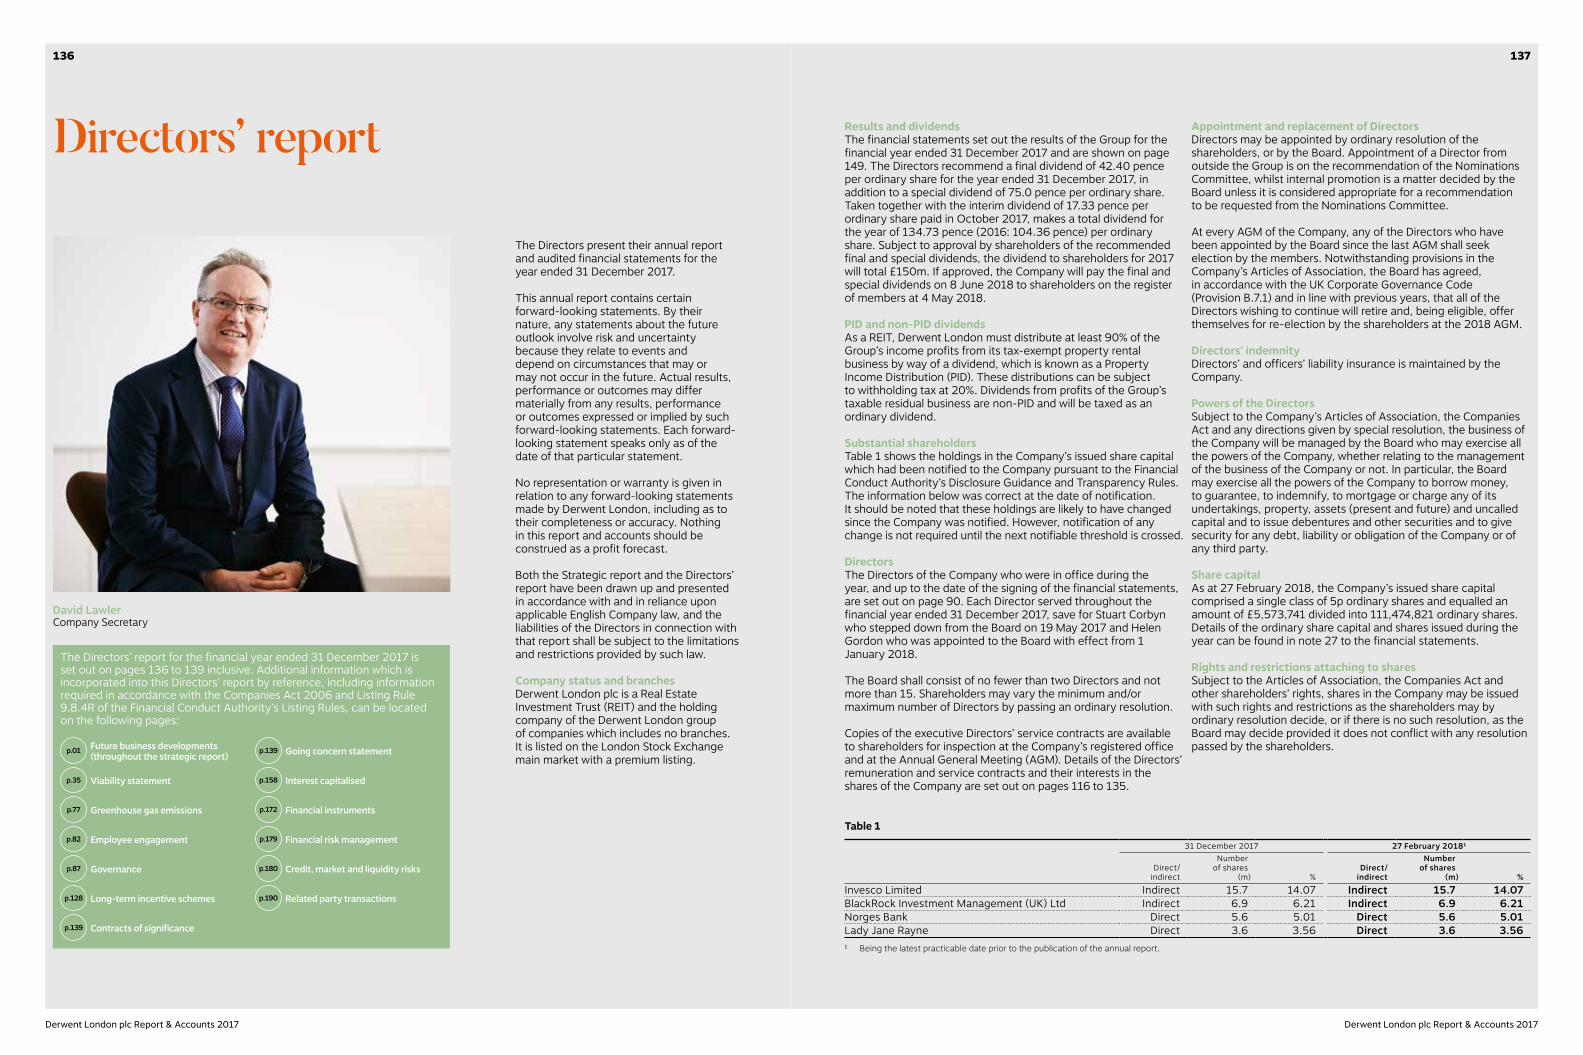
Directors’ report
The Directors present their annual report and audited financial statements for the year ended 31 December 2017.
This annual report contains certain forward-looking statements. By their nature, any statements about the future outlook involve risk and uncertainty because they relate to events and depend on circumstances that may or may not occur in the future. Actual results, performance or outcomes may differ materially from any results, performance or outcomes expressed or implied by such forward-looking statements. Each forward-looking statement speaks only as of the date of that particular statement.
No representation or warranty is given in relation to any forward-looking statements made by Derwent London, including as to their completeness or accuracy. Nothing in this report and accounts should be construed as a profit forecast.
Both the Strategic report and the Directors’ report have been drawn up and presented in accordance with and in reliance upon applicable English Company law, and the liabilities of the Directors in connection with that report shall be subject to the limitations and restrictions provided by such law.
Company status and branchesDerwent London plc is a Real Estate Investment Trust (REIT) and the holding company of the Derwent London group of companies which includes no branches. It is listed on the London Stock Exchange main market with a premium listing.
Results and dividendsThe financial statements set out the results of the Group for the financial year ended 31 December 2017 and are shown on page 149. The Directors recommend a final dividend of 42.40 pence per ordinary share for the year ended 31 December 2017, in addition to a special dividend of 75.0 pence per ordinary share. Taken together with the interim dividend of 17.33 pence per ordinary share paid in October 2017, makes a total dividend for the year of 134.73 pence (2016: 104.36 pence) per ordinary share. Subject to approval by shareholders of the recommended final and special dividends, the dividend to shareholders for 2017 will total £150m. If approved, the Company will pay the final and special dividends on 8 June 2018 to shareholders on the register of members at 4 May 2018.
PID and non-PID dividendsAs a REIT, Derwent London must distribute at least 90% of the Group’s income profits from its tax-exempt property rental business by way of a dividend, which is known as a Property Income Distribution (PID). These distributions can be subject to withholding tax at 20%. Dividends from profits of the Group’s taxable residual business are non-PID and will be taxed as an ordinary dividend.
Substantial shareholdersTable 1 shows the holdings in the Company’s issued share capital which had been notified to the Company pursuant to the Financial Conduct Authority’s Disclosure Guidance and Transparency Rules. The information below was correct at the date of notification. It should be noted that these holdings are likely to have changed since the Company was notified. However, notification of any change is not required until the next notifiable threshold is crossed.
DirectorsThe Directors of the Company who were in office during the year, and up to the date of the signing of the financial statements, are set out on page 90. Each Director served throughout the financial year ended 31 December 2017, save for Stuart Corbyn who stepped down from the Board on 19 May 2017 and Helen Gordon who was appointed to the Board with effect from 1 January 2018.
The Board shall consist of no fewer than two Directors and not more than 15. Shareholders may vary the minimum and/or maximum number of Directors by passing an ordinary resolution.
Copies of the executive Directors’ service contracts are available to shareholders for inspection at the Company’s registered office and at the Annual General Meeting (AGM). Details of the Directors’ remuneration and service contracts and their interests in the shares of the Company are set out on pages 116 to 135.
Appointment and replacement of DirectorsDirectors may be appointed by ordinary resolution of the shareholders, or by the Board. Appointment of a Director from outside the Group is on the recommendation of the Nominations Committee, whilst internal promotion is a matter decided by the Board unless it is considered appropriate for a recommendation to be requested from the Nominations Committee.
At every AGM of the Company, any of the Directors who have been appointed by the Board since the last AGM shall seek election by the members. Notwithstanding provisions in the Company’s Articles of Association, the Board has agreed, in accordance with the UK Corporate Governance Code (Provision B.7.1) and in line with previous years, that all of the Directors wishing to continue will retire and, being eligible, offer themselves for re-election by the shareholders at the 2018 AGM.
Directors’ indemnityDirectors’ and officers’ liability insurance is maintained by the Company.
Powers of the DirectorsSubject to the Company’s Articles of Association, the Companies Act and any directions given by special resolution, the business of the Company will be managed by the Board who may exercise all the powers of the Company, whether relating to the management of the business of the Company or not. In particular, the Board may exercise all the powers of the Company to borrow money, to guarantee, to indemnify, to mortgage or charge any of its undertakings, property, assets (present and future) and uncalled capital and to issue debentures and other securities and to give security for any debt, liability or obligation of the Company or of any third party.
Share capitalAs at 27 February 2018, the Company’s issued share capital comprised a single class of 5p ordinary shares and equalled an amount of £5,573,741 divided into 111,474,821 ordinary shares. Details of the ordinary share capital and shares issued during the year can be found in note 27 to the financial statements.
Rights and restrictions attaching to sharesSubject to the Articles of Association, the Companies Act and other shareholders’ rights, shares in the Company may be issued with such rights and restrictions as the shareholders may by ordinary resolution decide, or if there is no such resolution, as the Board may decide provided it does not conflict with any resolution passed by the shareholders.
Table 1
31 December 2017 27 February 20181
Direct/indirect
Number of shares
(m) %Direct/
indirect
Number of shares
(m) %Invesco Limited Indirect 15.7 14.07 Indirect 15.7 14.07BlackRock Investment Management (UK) Ltd Indirect 6.9 6.21 Indirect 6.9 6.21Norges Bank Direct 5.6 5.01 Direct 5.6 5.01Lady Jane Rayne Direct 3.6 3.56 Direct 3.6 3.561 Being the latest practicable date prior to the publication of the annual report.
David Lawler Company Secretary
The Directors’ report for the financial year ended 31 December 2017 is set out on pages 136 to 139 inclusive. Additional information which is incorporated into this Directors’ report by reference, including information required in accordance with the Companies Act 2006 and Listing Rule 9.8.4R of the Financial Conduct Authority’s Listing Rules, can be located on the following pages:
p.01 Future business developments (throughout the strategic report)
p.35 Viability statement
p.77 Greenhouse gas emissions
p.82 Employee engagement
p.87 Governance
p.128 Long-term incentive schemes
p.139 Contracts of significance
p.139 Going concern statement
p.158 Interest capitalised
p.172 Financial instruments
p.179 Financial risk management
p.180 Credit, market and liquidity risks
p.190 Related party transactions
137136
Derwent London plc Report & Accounts 2017 Derwent London plc Report & Accounts 2017
Significant agreementsThere are no agreements between the Company and its Directors or employees providing for compensation for loss of office or employment that occurs because of a takeover bid, except that, under the rules of the Group’s share-based remuneration schemes some awards may vest following a change of control.
Some of the Group’s banking arrangements are terminable upon a change of control of the Company.
As a REIT, a tax charge may be levied on the Company if it makes a distribution to another Company which is beneficially entitled to 10% or more of the shares or dividends in the Company or controls 10% or more of the voting rights in the Company, (a substantial shareholder), unless the Company has taken reasonable steps to avoid such a distribution being made. The Company’s Articles of Association give the Directors power to take such steps, including the power to:
• Identify a substantial shareholder;• Withhold the payment of dividends to a substantial
shareholder; and• Require the disposal of shares forming part of a
substantial shareholding.
There is no person with whom the Group has a contractual or other arrangement which is essential to the business of the Company.
Amendment of Articles of AssociationUnless expressly specified to the contrary in the Articles of Association of the Company, the Company’s Articles of Association may be amended by a special resolution of the Company’s shareholders.
Fixed assetsThe Group’s portfolio was professionally revalued at 31 December 2017, resulting in a surplus of £177.1m, before accounting adjustments of £26.4m. The portfolio is included in the Group balance sheet at a carrying value of £4,743m. Further details are given in note 16 of the financial statements.
Post-balance sheet eventsDetails of post-balance sheet events are given in note 35 of the financial statements.
Political donationsThere were no political donations during 2017 (2016: nil).
AuditorsPricewaterhouseCoopers LLP, which was appointed in 2014 following a competitive tender process, has expressed its willingness to continue in office as the Group’s Auditor and accordingly, resolutions to reappoint it and to authorise the Directors to determine its remuneration will be proposed at the AGM. These are resolutions 18 and 19 set out in the Notice of Meeting.
The Directors who held office at the date of approval of this Directors’ report confirm that, so far as they are each aware, there is no relevant audit information of which the Company’s Auditor is unaware and that each Director has taken all the steps that they ought to have taken as a Director to make themselves aware of any relevant audit information and ensure that the Auditor is aware of such information.
Greenhouse gas emissions Our annual GHG (greenhouse gas) emissions footprint for 2017 compared to our 2016 footprint together with a set of intensity ratios appropriate for our business, both of which fulfil the requirements of the Companies Act 2006 (Strategic and Directors’ Report) Regulations 2013 is contained on page 77.
For further analysis and detail on our GHG emissions please see our Annual Sustainability Report, which can be found at: www.derwentlondon.com/sustainability
Going concernUnder Provision C.1.3 of the UK Corporate Governance Code, the Board is required to report whether the business is a going concern. In considering this requirement, the Directors have taken into account the following:
• The Group’s latest rolling forecast for the next two years, in particular the cash flows, borrowings and undrawn facilities. Sensitivity analysis is included within these forecasts;
• The headroom under the Group’s financial covenants; and • The risks included on the Group’s risk register that could impact
on the Group’s liquidity and solvency over the next 12 months.
Having due regard to these matters and after making appropriate enquiries, the Directors have a reasonable expectation that the Group and Company have adequate resources to continue in operational existence until at least February 2019. Therefore, the Board continues to adopt the going concern basis in preparing the financial statements.
Annual General Meeting (AGM)The 34th AGM of Derwent London plc will be held at The Westbury hotel, Bond Street, London W1S 2YF on 18 May 2018 at 10.30 am. The Notice of Meeting together with explanatory notes is contained in the circular to shareholders that accompanies the report and accounts.
The Strategic report and Directors’ report have been approved by the Board of Directors and signed on its behalf by:
David LawlerCompany Secretary 27 February 2018
Directors’ reportcontinued
These rights and restrictions will apply to the relevant shares as if they were set out in the Articles of Association. Subject to the Articles of Association, the Companies Act and other shareholders’ rights, unissued shares are at the disposal of the Board.
Variation of rightsThe rights attached to any class of shares can be amended if approved, either by 75% of shareholders holding the issued shares in that class by amount, or by special resolution passed at a separate meeting of the holders of the relevant class of shares.
Every member and every duly appointed proxy present at a general meeting or class meeting has, upon a show of hands, one vote and every member present in person or by proxy has, upon a poll, one vote for every share held by him or her.
No person holds securities in the Company carrying special rights with regard to control of the Company.
Derwent London shares held by the GroupAt 31 December 2017 the Group held 4,952 Derwent London shares in order to deliver the deferred bonus shares to the Directors and other senior executives when the deferral periods expire. Movements on the holding of these shares are detailed in table 2.
Restrictions on transfer of securities in the CompanyThere are no specific restrictions on the transfer of securities in the Company, which is governed by its Articles of Association and prevailing legislation. The Company is not aware of any agreements between shareholders that may result in restrictions on the transfer of securities.
Powers in relation to the Company issuing or buying back its own sharesAt the 2017 AGM, shareholders authorised the Company to allot relevant securities,
(i) up to a nominal amount of £1,856,497; and(ii) up to a nominal amount of £3,712,994, after deducting
from such limit any relevant securities allotted under (i), in connection with an offer by way of a rights issue.
This authority is renewable annually. A special resolution will be proposed at the 2018 AGM to grant a similar authority (i) up to a nominal amount of £1,857,728 (being one-third of the issued share capital of the Company) or £3,716,013 in connection with an offer by way of a rights issue (being two-thirds of the issued share capital).
In respect to the non-pre-emptive allotment of securities, a special resolution will be proposed to shareholders at the 2018 AGM to renew authority to non-pre-emptively allot securities up to a nominal amount of £278,687 (representing 5% of the issued share capital) in connection with an offer by way of a rights issue (in accordance with s551 of the Companies Act). The Company will also seek authority to make non-pre-emptive issues for cash in connection with rights issues and otherwise up to a nominal amount of £278,687 (representing a further 5% of the issued share capital).
A further special resolution will be proposed to renew the Directors’ authority to repurchase the Company’s ordinary shares in the market. The authority will be limited to a maximum of 11,147,482 ordinary shares and the resolution sets the minimum and maximum prices which may be paid. The Directors will only purchase the Company’s shares in the market if they believe it is in the best interests of shareholders generally.
VotingShareholders will be entitled to vote at a general meeting whether on a show of hands or a poll, as provided in the Companies Act. Where a proxy is given discretion as to how to vote on a show of hands this will be treated as an instruction by the relevant shareholder to vote in the way in which the proxy decides to exercise that discretion. This is subject to any special rights or restrictions as to voting which are given to any shares or upon which any shares may be held at the relevant time and to the Articles of Association.
If more than one joint holder votes (including voting by proxy), the only vote which will count is the vote of the person whose name is listed first on the register for the share.
Restrictions on votingUnless the Directors decide otherwise, a shareholder cannot attend or vote shares at any general meeting of the Company or upon a poll or exercise any other right conferred by membership in relation to general meetings or polls if he has not paid all amounts relating to those shares which are due at the time of the meeting, or if he has been served with a restriction notice (as defined in the Articles of Association) after failure to provide the Company with information concerning interests in those shares required to be provided under the Companies Act.
The Company is not aware of any agreements between shareholders that may result in restrictions on voting rights.
Table 2
Year ended 31 December 2017 Year ended 31 December 2016
As at 1 January
2017 Acquired Disposal
As at 31 December
2017
As at 1 January
2016 Acquired Disposal
As at 31 December
2016Number of 5p ordinary shares 25,040 – 20,088 4,952 44,803 9,906 29,669 25,040 Percentage of issued share capital (%) 0 0 0 0 0 0 Price (£) – 26.73 – – 31.21 31.21 –
139138
Derwent London plc Report & Accounts 2017 Derwent London plc Report & Accounts 2017

Financial statements
03Statement of Directors’ responsibilities ���142Independent Auditor’s report ������������������143Group income statement �������������������������149Group statement of
comprehensive income ������������������������150Balance sheets ����������������������������������������151Statements of changes in equity �������������152Cash flow statements ������������������������������153Notes to the financial statements ������������154
Other informationTen-year summary ����������������������������������202EPRA summary ����������������������������������������203Principal properties ���������������������������������205List of definitions �������������������������������������207Communication with our shareholders ����210
Above and left: The White Chapel Building E1
141140
Derwent London plc Report & Accounts 2017Derwent London plc Report & Accounts 2017
Statement of Directors’ responsibilities
Independent Auditor’s report
The Directors are responsible for preparing the annual report, the report of the Remuneration Committee and the financial statements in accordance with applicable law and regulations.
Company law requires the Directors to prepare financial statements for each financial year. Under that law the Directors have prepared the Group and Company financial statements in accordance with International Financial Reporting Standards (IFRS) as adopted by the EU. Under company law the Directors must not approve the financial statements unless they are satisfied that they give a true and fair view of the state of affairs of the Group and the Company and of the profit or loss of the Group for that period. In preparing these financial statements, the Directors are required to:
• select suitable accounting policies and then apply them consistently;
• make judgements and accounting estimates that are reasonable and prudent;
• state whether applicable IFRSs as adopted by the European Union have been followed, subject to any material departures disclosed and explained in the financial statements; and
• prepare the financial statements on the going concern basis unless it is inappropriate to presume that the Company will continue in business.
The Directors are responsible for keeping adequate accounting records that are sufficient to show and explain the Company’s transactions and disclose with reasonable accuracy at any time the financial position of the Company and the Group and enable them to ensure that the financial statements and the report of the Remuneration Committee comply with the Companies Act 2006 and, as regards the Group financial statements, Article 4 of the IAS Regulation. They are also responsible for safeguarding the assets of the Company and the Group and hence for taking reasonable steps for the prevention and detection of fraud and other irregularities.
Report on the audit of the financial statementsOpinionIn our opinion, Derwent London plc’s Group financial statements and Company financial statements (the ‘financial statements’):
• give a true and fair view of the state of the Group’s and of the Company’s affairs as at 31 December 2017 and of the Group’s profit and the Group’s and the Company’s cash flows for the year then ended;
• have been properly prepared in accordance with IFRSs as adopted by the European Union and, as regards the Company’s financial statements, as applied in accordance with the provisions of the Companies Act 2006; and
• have been prepared in accordance with the requirements of the Companies Act 2006 and, as regards the Group financial statements, Article 4 of the IAS Regulation.
We have audited the financial statements, included within the Report and Accounts (the ‘Annual Report’), which comprise: the balance sheets as at 31 December 2017; the Group income statement and Group statement of comprehensive income for the year ended 31 December 2017; the cash flow statements for the year ended 31 December 2017; the statements of changes in equity for the year ended 31 December 2017; and the notes to the financial statements, which include a description of the significant accounting policies.
Our opinion is consistent with our reporting to the Audit Committee.
Basis for opinionWe conducted our audit in accordance with International Standards on Auditing (UK) (‘ISAs (UK)’) and applicable law. Our responsibilities under ISAs (UK) are further described in the Auditors’ responsibilities for the audit of the financial statements section of our report. We believe that the audit evidence we have obtained is sufficient and appropriate to provide a basis for our opinion.
IndependenceWe remained independent of the Group in accordance with the ethical requirements that are relevant to our audit of the financial statements in the UK, which includes the FRC’s Ethical Standard, as applicable to listed public interest entities, and we have fulfilled our other ethical responsibilities in accordance with these requirements.
To the best of our knowledge and belief, we declare that non-audit services prohibited by the FRC’s Ethical Standard were not provided to the Group or the Company.
Other than those disclosed in the Audit Committee Report, we have provided no non-audit services to the Group or the Company in the period from 1 January 2017 to 31 December 2017.
The Directors are responsible for the maintenance and integrity of the Company’s website. Legislation in the United Kingdom governing the preparation and dissemination of financial statements may differ from legislation in other jurisdictions.
The Directors consider that the annual report and accounts, taken as a whole, is fair, balanced and understandable and provides the information necessary for shareholders to assess the Group’s position, performance, business model and strategy.
Each of the Directors, whose names and functions are listed on page 90, confirm that to the best of their knowledge:
• The Group financial statements, which have been prepared in accordance with IFRSs as adopted by the EU, give a true and fair view of the assets, liabilities, financial position and profit and loss of the Group; and
• The Strategic Report includes a fair review of the development and performance of the business and the position of the Group, together with a description of the principal risks and uncertainties that it faces.
The financial statements on pages 149 to 201 were approved by the Board of Directors and signed on its behalf by:
John Burns Chief Executive
Damian WisniewskiFinance Director 27 February 2018
Our audit approachOverviewMateriality• Overall Group materiality:
£50.1 million (2016: £50.5 million), based on 1% of total assets.
• Specific Group materiality: £4.0 million (2016: £4.0 million) applied to property and other income, administrative expenses, provisions and working capital balances.
• Overall Company materiality: £34.2 million (2016: £40.4 million) based on 2% of total assets.
Audit scope• We tailored the scope of our audit to ensure that we performed
enough work to be able to give an opinion on the financial statements as a whole, taking into account the geographic structure of the Group, the accounting processes and controls, and the industry in which the Group operates.
• The Group’s properties are spread across 27 statutory entities with the Group financial statements being a consolidation of these entities, the Company and the Group’s joint ventures. All parts of the Group, including the joint ventures, were identified as requiring an audit of their complete financial information, either due to their size or their risk characteristics or statutory requirement. This work, all of which was carried out by the Group audit team, together with additional procedures performed on the consolidation, gave us sufficient appropriate audit evidence for our opinion on the Group financial statements as a whole.
Key audit matters• Valuation of investment properties (Group).• Compliance with REIT guidelines (Group).• Accounting for borrowings and derivatives (Group and parent).
The scope of our auditAs part of designing our audit, we determined materiality and assessed the risks of material misstatement in the financial statements. In particular, we looked at where the Directors made subjective judgements, for example in respect of significant accounting estimates that involved making assumptions and considering future events that are inherently uncertain.
Key auditmatters
Audit scope
Materiality
143142
Derwent London plc Report & Accounts 2017 Derwent London plc Report & Accounts 2017

We gained an understanding of the legal and regulatory framework applicable to the Group and the industry in which it operates, and considered the risk of acts by the Group which were contrary to applicable laws and regulations, including fraud. We designed audit procedures at Group and significant component level to respond to the risk, recognising that the risk of not detecting a material misstatement due to fraud is higher than the risk of not detecting one resulting from error, as fraud may involve deliberate concealment by, for example, forgery or intentional misrepresentations, or through collusion. We focused on laws and regulations that could give rise to a material misstatement in the Group and Company financial statements, including, but not limited to, the Companies Act 2006, the Listing Rules, the UK tax legislation, the REIT rules and equivalent local laws and regulations applicable to the subsidiary companies. Our tests included, but were not limited to, review of the financial statement disclosures to underlying supporting documentation, review of correspondence with legal advisers, enquiries of management and review of the REIT calculations and supporting documentation in so far as they related to the financial statements. There are inherent limitations in the audit procedures described above and the further removed non-compliance with laws and regulations is from the events and transactions reflected in the financial statements, the less likely we would become aware of it.
We did not identify any key audit matters relating to irregularities, including fraud. As in all of our audits we also addressed the risk of management override of internal controls, including testing journals and evaluating whether there was evidence of bias by the Directors that represented a risk of material misstatement due to fraud.
Key audit mattersKey audit matters are those matters that, in the auditors’ professional judgement, were of most significance in the audit of the financial statements of the current period and include the most significant assessed risks of material misstatement (whether or not due to fraud) identified by the auditors, including those which had the greatest effect on: the overall audit strategy; the allocation of resources in the audit; and directing the efforts of the engagement team. These matters, and any comments we make on the results of our procedures thereon, were addressed in the context of our audit of the financial statements as a whole, and in forming our opinion thereon, and we do not provide a separate opinion on these matters. This is not a complete list of all risks identified by our audit.
Key audit matter How our audit addressed the key audit matter
Valuation of investment propertiesGroupRefer to page 108 (Report of the Audit Committee), pages 165 to 168 (Notes to the financial statements – Note 16) and page 199 (Significant accounting policies).
The Group’s investment properties were valued at £4,670.7 million as at 31 December 2017 and a revaluation gain of £147.9 million was accounted for under ‘revaluation surplus’ in the Group income statement. In excess of 98% of the value of the Group’s investment property portfolio comprises offices and commercial space within central London. The remainder of the portfolio represents a retail park, cottages and strategic land in Scotland.
Valuations are carried out by third-party valuers in accordance with the RICS Valuation – Professional Standards and IAS 40.
There are significant judgements and estimates to be made in relation to the valuation of the Group’s investment properties. Where available, the valuations take into account evidence of market transactions for properties and locations comparable to those of the Group.
The central London investment property portfolio mainly features office accommodation and includes:
• Standing investments: These are existing properties that are currently let. They are valued using the income capitalisation method.
• Development projects: These are properties currently under development or identified for future development. They have a different risk and investment profile to the standing investments. These are valued using the residual appraisal method (i.e. by estimating the fair value of the completed project using the income capitalisation method less estimated costs to completion and a risk premium).
The most significant judgments and estimates affecting the valuation included yields and estimated rental value (ERV) growth (as described in note 16 of the financial statements). For development projects, other assumptions including costs to completion and risk premium assumptions are also factored into the valuation.
The existence of significant estimation uncertainty, coupled with the fact that only a small percentage difference in individual property valuations when aggregated could result in material misstatement, is why we have given specific audit focus and attention to this area.
The valuers used by the Group are CBRE Limited for the central London portfolio and Savills for the remaining investment property portfolio in Scotland. We assessed the competence and capabilities of the firms and verified their qualifications by discussing the scope of their work and reviewing the terms of their engagements for unusual terms or fee arrangements. Based on this work, we are satisfied that the firms remain independent and competent and that the scope of their work was appropriate.
We tested the data inputs underpinning the investment property valuation for a sample of properties, including rental income, acquisitions and capital expenditure, by agreeing them to the underlying property records held by the Group to assess the reliability, completeness and accuracy of the underlying data. The underlying property records were assessed for reliability by reviewing signed and approved lease contracts or sale/purchase contracts and by reviewing approved third-party invoices. For the properties currently under development, we traced the costs to date included within development appraisals to quantity surveyor reports and confirmed that they were comparable to costs incurred on similar completed projects. In addition, we visited a number of the key properties in central London that are under development to confirm the status of developments. We met with the external valuers independently of management and obtained the valuation reports to discuss and challenge the valuation methodology and assumptions.
We involved our internal valuation specialists to compare the valuations of each property to our independently formed market expectations and challenged any differences. In doing this we used evidence of comparable market transactions and focused in particular on properties where the growth in capital values was higher or lower than our expectations based on market indices.
We identified the following assets for further testing: standing investments where the valuation fell outside the expected range; ongoing and planned development projects; high value assets over £100m; and acquisitions.
In relation to these assets, we found that yield rates and ERVs were predominantly consistent with comparable information for central London offices and assumptions appropriately reflected comparable market information. Where assumptions did not fall within our expected range, we assessed whether additional evidence presented in arriving at the final valuations was appropriate, and, whether this was robustly challenged by the external independent valuers. Variances were predominantly due to property specific factors such as new lettings at higher rents, movements in ERV or yield to reflect market transactions in close proximity or the derisking of development projects nearing completion. We verified the movements to supporting documentation including evidence of comparable market transactions where appropriate.
We challenged the Directors and Audit Committee on the movements in the valuations and found that they were able to provide explanations and refer to appropriate supporting evidence.
Compliance with REIT guidelinesGroupRefer to page 108 (Report of the Audit Committee) and page 155 (Significant judgements, key assumptions and estimates).
The UK REIT regime grants companies tax exempt status provided they meet the rules within the regime. The rules are complex and the tax exempt status has a significant impact on the financial statements. The complexity of the rules creates a risk of inadvertently breaching and the Group’s profit becoming subject to tax.
We confirmed our understanding of management’s approach to ensuring compliance with the REIT regime rules.
We obtained management’s calculations and supporting documentation, checking their accuracy by verifying the inputs and calculation. We involved our internal specialists to verify the accuracy of the application of the rules.
We found that the assessment prepared was free from material error and consistent with the UK REIT guidelines.
Independent Auditor’s reportContinued
145144
Derwent London plc Report & Accounts 2017 Derwent London plc Report & Accounts 2017
Key audit matter How our audit addressed the key audit matter
Accounting for borrowings and derivativesGroup and parentRefer to page 108 (Report of the Audit Committee), pages 172 to 180 (Notes to the financial statements – Note 23) and pages 200 to 201 (Significant accounting policies).
The Group has secured and unsecured debt totalling £730.8 million (2016: £898.6 million). The debt includes unsecured convertible debt of £145.6 million (2016: £142.9 million) with an option for the Group to convert the debt when certain criteria have been met.
The Group uses interest rate swaps on a portion of its debt. The interest rate swaps were valued at 31 December 2017 by external valuers and the fair value was £7.9 million (2016: £17.3 million). The valuation of the swaps is based on market movements which can fluctuate significantly in the year and could have a material impact on the Group financial statements. The valuation also involves judgement and therefore is considered an area of audit focus.
We obtained and reviewed each loan contract to understand the terms and conditions. Where debt covenants were identified, we re-performed management’s calculations to verify compliance with the contracts. The carrying value of all debt was agreed to third-party confirmations.
For derivatives, we agreed the carrying value to valuations obtained directly from the third-party valuers, JC Rathbone Associates. We assessed the competence and capabilities of the external valuers by considering their qualifications and market experience. We involved our internal specialists who performed independent valuations to recalculate the value using independent market data.
From our work on of the terms of the debt arrangements in place as at 31 December 2017, we consider the borrowings and derivatives to be accounted for appropriately, valued correctly in the context of materiality, and disclosed appropriately.
For each component in the scope of our Group audit, we allocated a materiality that is less than our overall Group materiality. The range of materiality allocated across components was calculated individually based on the materiality of each statutory entity.
We agreed with the Audit Committee that we would report to them misstatements identified during our audit above £2.5 million (Group audit) (2016: £2.6 million) and £1.7 million (Company audit) (2016: £2.0 million) as well as misstatements below those amounts that, in our view, warranted reporting for qualitative reasons.
Going concernIn accordance with ISAs (UK) we report as follows:Reporting obligation OutcomeWe are required to report if we have anything material to add or draw attention to in respect of the Directors’ statement in the financial statements about whether the Directors considered it appropriate to adopt the going concern basis of accounting in preparing the financial statements and the Directors’ identification of any material uncertainties to the Group’s and the Company’s ability to continue as a going concern over a period of at least 12 months from the date of approval of the financial statements.
We have nothing material to add or to draw attention to. However, because not all future events or conditions can be predicted, this statement is not a guarantee as to the Group’s and Company’s ability to continue as a going concern.
We are required to report if the Directors’ statement relating to Going Concern in accordance with Listing Rule 9.8.6R(3) is materially inconsistent with our knowledge obtained in the audit.
We have nothing to report.
Reporting on other information The other information comprises all of the information in the Annual Report other than the financial statements and our auditors’ report thereon. The Directors are responsible for the other information. Our opinion on the financial statements does not cover the other information and, accordingly, we do not express an audit opinion or, except to the extent otherwise explicitly stated in this report, any form of assurance thereon.
In connection with our audit of the financial statements, our responsibility is to read the other information and, in doing so, consider whether the other information is materially inconsistent with the financial statements or our knowledge obtained in the audit, or otherwise appears to be materially misstated. If we identify an apparent material inconsistency or material misstatement, we are required to perform procedures to conclude whether there is a material misstatement of the financial statements or a material misstatement of the other information. If, based on the work we have performed, we conclude that there is a material misstatement of this other information, we are required to report that fact. We have nothing to report based on these responsibilities.
With respect to the Strategic report and Directors’ report, we also considered whether the disclosures required by the UK Companies Act 2006 have been included.
Based on the responsibilities described above and our work undertaken in the course of the audit, the Companies Act 2006, (CA06), ISAs (UK) and the Listing Rules of the Financial Conduct Authority (FCA) require us also to report certain opinions and matters as described below (required by ISAs (UK) unless otherwise stated).
Strategic report and Directors’ reportIn our opinion, based on the work undertaken in the course of the audit, the information given in the Strategic report and Directors’ report for the year ended 31 December 2017 is consistent with the financial statements and has been prepared in accordance with applicable legal requirements. (CA06)
In light of the knowledge and understanding of the Group and Company and their environment obtained in the course of the audit, we did not identify any material misstatements in the Strategic report and Directors’ report. (CA06)
The Directors’ assessment of the prospects of the Group and of the principal risks that would threaten the solvency or liquidity of the GroupWe have nothing material to add or draw attention to regarding:
• The Directors’ confirmation on page 113 of the Annual Report that they have carried out a robust assessment of the principal risks facing the Group, including those that would threaten its business model, future performance, solvency or liquidity.
• The disclosures in the Annual Report that describe those risks and explain how they are being managed or mitigated.
• The Directors’ explanation on page 35 of the Annual Report as to how they have assessed the prospects of the Group, over what period they have done so and why they consider that period to be appropriate, and their statement as to whether they have a reasonable expectation that the Group will be able to continue in operation and meet its liabilities as they fall due over the period of their assessment, including any related disclosures drawing attention to any necessary qualifications or assumptions.
We have nothing to report having performed a review of the Directors’ statement that they have carried out a robust assessment of the principal risks facing the Group and statement in relation to the longer-term viability of the Group. Our review was substantially less in scope than an audit and only consisted of making inquiries and considering the Directors’ process supporting their statements; checking that the statements are in alignment with the relevant provisions of the UK Corporate Governance Code (the ‘Code’); and considering whether the statements are consistent with the knowledge and understanding of the Group and Company and their environment obtained in the course of the audit. (Listing Rules).
Other Code ProvisionsWe have nothing to report in respect of our responsibility to report when:
• The statement given by the Directors, on page 142, that they consider the Annual Report taken as a whole to be fair, balanced and understandable, and provides the information necessary for the members to assess the Group’s and Company’s position and performance, business model and strategy is materially inconsistent with our knowledge of the Group and Company obtained in the course of performing our audit.
• The section of the Annual Report on pages 108 to 109 describing the work of the Audit Committee does not appropriately address matters communicated by us to the Audit Committee.
• The Directors’ statement relating to the Company’s compliance with the Code does not properly disclose a departure from a relevant provision of the Code specified, under the Listing Rules, for review by the auditors.
Directors’ remunerationIn our opinion, the part of the Directors’ remuneration report to be audited has been properly prepared in accordance with the Companies Act 2006 (CA06).
How we tailored the audit scopeWe tailored the scope of our audit to ensure that we performed enough work to be able to give an opinion on the financial statements as a whole, taking into account the structure of the Group and the Company, the accounting processes and controls, and the industry in which they operate.
MaterialityThe scope of our audit was influenced by our application of materiality. We set certain quantitative thresholds for materiality. These, together with qualitative considerations, helped us to determine the scope of our audit and the nature, timing and extent of our audit procedures on the individual financial statement line items and disclosures and in evaluating the effect of misstatements, both individually and in aggregate on the financial statements as a whole.
Based on our professional judgement, we determined materiality for the financial statements as a whole as follows:Group financial statements Company financial statements
Overall materiality £50.1 million (2016: £50.5 million). £34.2 million (2016: £40.4 million).How we determined it 1% of total assets. 2% of total assets.Specific materiality £4.0 million (2016: £4.0 million). –How we determined it 5% of profit before tax excluding investment property
valuation movements and profit on disposal of investment properties and net finance costs (capped at £4.0m).
–
Rationale for benchmark applied
The key driver of the business and determinant of the Group's value is direct property investments. Due to this, the key area of focus in the audit is the valuation of investment properties. On this basis, we set an overall Group materiality level based on total assets. In addition, a number of key performance indicators of the Group are driven by income statement items and we therefore also applied a lower specific materiality for testing property and other income, administrative expenses, provisions and working capital balances.
The key driver of the business and determinant of the Company's value is investments in subsidiaries. Due to this, the key area of focus in the audit is the valuation of investments in subsidiaries. On this basis, we set an overall Company materiality level based on total assets.
Independent Auditor’s reportContinued
147146
Derwent London plc Report & Accounts 2017 Derwent London plc Report & Accounts 2017

Responsibilities for the financial statements and the auditResponsibilities of the Directors for the financial statementsAs explained more fully in the Statement of Directors’ Responsibilities set out on page 142, the Directors are responsible for the preparation of the financial statements in accordance with the applicable framework and for being satisfied that they give a true and fair view. The Directors are also responsible for such internal control as they determine is necessary to enable the preparation of financial statements that are free from material misstatement, whether due to fraud or error.
In preparing the financial statements, the Directors are responsible for assessing the Group’s and the Company’s ability to continue as a going concern, disclosing as applicable, matters related to going concern and using the going concern basis of accounting unless the Directors either intend to liquidate the Group or the Company or to cease operations, or have no realistic alternative but to do so.
Auditors’ responsibilities for the audit of the financial statementsOur objectives are to obtain reasonable assurance about whether the financial statements as a whole are free from material misstatement, whether due to fraud or error, and to issue an auditors’ report that includes our opinion. Reasonable assurance is a high level of assurance, but is not a guarantee that an audit conducted in accordance with ISAs (UK) will always detect a material misstatement when it exists. Misstatements can arise from fraud or error and are considered material if, individually or in the aggregate, they could reasonably be expected to influence the economic decisions of users taken on the basis of these financial statements.
A further description of our responsibilities for the audit of the financial statements is located on the FRC’s website at: www.frc.org.uk/auditorsresponsibilities. This description forms part of our auditors’ report.
Use of this reportThis report, including the opinions, has been prepared for and only for the Company’s members as a body in accordance with Chapter 3 of Part 16 of the Companies Act 2006 and for no other purpose. We do not, in giving these opinions, accept or assume responsibility for any other purpose or to any other person to whom this report is shown or into whose hands it may come save where expressly agreed by our prior consent in writing.
Other required reportingCompanies Act 2006 exception reportingUnder the Companies Act 2006 we are required to report to you if, in our opinion:
• We have not received all the information and explanations we require for our audit; or
• Adequate accounting records have not been kept by the Company, or returns adequate for our audit have not been received from branches not visited by us; or
• Certain disclosures of Directors’ remuneration specified by law are not made; or
• The Company financial statements and the part of the Directors’ remuneration report to be audited are not in agreement with the accounting records and returns.
We have no exceptions to report arising from this responsibility.
AppointmentFollowing the recommendation of the audit committee, we were appointed by the Directors on 14 May 2014 to audit the financial statements for the year ended 31 December 2014 and subsequent financial periods. The period of total uninterrupted engagement is four years, covering the years ended 31 December 2014 to 31 December 2017.
Craig Hughes (Senior Statutory Auditor)for and on behalf of PricewaterhouseCoopers LLPChartered Accountants and Statutory AuditorsLondon
27 February 2018
Independent Auditor’s reportContinued
Group income statementfor the year ended 31 December 2017
Note2017
£m2016
£mGross property and other income 5 202.6 193.7
Net property and other income 5 164.8 149.2Administrative expenses (28.2) (30.9)Revaluation surplus/(deficit) 16 147.9 (37.1)Profit on disposal of investment property 6 50.3 7.5
Profit from operations 334.8 88.7Finance costs 7 (27.1) (27.8)Movement in fair value of derivative financial instruments 9.4 0.3Financial derivative termination costs 8 (7.3) (9.0)Share of results of joint ventures 9 5.0 2.3
Profit before tax 10 314.8 54.5Tax charge 15 (1.8) (0.9)
Profit for the year 313.0 53.6
Attributable to: Equity shareholders 29 314.0 58.7 Non-controlling interest (1.0) (5.1)
313.0 53.6
Earnings per share 38 281.79p 52.73p
Diluted earnings per share 38 281.12p 52.59p
The notes on pages 154 to 201 form part of these financial statements.
149
Derwent London plc Report & Accounts 2017
148
Derwent London plc Report & Accounts 2017
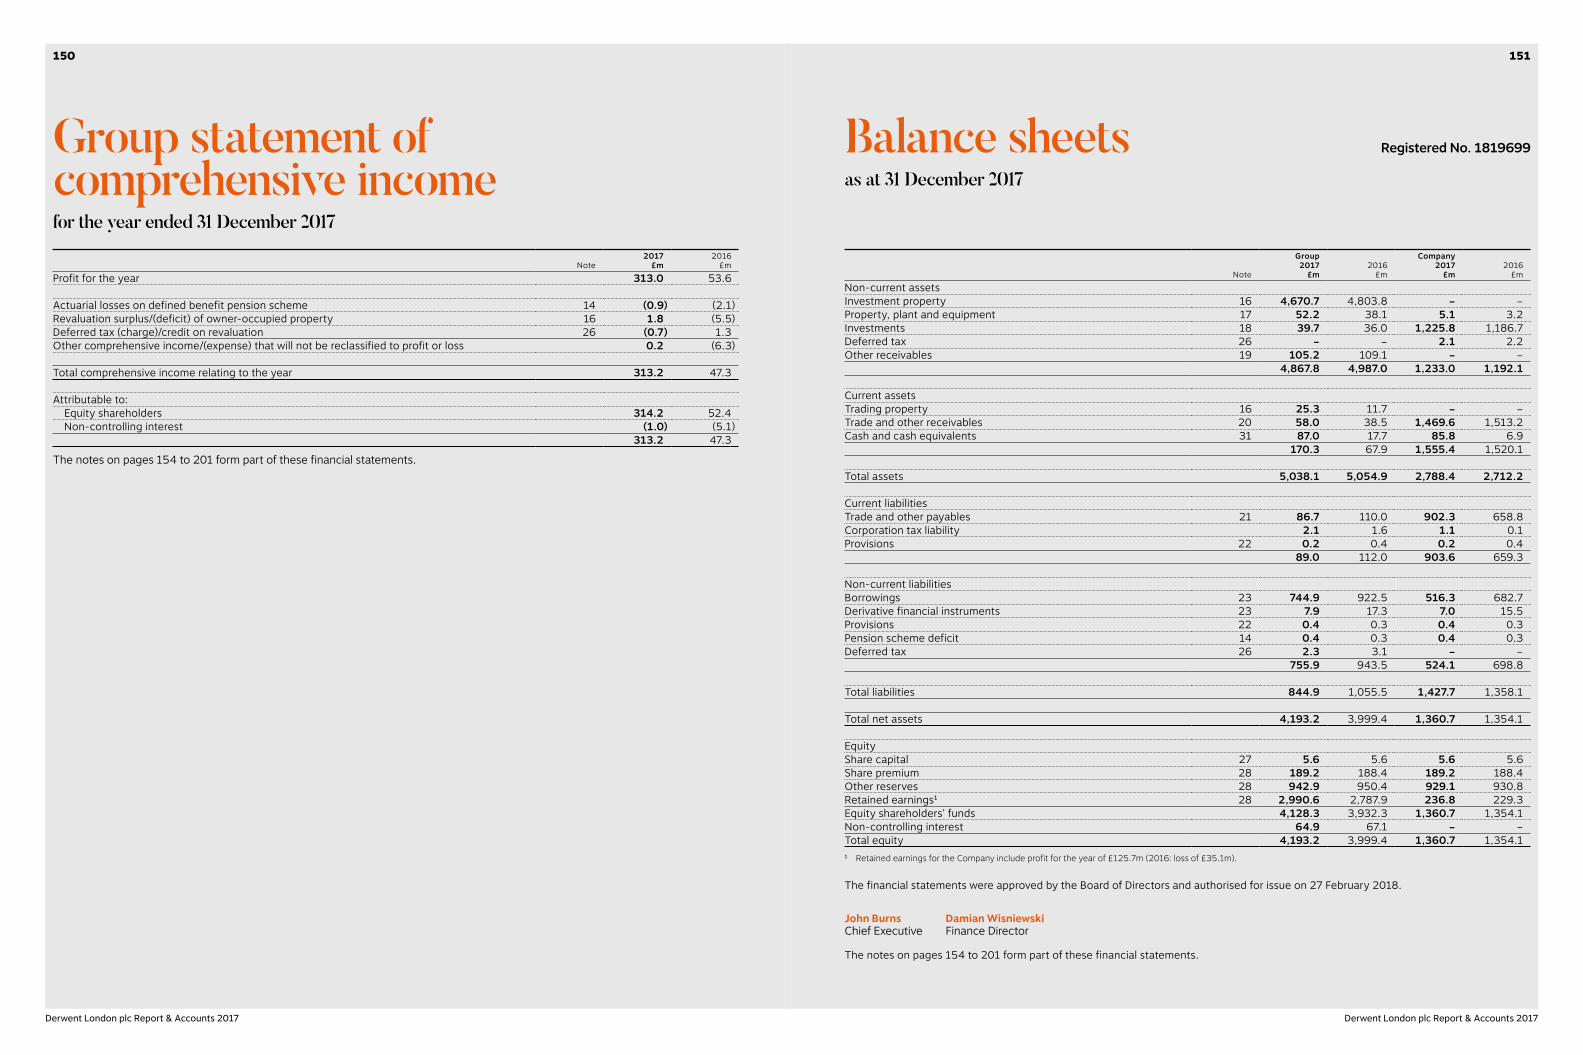
Note
Group2017
£m2016
£m
Company2017
£m2016
£mNon-current assetsInvestment property 16 4,670.7 4,803.8 – –Property, plant and equipment 17 52.2 38.1 5.1 3.2Investments 18 39.7 36.0 1,225.8 1,186.7Deferred tax 26 – – 2.1 2.2Other receivables 19 105.2 109.1 – –
4,867.8 4,987.0 1,233.0 1,192.1
Current assetsTrading property 16 25.3 11.7 – –Trade and other receivables 20 58.0 38.5 1,469.6 1,513.2Cash and cash equivalents 31 87.0 17.7 85.8 6.9
170.3 67.9 1,555.4 1,520.1
Total assets 5,038.1 5,054.9 2,788.4 2,712.2
Current liabilitiesTrade and other payables 21 86.7 110.0 902.3 658.8Corporation tax liability 2.1 1.6 1.1 0.1Provisions 22 0.2 0.4 0.2 0.4
89.0 112.0 903.6 659.3
Non-current liabilitiesBorrowings 23 744.9 922.5 516.3 682.7Derivative financial instruments 23 7.9 17.3 7.0 15.5Provisions 22 0.4 0.3 0.4 0.3Pension scheme deficit 14 0.4 0.3 0.4 0.3Deferred tax 26 2.3 3.1 – –
755.9 943.5 524.1 698.8
Total liabilities 844.9 1,055.5 1,427.7 1,358.1
Total net assets 4,193.2 3,999.4 1,360.7 1,354.1
EquityShare capital 27 5.6 5.6 5.6 5.6Share premium 28 189.2 188.4 189.2 188.4Other reserves 28 942.9 950.4 929.1 930.8Retained earnings1 28 2,990.6 2,787.9 236.8 229.3Equity shareholders’ funds 4,128.3 3,932.3 1,360.7 1,354.1Non-controlling interest 64.9 67.1 – –Total equity 4,193.2 3,999.4 1,360.7 1,354.11 Retained earnings for the Company include profit for the year of £125.7m (2016: loss of £35.1m).
The financial statements were approved by the Board of Directors and authorised for issue on 27 February 2018.
John Burns Damian Wisniewski Chief Executive Finance Director
The notes on pages 154 to 201 form part of these financial statements.
Balance sheets Registered No. 1819699
as at 31 December 2017
Group statement of comprehensive incomefor the year ended 31 December 2017
Note2017
£m2016
£mProfit for the year 313.0 53.6
Actuarial losses on defined benefit pension scheme 14 (0.9) (2.1)Revaluation surplus/(deficit) of owner-occupied property 16 1.8 (5.5)Deferred tax (charge)/credit on revaluation 26 (0.7) 1.3Other comprehensive income/(expense) that will not be reclassified to profit or loss 0.2 (6.3)
Total comprehensive income relating to the year 313.2 47.3
Attributable to: Equity shareholders 314.2 52.4 Non-controlling interest (1.0) (5.1)
313.2 47.3
The notes on pages 154 to 201 form part of these financial statements.
151150
Derwent London plc Report & Accounts 2017 Derwent London plc Report & Accounts 2017

Note
Group2017
£m2016
£m
Company2017
£m2016
£mOperating activitiesProperty income 154.3 147.1 – –Property expenses (19.2) (18.0) – –Cash paid to and on behalf of employees (19.5) (21.8) (19.5) (21.7)Other administrative expenses (7.3) (5.6) (7.9) (6.0)Interest paid 7 (21.7) (22.0) (16.8) (20.8)Other finance costs 7 (3.2) (2.3) (2.2) (1.3)Other income 2.9 2.4 2.4 2.3Tax paid in respect of operating activities (2.8) (2.1) – –Net cash from/(used in) operating activities 83.5 77.7 (44.0) (47.5)
Investing activitiesAcquisition of properties (8.5) (18.0) – –Capital expenditure on the property portfolio 7 (165.0) (213.5) – –Disposal of investment and trading properties 472.9 224.7 – –Investment in joint ventures – (3.0) – (1.3)Repayment of shareholder loan 1.3 – 1.3 –Purchase of property, plant and equipment (5.0) (4.5) (2.7) (1.4)VAT (paid)/received (11.7) 4.8 – –Net cash from/(used in) investing activities 284.0 (9.5) (1.4) (2.7)
Financing activitiesNet movement in intercompany loans – – 420.9 107.7Net movement in revolving bank loans 25 (170.8) (103.9) (170.4) (103.9)Drawdown of private placement notes – 104.3 – 104.3Financial derivative termination costs (7.3) (9.0) (7.3) (9.0)Net proceeds of share issues 27 0.8 1.0 0.8 1.0Dividends paid to non-controlling interest holder (1.2) (0.8) – –Dividends paid 30 (119.7) (48.6) (119.7) (48.6)Net cash (used in)/from financing activities (298.2) (57.0) 124.3 51.5
Increase in cash and cash equivalents in the year 69.3 11.2 78.9 1.3
Cash and cash equivalents at the beginning of the year 17.7 6.5 6.9 5.6
Cash and cash equivalents at the end of the year 31 87.0 17.7 85.8 6.9
The notes on pages 154 to 201 form part of these financial statements.
Cash flow statementsfor the year ended 31 December 2017
Sharecapital
£m
Sharepremium
£m
Otherreserves1
£m
Retainedearnings
£m
Equityshareholders’
funds£m
Non-controlling
interest£m
Totalequity
£mGroupAt 1 January 2017 5.6 188.4 950.4 2,787.9 3,932.3 67.1 3,999.4Profit/(loss) for the year – – – 314.0 314.0 (1.0) 313.0Other comprehensive income/(expense) – – 1.1 (0.9) 0.2 – 0.2Transfer of owner-occupied property – – (6.9) 6.9 – – –Share-based payments – 0.8 (1.7) 2.8 1.9 – 1.9Dividends paid – – – (120.1) (120.1) (1.2) (121.3)At 31 December 2017 5.6 189.2 942.9 2,990.6 4,128.3 64.9 4,193.2
At 1 January 2016 5.6 186.3 952.9 2,777.7 3,922.5 72.9 3,995.4Profit for the year – – – 58.7 58.7 (5.1) 53.6Other comprehensive expense – – (4.2) (2.1) (6.3) – (6.3)Share-based payments – 1.0 1.7 3.3 6.0 – 6.0Dividends paid – – – (48.6) (48.6) (0.7) (49.3)Scrip dividends – 1.1 – (1.1) – – –At 31 December 2016 5.6 188.4 950.4 2,787.9 3,932.3 67.1 3,999.4
CompanyAt 1 January 2017 5.6 188.4 930.8 229.3 1,354.1 – 1,354.1Profit for the year – – – 125.7 125.7 – 125.7Other comprehensive expense – – – (0.9) (0.9) – (0.9)Share-based payments – 0.8 (1.7) 2.8 1.9 – 1.9Dividends paid – – – (120.1) (120.1) – (120.1)At 31 December 2017 5.6 189.2 929.1 236.8 1,360.7 – 1,360.7
At 1 January 2016 5.6 186.3 929.1 312.9 1,433.9 – 1,433.9Loss for the year – – – (35.1) (35.1) – (35.1)Other comprehensive expense – – – (2.1) (2.1) – (2.1)Share-based payments – 1.0 1.7 3.3 6.0 – 6.0Dividends paid – – – (48.6) (48.6) – (48.6)Scrip dividends – 1.1 – (1.1) – – –At 31 December 2016 5.6 188.4 930.8 229.3 1,354.1 – 1,354.11 See note 28.
The notes on pages 154 to 201 form part of these financial statements.
Statements of changes in equityfor the year ended 31 December 2017
153152
Derwent London plc Report & Accounts 2017 Derwent London plc Report & Accounts 2017
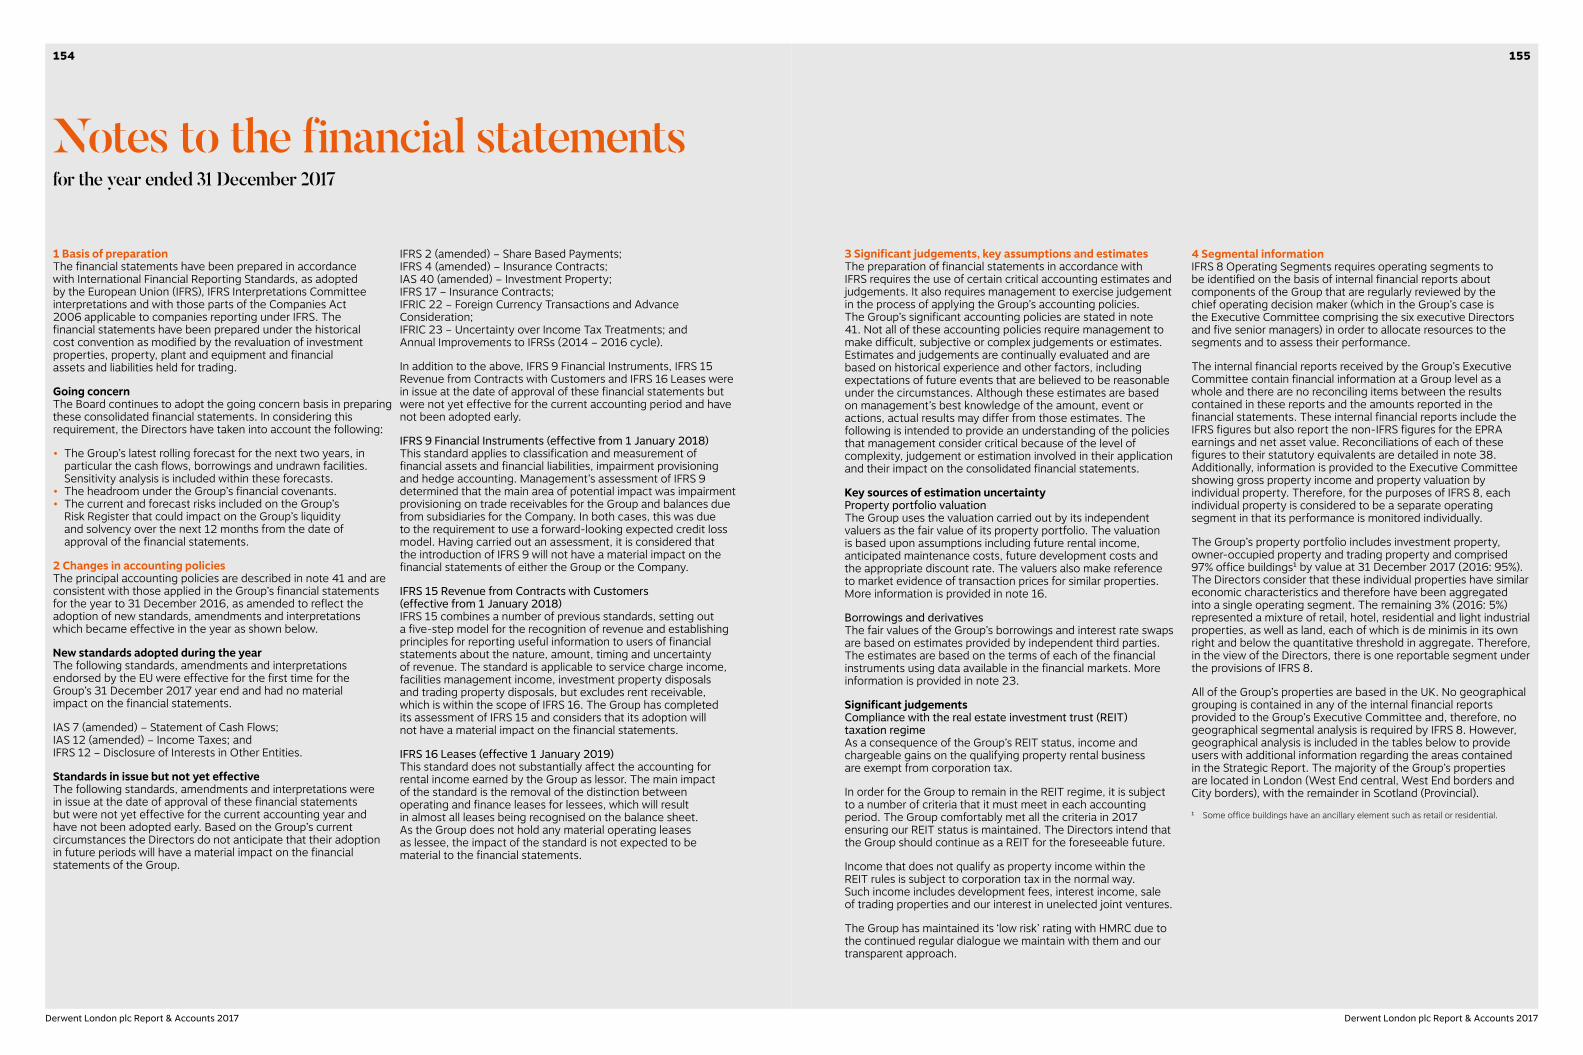
3 Significant judgements, key assumptions and estimatesThe preparation of financial statements in accordance with IFRS requires the use of certain critical accounting estimates and judgements. It also requires management to exercise judgement in the process of applying the Group’s accounting policies. The Group’s significant accounting policies are stated in note 41. Not all of these accounting policies require management to make difficult, subjective or complex judgements or estimates. Estimates and judgements are continually evaluated and are based on historical experience and other factors, including expectations of future events that are believed to be reasonable under the circumstances. Although these estimates are based on management’s best knowledge of the amount, event or actions, actual results may differ from those estimates. The following is intended to provide an understanding of the policies that management consider critical because of the level of complexity, judgement or estimation involved in their application and their impact on the consolidated financial statements.
Key sources of estimation uncertaintyProperty portfolio valuationThe Group uses the valuation carried out by its independent valuers as the fair value of its property portfolio. The valuation is based upon assumptions including future rental income, anticipated maintenance costs, future development costs and the appropriate discount rate. The valuers also make reference to market evidence of transaction prices for similar properties. More information is provided in note 16.
Borrowings and derivativesThe fair values of the Group’s borrowings and interest rate swaps are based on estimates provided by independent third parties. The estimates are based on the terms of each of the financial instruments using data available in the financial markets. More information is provided in note 23.
Significant judgementsCompliance with the real estate investment trust (REIT) taxation regimeAs a consequence of the Group’s REIT status, income and chargeable gains on the qualifying property rental business are exempt from corporation tax.
In order for the Group to remain in the REIT regime, it is subject to a number of criteria that it must meet in each accounting period. The Group comfortably met all the criteria in 2017 ensuring our REIT status is maintained. The Directors intend that the Group should continue as a REIT for the foreseeable future.
Income that does not qualify as property income within the REIT rules is subject to corporation tax in the normal way. Such income includes development fees, interest income, sale of trading properties and our interest in unelected joint ventures.
The Group has maintained its ‘low risk’ rating with HMRC due to the continued regular dialogue we maintain with them and our transparent approach.
4 Segmental informationIFRS 8 Operating Segments requires operating segments to be identified on the basis of internal financial reports about components of the Group that are regularly reviewed by the chief operating decision maker (which in the Group’s case is the Executive Committee comprising the six executive Directors and five senior managers) in order to allocate resources to the segments and to assess their performance.
The internal financial reports received by the Group’s Executive Committee contain financial information at a Group level as a whole and there are no reconciling items between the results contained in these reports and the amounts reported in the financial statements. These internal financial reports include the IFRS figures but also report the non-IFRS figures for the EPRA earnings and net asset value. Reconciliations of each of these figures to their statutory equivalents are detailed in note 38. Additionally, information is provided to the Executive Committee showing gross property income and property valuation by individual property. Therefore, for the purposes of IFRS 8, each individual property is considered to be a separate operating segment in that its performance is monitored individually.
The Group’s property portfolio includes investment property, owner-occupied property and trading property and comprised 97% office buildings1 by value at 31 December 2017 (2016: 95%). The Directors consider that these individual properties have similar economic characteristics and therefore have been aggregated into a single operating segment. The remaining 3% (2016: 5%) represented a mixture of retail, hotel, residential and light industrial properties, as well as land, each of which is de minimis in its own right and below the quantitative threshold in aggregate. Therefore, in the view of the Directors, there is one reportable segment under the provisions of IFRS 8.
All of the Group’s properties are based in the UK. No geographical grouping is contained in any of the internal financial reports provided to the Group’s Executive Committee and, therefore, no geographical segmental analysis is required by IFRS 8. However, geographical analysis is included in the tables below to provide users with additional information regarding the areas contained in the Strategic Report. The majority of the Group’s properties are located in London (West End central, West End borders and City borders), with the remainder in Scotland (Provincial).1 Some office buildings have an ancillary element such as retail or residential.
1 Basis of preparationThe financial statements have been prepared in accordance with International Financial Reporting Standards, as adopted by the European Union (IFRS), IFRS Interpretations Committee interpretations and with those parts of the Companies Act 2006 applicable to companies reporting under IFRS. The financial statements have been prepared under the historical cost convention as modified by the revaluation of investment properties, property, plant and equipment and financial assets and liabilities held for trading.
Going concernThe Board continues to adopt the going concern basis in preparing these consolidated financial statements. In considering this requirement, the Directors have taken into account the following:
• The Group’s latest rolling forecast for the next two years, in particular the cash flows, borrowings and undrawn facilities. Sensitivity analysis is included within these forecasts.
• The headroom under the Group’s financial covenants.• The current and forecast risks included on the Group’s
Risk Register that could impact on the Group’s liquidity and solvency over the next 12 months from the date of approval of the financial statements.
2 Changes in accounting policiesThe principal accounting policies are described in note 41 and are consistent with those applied in the Group’s financial statements for the year to 31 December 2016, as amended to reflect the adoption of new standards, amendments and interpretations which became effective in the year as shown below.
New standards adopted during the yearThe following standards, amendments and interpretations endorsed by the EU were effective for the first time for the Group’s 31 December 2017 year end and had no material impact on the financial statements.
IAS 7 (amended) – Statement of Cash Flows; IAS 12 (amended) – Income Taxes; and IFRS 12 – Disclosure of Interests in Other Entities.
Standards in issue but not yet effectiveThe following standards, amendments and interpretations were in issue at the date of approval of these financial statements but were not yet effective for the current accounting year and have not been adopted early. Based on the Group’s current circumstances the Directors do not anticipate that their adoption in future periods will have a material impact on the financial statements of the Group.
IFRS 2 (amended) – Share Based Payments; IFRS 4 (amended) – Insurance Contracts; IAS 40 (amended) – Investment Property; IFRS 17 – Insurance Contracts; IFRIC 22 – Foreign Currency Transactions and Advance Consideration; IFRIC 23 – Uncertainty over Income Tax Treatments; and Annual Improvements to IFRSs (2014 – 2016 cycle).
In addition to the above, IFRS 9 Financial Instruments, IFRS 15 Revenue from Contracts with Customers and IFRS 16 Leases were in issue at the date of approval of these financial statements but were not yet effective for the current accounting period and have not been adopted early.
IFRS 9 Financial Instruments (effective from 1 January 2018)This standard applies to classification and measurement of financial assets and financial liabilities, impairment provisioning and hedge accounting. Management’s assessment of IFRS 9 determined that the main area of potential impact was impairment provisioning on trade receivables for the Group and balances due from subsidiaries for the Company. In both cases, this was due to the requirement to use a forward-looking expected credit loss model. Having carried out an assessment, it is considered that the introduction of IFRS 9 will not have a material impact on the financial statements of either the Group or the Company.
IFRS 15 Revenue from Contracts with Customers (effective from 1 January 2018)IFRS 15 combines a number of previous standards, setting out a five-step model for the recognition of revenue and establishing principles for reporting useful information to users of financial statements about the nature, amount, timing and uncertainty of revenue. The standard is applicable to service charge income, facilities management income, investment property disposals and trading property disposals, but excludes rent receivable, which is within the scope of IFRS 16. The Group has completed its assessment of IFRS 15 and considers that its adoption will not have a material impact on the financial statements.
IFRS 16 Leases (effective 1 January 2019)This standard does not substantially affect the accounting for rental income earned by the Group as lessor. The main impact of the standard is the removal of the distinction between operating and finance leases for lessees, which will result in almost all leases being recognised on the balance sheet. As the Group does not hold any material operating leases as lessee, the impact of the standard is not expected to be material to the financial statements.
Notes to the financial statementsfor the year ended 31 December 2017
155154
Derwent London plc Report & Accounts 2017 Derwent London plc Report & Accounts 2017

5 Property and other income2017
£m2016
£mGross rental income 172.1 155.4Surrender premiums received 0.1 0.1Other property income – 0.5Gross property income 172.2 156.0Trading property sales proceeds – 12.5Service charge income 27.7 22.8Other income 2.7 2.4Gross property and other income 202.6 193.7
Gross rental income 172.1 155.4Ground rent (0.7) (0.7) Service charge income 27.7 22.8 Service charge expenses (29.6) (24.1)
(1.9) (1.3)Other property costs (8.4) (7.5)Net rental income 161.1 145.9 Trading property sales proceeds – 12.5 Trading property cost of sales – (10.6)Profit on trading property disposals – 1.9Reversal of write-down/(write-down) of trading property 1.0 (1.6)Other property income – 0.5Other income 2.7 2.4Surrender premiums received 0.1 0.1Reverse surrender premiums (0.2) (0.1)Dilapidation receipts 0.1 0.1Net property and other income 164.8 149.2
Rental income included £17.1m (2016: £10.3m) relating to rents recognised in advance of cash receipts.
In 2017 and 2016, other income related to fees and commissions earned in relation to the management of the Group’s properties and was recognised in the Group income statement in accordance with the delivery of services.
6 Profit on disposal of investment property2017
£m2016
£mGross disposal proceeds 486.3 210.6Costs of disposal (3.5) (2.6)Net disposal proceeds 482.8 208.0Carrying value (418.9) (198.8)Adjustment for lease costs and rents recognised in advance (19.2) (1.7)Adjustment for capital contributions (4.2) –Adjustment for headlease liability 9.8 –
50.3 7.5
Included within profit on disposal is £14.6m relating to the sale of 132-142 Hampstead Road NW1 in March 2017 and £24.9m relating to the sale of The Copyright Building W1 in November 2017. In addition, gross disposal proceeds reflect £5.0m of accrued overage in relation to Riverwalk House SW1 which was originally sold in 2012.
4 Segmental information (continued)Gross property income
2017 2016Office
buildings£m
Other£m
Total£m
Office buildings
£mOther
£mTotal
£mWest End central 79.4 0.4 79.8 81.4 4.2 85.6West End borders 18.4 – 18.4 17.2 – 17.2City borders 69.0 0.2 69.2 48.0 0.2 48.2Provincial – 4.8 4.8 – 5.0 5.0
166.8 5.4 172.2 146.6 9.4 156.0
A reconciliation of gross property income to gross property and other income is given in note 5.
Property portfolio 2017 2016
Officebuildings
£mOther
£mTotal
£m
Office buildings
£mOther
£mTotal
£mCarrying valueWest End central 2,356.8 42.2 2,399.0 2,531.5 141.1 2,672.6West End borders 439.3 – 439.3 408.3 – 408.3City borders 1,799.1 6.5 1,805.6 1,665.4 6.4 1,671.8Provincial – 98.6 98.6 – 97.0 97.0
4,595.2 147.3 4,742.5 4,605.2 244.5 4,849.7
Fair valueWest End central 2,394.9 43.7 2,438.6 2,573.9 142.1 2,716.0West End borders 459.7 – 459.7 426.5 – 426.5City borders 1,844.4 6.4 1,850.8 1,693.6 6.3 1,699.9Provincial – 101.2 101.2 – 100.3 100.3
4,699.0 151.3 4,850.3 4,694.0 248.7 4,942.7
A reconciliation between the fair value and carrying value of the portfolio is set out in note 16.
Notes to the financial statementsContinued
157156
Derwent London plc Report & Accounts 2017 Derwent London plc Report & Accounts 2017
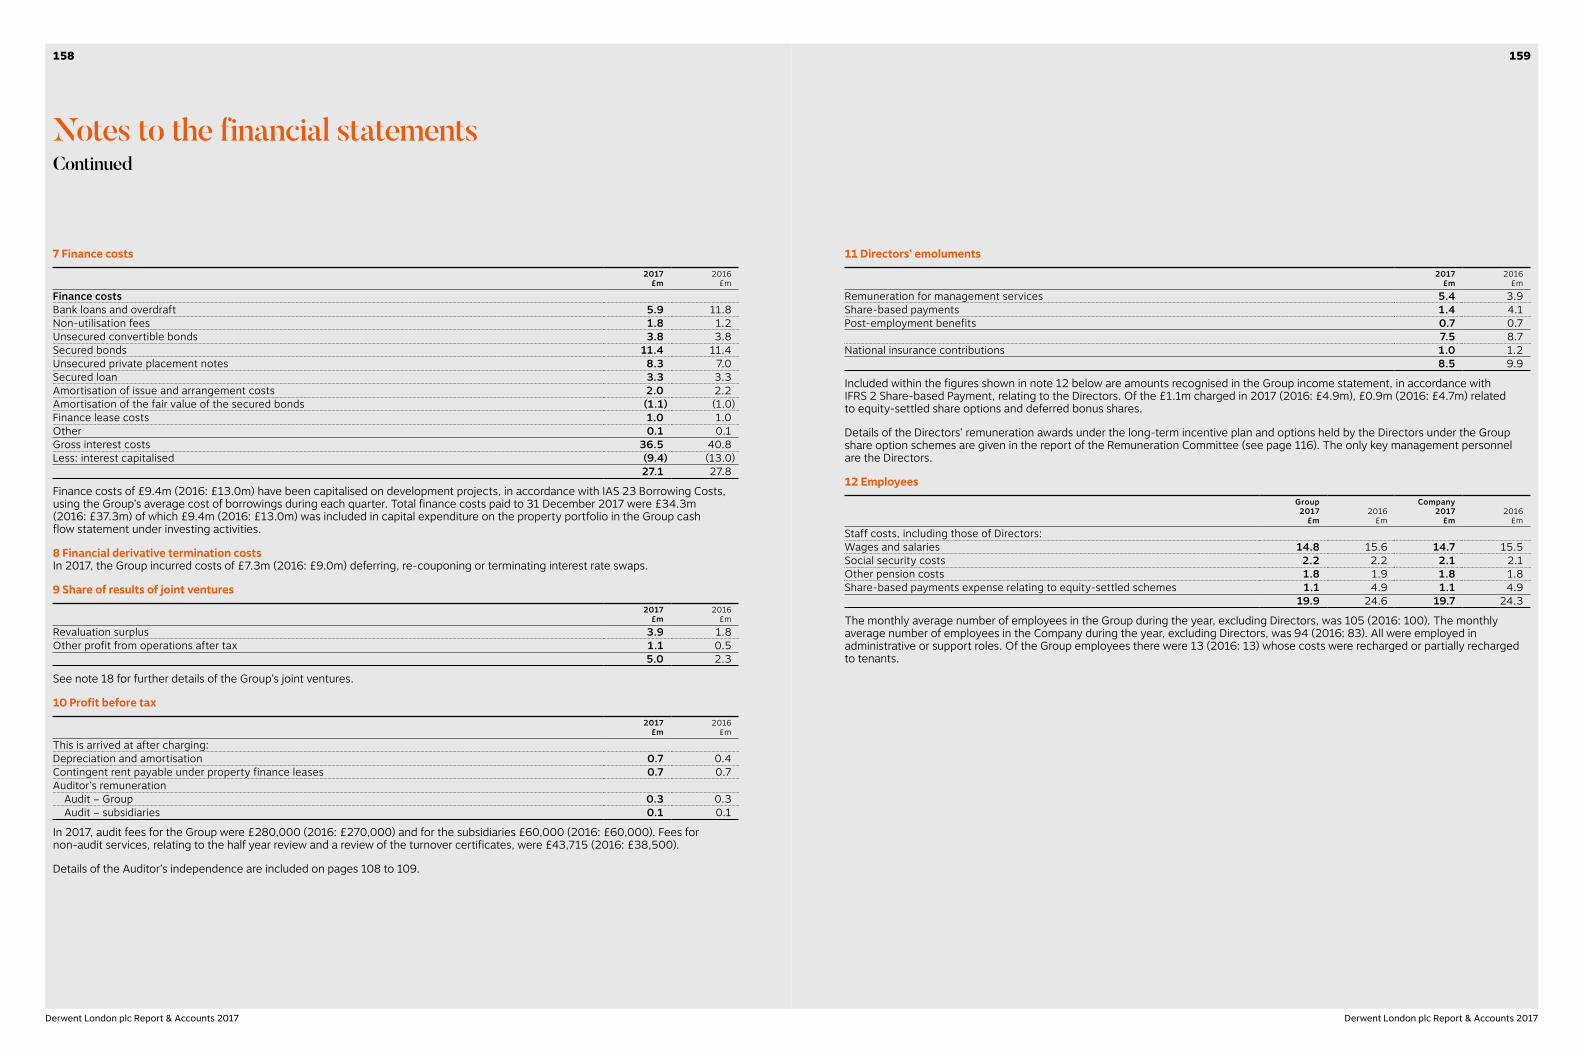
11 Directors’ emoluments2017
£m2016
£mRemuneration for management services 5.4 3.9Share-based payments 1.4 4.1Post-employment benefits 0.7 0.7
7.5 8.7National insurance contributions 1.0 1.2
8.5 9.9
Included within the figures shown in note 12 below are amounts recognised in the Group income statement, in accordance with IFRS 2 Share-based Payment, relating to the Directors. Of the £1.1m charged in 2017 (2016: £4.9m), £0.9m (2016: £4.7m) related to equity-settled share options and deferred bonus shares.
Details of the Directors’ remuneration awards under the long-term incentive plan and options held by the Directors under the Group share option schemes are given in the report of the Remuneration Committee (see page 116). The only key management personnel are the Directors.
12 EmployeesGroup2017
£m2016
£m
Company2017
£m2016
£mStaff costs, including those of Directors:Wages and salaries 14.8 15.6 14.7 15.5Social security costs 2.2 2.2 2.1 2.1Other pension costs 1.8 1.9 1.8 1.8Share-based payments expense relating to equity-settled schemes 1.1 4.9 1.1 4.9
19.9 24.6 19.7 24.3
The monthly average number of employees in the Group during the year, excluding Directors, was 105 (2016: 100). The monthly average number of employees in the Company during the year, excluding Directors, was 94 (2016: 83). All were employed in administrative or support roles. Of the Group employees there were 13 (2016: 13) whose costs were recharged or partially recharged to tenants.
7 Finance costs2017
£m2016
£mFinance costsBank loans and overdraft 5.9 11.8Non-utilisation fees 1.8 1.2Unsecured convertible bonds 3.8 3.8Secured bonds 11.4 11.4Unsecured private placement notes 8.3 7.0Secured loan 3.3 3.3Amortisation of issue and arrangement costs 2.0 2.2Amortisation of the fair value of the secured bonds (1.1) (1.0)Finance lease costs 1.0 1.0Other 0.1 0.1Gross interest costs 36.5 40.8Less: interest capitalised (9.4) (13.0)
27.1 27.8
Finance costs of £9.4m (2016: £13.0m) have been capitalised on development projects, in accordance with IAS 23 Borrowing Costs, using the Group’s average cost of borrowings during each quarter. Total finance costs paid to 31 December 2017 were £34.3m (2016: £37.3m) of which £9.4m (2016: £13.0m) was included in capital expenditure on the property portfolio in the Group cash flow statement under investing activities.
8 Financial derivative termination costsIn 2017, the Group incurred costs of £7.3m (2016: £9.0m) deferring, re-couponing or terminating interest rate swaps.
9 Share of results of joint ventures2017
£m2016
£mRevaluation surplus 3.9 1.8Other profit from operations after tax 1.1 0.5
5.0 2.3
See note 18 for further details of the Group’s joint ventures.
10 Profit before tax2017
£m2016
£mThis is arrived at after charging:Depreciation and amortisation 0.7 0.4Contingent rent payable under property finance leases 0.7 0.7Auditor’s remuneration Audit – Group 0.3 0.3 Audit – subsidiaries 0.1 0.1
In 2017, audit fees for the Group were £280,000 (2016: £270,000) and for the subsidiaries £60,000 (2016: £60,000). Fees for non-audit services, relating to the half year review and a review of the turnover certificates, were £43,715 (2016: £38,500).
Details of the Auditor’s independence are included on pages 108 to 109.
Notes to the financial statementsContinued
159158
Derwent London plc Report & Accounts 2017 Derwent London plc Report & Accounts 2017
The following information is relevant in the determination of the fair value of the options granted during 2017 and 2016 under the equity-settled employee share plan operated by the Group.
2017 2016Option pricing model used Binomial lattice Binomial latticeRisk-free interest rate 0.4% 0.8%Volatility 24.0% 23.0%Dividend yield 1.8% 1.4%
For both the 2017 and 2016 grants, additional assumptions have been made that there is no employee turnover and 50% of employees exercise early when the share options are 20% in the money and 50% of employees exercise early when the share options are 100% in the money.
The volatility assumption, measured as the standard deviation of expected share price returns, is based on a statistical analysis of daily prices over the past four years.
14 Pension costsThe Group and Company operate both a defined contribution scheme and a defined benefit scheme. The latter was acquired as part of the acquisition of London Merchant Securities plc in 2007 and is closed to new members. All new employees are entitled to join the defined contribution scheme. The assets of the pension schemes are held separately from those of the Group companies.
Defined contribution planThe total expense relating to this plan in the current year was £1.6m (2016: £1.6m).
Defined benefit planThe Company sponsors the scheme which is a funded defined benefit arrangement. This is a separate trustee-administered fund holding the pension scheme assets to meet long-term pension liabilities for some 63 past and four present employees as at 31 October 2016. The level of retirement benefit is principally based on basic salary at the last scheme anniversary of employment prior to leaving active service and is linked to changes in inflation up to retirement.
The scheme is subject to the funding legislation, which came into force on 30 December 2005, outlined in the Pensions Act 2004. This, together with documents issued by the Pensions Regulator, and Guidance Notes adopted by the Financial Reporting Council, set out the framework for funding defined benefit occupational pension schemes in the UK.
The trustees of the scheme are required to act in the best interest of the scheme’s beneficiaries. The appointment of the trustees is determined by the scheme’s trust documentation. It is policy that one-third of all trustees should be nominated by the members.
A full actuarial valuation was carried out as at 31 October 2016 in accordance with the scheme funding requirements of the Pensions Act 2004 and the funding of the scheme is agreed between the Company and the trustees in line with those requirements. These in particular require the surplus/deficit to be calculated using prudent, as opposed to best estimate actuarial assumptions.
This actuarial valuation showed a deficit of £8.3m. The Company has agreed with the trustees that it will aim to eliminate the deficit over a period of seven years and one month from 14 November 2017 by the payment of annual contributions of £0.9m payable by each 31 December from 31 December 2017 to 31 December 2024 inclusive. In addition the Company has agreed with the trustees that it will pay 91.5% of pensionable salaries including member contributions in respect of the cost of accruing benefits and will meet expenses of the scheme, DIS premiums and levies to the Pension Protection Fund separately.
For the purposes of IAS 19 the actuarial valuation as at 31 October 2016, which was carried out by a qualified independent actuary, has been updated on an approximate basis to 31 December 2017. There have been no changes in the valuation methodology adopted for this period’s disclosures compared to the previous period’s disclosures.
Amounts included in the balance sheet 2017
£m2016
£m2015
£m
Fair value of plan assets 17.6 15.9 13.7Present value of defined benefit obligation (18.0) (16.2) (12.6)Net (liability)/asset (0.4) (0.3) 1.1
The present value of the scheme liabilities is measured by discounting the best estimate of future cash flows to be paid out by the scheme using the projected unit credit method. The value calculated in this way is reflected in the net liability in the balance sheet as shown above.
13 Share-based paymentsDetails of the options held by Directors and employees under the Group’s share option schemes are given in the report of the Remuneration Committee, other than the employee share plan that is detailed below.
Group and Company – equity-settled option schemeThis scheme is separate from the performance share plan that is disclosed in the report of the Remuneration Committee and the Directors are not entitled to any awards under this scheme.
Year of grant
Exerciseprice
£
Adjustedexercise price1
£
Outstandingat
1 January
Movement in options Outstandingat
31 DecemberGranted Adjustment1 Exercised LapsedFor the year to 31 December 20172009 6.10 6.10 1,600 – – (600) – 1,0002011 16.60 16.60 200 – – – – 2002012 17.19 16.89 16,420 – 223 (2,000) – 14,6432013 21.99 21.61 55,950 – 582 (17,200) – 39,3322014 27.39 26.91 76,900 – 862 (13,360) – 64,4022015 34.65 34.04 67,450 – 1,018 – (1,750) 66,7182016 31.20 30.64 93,250 – 1,336 – (2,650) 91,9362017 28.93 28.42 – 131,100 1,893 – – 132,993
311,770 131,100 5,914 (33,160) (4,400) 411,224
For the year to 31 December 2016
2009 6.10 – 2,465 – – (865) – 1,6002011 16.60 – 5,200 – – (5,000) – 2002012 17.19 – 28,680 – – (12,260) – 16,4202013 21.99 – 86,750 – – (30,800) – 55,9502014 27.39 – 93,350 – – – (16,450) 76,9002015 34.65 – 76,000 – – – (8,550) 67,4502016 31.20 – – 95,250 – – (2,000) 93,250
292,445 95,250 – (48,925) (27,000) 311,770
31 December2017
31 December2016
1 January2016
Number of shares:Exercisable 119,577 74,170 36,345Non-exercisable 291,647 237,600 256,100
Weighted average exercise price of share options:Exercisable £23.75 £20.57 £16.35Non-exercisable £30.41 £30.95 £27.72
Weighted average remaining contracted life of share options:Exercisable 5.79 years 6.06 years 6.05 yearsNon-exercisable 8.48 years 8.32 years 8.23 years
Weighted average exercise price of share options that lapsed:Exercisable – – –Non-exercisable £32.57 £29.97 £26.281 Following the payment of the special dividend of 52 pence per share on 9 June 2017, the Remuneration Committee exercised their discretion and adjusted the number of
outstanding unapproved ‘B’ options and their option price, to ensure participants were not disadvantaged by the payment to shareholders of the special dividend.
The weighted average share price at which options were exercised during 2017 was £28.87 (2016: £31.81).
The weighted average fair value of options granted during 2017 was £6.05 (2016: £6.84).
Notes to the financial statementsContinued
161160
Derwent London plc Report & Accounts 2017 Derwent London plc Report & Accounts 2017
Fair value of plan assets2017
£m2016
£m2015
£m
UK equities 0.7 0.6 0.5Overseas equities 0.7 0.6 0.5Government bonds 2.7 2.6 2.8Cash 1.0 0.8 0.8Other 12.5 11.3 9.1Total assets 17.6 15.9 13.7
The £12.5m in the ‘other’ asset class is made up of holdings of £7.5m in equity-linked gilt funds and £5.0m in absolute return funds.
None of the fair values of the assets shown above include any directly-held financial instruments of the Group or property occupied by, or other assets used by, the Group. All of the scheme assets have a quoted market price in an active market (with the exception of the Trustee’s bank account balance) representing Level 1 fair value measurement as defined by IFRS 13 Fair Value Measurement.
It is the policy of the trustees and the Group to review the investment strategy at the time of each funding valuation. The Trustees’ investment objectives and the processes undertaken to measure and manage the risks inherent in the plan investment strategy are illustrated by the asset allocation at 31 December 2017.
There are no asset-liability matching strategies currently being used by the plan.
Significant actuarial assumptions2017
%2016
%2015
%Discount rate 2.50 2.70 3.95Inflation (RPI) 3.20 3.40 3.30Salary increases 4.70 4.90 4.80Allowance for commutation of pension for cash at retirement 75% of Post A
Day Pension75% of Post A
Day Pension75% of Post A
Day Pension
The mortality assumptions adopted at 31 December 2017 are 80% of the standard tables S2PxA, year of birth, no age rating for males and females, projected using CMI_2016 converging to 1.25% p.a. These imply the following life expectancies:
Life expectancy at age 65 Years
Male retiring in 2017 23.8Female retiring in 2017 25.6Male retiring in 2037 25.2Female retiring in 2037 27.1
Analysis of the sensitivity to the principal assumptions of the present value of the defined benefit obligation Change in assumption Change in liabilities
Discount rate Decrease of 0.25% p.a. Increase by 6.8%Inflation (RPI) Increase of 0.25% p.a. Increase by 0.3%Salary increases Increase of 0.25% p.a. Increase by 0.3%Rate of mortality Increase in life expectancy of one year Increase by 3.8%Allowance for commutation of pensionfor cash at retirement
Members commute an extra 10% ofPost A Day pension on retirement
Decrease by 1.7%
The sensitivities shown above are approximate. Each sensitivity considers one change in isolation. The average duration of the defined benefit obligation at the year ended 31 December 2017 is 29 years.
The scheme typically exposes the Group to actuarial risks such as investment risk, interest rate risk, salary growth risk, mortality risk and longevity risk. A decrease in corporate bond yields, a rise in inflation or an increase in life expectancy would result in an increase to the scheme’s liabilities. This would detrimentally impact the balance sheet position and may give rise to increased charges in the income statement. This effect would be partially offset by an increase in the value of the scheme’s bond holdings.
The best estimate of contributions to be paid by the Group to the plan for the year commencing 1 January 2018 is £1.0m.
14 Pension costs (continued)The projected unit credit method is an accrued benefits valuation method in which allowance is made for projected earnings increases for active members. The accumulated benefit obligation is an alternative actuarial measure of the scheme’s liabilities, whose calculation differs from that under the projected unit credit method in that it includes no assumption for future earnings increases. In assessing this figure for the purpose of these disclosures, allowance has been made for future statutory revaluation of benefits up to retirement. At the balance sheet date the accumulated benefit obligation was £18.0m (2016: £16.2m).
All actuarial gains and losses are recognised in the year in which they occur in the Group statement of comprehensive income.
Reconciliation of the impact of the asset ceilingIt has been assumed that the application of IFRIC 14 has no effect on the IAS 19 figures.
Reconciliation of the opening and closing present value of the defined benefit obligation2017
£m2016
£mAt 1 January 16.2 12.6Current service cost 0.1 0.1Interest cost 0.4 0.5Actuarial losses due to scheme experience 1.6 –Actuarial gains due to changes in demographic assumptions (0.6) –Actuarial losses due to changes in financial assumptions 0.9 4.4Benefits paid, death in service premiums and expenses (0.6) (1.4)At 31 December 18.0 16.2
There have been no scheme amendments, curtailments or settlements in the year.
Reconciliation of the opening and closing fair value of the plan assets2017
£m2016
£mAt 1 January 15.9 13.7Interest income 0.4 0.5Return on plan assets (excluding amounts included in interest income) 1.0 2.3Contributions by the Group 0.9 0.7Benefits paid, death in service premiums and expenses (0.6) (1.3)At 31 December 17.6 15.9
The actual return on the plan assets over the year was £1.4m (2016: £2.8m).
Defined benefit costs recognised in the income statement
2017
£m2016
£mCurrent service cost 0.1 0.1
Amounts recognised in other comprehensive income2017
£m2016
£mGain on plan assets (excluding amounts recognised in net interest cost) 1.0 2.3Experience losses arising on the defined benefit obligation (1.6) –Gain from changes in the demographic assumptions underlying the present value of the defined benefit obligation 0.6 –Loss from changes in the financial assumptions underlying the present value of the defined benefit obligation (0.9) (4.4)Total loss recognised in other comprehensive income (0.9) (2.1)
Notes to the financial statementsContinued
163162
Derwent London plc Report & Accounts 2017 Derwent London plc Report & Accounts 2017
16 Property portfolio
Freehold£m
Leasehold£m
Total investment
property£m
Owner-occupiedproperty
£m
Tradingproperty
£m
Total propertyportfolio
£mGroupCarrying valueAt 1 January 2017 3,959.9 843.9 4,803.8 34.2 11.7 4,849.7 Acquisitions 0.8 – 0.8 – 7.8 8.6 Capital expenditure 73.3 62.7 136.0 2.3 4.7 143.0 Interest capitalisation 4.7 4.6 9.3 – 0.1 9.4Additions 78.8 67.3 146.1 2.3 12.6 161.0Disposals (298.2) (120.7) (418.9) – – (418.9)Transfers (8.2) – (8.2) 8.2 – –Revaluation 134.7 13.2 147.9 1.8 – 149.7Reversal of write-down of trading property – – – – 1.0 1.0At 31 December 2017 3,867.0 803.7 4,670.7 46.5 25.3 4,742.5
At 1 January 2016 4,006.8 825.5 4,832.3 36.1 10.5 4,878.9 Acquisitions 12.0 – 12.0 – – 12.0 Capital expenditure 116.1 75.7 191.8 3.6 2.9 198.3 Interest capitalisation 10.6 2.4 13.0 – – 13.0Additions 138.7 78.1 216.8 3.6 2.9 223.3Disposals (158.1) (40.7) (198.8) – (10.2) (209.0)Transfers (10.1) – (10.1) – 10.1 –Revaluation (17.4) (19.7) (37.1) (5.5) – (42.6)Write-down of trading property – – – – (1.6) (1.6)Movement in grossing up of headlease liabilities – 0.7 0.7 – – 0.7At 31 December 2016 3,959.9 843.9 4,803.8 34.2 11.7 4,849.7
Adjustments from fair value to carrying valueAt 31 December 2017Fair value 3,968.6 808.6 4,777.2 46.5 26.6 4,850.3Revaluation of trading property – – – – (1.3) (1.3)Lease incentives and costs included in receivables (101.6) (19.0) (120.6) – – (120.6)Grossing up of headlease liabilities – 14.1 14.1 – – 14.1Carrying value 3,867.0 803.7 4,670.7 46.5 25.3 4,742.5
At 31 December 2016Fair value 4,054.0 842.8 4,896.8 34.2 11.7 4,942.7Lease incentives and costs included in receivables (94.1) (22.8) (116.9) – – (116.9)Grossing up of headlease liabilities – 23.9 23.9 – – 23.9Carrying value 3,959.9 843.9 4,803.8 34.2 11.7 4,849.7
Reconciliation of fair value
2017£m
2016£m
Portfolio including the Group’s share of joint ventures 4,897.6 4,980.5Joint ventures (47.3) (37.8)IFRS property portfolio 4,850.3 4,942.7
The property portfolio is subject to semi-annual external valuations and was revalued at 31 December 2017 by external valuers on the basis of fair value in accordance with The RICS Valuation – Professional Standards, which takes account of the properties’ highest and best use. When considering the highest and best use of a property, the external valuers will consider its existing and potential uses which are physically, legally and financially viable. Where the highest and best use differs from the existing use, the external valuers will consider the costs and the likelihood of achieving and implementing this change in arriving at the property valuation.
CBRE Limited valued properties at £4,817.5m (2016: £4,910.7m) and other valuers at £32.8m (2016: £32.0m), giving a combined value of £4,850.3m (2016: £4,942.7m). Of the properties revalued by CBRE, £46.5m (2016: £34.2m) relating to owner-occupied property was included within property, plant and equipment and £26.6m (2016: £11.7m) was in relation to trading property.
The total fees, including the fee for this assignment, earned by CBRE (or other companies forming part of the same group of companies within the UK) from the Group is less than 5.0% of their total UK revenues.
15 Tax charge2017
£m2016
£mCorporation taxUK corporation tax and income tax in respect of profit for the year 4.0 1.9Other adjustments in respect of prior years’ tax (0.7) 0.1Corporation tax charge 3.3 2.0
Deferred taxOrigination and reversal of temporary differences (1.2) (0.9)Adjustment for changes in estimates (0.3) (0.2)Deferred tax credit (1.5) (1.1)
Tax charge 1.8 0.9
In addition to the tax charge of £1.8m (2016: £0.9m) that passed through the Group income statement, a deferred tax charge of £0.7m (2016: credit of £1.3m) was recognised in the Group statement of comprehensive income relating to the revaluation of the owner-occupied property at 25 Savile Row W1.
The effective rate of tax for 2017 is lower (2016: lower) than the standard rate of corporation tax in the UK. The differences are explained below:
2017£m
2016£m
Profit before tax 314.8 54.5
Expected tax charge based on the standard rate of corporation tax in the UK of 19.25% (2016: 20.00%)1 60.6 10.9Difference between tax and accounting profit on disposals (9.8) (1.2)REIT exempt income (10.8) (7.8)Revaluation (surplus)/deficit attributable to REIT properties (27.4) 7.2Expenses and fair value adjustments not allowable for tax purposes (4.4) (2.8)Capital allowances (4.2) (5.3)Other differences (1.5) (0.2)Tax charge in respect of profit for the year 2.5 0.8Adjustments in respect of prior years’ tax (0.7) 0.1Tax charge 1.8 0.91 Changes to the UK corporation tax rates were substantively enacted as part of the Finance Bill 2015 (on 26 October 2015) and the Finance Bill 2016 (on 7 September 2016).
These include reducing the main rate to 19% from 1 April 2017 and then to 17% from 1 April 2020. Deferred taxes at the balance sheet date have been measured using the expected enacted tax rate and this is reflected in these financial statements.
Notes to the financial statementsContinued
165164
Derwent London plc Report & Accounts 2017 Derwent London plc Report & Accounts 2017

Valuation techniquesThe fair value of the property portfolio has been determined using an income capitalisation technique, whereby contracted and market rental values are capitalised with a market capitalisation rate. The resulting valuations are cross-checked against the equivalent yields and the fair market values per square foot derived from comparable recent market transactions on arm’s length terms.
For properties under construction, the fair value is calculated by estimating the fair value of the completed property using the income capitalisation technique less estimated costs to completion and a risk premium.
These techniques are consistent with the principles in IFRS 13 Fair Value Measurement and use significant unobservable inputs such that the fair value measurement of each property within the portfolio has been classified as Level 3 in the fair value hierarchy.
There were no transfers between Levels 1 and 2 or between Levels 2 and 3 in the fair value hierarchy during either 2017 or 2016.
Gains and losses recorded in profit or loss for recurring fair value measurements categorised within Level 3 of the fair value hierarchy amount to a gain of £147.9m (2016: loss of £37.1m) and are presented in the Group income statement in the line item ‘revaluation surplus/(deficit)’. The revaluation surplus for the owner-occupied property of £1.8m (2016: deficit of £5.5m) was included within the revaluation reserve.
All gains and losses recorded in profit or loss in 2017 and 2016 for recurring fair value measurements categorised within Level 3 of the fair value hierarchy are attributable to changes in unrealised gains or losses relating to investment property held at 31 December 2017 and 31 December 2016, respectively.
Quantitative information about fair value measurement using unobservable inputs (Level 3) West End
centralWest End
bordersCity
bordersProvincial
commercialProvincial
land Total
Valuation techniqueIncome
capitalisationIncome
capitalisationIncome
capitalisationIncome
capitalisationIncome
capitalisation
Fair value (£m)1 2,438.6 480.2 1,877.6 67.9 33.3 4,897.6Area (‘000 sq ft) 2,565 516 2,088 343 – 5,512Range of unobservable inputs2: Gross ERV (per sq ft pa) Minimum £13 £40 £10 £8 n/a3
Maximum £176 £55 £62 £15 n/a3
Weighted average £55 £52 £49 £15 n/a3
Net initial yield Minimum 0.0% 2.5% 0.0% 6.3% 0.0% Maximum 5.2% 4.7% 4.7% 13.0% 10.1% Weighted average 3.0% 3.0% 3.0% 6.4% 1.6%Reversionary yield Minimum 2.4% 4.8% 4.0% 6.8% 0.0% Maximum 9.5% 5.8% 5.6% 13.8% 9.8% Weighted average 4.9% 5.2% 4.9% 6.9% 1.8%True equivalent yield (EPRA basis) Minimum 2.3% 4.9% 4.2% 6.7% 9.2% Maximum 7.3% 5.1% 5.4% 14.7% 10.9% Weighted average 4.5% 4.9% 4.8% 6.9% 10.5%1 Includes the Group’s share of joint ventures.2 Costs to complete are not deemed a significant unobservable input by virtue of the high percentage that is already fixed.3 There is no calculation of gross ERV per sq ft pa. The land totals 5,235 acres.
16 Property portfolio (continued)During the year ended 31 December 2016, the Group transferred, at market value, a property previously held for investment to trading property as it was being developed for sale. Any future revaluation surplus relating to the trading property will be recognised as an adjustment to EPRA net asset value, but, in accordance with IAS 2 Inventories, will not be recognised in the carrying value of the property as trading properties are stated at the lower of cost and net realisable value. In 2016 the net realisable value of this property was lower than its cost which resulted in a £1.6m write-down. An increase in the net realisable value in 2017 resulted in a write back of this adjustment. In addition, in 2017, there was a write-down of £0.6m on another trading property that was acquired in the year.
Reconciliation of revaluation surplus/(deficit) 2017
£m2016
£mTotal revaluation surplus/(deficit) 177.1 (20.9)Less: Share of joint ventures (4.9) (1.8) Lease incentives and costs (20.2) (21.5) Trading property revaluation surplus (1.3) –IFRS revaluation surplus/(deficit) 150.7 (44.2)
Reported in the: Revaluation surplus/(deficit) 147.9 (37.1) Reversal of write-down/(write-down) of trading property 1.0 (1.6)Group income statement 148.9 (38.7)Group statement of comprehensive income 1.8 (5.5)
150.7 (44.2)
Valuation processThe valuation reports produced by the external valuers are based on information provided by the Group such as current rents, terms and conditions of lease agreements, service charges and capital expenditure. This information is derived from the Group’s financial and property management systems and is subject to the Group’s overall control environment. In addition, the valuation reports are based on assumptions and valuation models used by the external valuers. The assumptions are typically market related, such as yields and discount rates, and are based on their professional judgement and market observation. Each property is considered a separate asset class based on the unique nature, characteristics and risks of the property.
Members of the Group’s investments team, who report to the executive Director responsible for the valuation process, verify all major inputs to the external valuation reports, assess the individual property valuation changes from the prior year valuation report and hold discussions with the external valuers. When this process is complete, the valuation report is recommended to the Audit Committee, which considers it as part of its overall responsibilities.
Notes to the financial statementsContinued
167166
Derwent London plc Report & Accounts 2017 Derwent London plc Report & Accounts 2017

17 Property, plant and equipmentOwner-
occupiedproperty
£mArtwork
£mOther
£mTotal
£mGroupAt 1 January 2017 34.2 1.5 2.4 38.1Additions 2.3 0.1 2.6 5.0Disposals – – (0.2) (0.2)Depreciation – – (0.7) (0.7)Transfers 8.2 – – 8.2Revaluation 1.8 – – 1.8At 31 December 2017 46.5 1.6 4.1 52.2
At 1 January 2016 36.1 1.5 1.5 39.1Additions 3.6 – 1.3 4.9Depreciation – – (0.4) (0.4)Revaluation (5.5) – – (5.5)At 31 December 2016 34.2 1.5 2.4 38.1
Net book valueCost or valuation 46.5 1.6 5.9 54.0Accumulated depreciation – – (1.8) (1.8)At 31 December 2017 46.5 1.6 4.1 52.2
Net book valueCost or valuation 34.2 1.5 4.8 40.5Accumulated depreciation – – (2.4) (2.4)At 31 December 2016 34.2 1.5 2.4 38.1
CompanyAt 1 January 2017 – 0.9 2.3 3.2Additions – 0.1 2.7 2.8Disposals – – (0.2) (0.2)Depreciation – – (0.7) (0.7)At 31 December 2017 – 1.0 4.1 5.1
At 1 January 2016 – 0.9 1.4 2.3Additions – – 1.3 1.3Disposals – – – –Depreciation – – (0.4) (0.4)At 31 December 2016 – 0.9 2.3 3.2
Net book valueCost or valuation – 1.0 5.9 6.9Accumulated depreciation – – (1.8) (1.8)At 31 December 2017 – 1.0 4.1 5.1
Net book valueCost or valuation – 0.9 4.9 5.8Accumulated depreciation – – (2.6) (2.6)At 31 December 2016 – 0.9 2.3 3.2
The artwork is periodically valued by Bonhams on the basis of fair value using their extensive market knowledge. The latest valuation was carried out in October 2016 and the Directors consider that there have been no material valuation movements since that date. In accordance with IFRS 13 Fair Value Measurement, the artwork is deemed to be classified as Level 3.
The historic cost of the artwork in the Group at 31 December 2017 was £1.6m (2016: £1.5m) and £1.0m (2016: £0.9m) in the Company. See note 16 for the historic cost of owner-occupied property and IFRS 13 Fair Value Measurement disclosures.
16 Property portfolio (continued)Sensitivity of measurement to variations in the significant unobservable inputsThe significant unobservable inputs used in the fair value measurement categorised within Level 3 of the fair value hierarchy of the Group’s property portfolio, together with the impact of significant movements in these inputs on the fair value measurement, are shown below:
Unobservable inputImpact on fair value measurement
of significant increase in inputImpact on fair value measurement
of significant decrease in inputGross ERV Increase DecreaseNet initial yield Decrease IncreaseReversionary yield Decrease IncreaseTrue equivalent yield Decrease Increase
There are inter-relationships between these inputs as they are partially determined by market conditions. An increase in the reversionary yield may accompany an increase in gross ERV and would mitigate its impact on the fair value measurement.
A sensitivity analysis was performed to ascertain the impact on the fair value of a 25 basis point shift in true equivalent yield and a £2.50 psf shift in ERV.
West Endcentral
West Endborders
Cityborders
Provincialcommercial
Provincialland Total
True equivalent yield +25bp (5.3%) (4.9%) (5.0%) (3.5%) (2.3%) (5.1%) - 25bp 5.9% 5.4% 5.5% 3.8% 2.4% 5.6%ERV +£2.50 psf 4.6% 4.8% 5.2% 17.0% – 5.0% - £2.50 psf (4.6%) (4.8%) (5.2%) (17.0%) – (5.0%)
Historic cost 2017
£m2016
£m
Investment property 2,697.0 2,838.5Owner-occupied property 19.8 14.1Trading property 33.0 18.4Total property portfolio 2,749.8 2,871.0
Notes to the financial statementsContinued
169168
Derwent London plc Report & Accounts 2017 Derwent London plc Report & Accounts 2017
19 Other receivables (non-current)Group2017
£m2016
£m
Company2017
£m2016
£mPrepayments and accrued income 105.2 105.4 – –Other – 3.7 – –
105.2 109.1 – –
Prepayments and accrued income relates to rents recognised in advance as a result of spreading the effect of rent free and reduced rent periods, capital contributions in lieu of rent free periods and contracted rent uplifts, as well as the initial direct costs of the letting, over the expected terms of their respective leases. Together with £15.4m (2016: £11.5m), which was included as current assets within trade and other receivables, these amounts totalled £120.6m at 31 December 2017 (2016: £116.9m).
20 Trade and other receivablesGroup2017
£m2016
£m
Company2017
£m2016
£mTrade receivables 7.1 5.1 – –Amounts owed by subsidiaries – – 1,459.9 1,512.0Other receivables 6.8 2.7 1.3 1.0Prepayments 17.3 15.5 0.1 0.2Other taxes 4.6 – 8.2 –Accrued income 22.2 15.2 0.1 –
58.0 38.5 1,469.6 1,513.2
2017
£m2016
£m
Group trade receivables are split as follows: less than three months due 7.1 5.1
7.1 5.1
Group trade receivables includes a provision for bad debts as follows: 2017
£m2016
£m
At 1 January 0.3 0.3Released – –At 31 December 0.3 0.3
The provision for bad debts is split as follows: less than three months due 0.3 0.3
0.3 0.3
None of the amounts included in other receivables are past due and therefore no ageing has been shown.
21 Trade and other payablesGroup2017
£m2016
£m
Company2017
£m2016
£mTrade payables 2.0 2.0 0.4 –Amounts owed to subsidiaries – – 890.3 647.0Other payables 17.8 16.7 0.9 1.2Other taxes – 6.5 – 0.8Accruals 27.1 45.9 10.6 9.7Deferred income 39.8 38.9 0.1 0.1
86.7 110.0 902.3 658.8
18 InvestmentsGroupThe Group has a 50% interest in two joint ventures, Primister Limited and Prescot Street Limited Partnership.
2017£m
2016£m
At 1 January 36.0 30.7Additions – 3.0Repayment of shareholder loan (1.3) –Share of results of joint ventures (see note 9) 5.0 2.3At 31 December 39.7 36.0
The Group’s share of its investments in joint ventures is represented by the following amounts in the underlying joint venture entities.
2017 2016Joint ventures
£mGroup share
£mJoint ventures
£mGroup share
£mNon-current assets 52.7 26.4 75.3 37.7Current assets 44.1 22.1 7.0 3.5Current liabilities (15.1) (7.6) (5.4) (2.7)Non-current liabilities (43.3) (21.7) (48.5) (24.3)Net assets 38.4 19.2 28.4 14.2Loans provided to joint ventures 20.5 21.8Total investment in joint ventures 39.7 36.0
Income 10.6 5.3 5.2 2.6Expenses (0.6) (0.3) (0.6) (0.3)Profit for the year 10.0 5.0 4.6 2.3
In January 2018, Primister Limited exchanged contracts for the sale of its freehold interest in Porters North N1 for £45.4m before costs with completion expected in March 2018. The property has been included in current assets held for sale as it was being actively marketed for sale as at 31 December 2017.
Company Subsidiaries
£mJoint ventures
£mTotal
£mAt 1 January 2016 1,185.4 – 1,185.4Additions – 1.3 1.3At 31 December 2016 1,185.4 1.3 1,186.7Additions 40.0 – 40.0Repayment of shareholder loan – (1.3) (1.3)Reversal of impairment 0.4 – 0.4At 31 December 2017 1,225.8 – 1,225.8
At 31 December 2017, the carrying value of the investment in wholly-owned subsidiaries and joint ventures were reviewed in accordance with IAS 36 Impairment of Assets on both value in use and fair value less costs to sell bases. The Company’s accounting policy is to carry investments in subsidiary undertakings and joint ventures at the lower of cost and recoverable amount and recognise any impairment, or reversal thereof, in the income statement.
Notes to the financial statementsContinued
171170
Derwent London plc Report & Accounts 2017 Derwent London plc Report & Accounts 2017

1.125% unsecured convertible bonds 2019In July 2013 the Group issued £150m of convertible bonds. The unsecured instruments pay a coupon of 1.125% until July 2019 or the conversion date, if earlier. The initial conversion price was set at £33.35 per share, but following the 2016 final dividend and special dividend the conversion price has been adjusted to £32.73 per share. In accordance with IAS 32, the equity and debt components of the bonds are accounted for separately and the fair value of the debt component has been determined using the market interest rate for an equivalent non-convertible bond, deemed to be 2.67%. As a result, £137.4m was recognised as a liability in the balance sheet on issue and the remainder of the proceeds, £12.6m, which represent the equity component, was credited to reserves. The difference between the fair value of the liability and the principal value is being amortised through the income statement from the date of issue. Issue costs of £3.8m were allocated between equity and debt and the element relating to the debt component is being amortised over the life of the bonds. The issue costs apportioned to equity of £0.3m have not been amortised. The fair value was determined by the ask-price of £107.88 per £100 as at 31 December 2017 (2016: £105.38 per £100). The carrying value at 31 December 2017 was £145.6m (2016: £142.9m).
Reconciliation of nominal value to carrying value:
£mNominal value 150.0Fair value adjustment on issue allocated to equity (12.6)Debt component on issue 137.4Unamortised issue costs (0.9)Amortisation of fair value adjustment 9.1Carrying amount included in borrowings 145.6
6.5% secured bonds 2026As a result of the acquisition of London Merchant Securities plc in 2007, the secured bonds 2026 were included at fair value less unamortised issue costs. This difference between fair value at acquisition and principal value is being amortised through the income statement. The fair value at 31 December 2017 was determined by the ask-price of £128.94 per £100 (2016: £128.91 per £100). The carrying value at 31 December 2017 was £186.9m (2016: £187.9m).
3.46% unsecured private placement notes 2028 and 3.57% unsecured private placement notes 2031In February 2016, the Group arranged unsecured private placement notes, comprising £30m for 12 years and £75m for 15 years. The funds were drawn on 4 May 2016. The fair values were determined by comparing the discounted future cash flows using the contracted yields with those of the reference gilts plus the implied margins. The references were a 6% 2028 gilt and a 4.75% 2030 gilt both with an implied margin which is unchanged since the date of fixing. The carrying values at 31 December 2017 were £29.8m (2016: £29.8m) and £74.5m (2016: £74.5m), respectively.
4.41% unsecured private placement notes 2029 and 4.68% unsecured private placement notes 2034In November 2013, the Group arranged unsecured private placement notes, comprising £25m for 15 years and £75m for 20 years. The funds were drawn on 8 January 2014. The fair values were determined by comparing the discounted future cash flows using the contracted yields with those of the reference gilts plus the implied margins. The references were a 6% 2028 gilt and a 4.25% 2032 gilt both with an implied margin which is unchanged since the date of fixing. The carrying values at 31 December 2017 were £24.8m (2016: £24.8m) and £74.3m (2016: £74.3m), respectively.
3.99% secured loan 2024In July 2012, the Group arranged a 12¼-year secured fixed rate loan. The loan was drawn on 1 August 2012. The fair value was determined by comparing the discounted future cash flows using the contracted yield with those of the reference gilt plus an implied margin. The reference was a 5% 2025 gilt with an implied margin which is unchanged since the date of fixing. The carrying value at 31 December 2017 was £81.7m (2016: £82.1m).
Bank borrowingsIn 2017, the maturity of the £75m revolving credit facility arranged in July 2015 was extended by one year to 2022.
In 2016, the maturity of £450m of the £550m facility arranged in September 2013 was extended by one year to 2022. The remaining £100m was later cancelled in March 2017.
As all main corporate facilities were refinanced or amended in the past few years, the fair values of the Group’s bank loans are deemed to be approximately the same as their carrying amount, after adjusting for the unamortised arrangement fees.
22 ProvisionsGroup
£mCompany
£m
At 1 January 2017 0.7 0.7Provided in the income statement 0.2 0.2Utilised in year (0.3) (0.3)At 31 December 2017 0.6 0.6
Due within one year 0.2 0.2Due after one year 0.4 0.4
0.6 0.6
At 1 January 2016 1.2 1.2Provided in the income statement 0.2 0.2Utilised in year (0.7) (0.7)At 31 December 2016 0.7 0.7
Due within one year 0.4 0.4Due after one year 0.3 0.3
0.7 0.7
The provisions in both the Group and the Company relate to national insurance that is payable on gains made by employees on the exercise of share options granted to them. The eventual liability to national insurance is dependent on:
• the market price of the Company’s shares at the date of exercise;• the number of equity share options that are exercised; and• the prevailing rate of national insurance at the date of exercise.
23 Borrowings and derivative financial instrumentsGroup2017
£m2016
£m
Company2017
£m2016
£m
Non-current liabilities1.125% unsecured convertible bonds 2019 145.6 142.9 – –6.5% secured bonds 2026 186.9 187.9 – –3.46% unsecured private placement notes 2028 29.8 29.8 29.8 29.84.41% unsecured private placement notes 2029 24.8 24.8 24.8 24.83.57% unsecured private placement notes 2031 74.5 74.5 74.5 74.54.68% unsecured private placement notes 2034 74.3 74.3 74.3 74.33.99% secured loan 2024 81.7 82.1 81.7 82.1Unsecured bank loans 85.6 254.3 85.6 254.3Secured bank loans 27.6 28.0 – –Intercompany loan – – 145.6 142.9Gross debt 730.8 898.6 516.3 682.7
Leasehold liabilities 14.1 23.9 – –Borrowings 744.9 922.5 516.3 682.7
Derivative financial instruments expiring in greater than one year 7.9 17.3 7.0 15.5Total borrowings and derivative financial instruments 752.8 939.8 523.3 698.2
Reconciliation of borrowings to net debt:Borrowings 744.9 922.5 516.3 682.7Cash and cash equivalents (87.0) (17.7) (85.8) (6.9)Net debt 657.9 904.8 430.5 675.8
Notes to the financial statementsContinued
173172
Derwent London plc Report & Accounts 2017 Derwent London plc Report & Accounts 2017
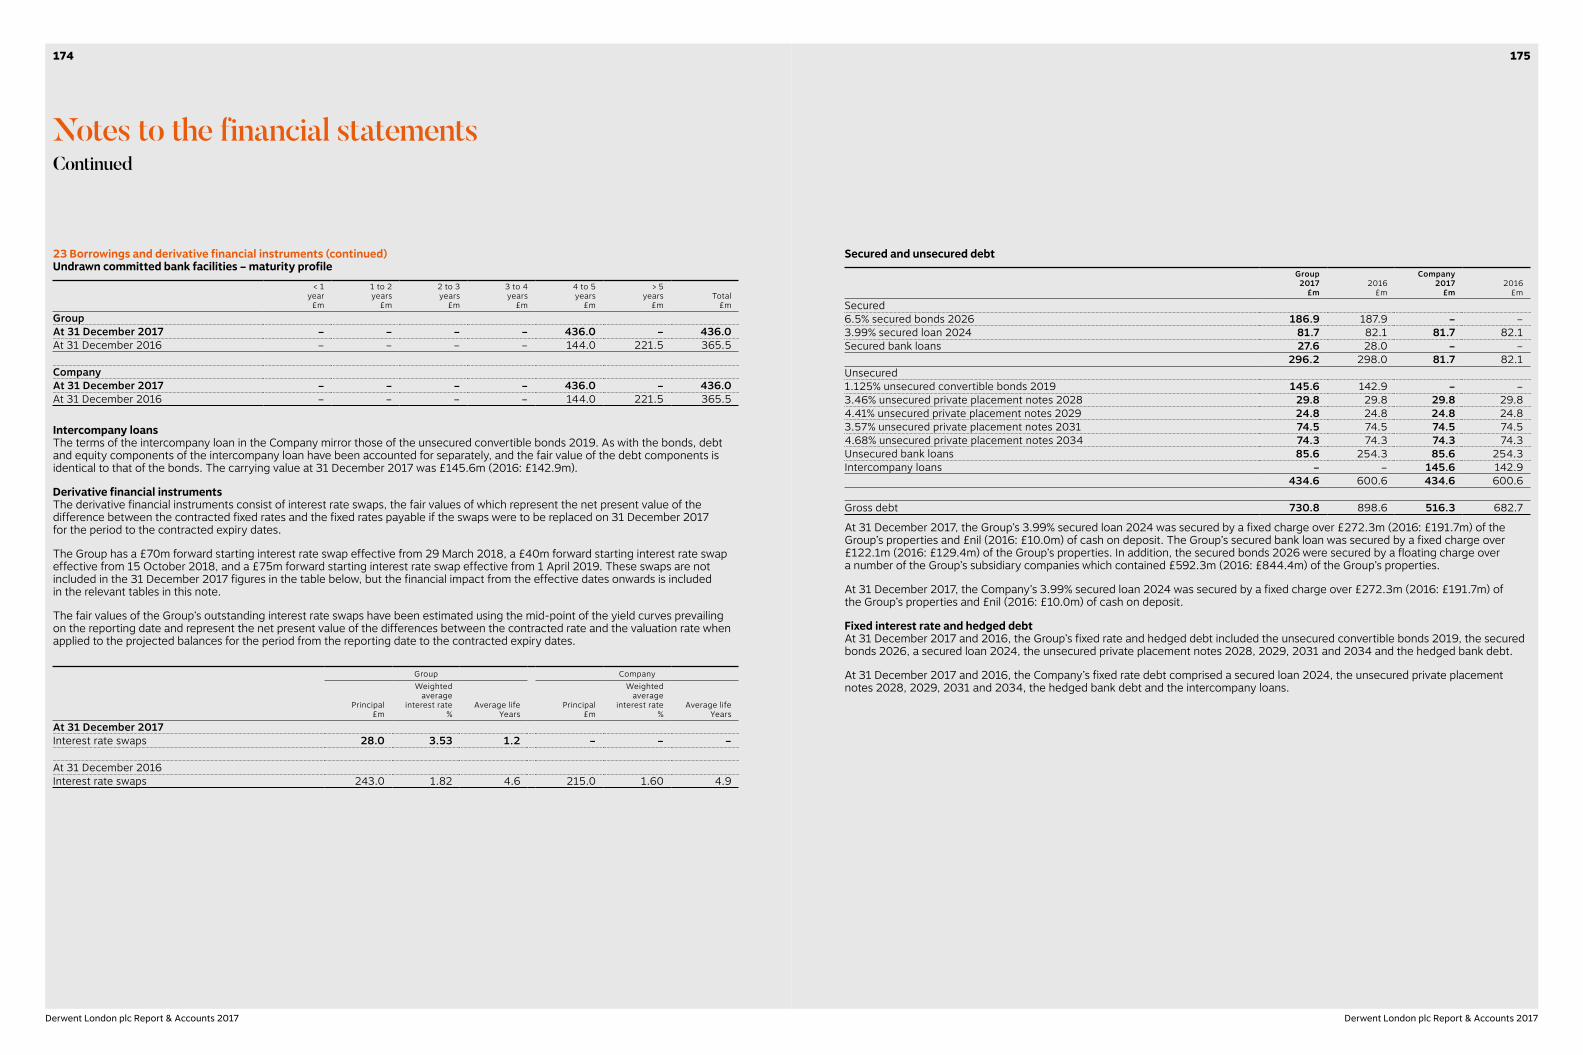
Secured and unsecured debtGroup2017
£m2016
£m
Company2017
£m2016
£mSecured6.5% secured bonds 2026 186.9 187.9 – –3.99% secured loan 2024 81.7 82.1 81.7 82.1Secured bank loans 27.6 28.0 – –
296.2 298.0 81.7 82.1Unsecured1.125% unsecured convertible bonds 2019 145.6 142.9 – –3.46% unsecured private placement notes 2028 29.8 29.8 29.8 29.84.41% unsecured private placement notes 2029 24.8 24.8 24.8 24.83.57% unsecured private placement notes 2031 74.5 74.5 74.5 74.54.68% unsecured private placement notes 2034 74.3 74.3 74.3 74.3Unsecured bank loans 85.6 254.3 85.6 254.3Intercompany loans – – 145.6 142.9
434.6 600.6 434.6 600.6
Gross debt 730.8 898.6 516.3 682.7
At 31 December 2017, the Group’s 3.99% secured loan 2024 was secured by a fixed charge over £272.3m (2016: £191.7m) of the Group’s properties and £nil (2016: £10.0m) of cash on deposit. The Group’s secured bank loan was secured by a fixed charge over £122.1m (2016: £129.4m) of the Group’s properties. In addition, the secured bonds 2026 were secured by a floating charge over a number of the Group’s subsidiary companies which contained £592.3m (2016: £844.4m) of the Group’s properties.
At 31 December 2017, the Company’s 3.99% secured loan 2024 was secured by a fixed charge over £272.3m (2016: £191.7m) of the Group’s properties and £nil (2016: £10.0m) of cash on deposit.
Fixed interest rate and hedged debtAt 31 December 2017 and 2016, the Group’s fixed rate and hedged debt included the unsecured convertible bonds 2019, the secured bonds 2026, a secured loan 2024, the unsecured private placement notes 2028, 2029, 2031 and 2034 and the hedged bank debt.
At 31 December 2017 and 2016, the Company’s fixed rate debt comprised a secured loan 2024, the unsecured private placement notes 2028, 2029, 2031 and 2034, the hedged bank debt and the intercompany loans.
23 Borrowings and derivative financial instruments (continued)Undrawn committed bank facilities – maturity profile
< 1year£m
1 to 2years
£m
2 to 3years
£m
3 to 4years
£m
4 to 5years
£m
> 5 years
£mTotal
£mGroupAt 31 December 2017 – – – – 436.0 – 436.0At 31 December 2016 – – – – 144.0 221.5 365.5
CompanyAt 31 December 2017 – – – – 436.0 – 436.0At 31 December 2016 – – – – 144.0 221.5 365.5
Intercompany loansThe terms of the intercompany loan in the Company mirror those of the unsecured convertible bonds 2019. As with the bonds, debt and equity components of the intercompany loan have been accounted for separately, and the fair value of the debt components is identical to that of the bonds. The carrying value at 31 December 2017 was £145.6m (2016: £142.9m).
Derivative financial instrumentsThe derivative financial instruments consist of interest rate swaps, the fair values of which represent the net present value of the difference between the contracted fixed rates and the fixed rates payable if the swaps were to be replaced on 31 December 2017 for the period to the contracted expiry dates.
The Group has a £70m forward starting interest rate swap effective from 29 March 2018, a £40m forward starting interest rate swap effective from 15 October 2018, and a £75m forward starting interest rate swap effective from 1 April 2019. These swaps are not included in the 31 December 2017 figures in the table below, but the financial impact from the effective dates onwards is included in the relevant tables in this note.
The fair values of the Group’s outstanding interest rate swaps have been estimated using the mid-point of the yield curves prevailing on the reporting date and represent the net present value of the differences between the contracted rate and the valuation rate when applied to the projected balances for the period from the reporting date to the contracted expiry dates.
Group Company
Principal£m
Weightedaverage
interest rate%
Average lifeYears
Principal£m
Weightedaverage
interest rate%
Average lifeYears
At 31 December 2017Interest rate swaps 28.0 3.53 1.2 – – –
At 31 December 2016Interest rate swaps 243.0 1.82 4.6 215.0 1.60 4.9
Notes to the financial statementsContinued
175174
Derwent London plc Report & Accounts 2017 Derwent London plc Report & Accounts 2017
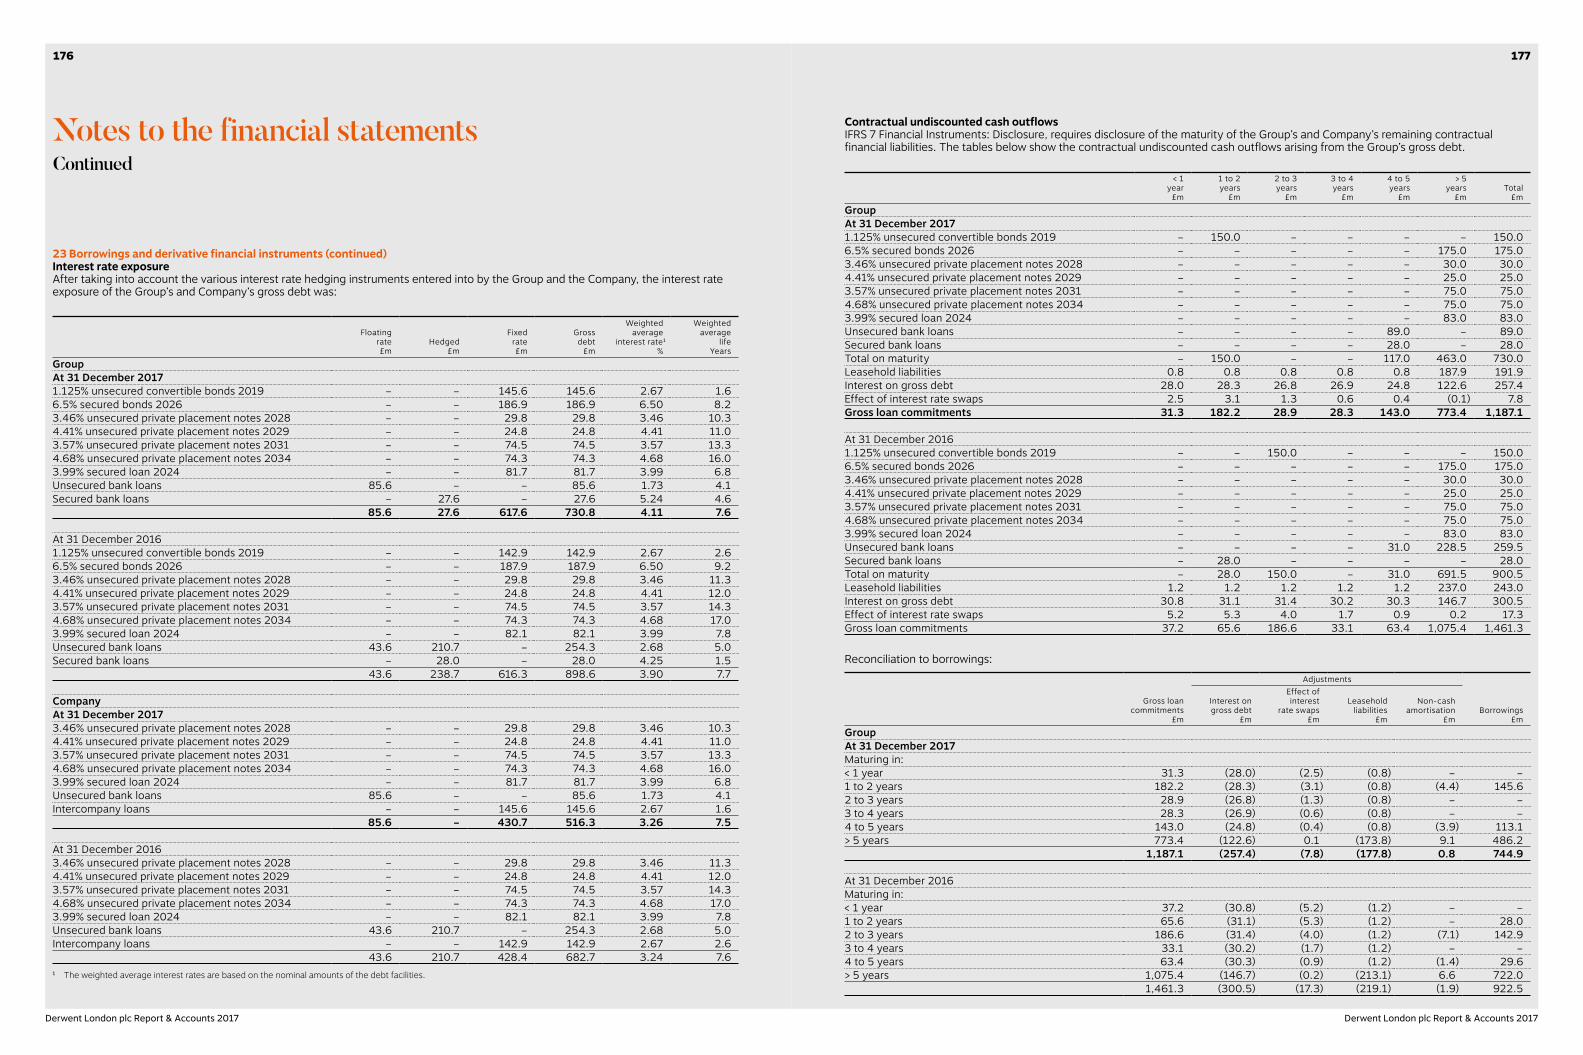
Contractual undiscounted cash outflowsIFRS 7 Financial Instruments: Disclosure, requires disclosure of the maturity of the Group’s and Company’s remaining contractual financial liabilities. The tables below show the contractual undiscounted cash outflows arising from the Group’s gross debt.
< 1year£m
1 to 2years
£m
2 to 3years
£m
3 to 4years
£m
4 to 5years
£m
> 5 years
£mTotal
£mGroup At 31 December 20171.125% unsecured convertible bonds 2019 – 150.0 – – – – 150.06.5% secured bonds 2026 – – – – – 175.0 175.03.46% unsecured private placement notes 2028 – – – – – 30.0 30.04.41% unsecured private placement notes 2029 – – – – – 25.0 25.03.57% unsecured private placement notes 2031 – – – – – 75.0 75.04.68% unsecured private placement notes 2034 – – – – – 75.0 75.03.99% secured loan 2024 – – – – – 83.0 83.0Unsecured bank loans – – – – 89.0 – 89.0Secured bank loans – – – – 28.0 – 28.0Total on maturity – 150.0 – – 117.0 463.0 730.0Leasehold liabilities 0.8 0.8 0.8 0.8 0.8 187.9 191.9Interest on gross debt 28.0 28.3 26.8 26.9 24.8 122.6 257.4Effect of interest rate swaps 2.5 3.1 1.3 0.6 0.4 (0.1) 7.8Gross loan commitments 31.3 182.2 28.9 28.3 143.0 773.4 1,187.1
At 31 December 20161.125% unsecured convertible bonds 2019 – – 150.0 – – – 150.06.5% secured bonds 2026 – – – – – 175.0 175.03.46% unsecured private placement notes 2028 – – – – – 30.0 30.04.41% unsecured private placement notes 2029 – – – – – 25.0 25.03.57% unsecured private placement notes 2031 – – – – – 75.0 75.04.68% unsecured private placement notes 2034 – – – – – 75.0 75.03.99% secured loan 2024 – – – – – 83.0 83.0Unsecured bank loans – – – – 31.0 228.5 259.5Secured bank loans – 28.0 – – – – 28.0Total on maturity – 28.0 150.0 – 31.0 691.5 900.5Leasehold liabilities 1.2 1.2 1.2 1.2 1.2 237.0 243.0Interest on gross debt 30.8 31.1 31.4 30.2 30.3 146.7 300.5Effect of interest rate swaps 5.2 5.3 4.0 1.7 0.9 0.2 17.3Gross loan commitments 37.2 65.6 186.6 33.1 63.4 1,075.4 1,461.3
Reconciliation to borrowings:
Gross loancommitments
£m
Adjustments
Borrowings£m
Interest ongross debt
£m
Effect of interest
rate swaps£m
Leaseholdliabilities
£m
Non-cashamortisation
£mGroupAt 31 December 2017Maturing in:< 1 year 31.3 (28.0) (2.5) (0.8) – –1 to 2 years 182.2 (28.3) (3.1) (0.8) (4.4) 145.62 to 3 years 28.9 (26.8) (1.3) (0.8) – –3 to 4 years 28.3 (26.9) (0.6) (0.8) – –4 to 5 years 143.0 (24.8) (0.4) (0.8) (3.9) 113.1> 5 years 773.4 (122.6) 0.1 (173.8) 9.1 486.2
1,187.1 (257.4) (7.8) (177.8) 0.8 744.9
At 31 December 2016Maturing in:< 1 year 37.2 (30.8) (5.2) (1.2) – –1 to 2 years 65.6 (31.1) (5.3) (1.2) – 28.02 to 3 years 186.6 (31.4) (4.0) (1.2) (7.1) 142.93 to 4 years 33.1 (30.2) (1.7) (1.2) – –4 to 5 years 63.4 (30.3) (0.9) (1.2) (1.4) 29.6> 5 years 1,075.4 (146.7) (0.2) (213.1) 6.6 722.0
1,461.3 (300.5) (17.3) (219.1) (1.9) 922.5
23 Borrowings and derivative financial instruments (continued)Interest rate exposureAfter taking into account the various interest rate hedging instruments entered into by the Group and the Company, the interest rate exposure of the Group’s and Company’s gross debt was:
Floatingrate£m
Hedged£m
Fixedrate£m
Grossdebt
£m
Weightedaverage
interest rate1
%
Weightedaverage
lifeYears
GroupAt 31 December 20171.125% unsecured convertible bonds 2019 – – 145.6 145.6 2.67 1.66.5% secured bonds 2026 – – 186.9 186.9 6.50 8.23.46% unsecured private placement notes 2028 – – 29.8 29.8 3.46 10.34.41% unsecured private placement notes 2029 – – 24.8 24.8 4.41 11.03.57% unsecured private placement notes 2031 – – 74.5 74.5 3.57 13.34.68% unsecured private placement notes 2034 – – 74.3 74.3 4.68 16.03.99% secured loan 2024 – – 81.7 81.7 3.99 6.8Unsecured bank loans 85.6 – – 85.6 1.73 4.1Secured bank loans – 27.6 – 27.6 5.24 4.6
85.6 27.6 617.6 730.8 4.11 7.6
At 31 December 20161.125% unsecured convertible bonds 2019 – – 142.9 142.9 2.67 2.66.5% secured bonds 2026 – – 187.9 187.9 6.50 9.23.46% unsecured private placement notes 2028 – – 29.8 29.8 3.46 11.34.41% unsecured private placement notes 2029 – – 24.8 24.8 4.41 12.03.57% unsecured private placement notes 2031 – – 74.5 74.5 3.57 14.34.68% unsecured private placement notes 2034 – – 74.3 74.3 4.68 17.03.99% secured loan 2024 – – 82.1 82.1 3.99 7.8Unsecured bank loans 43.6 210.7 – 254.3 2.68 5.0Secured bank loans – 28.0 – 28.0 4.25 1.5
43.6 238.7 616.3 898.6 3.90 7.7
Company At 31 December 20173.46% unsecured private placement notes 2028 – – 29.8 29.8 3.46 10.34.41% unsecured private placement notes 2029 – – 24.8 24.8 4.41 11.03.57% unsecured private placement notes 2031 – – 74.5 74.5 3.57 13.34.68% unsecured private placement notes 2034 – – 74.3 74.3 4.68 16.03.99% secured loan 2024 – – 81.7 81.7 3.99 6.8Unsecured bank loans 85.6 – – 85.6 1.73 4.1Intercompany loans – – 145.6 145.6 2.67 1.6
85.6 – 430.7 516.3 3.26 7.5
At 31 December 20163.46% unsecured private placement notes 2028 – – 29.8 29.8 3.46 11.34.41% unsecured private placement notes 2029 – – 24.8 24.8 4.41 12.03.57% unsecured private placement notes 2031 – – 74.5 74.5 3.57 14.34.68% unsecured private placement notes 2034 – – 74.3 74.3 4.68 17.03.99% secured loan 2024 – – 82.1 82.1 3.99 7.8Unsecured bank loans 43.6 210.7 – 254.3 2.68 5.0Intercompany loans – – 142.9 142.9 2.67 2.6 43.6 210.7 428.4 682.7 3.24 7.61 The weighted average interest rates are based on the nominal amounts of the debt facilities.
Notes to the financial statementsContinued
177176
Derwent London plc Report & Accounts 2017 Derwent London plc Report & Accounts 2017
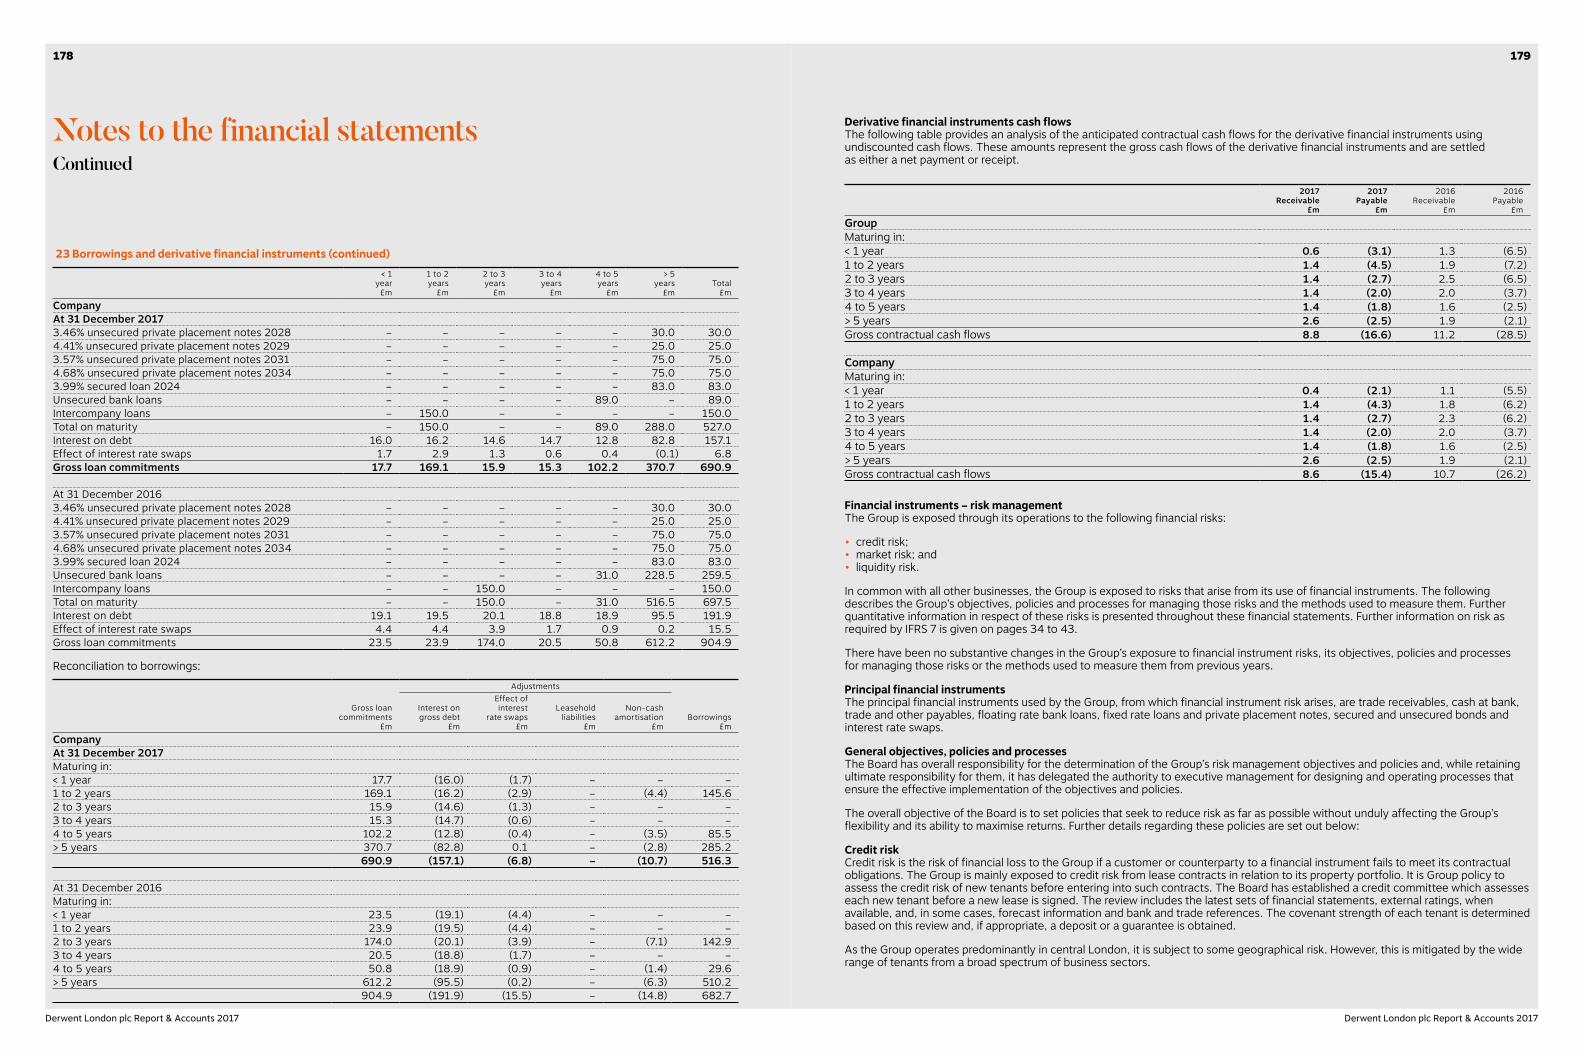
Derivative financial instruments cash flowsThe following table provides an analysis of the anticipated contractual cash flows for the derivative financial instruments using undiscounted cash flows. These amounts represent the gross cash flows of the derivative financial instruments and are settled as either a net payment or receipt.
2017Receivable
£m
2017Payable
£m
2016Receivable
£m
2016Payable
£m
GroupMaturing in:< 1 year 0.6 (3.1) 1.3 (6.5)1 to 2 years 1.4 (4.5) 1.9 (7.2)2 to 3 years 1.4 (2.7) 2.5 (6.5)3 to 4 years 1.4 (2.0) 2.0 (3.7)4 to 5 years 1.4 (1.8) 1.6 (2.5)> 5 years 2.6 (2.5) 1.9 (2.1)Gross contractual cash flows 8.8 (16.6) 11.2 (28.5)
CompanyMaturing in:< 1 year 0.4 (2.1) 1.1 (5.5)1 to 2 years 1.4 (4.3) 1.8 (6.2)2 to 3 years 1.4 (2.7) 2.3 (6.2)3 to 4 years 1.4 (2.0) 2.0 (3.7)4 to 5 years 1.4 (1.8) 1.6 (2.5)> 5 years 2.6 (2.5) 1.9 (2.1)Gross contractual cash flows 8.6 (15.4) 10.7 (26.2)
Financial instruments – risk managementThe Group is exposed through its operations to the following financial risks:
• credit risk;• market risk; and• liquidity risk.
In common with all other businesses, the Group is exposed to risks that arise from its use of financial instruments. The following describes the Group’s objectives, policies and processes for managing those risks and the methods used to measure them. Further quantitative information in respect of these risks is presented throughout these financial statements. Further information on risk as required by IFRS 7 is given on pages 34 to 43.
There have been no substantive changes in the Group’s exposure to financial instrument risks, its objectives, policies and processes for managing those risks or the methods used to measure them from previous years.
Principal financial instrumentsThe principal financial instruments used by the Group, from which financial instrument risk arises, are trade receivables, cash at bank, trade and other payables, floating rate bank loans, fixed rate loans and private placement notes, secured and unsecured bonds and interest rate swaps.
General objectives, policies and processesThe Board has overall responsibility for the determination of the Group’s risk management objectives and policies and, while retaining ultimate responsibility for them, it has delegated the authority to executive management for designing and operating processes that ensure the effective implementation of the objectives and policies.
The overall objective of the Board is to set policies that seek to reduce risk as far as possible without unduly affecting the Group’s flexibility and its ability to maximise returns. Further details regarding these policies are set out below:
Credit riskCredit risk is the risk of financial loss to the Group if a customer or counterparty to a financial instrument fails to meet its contractual obligations. The Group is mainly exposed to credit risk from lease contracts in relation to its property portfolio. It is Group policy to assess the credit risk of new tenants before entering into such contracts. The Board has established a credit committee which assesses each new tenant before a new lease is signed. The review includes the latest sets of financial statements, external ratings, when available, and, in some cases, forecast information and bank and trade references. The covenant strength of each tenant is determined based on this review and, if appropriate, a deposit or a guarantee is obtained.
As the Group operates predominantly in central London, it is subject to some geographical risk. However, this is mitigated by the wide range of tenants from a broad spectrum of business sectors.
23 Borrowings and derivative financial instruments (continued)< 1
year£m
1 to 2years
£m
2 to 3years
£m
3 to 4years
£m
4 to 5years
£m
> 5 years
£mTotal
£mCompany At 31 December 20173.46% unsecured private placement notes 2028 – – – – – 30.0 30.04.41% unsecured private placement notes 2029 – – – – – 25.0 25.03.57% unsecured private placement notes 2031 – – – – – 75.0 75.04.68% unsecured private placement notes 2034 – – – – – 75.0 75.03.99% secured loan 2024 – – – – – 83.0 83.0Unsecured bank loans – – – – 89.0 – 89.0Intercompany loans – 150.0 – – – – 150.0Total on maturity – 150.0 – – 89.0 288.0 527.0Interest on debt 16.0 16.2 14.6 14.7 12.8 82.8 157.1Effect of interest rate swaps 1.7 2.9 1.3 0.6 0.4 (0.1) 6.8Gross loan commitments 17.7 169.1 15.9 15.3 102.2 370.7 690.9
At 31 December 20163.46% unsecured private placement notes 2028 – – – – – 30.0 30.04.41% unsecured private placement notes 2029 – – – – – 25.0 25.03.57% unsecured private placement notes 2031 – – – – – 75.0 75.04.68% unsecured private placement notes 2034 – – – – – 75.0 75.03.99% secured loan 2024 – – – – – 83.0 83.0Unsecured bank loans – – – – 31.0 228.5 259.5Intercompany loans – – 150.0 – – – 150.0Total on maturity – – 150.0 – 31.0 516.5 697.5Interest on debt 19.1 19.5 20.1 18.8 18.9 95.5 191.9Effect of interest rate swaps 4.4 4.4 3.9 1.7 0.9 0.2 15.5Gross loan commitments 23.5 23.9 174.0 20.5 50.8 612.2 904.9
Reconciliation to borrowings:
Gross loancommitments
£m
Adjustments
Borrowings£m
Interest ongross debt
£m
Effect of interest
rate swaps£m
Leaseholdliabilities
£m
Non-cashamortisation
£mCompanyAt 31 December 2017Maturing in:< 1 year 17.7 (16.0) (1.7) – – –1 to 2 years 169.1 (16.2) (2.9) – (4.4) 145.62 to 3 years 15.9 (14.6) (1.3) – – –3 to 4 years 15.3 (14.7) (0.6) – – –4 to 5 years 102.2 (12.8) (0.4) – (3.5) 85.5> 5 years 370.7 (82.8) 0.1 – (2.8) 285.2
690.9 (157.1) (6.8) – (10.7) 516.3
At 31 December 2016Maturing in:< 1 year 23.5 (19.1) (4.4) – – –1 to 2 years 23.9 (19.5) (4.4) – – –2 to 3 years 174.0 (20.1) (3.9) – (7.1) 142.93 to 4 years 20.5 (18.8) (1.7) – – –4 to 5 years 50.8 (18.9) (0.9) – (1.4) 29.6> 5 years 612.2 (95.5) (0.2) – (6.3) 510.2
904.9 (191.9) (15.5) – (14.8) 682.7
Notes to the financial statementsContinued
179178
Derwent London plc Report & Accounts 2017 Derwent London plc Report & Accounts 2017
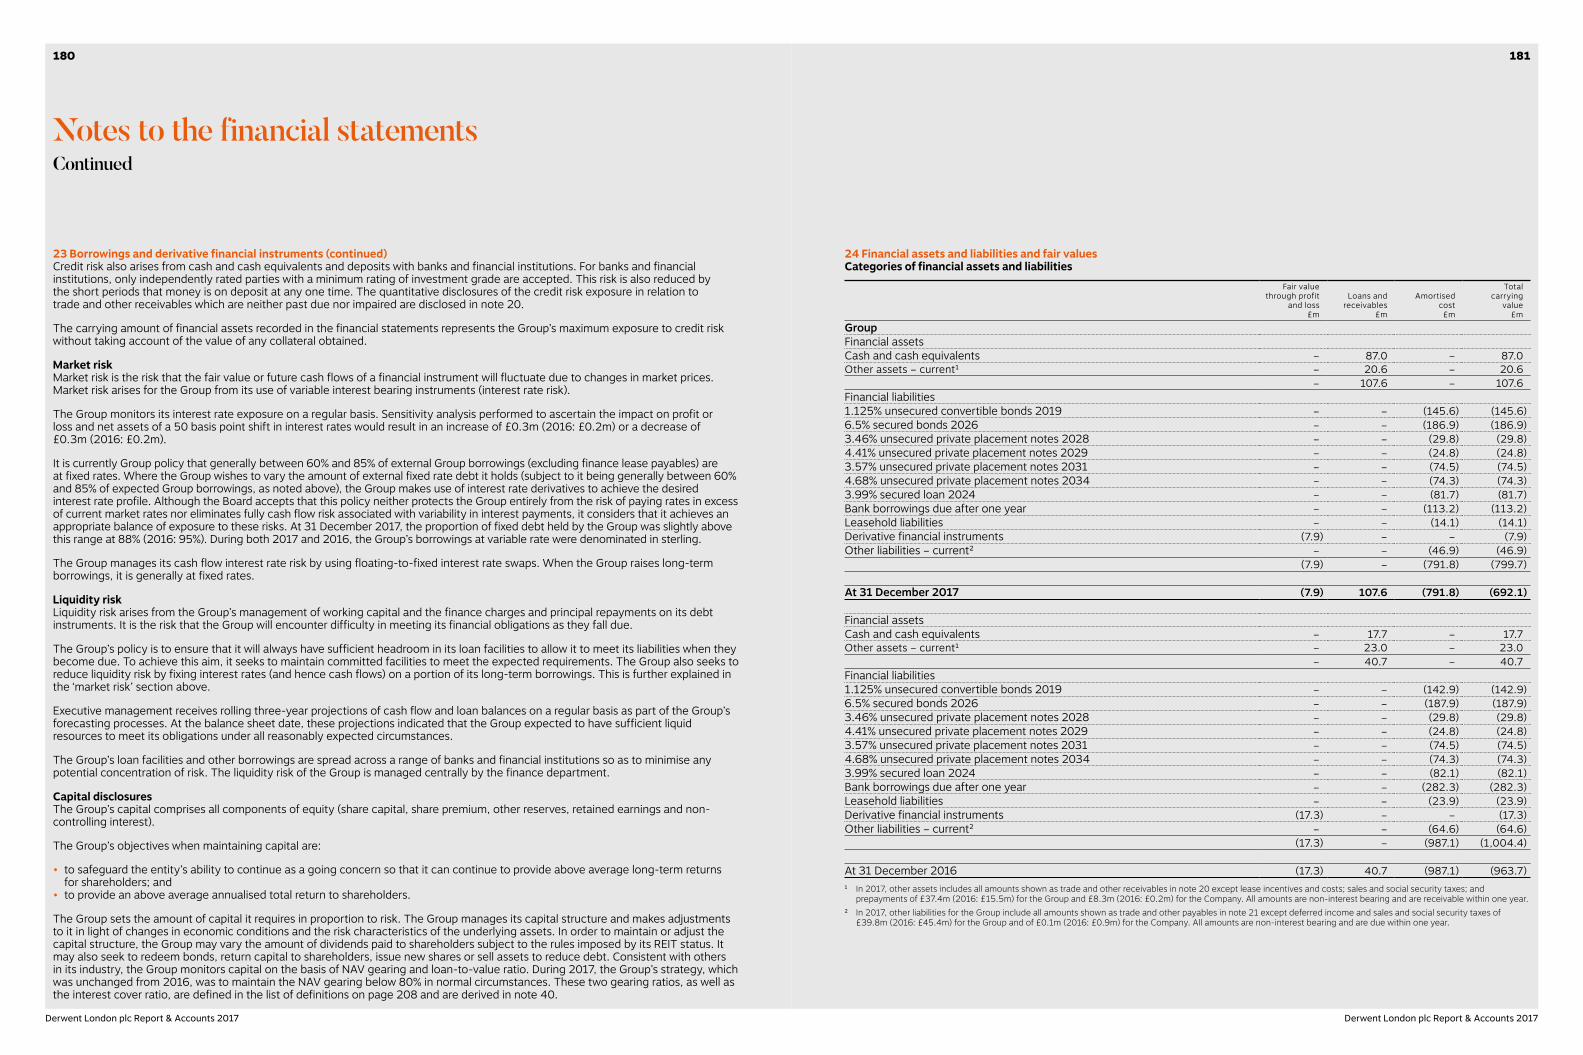
24 Financial assets and liabilities and fair valuesCategories of financial assets and liabilities
Fair value through profit
and loss£m
Loans andreceivables
£m
Amortisedcost£m
Totalcarrying
value£m
GroupFinancial assetsCash and cash equivalents – 87.0 – 87.0Other assets – current1 – 20.6 – 20.6
– 107.6 – 107.6Financial liabilities1.125% unsecured convertible bonds 2019 – – (145.6) (145.6)6.5% secured bonds 2026 – – (186.9) (186.9)3.46% unsecured private placement notes 2028 – – (29.8) (29.8)4.41% unsecured private placement notes 2029 – – (24.8) (24.8)3.57% unsecured private placement notes 2031 – – (74.5) (74.5)4.68% unsecured private placement notes 2034 – – (74.3) (74.3)3.99% secured loan 2024 – – (81.7) (81.7)Bank borrowings due after one year – – (113.2) (113.2)Leasehold liabilities – – (14.1) (14.1)Derivative financial instruments (7.9) – – (7.9)Other liabilities – current2 – – (46.9) (46.9)
(7.9) – (791.8) (799.7)
At 31 December 2017 (7.9) 107.6 (791.8) (692.1)
Financial assetsCash and cash equivalents – 17.7 – 17.7Other assets – current1 – 23.0 – 23.0
– 40.7 – 40.7Financial liabilities1.125% unsecured convertible bonds 2019 – – (142.9) (142.9)6.5% secured bonds 2026 – – (187.9) (187.9)3.46% unsecured private placement notes 2028 – – (29.8) (29.8)4.41% unsecured private placement notes 2029 – – (24.8) (24.8)3.57% unsecured private placement notes 2031 – – (74.5) (74.5)4.68% unsecured private placement notes 2034 – – (74.3) (74.3)3.99% secured loan 2024 – – (82.1) (82.1)Bank borrowings due after one year – – (282.3) (282.3)Leasehold liabilities – – (23.9) (23.9)Derivative financial instruments (17.3) – – (17.3)Other liabilities – current2 – – (64.6) (64.6)
(17.3) – (987.1) (1,004.4)
At 31 December 2016 (17.3) 40.7 (987.1) (963.7)1 In 2017, other assets includes all amounts shown as trade and other receivables in note 20 except lease incentives and costs; sales and social security taxes; and
prepayments of £37.4m (2016: £15.5m) for the Group and £8.3m (2016: £0.2m) for the Company. All amounts are non-interest bearing and are receivable within one year.2 In 2017, other liabilities for the Group include all amounts shown as trade and other payables in note 21 except deferred income and sales and social security taxes of
£39.8m (2016: £45.4m) for the Group and of £0.1m (2016: £0.9m) for the Company. All amounts are non-interest bearing and are due within one year.
23 Borrowings and derivative financial instruments (continued)Credit risk also arises from cash and cash equivalents and deposits with banks and financial institutions. For banks and financial institutions, only independently rated parties with a minimum rating of investment grade are accepted. This risk is also reduced by the short periods that money is on deposit at any one time. The quantitative disclosures of the credit risk exposure in relation to trade and other receivables which are neither past due nor impaired are disclosed in note 20.
The carrying amount of financial assets recorded in the financial statements represents the Group’s maximum exposure to credit risk without taking account of the value of any collateral obtained.
Market riskMarket risk is the risk that the fair value or future cash flows of a financial instrument will fluctuate due to changes in market prices. Market risk arises for the Group from its use of variable interest bearing instruments (interest rate risk).
The Group monitors its interest rate exposure on a regular basis. Sensitivity analysis performed to ascertain the impact on profit or loss and net assets of a 50 basis point shift in interest rates would result in an increase of £0.3m (2016: £0.2m) or a decrease of £0.3m (2016: £0.2m).
It is currently Group policy that generally between 60% and 85% of external Group borrowings (excluding finance lease payables) are at fixed rates. Where the Group wishes to vary the amount of external fixed rate debt it holds (subject to it being generally between 60% and 85% of expected Group borrowings, as noted above), the Group makes use of interest rate derivatives to achieve the desired interest rate profile. Although the Board accepts that this policy neither protects the Group entirely from the risk of paying rates in excess of current market rates nor eliminates fully cash flow risk associated with variability in interest payments, it considers that it achieves an appropriate balance of exposure to these risks. At 31 December 2017, the proportion of fixed debt held by the Group was slightly above this range at 88% (2016: 95%). During both 2017 and 2016, the Group’s borrowings at variable rate were denominated in sterling.
The Group manages its cash flow interest rate risk by using floating-to-fixed interest rate swaps. When the Group raises long-term borrowings, it is generally at fixed rates.
Liquidity riskLiquidity risk arises from the Group’s management of working capital and the finance charges and principal repayments on its debt instruments. It is the risk that the Group will encounter difficulty in meeting its financial obligations as they fall due.
The Group’s policy is to ensure that it will always have sufficient headroom in its loan facilities to allow it to meet its liabilities when they become due. To achieve this aim, it seeks to maintain committed facilities to meet the expected requirements. The Group also seeks to reduce liquidity risk by fixing interest rates (and hence cash flows) on a portion of its long-term borrowings. This is further explained in the ‘market risk’ section above.
Executive management receives rolling three-year projections of cash flow and loan balances on a regular basis as part of the Group’s forecasting processes. At the balance sheet date, these projections indicated that the Group expected to have sufficient liquid resources to meet its obligations under all reasonably expected circumstances.
The Group’s loan facilities and other borrowings are spread across a range of banks and financial institutions so as to minimise any potential concentration of risk. The liquidity risk of the Group is managed centrally by the finance department.
Capital disclosuresThe Group’s capital comprises all components of equity (share capital, share premium, other reserves, retained earnings and non-controlling interest).
The Group’s objectives when maintaining capital are:
• to safeguard the entity’s ability to continue as a going concern so that it can continue to provide above average long-term returns for shareholders; and
• to provide an above average annualised total return to shareholders.
The Group sets the amount of capital it requires in proportion to risk. The Group manages its capital structure and makes adjustments to it in light of changes in economic conditions and the risk characteristics of the underlying assets. In order to maintain or adjust the capital structure, the Group may vary the amount of dividends paid to shareholders subject to the rules imposed by its REIT status. It may also seek to redeem bonds, return capital to shareholders, issue new shares or sell assets to reduce debt. Consistent with others in its industry, the Group monitors capital on the basis of NAV gearing and loan-to-value ratio. During 2017, the Group’s strategy, which was unchanged from 2016, was to maintain the NAV gearing below 80% in normal circumstances. These two gearing ratios, as well as the interest cover ratio, are defined in the list of definitions on page 208 and are derived in note 40.
Notes to the financial statementsContinued
181180
Derwent London plc Report & Accounts 2017 Derwent London plc Report & Accounts 2017
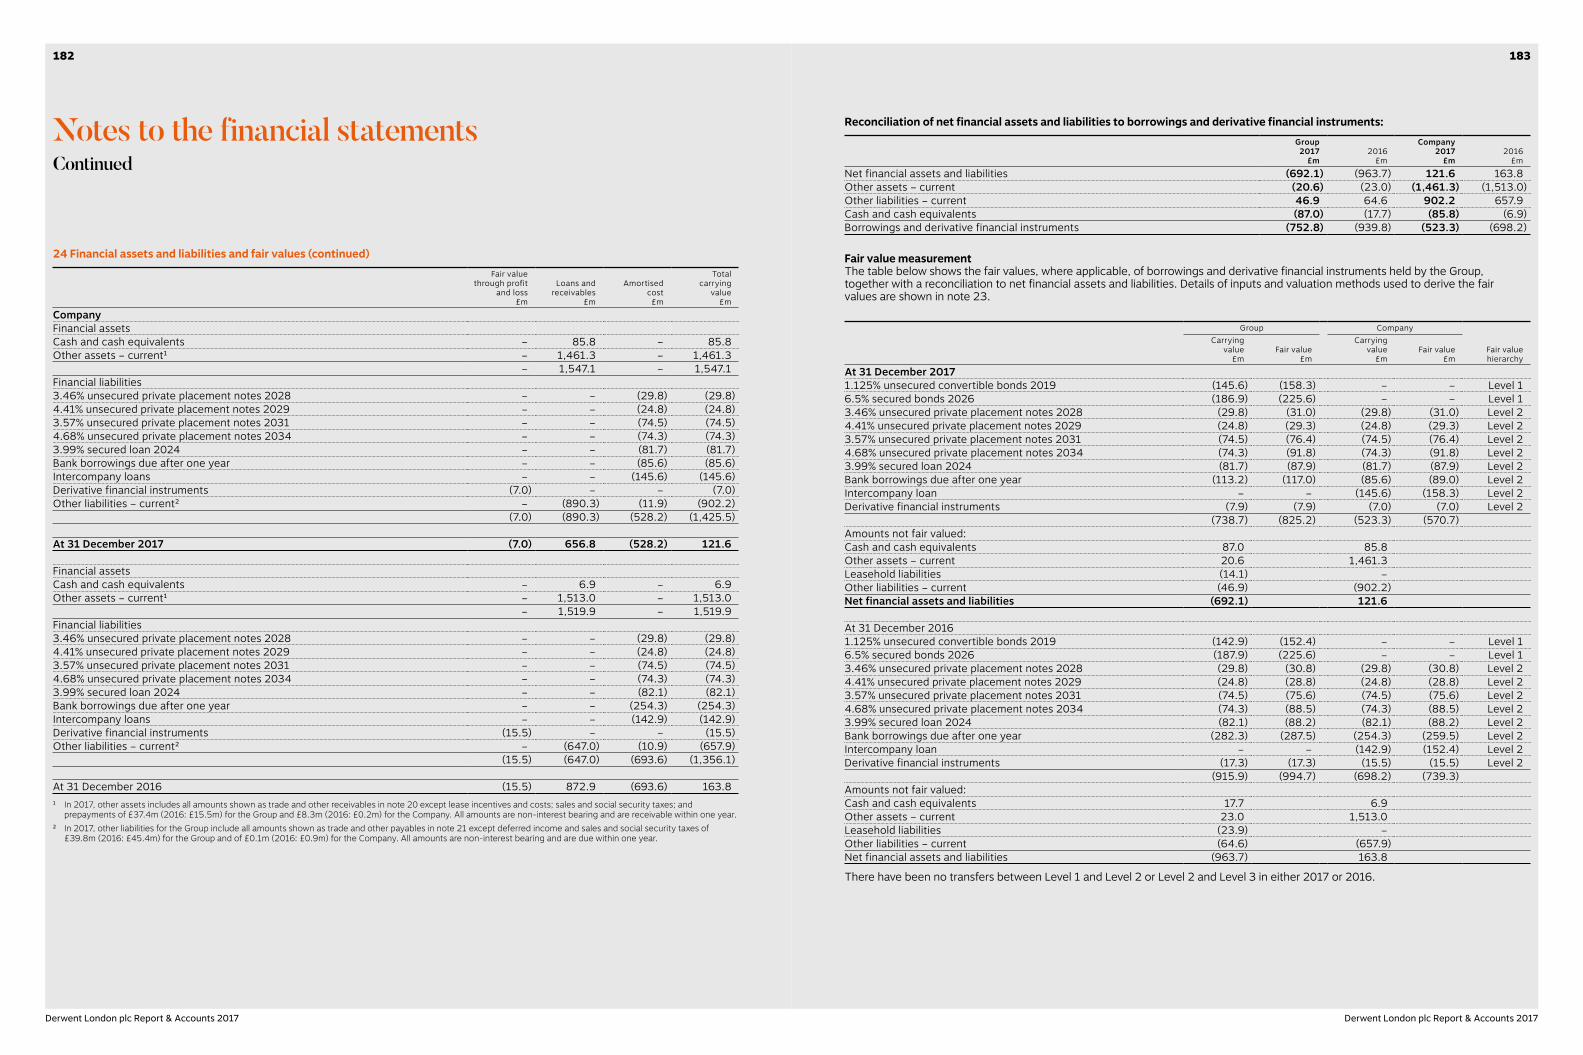
Reconciliation of net financial assets and liabilities to borrowings and derivative financial instruments: Group2017
£m2016
£m
Company2017
£m2016
£mNet financial assets and liabilities (692.1) (963.7) 121.6 163.8Other assets – current (20.6) (23.0) (1,461.3) (1,513.0)Other liabilities – current 46.9 64.6 902.2 657.9Cash and cash equivalents (87.0) (17.7) (85.8) (6.9)Borrowings and derivative financial instruments (752.8) (939.8) (523.3) (698.2)
Fair value measurementThe table below shows the fair values, where applicable, of borrowings and derivative financial instruments held by the Group, together with a reconciliation to net financial assets and liabilities. Details of inputs and valuation methods used to derive the fair values are shown in note 23.
Group Company
Fair valuehierarchy
Carrying value
£mFair value
£m
Carrying value
£mFair value
£mAt 31 December 20171.125% unsecured convertible bonds 2019 (145.6) (158.3) – – Level 16.5% secured bonds 2026 (186.9) (225.6) – – Level 13.46% unsecured private placement notes 2028 (29.8) (31.0) (29.8) (31.0) Level 24.41% unsecured private placement notes 2029 (24.8) (29.3) (24.8) (29.3) Level 23.57% unsecured private placement notes 2031 (74.5) (76.4) (74.5) (76.4) Level 24.68% unsecured private placement notes 2034 (74.3) (91.8) (74.3) (91.8) Level 23.99% secured loan 2024 (81.7) (87.9) (81.7) (87.9) Level 2Bank borrowings due after one year (113.2) (117.0) (85.6) (89.0) Level 2Intercompany loan – – (145.6) (158.3) Level 2Derivative financial instruments (7.9) (7.9) (7.0) (7.0) Level 2
(738.7) (825.2) (523.3) (570.7)Amounts not fair valued:Cash and cash equivalents 87.0 85.8Other assets – current 20.6 1,461.3Leasehold liabilities (14.1) –Other liabilities – current (46.9) (902.2)Net financial assets and liabilities (692.1) 121.6
At 31 December 20161.125% unsecured convertible bonds 2019 (142.9) (152.4) – – Level 16.5% secured bonds 2026 (187.9) (225.6) – – Level 13.46% unsecured private placement notes 2028 (29.8) (30.8) (29.8) (30.8) Level 24.41% unsecured private placement notes 2029 (24.8) (28.8) (24.8) (28.8) Level 23.57% unsecured private placement notes 2031 (74.5) (75.6) (74.5) (75.6) Level 24.68% unsecured private placement notes 2034 (74.3) (88.5) (74.3) (88.5) Level 23.99% secured loan 2024 (82.1) (88.2) (82.1) (88.2) Level 2Bank borrowings due after one year (282.3) (287.5) (254.3) (259.5) Level 2Intercompany loan – – (142.9) (152.4) Level 2Derivative financial instruments (17.3) (17.3) (15.5) (15.5) Level 2
(915.9) (994.7) (698.2) (739.3)Amounts not fair valued:Cash and cash equivalents 17.7 6.9Other assets – current 23.0 1,513.0Leasehold liabilities (23.9) –Other liabilities – current (64.6) (657.9)Net financial assets and liabilities (963.7) 163.8
There have been no transfers between Level 1 and Level 2 or Level 2 and Level 3 in either 2017 or 2016.
24 Financial assets and liabilities and fair values (continued)Fair value
through profitand loss
£m
Loans andreceivables
£m
Amortisedcost£m
Totalcarrying
value£m
CompanyFinancial assetsCash and cash equivalents – 85.8 – 85.8Other assets – current1 – 1,461.3 – 1,461.3
– 1,547.1 – 1,547.1Financial liabilities3.46% unsecured private placement notes 2028 – – (29.8) (29.8)4.41% unsecured private placement notes 2029 – – (24.8) (24.8)3.57% unsecured private placement notes 2031 – – (74.5) (74.5)4.68% unsecured private placement notes 2034 – – (74.3) (74.3)3.99% secured loan 2024 – – (81.7) (81.7)Bank borrowings due after one year – – (85.6) (85.6)Intercompany loans – – (145.6) (145.6)Derivative financial instruments (7.0) – – (7.0)Other liabilities – current2 – (890.3) (11.9) (902.2)
(7.0) (890.3) (528.2) (1,425.5)
At 31 December 2017 (7.0) 656.8 (528.2) 121.6
Financial assetsCash and cash equivalents – 6.9 – 6.9Other assets – current1 – 1,513.0 – 1,513.0
– 1,519.9 – 1,519.9Financial liabilities3.46% unsecured private placement notes 2028 – – (29.8) (29.8)4.41% unsecured private placement notes 2029 – – (24.8) (24.8)3.57% unsecured private placement notes 2031 – – (74.5) (74.5)4.68% unsecured private placement notes 2034 – – (74.3) (74.3)3.99% secured loan 2024 – – (82.1) (82.1)Bank borrowings due after one year – – (254.3) (254.3)Intercompany loans – – (142.9) (142.9)Derivative financial instruments (15.5) – – (15.5)Other liabilities – current2 – (647.0) (10.9) (657.9)
(15.5) (647.0) (693.6) (1,356.1)
At 31 December 2016 (15.5) 872.9 (693.6) 163.81 In 2017, other assets includes all amounts shown as trade and other receivables in note 20 except lease incentives and costs; sales and social security taxes; and
prepayments of £37.4m (2016: £15.5m) for the Group and £8.3m (2016: £0.2m) for the Company. All amounts are non-interest bearing and are receivable within one year.2 In 2017, other liabilities for the Group include all amounts shown as trade and other payables in note 21 except deferred income and sales and social security taxes of
£39.8m (2016: £45.4m) for the Group and of £0.1m (2016: £0.9m) for the Company. All amounts are non-interest bearing and are due within one year.
Notes to the financial statementsContinued
183182
Derwent London plc Report & Accounts 2017 Derwent London plc Report & Accounts 2017

Deferred tax assets have been recognised in respect of all tax losses and other temporary differences where the Directors believe it is probable that these assets will be recovered.
27 Share capitalThe movement in the number of 5p ordinary shares in issue is shown in the table below:
Number of shares in issue Number
At 1 January 2016 111,172,101Issued as a result of scrip dividends 33,884Issued as a result of awards vesting under the Group’s Performance Share Plan 134,177Issued as a result of the exercise of share options1 49,675At 31 December 2016 111,389,837Issued as a result of awards vesting under the Group’s Performance Share Plan 51,824Issued as a result of the exercise of share options1 33,160At 31 December 2017 111,474,8211 Proceeds from these issues were £0.8m (2016: £1.0m).
The number of outstanding share options and other share awards granted are disclosed in the report of the Remuneration Committee and note 13.
28 ReservesThe following describes the nature and purpose of each reserve within shareholders’ equity:
Reserve Description and purposeShare premium Amount subscribed for share capital in excess of nominal value less directly attributable issue costs.
Other reserves: Merger Premium on the issue of shares as equity consideration for the acquisition of London Merchant
Securities plc (LMS). Revaluation Revaluation of the owner-occupied property and the associated deferred tax. Other Equity portion of the convertible bonds for the Group and intercompany loans for the Company. Fair value of equity instruments granted but not yet exercised under share-based payments.
Retained earnings Cumulative net gains and losses recognised in the Group income statement together with other items such as dividends and share-based payments.
Other reserves Group2017
£m2016
£m
Company2017
£m2016
£mMerger reserve 910.5 910.5 910.5 910.5Revaluation reserve 13.8 19.6 – –Equity portion of the convertible bonds 12.3 12.3 – –Equity portion of long-term intercompany loan – – 12.3 12.3Fair value of equity instruments under share-based payments 6.3 8.0 6.3 8.0
942.9 950.4 929.1 930.8
29 Profit for the year attributable to members of Derwent London plcProfit for the year in the Group income statement includes a profit of £125.7m (2016: loss of £35.1m) generated by the Company. The Company has taken advantage of the exemption allowed under section 408 of the Companies Act 2006 and has not presented its own income statement in these financial statements.
25 Cash flow informationNet debt reconciliation
2016£m
Cash flows£m
Non-cash changes
2017£m
Amortisation of issue and
arrangement costs
£m
Fair value adjustments
£mDisposals
£mGroupLong-term borrowings 898.6 (170.8) 2.0 1.0 – 730.8Leasehold liabilities 23.9 – – – (9.8) 14.1Total liabilities from financing activities 922.5 (170.8) 2.0 1.0 (9.8) 744.9
Cash and cash equivalents (17.7) (69.3) – – – (87.0)Net debt 904.8 (240.1) 2.0 1.0 (9.8) 657.9
CompanyLong-term borrowings 682.7 (170.4) 1.9 2.1 – 516.3Total liabilities from financing activities 682.7 (170.4) 1.9 2.1 – 516.3
Cash and cash equivalents (6.9) (78.9) – – – (85.8)Net debt 675.8 (249.3) 1.9 2.1 – 430.5
26 Deferred taxRevaluation
surplus£m
Other£m
Total£m
GroupAt 1 January 2017 5.3 (2.2) 3.1Credited to the income statement (1.0) (0.2) (1.2)Change in tax rates in the income statement (0.5) 0.2 (0.3)Charged to other comprehensive income 0.8 – 0.8Change in tax rates in other comprehensive income (0.1) – (0.1)At 31 December 2017 4.5 (2.2) 2.3
At 1 January 2016 8.7 (3.2) 5.5(Credited)/charged to the income statement (1.8) 0.9 (0.9)Change in tax rates in the income statement (0.3) 0.1 (0.2)Credited to other comprehensive income (1.2) – (1.2)Change in tax rates in other comprehensive income (0.1) – (0.1)At 31 December 2016 5.3 (2.2) 3.1
CompanyAt 1 January 2017 – (2.2) (2.2)Credited to the income statement – (0.2) (0.2)Change in tax rates in the income statement – 0.3 0.3At 31 December 2017 – (2.1) (2.1)
At 1 January 2016 – (3.2) (3.2)Charged to the income statement – 0.9 0.9Change in tax rates in the income statement – 0.1 0.1At 31 December 2016 – (2.2) (2.2)
Deferred tax on the revaluation surplus is calculated on the basis of the chargeable gains that would crystallise on the sale of the property portfolio at each balance sheet date. The calculation takes account of any available indexation on the historic cost of the properties. Due to the Group’s REIT status, deferred tax is only provided at each balance sheet date on properties outside the REIT regime.
Notes to the financial statementsContinued
185184
Derwent London plc Report & Accounts 2017 Derwent London plc Report & Accounts 2017
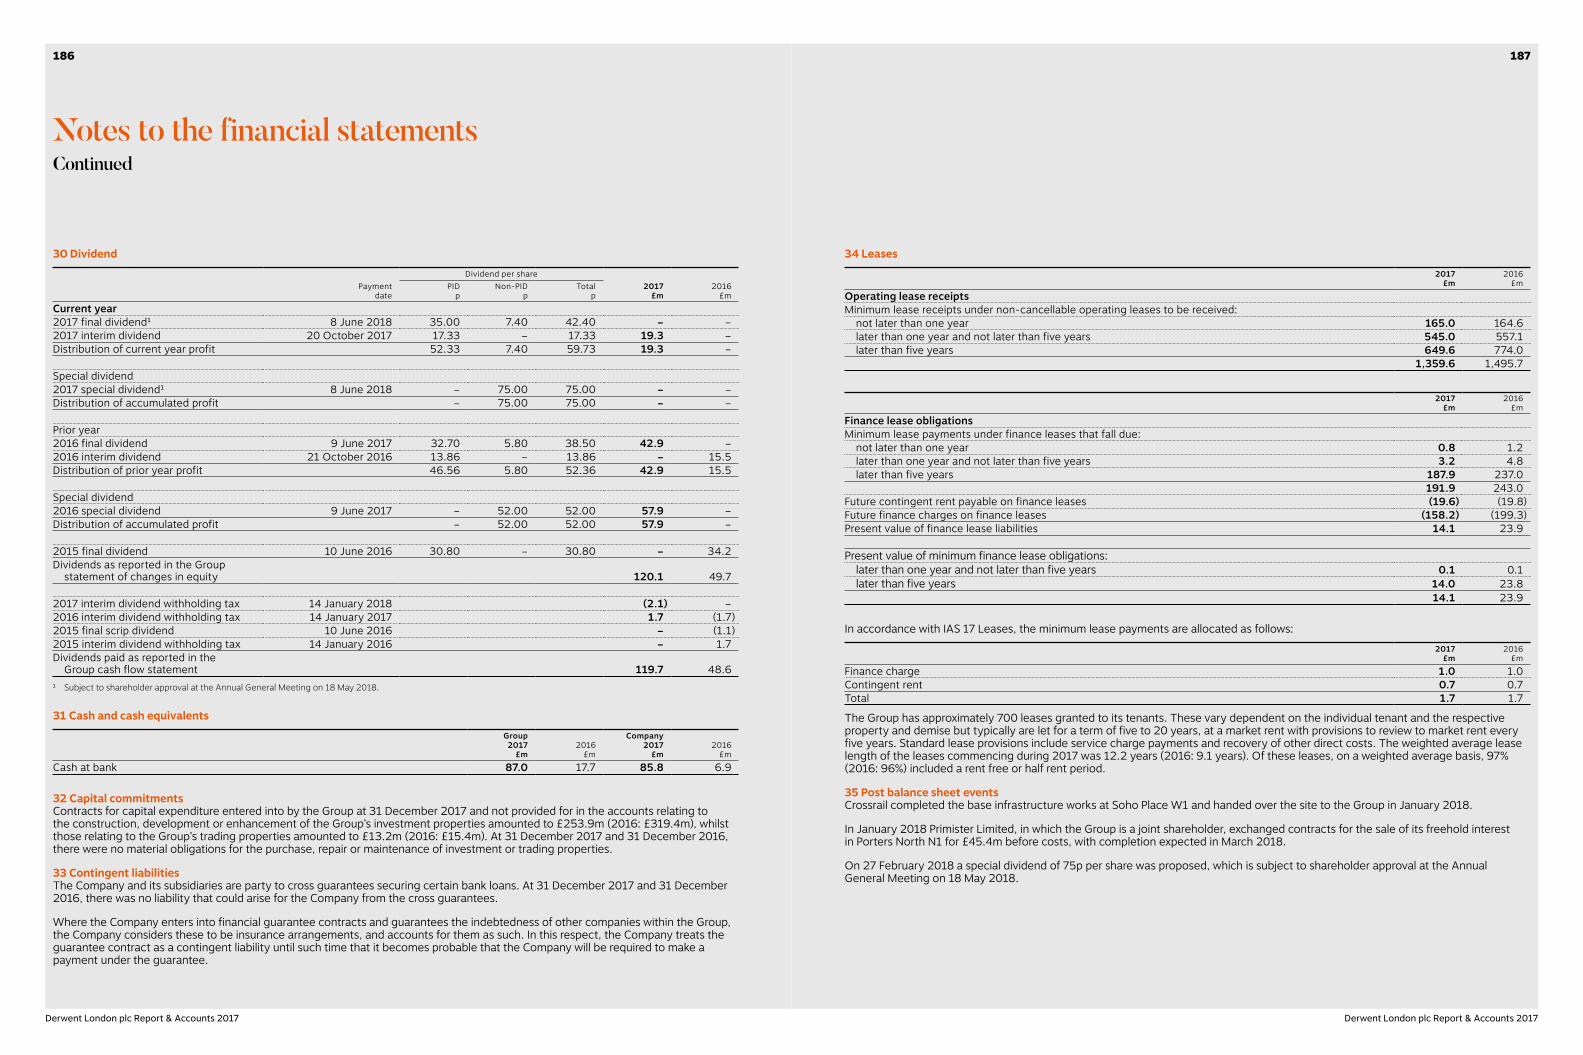
34 Leases2017
£m2016
£mOperating lease receiptsMinimum lease receipts under non-cancellable operating leases to be received: not later than one year 165.0 164.6 later than one year and not later than five years 545.0 557.1 later than five years 649.6 774.0
1,359.6 1,495.7
2017£m
2016£m
Finance lease obligationsMinimum lease payments under finance leases that fall due: not later than one year 0.8 1.2 later than one year and not later than five years 3.2 4.8 later than five years 187.9 237.0
191.9 243.0Future contingent rent payable on finance leases (19.6) (19.8)Future finance charges on finance leases (158.2) (199.3)Present value of finance lease liabilities 14.1 23.9
Present value of minimum finance lease obligations: later than one year and not later than five years 0.1 0.1 later than five years 14.0 23.8
14.1 23.9
In accordance with IAS 17 Leases, the minimum lease payments are allocated as follows: 2017
£m2016
£mFinance charge 1.0 1.0Contingent rent 0.7 0.7Total 1.7 1.7
The Group has approximately 700 leases granted to its tenants. These vary dependent on the individual tenant and the respective property and demise but typically are let for a term of five to 20 years, at a market rent with provisions to review to market rent every five years. Standard lease provisions include service charge payments and recovery of other direct costs. The weighted average lease length of the leases commencing during 2017 was 12.2 years (2016: 9.1 years). Of these leases, on a weighted average basis, 97% (2016: 96%) included a rent free or half rent period.
35 Post balance sheet eventsCrossrail completed the base infrastructure works at Soho Place W1 and handed over the site to the Group in January 2018.
In January 2018 Primister Limited, in which the Group is a joint shareholder, exchanged contracts for the sale of its freehold interest in Porters North N1 for £45.4m before costs, with completion expected in March 2018.
On 27 February 2018 a special dividend of 75p per share was proposed, which is subject to shareholder approval at the Annual General Meeting on 18 May 2018.
30 Dividend
Paymentdate
Dividend per share2017
£m2016
£mPID
pNon-PID
pTotal
pCurrent year2017 final dividend1 8 June 2018 35.00 7.40 42.40 – –2017 interim dividend 20 October 2017 17.33 – 17.33 19.3 –Distribution of current year profit 52.33 7.40 59.73 19.3 –
Special dividend2017 special dividend1 8 June 2018 – 75.00 75.00 – –Distribution of accumulated profit – 75.00 75.00 – –
Prior year2016 final dividend 9 June 2017 32.70 5.80 38.50 42.9 –2016 interim dividend 21 October 2016 13.86 – 13.86 – 15.5Distribution of prior year profit 46.56 5.80 52.36 42.9 15.5
Special dividend2016 special dividend 9 June 2017 – 52.00 52.00 57.9 –Distribution of accumulated profit – 52.00 52.00 57.9 –
2015 final dividend 10 June 2016 30.80 – 30.80 – 34.2Dividends as reported in the Group statement of changes in equity 120.1 49.7
2017 interim dividend withholding tax 14 January 2018 (2.1) –2016 interim dividend withholding tax 14 January 2017 1.7 (1.7)2015 final scrip dividend 10 June 2016 – (1.1)2015 interim dividend withholding tax 14 January 2016 – 1.7Dividends paid as reported in the Group cash flow statement 119.7 48.61 Subject to shareholder approval at the Annual General Meeting on 18 May 2018.
31 Cash and cash equivalents
Group2017
£m2016
£m
Company2017
£m2016
£mCash at bank 87.0 17.7 85.8 6.9
32 Capital commitmentsContracts for capital expenditure entered into by the Group at 31 December 2017 and not provided for in the accounts relating to the construction, development or enhancement of the Group’s investment properties amounted to £253.9m (2016: £319.4m), whilst those relating to the Group’s trading properties amounted to £13.2m (2016: £15.4m). At 31 December 2017 and 31 December 2016, there were no material obligations for the purchase, repair or maintenance of investment or trading properties.
33 Contingent liabilitiesThe Company and its subsidiaries are party to cross guarantees securing certain bank loans. At 31 December 2017 and 31 December 2016, there was no liability that could arise for the Company from the cross guarantees.
Where the Company enters into financial guarantee contracts and guarantees the indebtedness of other companies within the Group, the Company considers these to be insurance arrangements, and accounts for them as such. In this respect, the Company treats the guarantee contract as a contingent liability until such time that it becomes probable that the Company will be required to make a payment under the guarantee.
Notes to the financial statementsContinued
187186
Derwent London plc Report & Accounts 2017 Derwent London plc Report & Accounts 2017
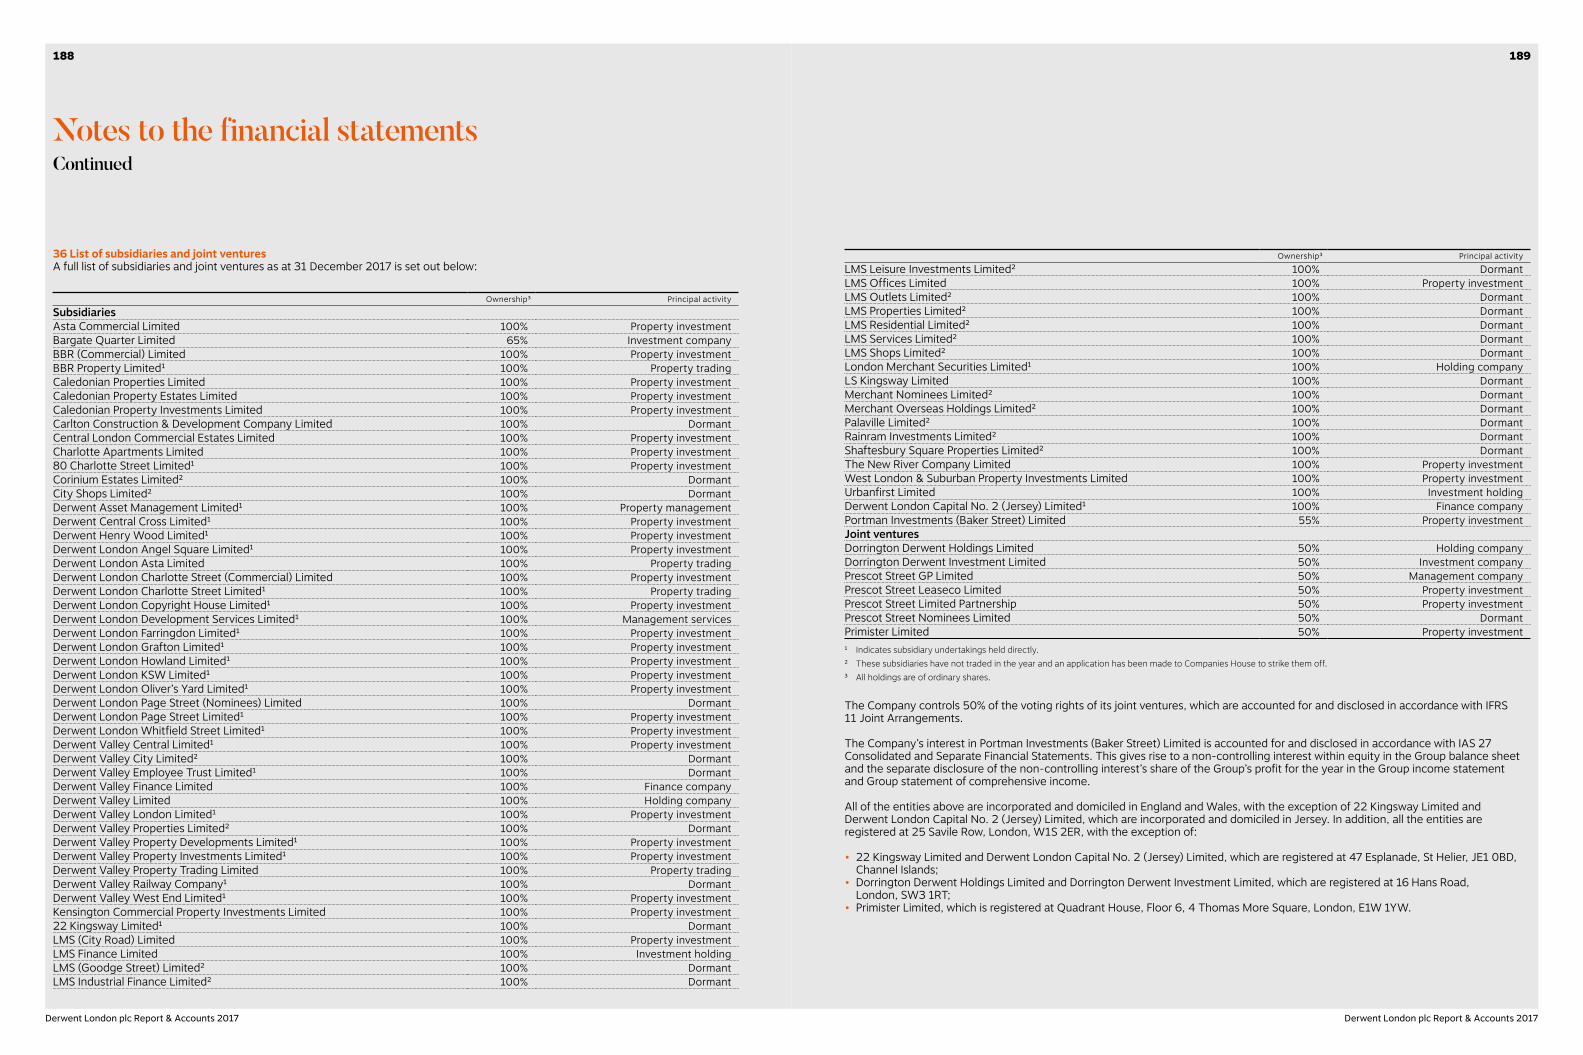
Ownership3 Principal activity
LMS Leisure Investments Limited2 100% DormantLMS Offices Limited 100% Property investmentLMS Outlets Limited2 100% DormantLMS Properties Limited2 100% DormantLMS Residential Limited2 100% DormantLMS Services Limited2 100% DormantLMS Shops Limited2 100% DormantLondon Merchant Securities Limited1 100% Holding companyLS Kingsway Limited 100% DormantMerchant Nominees Limited2 100% DormantMerchant Overseas Holdings Limited2 100% DormantPalaville Limited2 100% DormantRainram Investments Limited2 100% DormantShaftesbury Square Properties Limited2 100% DormantThe New River Company Limited 100% Property investmentWest London & Suburban Property Investments Limited 100% Property investmentUrbanfirst Limited 100% Investment holdingDerwent London Capital No. 2 (Jersey) Limited1 100% Finance companyPortman Investments (Baker Street) Limited 55% Property investmentJoint venturesDorrington Derwent Holdings Limited 50% Holding companyDorrington Derwent Investment Limited 50% Investment companyPrescot Street GP Limited 50% Management companyPrescot Street Leaseco Limited 50% Property investmentPrescot Street Limited Partnership 50% Property investmentPrescot Street Nominees Limited 50% DormantPrimister Limited 50% Property investment1 Indicates subsidiary undertakings held directly. 2 These subsidiaries have not traded in the year and an application has been made to Companies House to strike them off.3 All holdings are of ordinary shares.
The Company controls 50% of the voting rights of its joint ventures, which are accounted for and disclosed in accordance with IFRS 11 Joint Arrangements.
The Company’s interest in Portman Investments (Baker Street) Limited is accounted for and disclosed in accordance with IAS 27 Consolidated and Separate Financial Statements. This gives rise to a non-controlling interest within equity in the Group balance sheet and the separate disclosure of the non-controlling interest’s share of the Group’s profit for the year in the Group income statement and Group statement of comprehensive income. All of the entities above are incorporated and domiciled in England and Wales, with the exception of 22 Kingsway Limited and Derwent London Capital No. 2 (Jersey) Limited, which are incorporated and domiciled in Jersey. In addition, all the entities are registered at 25 Savile Row, London, W1S 2ER, with the exception of:
• 22 Kingsway Limited and Derwent London Capital No. 2 (Jersey) Limited, which are registered at 47 Esplanade, St Helier, JE1 0BD, Channel Islands;
• Dorrington Derwent Holdings Limited and Dorrington Derwent Investment Limited, which are registered at 16 Hans Road, London, SW3 1RT;
• Primister Limited, which is registered at Quadrant House, Floor 6, 4 Thomas More Square, London, E1W 1YW.
36 List of subsidiaries and joint venturesA full list of subsidiaries and joint ventures as at 31 December 2017 is set out below:
Ownership3 Principal activity
SubsidiariesAsta Commercial Limited 100% Property investmentBargate Quarter Limited 65% Investment companyBBR (Commercial) Limited 100% Property investmentBBR Property Limited1 100% Property tradingCaledonian Properties Limited 100% Property investmentCaledonian Property Estates Limited 100% Property investmentCaledonian Property Investments Limited 100% Property investmentCarlton Construction & Development Company Limited 100% DormantCentral London Commercial Estates Limited 100% Property investmentCharlotte Apartments Limited 100% Property investment80 Charlotte Street Limited1 100% Property investmentCorinium Estates Limited2 100% DormantCity Shops Limited2 100% DormantDerwent Asset Management Limited1 100% Property managementDerwent Central Cross Limited1 100% Property investmentDerwent Henry Wood Limited1 100% Property investmentDerwent London Angel Square Limited1 100% Property investmentDerwent London Asta Limited 100% Property tradingDerwent London Charlotte Street (Commercial) Limited 100% Property investmentDerwent London Charlotte Street Limited1 100% Property tradingDerwent London Copyright House Limited1 100% Property investmentDerwent London Development Services Limited1 100% Management servicesDerwent London Farringdon Limited1 100% Property investmentDerwent London Grafton Limited1 100% Property investmentDerwent London Howland Limited1 100% Property investmentDerwent London KSW Limited1 100% Property investmentDerwent London Oliver’s Yard Limited1 100% Property investmentDerwent London Page Street (Nominees) Limited 100% DormantDerwent London Page Street Limited1 100% Property investmentDerwent London Whitfield Street Limited1 100% Property investmentDerwent Valley Central Limited1 100% Property investmentDerwent Valley City Limited2 100% DormantDerwent Valley Employee Trust Limited1 100% DormantDerwent Valley Finance Limited 100% Finance companyDerwent Valley Limited 100% Holding companyDerwent Valley London Limited1 100% Property investmentDerwent Valley Properties Limited2 100% DormantDerwent Valley Property Developments Limited1 100% Property investmentDerwent Valley Property Investments Limited1 100% Property investmentDerwent Valley Property Trading Limited 100% Property tradingDerwent Valley Railway Company1 100% DormantDerwent Valley West End Limited1 100% Property investmentKensington Commercial Property Investments Limited 100% Property investment22 Kingsway Limited1 100% DormantLMS (City Road) Limited 100% Property investmentLMS Finance Limited 100% Investment holdingLMS (Goodge Street) Limited2 100% DormantLMS Industrial Finance Limited2 100% Dormant
Notes to the financial statementsContinued
189188
Derwent London plc Report & Accounts 2017 Derwent London plc Report & Accounts 2017
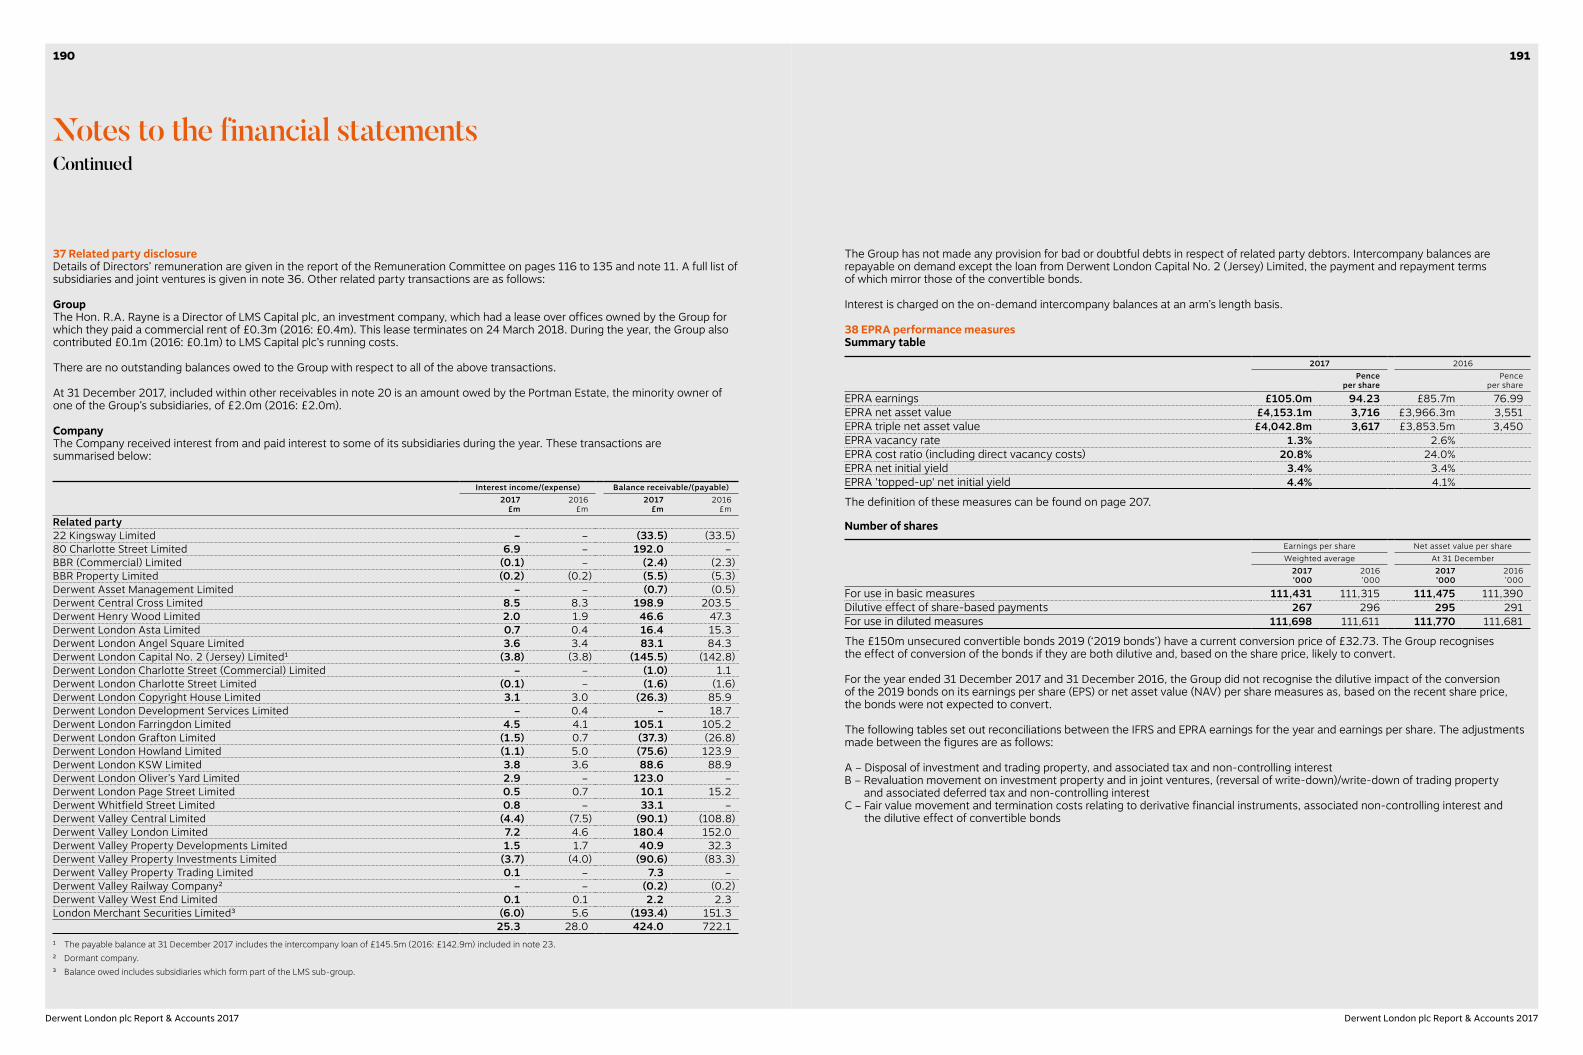
The Group has not made any provision for bad or doubtful debts in respect of related party debtors. Intercompany balances are repayable on demand except the loan from Derwent London Capital No. 2 (Jersey) Limited, the payment and repayment terms of which mirror those of the convertible bonds.
Interest is charged on the on-demand intercompany balances at an arm’s length basis.
38 EPRA performance measuresSummary table
2017 2016Pence
per sharePence
per share
EPRA earnings £105.0m 94.23 £85.7m 76.99EPRA net asset value £4,153.1m 3,716 £3,966.3m 3,551EPRA triple net asset value £4,042.8m 3,617 £3,853.5m 3,450EPRA vacancy rate 1.3% 2.6%EPRA cost ratio (including direct vacancy costs) 20.8% 24.0%EPRA net initial yield 3.4% 3.4%EPRA 'topped-up' net initial yield 4.4% 4.1%
The definition of these measures can be found on page 207.
Number of sharesEarnings per share Net asset value per shareWeighted average At 31 December
2017’000
2016’000
2017’000
2016’000
For use in basic measures 111,431 111,315 111,475 111,390Dilutive effect of share-based payments 267 296 295 291For use in diluted measures 111,698 111,611 111,770 111,681
The £150m unsecured convertible bonds 2019 (‘2019 bonds’) have a current conversion price of £32.73. The Group recognises the effect of conversion of the bonds if they are both dilutive and, based on the share price, likely to convert.
For the year ended 31 December 2017 and 31 December 2016, the Group did not recognise the dilutive impact of the conversion of the 2019 bonds on its earnings per share (EPS) or net asset value (NAV) per share measures as, based on the recent share price, the bonds were not expected to convert.
The following tables set out reconciliations between the IFRS and EPRA earnings for the year and earnings per share. The adjustments made between the figures are as follows:
A – Disposal of investment and trading property, and associated tax and non-controlling interestB – Revaluation movement on investment property and in joint ventures, (reversal of write-down)/write-down of trading property
and associated deferred tax and non-controlling interestC – Fair value movement and termination costs relating to derivative financial instruments, associated non-controlling interest and
the dilutive effect of convertible bonds
37 Related party disclosureDetails of Directors’ remuneration are given in the report of the Remuneration Committee on pages 116 to 135 and note 11. A full list of subsidiaries and joint ventures is given in note 36. Other related party transactions are as follows:
GroupThe Hon. R.A. Rayne is a Director of LMS Capital plc, an investment company, which had a lease over offices owned by the Group for which they paid a commercial rent of £0.3m (2016: £0.4m). This lease terminates on 24 March 2018. During the year, the Group also contributed £0.1m (2016: £0.1m) to LMS Capital plc’s running costs.
There are no outstanding balances owed to the Group with respect to all of the above transactions.
At 31 December 2017, included within other receivables in note 20 is an amount owed by the Portman Estate, the minority owner of one of the Group’s subsidiaries, of £2.0m (2016: £2.0m).
Company The Company received interest from and paid interest to some of its subsidiaries during the year. These transactions are summarised below:
Interest income/(expense) Balance receivable/(payable)2017
£m2016
£m2017
£m2016
£mRelated party22 Kingsway Limited – – (33.5) (33.5)80 Charlotte Street Limited 6.9 – 192.0 –BBR (Commercial) Limited (0.1) – (2.4) (2.3)BBR Property Limited (0.2) (0.2) (5.5) (5.3)Derwent Asset Management Limited – – (0.7) (0.5)Derwent Central Cross Limited 8.5 8.3 198.9 203.5Derwent Henry Wood Limited 2.0 1.9 46.6 47.3Derwent London Asta Limited 0.7 0.4 16.4 15.3Derwent London Angel Square Limited 3.6 3.4 83.1 84.3Derwent London Capital No. 2 (Jersey) Limited1 (3.8) (3.8) (145.5) (142.8)Derwent London Charlotte Street (Commercial) Limited – – (1.0) 1.1Derwent London Charlotte Street Limited (0.1) – (1.6) (1.6)Derwent London Copyright House Limited 3.1 3.0 (26.3) 85.9Derwent London Development Services Limited – 0.4 – 18.7Derwent London Farringdon Limited 4.5 4.1 105.1 105.2Derwent London Grafton Limited (1.5) 0.7 (37.3) (26.8)Derwent London Howland Limited (1.1) 5.0 (75.6) 123.9Derwent London KSW Limited 3.8 3.6 88.6 88.9Derwent London Oliver’s Yard Limited 2.9 – 123.0 –Derwent London Page Street Limited 0.5 0.7 10.1 15.2Derwent Whitfield Street Limited 0.8 – 33.1 –Derwent Valley Central Limited (4.4) (7.5) (90.1) (108.8)Derwent Valley London Limited 7.2 4.6 180.4 152.0Derwent Valley Property Developments Limited 1.5 1.7 40.9 32.3Derwent Valley Property Investments Limited (3.7) (4.0) (90.6) (83.3)Derwent Valley Property Trading Limited 0.1 – 7.3 –Derwent Valley Railway Company2 – – (0.2) (0.2)Derwent Valley West End Limited 0.1 0.1 2.2 2.3London Merchant Securities Limited3 (6.0) 5.6 (193.4) 151.3
25.3 28.0 424.0 722.11 The payable balance at 31 December 2017 includes the intercompany loan of £145.5m (2016: £142.9m) included in note 23.2 Dormant company.3 Balance owed includes subsidiaries which form part of the LMS sub-group.
Notes to the financial statementsContinued
191190
Derwent London plc Report & Accounts 2017 Derwent London plc Report & Accounts 2017

Net asset value and net asset value per share
£mUndiluted
pDiluted
pAt 31 December 2017Net assets attributable to equity shareholders 4,128.3 3,703 3,694Adjustment for: Revaluation of trading properties net of tax 1.0 Deferred tax on revaluation surplus 4.5 Fair value of derivative financial instruments 7.9 Fair value adjustment to secured bonds 12.9 Non-controlling interest in respect of the above (1.5)EPRA net asset value 4,153.1 3,726 3,716Adjustment for: Mark-to-market of secured bonds 2026 (50.6) Mark-to-market of secured loan 2024 (4.9) Mark-to-market of unsecured private placement notes 2029 and 2034 (21.1) Mark-to-market of unsecured private placement notes 2028 and 2031 (2.4) Mark-to-market of 1.125% unsecured convertible bonds 2019 (11.8) Deferred tax on revaluation surplus (4.5) Fair value of derivative financial instruments (7.9) Unamortised issue and arrangement costs (8.6) Non-controlling interest in respect of the above 1.5EPRA triple net asset value 4,042.8 3,627 3,617
At 31 December 2016Net assets attributable to equity shareholders 3,932.3 3,530 3,521Adjustment for: Deferred tax on revaluation surplus 5.3 Fair value of derivative financial instruments 17.3 Fair value adjustment to secured bonds 14.0 Non-controlling interest in respect of the above (2.6)EPRA net asset value 3,966.3 3,561 3,551Adjustment for: Mark-to-market of secured bonds 2026 (50.6) Mark-to-market of secured loan 2024 (5.2) Mark-to-market of unsecured private placement notes 2029 and 2034 (17.3) Mark-to-market of unsecured private placement notes 2028 and 2031 (1.4) Mark-to-market of 1.125% unsecured convertible bonds 2019 (8.0) Deferred tax on revaluation surplus (5.3) Fair value of derivative financial instruments (17.3) Unamortised issue and arrangement costs (10.3) Non-controlling interest in respect of the above 2.6EPRA triple net asset value 3,853.5 3,459 3,450
38 EPRA performance measures (continued)Earnings and earnings per share
IFRS£m
Adjustments EPRA basis
£mA
£mB
£mC
£mYear ended 31 December 2017Net property and other income 164.8 – (1.0) – 163.8Total administrative expenses (28.2) – – – (28.2)Revaluation surplus 147.9 – (147.9) – –Profit on disposal of investment property 50.3 (50.3) – – –Net finance costs (27.1) – – – (27.1)Movement in fair value of derivative financial instruments 9.4 – – (9.4) –Financial derivative termination costs (7.3) – – 7.3 –Share of results of joint ventures 5.0 – (3.9) – 1.1Profit before tax 314.8 (50.3) (152.8) (2.1) 109.6Tax charge (1.8) 1.1 (1.5) – (2.2)Profit for the year 313.0 (49.2) (154.3) (2.1) 107.4Non-controlling interest 1.0 – (3.8) 0.4 (2.4)Earnings attributable to equity shareholders 314.0 (49.2) (158.1) (1.7) 105.0
Earnings per share 281.79p 94.23p
Diluted earnings per share 281.12p 94.00p
Year ended 31 December 2016Net property and other income 149.2 (1.9) 1.6 – 148.9Total administrative expenses (30.9) – – – (30.9)Revaluation deficit (37.1) – 37.1 – –Profit on disposal of investment property 7.5 (7.5) – – –Net finance costs (27.8) – – – (27.8)Movement in fair value of derivative financial instruments 0.3 – – (0.3) –Financial derivative termination costs (9.0) – – 9.0 –Share of results of joint ventures 2.3 – (1.8) – 0.5Profit before tax 54.5 (9.4) 36.9 8.7 90.7Tax charge (0.9) 0.5 (2.2) – (2.6)Profit for the year 53.6 (8.9) 34.7 8.7 88.1Non-controlling interest 5.1 – (7.6) 0.1 (2.4)Earnings attributable to equity shareholders 58.7 (8.9) 27.1 8.8 85.7
Earnings per share 52.73p 76.99p
Diluted earnings per share 52.59p 76.78p
Notes to the financial statementsContinued
193192
Derwent London plc Report & Accounts 2017 Derwent London plc Report & Accounts 2017
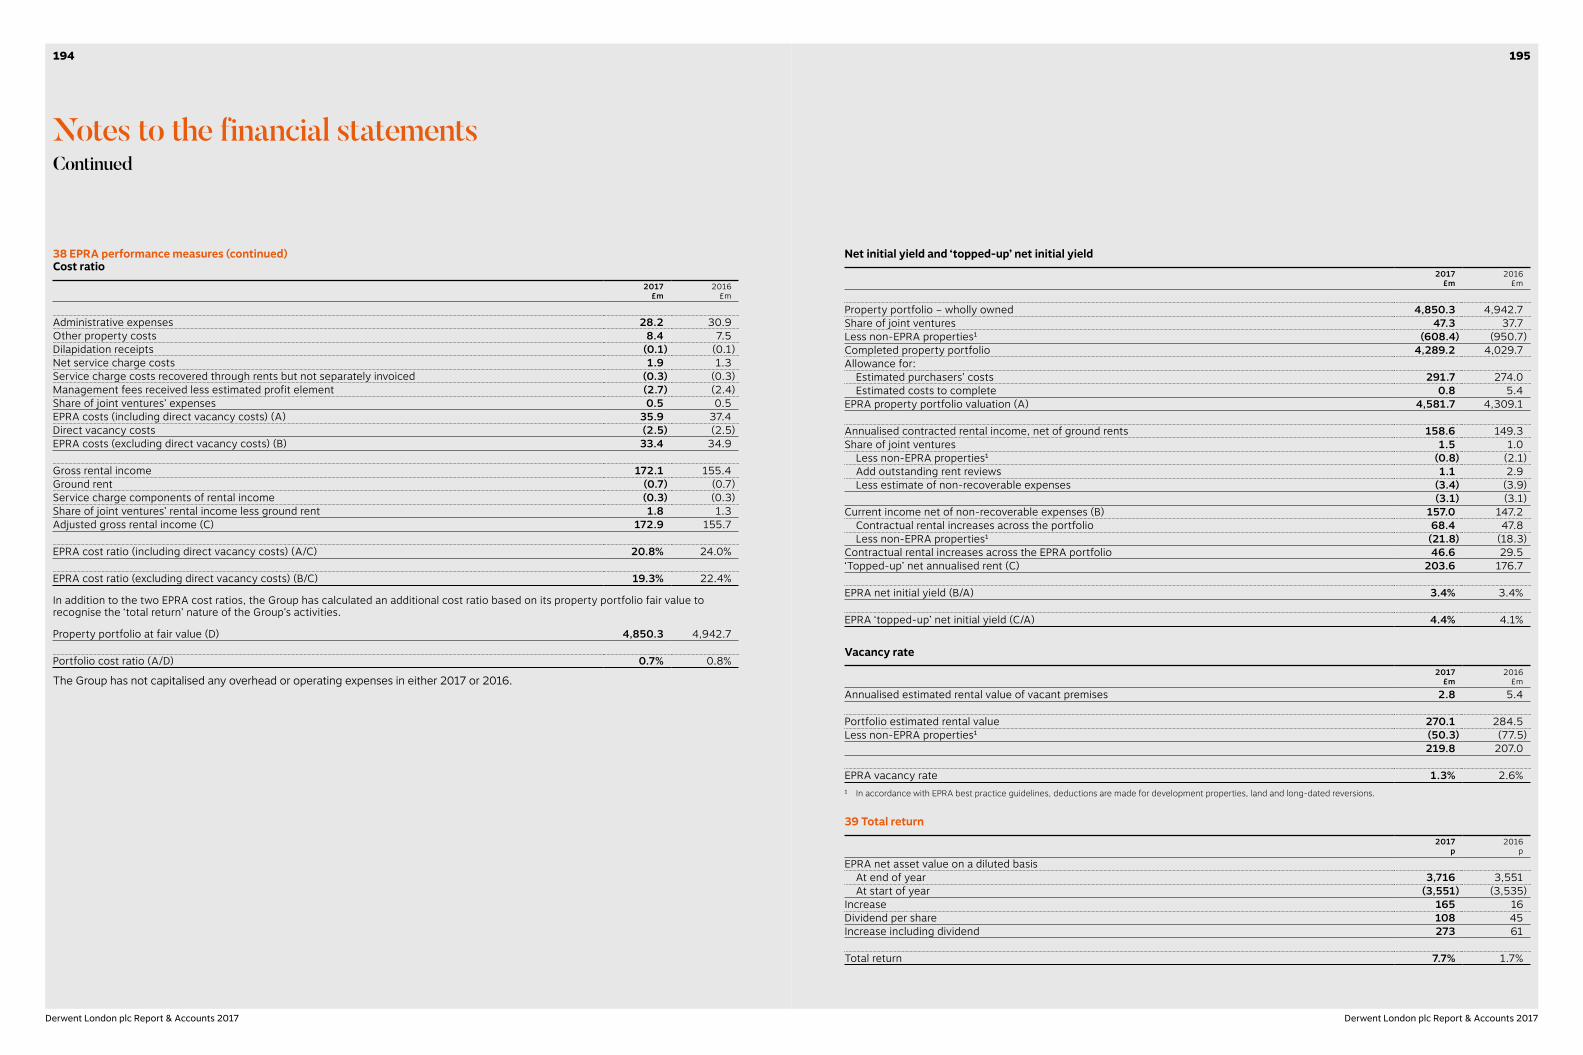
Net initial yield and ‘topped-up’ net initial yield 2017
£m2016
£m
Property portfolio – wholly owned 4,850.3 4,942.7Share of joint ventures 47.3 37.7Less non-EPRA properties1 (608.4) (950.7)Completed property portfolio 4,289.2 4,029.7Allowance for: Estimated purchasers’ costs 291.7 274.0 Estimated costs to complete 0.8 5.4EPRA property portfolio valuation (A) 4,581.7 4,309.1
Annualised contracted rental income, net of ground rents 158.6 149.3Share of joint ventures 1.5 1.0 Less non-EPRA properties1 (0.8) (2.1) Add outstanding rent reviews 1.1 2.9 Less estimate of non-recoverable expenses (3.4) (3.9)
(3.1) (3.1)Current income net of non-recoverable expenses (B) 157.0 147.2 Contractual rental increases across the portfolio 68.4 47.8 Less non-EPRA properties1 (21.8) (18.3)Contractual rental increases across the EPRA portfolio 46.6 29.5‘Topped-up’ net annualised rent (C) 203.6 176.7
EPRA net initial yield (B/A) 3.4% 3.4%
EPRA ‘topped-up’ net initial yield (C/A) 4.4% 4.1%
Vacancy rate
2017
£m2016
£mAnnualised estimated rental value of vacant premises 2.8 5.4
Portfolio estimated rental value 270.1 284.5Less non-EPRA properties1 (50.3) (77.5)
219.8 207.0
EPRA vacancy rate 1.3% 2.6%1 In accordance with EPRA best practice guidelines, deductions are made for development properties, land and long-dated reversions.
39 Total return2017
p2016
pEPRA net asset value on a diluted basis At end of year 3,716 3,551 At start of year (3,551) (3,535)Increase 165 16Dividend per share 108 45Increase including dividend 273 61
Total return 7.7% 1.7%
38 EPRA performance measures (continued)Cost ratio
2017£m
2016£m
Administrative expenses 28.2 30.9Other property costs 8.4 7.5Dilapidation receipts (0.1) (0.1)Net service charge costs 1.9 1.3Service charge costs recovered through rents but not separately invoiced (0.3) (0.3)Management fees received less estimated profit element (2.7) (2.4)Share of joint ventures’ expenses 0.5 0.5EPRA costs (including direct vacancy costs) (A) 35.9 37.4Direct vacancy costs (2.5) (2.5)EPRA costs (excluding direct vacancy costs) (B) 33.4 34.9
Gross rental income 172.1 155.4Ground rent (0.7) (0.7)Service charge components of rental income (0.3) (0.3)Share of joint ventures’ rental income less ground rent 1.8 1.3Adjusted gross rental income (C) 172.9 155.7
EPRA cost ratio (including direct vacancy costs) (A/C) 20.8% 24.0%
EPRA cost ratio (excluding direct vacancy costs) (B/C) 19.3% 22.4%
In addition to the two EPRA cost ratios, the Group has calculated an additional cost ratio based on its property portfolio fair value to recognise the ‘total return’ nature of the Group’s activities.
Property portfolio at fair value (D) 4,850.3 4,942.7
Portfolio cost ratio (A/D) 0.7% 0.8%
The Group has not capitalised any overhead or operating expenses in either 2017 or 2016.
Notes to the financial statementsContinued
195194
Derwent London plc Report & Accounts 2017 Derwent London plc Report & Accounts 2017
41 Significant accounting policiesBasis of consolidationThe Group financial statements incorporate the financial statements of Derwent London plc and all of its subsidiaries, together with the Group’s share of the results of its joint ventures.
Subsidiaries are all entities (including structured entities) over which the Group has control. The Group controls an entity when the Group is exposed to, or has rights to, variable returns from its involvement with the entity and has the ability to affect those returns through its power over the entity. Subsidiaries are fully consolidated from the date on which control is transferred to the Group. They are deconsolidated from the date that control ceases.
Joint ventures are those entities over whose activities the Group has joint control, established by contractual agreement. Interests in joint ventures are accounted for using the equity method of accounting as permitted by IFRS 11 Joint Arrangements, and following the procedures for this method set out in IAS 28 Investments in Associates and Joint Ventures. The equity method requires the Group’s share of the joint venture’s post-tax profit or loss for the year to be presented separately in the income statement and the Group’s share of the joint venture’s net assets to be presented separately in the balance sheet.
Intra-group balances and any unrealised gains and losses arising from intra-group transactions are eliminated in preparing the consolidated financial statements. Unrealised gains arising from transactions with joint ventures are eliminated to the extent of the Group’s interest in the joint venture concerned. Unrealised losses are eliminated in the same way, but only to the extent that there is no evidence of impairment.
Gross property incomeGross property income arises from two main sources:
(i) Rental income – This arises from operating leases granted to tenants. An operating lease is a lease other than a finance lease. A finance lease is one whereby substantially all the risks and rewards of ownership are passed to the lessee.
Rental income is recognised in the Group income statement on a straight-line basis over the term of the lease in accordance with
SIC 15 Operating Leases – Incentives and IAS 17 Leases. This includes the effect of lease incentives given to tenants, which are normally in the form of rent free or half rent periods or capital contributions in lieu of rent free periods, and the effect of contracted rent uplifts and payments received from tenants on the grant of leases.
For income from property leased out under a finance lease, a lease receivable asset is recognised in the balance sheet at an
amount equal to the net investment in the lease, as defined in IAS 17 Leases. Minimum lease payments receivable, again defined in IAS 17, are apportioned between finance income and the reduction of the outstanding lease receivable so as to produce a constant periodic rate of return on the remaining net investment in the lease. Contingent rents, being the difference between the rent currently receivable and the minimum lease payments when the net investment in the lease was originally calculated, are recognised in property income in the years in which they are receivable.
(ii) Surrender premiums – Payments received from tenants to surrender their lease obligations are recognised immediately in the Group income statement.
Other incomeOther income consists of commissions and fees arising from the management of the Group’s properties and is recognised in the Group income statement in accordance with the delivery of service.
40 Gearing and interest coverNAV gearing
2017
£m2016
£mNet debt 657.9 904.8
Net assets 4,193.2 3,999.4
NAV gearing 15.7% 22.6%
Loan-to-value ratio
2017
£m2016
£mNet debt 657.9 904.8Fair value adjustment of secured bonds (12.9) (14.0)Unamortised issue and arrangement costs 8.6 10.3Leasehold liabilities (14.1) (23.9)Drawn debt 639.5 877.2
Fair value of property portfolio 4,850.3 4,942.7
Loan-to-value ratio 13.2% 17.7%
Net interest cover ratio
2017
£m2016
£mNet property and other income 164.8 149.2Adjustments for: Other income (2.7) (2.4) Other property income – (0.5) Net surrender premiums received (0.1) (0.1) (Reversal of write-down)/write-down of trading property (1.0) 1.6 Profit on disposal of trading properties – (1.9) Reverse surrender premiums 0.2 0.1Adjusted net property income 161.2 146.0
Finance costs 27.1 27.827.1 27.8
Adjustments for: Other finance costs (0.1) (0.1) Amortisation of fair value adjustment to secured bonds 1.1 1.0 Amortisation of issue and arrangement costs (2.0) (2.2) Finance costs capitalised 9.4 13.0Net interest payable 35.5 39.5
Net interest cover ratio 454% 370%
Notes to the financial statementsContinued
197196
Derwent London plc Report & Accounts 2017 Derwent London plc Report & Accounts 2017
Business combinationsBusiness combinations are accounted for under the acquisition method. Any excess of the purchase price of business combinations over the fair value of the assets, liabilities and contingent liabilities acquired and resulting deferred tax thereon is recognised as goodwill. Any discount is credited to the Group income statement in the period of acquisition. Goodwill is recognised as an asset and reviewed for impairment. Any impairment is recognised immediately in the Group income statement and is not subsequently reversed. Any residual goodwill is reviewed annually for impairment.
Investment property(i) Valuation – Investment properties are those that are held either to earn rental income or for capital appreciation or both, including
those that are undergoing redevelopment. Investment properties are measured initially at cost, including related transaction costs. After initial recognition, they are carried in the Group balance sheet at fair value adjusted for the carrying value of leasehold interests and lease incentive and letting cost receivables. Fair value is the price that would be received to sell an investment property in an orderly transaction between market participants at the measurement date. The valuation is undertaken by independent valuers who hold recognised and relevant professional qualifications and have recent experience in the locations and categories of properties being valued.
Surpluses or deficits resulting from changes in the fair value of investment property are reported in the Group income statement in the year in which they arise.
(ii) Capital expenditure – Capital expenditure, being costs directly attributable to the redevelopment or refurbishment of an investment property, up to the point of it being completed for its intended use, are capitalised in the carrying value of that property. In addition, in accordance with IAS 23 Borrowing Costs, finance costs that are directly attributable to such expenditure are capitalised using the Group’s average cost of borrowings during each quarter.
(iii) Disposal – Properties are treated as disposed when the Group transfers the significant risks and rewards of ownership to the buyer. Generally this would occur on completion of contract. On disposal, any gain or loss is calculated as the difference between the net disposal proceeds and the carrying value at the last year end plus subsequent capitalised expenditure during the year. Where the net disposal proceeds have yet to be finalised at the balance sheet date, the proceeds recognised reflect the Directors’ best estimate of the amounts expected to be received. Any contingent consideration is recognised at fair value at the balance sheet date. The fair value is calculated using future discounted cash flows based on expected outcomes with estimated probabilities taking account of the risk and uncertainty of each input.
(iv) Development – When the Group begins to redevelop an existing investment property for continued use as an investment property or acquires a property with the subsequent intention of developing as an investment property, the property is classified as an investment property and is accounted for as such. When the Group begins to redevelop an existing investment property with a view to sale, the property is transferred to trading properties and held as a current asset. The property is remeasured to fair value as at the date of transfer with any gain or loss being taken to the income statement. The remeasured amount becomes the deemed cost at which the property is then carried in trading properties.
Trading propertyTrading property relate to property being developed for sale. In accordance with IAS 2 Inventories, they are held at the lower of cost and net realisable value.
41 Significant accounting policies (continued)Expenses(i) Lease payments – Where investment properties are held under operating leases, the leasehold interest is classified as if it were
held under a finance lease, which is recognised at its fair value on the balance sheet, within the investment property carrying value. Upon initial recognition, a corresponding liability is included as a finance lease liability. Minimum lease payments are apportioned between the finance charge and the reduction of the outstanding liability so as to produce a constant periodic rate of interest on the remaining finance lease liability. Contingent rents payable, being the difference between the rent currently payable and the minimum lease payments when the lease liability was originally calculated, are charged as expenses within property expenditure in the years in which they are payable.
(ii) Dilapidations – Dilapidations monies received from tenants in respect of their lease obligations are recognised immediately in the Group income statement, unless they relate to future capital expenditure. In the latter case, where the costs are considered to be recoverable they are capitalised as part of the carrying value of the property.
(iii) Reverse surrender premiums – Payments made to tenants to surrender their lease obligations are charged directly to the Group income statement unless the payment is to enable the probable redevelopment of a property. In the latter case, where the costs are considered to be recoverable, they are capitalised as part of the carrying value of the property.
(iv) Other property expenditure – Vacant property costs and other property costs are expensed in the year to which they relate, with the exception of the initial direct costs incurred in negotiating and arranging leases which are, in accordance with IAS 17 Leases, added to the carrying value of the relevant property and recognised as an expense over the lease term on the same basis as the lease income.
Employee benefits(i) Share-based remuneration
Equity settled – The Company operates a long-term incentive plan and share option scheme. The fair value of the conditional awards of shares granted under the long-term incentive plan and the options granted under the share option scheme are determined at the date of grant. This fair value is then expensed on a straight-line basis over the vesting period, based on an estimate of the number of shares that will eventually vest. At each reporting date, the non-market based performance criteria of the long-term incentive plan are reconsidered and the expense is revised as necessary. In respect of the share option scheme, the fair value of the options granted is calculated using a binomial lattice pricing model.
Under the transitional provisions of IFRS 1, no expense is recognised for options or conditional shares granted on or before
7 November 2002.
(ii) Pensions
(a) Defined contribution plans – Obligations for contributions to defined contribution pension plans are recognised as an expense in the Group income statement in the period to which they relate.
(b) Defined benefit plans – The Group’s net obligation in respect of defined benefit post-employment plans, including pension plans, is calculated separately for each plan by estimating the amount of future benefit that employees have earned in return for their service in the current and prior periods. That benefit is discounted to determine its present value, and the fair value of any plan assets is deducted. The discount rate is the yield at the balance sheet date on AA credit-rated bonds that have maturity dates approximating the terms of the Group’s obligations. The calculation is performed by a qualified actuary using the projected unit credit method. Any actuarial gain or loss in the period is recognised in full in the Group statement of comprehensive income.
Notes to the financial statementsContinued
199198
Derwent London plc Report & Accounts 2017 Derwent London plc Report & Accounts 2017
41 Significant accounting policies (continued)Property, plant and equipment(i) Owner-occupied property – Owner-occupied property is stated at its revalued amount, which is determined in the same manner
as investment property. It is depreciated over its remaining useful life (40 years) with the depreciation included in administrative expenses. On revaluation, any accumulated depreciation is eliminated against the gross carrying amount of the property concerned, and the net amount restated to the revalued amount. Subsequent depreciation charges are adjusted based on the revalued amount for each property. Any difference between the depreciation charge on the revalued amount and that which would have been charged under historic cost is transferred, net of any related deferred tax, between the revaluation reserve and retained earnings as the property is utilised. Surpluses or deficits resulting from changes in the fair value are reported in the Group statement of comprehensive income. The land element of the property is not depreciated.
(ii) Artwork – Artwork is stated at revalued amounts on the basis of open market value.
(iii) Other – Plant and equipment is depreciated at a rate of between 10% and 25% per annum which is calculated to write off the cost, less estimated residual value of the individual assets, over their expected useful lives.
InvestmentsInvestments in joint ventures, being those entities over whose activities the Group has joint control, as established by contractual agreement, are included in the Group’s balance sheet at cost together with the Group’s share of post-acquisition reserves, on a net equity basis. Investments in subsidiaries and joint ventures are included in the Company’s balance sheet at the lower of cost and recoverable amount. Any impairment is recognised immediately in the income statement.
Non-current assets held for saleNon-current assets are classified as held for sale if their carrying value will be recovered through a sale transaction rather than through continuing use. This condition is regarded as met if the sale is highly probable, the asset is available for immediate sale in its present condition, being actively marketed and management is committed to the sale which should be expected to qualify for recognition as a completed sale within one year from the date of classification.
Non-current assets, including related liabilities, classified as held for sale are measured at the lower of carrying value and fair value less costs of disposal.
Financial assets(i) Cash and cash equivalents – Cash comprises cash in hand and on-demand deposits less overdrafts. Cash equivalents comprise
short-term, highly liquid investments that are readily convertible to known amounts of cash and which are subject to an insignificant risk of changes in value.
(ii) Trade receivables – Trade receivables are recognised and carried at the original transaction value. A provision for impairment is established where there is objective evidence that the Group will not be able to collect all amounts due according to the original terms of the receivables concerned.
Financial liabilities(i) Bank loans and fixed rate loans – Bank loans and fixed rate loans are included as financial liabilities on the balance sheets at the
amounts drawn on the particular facilities. Interest payable is expensed as a finance cost in the year to which it relates.
(ii) Non-convertible bonds – These are included as a financial liability on the balance sheet net of the unamortised discount and costs on issue. The difference between this carrying value and the redemption value is recognised in the Group income statement over the life of the bond on an effective interest basis. Interest payable to bond holders is expensed in the year to which it relates.
(iii) Convertible bonds – The fair value of the liability component of a convertible bond is determined using the market interest rate for an equivalent non-convertible bond. This amount is recorded as a liability on an amortised cost basis until extinguished on conversion or maturity of the bonds. The remainder of the proceeds is allocated to the conversion option. This is recognised and included in shareholders’ equity, net of income tax effects and is not subsequently remeasured. Issue costs are apportioned between the liability and the equity components of the convertible bonds based on their carrying amounts at the date of issue. The portion relating to the equity component is charged directly against equity. The issue costs apportioned to the liability are amortised over the life of the bond. The issue costs apportioned to equity are not amortised.
(iv) Finance lease liabilities – Finance lease liabilities arise for those investment properties held under a leasehold interest and accounted for as investment property. The liability is initially calculated as the present value of the minimum lease payments, reducing in subsequent years by the apportionment of payments to the lessor, as described above under the heading for lease payments.
(v) Interest rate derivatives – The Group uses derivative financial instruments to manage the interest rate risk associated with the financing of the Group’s business. No trading in financial instruments is undertaken.
At each reporting date, these interest rate derivatives are measured at fair value, being the estimated amount that the Group would receive or pay to terminate the agreement at the balance sheet date, taking into account current interest rates and the current credit rating of the counterparties. The gain or loss at each fair value remeasurement is recognised in the Group income statement because the Group does not apply hedge accounting.
(vi) Trade payables – Trade payables are recognised and carried at the original transaction value.
Deferred taxDeferred tax is the tax expected to be payable or recoverable on differences between the carrying amounts of assets and liabilities in the financial statements and the corresponding tax bases used in the tax computations, and is accounted for using the balance sheet liability method. Deferred tax liabilities are generally recognised for all taxable temporary differences and deferred tax assets are recognised to the extent that it is probable that taxable profits will be available against which deductible temporary differences can be utilised. In respect of the deferred tax on the revaluation surplus, this is calculated on the basis of the chargeable gains that would crystallise on the sale of the investment portfolio as at the reporting date. The calculation takes account of available indexation on the historic cost of the properties.
Deferred tax is calculated at the tax rates that are expected to apply in the period, based on Acts substantially enacted at the year end, when the liability is settled or the asset is realised. Deferred tax is included in profit or loss for the period, except when it relates to items recognised in other comprehensive income or directly in equity.
Cash flowTransactions in the cash flow statement under operating, investing and financing activities have been prepared net of value added tax in order to reflect the true cash inflows and outflows of the Group.
DividendsDividends payable on the ordinary share capital are recognised in the year in which they are declared.
Foreign currency translationTransactions entered into by Group entities in currencies other than the entity’s functional currency are recorded at the exchange rate prevailing at the transaction dates. Foreign exchange gains and losses resulting from settlement of these transactions and from retranslation of monetary assets and liabilities denominated in foreign currencies are recognised in the Group income statement.
Notes to the financial statementsContinued
201200
Derwent London plc Report & Accounts 2017 Derwent London plc Report & Accounts 2017

Ten-year summary (unaudited)
2017£m
2016£m
2015£m
2014£m
2013£m
2012£m
2011£m
2010£m
2009£m
20082
£mIncome statementGross property income 172.2 156.0 152.0 138.4 131.6 124.8 125.5 119.4 123.8 119.0Net property income and other income 164.8 149.2 148.6 136.1 124.3 117.0 117.7 113.0 114.8 95.5Profit on disposal of properties and investments 50.3 7.5 40.2 30.2 53.5 10.8 36.1 0.9 (16.6) 1.2Profit before tax 314.8 54.5 779.5 753.7 467.9 228.1 233.0 352.8 (34.9) (606.5)
Earnings and dividend per shareEPRA earnings 105.0 85.7 78.7 58.6 55.1 51.3 52.3 53.6 57.6 21.9EPRA earnings per share (p) 94.23 76.99 71.34 57.08 53.87 50.36 51.59 52.89 57.14 21.74Dividend paid (p) 107.83 44.66 40.60 37.40 34.50 31.85 29.70 27.60 24.50 23.15Distribution of years’ profit (p) 59.73 52.36 43.40 39.65 36.50 33.70 31.35 29.00 27.00 24.50Special dividend (p) 75.00 52.00 – – – – – – – –
Net asset valueNet assets 4,193.2 3,999.4 3,995.4 3,075.7 2,370.5 1,918.0 1,714.5 1,494.7 1,163.9 1,215.0Net asset value per share (p) – undiluted 3,703 3,530 3,528 2,931 2,248 1,824 1,636 1,432 1,117 1,170EPRA net asset value per share (p) – diluted 3,716 3,551 3,535 2,908 2,264 1,886 1,701 1,474 1,161 1,222EPRA triple net asset value per share (p) – diluted 3,617 3,450 3,463 2,800 2,222 1,764 1,607 1,425 1,126 1,206EPRA total return (%) 7.7 1.7 23.0 30.1 21.9 12.7 17.4 29.3 (2.9) (30.6)
Property portfolioProperty portfolio at fair value 4,850.3 4,942.7 4,954.5 4,168.1 3,353.1 2,859.6 2,646.5 2,426.1 1,918.4 2,108.0Revaluation surplus/(deficit) 149.7 (42.6) 651.4 671.9 337.5 175.3 172.1 301.7 (81.1) (602.1)
Cash flow statementCash flow1 247.8 19.6 (43.6) (57.3) (65.9) 1.9 18.4 (171.6) 139.5 (83.7)Net cash from operating activities 83.5 77.7 76.0 65.6 57.5 52.5 47.2 46.5 66.4 39.3Acquisitions 8.5 18.0 246.2 92.4 130.1 99.8 91.6 148.0 10.2 31.9Capital expenditure on properties 165.0 213.5 116.4 113.2 108.4 78.6 42.6 49.5 94.6 72.9Disposals 472.9 224.7 277.2 114.4 149.7 161.0 131.5 8.5 195.5 72.6
Gearing and debtNet debt 657.9 904.8 911.7 1,013.3 949.2 874.8 864.5 887.8 720.8 865.4NAV gearing (%) 15.7 22.6 22.8 32.9 40.0 45.6 50.4 59.4 61.9 71.2Loan-to-value ratio (%) 13.2 17.7 17.8 24.0 28.0 30.0 32.0 35.7 36.4 39.7Net interest cover ratio (%) 454 370 362 286 279 263 261 286 280 2151 Cash flow is the net cash from operating and investing activities less the dividend paid. 2 2008 was the Group’s first full year following the merger of Derwent Valley Holdings plc and London Merchant Securities plc. It was also the Group’s first full year as a REIT.
A list of definitions is provided on page 207.
EPRA Measure Definition 2017 2016
EPRA Performance MeasuresEPRA earnings Earnings from operational activities £105.0m £85.7mEPRA undiluted earnings per share EPRA earnings divided by the weighted average number of
ordinary shares in issue during the financial year94.23p 76.99p
EPRA net asset value (NAV) NAV adjusted to include trading properties and other investment interests at fair value and to exclude certain items not expected to crystallise in a long-term investment property business model
£4,153.1m £3,966.3m
EPRA diluted NAV per share EPRA NAV divided by the number of ordinary shares in issue at the financial year end adjusted to include the effects of potential dilutive shares issuable under the Group’s share option schemes and the convertible bonds
3,716p 3,551p
EPRA triple NAV EPRA NAV adjusted to include the fair values of (i) financial instruments, (ii) debt and (iii) deferred taxes on revaluations, where applicable
£4,042.8m £3,853.5m
EPRA diluted triple NAV per share EPRA triple NAV divided by the number of ordinary shares in issue at the financial year end adjusted to include the effects of potential dilutive shares issuable under the Group’s share option schemes and the convertible bonds
3,617p 3,450p
EPRA vacancy rate Estimated rental value (ERV) of immediately available space divided by the ERV of the EPRA portfolio
1.3% 2.6%
EPRA cost ratio (including direct vacancy costs)
Administrative and operating costs (including costs of direct vacancy) divided by gross rental income
20.8% 24.0%
EPRA net initial yield Annualised rental income based on the cash rents passing at the balance sheet date, less non-recoverable property operating expenses, divided by the market value of the EPRA property portfolio, increased by estimated purchasers’ costs
3.4% 3.4%
EPRA ‘topped-up’ net initial yield This measure incorporates an adjustment to the EPRA NIY in respect of the expiration of rent free periods (or other unexpired lease incentives such as discounted rent periods and stepped rents)
4.4% 4.1%
EPRA Sustainability Performance MeasuresEnvironmental Sustainability Performance MeasuresTotal electricity consumption Energy use across our total managed portfolio (landlord/common
areas) – annual kWh10,107,931 10,580,966
Like-for-like total electricity consumption
Energy use across our like-for-like portfolio (landlord/common areas) – annual kWh
7,666,941 9,414,212
Total fuel consumption Energy use across our total managed portfolio (landlord/common areas); a total of gas, oil and biomass consumption – annual kWh
19,100,056 15,237,152
Like-for-like total fuel consumption Energy use across our like-for-like portfolio (landlord/common areas); a total of gas, oil and biomass consumption – annual kWh
11,199,989 14,446,722
Building energy intensity Energy use across our total managed portfolio (landlord/common areas) – kWh per m2
75.25 78.07
Total direct greenhouse gas (GHG) emissions
Total managed portfolio emissions (landlord influenced portfolio emissions); a total of Scope 1 emissions – annual metric tonnes CO2e
4,321 3,533
Total indirect greenhouse gas (GHG) emissions
Total managed portfolio emissions (landlord influenced portfolio emissions); Scope 2 energy-use – annual metric tonnes CO2e
3,538 4,342
Like-for-like total direct greenhouse gas (GHG) emissions
Like-for-like emissions (landlord influenced portfolio emissions, building related only); Scope 1 energy-use – annual metric tonnes CO2e
1,957 2,528
Like-for-like total indirect greenhouse gas (GHG) emissions
Like-for-like emissions (landlord influenced portfolio emissions, building related only); Scope 2 energy-use – annual metric tonnes CO2e
2,695 3,879
EPRA summary (unaudited)
203202
Derwent London plc Report & Accounts 2017 Derwent London plc Report & Accounts 2017
EPRA Measure Definition 2017 2016
EPRA Sustainability Performance Measures (continued)Environmental Sustainability Performance Measures (continued)Greenhouse gas (GHG) intensity from building energy consumption
Intensity (Scopes 1 & 2) per m2/£m turnover/fair market value (reported in tCO2e/m2) – kg CO2e/m2/year
0.020 0.024
Total water consumption Water use across our total managed portfolio (excluding retail consumption) – annual m3
195,660 150,413
Like-for-like total water consumption Water use across our like-for-like portfolio (excluding retail consumption) – annual m3
117,236 131,300
Building water intensity Water use across our total managed portfolio (excluding retail consumption) – m3/m2/year
0.52 0.47
Total weight of waste by disposal route Waste generated across our total managed portfolio – annual metric tonnes and proportion by disposal route
2,535 2,739
Like-for-like total weight of waste by disposal route
Waste generated across our like-for-like portfolio – annual metric tonnes and proportion by disposal route
2,004 2,514
Social Performance MeasuresEmployee gender diversity Percentage of male and female employees in the organisation’s
governance bodies (committee or boards responsible for the strategic guidance of the organisation)
See page 105
Gender pay ratio Ratio of the basic salary and/or remuneration of men to women. As we have less than 250 employees we are not obliged by the Equality Act 2010 (Gender Pay Gap Information) Regulations 2017 to disclose our gender pay gap information.
New hires and turnovers Total number and rate of new employee hires and employee turnover during the reporting period
See page 84
Employee health and safety Occupational health and safety performance with relation to direct employees
See page 81
Asset health and safety assessments Proportion of assets controlled for which health and safety impacts have been reviewed or assessed for compliance or improvement
See page 80
Asset health and safety compliance Any incidents of non-compliance with regulations and/or voluntary standards concerning the health and safety impacts of assets assessed during the reporting period
See page 81
Employees’ training and development Average hours of training that the organisation’s employees have undertaken in the reporting period
See the EPRA Reporting section in our 2017 Annual Sustainability Report
Employee performance appraisals Percentage of total employees who received regular performance and career development reviews during the reporting period
Community engagement, impact assessments and development programmes
Percentage of assets under operational control that have implemented local community engagement, impact assessments and/or development programmes
Governance Performance MeasuresComposition of the highest governance body
Number of executive Board members, number of independent/non-executive Board members, average tenure of the governance body and number of independent/non-executive Board members with competencies relating to environmental and social topics
See pages 90 and 105
Process for nominating and selecting the highest governance body
Nomination and selection process for the highest governance body and its members, and the criteria used to guide the nomination and selection process
See page 103
Process for managing conflicts of interest
Process for the highest governance body to ensure conflicts of interest are avoided and managed
See page 96
EPRA summary (unaudited) Continued
Value banding
£m
Offices (O), Retail/restaurant (R),
Residential (Re),Industrial (I),
Leisure (L)Freehold (F),
Leasehold (L)
Approximatenet area
sq ft
West End: Central (50%)Fitzrovia1 (29%)80 Charlotte Street W1 200+ O/R/Re F 380,0002
1-2 Stephen Street & Tottenham Court Walk W1 200+ O/R/L F 265,00090 Whitfield Street W1 100-200 O/R/Re F 109,400Holden House, 54-68 Oxford Street W1 100-200 O/R F 90,200Henry Wood House, 3-7 Langham Place W1 50-100 O/R/L L 79,900Middlesex House, 34-42 Cleveland Street W1 50-100 O F 65,700Network Building, 95-100 Tottenham Court Road W1 50-100 O/R F 64,20088-94 Tottenham Court Road W1 0-25 O/R F 52,400Charlotte Building, 17 Gresse Street W1 50-100 O L 47,20080-85 Tottenham Court Road W1 50-100 O/R F 44,50060 Whitfield Street W1 25-50 O F 36,20043 and 45-51 Whitfield Street W1 25-50 O F 30,900Rathbone Studios, 7-10 Rathbone Place W1 0-25 O/R/Re L 23,3001-5 Maple Place and 12-16 Fitzroy Street W1 0-25 O F 20,30076-78 Charlotte Street W1 0-25 O F 11,00050 Oxford Street W13 0-25 O/R F 6,100
Victoria (11%)Horseferry House, Horseferry Road SW1 100-200 O F 162,700Greencoat and Gordon House, Francis Street SW1 100-200 O F 139,0001 Page Street SW1 100-200 O F 127,800Premier House, 10 Greycoat Place SW1 25-50 O F 62,000Francis House, 11 Francis Street SW1 25-50 O F 57,0006-8 Greencoat Place SW1 25-50 O F 33,200
Baker Street/Marylebone (4%)19-35 Baker Street W1 50-100 O/R L 77,80088-110 George Street W1 25-50 O/R/Re L 44,80030 Gloucester Place W1 0-25 O/Re L 23,60016-20 Baker Street and 27-33 Robert Adam Street W1 0-25 O/R/Re L 21,00017-39 George Street W1 25-50 O/R/Re L 21,400
Paddington (3%)Brunel Building, 2 Canalside Walk W2 100-200 O L 243,0002
Mayfair (2%)25 Savile Row W1 50-100 O/R F 43,100
Soho/Covent Garden (1%)Bush House, South West Wing, Strand WC2 25-50 O F 107,900Soho Place W1 0-25 O/R/L L –
Principal properties (unaudited)
205204
Derwent London plc Report & Accounts 2017 Derwent London plc Report & Accounts 2017

Value banding
£m
Offices (O), Retail/restaurant (R),
Residential (Re),Industrial (I),
Leisure (L)Freehold (F),
Leasehold (L)
Approximatenet area
sq ft
West End: Borders (10%)Islington/Camden (10%)Angel Building, 407 St. John Street EC1 200+ O/R F 261,900Angel Square EC1 100-200 O F 126,2004 & 10 Pentonville Road N1 50-100 O F 53,400Porters North, 8-14 Crinan Street N14 0-25 O F 44,100401 St. John Street EC1 0-25 O F 12,300
City: Borders (38%)Clerkenwell (12%)20 Farringdon Road EC1 100-200 O/R/L L 166,30088 Rosebery Avenue EC1 50-100 O F 103,700Morelands, 5-27 Old Street EC1 50-100 O/R L 89,500The Buckley Building, 49 Clerkenwell Green EC1 50-100 O/R F 85,100Turnmill, 63 Clerkenwell Road EC1 50-100 O/R F 70,30019 Charterhouse Street EC1 50-100 O F 63,7005-8 Hardwick Street and 161 Rosebery Avenue EC1 25-50 O F 35,000151 Rosebery Avenue EC1 0-25 O F 24,0003-4 Hardwick Street EC1 0-25 O F 12,000
Old Street (11%)White Collar Factory, Old Street Yard EC1 200+ O/R/Re F 293,3001 Oliver’s Yard EC1 100-200 O/R F 185,100Monmouth House, 58-64 City Road EC1 0-25 O F 41,50019-23 Featherstone Street EC1 0-25 O F 27,500
Shoreditch/Whitechapel (9%)Tea Building, 56 Shoreditch High Street E1 200+ O/R/L F 269,600The White Chapel Building E1 100-200 O F 272,9009 and 16 Prescot Street E14 25-50 O/R F 106,900
Holborn (6%)Johnson Building, 77 Hatton Garden EC1 100-200 O/R F 156,80040 Chancery Lane WC2 100-200 O/R L 103,7006-7 St. Cross Street EC1 25-50 O F 33,800
Provincial (2%)Scotland (2%)Strathkelvin Retail Park, Bishopbriggs, Glasgow 50-100 R/L F 325,500Land, Bishopbriggs, Glasgow 25-50 – F 5,200 acres1 Includes North of Oxford Street.2 Proposed scheme area.3 Includes 36-38 and 42-44 Hanway Street W1.4 Joint venture, Derwent London has a 50% interest.( ) Percentages weighted by valuation.
Tech Belt (46%)
Principal properties (unaudited)Continued
List of definitions (unaudited)
Average ‘topped-up’ rentAnnualised rents generated by the portfolio plus rent contracted from expiry of rent free periods and uplifts agreed at the balance sheet date.
Capital returnThe annual valuation movement arising on the Group’s portfolio expressed as a percentage return on the valuation at the beginning of the year adjusted for acquisitions and capital expenditure.
Diluted figuresReported results adjusted to include the effects of potential dilutive shares issuable under the Group’s share option schemes and the convertible bonds.
Earnings/earnings per share (EPS)Earnings represent the profit or loss for the year attributable to equity shareholders and are divided by the weighted average number of ordinary shares in issue during the financial year to arrive at earnings per share.
Estimated rental value (ERV)This is the external valuers’ opinion as to the open market rent which, on the date of valuation, could reasonably be expected to be obtained on a new letting or rent review of a property.
European Public Real Estate Association (EPRA)A not-for-profit association with a membership of Europe’s leading property companies, investors and consultants which strives to establish best practices in accounting, reporting and corporate governance and to provide high-quality information to investors. EPRA published its latest Best Practices Recommendations in November 2016. This includes guidelines for the calculation of the following performance measures which the Group has adopted.
• EPRA earnings per share Earnings from operational activities
• EPRA net asset value per share NAV adjusted to include trading properties and other
investment interests at fair value and to exclude certain items not expected to crystallise in a long-term investment property business model.
• EPRA triple net asset value per share EPRA NAV adjusted to include the fair values of (i) financial
instruments, (ii) debt and (iii) deferred taxes on revaluations, where applicable.
• EPRA cost ratio (including direct vacancy costs) EPRA costs as a percentage of gross rental income less ground
rent (including share of joint venture gross rental income less ground rent). EPRA costs include administrative expenses, other property costs, net service charge costs and the share of joint ventures’ overheads and operating expenses (net of any service charge costs), adjusted for service charge costs recovered through rents and management fees.
• EPRA cost ratio (excluding direct vacancy costs) Calculated as above, but with an adjustment to exclude direct vacancy costs.
• EPRA net initial yield (NIY) Annualised rental income based on the cash rents passing
at the balance sheet date, less non-recoverable property operating expenses, divided by the market value of the EPRA property portfolio, increased by estimated purchasers’ costs.
• EPRA ‘topped-up’ net initial yield This measure incorporates an adjustment to the EPRA NIY
in respect of the expiration of rent free periods (or other unexpired lease incentives such as discounted rent periods and stepped rents).
• EPRA vacancy rate Estimated rental value (ERV) of immediately available space
divided by the ERV of the EPRA portfolio.
In addition, the Group has adopted the following recommendation for investment property reporting.
• EPRA like-for-like rental income growth The growth in rental income on properties owned throughout
the current and previous year under review. This growth rate includes revenue recognition and lease accounting adjustments but excludes properties held for development in either year and properties acquired or disposed of in either year.
Fair value adjustmentAn accounting adjustment to change the book value of an asset or liability to its market value.
Ground rentThe rent payable by the Group for its leasehold properties. Under IFRS, these leases are treated as finance leases and the cost allocated between interest payable and property outgoings.
HeadroomThis is the amount left to draw under the Group’s loan facilities (i.e. the total loan facilities less amounts already drawn).
Interest rate swapA financial instrument where two parties agree to exchange an interest rate obligation for a predetermined amount of time. These are generally used by the Group to convert floating rate debt to fixed rates.
Key Performance Indicators (KPIs)Activities and behaviours, aligned to both business objectives and individual goals, against which the performance of the Group is annually assessed. Performance measured against them is referenced in the Annual Report.
207206
Derwent London plc Report & Accounts 2017 Derwent London plc Report & Accounts 2017
Lease incentivesAny incentive offered to occupiers to enter into a lease. Typically the incentive will be an initial rent free or half rent period, stepped rents, or a cash contribution to fit-out or similar costs.
Loan-to-value ratio (LTV)Drawn debt net of cash divided by the fair value of the property portfolio. Drawn debt is equal to drawn facilities less cash and the unamortised equity element of the convertible bonds.
Mark-to-marketThe difference between the book value of an asset or liability and its market value.
MSCI Inc. (MSCI IPD) MSCI Inc. is a company that produces independent benchmarks of property returns. The Group measures its performance against both the Central London Offices Index (including Inner London) and the UK All Property Index.
NAV gearingNet debt divided by net assets.
Net assets per share or net asset value (NAV)Equity shareholders’ funds divided by the number of ordinary shares in issue at the balance sheet date.
Net debtBorrowings plus bank overdraft less cash and cash equivalents.
Net interest cover ratioNet property income, excluding all non-core items divided by interest payable on borrowings and non-utilisation fees.
Property income distribution (PID)Dividends from profits of the Group’s tax-exempt property rental business under the REIT regulations.
Non-PIDDividends from profits of the Group’s taxable residual business.
Real Estate Investment Trust (REIT)The UK Real Estate Investment Trust (‘REIT’) regime was launched on 1 January 2007. On 1 July 2007, Derwent London plc elected to convert to REIT status.
The REIT legislation was introduced to provide a structure which closely mirrors the tax outcomes of direct ownership in property and removes tax inequalities between different real estate investors. It provides a liquid and publicly available vehicle which opens the property market to a wide range of investors.
A REIT is exempt from corporation tax on qualifying income and gains of its property rental business providing various conditions are met. It remains subject to corporation tax on non-exempt income and gains e.g. interest income, trading activity and development fees.
REITs must distribute at least 90% of the Group’s income profits from its tax exempt property rental business, by way of dividend, known as a property income distribution. These distributions can be subject to withholding tax at 20%.
If the Group distributes profits from the non-tax exempt business, the distribution will be taxed as an ordinary dividend in the hands of the investors.
Rent reviewsRent reviews take place at intervals agreed in the lease (typically every five years) and their purpose is usually to adjust the rent to the current market level at the review date. For upwards only rent reviews, the rent will either remain at the same level or increase (if market rents are higher) at the review date.
ReversionThe reversion is the amount by which ERV is higher than the rent roll of a property or portfolio. The reversion is derived from contractual rental increases, rent reviews, lease renewals and the letting of space that is vacant and available to occupy or under development or refurbishment.
Scrip dividendDerwent London plc sometimes offers its shareholders the opportunity to receive dividends in the form of shares instead of cash. This is known as a scrip dividend.
Total property return (TPR)Total property return is a performance measure calculated by MSCI IPD and defined in the MSCI Global Methodology Standards for Real Estate Investment as ‘the percentage value change plus net income accrual, relative to the capital employed.’
Total returnThe movement in EPRA adjusted net asset value per share on a diluted basis between the beginning and the end of each financial year plus the dividend per share paid during the year expressed as a percentage of the EPRA net asset value per share on a diluted basis at the beginning of the year.
Total shareholder return (TSR)The growth in the ordinary share price as quoted on the London Stock Exchange plus dividends per share received for the year, expressed as a percentage of the share price at the beginning of the year.
Underlying portfolioProperties that have been held for the whole of the year (i.e. excluding any acquisitions or disposals made during the year).
Underlying valuation increaseThe valuation increase on the underlying portfolio.
Yields• Net initial yield Annualised rental income based on the cash rents passing
at the balance sheet date, less non-recoverable property operating expenses, divided by the market value of the property, increased by estimated purchasers' costs.
• Reversionary yield The anticipated yield to which the net initial yield will rise,
once the rent reaches the estimated rental values.• True equivalent yield The constant capitalisation rate which, if applied to all cash
flows from the portfolio, including current rent, reversions to valuers’ estimated rental value and such items as voids and expenditures, equates to the valuation having taken into account notional purchasers’ costs. Rent is assumed to be received quarterly in advance.
• Yield shift A movement in the yield of a property asset, or like-for-like
portfolio, over a given year. Yield compression is a commonly-used term for a reduction in yields.
Sustainability and corporate responsibilityBuilding Research Establishment Environmental Assessment Method (BREEAM)An environmental impact assessment method for commercial buildings. Performance is measured across a series of ratings; ‘Pass’, ‘Good’, ‘Very Good’, ‘Excellent’ and ‘Outstanding’.
Carbon emissions Scopes 1, 2 and 3Scope 1 – direct emissions;Scope 2 – indirect emissions; andScope 3 – other indirect emissions.
CDPThe CDP is an organisation which works with shareholders and listed companies to facilitate the disclosure and reporting of climate change data and information.
Department for Environment, Food and Rural Affairs (DEFRA) The government department responsible for environmental protection, food production and standards, agriculture, fisheries and rural communities in the United Kingdom.
Energy Performance Certificate (EPC)An EPC is an asset rating detailing how energy efficient a building is, rated by carbon dioxide emission on a scale of ‘A’ to ‘G’, where an ‘A’ rating is the most energy efficient. They are legally required for any building that is to be put on the market for sale or rent.
Global Real Estate Sustainability Benchmark (GRESB) The Global Real Estate Sustainability Benchmark is an initiative set up to assess the environmental and social performance of public and private real estate investments and allow investors to understand their performance.
Global 100 IndexThe Global 100 Index is a ranking of the world's most sustainable corporations. The list is compiled by Toronto-based media and investment advisory firm Corporate Knights. Each year, the latest iteration of the index is announced at the World Economic Forum in Davos, Switzerland.
Leadership in Energy and Environmental Design (LEED)LEED is a US-based environmental impact assessment method for buildings. Performance is measured across a series of ratings – ‘Certified’, ‘Silver’, ‘Gold’ and ‘Platinum’.
Reporting of Injuries, Diseases and Dangerous Occurrences Regulations (RIDDORs)The regulations place a legal duty on employers to report work-related deaths, major injuries or over-three-day injuries, work related diseases and dangerous occurrences (near miss accidents) to the Health and Safety Executive.
SKASKA is a sustainability rating method developed specifically for fit-out projects. It sets out a range of good practice criteria and measures. Performance is measured across a series of ratings – ‘Bronze’, ‘Silver’ and ‘Gold’.
Transmission and distribution (T&D) The emissions associated with the transmission and distribution losses in the grid from the transportation of electricity from its generation source.
Well to tank (WTT)The emissions associated with extracting, refining and transporting raw fuel to the vehicle, asset or process under scrutiny.
List of definitions (unaudited)Continued
209208
Derwent London plc Report & Accounts 2017 Derwent London plc Report & Accounts 2017
Communication with our shareholdersShareholder enquiriesEnquiries relating to shareholders, such as queries concerning notification of change of address, dividend payments and lost share certificates, should be made to the Company’s registrars, Equiniti.
The Company has a share account, management and dealing facility for all shareholders via Equiniti Limited. This offers shareholders secure access to their account details held on the share register, to amend address information and payment instructions directly, as well as providing a simple and convenient way of buying and selling the Company’s ordinary shares. For internet services visit www.shareview.co.uk. The Shareview Dealing service is also available by telephone on +44 (0) 3456 037037 between 8.00 am and 4.30 pm, Monday to Friday (excluding UK Bank Holidays).
The best way to ensure that dividends are received as quickly as possible is to instruct the Company’s registrars to pay them directly into a bank or building society account; tax vouchers are then mailed to shareholders separately. This method also avoids the risk of dividend cheques being delayed or lost in the post. Dividend mandate forms are available from the registrars, either from their website at: www.shareview.co.uk or by telephone on the Equiniti general shareholder helpline number below.
Advisers
Stockbrokers JP Morgan CazenoveUBS
Solicitors Slaughter & May LLPAuditor PricewaterhouseCoopers LLPRegistrars Equiniti
Financial and dividend calendar – 2018Our forthcoming financial and dividend calendar for 2018 is provided below. These dates are provisional and subject to change. For up-to-date information, refer to the financial calendar on our corporate website at: www.derwentlondon.com/investors/calendarFinancial calendar Final results announced 27 FebQ1 Business Update 10 MayAnnual General Meeting 18 MayInterim results announced 9 AugustQ3 Business Update 8 November
Dividend calendar Final and special dividends: Interim dividend:
Ex-dividend date 3 May 13 SeptemberRecord date 4 May 14 SeptemberDividend paid 8 June 19 October
WebsiteFinancial information about the Company, including annual reports, public announcements and share price data, is available from the Company’s website at: www.derwentlondon.com.
Contact detailsOur registrarsEquiniti LimitedAspect HouseLancing Business ParkLancingWest Sussex BN99 6DA
Equiniti general shareholder helpline:Calling from the UK: 0371 384 2179Calling from overseas: +44 (0) 121 415 7047 Lines are open 8.30am to 5.30pm, Monday to Friday (excluding UK Bank Holidays).
Company SecretaryDavid LawlerCompany Secretary
Derwent London25 Savile RowLondonW1S 2ERUnited KingdomTelephone: +44 (0)20 7659 3000Fax: +44 (0)20 7659 3100
Email: [email protected]
Investor relations Quentin FreemanHead of Investor Relations & Corporate Communications
Derwent London25 Savile RowLondonW1S 2ERUnited KingdomTelephone: +44 (0)20 7659 3000Fax: +44 (0)20 7659 3100
Email: [email protected]
210
Derwent London plc Report & Accounts 2017
Designed and produced by MerchantCantos www.merchantcantos.com Printed by Empress Litho Limited
Derwent London plc Report &
Accounts 2017
Derwent London plcRegistered office: 25 Savile Row London W1S 2ERT +44 (0)20 7659 3000www.derwentlondon.comRegistered No. 1819699