Report 1943 PROMETHIUM-147 … · Military Technology Laboratory ... A radioluminescent paint...
20
AD Report 1943 PROMETHIUM-147 RADIOLUMINESCENT DECAY by Robert C. McMillan and Edwin A. Heck April 1969 This document has been approved for public release and sale; its distribution is unlimited. 0. S. ARMY MOBILITY EQUIPMENT RESEARCH AND DEVELOPMENT CENTER FORT RELVOIR, VIRGINIA Reproduced by the CLEARINGHOUSE for Federal Scientific & Technical Infcmdhon Springfield Vr« 2i!!5l 2P
Transcript of Report 1943 PROMETHIUM-147 … · Military Technology Laboratory ... A radioluminescent paint...

AD
Report 1943
PROMETHIUM-147 RADIOLUMINESCENT DECAY
by
Robert C. McMillan and
Edwin A. Heck
April 1969
This document has been approved for public release and sale; its distribution is unlimited.
0. S. ARMY MOBILITY EQUIPMENT RESEARCH AND DEVELOPMENT CENTER FORT RELVOIR, VIRGINIA
Reproduced by the CLEARINGHOUSE
for Federal Scientific & Technical Infcmdhon Springfield Vr« 2i!!5l
2P
Destroy this report when no longer needed. Do not return it to the originator.
The findings in this report are not to be construed as aa official Department of the Army position unless so designated by other authorized documents.
The citation in this report of trade names of commercially avail- able products does not constitute official endorsement or approval of the use of such products.
Ku\i. *-**•"" \
FP-
U. S. ARMY MOBILITY EQUIPMENT RESEARCH AND DEVELOPMENT CENTER
FORT BELVOIR, VIRGINIA
Report 1943
PROMETHIUM-147 RADIOLUMINESCENT DECAY
Task 1T062105A330-03
April 1969
Distributed by
The Commanding Officer U. S. Army Mobility Equipment Research and Development Center
Prepared by
Robert C. McMillan and
Edwin A. Heck Materials Research Support Division
Military Technology Laboratory
This document has been approved for public release and sale; its distribution is unlimited.
.-
,»••
7^
SUMMARY
A radioluminescent paint excited by promethium-147 was applied to 20 test items. The luminous decay was measured from 12 to 18 months after production. A single decay constant is used to fit all samples to an exponential decay curve. The effective luminous half-life is calculated to be 12.6 months contrasted with 30 months for the radionuclide. A com- parison of the relative luminosities of three different groups at the time of manufacture and at 15 months reveals that at some time during that period the groups decayed with different decay constants. The two brighter groups differed by 35 percent initially, but at 15 months they differed by less than 5 percent.
ii
FOREWORD
Authority for the research covered by this report is contained in DA Project 1T062105A330, Task 1T062105A330 FOE, Work Unit No. 034.
The study was made by Robert C. McMillan and Edwin A. Heck, Materials Research Support Division, Military Technology Laboratory.
iii
~n
CONTENTS
Section
n
m
IV
Title
SUMMARY
FOREWORD
INTRODUCTION
1. Purpose 2. Scope 3. Background
INVESTIGATION
4. Samples 5. Equipment 6. Calibration 7. Results
DISCUSSION
8. Analysis of Results 9. Further Study
CONCLUSIONS
10. Conclusions
APPENDIX - Compounding and Applying Radioluminous Paint to the Lensatic Compass
Page
ii
iii
1 1 1
2 2 2 4
4 9
10
iv
PROMETHIUM-147 RADIOLUMINESCENT DECAY
I. INTRODUCTION
1. Purpose. The purpose of this report is to present the data for the luminous decay of a radioluminescent paint excited by promethium-147 (147pm).
2. Scope. The data are obtained from a single system—the lumi- nous sector of the lensatic compass. All parts were painted during a single manufacturing period, but different exciter-binder mixes were used tc achieve different luminous levels.
3. Background. The development of useful self-luminous com- pounds is limited by four factors: Initial required luminosity, minimum acceptable luminosity, rate of luminous decay, and radiological hazards. This report presents data for only one factor, the luminous decay, and for a specific application. The data show that during the 6 months of data collection the luminosity of the 147Pm excited paint decreased with an effective half-life of 12.6 months.
Some of the factors associated with the loss of luminescence are: Radioactive decay, phosphor deterioration, and diffusion of the radio- active material. The radioactive decay is determined by the half-life of the nuclide which is chosen to excite the phosphor. The deterioration of the phosphor is usually associated with nuclides which emit alpha particles, but may be the result of a slow introduction of impurities into the phosphor. The diffusion of the radioactive nuclide away from the phosphor will depend on the nuclide chosen for excitation and the method of mixing or binding with the phosphor.
The radioluminescent decay of self-luminous materials deter- mines the useful life of many items. The user of such items is primarily interested in the length of the useful luminosity. Therefore, the developer of self-luminous materials must isolate and control the factors which affect the luminous life. In the search for the significant factors, each self- luminous system must be considered as an entity. Different methods of binding the radioactive nuclide in the materials may demonstrate different luminous decay characteristics. Changes of materials for protecting the luminous surface or of surfaces to which the material is applied may also produce changes in the luminous decay.

This report covers data from a single application. All sam- ples were prepared by the manufacturer using* the same type of materials and applied to the same types of surfaces. The main variation between samples was different initial luminosity. Although the data are consistent, the extension of the results to other systems or applications may not be justified.
H. INVESTIGATION
4. Samples. The luminous portions of 25 lensatic compasses were prepared with a radioluminescent paint excited by 147Pm contained in 3M Brand Radiating Microspheres provided under Contract DAAK02-67-C-0388. The details of the paint preparation as described by the manufacturer are given in the appendix to this report. This report covers the luminous decay data of the luminous sector of 20 of these compasses.
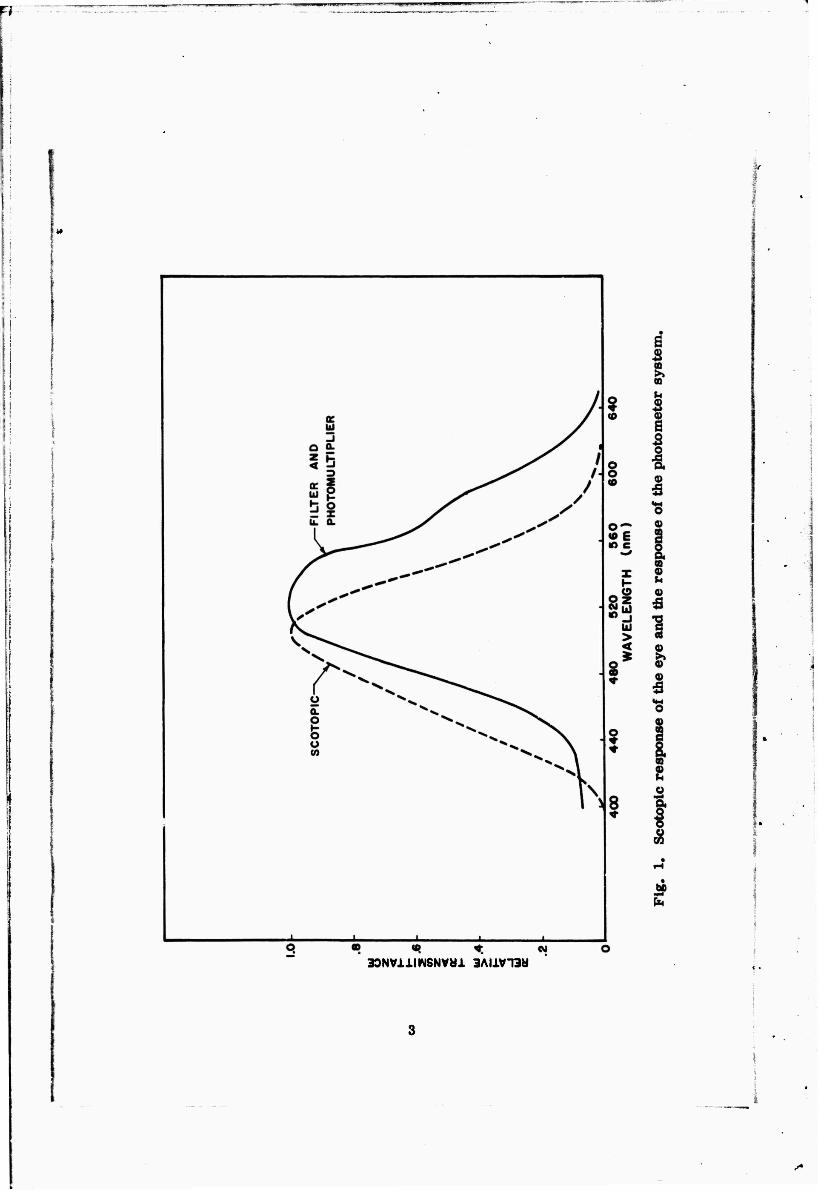
5. Equipment. The detecting system consists of an AMINCO Model 10-213 microphotometer with a 1P22 photomultiplier tube. Three filters, Corning 4308, Corning 3707, and Wratten 86A, are in the light path to the photometer. The filter system was in the photometer when the measurements were initiated. This system's response was assumed to approximate that of the scotopic eye. Later investigation revealed that the system1 s sensitivity is as shown in Fig. 1. Since the purpose of this investigation was to determine the luminosity decrease, the filter system was not changed throughout these measurements. If the spectral distribu- tion of the luminous sources did not change over the period of data collec- tion, then the analysis of the data is straightforward.
A jig was used to position the compass bowl and mask the luminous sector to the same area. A plastic rod served as a light pipe to the photomultiplier tube.
6. Calibration. Prior to the recording of data, the photometer system was calibrated each day. The calibration was performed by refer- ence to a standard lamp. Two opal glasses mounted on an optical bench reduced the luminous level to the measurement range. An average cali- bration factor for the photometer was calculated for a minimum of six points in the range of the measurements.
A second standard lamp was purchased. On two successive days, the system was calibrated using each of the standard lamps, and separate measurements were made for each compass bowl. The mean
w
• «! *. w 30NV11IWSNVH1 3AI1V13H
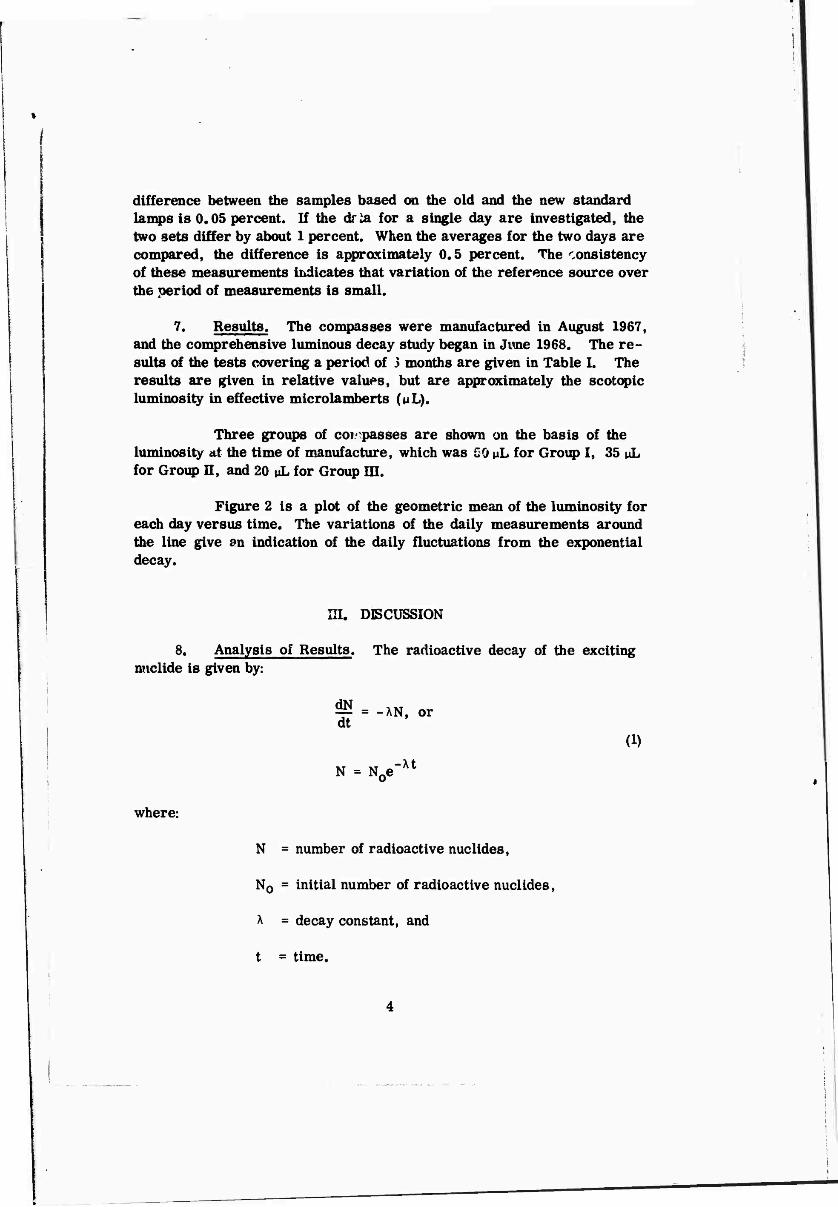
difference between the samples based on the old and the new standard lamps is 0« 05 percent. If the dr ia for a single day are investigated, the two sets differ by about 1 percent. When the averages for the two days are compared, the difference is approximately 0.5 percent. The consistency of these measurements indicates that variation of the reference source over the period of measurements is small.
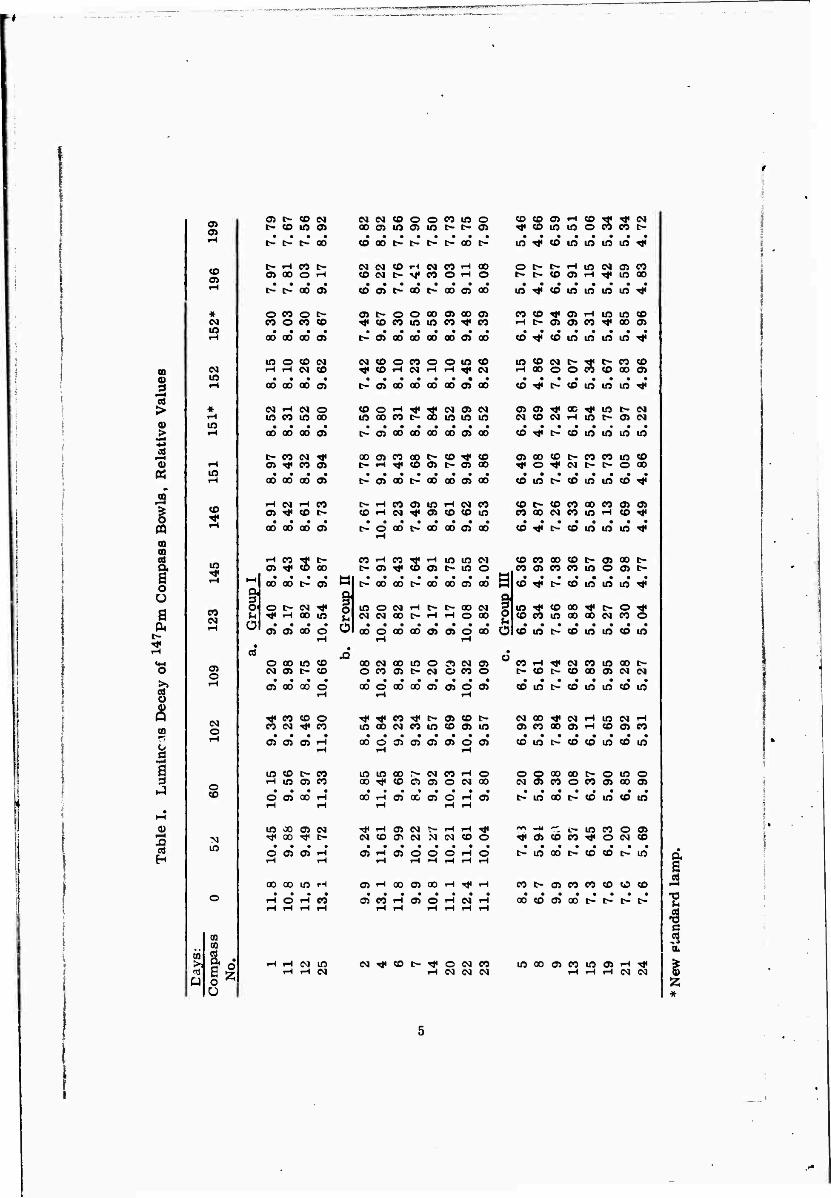
7. Results. The compasses were manufactured in August 1967, and the comprehensive luminous decay study began in June 1968. The re- sults of the tests covering a period of 3 months are given in Table I. The results are given in relative values, but are approximately the scotopic luminosity in effective microlamberts (uL).
Three groups of cor passes are shown on the basis of the luminosity at the time of manufacture, which was CO »L for Group I, 35 uL for Group II, and 20 uL for Group in.
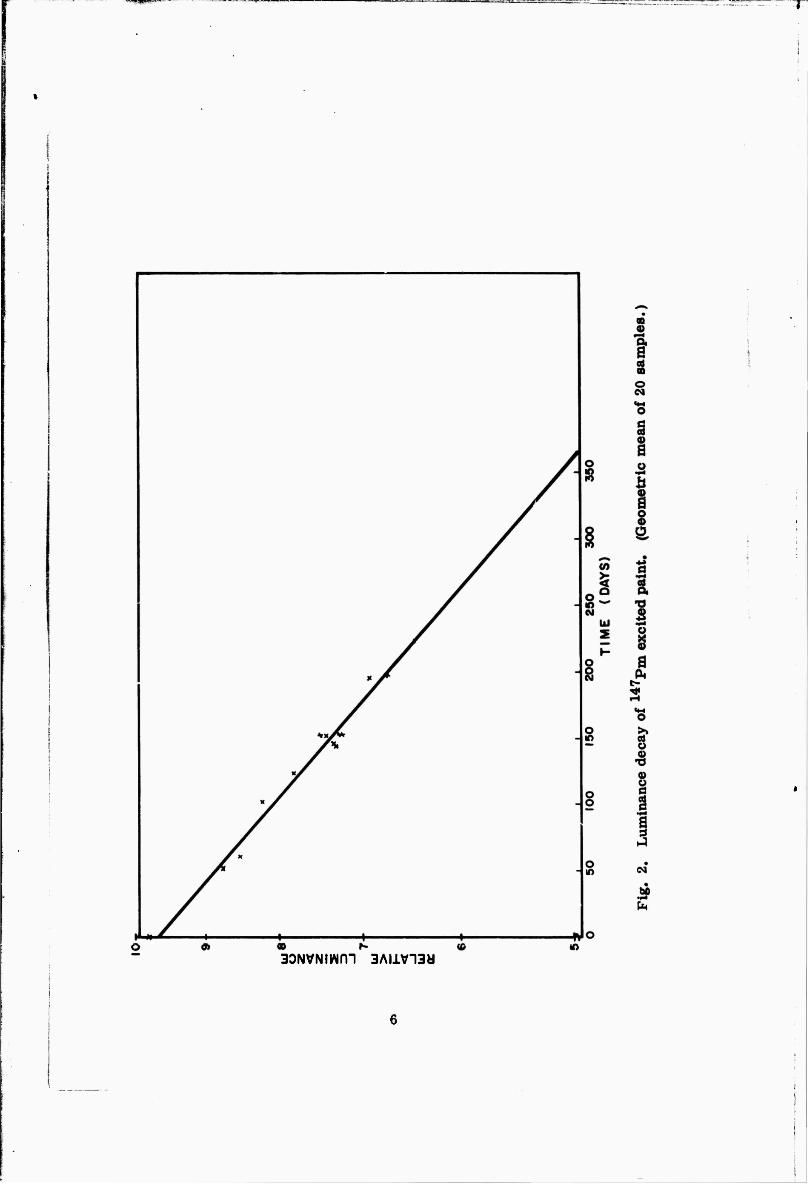
Figure 2 is a plot of the geometric mean of the luminosity for each day versus time. The variations of the daily measurements around the line give an indication of the daily fluctuations from the exponential decay.
in. DISCUSSION
8. Analysis of Results. The radioactive decay of the exciting nuclide is given by:
— = -AN, or dt
(1) -At N = N0e
where:
N = number of radioactive nuclides,
N0 = initial number of radioactive nuclides,
A = decay constant, and
t = time.
O) O)
a o co CM CMCMCOOOCOlß©
t» t<- t- 00 <Ofl0t-l>t-^fl0l* (O^tDlOlOiOU)^
CO O)
* CM Iß
l-HC0h Oi 00 O H
NN«r<ejCOH00 CDWt-M«e0Or-4O
Ot«l*HU)NO>rt
t- i> oo o)
O CO o t» 00 O CO CO
«O)t>00t»COO>GO
05D-O0000i000>
lA^tOlfllOlOlA^
C0»^«HiOlO<0 H^aoieo^ooa
00 00 00 CO t"-ffiQO0OQO0OO5flO CO^COtßlßtßtß-**
CO
3 •—I
>
'S «
i PQ 00 CO a s o o a ft t-
Ü
& CO
CM Iß
* 1-1 iß
iß
CO
iß
CO CM
0) ©
CM o
tO O CO CM rH iH CM CO
CMCOOOOOOtßCO ^COr-lCM«H«H^CM
lOCOdO^t-COCO iHOD©OCOCOOO0)
00 OO 00 o
N H N O lO CO IO 00
00 00 00 0)
f- CO CM -# O) ^* CO O)
t--O)0OO00O0OO5Q0
WOOCO^QOUJIOlO
(«0)000000000)00
C0^t><OlOlOtO^
O)O)^0CTfiOt-<N CMCOCMrHiOOOCM
ooocooot-co^co t>iH<««COO)t-0)aO
(O^Ncmiomifl
cnaocot^cocoioco ^O^Nb»t»O00
00 00 00 0)
iH CM «H CO O)^ <D N
00 00 00 0)
N0)oot,*ooaoo)oo
C-iHCOqjIßr-lCMCO cotHCMTföJcocom
NOOOt»aOOO0)QO
COlOt>COlftlOCO<4<
coi>cocooocoo)0> COOOCMCOlßiHCO«*
CO tjJ t-' (D lO ifl lO ^*
H CO ^ b- O) ^i CO OO
C0iH00^**HiOiDCM N0)^CO0)flOO
t> oo" oo" t> oo* oo* a* oo M
cocoaocot-0)oot- CO0)COCOlßOO)t-
t—t 00 OO t> O) a (O^^COlOlOU)^
g o O t- CM ^* ^ iH 00 Iß I IOOtNHt-t-00N g
NN00NHHO00 g • ••••••• JÜ
00000000)0000 Ü
lO^COOO^fO^) COCOlOaOOOCMCOO
Ü • • • • OS 05 00 O O • •••••••
C0tßt>COlßlß<Olß
a O 00 iß CO CM CD ^ CO
O) 00 00 O
T* 00 CO O CO CM ^f CO
O) O) 0) H
OOCMOOlßOÄCMO) OCOO)t~CMOCOO
00000000)0)00)
^Tj«eOTft-0)COi> IOOON(OU)(0O)IO
°eoH^NWujat- OCOt>COaO0)CMCM
CO Iß* t> CO Iß* Iß* CO* Iß*
CMOO^NHlONH O)COOO0)THCO0)CO
0000)0)0)0)00) C0lßt>COC0lßC0lß
o CO
lO CO t- 00 ft Iß 0) CO
O O) 00 rH
lOlflOOSNnHO OOT*CO0)0)OCMOO
oooooot>oioo CM0)COOCO0)OO0)
OOfH0)»0)OrH0) t-iöooocoifltoin
0> I—•
■s Iß
Iß 00 0) CM «tf 00 ^ t>
00)0)H
CM CO 0> CM N CN COO ^-"^c-lßOOOO) Tt*0)COCO^OC\ICO
O)IH0)OOOTHO t>lß00t-COCOt>lß
00 00 Iß r-i • • • •
rH O r-t 00
Ö)Hfl0O)0OHTj<H
O) CO H O) O* H N H
OOt-0)COOOCOCOCO
OOCD0)OOC»C»t-t>
CQ CO
CO
Is o Ü
CM Iß i-l CM
CMTt*COl>TJ<OCMCO rH CM CM CM
lßOOÖ)OlßO)H^ H H H N N
aONVNIWm 3AI1V13M
If one assumes that the luminosity (ty is proportional to the number of decaying nuclides, then:
L = kAN kAN0e"At = I^e~U (2)
where k is a proportionality constant and LQ is the initial luminosity« Under this assumption, the luminescence decays with the same decay constant as the radioactive nuclide.
Other factors beside the radioactive decay may change the lum- inosity. For the purpose of analyzing the data, we shall assume that diese factors change only the decay constant for the luminosity.
The data for each test item may be fitted by a least squares computation to equation 2. If this is done, one obtains 20 individual decay constants and 20 individual initial values for luminosity. Rather than pro- ceeding in this direction, the data were studied utilizing the methods of the analysis of variance.
The first results to show significance are the differences be- tween the luminosity of the groups and the differences between the lum- inosity of the individual samples. These results should be expected unless there were either very small differences between the luminosity of groups or compasses at the time of manufacture or very poor luminous measuring techniques. Although the initial luminosity for each test item was not cal- culated, the analysis is corrected for the values which would be obtained from a least squares calculation.
Although the groups are significantly different, the luminosity does not maintain the same relative status from the time of manufacture. This is shown in Table II. The values at 15 months are calculated from the 6 months of measurements. These calculated values provide better averages for the groups than the measurements of any single day. The two brighter grovps differed by 35 percent initially, but at 15 months, they differed by less than 5 percent.
Since the measurements were made on different instruments, direct comparison of the luminosity may be misleading. No comparative measurements on the two instruments were made at the time of the initial measurements. In spite of this, the relative status of each group for the two dates may be compared. At some time during the first 15 months, the groups decayed with different decay constants. However, there was no
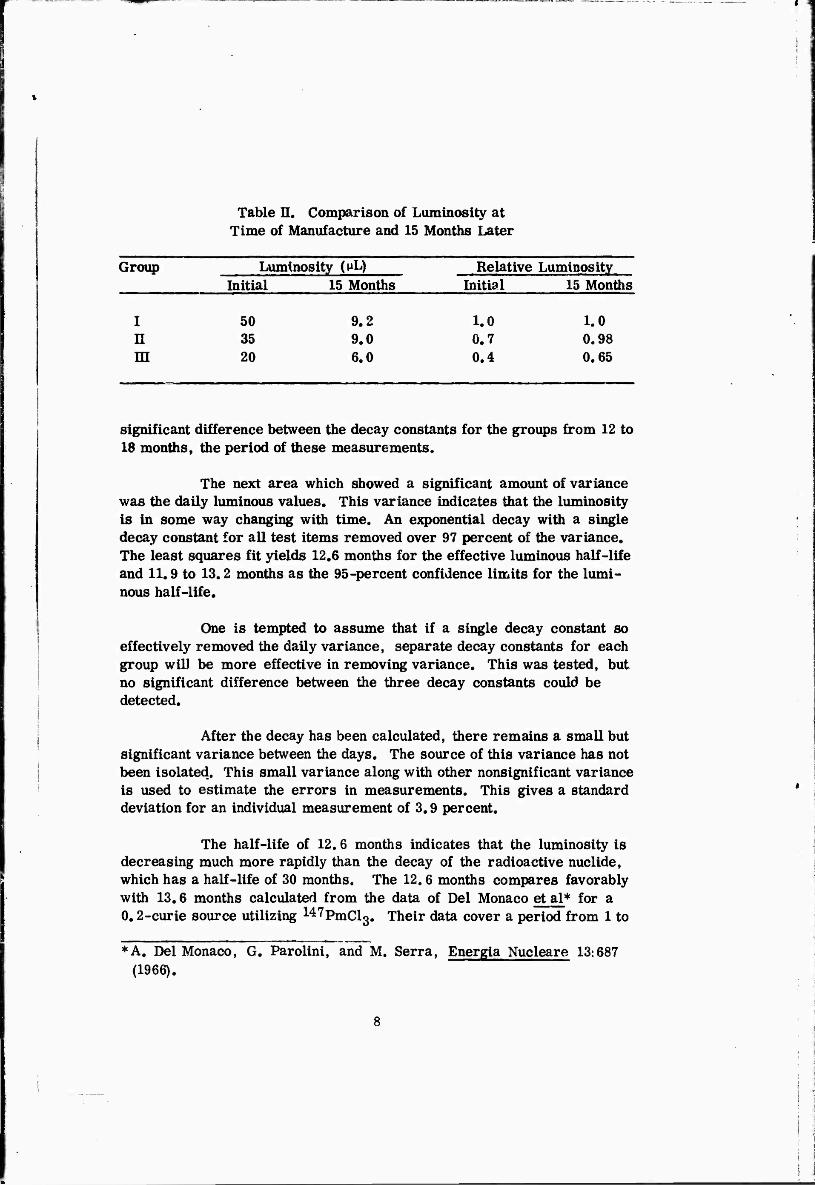
Table n. Comparison of Luminosity at Time of Manufacture and 15 Months Later
Group Luminosity (t*L) Relative Luminosity Initial 15 Months Initial 15 Months
I n m
50 35 20
9.2 9.0 6.0
1.0 0.7 0.4
1.0 0.98 0.65
significant difference between the decay constants for the groups from 12 to 18 months, the period of these measurements.
The next area which showed a significant amount of variance was the daily luminous values. This variance indicates that the luminosity is in some way changing with time. An exponential decay with a single decay constant for all test items removed over 97 percent of the variance. The least squares fit yields 12.6 months for the effective luminous half-life and 11.9 to 13.2 months as the 95-percent confidence limits for the lumi- nous half-life.
One is tempted to assume that if a single decay constant so effectively removed the daily variance, separate decay constants for each group will be more effective in removing variance. This was tested, but no significant difference between the three decay constants could be detected.
After the decay has been calculated, there remains a small but significant variance between the days. The source of this variance has not been isolated. This small variance along with other nonsignificant variance is used to estimate the errors in measurements. This gives a standard deviation for an individual measurement of 3.9 percent.
The half-life of 12.6 months indicates that the luminosity is decreasing much more rapidly than the decay of the radioactive nuclide, which has a half-life of 30 months. The 12.6 months compares favorably with 13.6 months calculated from the data of Del Monaco et al* for a 0.2-curie source utilizing 147PmCl3# Their data cover a period from 1 to
*A. Del Monaco, G. Parolini, and M. Serra, Energia Nucleare 13:687 (1966).
2 years after sample preparation. It is interesting to note that in an earlier period from 120 days to 200 days after preparation, a 0.2-curie source had a luminous half-life of 2.6 years and a 0« 1-curie source had a luminous half-life of 2.3 years. This is indicative of the wide fluctuation that may occur in such measurements.
It is recognized that Del Monaco's results are from sources with much higher activity than those covered in this report. However, it should be noted that all of their sources, ranging from 0.1 curie to 2.0 curies, tend toward a common limiting value after 1 year. This same phenomenon is noted for the two groups with the higher initial luminosity in the present report. This phenomenon in the initial and 15 -month luminosi- ties is illustrated in Table n.
9. Further Study. Measurement of the luminosity of these samples should be continued. Long-term studies will be useful in determining if the exponential decay is a reasonable approach to the luminescent decay or if another model should be developed.
Additional studies should be conducted to determine the factors that shorten the luminous half-life for this application.
Any new system which uses self-luminous materials should be evaluated on its own merits. The introduction of data from other systems must be carefully evaluated to determine that the same conditions exist for the new system.
IV. CONCLUSIONS
10. Conclusions. The 147Pm excited paint has a luminous half-life of 12.6 months as determined from a test period from 12 to 18 months after preparation. Although this differs from the radioactive half-life of 30 months, the result is similar to that obtained by others using a different method for including 147Pm in the paint.
The two groups of samples which had a larger initial luminosity had a ratio of 10:7 initially, but were within 5 percent of each other at the end of 15 months. No adequate explanation for this change can be postulated at this time.
»
APPENDIX
COMPOUNDING AND APPLYING RADIOLUMINOUS PAINT TO THE LENSATIC COMPASS
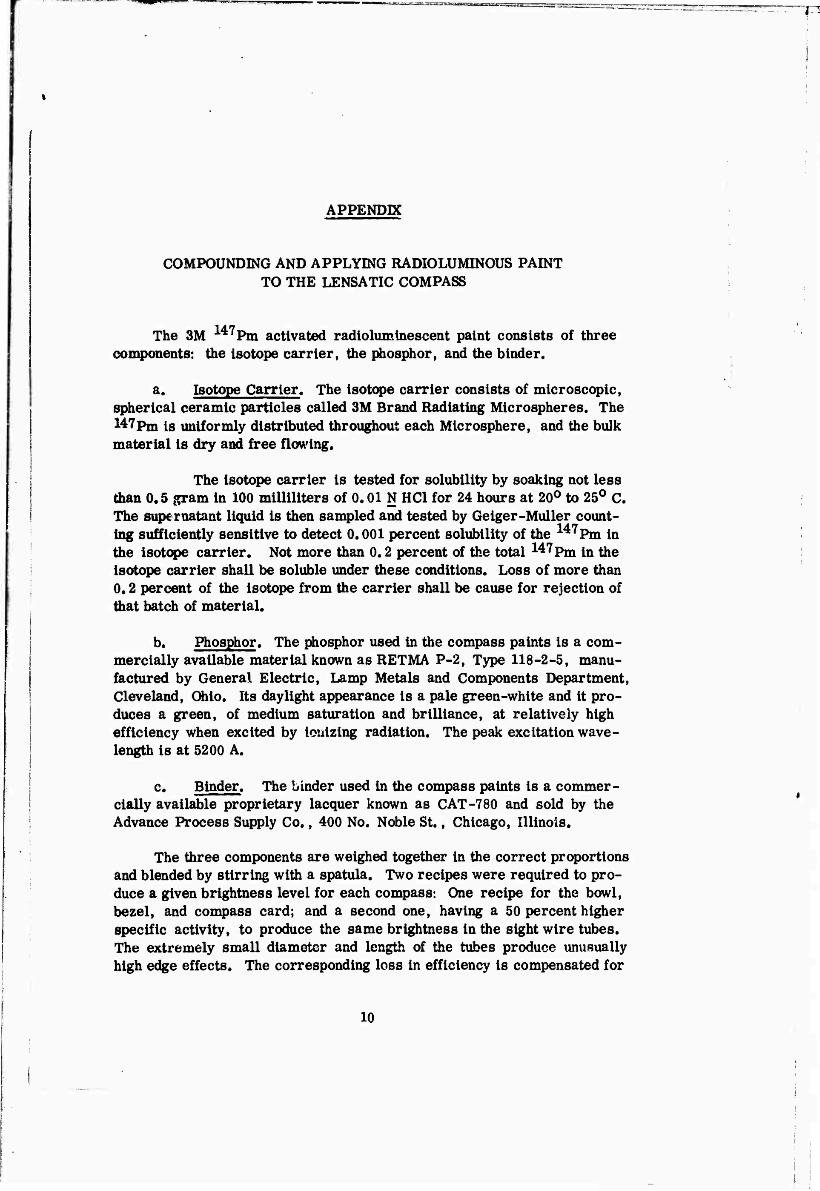
The 3M 147Pm activated radiolumlnescent paint consists of three components: the isotope carrier, the phosphor, and the binder.
a. Isotope Carrier. The isotope carrier consists of microscopic, spherical ceramic particles called 3M Brand Radiating Microspheres. The 147pm is uniformly distributed throughout each Microsphere, and the bulk material is dry and free flowing.
The isotope carrier is tested for solubility by soaking not less than 0.5 gram in 100 milliliters of 0.01 N HC1 for 24 hours at 20° to 25° C. The supernatant liquid is then sampled and tested by Geiger-Muller count- ing sufficiently sensitive to detect 0.001 percent solubility of the 147Pm in the isotope carrier. Not more than 0.2 percent of the total 147Pm in the isotope carrier shall be soluble under these conditions. Loss of more than 0.2 percent of the isotope from the carrier shall be cause for rejection of that batch of material.
b. Phosphor. The phosphor used in the compass paints is a com- mercially available material known as RETMA P-2, Type 118-2-5, manu- factured by General Electric, Lamp Metals and Components Department, Cleveland, Ohio. Its daylight appearance is a pale green-white and it pro- duces a green, of medium saturation and brilliance, at relatively high efficiency when excited by ionizing radiation. The peak excitation wave- length is at 5200 A.
c. Binder. The binder used in the compass paints is a commer- cially available proprietary lacquer known as CAT-7 80 and sold by the Advance Process Supply Co., 400 No. Noble St., Chicago, Illinois.
The three components are weighed together in the correct proportions and blended by stirring with a spatula. Two recipes were required to pro- duce a given brightness level for each compass: One recipe for the bowl, bezel, and compass card; and a second one, having a 50 percent higher specific activity, to produce the same brightness in the sight wire tubes. The extremely small diameter and length of the tubes produce unusually high edge effects. The corresponding loss in efficiency is compensated for
10
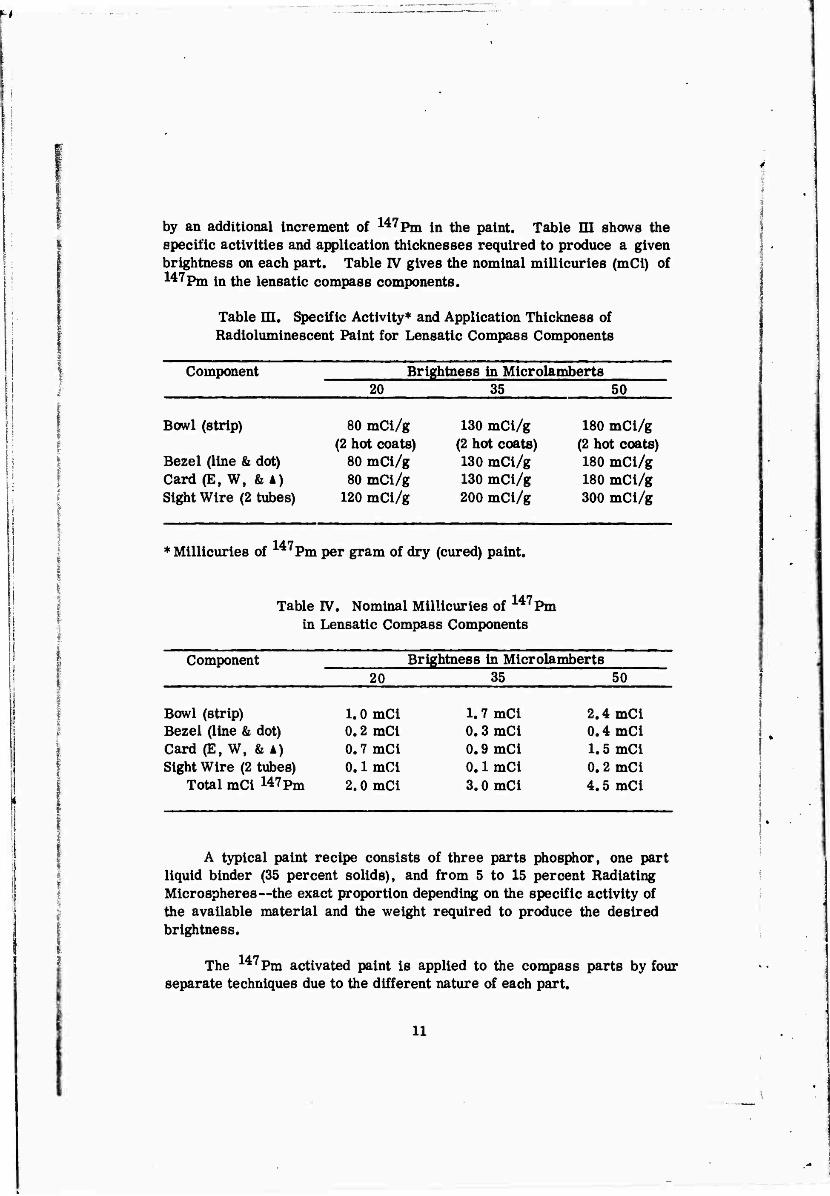
by an additional increment of 147Pm in the paint. Table III shows the specific activities and application thicknesses required to produce a given brightness on each part. Table IV gives the nominal millicuries (mCi) of 147Pm in the lensatic compass components.
Table in. Specific Activity* and Application Thickness of Radioluminescent Paint for Lensatic Compass Components
Component Brightness in Microlamberts 20 35 50
1 * Bowl (strip) 80 mCi/g 130 mCi/g
i (2 hot coats) (2 hot coats) Bezel (line & dot) 80 mCi/g 130 mCi/g
| Card (E, W, & A) 80 mCi/g 130 mCi/g Sight Wire (2 tubes) 120 mCi/g 200 mCi/g
180 mCi/g (2 hot coats) 180 mCi/g 180 mCi/g 300 mCi/g
* Millicuries of 147Pm per gram of dry (cured) paint.
Table IV. Nominal Millicuries of 147Pm in Lensatic Compass Components
Component Brightn ess in Microlamberts 20 35 50
Bowl (strip) 1.0 mCi 1.7 mCi 2.4 mCi Bezel (line & dot) 0.2 mCi 0.3 mCi 0.4 mCi Card (E, W, & A) 0.7 mCi 0.9 mCi 1.5 mCi Sight Wire (2 tubes) 0.1 mCi 0.1 mCi 0.2 mCi
Total mCi 147Pm 2.0 mCi 3.0 mCi 4.5 mCi
A typical paint recipe consists of three parts phosphor, one part liquid binder (35 percent solids), and from 5 to 15 percent Radiating Microspheres— the exact proportion depending on the specific activity of the available material and the weight required to produce the desired brightness.
The 147Pm activated paint is applied to the compass parts by four separate techniques due to the different nature of each part.
11
a. A special pen, developed for radioluminescent paints, was used to apply paint to the E, W, and A of the compass card. A clear seal- coat of 10 percent CAT-780 was sprayed on to prevent abrasion damage to the luminous areas.
b. With the above pen, paint was laid into the line and dot of the glass bezel« A spatula was used to squeegee the paint into the narrow line. Excess paint was removed with a cotton-tipped swab and lacquer thinner. The center portion of the luminous line was scraped away when dry, and 10 percent CAT-780 was sprayed over the luminous areas to improve adhesion to the glass.
c. The bowl strip was prepared by screening a reflective white coat (CAT-100) onto 1/2-mil Scotchpar (polyester) film. The samples were cured for 4 hours at 80° C, and two or three coats of hot paint were applied using a 200- by 200-mesh stainless steel screen. The samples were cured as above and weighed. A she t of 1/2-mil Scotchpar was laminated to the top of the construction using Scotchgrip Industrial Adhe- sive No. 826 around the edges, but not over the luminous material. The finished "sandwich" construction was applied to the white painted interior of the compass bowls using Scotchgrip No. 826.
d. The sight wire tubes were prepared by filling Pyrex tubes and melting the ends closed. For this application, the organic binder was not used. The tubes were mounted in the grooves below the ends of the sight wire using CAT-780 (50 percent solids). The clear adhesive is required to "pipe" the light around the sides of the sight wire which is large enough to nearly obscure the tube.
12
UNCLASSIFIED Security ClsssiflcstioR
DOCUMENT CONTROL DATA .R&D (Ucmitf clmmmtUcmtimm ml tltt». bo0r fj jjfjggg fjgj JRJSEJRJ ggjggg —' ** «*»<—' SJRSR ft» «itNll
I. ORIGINATING ACTIVITY (CtipMM AuStorJ
U. S. Army Mobility Equipment Research and Development Center Fort Belvolr, Virginia 22060
am. REPORT SECURITY CLASSIFICATION
Unclassified
Uli—!)
REPORT TITLE
PROMETHIUM-147 RADIOLUMINESCENT DECAY
I (Tfpm mt «psrt mm4 mtclmmiw matmm)
t. MtTHOnm (Mnt mmmw. SSBB P3BE Bfi555 "
Robert C. McMillan and Edwin A. Heck
». REPORT DATS
April 1969
m. PROJECT NO. 1T062105A330
. Task No. 1T062105A330 FOE
4WorkUnitNo. 034
7«. TOTAL NO. <
24 Tfc. NO.
Mi ORIGINATOR'S RE»ORT NUtAlNI»
1943
, OTHER REPORT NOIII (At*f 0»W ( iMIHTHMllllW
•O. CitTRISUTION ITATIMINT
This document has been approved for public release and sale; its distribution is unlimited.
II. SUPPLEMENTARY NOTES
il-
ia. SPONSORING MILITARY ACTIVITY
USAMERDC Fort Belvoir, Virginia 22060
\ ^ radioluminescent paint excited by promethium-147 was applied to 20 test items.
The luminous decay was measured from 12 to 18 months after production. A single decay constant is used to fit all samples to an exponential decay curve. The effective luminous half-life is calculated to be 12.6 months contrasted with 30 months for the radionuclide. A comparison of the relative luminosities of three different groups at the time of manu- facture and at 15 months reveals that at some time during that period the groups decayed with different decay constants. The two brighter groups differed by 35 percent initially, but at 15 months they differed by less than 5 percent.
DD :r„1473 REPLACES OO F OSS9LIT« FOR
MT». I JAM M. «MICH IS 1«.
23
UNCLASSIFIED
KKV MROI
Promethium-147
Radioluminescent Decay
Self-Luminous Materials
24 UNC1 4gsim$L
3-4 -ll.MA—Ft Bclvoir