Report 1 Work flow - geothermie.nl · Inadequately perforated wells; Too long acid treatment before...
18
Kennisagenda Aardwarmte A workflow for laboratory and numerical analysis of matrix acidizing in geothermal wells June, 2016 Authors: Anna Peksa Naveen Ilangovan Fiorenza Deon Hamidreza M. Nick David Bruhn
Transcript of Report 1 Work flow - geothermie.nl · Inadequately perforated wells; Too long acid treatment before...

Kennisagenda Aardwarmte
A workflow for laboratory and numerical analysis of matrix acidizing in geothermal wells
June, 2016
Authors: Anna Peksa
Naveen Ilangovan
Fiorenza Deon
Hamidreza M. Nick
David Bruhn

kennisagenda Aardwarmte: Soft stimulation techniques - D1
2
1. INTRODUCTION
Acid Stimulation refers to the process of injecting acid into a formation to increase the permeability and enhance a geothermal well’s productivity dissolving material in the productive formation that is restricting flow. As well it can be directed to dissolve formation rock itself to enhance existing flow paths, or to create new flow paths to the wellbore. The formation subsurface archetype (carbonate, sandstone, or shale), and formation permeability (the ability of fluid to flow through the formation in its natural state) are the two key factors that influences the design process and treatment selection of an acid job. For example, in carbonate formations, the dissolution of solids by the acid solution in the near-well region leads to creation of highly conductive channels called wormholes. In the sandstone formations, pore filling material is dissolved and overall permeability increase. The formation archetype determines the type(s) of acid necessary for stimulations and formation permeability determines the pressures required for pumping the acid into the formation.
In both sandstone and carbonate formations, at pressures below the fracturing pressure, the matrix acidizing is performed [1]. Matrix acidizing is the process of injecting acid mixtures into reservoir formation, however the acid used for each treatment varies according to the solubility of the minerals in the formations. Conventionally, the most often used acid for sandstone stimulation is a mixture of hydrofluoric (HF) and hydrochloric (HCl) acids depending on the sandstone minerals. For carbonates solely HCl acids are used.
Since many years, large amount of research has been done on matrix acidizing, however experience shows that still many issues need to be addressed. Among the major challenges, following should be consider: multiple types of co-existing formation damage; uncertain rock mineralogy; multiple fluids and pumping stages; complex chemical reactions between fluids and formation minerals; inadequate zonal coverage; limited active acid penetration; rock deconsolidation due to acid-rock interactions; acid emulsion and sludge tendencies [2]. In addition, determining the optimum combination of injection rate and fluid type is still a challenge when it comes to field scale.
In geothermal reservoirs with increased downhole temperatures, the most common causes for a failure of acidizing treatment, could be either one or a combination of the following reasons[2]: Using the wrong type of acid; Using improper acid volumes and/or acid concentrations for the formation minerology; Over/mis-using additives; Inadequately perforated wells; Too long acid treatment before reproduction; Wrong identification of the cause of formation damage; The rate of corrosion increase. Thus, the effect of elevated temperatures on fluid properties and on various steps of the acidizing treatment has to be determined. To overcome this problem and to achieve success in the acidizing treatment, it is crucial to design an effective acid treatment. Therefore a workflow for laboratory and numerical analysis of matrix acidizing is provided. In this workflow we have shown the use of data acquired from the laboratory tests and numerical analysis to predict the injectivity procedure and to asses and minimize risks in the geothermal operations.
2. WORKFLOW OVERVIEW
The design of any acid-stimulation treatment should begin with a detailed evaluation of the characteristics of the targeted formation, based on both the available field data and extensive laboratory techniques. Inter alia composition, structure, permeability, porosity, and strength of the rock must be determined, along with formation temperature and pressure and the properties of reservoir fluids. In order to make the most of acidizing, the acid treatment design must be approached as a process. The general approach is presented in fig. 1.

kennisagenda Aardwarmte: Soft stimulation techniques - D1
3
Fig. 1 A workflow chart for laboratory analysis of matrix acidizing in geothermal wells

kennisagenda Aardwarmte: Soft stimulation techniques - D1
4
Here we introduce a workflow for systematic laboratory and numerical analysis for matrix acidizing in geothermal wells. The workflow is supported by a number of examples to illustrate and discuss the application to geothermal reservoir evaluation. The examples belong to a case study on the Triassic formations in the Netherlands that are considered as potential geothermal reservoirs. In these formations the permeability of the rock matrix can be very low for geothermal energy production and fractures may become the main pathways for flow. Acid stimulations techniques should be utilized to improve injectivity/productivity in such formations.
3. WORKFLOW DESCRIPTION WITH EXAMPLES
I. Study material
I.I Samples selection and collection
Sample collection procedures are necessary mainly to ensure use of representative samples for the planned geothermal reservoir. Additional consideration for sample collection activities is the assurance of sufficient volume of the test material to conduct all necessary studies. For the laboratory test of matrix acidizing in geothermal wells large volume of test material is needed due to two reasons: (1) an extended investigation needed in prior to main acid injection tests; (2) the reservoirs in most of the projects are not well known and are difficult to characterize with the actual geophysical tools. Thus, additional samples collection is needed from outcrops of analogue rocks.
An example of outcrop and well samples selection process for the geothermal operations in the Lower Germanic Triassic Group in the Netherlands is presented below. The aquifer planned for the thermal extraction spans the whole Main Buntsandstein, thus it contains lithostratigraphic Members and Formations from the Solling Sandstone down to the Lower Volpriehausen (Fig.2).
Fig.2 Lithostratigraphy of the Middle Triassic of the Germanic Basin
The Hardegsen formations, a subgroup of Main Buntsandstein, that are considered as potential geothermal reservoirs are characterized by poor matrix permeability and flow is mainly controlled by natural fracture and faults network. The main experimental material was collected from existing boreholes, however, additional material needed to be obtained from the outcrop locations. Due to limited availability of the Hardegsen Formation samples, the investigation of the well samples for final tests was diversified throughout the Main Buntsandstein (MB) formation (Fig.2) The sedimentary facies in the larger interval are exhibiting similarities. Selection of the appropriate samples has been done based on available mineralogical/petrographic composition data in the literature and the geological conditions determined from the well cores in the Westland concession. The selection of samples was directed towards low porosity sandstones, as according to Nelskamp and Verwey (2012) [3], the average reservoir porosity of Triassic Formation at 4 km depth will not exceed 8% and permeability will be around 4 mD.

kennisagenda Aardwarmte: Soft stimulation techniques - D1
5
In this regard, analog sandstones (both well and outcrop) with similar properties and cement types– regardless of their stratigraphic position were chosen (Table 1); three different outcrop samples from Germany and one offshore sample from a borehole Q16-02 from depths of 3629 – 3838 m (Fig.2).
Table. 1 Representative rock samples from the Lower Germanic Triassic Group that were selected
Name of the rock Sample name
Location Stratigraphy
Borehole Q16-02 Offshore MB, Volpriehausen
Wesersandstein (Quarry) W-1 Bad Karlshafen, North Hessen
MB, Solling-Folge, Karlshafener Schichten
Friedewalder Buntsandstein, pale, (Quarry)
F-1 Friedewald, South Hessen
MB, Solling-Folge
Kordeler Sandstein (Quarry) K-1 Trier, Rhineland-Palatinate
Upper Buntsandstein Voltziensandstein
Fig. 3 Locations of the selected samples
For the further workflow description, the Wesersandstein sample (W-1) is used as an example.
I.II Mineralogy analysis
To improve the success of sandstone-acidizing, the detail mineral composition of the target formations must be known. Otherwise, problems with clay swelling, fines migration, gel formation, and precipitation can be encountered. Moreover, the mineral composition is necessary for proper injection acid determination. The combination of following methods: XRD powder diffraction, XRF, microscope analysis, scanning electron microscope (SEM) and electron Microprobe (EMP) provides a complete description and interpretation of the rock (Fig.4).
Electron-microprobe analysis (EMPA). Single-spot mineral analyses are performed using a electron microprobe operating in the wavelength-dispersive mode The analytical conditions include an accelerating voltage of 15 kV, a

kennisagenda Aardwarmte: Soft stimulation techniques - D1
6
beam current of 10 nA, and a focused beam. Well-characterized grains of plagioclase and quartz were used as standards. Secondary-electron (SE) images are collected with a electron microprobe (15 kV accelerating voltage).
X-Ray diffraction analysis (XRD. To determine the modal mineralogy of the rocks by XRD, the rock samples are crushed and sieved to obtain the 63-µm fraction. XRD patterns are recorded in transmission using a fully automated STOE STADI P diffractometer (Cu-Kα radiation), equipped with a primary monochromator and a 7°-wide position sensitive detector. The diffractograms are refined with specialy designed software (i.e the EXPGUI-GSAS software (Larson and Von Dreele, 2000; Toby, 2001; Belsky et al., 2002), using reference structures from the ICDS database (Bergerhoff and Brown, 1987). Additional X-ray measurements (step-scan mode) were performed with an automatic Siemens D500 diffractometer (half automatic beam - 40a, Graphite secondary monochromtator - with Cu Kα 40 kV, 35 mA) at the Section of Material Research and Physics, University of Salzburg, Austria.
X-ray fluorescence analysis (XRF). XRF analyses were conducted at the Department of Inorganic and Isotope Geochemistry at Helmholtz Centre Potsdam – German Research Centre for Geosciences, using a PANanalytical AXIOS instrument featuring a 4 kW Rh tube. Additional XRF data were acquired at the Section of Material Science and Physics, University of Salzburg, on a Bruker S4 Pioneer instrument, equipped with a 4 kW Rh tube. Major elements were determined at reduced tube energies. Counting times were chosen such that the relative 2σ uncertainties were less than 1% for Si and Al, and less than 5 % for elements occurring at the 1−10 wt.% concentration level. For the determination of trace elements, tube conditions and counting times were optimized automatically up to 4 kW and 400 s per element, to obtain a detection limit of ~3 ppm (3σ). Typical errors (2σ) from the counting statistics were 1−2 ppm at low concentrations (<10 ppm), ~5 ppm at the 100 ppm concentration level, and better than 50 ppm at the 1,000 ppm level.
Example of results for the mineral composition on sample W1
The optical observation at the microscope evidences a high concentration of quartz, microcline, and micas. The exact type of mica (or phyllosilicate) could not be determined at the microscope. Grains with a size≥ 100 µ characterize the sample. Quartz occur with different extinction. Microcline can be recognized by the typical twining detectable with crossed nicols. Alteration appears throughout the W1. However, the clay fraction cannot be recognized at the microscope. The sample has been investigated additionally by means of XRD and EMPA
In order to determine the chemical composition of each single well-polished thin section of the W1, sample have been observed and analysed at the electron microprobe. An advantage of using the electron microprobe is the detection of mineral phases whose concentration lies below 1wt. %. Such minerals, like rutile and zircon in our case, could not be detected by XRD. Images offers an overview of the thin section where quartz, microcline, clay fraction and zircon can be observed. The most abundant phase in the sample is quartz followed by microcline, clay, phyllosilicate (mica or chlorite) and accessories (zircon and spinel). The evidence of chlorite along with zircon and microcline is found. Moreover, we can observe one of the typical occurrence of the clay fraction in this sample. Usually clay forms replacing microcline (or plagioclase or K-feldspar) when alteration processes take places. Interesting are the typical stripes of the microcline cleavage which allow to distinguish microcline from plagioclase and K-feldspar.
As a result of the conducted study, the Wesersandstein samples (W-1) consist mainly of quartz (53.9%wt.) as the rock forming mineral with microcline (28.7%wt.), phlogopite (7.9%wt.), Biotite (9.4%wt.).

kennisagenda Aardwarmte: Soft stimulation techniques - D1
7
Fig. 4 A workflow chart for laboratory petrographic analysis with example of the tested sample W-1
I.III Core handling and sample preparation
To prevent a laboratory-induced damage, the core handling, cleaning and preparation procedures should be specified with a complete understanding of the mineralogy of the tested samples. Among the most important factors are: (1) plug drilling that need to be performed with a compatible plug drilling fluid to avoid fluid/rock and/or fluid/fluid reactions; (2) sample cleaning that need to be adjusted to the rock characteristics, i.e. low flow rate cleaning for formations having delicate mineral morphology; (3) sample drying procedures to remove the fluids and prepare samples for the flooding tests. Knowledge about critical point drying is necessary to preserve the delicate illite structures and to avoid clays to get brittle and flaky. Damaged particles, while drying, can become mobile while conducting core flood tests, and might be a source of pore clogging.
II. Pre- injection studies
II.I Physical rock properties tests
A factor that is important for the planning of the acid jobs is formation permeability - the ability of the formation to transmit fluids in its natural state. Knowledge about the formation permeability determines the pressure required for pumping the acid into the formation (lower permeability- higher pressure required). In addition, porosity and specific surface area is a parameter necessary for determination of the homogeneity of the sample and the correct selection of the volume of the injected acid.
Laboratory tests
Single phase permeability of rock samples should be measured in the framework of core plugs oriented in three directions. In the example study, permeability was measured along the axials direction of core plugs using nitrogen in a Ruska gas permeameter. Core plug dry porosity was measured using a helium injection method in a gas expansion
kennisagenda Aardwarmte: Soft stimulation techniques - D1
8
Ultra Pycnometer 1000 (Quantachrome Instruments™) using Boyle's gas expansion law. The resulting matrix volume values provide the bulk density and effective porosity.
The specific surface areas of rock samples was obtained in two ways: (1) at pore level from thin section analysis on a consolidated sample, and (2) at electron level, by adsorption of nitrogen, at low temperatures (77 K). Before each measurement, the samples were degassed at 150 °C for at least 24 h. The nitrogen adsorption of samples was measured with a Micrometrics Gemini™ system. The adsorption behavior in porous material is related to both fluid wall interactions and the attractive interactions occurring among the fluid molecules. It results in multilayer adsorption and the existence of capillary condensation in the pore space.
II.II Acidification solution tests
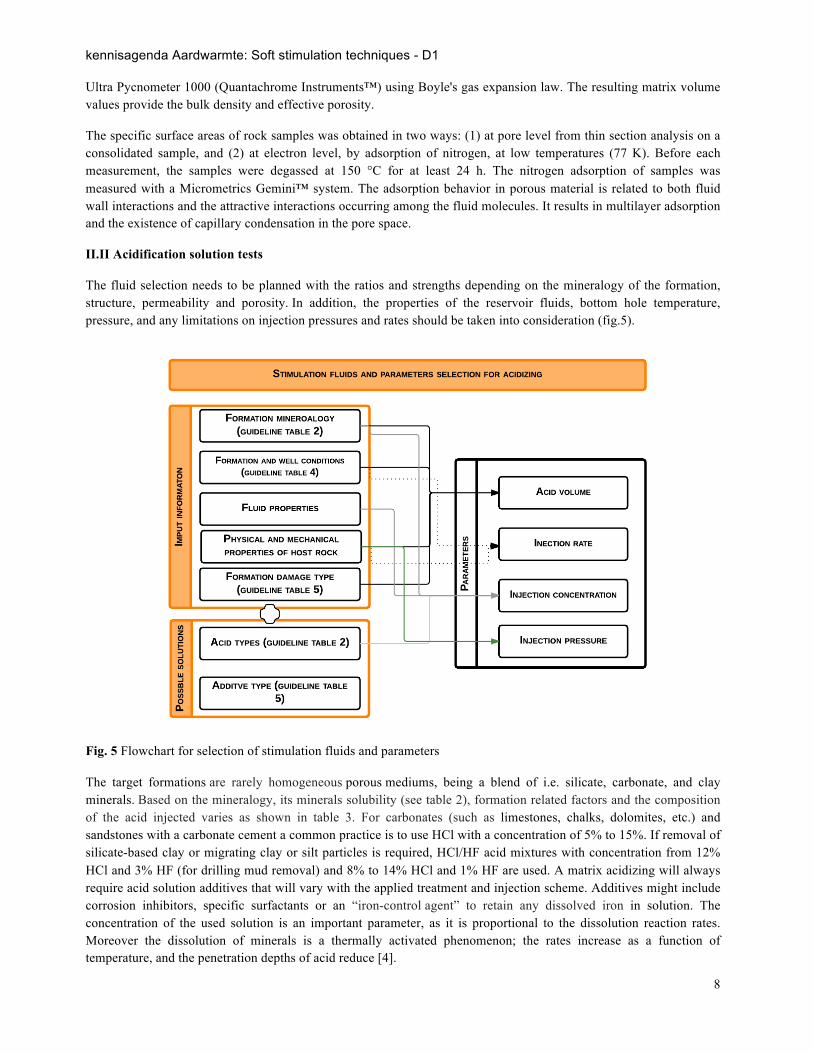
The fluid selection needs to be planned with the ratios and strengths depending on the mineralogy of the formation, structure, permeability and porosity. In addition, the properties of the reservoir fluids, bottom hole temperature, pressure, and any limitations on injection pressures and rates should be taken into consideration (fig.5).
Fig. 5 Flowchart for selection of stimulation fluids and parameters
The target formations are rarely homogeneous porous mediums, being a blend of i.e. silicate, carbonate, and clay minerals. Based on the mineralogy, its minerals solubility (see table 2), formation related factors and the composition of the acid injected varies as shown in table 3. For carbonates (such as limestones, chalks, dolomites, etc.) and sandstones with a carbonate cement a common practice is to use HCl with a concentration of 5% to 15%. If removal of silicate-based clay or migrating clay or silt particles is required, HCl/HF acid mixtures with concentration from 12% HCl and 3% HF (for drilling mud removal) and 8% to 14% HCl and 1% HF are used. A matrix acidizing will always require acid solution additives that will vary with the applied treatment and injection scheme. Additives might include corrosion inhibitors, specific surfactants or an “iron-control agent” to retain any dissolved iron in solution. The concentration of the used solution is an important parameter, as it is proportional to the dissolution reaction rates. Moreover the dissolution of minerals is a thermally activated phenomenon; the rates increase as a function of temperature, and the penetration depths of acid reduce [4].

kennisagenda Aardwarmte: Soft stimulation techniques - D1
9
Table 2. (left) Acid types and (right) an example of solubility of sandstone minerals in HCl and HCl-HF: ‘-‘ very low; ‘o’ low to moderate and ‘+’ high (after [2])
Inorganic Hydrochloric acid (HCl) Hydrofluoric acd (HF) Rock Mud Acid (HCl/HF) Tetrafluoroboric acid (HBF4) Organic Acetic acid Formic acid Citric Acd (C6H8O7) Mixtures Organic clay acid Biodegradable acid
Table 3. Sandstone acid procedures for specific formation conditions (after Portier et al., 2007)
Well and formation conditions Treatment fluid recommandation Bottomhole treating temperatures > 100°C 1.5% HF + 13.5% HCl Permeability < 5 md 1.5% HF + 13.5% HCl Quartz content: > 90% 50 to 90%
3% HF + 12% HCl 3% HF + 12% HCl or retarded HF
Feldspar, 15 to 30% 1.5% HF + 13.5% HCl Chlorite clay: 1 to 5 > 5%
3% HF + 10% Acetic 1.5% HF + 10% Acetic or Formic
Table 4. Composition dependent acid guidelines for the chemical treatment of sandstones (after Crowe et al., 1992)
Temp. (°C) Rock mineralogy (%)
Rock permeability (milliDarcy [md])
> 100 md 20-100 md < 20 md HCl (%)
HF (%)
HCl (%)
HF (%)
HCl (%)
HF (%)
< 100
High quartz (> 80), low clay (< 10) 12 3 10 2 6 1.5 High clay (> 10), low silt (< 10) 7.5 3 6 1 4 0.5 High clay (> 10), high silt (> 10) 10 1.5 8 1 6 0.5 Low clay (< 10), high silt (> 10) 12 1.5 10 1 8 0.5
> 100
High quartz (> 80), low clay (< 10) 10 2 6 1.5 6 1 High clay (> 10), low silt (< 10) 6 1 4 0.5 4 0.5 High clay (> 10), high silt (> 10) 8 1 6 0.5 6 0.5 Low clay (< 10), high silt (> 10) 10 1 8 0.5 8 0.5
Minerals Solubility HCl HCL-HF
Quartz no - Feldspars no o Micas no o Kaolinite no + Illite no + Smectite no + Chlorite o + Calcite + + Dolomite + + Ankerite + + Siderite + +
kennisagenda Aardwarmte: Soft stimulation techniques - D1
10
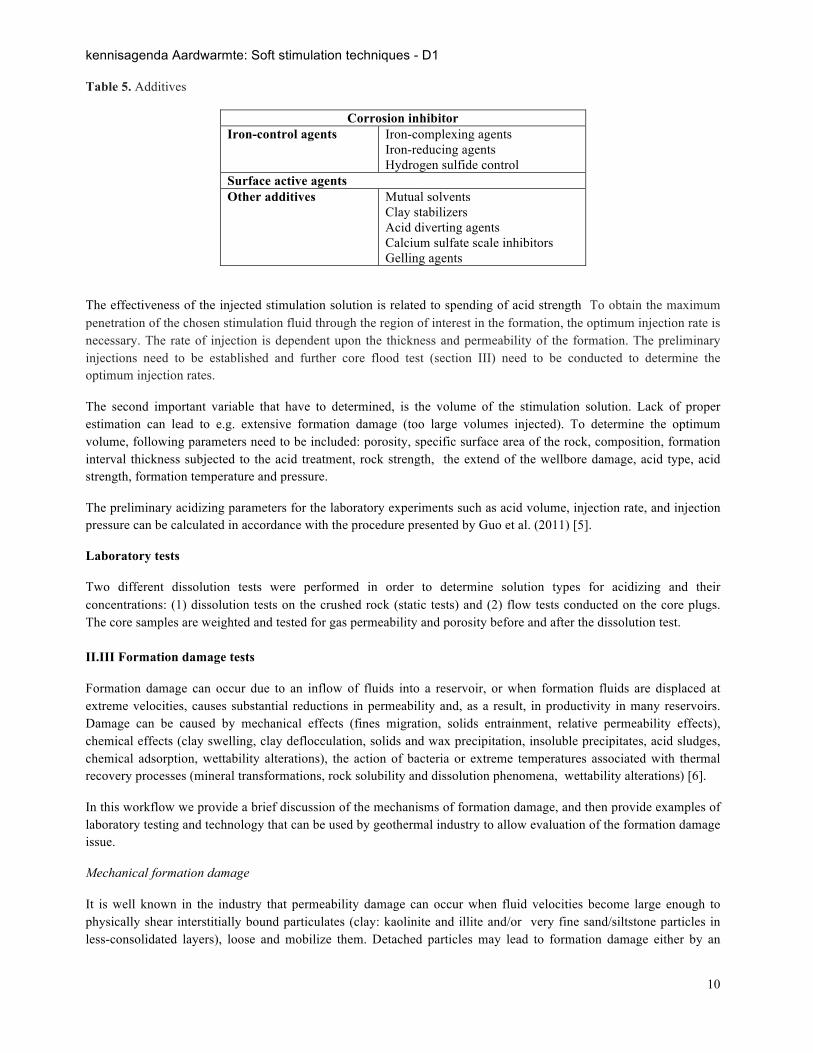
Table 5. Additives
Corrosion inhibitor Iron-control agents
Iron-complexing agents Iron-reducing agents Hydrogen sulfide control
Surface active agents Other additives
Mutual solvents Clay stabilizers Acid diverting agents Calcium sulfate scale inhibitors Gelling agents
The effectiveness of the injected stimulation solution is related to spending of acid strength To obtain the maximum penetration of the chosen stimulation fluid through the region of interest in the formation, the optimum injection rate is necessary. The rate of injection is dependent upon the thickness and permeability of the formation. The preliminary injections need to be established and further core flood test (section III) need to be conducted to determine the optimum injection rates.
The second important variable that have to determined, is the volume of the stimulation solution. Lack of proper estimation can lead to e.g. extensive formation damage (too large volumes injected). To determine the optimum volume, following parameters need to be included: porosity, specific surface area of the rock, composition, formation interval thickness subjected to the acid treatment, rock strength, the extend of the wellbore damage, acid type, acid strength, formation temperature and pressure.
The preliminary acidizing parameters for the laboratory experiments such as acid volume, injection rate, and injection pressure can be calculated in accordance with the procedure presented by Guo et al. (2011) [5].
Laboratory tests
Two different dissolution tests were performed in order to determine solution types for acidizing and their concentrations: (1) dissolution tests on the crushed rock (static tests) and (2) flow tests conducted on the core plugs. The core samples are weighted and tested for gas permeability and porosity before and after the dissolution test. II.III Formation damage tests
Formation damage can occur due to an inflow of fluids into a reservoir, or when formation fluids are displaced at extreme velocities, causes substantial reductions in permeability and, as a result, in productivity in many reservoirs. Damage can be caused by mechanical effects (fines migration, solids entrainment, relative permeability effects), chemical effects (clay swelling, clay deflocculation, solids and wax precipitation, insoluble precipitates, acid sludges, chemical adsorption, wettability alterations), the action of bacteria or extreme temperatures associated with thermal recovery processes (mineral transformations, rock solubility and dissolution phenomena, wettability alterations) [6].
In this workflow we provide a brief discussion of the mechanisms of formation damage, and then provide examples of laboratory testing and technology that can be used by geothermal industry to allow evaluation of the formation damage issue.
Mechanical formation damage
It is well known in the industry that permeability damage can occur when fluid velocities become large enough to physically shear interstitially bound particulates (clay: kaolinite and illite and/or very fine sand/siltstone particles in less-consolidated layers), loose and mobilize them. Detached particles may lead to formation damage either by an

kennisagenda Aardwarmte: Soft stimulation techniques - D1
11
accumulation in the form of a “filter cake” in the injector wells or as a pore bridging in the near-wellbore area of injector or producer. A detailed characterization of mechanical formation damage can be found in the literature [7-14].
Chemically Induced Damage Clay swelling due to cation exchange has a potential to damage formation by reductions in permeability. It occurs as the direct substitution of water into hydratable clays and temperature effects. This damage strongly depends on the type of clay minerals (e.g. smectite) that are present in the sample, that is why the conduction of the mineralogical test in prior to any operations is very important. A detailed discussion on the clay swelling phenomena can be found in Wang [15]. Another process that may have a negative effect on the formation is deflocculation. It occurs as a result of the exchange between sodium ions attached to clays and injected fluids. The ionic charge that binds clays, particulates and pore walls contact is disrupted. As a results the injected fluids are converted into salt water of the corresponding concentrations of present ions. Further exposure to formed low-salinity brine can cause water-sensitive clays to swell and block matrixes.
Laboratory tests
To evaluate the mechanical formation damage a combination of core displacement studies and particle size distribution analyses should be performed. The core flood equipment used for the formation damage tests is illustrated in fig. 6. The core sample which is placed in a PEEK core holder is surrounded by epoxy glue to ensure that no fluid slippage occurs between the rock wall and the core holder.
Fig. 6 Picture of experimental setup for formation damage.

kennisagenda Aardwarmte: Soft stimulation techniques - D1
12
Salinity-related tests These tests provide a compatibility check of injected fluids with the formation mineralogy and build-up knowledge about the reservoir water history to further avoid clay swelling and deflocculating in the reservoir. The tests are started by flooding the test rock with a non-damaging reference fluid in order to establish base line permeability. Subsequently, the injection is switched to the test fluid and a dynamic measurement of the resulting change in permeability is conducted. Critical velocity tests Conducting critical velocity tests provide insights into the reservoir structure. It is further recommended to conduct these test in order to minimize geotechnical damage and/or to avoid fine migration. he purpose of a test is to determine the critical interstitial velocity at which fines migration starts to occur. The results are obtained by displacing an equilibrium fluid (brine) through the plug core sample at increasing flow rates. At higher flow rates, it is advised to eliminate effects of non-Darcy flow due to turbulence by decreasing the injection rate to the initial level. As a result of increasing flow rate, the permeability may either increase or be reduced, depending on the size and quantity of the migrated fines and the pore throat size distribution existing in the reservoir [6]. Additional pH monitoring of the effluents can give an overview of the chemical changes in the investigated sample. The fig. 7 represents an illustration of interstitial velocity vs change in permeability.
Fig. 7 A plot of interstitial velocity vs change in permeability for sample W-1.
II.III Mechanical and Hydro-mechanical tests
II.III.I Mechanical tests
The uniaxial mechanical properties of wet and dry samples (stress-strain behavior) should be examined using the ASTM D2938-95 and D 3148-96 Standard Test Procedure (STP) for the determination of unconfined compressive strength, Young’s modulus and Poisson’s ratio. The samples are loaded until failure while the axial load and vertical and horizontal deformation were monitored. The load was applied with a constant stress rate in between 0.5 and 1Mpa/sec (1% accuracy).
kennisagenda Aardwarmte: Soft stimulation techniques - D1
13
II.III.II Hydro-mechanical tests
In thermal transport for geothermal energy extraction, the mechanical, hydraulic and thermal processes occurring in fractured rocks are equally important. In this context, the rock mechanics aspect is much broader than in its traditional field concerning the stress, deformation, strength and stability of rocks and rock engineering facilities. It involves aspects of the fractured rock masses driven by mechanical, hydraulic and thermal loading mechanisms. The coupling links for the hydro-mechanical mechanisms are the relations between the fracture aperture, rock porosity/permeability, fluid pressure and rock stress. Fracture aperture controls the amount of fluid flowing through a fracture.
The dependency of stress changes on rock permeability is a matter of considerable interest, and several studies, primarily experimental, have been made [16-24]. It was proven that the permeability of a fracture to the flow of fluids decreases with increasing effective confining pressure because of two factors [25]: (1) the aperture decreases and the resistance to flow increases because of the smaller cross-sectional area; (2) the number of points of contact between asperities on the fracture surfaces, and their area, increase and the resistance accordingly because of the longer and more tortuous fluid path. Based on the experimental results, functions relating the hydraulic and mechanical properties of fractures (both depending on a statistical distribution of aperture and a contact area) have been established. Several models of effective confining pressure - permeability relationship have been proposed, including an exponential, a power and a polynomial relationship [17, 20, 21, 24, 26-28]. Moreover, it was stated that the permeability is dependent not only on the current loading condition but also on the stress history within a sedimentary basin. The laboratory results indicate that there is a clear hysteresis effect for the permeability change in the process of releasing a confining pressure [3, 18, 29, 30].
Laboratory tests
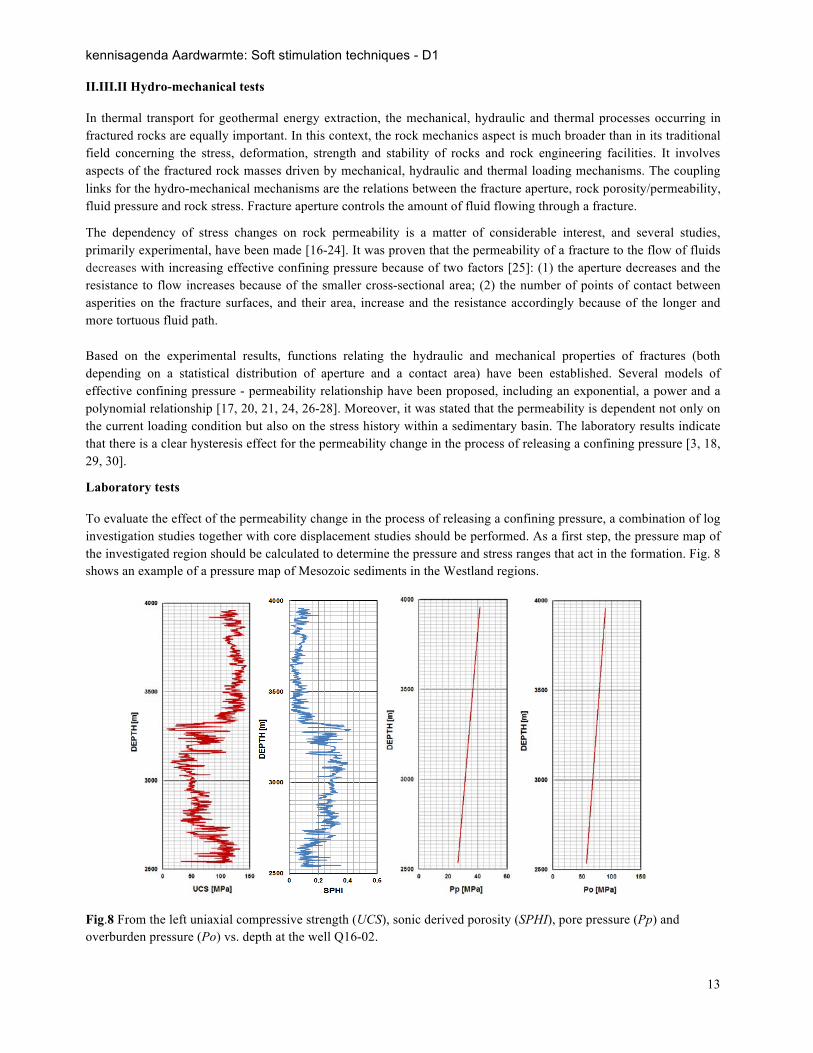
To evaluate the effect of the permeability change in the process of releasing a confining pressure, a combination of log investigation studies together with core displacement studies should be performed. As a first step, the pressure map of the investigated region should be calculated to determine the pressure and stress ranges that act in the formation. Fig. 8 shows an example of a pressure map of Mesozoic sediments in the Westland regions.
Fig.8 From the left uniaxial compressive strength (UCS), sonic derived porosity (SPHI), pore pressure (Pp) and overburden pressure (Po) vs. depth at the well Q16-02.

kennisagenda Aardwarmte: Soft stimulation techniques - D1
14
The response of the fracked sandstones to mechanical compression is studied on pre-fractured samples under various loading conditions by using a laboratory setup as shown in fig. 9. A PEEK cell with an external confining pressure is used to allow determination of the permeability of the samples. The samples are isolated in jackets and compacted by increasing axial and radial stresses. Closure of fractures parallel to the sample axis is monitored by changes in permeability. Permeability is calculated from the differential pressure record between the sample inlet and outlet (DP) using the steady state flow method. Fig. 10 represents an illustration of a plot permeability vs. effective confining pressure
Fig. 9 The experimental cell for permeability tests under various load conditions and the typical sample for the test.
Fig. 10 Permeability vs. effective confining pressure plot
III. MAIN LABORATORY TESTS
III.I MARIX ACIDIZING
Proper design of the acid treatment, use of adequate pre-flush, and carefully chosen additives and diverting agents (see section II) can help to the desired permeability improvement together with formation damage prevention.
General matrix acidizing procedures include the following stages:
-‐ Cutting and preparation of core samples (see section I); -‐ Assembling of core samples into rubber sleeve and further in the core holder adjusting inlet and outlet face; -‐ In the case of separate confining pressure: pressurize the rubber sleeve;

kennisagenda Aardwarmte: Soft stimulation techniques - D1
15
-‐ Core characterizations (porosity and permeability) with 3D scan X-ray technics applied in prior to injection (optional: tracer penetration tests); if possible, analysis of the samples with CT-scan equipment to determine their degree of heterogeneities and initial pore distribution;
-‐ Saturation of core samples with brine; -‐ Pre-flush; -‐ Main flush; -‐ Over flush; -‐ Core characterizations (porosity and permeability) with 3D scan X-ray technics applied in prior to injection
(optional: tracer penetration tests); -‐ Effluent monitoring and characterization (CP, density, viscosity).
Pre-flush is a fluid stage pumped ahead of the main treating fluid. The main aim of the pre-flush is to displace the formation brines that usually contain Na, Ca or K ions. These ions when in contact with HF result in the formation of alkali-fluosilicates. Another important function of the pre-flush is to dissolve calcareous materials prior to the injection of the HF acid to minimize calcium fluoride precipitation [1].
Main flush is the treatment stage that injects the mud acid to remove the formation damage or to enhance permeability in the formation.
Over flush is an important part of a sandstone acid treatment and it is mainly used for displacing the non-reacted acid into the formation, displace the reaction products away from the wellbore and finally remove the oil-wet relative permeability problems caused by some corrosion inhibitors.
Tracer tests vs. CT imaging. The most efficient way to determine the degree of heterogeneities in investigated samples and to establish the initial pore distribution is the use of the CT-Scan equipment. Alternatives, in the case of lack of an appropriate equipment are tracer tests. They involve injection of a chemical tracer into a porous system and monitoring its recovery, through time. However, the tracers selected needs to meet a flowing requirements: (1) should not be present in the reservoir; (2) should not react with reservoir rocks; (3) should be thermally stable at reservoir conditions; (4) should be relatively inexpensive and handy to analyses.
Laboratory setup
The apparatus has been designed to be safe and easily operable, with the purpose of displacing diverse types of acid at different conditions (fig.11); the operation procedure will be detailed. The experimental measured data are to be processed and interpreted; detailed procedures are to be developed for each experiment stage. The equipment and instruments specifications are to be listed.

kennisagenda Aardwarmte: Soft stimulation techniques - D1
16
Fig. 11 Experimental setup for acid injection tests
Output
In sandstone cores the main result is the acid response curve in terms of pressure drop or permeability vs. time or amount of injected acid (pore-volume); it shows the permeability behavior as the acidizing process take place.
III.II POSSIBLE CHALLENGES IN THE LABORATORY ACID INJECTIONS
III.II.I APPARENT CO2 DAMAGE IN CORES AT THE BEGINNING OF THE INJECTION Many sandstones contain various amounts of carbonate minerals. As a results of contact with acid, carbonate minerals react and CO2 and salt are produced. The released CO2 in a gaseous phase within the pore structure will cause an apparent sample damaged. However, this phenomenon is not true damage because the absolute permeability of the rock is not decreased. Instead, the development of a CO2 gas saturation temporarily lowers the relative permeability of the aqueous phase. Laboratory solution is to dissolve the created gas at the specific solubility P,T level. IV. NUMERICAL ANALYSIS
The modelling is done by populating the model with near wellbore data obtained either from the well logs or data populating software such as FLUME. The acid composition which is determined from mineralogy and rock composition studies is added in the model. Once we have these two major steps done, the acid-rock interaction can be modelled by focusing on the most important reactions taking place in the reservoir. This is followed by using the acid-rock interaction to implement changes in permeability and porosity which would result in the formation or wormholes or the dissolution of rock particles. This would give a basic idea of the permeability increase expected from the amount of acid injected.
V. RECOMMENDATIONS
Sampling: For all types of the heterogeneous reservoirs it is strongly recommended to obtain the sampling material from the reservoirs where the geothermal activities are planned. Moreover, the larger quantity of samples the higher the accuracy and precision of the estimates.

kennisagenda Aardwarmte: Soft stimulation techniques - D1
17
Optimum injection rate. To avoid damage of the formation the applied injection rate should be lower than the critical velocity that can be tested in the laboratory. It is advised to use in the laboratory tests the planed pump rates. For the fractured rocks, the injection rate may vary from low to high and is dependent on the purpose and scale of acid penetration. A combination of different flow rates is recommended for optimal usage.
Selection of the chemical agent. First step is the detail knowledge about the type, geometry and composition of the fracture and filling materials. In the case of the formation damaged, history of applied operations in the well area is necessary. Secondly, the proper agent is selected based on the existing guidelines taking into consideration all possible side effects (i.e. reactions, precipitates ect) of applied fluid. And finally the dissolution tests are conducted is the material is available.
Advise on the necessary and alternative steps in the laboratory procedure. It is advised to conduct following tests as a must: critical velocity test, salinity tests, dissolution tests, corrosion tests. Above those, to improve the knowledge about formation additional tests (optional) can be conducted: strength measurements and hydro-mechanical tests (manly for fractured rocks).
4. CONCLUSONS
We strongly recommend that it is necessary to conduct the experimental research together with accurate numerical simulation that can answer how the long-term geochemical reactions affect the rock mechanics during acid gas injection and can help to determine the relative improvement of infectivity index and productivity index. The advised tests give information not only about the general effectiveness of the acid on the rock, but provide detailed information about the volume needed, the concentrations and the injection rates. Reproduction, to maximum possible extend, of the characteristics of the treatments in field conditions reduce the risks associated with subsurface injection and help to avoid potential side issues (formation damage).
5. Acknowledgments
The authors would like to thank the members of the Project Advisory Group for their contribution to the development of this report. The authors also thank EZ, LTO Glaskracht Nederland and het programma Kas als Energiebron for financial support of this project.
6. REFERENCES
1. Kalfayan, L., Production enhancement with acid stimulation. 2008: Pennwell Books. 2. Portier, S., L. André, and F.-D. Vuataz, Review on chemical stimulation techniques in oil industry and
applications to geothermal systems. Engine, work package, 2007. 4: p. 32. 3. S., N. and V. J.M., Using basin modeling for geothermal energy exploration in the Netherlands - an example
from the West Netherlands Basin and Roer Valley Graben. 2012. 4. Economides, M.J. and K.G. Nolte, Reservoir stimulation. Vol. 18. 2000: Wiley Chichester. 5. Guo, B., P.D.P.E. William C. Lyons, and A. Ghalambor, Petroleum Production Engineering, A Computer-
Assisted Approach. 2011: Elsevier Science. 6. Bennion, D.B., F. Thomas, and D. Bennion. Effective Laboratory Coreflood Tests to Evaluate and Minimize
Formation Damage in Horizontal Wells. in 3rd International Conference on Horizontal Well Technology, Houston, Texas, Nov 12. 1991.
7. Gabriel, G. and G. Inamdar. An experimental investigation of fines migration in porous media. in SPE Annual Technical Conference and Exhibition. 1983. Society of Petroleum Engineers.
8. Gray, D. and R. Rex. Formation damage in sandstones caused by clay dispersion and migration. in Proc. 1965.
9. Gruesbeck, C. and R. Collins, Entrainment and deposition of fine particles in porous media. Society of Petroleum Engineers Journal, 1982. 22(06): p. 847-856.

kennisagenda Aardwarmte: Soft stimulation techniques - D1
18
10. Krueger, R.F. An overview of formation damage and well productivity in oilfield operations: An update. in SPE California Regional Meeting. 1988. Society of Petroleum Engineers.
11. Muecke, T.W., Formation fines and factors controlling their movement in porous media. Journal of Petroleum Technology, 1979. 31(02): p. 144-150.
12. Mungan, N., Permeability reduction through changes in pH and salinity. Journal of Petroleum Technology, 1965. 17(12): p. 1,449-1,453.
13. Porter, K.E., An Overview of Formation Damage (includes associated paper 20014). Journal of Petroleum Technology, 1989. 41(08): p. 780-786.
14. Selby, R.J. and S. Ali, Mechanics of sand production and the flow of fines in porous media. Journal of Canadian Petroleum Technology, 1988. 27(03).
15. Wang, F., Effect of wettability alteration on water/oil relative permeability, dispersion, and flowable saturation in porous media. SPE reservoir engineering, 1988. 3(02): p. 617-628.
16. Bolton, A., Some measurements of permeability and effective stress on a heterogeneous soil mixture: implications for recovery of inelastic strains. Engineering geology, 2000. 57(1): p. 95-104.
17. David, C., et al., Laboratory measurement of compaction-induced permeability change in porous rocks: Implications for the generation and maintenance of pore pressure excess in the crust. pure and applied geophysics, 1994. 143(1): p. 425-456.
18. Dong, J.-J., et al., Stress-dependence of the permeability and porosity of sandstone and shale from TCDP Hole-A. International Journal of Rock Mechanics and Mining Sciences, 2010. 47(7): p. 1141-1157.
19. Gavrilenko, P. and Y. Gueguen, Pressure dependence of permeability: a model for cracked rocks. Geophysical Journal International, 1989. 98(1): p. 159-172.
20. Jasinge, D., P. Ranjith, and S.-K. Choi, Effects of effective stress changes on permeability of latrobe valley brown coal. Fuel, 2011. 90(3): p. 1292-1300.
21. Jobmann, M., T. Wilsnack, and H.-D. Voigt, Investigation of damage-induced permeability of Opalinus clay. International Journal of Rock Mechanics and Mining Sciences, 2010. 47(2): p. 279-285.
22. Okazaki, K., et al., Permeability, porosity and pore geometry evolution during compaction of Neogene sedimentary rocks. Journal of Structural Geology, 2014. 62: p. 1-12.
23. Peng, Y., et al., Experimental research on sensibility of permeability of coal samples under confining pressure status based on scale effect. Journal of China Coal Society, 2008. 33(5): p. 509-513.
24. Zisser, N. and G. Nover, Anisotropy of permeability and complex resistivity of tight sandstones subjected to hydrostatic pressure. Journal of Applied Geophysics, 2009. 68(3): p. 356-370.
25. Walsh, J. Effect of pore pressure and confining pressure on fracture permeability. in International Journal of Rock Mechanics and Mining Sciences & Geomechanics Abstracts. 1981. Elsevier.
26. Evans, J.P., C.B. Forster, and J.V. Goddard, Permeability of fault-related rocks, and implications for hydraulic structure of fault zones. Journal of Structural Geology, 1997. 19(11): p. 1393-1404.
27. Gangi, A.F. Variation of whole and fractured porous rock permeability with confining pressure. in International Journal of Rock Mechanics and Mining Sciences & Geomechanics Abstracts. 1978. Elsevier.
28. Meng, Z. and G. Li, Experimental research on the permeability of high-rank coal under a varying stress and its influencing factors. Engineering Geology, 2013. 162: p. 108-117.
29. Darot, M. and T. Reuschlé, Acoustic wave velocity and permeability evolution during pressure cycles on a thermally cracked granite. International Journal of Rock Mechanics and Mining Sciences, 2000. 37(7): p. 1019-1026.
30. Yulong, H. and Y. Lizhong, Testing study on variational characteristics of rockmass permeability under loading-unloading of confining pressure. Chinese Journal of Rock Mechanics and Engineering, 2004. 23(3): p. 415-419.