I.T. RATE METHODOLOGY REASONABLE BUT CHARGES INADEQUATELY ...
36
I.T. RATE METHODOLOGY REASONABLE BUT CHARGES INADEQUATELY EXPLAINED A REPORT FROM THE CITY AUDITOR July 2005 Office of the City Auditor Portland, Oregon
Transcript of I.T. RATE METHODOLOGY REASONABLE BUT CHARGES INADEQUATELY ...

I.T. RATE METHODOLOGY REASONABLE BUT CHARGES INADEQUATELY EXPLAINED
A REPORT FROM THE CITY AUDITORJuly 2005
Office of the City AuditorPortland, Oregon

CITY OF
PORTLAND, OREGONOFFICE OF THE CITY AUDITOR
Audit Services Division
Gary Blackmer, City AuditorDrummond Kahn, Director of Audit Services
1221 S.W. 4th Avenue, Room 310Portland, Oregon 97204
(503) 823-4005 FAX (503) 823-4459 www.portlandonline.com/auditor/auditservices
July 28, 2005
TO: Tom Potter, MayorSam Adams, CommissionerRandy Leonard, CommissionerDan Saltzman, CommissionerErik Sten, CommissionerTim Grewe, Chief Administrative OfficerTom Feely, Senior Business Operations ManagerMatthew Lampe, Chief Technology Officer
SUBJECT: Audit of the I.T. Rate Methodology, Report #314
Attached is Report #314 containing the results of our audit of the Information Technology rate methodology. The audit was included in our annual audit schedule and was conducted in accordance with generally accepted government auditing standards.
As a follow-up to our recommendations, we ask that the Chief Administrative Officer, working with the Office of Management and Finance Business Operations and the Bureau of Information Technology, prepare a status report in one year, detailing steps taken to address the report recommendations. This status report should be submitted to the Audit Services Division and coordinated through the Commissioner in Charge’s office.
We appreciate the cooperation and assistance we received from personnel in OMF Business Operations and the Bureau of Technology Services as we conducted this audit.
GARY BLACKMER Audit Team: Drummond KahnCity Auditor Sharon Meross
Attachment


Table of Contents
Summary. . . . . . . . . . . . . . . . . . . . . . . . . . . . . . . . . . . . . . . . . . . . . . . . . . . . . . . . . . . . . . . . . 1
Scope and methodology . . . . . . . . . . . . . . . . . . . . . . . . . . . . . . . . . . . . . . . . . . . . . . 2
Background . . . . . . . . . . . . . . . . . . . . . . . . . . . . . . . . . . . . . . . . . . . . . . . . . . . . . . . . . . . . . 3
AUDIT RESULTS
Lack of sufficient information contributes to customer dissatisfaction with rates . . . . . . . . . . . . . . . . . . . . . . . . . . . . . . . . . . . . . . . . . . . 7
Customers need to know BTS costs on unit charged items . . . 8
Service Level Agreements need to be improved . . . . . . . . . . . . . . . . 9
Overall, revenues align reasonably well with costs . . . . . . . . . . . . 10
Overall, the allocations of services appear reasonable . . . . . . . . 10
More detailed approaches to rate models are based on usage and types of activities performed . . . . . . . . . . . . . . . . . . . . 12
Portland’s IT budget and staffing is in line with other cities’ IT budgets . . . . . . . . . . . . . . . . . . . . . . . . . . . . . . . . . . . . . . . . . . . . . . . . . . . . 13
Recommendations . . . . . . . . . . . . . . . . . . . . . . . . . . . . . . . . . . . . . . . . . . . . . . . . . 14
APPENDICES
A Simplified BTS rate model
B Methods for assigning costs to bureaus
C Survey of other cities’ information technology departments
RESPONSE TO THE AUDIT
Tim Grewe, Chief Administrative Officer
Matthew Lampe, Chief Technology Officer

I.T. RATE METHODOLOGY REASONABLEBUT CHARGES INADEQUATELY EXPLAINED
A REPORT FROM THE CITY AUDITOR
July 2005
Office of the City AuditorPortland, Oregon
Production/DesignThis report was produced in-house using desktop publishing software on Pentium 4 personal
computers, and a Hewlett Packard Laserjet PCL/Postscript laser printer. It was printed at the
Printing and Distribution Division of the City’s Bureau of General Services. Adobe InDesign CS
PageMaker version was used to design and layout the finished product. Tables were created
in InDesign. Some text was initially written in Microsoft Word, then imported into InDesign for
formatting and layout.

1
Summary The rates charged to City bureaus for information technology (IT) services reflect the Bureau of Technology Services (BTS) costs for most items. However, communication of costs and IT activities performed must be made clearer to BTS customers, and improvements in the rate model can be made.
BTS charges City bureaus for computer services, software application development and related technical services. Most of BTS costs are re-covered from the bureaus. Rates for services are determined through what is commonly referred to as “the rate model”. Our objective was to determine whether the method used to establish rates and recover costs from BTS customers is reasonable and represents BTS costs for each rate item. This audit report is directed to the Bureau of Tech-nology Services (BTS) and Business Operations within the Office of Management and Finance because Business Operations administers the rate model, and played a large role in its development. This re-port does not address customer satisfaction with BTS service delivery. This report may also help address Recommendation #4 in the Mayor’s Bureau Innovation Project: “Implement Cost Efficiencies and Customer Improvements within the Office of Management and Finance.”
This audit is the first in a two-part series on the Bureau of Technology Services and information technology. The second forthcoming report will discuss Best Practices for Information Technology Governance.
I.T. rate methodology reasonable but charges inadequately explained

2
I.T. rate methodology reasonable but charges inadequately explained
Our primary objective was to determine if the method used to charge BTS customers for technical services was reasonable and accurately represented costs. To do this, we reviewed documents and inter-viewed Business Operations staff to determine how the current rate model was developed.
For our financial analysis of BTS revenues and costs, we used financial data and allocated these data using Business Operations’ cost alloca-tion method shown in Appendix A (i.e. the “rate model.”) Our analysis used the following financial data to determine costs and revenues: FY 2003-04 is actual year end data; FY 2004-05 is projected from AP 9 to the end of the fiscal year; FY 2005-06 is based on the Adopted Budget. To calculate costs for unit-based charges, we divided costs by BTS computer inventories. Because computer inventories change over the year as users are added and removed, we used the average of two-year inventories.
We did not verify that staff tracked its hours correctly, or that costs were coded correctly when entered into the City’s financial system, or that computing asset inventories were accurate.
We conducted focus groups that included managers of City bureaus, and BTS customer service representatives. We also reviewed literature on methods used to recover IT related costs. We also surveyed four other cities on information technology budgets and cost recovery methods.
We did not review the cost-effectiveness of BTS services or perform a market rate comparison of BTS rates. The Communications and Net-working (ComNet) services are not included in our review.
Three appendices are included in this report to provide more in-formation on the rate model (Appendix A), how BTS assigns costs to bureaus (Appendix B), and the results of our other city survey (Appendix C).
Scope and methodology

3
Background
Finally, during the course of our audit, we noted some issues related to BTS fund reserves which we discussed with Business Operations and BTS management.
We conducted our work in accordance with generally accepted gov-ernment auditing standards.
Centralization of many City internal services, including Information Technology, began in FY 2001-02. Currently, the transfer of infor-mation technology staff from individual bureaus to the centralized Bureau of Technology Services (housed in the Office of Management and Finance) is almost complete. Operational functions have been centralized, and for most bureaus, application development is also centralized.
Prior to centralization, attempts were made to improve how rates for IT services were developed. With complete centralization, a new rate model was needed. In FY 2003-04, Business Operations implemented a new model. Business Operations staff created the rate model, work-ing with staff from Information Technology and several other bureaus to identify significant work areas and cost centers. From this work the current rate categories were created, costs were determined, and service rates were established.
The information technology service area of BTS is organized into four programs: Customer Service, Operations, Strategic Technology and Information Security. The Administrative / Contract Management pro-gram supports both the information technology and ComNet areas. A portion of this department is allocated to the information technology rates. Figure 1 shows the organization and number of positions for the information technology services area of BTS.

4
I.T. rate methodology reasonable but charges inadequately explained
Figure 1
CUSTOMER SERVICE(7)
OPERATIONS (82)
STRATEGIC TECHNOLOGY (46)
Corporate TechnologyWeb servicesApplication servicesMainframe servicesData managementProject management
CHIEF TECHNOLOGY OFFICER (1)
COMNET (not covered in this audit)
ADMINISTRATION & CONTRACT MANAGEMENT (4)
INFORMATION SECURITY (2)
Bureau TechnologyApplicationsFireBOEC
HelpDesk
Technical Support PurchasingEquipmentSeven site- specific
technical teams
Technical Services Data centerResearch, Test &
MeasurementPlanningDesktop ServicesEngineering &
Deployment
Bureau Business Representatives
Source: Auditor summary of organizational charts received from BTS and personal services worksheets from Business Operations prepared for the FY 2005-06 Requested Budget. Does not include add or cut packages included in the FY 2005-06 Adopted Budget.
BTS organizational chart showing information technology services and number of positions

5
A bureau’s total costs for IT services is largely driven by the num-ber of computers, servers and processors owned, and if it has BTS staff dedicated to its bureau. For the Police Bureau and the Office of Management and Finance, the Enterprise Server also contributes significant costs. Services that contribute to the City as a whole, such as E-Government and IT Strategic Planning, are allocated based on a bureau’s portion of the previous year’s IT budget.
BTS costs are primarily from employee salaries. Over forty center codes are used to track costs. Some of these center codes represent staff time and, materials and services spent directly on a rate item. Other centers represent administrative, managerial or direct work that is allocated to the rate item. Appendix A shows a simplified rate model using adopted FY 2005-06 costs to illustrate how costs are allocated to the rate items.
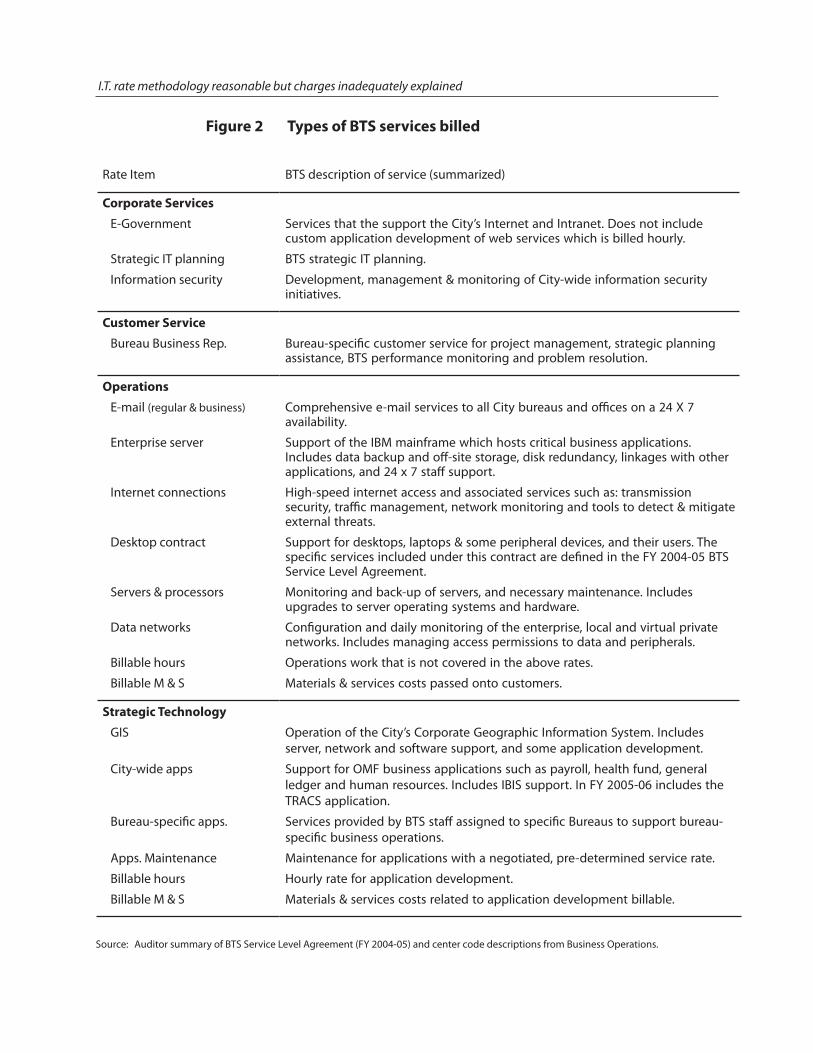
Except for services that support City-wide and BTS-wide functions, rate items reflect work performed within BTS programs. The rate items are described in Figure 2. Not all bureaus receive every ser-vice or are charged for every service. For more information on how charges for these services are assigned to the bureaus for cost recov-ery, see Appendix B.
6
I.T. rate methodology reasonable but charges inadequately explained
Rate Item BTS description of service (summarized)
Corporate Services
E-Government Services that the support the City’s Internet and Intranet. Does not include custom application development of web services which is billed hourly.
Strategic IT planning BTS strategic IT planning.
Information security Development, management & monitoring of City-wide information security initiatives.
Customer Service
Bureau Business Rep. Bureau-specific customer service for project management, strategic planning assistance, BTS performance monitoring and problem resolution.
Operations
E-mail (regular & business) Comprehensive e-mail services to all City bureaus and offices on a 24 X 7 availability.
Enterprise server Support of the IBM mainframe which hosts critical business applications. Includes data backup and off-site storage, disk redundancy, linkages with other applications, and 24 x 7 staff support.
Internet connections High-speed internet access and associated services such as: transmission security, traffic management, network monitoring and tools to detect & mitigate external threats.
Desktop contract Support for desktops, laptops & some peripheral devices, and their users. The specific services included under this contract are defined in the FY 2004-05 BTS Service Level Agreement.
Servers & processors Monitoring and back-up of servers, and necessary maintenance. Includes upgrades to server operating systems and hardware.
Data networks Configuration and daily monitoring of the enterprise, local and virtual private networks. Includes managing access permissions to data and peripherals.
Billable hours Operations work that is not covered in the above rates.
Billable M & S Materials & services costs passed onto customers.
Strategic Technology
GIS Operation of the City’s Corporate Geographic Information System. Includes server, network and software support, and some application development.
City-wide apps Support for OMF business applications such as payroll, health fund, general ledger and human resources. Includes IBIS support. In FY 2005-06 includes the TRACS application.
Bureau-specific apps. Services provided by BTS staff assigned to specific Bureaus to support bureau-specific business operations.
Apps. Maintenance Maintenance for applications with a negotiated, pre-determined service rate.
Billable hours Hourly rate for application development.
Billable M & S Materials & services costs related to application development billable.
Figure 2
Source: Auditor summary of BTS Service Level Agreement (FY 2004-05) and center code descriptions from Business Operations.
Types of BTS services billed
7
In our focus groups with bureau managers and BTS Bureau Business Representatives, we consistently heard a lack of understanding of how the rate model works, how rates are developed, and BTS actual costs for services. Despite Business Operations’ efforts to explain rates and costs through annual rate workshops and other invitations to bureau management, we believe that more information about rates and costs is needed. We believe that better information from Business Operations to BTS and to BTS customers about the rate model and BTS costs could help mitigate misconceptions and anxieties about rates.
In addition to information on the rate model and costs, all bureau managers involved in IT need summarized information on the type of work performed, and how service requests are generated (i.e. bureau staff or manager, or BTS). Managers want information for their bu-reaus such as the number of HelpDesk calls and server maintenance activities. In our focus groups with City bureau managers, we heard that despite repeated requests, managers are unable to obtain this information. However, we found that this information is available through BTS billing and HelpDesk tracking systems. More information on usage statistics and costs can help BTS and the bureaus better plan their information technology needs and identify problem areas. Additionally, analyzing bureau-specific statistics about work per-formed could help BTS determine if unit-based services represent a reasonably equal level of service among the bureaus.
Lack of sufficient information
contributes to customer dissatisfaction with rates
8
I.T. rate methodology reasonable but charges inadequately explained
In our focus groups, bureau managers said that they wanted to know BTS costs for unit-based services such as desktop support and e-mail accounts. Figure 3 shows the auditor’s calculations of costs for unit-based items. Costs for each unit include direct and allocated costs that we calculated using the rate model shown in Appendix A.
Note that a large variance exists in the Operations hourly billable comparison. The rate charged is much higher than the auditor’s calculated costs because the rate method does not include over-head allocations to this item. We understand that overhead costs are recovered in the hourly rate charged. However, the missing overhead allocation impeded us from comparing the true costs of this service to the rates charged. Business Operations should correct its allocation method so that the basis for the rate charged is clearly represented in the rate method.
One specific concern we heard in our focus groups was that BTS was billing customers twice by using hourly billings for services for which customers had already pre-paid in unit-based rates. We con-cluded and Business Operations agrees, that in FY 2003-04, some bureaus were billed on an hourly basis for services that bureaus initially thought would be covered in the pre-paid rates. This oc-curred because BTS had not anticipated the different types and levels of services required among the bureaus. Consequently, BTS decided to bill for some services in an effort to provide a consistent level of service within the pre-paid rates to all bureaus. As shown in Figure 3, Business Operations corrected for “reductions” in service coverage the following year by reducing rates on e-mail, servers, processors and networks. Services that were no longer covered in the pre-paid contract rates were billed on an hourly basis.
By comparing and reporting the rates charged to the costs of those services (calculated using Business Operations rate methodology), we hope that this report provides summary information that can be used for discussions on the rates, costs, and cost allocation method. We provided Business Operations with an easy-to-use spreadsheet that calculates fully loaded costs by rate item, and creates a summary of BTS costs and allocation percentages. We hope Business Operations and BTS will use and improve on this communication tool for subse-quent discussions about rates.
Customers need to know BTS costs on unit
charged items

9
Figure 3
Source: Auditor analysis of CARS and Business Operations financial data using rate methodology. Costs shown in Figure were divided by unit data provided by Business Operations.
FY 2003-04 (actual) FY 2004-05 (projected) FY 2005-06 (adopted)
% % % RATE COST var. RATE COST var. RATE COST var.
E-mail (per account)
Regular $111 $91 +22% $98 $94 +4% $109 $101 +9%Business $54 $44 +22% $47 $45 +4% $42 $47 -10%
Internet (per domain account) $118 $128 -7% $141 $139 +2% $145 $144 +1%
Desktops & laptops (each) $713 $797 -10% $803 $848 -5% $891 $847 +5%
Servers (each) $2,848 $2,197 +30% $2,459 $2,002 +23% $2,351 $2,359 0%
Processors (each) $1,424 $1,099 +30% $1,230 $1,001 +23% $1,175 $1,179 0%
Data networks (see internet) $226 $210 +8% $204 $240 -15% $217 $281 -23%
Operations billable (per hour) $77 $48 +62% $80 $44 +83% $83 $57 +46%
Strat. Tech. billable (per hour) $77 $65 +19% $80 $81 -2% $83 $53 +55%
Comparison of unit costs and rates: FY 2003-04 to FY 2005-06
BTS told us that it has requested customer input on and made im-provements to the BTS Service Level Agreement (SLA). Despite these efforts, we noted that the SLA is approved very late in the fiscal year, is difficult to read, contains program information that may be better suited to other documents, does not clearly link service objectives and levels with the rates, and does not identify BTS’ responsibility if serious service delivery problems occur. In our literature review about SLAs, we noted that three components which are considered essen-tial in SLAs were lacking from the BTS SLA. These are nonperformance clauses, provisions for monitoring and reporting the service provider’s performance, and formal approvals of the SLA. Additionally, we noted that some services described in the SLA do not align with the BTS rate structure. Finally, we believe that the SLA language is inconsis-tent and that some areas are overly technical while other areas are too general. These inconsistencies can impede the primary objective of the SLA which is to create a common understanding between the provider and customer of the nature and level of service required.
Service level agreements need
to be improved

10
I.T. rate methodology reasonable but charges inadequately explained
From our review of financial data and the BTS rate model, we found that revenues received for each rate item align reasonably well with costs, although we noted some large revenue to cost variations in some rate items in FY 2003-04 and FY 2004-05. While draft financial policies do not require that costs and revenues are equal for each rate item, we did find that Business Operations reviews BTS costs and projected revenues during budget preparation. Business Operations’ review is to ensure that rates do not exceed inflationary limits, and to ensure that rates and costs align reasonably well. We also note that Business Operations has made corrections to rates in order to smooth-out variances, and monitors costs and revenues at the pro-gram level throughout the fiscal year. Figure 4 shows the auditor’s calculations for revenues and costs by rate item for the three year period FY 2003-04 through FY 2005-06.
As the rate model is relatively new, Business Operations needs to continue to monitor the variances in the rate items during budget preparation to ensure that rates are reasonable. If there is sound rationale for maintaining large variances in the rate items, Business Operations should disclose the variances and the rationale for main-taining them. If Business Operations discovers significant variations during its revenue and expenditure monitoring, it should perform an analysis of how the cost of the rate items are impacted. Such an analysis could provide an indication of forthcoming rate changes in the next fiscal year.
The allocations of BTS HelpDesk, and administrative and managerial services to the rate items appear reasonable among the rate items. However, we did not verify how well each allocation percentage matches actual time spent or costs incurred in each service area. Such an analysis would require more detail on the work performed by BTS administrative and managerial staff. Additionally, we recog-nize that models represent best estimates of where administrative and managerial time is spent. As noted on page 8, allocations of overhead should be represented in the model so that the full costs of Operations hourly billable is represented. Finally, several improve-
Overall, the allocations of services appear
reasonable
Overall, revenues align reasonably well
with costs

11 1 Va
rianc
es in
GIS
are
ant
icip
ated
as
per
the
GIS
fina
ncia
l pla
n. Y
ears
with
larg
e de
bt
pay
men
ts m
ay s
how
cos
ts e
xcee
ding
rev
enue
s. A
ll de
bt
pay
men
ts fo
r FY
200
4-05
may
not
be
incl
uded
in t
he p
roje
cted
FY
2004
-05
figur
e.2
In F
Y 20
03-0
4, s
trat
egic
tec
hnol
ogy
bill
able
mat
eria
ls a
nd s
ervi
ces
reve
nue
incl
udes
$0.
5 m
illio
n th
at w
as “p
re-b
illed
” to
OM
F fo
r ap
plic
a-tio
n de
velo
pm
ent.
The
fund
s ar
e cu
rren
tly
in t
he B
TS r
eser
ve b
alan
ce.
Figure 4
Source: Expenditure and revenue data extracted from CARS or provided by OMF Business Operations. FY 2003-04 is actual; FY 2004-05 is projected from AP 9, and FY 2005-06 is from Adopted Budget spreadsheets.
BTS revenues and cost by rate item, FY 2003-04 through FY 2005-06
FY
200
3-04
(act
ual)
FY 2
004-
05 (p
roje
cted
) FY
200
5-06
(ado
pte
d)
Re
venu
es
Reve
nues
Re
venu
es
REV
ENU
ES
CO
STS
- co
sts
REV
ENU
ES
CO
STS
- co
sts
REV
ENU
ES
CO
STS
- co
sts
Corp
orat
e Se
rvic
esE-
Gov
ernm
ent
$515
,757
$5
88,6
28
$3
21,3
37
$621
,847
$342
,899
$4
03,7
21St
rate
gic
IT p
lann
ing
$171
,820
$1
42,0
25
$1
71,9
20
$132
,737
$134
,971
$1
08,5
71
Info
rmat
ion
secu
rity
$454
,431
$2
98,7
42
$2
64,2
72
$192
,996
$334
,405
$3
92,4
76
SUBT
OTA
L $1
,142
,008
$1
,029
,396
+
$112
,612
$7
57,5
29
$947
,580
-$
190,
051
$812
,275
$9
04,7
68
-$92
,493
C
ust
om
er S
ervi
ce
Bure
au B
usin
ess
Rep.
$7
13,1
28
$539
,043
+
$174
,085
$5
77,3
02
$509
,202
+
$68,
100
$554
,202
$7
95,9
63
-$24
1,76
1
Ente
rpri
se
Bu
sin
ess
Syst
em
- -
- -
- -
$4,3
30,4
30
$4,3
30,4
30
$0
Op
erat
ion
sE-
mai
l con
trac
t $5
36,2
47
$431
,040
$500
,629
$4
58,8
75
$5
39,0
26
$491
,603
En
terp
rise
serv
er
$1,3
57,2
18
$1,7
08,6
06
$1
,918
,226
$2
,057
,298
$1,9
14,0
33
$2,0
02,1
33
Inte
rnet
acc
ess
$594
,139
$6
44,4
59
$7
15,8
54
$691
,495
$726
,984
$6
77,5
98
Des
ktop
con
trac
t $3
,213
,919
$3
,631
,468
$3,6
40,9
15
$3,8
03,5
43
$3
,840
,961
$3
,675
,705
Se
rver
s co
ntra
ct
$1,2
76,4
03
$968
,936
$1,1
16,9
23
$900
,909
$1,0
55,6
35
$1,0
28,3
15
Net
wor
ks c
ontr
act
$1,1
37,3
29
$1,0
62,1
22
$1
,040
,255
$1
,192
,579
$1,1
00,4
16
$1,3
26,3
21
Billa
ble
$2
56,5
99
$157
,984
$338
,577
$1
85,0
00
$1
,078
,311
$7
39,3
08
Billa
ble
M &
S
$1,0
10,3
25
$1,0
10,3
25
$1
,059
,432
$1
,059
,432
$2,7
10,1
20
$2,7
10,1
20
SUBT
OTA
L $9
,382
,180
$9
,614
,939
-$
232,
760
$10,
330,
811
$10,
349,
132
-$18
,321
$1
2,96
5,48
6 $1
2,65
1,10
2 +
$314
,384
Stra
teg
ic T
ech
no
log
y
GIS
1 $2
,515
,403
$3
,056
,259
$2,0
13,1
31
$1,4
14,7
64
$2
,626
,823
$2
,862
,161
C
ity-
wid
e ap
ps.
$2
,417
,955
$1
,688
,099
$1,3
40,5
56
$2,2
81,1
50
$1
,929
,228
$1
,883
,530
Bu
reau
-sp
ecifi
c ap
ps.
$2
,084
,390
$2
,024
,154
$2,1
82,0
10
$2,1
75,9
04
$2
,893
,032
$2
,677
,013
A
pp
s. m
aint
enan
ce
$0
$18,
738
$5
9,26
8 $1
7,36
8
$71,
937
$22,
931
Billa
ble
$7
38,8
07
$619
,765
$647
,193
$6
60,5
02
$1
,117
,044
$7
19,9
13
Billa
ble
M &
S 2
$771
,736
$2
71,7
36
$2
79,1
15
$279
,115
$45,
725
$45,
725
SUBT
OTA
L $8
,528
,292
$7
,678
,751
+
$849
,541
$6
,521
,273
$6
,828
,802
-$
307,
530
$8,6
83,7
89
$8,2
11,2
73
+$4
72,5
16
TO
TAL
$19,
765,
607
$18,
862,
129
+$9
03,4
78
$18,
186,
915
$18,
634,
716
-$44
7,80
1 $2
7,34
6,18
2 $2
6,89
3,53
7 +
$452
,645

12
I.T. rate methodology reasonable but charges inadequately explained
ments to the current rate model could make the allocation of services and costs easier to understand, administer and explain. These im-provements are listed in our recommendations.
We reviewed literature about information technology rate models. From our review, we found that good rate models contain three un-derpinnings – fairness, predictability, and the ability to change rates with minimum disruption to the rate model when service demands change.
There are many ways to charge for information technology. Rate models like the BTS model, are often a blend of methods. From our review of the literature, we identified two new methods that BTS could consider in setting rates — tiered pricing and activity-based rates — that could better address fairness and predictability. How-ever, we caution that the more detailed the rate model, the more complex to administer and explain.
Tiered pricing Currently, BTS unit-based rates reflect a standard level of service for all bureaus even though some bureaus may be larger consumers of the standard services than other bureaus. Tiered pricing addresses fairness by creating different levels of service for differing demands on that service. For example, customers requiring support for various peripheral devices or more sophisticated software applications would be charged a higher rate than those requiring only minimal sup-port on standard applications. Tiered rates for similar services could also provide more predictability for BTS and the bureaus if services in each tier are clearly outlined. Tiered service pricing would require thoughtful consideration and definition of services and pricing tiers, and would require information from the BTS billing and HelpDesk systems and input from customers.
More detailed approaches to rate
models are based on usage and types of
activities performed

13
Activity or service-based ratesWhen rates are charged as “units” such as the number of desktops, the processes that are needed to fully support the unit are not obvi-ous to the rate payer. Activity or service-based rates can provide clearer expectations and costs for services delivered — much like a price list from a service delivery company. For example, installation of a new desktop with standard software costs $X, or providing 30 days unlimited help desk support for a new user costs $Y. Activity-based rates could help BTS better capture the range of activities that are supported by the current contract rates. In order to provide predict-ability in budgeted costs and revenues, tiered pricing would require the bureaus to provide good estimates of the types and quantities of work needed in upcoming year, and perhaps minimum commitments to service usage. Activity-based pricing would also require thought-ful consideration of BTS services and processes, could require staff to track its activities in new ways, and could reveal efficiencies or inef-ficiencies in service delivery areas.
We interviewed and surveyed four other cities to get an idea of how IT department budgets, cost recovery and rate methods, and the delivery of IT services compare to Portland. Overall, we found that cost recovery methods vary widely, and are often a blend of pre-determined and hourly rates. Of three cities with centralized IT services, Portland’s IT budget and staffing levels are comparable. We also note that the City of Phoenix, which charges an hourly rate dependent on the type of service, charged an average of $87 per hour in FY 2004-05, compared to Portland’s hourly billable rate of $80. Appendix C shows the results of our survey.
Portland’s IT budget and staffing is in line
with other cities’ IT budgets

14
I.T. rate methodology reasonable but charges inadequately explained
To improve understanding, transparency and monitoring of the costs and rates related to information technology services, Business Opera-tions should:
1. Provide better communication to BTS and to BTS customers about how rates are determined, the components of the costs, and the actual costs of providing services.
The continued use of revenue, cost and rate model tables found in this report could be used as a basis for conversations with BTS and the bureaus.
2. Consider, with BTS input, setting targets for maximum and minimum variances within each rate item, and compare the variances to the targets at year end. The rationale for maintaining large variances should be disclosed to all stakeholders.
3. Continue to analyze rates during budget preparation, and report the budgeted costs and expected variances within each rate item to all stakeholders.
4. Improve the rate model.
The following improvements could ease administration of the model and better represent fully loaded costs.
a) Business Operations, with BTS, should consider eliminating the “integrated operations” center code. Like all the other direct service work, “integrated operations” work should be clearly coded to cost centers which correspond directly to rate items or to an organizational group within the Operations program.
b) The enterprise server has several allocations of administrative and managerial services. There is a negative allocation intended to reduce enterprise server costs. Business Operations should consider removing the negative allocation and compensate by changing allocated costs in other areas. This change would result in a more straightforward model.
Recommendations

15
c) The model should include administrative and managerial allocations for Operations billable hours. Allocations of Strategic Support and Operations administration should be changed within other Operations rate items to compensate for this adjustment.
d) Materials and services costs should be tracked in separate center codes. The current expensing of materials and services in the hourly rate center codes can lead to misinterpretations of the amount and cost of billable labor. This change is especially important as BTS begins recovering its costs for centralized computer purchases in FY 2005-06. We believe these funds should be recorded in a unique center code.
e) New center codes added in FY 2005-06 should be added to the worksheet for the rate model, so that the model accurately represents centers included in the rates. For example, center code 55014094 – which is a new center code for Customer Service (BBR) administration and management.
In order to provide more information and clarity to its customers, BTS should:
5. Extract, analyze and summarize BTS billing and HelpDesk information about tasks and recipients of work performed within the unit-based rate items.
This information should be made available to bureau managers so that they can plan and manage their IT needs, and identify problem areas. This information would also help Business Operations and BTS determine if some types of activities or recipients are using a disproportionate amount of resources.

16
I.T. rate methodology reasonable but charges inadequately explained
6. Improve Service Level Agreements.
The agreements should align with the rate categories, contain provisions for serious nonperformance problems, include signed authorizations from both BTS and bureau management, and, to the best of BTS’ ability describe work performed in business, not technical, terms. The agreements should be finalized before the budget is adopted.

APPENDICES


A-1
Notes: For simplification, Information Security direct costs include $29,127 of administrative costs recorded in a new center in FY 2005-06.
Operations direct costs include “Integrated Operations” ($721,625) allocated per the rate model.
The 10% of Operations that is allocated to the HelpDesk is included in Operations using a weighted allocation.
All OMF applications support, including “IBIS non-specific” is grouped under City-wide apps.
This summary does not show Enterprise Business System Planning ($4.3 million) because it is a pass through cost that is not managed by BTS and, because it is not part of the rate model.
Expenditures do not include general fund overhead and do not include CIP projects.
Appendix A
Allocated services costs
Strategic Strategic Customer Direct costs HelpDesk Support Operations Technology Service TOTAL
RATE ITEM $16,801,862 $547,123 $1,001,442 $2,351,551 $1,592,092 $269,037 $22,563,107
Corporate Services
E-Government $228,469 18% $403,721Strategic IT planning $33,463 8% $108,571 Information security $322,375 7% $392,476
Customer ServiceBureau Business Rep. $476,854 5% 100% $795,963
Operations
E-mail (regular & business) $239,757 11% 2% 7% $491,603 Enterprise server $1,559,185 19% -6% 17% $2,002,133 Internet connections $429,411 7% 3% 8% $677,598 Desktop contract $2,241,341 35% 17% 45% $3,675,705 Servers & processors $736,849 9% 3% 9% $1,028,315 Data networks $846,097 19% 5% 14% $1,326,321 Billable $739,308 0% 0% 0% $739,308 Billable M & S $2,710,120 - - - $2,710,120 100% 100%
Strategic Technology
GIS $2,355,939 9% 26% $2,862,161 City-wide apps. $1,299,166 14% 28% $1,883,530 Bureau-specific apps. $2,025,060 11% 34% $2,677,013 Apps. maintenance $22,931 0% 0% $22,931 Billable $489,812 4% 12% $719,913 Billable M & S $45,725 - - $45,725 100% 100%
Simplified BTS rate model showing how costs are allocated to each rate item using FY 2005-06 Adopted Budget expenditures
Source: Auditor analysis using Business Operations U550E53.xls (proposed BTS expenditures) April 26, 2005 and BTS rate model.

A-2
I.T. rate methodology reasonable but charges inadequately explained

B-1
Appendix B
RATE ITEM ALLOCATION METHOD ( or FY 2005-06 rate)
Corporate Services All pre-paid rates where bureaus pay a portion of total costs
E-Government Strategic IT planningInformation Security
Allocated based on bureau’s percentage of IT adopted budget for FY 2004-05. (We calculated the maximum rate payer was OMF at 17.2%; the minimum was Commissioners’ offices at 0.1%)
Customer Service All pre-paid rates where bureaus pay a portion of total costs
Bureau Business Rep. Based on predetermined percent of time dedicated to bureaus; percents differ by bureau
IT operations Except for Enterprise Server, all are unit-based. Bureaus costs will vary by usage.
E-mail account (regular) $109.39 (per account)
E-mail account (business) $51.43 (per account)
Enterprise Server Cost allocation based on CPU utilization for bureaus using the mainframe (OMF 43%, Police 39%, Water 14%, Auditor 4%)
Internet connection $145.16 (per domain account)
Desktops and laptops $891.40 (per computer)
Servers $2,350.67 (per server)
Processors $1,175.33 (per processor)
Data network $217.19 (per domain account)
Billable $82.65 (per hour)
Billable materials & services Charged to bureaus at cost
Strategic Technology Rates based on historical or actual use, except for GIS
Corporate Geographic Information Systems (GIS)
Pre-determined based on 7-year financial plan ending FY 2006. The General Fund, PDOT, BES, Water, BDS, and PDC contribute.
Corporate applications billed to OMF bureaus
Based on history and estimates for upcoming year. Primarily charged to the OMF Corporate service providers, starting in FY 2006 this will include the TRACS program and its customers.
Bureau specific applications Rates apply to BTS staff that is 100% dedicated to a specific bureau. Hourly rates based on job class.
Billable hours $82.65 (per hour)
Billable materials & services Charged to bureaus at cost
Source: Auditor summary of cost allocation information provided by Business Operations (for information technology services only).
Methods for assigning costs to bureaus

B-2
I.T. rate methodology reasonable but charges inadequately explained

C-1
PHOENIX TUCSONINDIANA-
POLIS SEATTLE PORTLAND
BUDGET & STAFFING (FY 2004-05)
Amount of IT services included in other department budgets(none / some / most / all)
Some Some Some Most Some
City:
Operating budget $2.1 billion $784 million $543 million $2.8 billion $1.0 billion
FTE 15,256 5,897 4,149* 10,147 5,604
IT department:
Operating budget $40.6 million $13.5 million $28.0 million $36 million $17.9 million
FTE 215 101 118* 192 142
IT department’s budget as percent of city budget 2% 2% 5% 1% 2%
IT department staff as percent of all city staff 1% 2% 3%* 2% 2%
ORGANIZATIONAL STRUCTURE
Amount of IT services centralized (none / some / most / all) Most Most Most Some Most
Adopted a formal governance structure? No No No Yes No
Amount of services outsourced(none / some / most / all) - None Most None Some
Amount of IT costs recovered from other departments(none / some / most / all)
Most Some All All Most
Amount of purchasing done by central IT department(none / some / most / all)
Most Most All Some Some
Notes: We also surveyed Kansas City, MO, but did not get a response.
The IT department budgets and staffing reflect the budget and staff only for that department; other city departments IT budgets and staff are not included.
* Includes 72 Information Technology staff who are outsourced.
Source: The information presented here represents the cities’ responses to our survey questions. The budget and staffing information is from the cities’ adopted FY 2004-05 budgets, and was confirmed or adjusted by each city as part of our survey.
Survey of other cities’ information technology departments
Appendix C

C-2
I.T. rate methodology reasonable but charges inadequately explained

RESPONSE TO THE AUDIT


Audit Services Division Office of the City Auditor1221 SW 4th Avenue, Room 310Portland, Oregon 97204503-823-4005www.portlandonline.com/auditor/auditservices
I.T. rate methodology reasonable but charges inadequately explained
Report #314, July 2005
Audit Team Members:Sharon Meross
This report is intended to promote the best possible management of public resources. This and other audit reports produced by the Audit Services Division are available for view-ing on the web at: www.portlandonline.com/auditor/auditservices. Printed copies can be obtained by contacting the Audit Services Division.
Gary Blackmer, City AuditorDrummond Kahn, Director of Audit Services
Other recent audit reports:
City of Portland Service Efforts and Accomplishments: 2003-04 (#310, December 2004)
Corporate Geographic Information Systems: A Review of Status and Accomplishments (#307, August 2004)
Bureau of Licenses: Opportunities to Improve Revenue Collection and Strengthen Internal Controls (#305, April 2004)