Repeated Measures ANOVA
39
Anthony Greene 1 Repeated Measures ANOVA I. Between Subjects Variance Is Partitioned From the Error Variance II. Conceptual Approach III.Using The Source Table
-
Upload
abel-abbott -
Category
Documents
-
view
18 -
download
0
description
Repeated Measures ANOVA. Between Subjects Variance Is Partitioned From the Error Variance Conceptual Approach Using The Source Table. Total Variability. Effect Variability (MS Between). Error Variability (MS Within). The Source Table. Keeps track of all data in complex ANOVA designs - PowerPoint PPT Presentation
Transcript of Repeated Measures ANOVA

Anthony Greene 1
Repeated Measures ANOVA
I. Between Subjects Variance Is Partitioned From the Error Variance
II. Conceptual Approach
III. Using The Source Table

Anthony Greene 2
The Source Table• Keeps track of all data in complex ANOVA
designs
• Source of SS, df, and Variance (MS)– Partitioning the
SS, df and MS– All variability is attributable to
effect differences or error (all unexplained differences)
Total Variability
Effect Variability
(MS Between)
ErrorVariability
(MS Within)

Anthony Greene 3
Source Table for 1-Way ANOVA

4
Source Table for 1-Way ANOVA
Effect VariabilityError Variability

Anthony Greene 5
Repeated Measures ANOVA
Measurement 1 Measurement 2 Measurement 3
Treatment 1 Treatment 2 Treatment 3
M1 M2 M3

An Example of a Repeated Measures Design
S Base Perf
Pf After 2 Cups Coffee
Pf After 4 Cups Coffee
Pf After 6 Cups Coffee
A 4 6 6 3
B 5 8 6 2
C 9 11 9 7
D 6 7 8 9
E 5 6 5 2
F 7 10 8 7
Avg 6 8 7 5

Anthony Greene 7
Repeated Measures ANOVA• Recall the differences between a t-test a
tD-test:1. The same group is used in the experimental
and control group via the before-after design2. Thereby individual
differences are removed from the error term
• Identical concepts to repeated measures ANOVA
• Individual Variation is computed and subtracted from the error term
n x1 x2 D
A 2 6 4
B 13 17 4
C 24 28 4

Anthony Greene 8
Partitioning Variability For Repeated Measures ANOVA
Total Variability
Effect Variability
(MS Between)
MS Within
Individual Variability
ErrorVariability
Stage 1 {{Stage 2

9
Partitioning Variability For Repeated Measures ANOVA
Total Variability
Effect Variability
(MS Between)
MS Within
Individual Variability
ErrorVariability
Stage 1 {{Stage 2
Numerator of F-ratio
Denominator of F-ratio

Anthony Greene 10
Source Table For Repeated Measures ANOVA
Tests of Within-Subjects Effects
Source SS df MS F p
FACTOR1 30.0 3 10.0 6.3 .005
Error 23.5 15 1.5
Subj. 72.5 5
Within 96.0 20
Total 126.0 23
Source SS df MS F p
FACTOR1 30.0 3 10.0 2.1 n.s.
Error 23.5 15
Subj. 72.5 5
Within 96.0 20 4.8Total 126.0 23

Anthony Greene 11
Source Table For Repeated Measures ANOVA
Tests of Within-Subjects Effects
Source SS df MS F Sig.
FACTOR1 30.0 3 10.0 6.3 .005
Error 23.5 15 1.5
Subj. 72.5 5
Within 96.0 20Total 126.0 23

Anthony Greene 12
Source Table For Repeated Measures ANOVA
Tests of Within-Subjects Effects
Source SS df MS F Sig.
FACTOR1 30.0 3 10.0 6.3 .005
Error 23.5 15 1.5
Subj. 72.5 5
Within 96.0 20Total 126.0 23

Anthony Greene 13
Source Table For Repeated Measures ANOVA
Tests of Within-Subjects Effects
Source SS df MS F Sig.
FACTOR1 30.0 3 10.0 6.3 .005
Error 23.5 15 1.5
Subj. 72.5 5
Within 96.0 20Total 126.0 23
0
1
2
3
4
5
6
7
8
9
Base 2 4 6

Anthony Greene 14
Source Table For Repeated Measures ANOVA
Tests of Within-Subjects Contrasts
Source SS df MS F Sig.
Linear 4.8 1 4.8 1.5 .263
Quadratic 24.0 1 24.0 18.4 .008
Cubic 1.2 1 1.2 3.1 .136
Tests of Within-Subjects Effects
Source SS df MS F Sig.
FACTOR1 30.0 3 10.0 6.3 .005
Error 23.5 15 1.5
Subj 72.5 5
Within 96.0 20Total 126.0 23
0
1
2
3
4
5
6
7
8
9
Base 2 4 6

Doing the ComputationsS Base
PerfPerf After 2 Cups Coffee
Perf After 4 Cups Coffee
Perf After 6 Cups Coffee
Person Totals P
A 4 6 6 3 19
B 5 8 6 2 21
C 9 11 9 7 36
D 6 7 8 9 30
E 5 6 5 2 18
F 7 10 8 7 32Avg 6 8 7 5 26

Anthony Greene 16
S Base Perf
Perf After 2 Cups Coffee
Perf After 4 Cups Coffee
Perf After 6 Cups Coffee
Person Totals P
A 4 6 6 3 19
B 5 8 6 2 21
C 9 11 9 7 36
D 6 7 8 9 30
E 5 6 5 2 18
F 7 10 8 7 32
Avg 6 8 7 5 26
1..
22
nfd
N
G
k
P
Total Variability
Effect Variability
(MS Between)
MS Within
Individual Variability
ErrorVariability
Stage 1 {
{Stage 2
New computation: 1. Compute SS for P and deg freedom2. Subtract those from SS w/in and d.f. w/in3. This leaves SS error and d.f. error

Anthony Greene 17
Tests of Within-Subjects EffectsSource SS df MS F Sig. FACTOR1 30.0 3
ErrorSubj. STAGE 1
Within 96.0 20Total 126.0 23
Source SS df MS F Sig. FACTOR1 30.0 3
ErrorSubj. 72.5 5 STAGE 2
Within 96.0 20Total 126.0 23
Source SS df MS F Sig. FACTOR1 30.0 3 10.0 6.3 .005
Error 23.5 15 1.5Subj. 72.5 5
Within 96.0 20Total 126.0 23

Anthony Greene 18
Repeated Measures ANOVA
Source d.f. SS MS F
Between 11.67
Within 12Subject 3 3
Residual
Total 15 51

Anthony Greene 19
Repeated Measures ANOVA
Source d.f. SS MS F
Between 3 11.67
Within 12Subject 3 3
Residual
Total 15 51
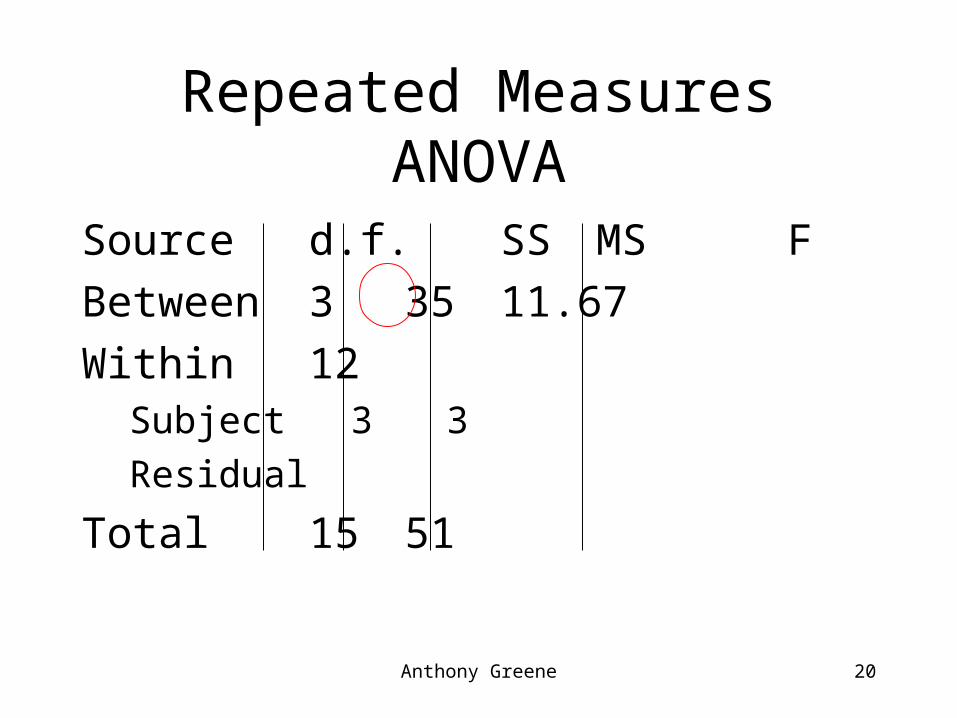
Anthony Greene 20
Repeated Measures ANOVA
Source d.f. SS MS F
Between 3 35 11.67
Within 12Subject 3 3
Residual
Total 15 51

Anthony Greene 21
Repeated Measures ANOVA
Source d.f. SS MS F
Between 3 35 11.67
Within 12 16Subject 3 3
Residual
Total 15 51

Anthony Greene 22
Repeated Measures ANOVA
Source d.f. SS MS F
Between 3 35 11.67
Within 12 16Subject 3 3
Residual 9
Total 15 51

Anthony Greene 23
Repeated Measures ANOVA
Source d.f. SS MS F
Between 3 35 11.67
Within 12 16Subject 3 3
Residual 9 13
Total 15 51

Anthony Greene 24
Repeated Measures ANOVA
Source d.f. SS MS F
Between 3 35 11.67
Within 12 16Subject 3 3
Residual 9 13 1.44
Total 15 51

Anthony Greene 25
Repeated Measures ANOVA
Source d.f. SS MS F
Between 3 35 11.67 9.0
Within 12 16Subject 3 3
Residual 9 13 1.44
Total 15 51

Anthony Greene 26
Repeated-Measures ANOVA
Before Therapy
After Therapy
6-month follow-up
4 3 1
2 5 4
4 7 6
1 2 6
An experimenter wishes to examine whether a certain therapy for Attention Deficit Disorder is effective. Four ADD children, 12 years old, are selected. The dependent measure is a standard test of attention wherein the child hears a narrative and is then asked questions about its content

Anthony Greene 27
Repeated-Measures ANOVA
Before Therapy
After Therapy
6-month follow-up
5 3 1
2 5 4 G=48
4 6 9
1 2 6
T1=12 T2=16 T3=20
Compute the treatment totals, T, and the grand total, G

Anthony Greene 28
Repeated-Measures ANOVA
Before Therapy
After Therapy
6-month follow-up
5 3 1
2 5 4 G=48
4 6 9 N=12
1 2 6 k=3
T1=12 T2=16 T3=20
n1=4 n2=4 n3=4
Count n for each treatment, the total N, and k

Anthony Greene 29
Repeated-Measures ANOVA
Before Therapy
After Therapy
6-month follow-up
5 3 1
2 5 4 G=48
4 6 9 N=12
1 2 6 k=3
T1=12 T2=16 T3=20
n1=4 n2=4 n3=4
MX1=3 MX2 =4 MX3 =5
Compute the treatment means

Anthony Greene 30
Repeated-Measures ANOVA
Before Therapy
After Therapy
6-month follow-up
5 3 1
2 5 4 G=48
4 6 9 N=12
1 2 6 k=3
T1=12 T2=16 T3=20
n1=4 n2=4 n3=4
MX1=3 MX2 =4 MX3 =5
SS=10 SS=10 SS=34
Compute the treatment SSs
(5-3)2=4
(2-3)2=1
(4-3)2=1
(1-3)2=4
sum

Anthony Greene 31
Repeated-Measures ANOVA
Before Therapy
After Therapy
6-month follow-up
5 3 1
2 5 4
4 6 9
1 2 6
T1=12 T2=16 T3=20 G=48
n1=4 n2=4 n3=4 N=12
MX1=3 MX2 =4 MX3 =5 k=3
SS=10 SS=10 SS=34 X2= 254
Compute all X2s and sum them

Anthony Greene 32
Repeated-Measures ANOVA
Add in Person totals column
Before Therapy
After Therapy
6-month follow-up
P totals
5 3 1 9
2 5 4 11
4 6 9 19
1 2 6 9
T1=12 T2=16 T3=20 G=48
n1=4 n2=4 n3=4 N=12
MX1=3 MX2 =4 MX3 =5 k=3
SS=10 SS=10 SS=34 X2= 254

Anthony Greene 33
Repeated-Measures ANOVA
Before Therapy
After Therapy
6-month follow-up
P totals
5 3 1 9
2 5 4 11
4 6 9 19
1 2 6 9
T1=12 T2=16 T3=20 G=48
n1=4 n2=4 n3=4 N=12
MX1=3 MX2 =4 MX3 =5 k=3
SS=10 SS=10 SS=34 X2= 254
Compute SSTotal
SSTotal= X2 – G2/N
SSTotal=62

Anthony Greene 34
Repeated-Measures ANOVA
Before Therapy
After Therapy
6-month follow-up
P totals
5 3 1 9
2 5 4 11
4 6 9 19
1 2 6 9
T1=12 T2=16 T3=20 G=48
n1=4 n2=4 n3=4 N=12
MX1=3 MX2 =4 MX3 =5 k=3
SS1=10 SS2=10 SS3=34 X2= 254
T2/n=36 T2/n=64 T2/n=100
Compute SSbetween
SSbetween= T2/n – G2/N
SSbetween=8

Anthony Greene 35
Repeated-Measures ANOVA
Before Therapy
After Therapy
6-month follow-up
P totals
5 3 1 9
2 5 4 11
4 6 9 19
1 2 6 9
T1=12 T2=16 T3=20 G=48
n1=4 n2=4 n3=4 N=12
MX1=3 MX2 =4 MX3 =5 k=3
SS1=10 SS2=10 SS3=34 X2= 254
Compute SSWithin
SSWithin= SSi
SSWithin = 54

Anthony Greene 36
Repeated-Measures ANOVA
Before Therapy
After Therapy
6-month follow-up
P
5 3 1 9
2 5 4 11
4 6 9 19
1 2 6 9
T1=12 T2=16 T3=20 G=48
n1=4 n2=4 n3=4 N=12
MX1=3 MX2 =4 MX3 =5 k=3
SS1=10 SS2=10 SS3=34 X2= 254
Compute SSBtw sub
SSBtw Sub=
P2/k – G2/N
SSBtw Sub =22.66
SSerror = SSwithin-SSbtw sub = 54-22.66 = 31.34

Anthony Greene 37
Repeated-Measures ANOVA
Before Therapy
After Therapy
6-month follow-up
5 3 1 G=48
2 5 4 N=12
4 6 9 k=3
1 2 6 X2= 254
T1=12 T2=16 T3=20
n1=4 n2=4 n3=4 d.f. Within=9
MX1=3 MX2 =4 MX3 =5 d.f. Between=2
SS1=10 SS2=10 SS3=34 d.f.bet sub= 3
d.f.error=6
d.f. Total=11
Determine d.f.s
d.f. Within=N-k
d.f. Between=k-1
d.f. Total=N-1
d.f. error = (N-k) – (n-1)

Anthony Greene 38
Repeated-Measures ANOVA
Before Therapy
After Therapy
6-month follow-up
5 3 1 G=48
2 5 4 N=12
4 6 9 k=3
1 2 6 X2= 254
T1=12 T2=16 T3=20 SSWithin=54
n1=4 n2=4 n3=4 d.f. Within=9
MX1=3 MX2 =4 MX3 =5 d.f. Between=2
SS1=10 SS2=10 SS3=34 d.f.bet sub= 3
d.f.error=6
d.f. Total=11
Ready to move it to a source table

Anthony Greene 39
Repeated Measures ANOVA
Source SS d.f. MS F
Between8 2 4 0.766
Within 54 9Subject 22.66 3
Error 31.34 6 5.22
Total 62 11
Compare to critical value of F(2,6) = 5.14
Fail to reject (no significant difference)