RENT SEEKING, POLICY AND GROWTH 15-09-04 - aueb.gr SEEKING, POLICY AND GROWTH _15-09-04... · RENT...
32
RENT SEEKING, POLICY AND GROWTH UNDER ELECTORAL UNCERTAINTY: Theory and Evidence Konstantinos Angelopoulos and George Economides Athens University of Economics and Business September 15, 2004 Abstract: We construct an otherwise standard general equilibrium model of economic growth and endogenously chosen fiscal policy, in which individuals compete with each other for extra fiscal transfers and two political parties compete with each other for staying in power. The main prediction is that relatively large public sectors in pre-election periods distort incentives by pushing individuals away from productive work to rent seeking activities. In turn, distorted incentives hurt growth. We test this prediction by using a panel data set of a group of 25 OECD countries over the period 1982-1996, as well as a cross- section of 108 industrial and developing countries over the decade 1990-2000. There is evidence that electoral and/or political instability cause relatively large public sectors, which in turn increase rent seeking (as measured by the ICRG index), and this is bad for economic growth. Keywords: Political uncertainty, economic growth, incentives. JEL Classification: D7, D9, E6. Acknowledgements: We thank Apostolis Philippopoulos for extensive comments and suggestions. We also thank Sarantis Kalyvitis, Jim Malley, Elissaios Papyrakis, Hyun Park, Thanasis Stengos, Makis Tsionas, Elias Tzavalis and Vangelis Vassilatos for helpful discussions. Any errors are ours. The first co-author is grateful to the "Foundation Propondis" for their support, and also wishes to acknowledge financial support from the Greek Ministry of Education and the European Union under the "Iraklitos" research fellowship program. Corresponding author: Konstantinos Angelopoulos, Department of International and European Economic Studies (Derigni wing - doma), Athens University of Economics and Business, 76 Patission Street, Athens 10434, Greece. Tel: +30-210-8203729. Fax: +30-210-8214122. Email: [email protected]
-
Upload
vuongkhanh -
Category
Documents
-
view
217 -
download
0
Transcript of RENT SEEKING, POLICY AND GROWTH 15-09-04 - aueb.gr SEEKING, POLICY AND GROWTH _15-09-04... · RENT...

RENT SEEKING, POLICY AND GROWTH
UNDER ELECTORAL UNCERTAINTY:
Theory and Evidence
Konstantinos Angelopoulos and George Economides
Athens University of Economics and Business
September 15, 2004
Abstract: We construct an otherwise standard general equilibrium model of economic growth and endogenously chosen fiscal policy, in which individuals compete with each other for extra fiscal transfers and two political parties compete with each other for staying in power. The main prediction is that relatively large public sectors in pre-election periods distort incentives by pushing individuals away from productive work to rent seeking activities. In turn, distorted incentives hurt growth. We test this prediction by using a panel data set of a group of 25 OECD countries over the period 1982-1996, as well as a cross-section of 108 industrial and developing countries over the decade 1990-2000. There is evidence that electoral and/or political instability cause relatively large public sectors, which in turn increase rent seeking (as measured by the ICRG index), and this is bad for economic growth. Keywords: Political uncertainty, economic growth, incentives. JEL Classification: D7, D9, E6.
Acknowledgements: We thank Apostolis Philippopoulos for extensive comments and suggestions. We also thank Sarantis Kalyvitis, Jim Malley, Elissaios Papyrakis, Hyun Park, Thanasis Stengos, Makis Tsionas, Elias Tzavalis and Vangelis Vassilatos for helpful discussions. Any errors are ours. The first co-author is grateful to the "Foundation Propondis" for their support, and also wishes to acknowledge financial support from the Greek Ministry of Education and the European Union under the "Iraklitos" research fellowship program. Corresponding author: Konstantinos Angelopoulos, Department of International and European Economic Studies (Derigni wing - doma), Athens University of Economics and Business, 76 Patission Street, Athens 10434, Greece. Tel: +30-210-8203729. Fax: +30-210-8214122. Email: [email protected]

1
1. INTRODUCTION
Anecdotal and case study evidence across countries shows that rent-seeking activities
increase before elections. For instance, participation in strikes and demonstrations,
lobbying efforts, etc, indicate that the redistributive struggle escalates in pre-election
periods. In other words, individual incentives to work relative to rent seek deteriorate
before elections. At the same time, there is rich econometric evidence of electoral cycles in
economic policy. For instance, government spending increases before elections as
incumbent policymakers try to bribe the electorate (see e.g. Alesina, Roubini and Cohen
(1997) and Persson and Tabellini (1999a)).1 In other words, policies become short sighted
before elections.
This paper sets up a general equilibrium model to study, both theoretically and
econometrically, this real-world scenario. To this end, we develop a dynamic model that
studies the joint determination of fiscal policy, rent-seeking private incentives and
economic growth, when the driving force is electoral uncertainty. We then test the
predictions of the model by using a panel data set of a group of 25 OECD countries over
the period 1982-1996, as well as a cross section of 108 industrial and developing countries
over the decade 1990-2000.
We build upon a standard general equilibrium model of economic growth and
endogenously chosen fiscal policy. Specifically, we build upon the model introduced by
Barro (1990). To this well-known model, we add two things. First, private agents, apart
from making their usual consumption/saving decisions, also decide on how much effort
they will allocate to productive work relative to rent seeking activities. In doing so, rent
seekers compete with each other for extra fiscal transfers. Our rent seeking mechanism is as
in Tullock (1967) and Murphy, Shleifer and Vishny (1991).2 Second, there are two political
parties that can alternate in power so that they choose economic policy by competing with
each other and knowing that there is only a non-zero probability of remaining in power in
the coming election. Our electoral mechanism is as in e.g. Alesina and Tabellini (1990),
Lockwood, Philippopoulos and Snell (1996) and Devereux and Wen (1998).
1 For surveys of the empirical literature, see Drazen (2000, chapter 7) and Mueller (2003, chapter 19). 2 See also Mauro (2002), Mohtadi and Roe (1998, 2003) and Park, Philippopoulos and Vassilatos (2003) for similar setups in which rent seekers compete with each other for extra fiscal transfers. That is, here the common pool is the tax base. For surveys of rent seeking and growth, see Drazen (2000, chapter 11) and Persson and Tabellini (2000, chapter 14.4). For a survey of rent seeking in general, see Mueller (2003, chapter 15).
2
The main theoretical result is as follows. As the probability of remaining in power
decreases (or equivalently electoral uncertainty increases), the incumbent party finds it
optimal to go for a relatively large size of the public sector, which implies that there are
also relatively high aggregate fiscal transfers. This signals a larger pie that rational
atomistic individuals are willing to fight over. Thus, relatively large public sectors in pre-
election periods distort private incentives by pushing individuals away from productive
work to rent seeking activities. In turn, distorted private incentives hurt the macro-economy
and economic growth.
The theoretical model gives a three-equation system in economic growth, rent-
seeking activities and the size of public sector. The system is first estimated for a panel of
25 OECD countries with three five-year periods for each over 1982-1996. For this group of
countries, we construct a measure of electoral uncertainty defined as the average of pre-
election dummies over the five-year periods (this is similar to Alesina et al. (1997) and
most of the empirical literature on political business cycles). An additional test is carried
out by using a more general measure of political stability similar to the indices used by e.g.
Perotti (1996), Rodrik (1999) and the literature on socio-political instability. This allows us
to get a cross-section of 108 countries, both developed and developing, over 1990-2000.
For both of the samples (i.e. the panel and cross-section), the widely used Knack and
Keefer (1995) dataset on institutions and incentives (known as ICRG index) provides a
reasonable proxy for rent-seeking behavior.
The econometric evidence supports the theoretical link analyzed above. In
particular, electoral and/or political instability cause relatively large public sectors, which
in turn exert an adverse effect on individual incentives; then, worse incentives hurt
economic growth. The economic effects of electoral and political uncertainty are found to
be important. For instance, in the OECD panel sample, an increase in electoral uncertainty
caused by an additional extra election in a 5-year period is estimated to increase the size of
public sector (measured by the government share in GDP) by 2 percentage points. This
aggravates rent seeking behavior (captured by a reduction in the ICRG index) by 0.6-1.3
units, which in turn causes a drop in the growth rate by 0.18-0.39 percentage points over a
5-year period.
What is the value added of our paper? Our work differs because, as far as we know,
this is the first theoretical attempt to model the effects of electoral uncertainty on the joint
determination of fiscal policy, rent seeking behavior and economic growth in a unified

3
general equilibrium framework.3 Concerning the empirical literature, we estimate a three-
equation model that identifies the channel through which electoral and political uncertainty
affects the joint determination of these three key variables (namely, the size of government,
rent seeking behavior and economic growth). This differs from most of the existing
econometric studies, which have focused on single-equation reduced-form regressions that
test the relation either between fiscal policy and elections, or between rent seeking and
political variables, or between growth and rent seeking, or between growth and government
size.4 It is worth pointing out that such single-equation reduced-form regressions have not
established a significant effect from electoral and political uncertainty to endogenous
variables like rent seeking and growth.5 Here, in contrast, by estimating a three-equation
system that identifies the channel through which electoral and political uncertainty affect
the economy, we do find evidence of such significant effects on rent seeking and growth -
the channel is the conduct of fiscal policy.
Before proceeding, two points need to be made. First, we focus on the adverse
effects of electoral competition. It is well known, however, that elections can also play a
positive role (e.g. they can control the moral hazard behavior of policymakers, help voters
select the most competent policymaker, or help voters to choose the policymaker whose
ideology is closer to the majority of voters). Here, we do not study these issues. Second, we
do not claim that larger public sectors are bad per se. What we do claim is that, when
driven by electoral uncertainty and competition, large public sectors are bad for individual
incentives and this in turn hurts growth. This indirect effect of government policy is in
addition to the direct (positive or negative) effect that policy may have on growth. Further
discussion of these two points is provided in the closing section.
3 In the political business cycle literature, electoral instability hurts growth by inducing incumbents to follow shortsighted policies (see e.g. Alesina and Tabellini (1990), Lockwood et al. (1996), Devereux and Wen (1998), Persson and Tabellini (1999a, 2000) and Economides et al. (2003) for dynamic models). However, most of this literature abstracts from the effects of electoral uncertainty on rent seeking. On the other hand, in the rent-seeking literature, a larger public sector and higher transfers can worsen private incentives and this is bad for growth (see e.g. Mauro (2002), Mohtadi and Roe (1998, 2003), Park et al. (2003) and the papers cited in Persson and Tabellini (2000, chapter 14.4)). However, most of these models abstract from elections and their effects on private incentives. 4 For the effects of electoral competition on the conduct of fiscal policy, see e.g. Alesina et al. (1997). For the effects of political variables and the size of government on rent seeking activities, see e.g. Treisman (2000). For the effects of rent seeking and corruption on economic growth, see e.g. Mauro (1995), Knack and Keefer (1995), Rodrik (1999) and Hall and Jones (1999). For the effects of the size of public sector on economic growth, see the rich survey in Barro and Sala-i-Martin (2004, chapter 12). Section 3.2 below will provide further details on the empirical literature. 5 See e.g. Alesina et al. (1997) for the effects (or lack of them) of electoral uncertainty on growth, and Treisman (2000) for the effects (or lack of them) of political uncertainty on rent seeking.
4
The rest of the paper is as follows. Section 2 presents the theoretical model. Section
3 presents the econometric part. Section 4 closes the paper. All proofs are in an Appendix.
2. THE THEORETICAL MODEL
2.1. Informal description of the model
With an eye to empirical estimation, we will keep the theoretical model as simple as
possible. Our aim is to introduce rent seeking and electoral uncertainty into a growth
model. To do so, we will combine the electoral competition model of Economides et al.
(2003) with the rent-seeking model of Mauro (2002) and Park et al. (2003).
It is helpful to start by discussing the key features of the model. (i) The underlying
model is Barro’s (1990) model, where public infrastructure is the engine of long-term
growth. Public infrastructure is financed by distorting income taxes. (ii) Rational atomistic
individuals can extract from government income (i.e. collected tax revenues) to increase
their own personal wealth. This is at the cost of social resources allocated to finance public
infrastructure. (iii) This rent-seeking behavior, on the part of individuals, is modeled as in
Tullock (1967). Specifically, individuals compete with each other for a fraction of tax
revenues, and this rent-seeking competition is given by a non-cooperative (Nash) game
among individuals. (iv) Rent seeking requires time and effort. Thus, each individual
chooses optimally (in addition to consumption and saving) the allocation of its time and
effort between productive work and rent seeking activities. (v) Elections are held every
time period; this is for simplicity. (vi) The political party, which wins the election, chooses
economic policy to maximize the inter-temporal welfare of the representative household by
competing with the other party that can win the next election with a non-zero probability.
(vii) In each time-period, the sequence of events is as follows: economic policy is chosen
first, and in turn, private agents make their allocation choices simultaneously. (viii) We
assume infinite-time horizons, discrete time and certainty (except from probabilistic
electoral uncertainty).
We will work with backward induction. Thus, within each period t , we will first
solve the private agents’ optimization problem for any feasible economic policy; in turn,
we will endogenize economic policy by forming a Nash game between two alternating
political parties. We will solve for Markov policy strategies and hence a Markov-perfect
general equilibrium so that optimal policies are sub-game perfect and time consistent.

5
2.2. Firms’ problem
We assume a single firm (this is for simplicity). This firm maximizes profits, π :
tttttt lwkry −−=π (1)
where ty is output produced at time t ; tk and tl are capital and labor used at t ; and tr and
tw are the interest rate and wage rate respectively.
At the firm’s level, the production function takes a Cobb-Douglas form:
( ) ( )α
αα−
− ⎟⎠⎞
⎜⎝⎛=
11
IG
lkAy tttt (2)
where 0>A and 0 1< <α are parameters, tG is government production services at t and
I is a fixed number of population.6 For similar production functions, see e.g. Barro and
Sala-i-Martin (2004, chapter 4).
The firm chooses tk and tl to maximize (1) subject to (2). In doing so, it acts
competitively by taking prices, policy variables and aggregate outcomes as given. The
solution of this simple static problem is written in Appendix A.
2.3. Households’ problem
Households are indexed by i ∈ I . Each household’s inter-temporal utility is:
∑∞
=0log
t
it
t cβ (3)
where itc is private consumption at time t and 0 1< <β is the discount rate.
Each household i is endowed with one unit of effort time and then allocates
10 ≤< itθ of that unit to productive work and ( ) 110 <−≤ i
tθ to rent-seeking competition.
The within-period budget constraint of household i is:
6 To avoid scale effects in equilibrium, we assume that it is the average amount
IG , rather than the total G ,
that provides growth-promoting services to the individual firm. This is not important.
6
( )( ) ( )( )
1
1
11
1
iti i i i i
t t t t t t t t tIit
i
a c r a w Tθ
τ θ πθ
+
=
−+ = − + + +
−∑
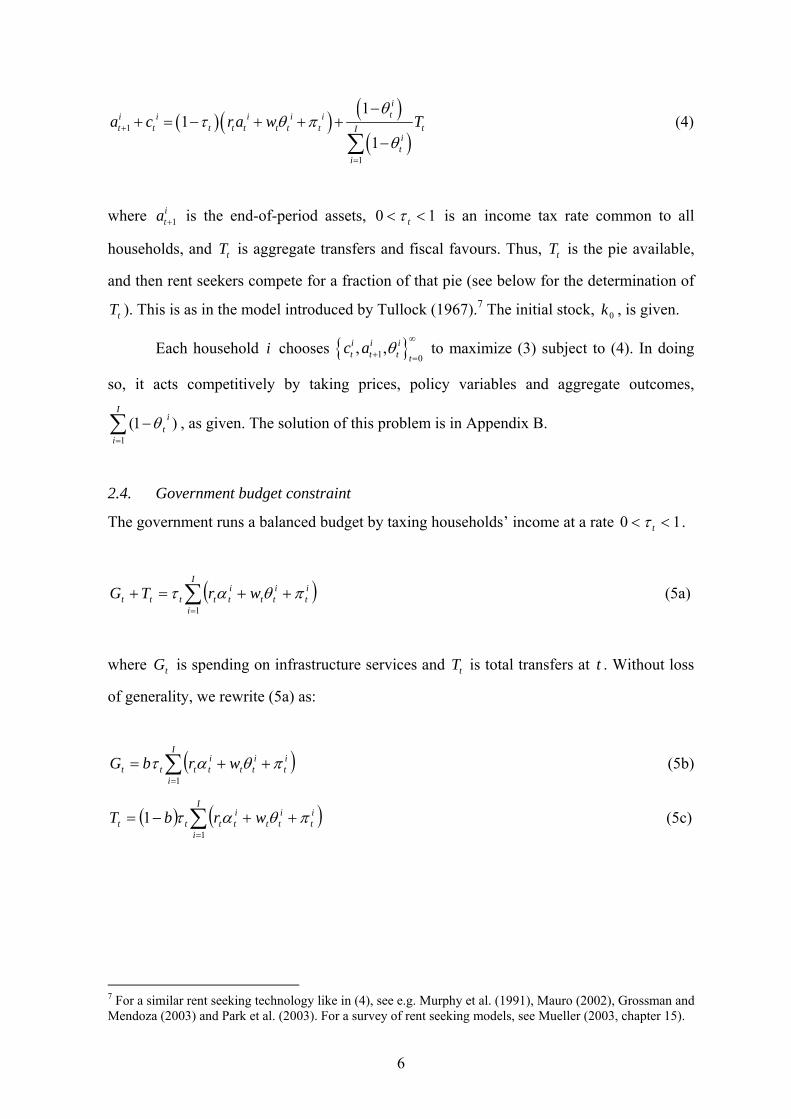
(4)
where 1ita + is the end-of-period assets, 10 << tτ is an income tax rate common to all
households, and tT is aggregate transfers and fiscal favours. Thus, tT is the pie available,
and then rent seekers compete for a fraction of that pie (see below for the determination of
tT ). This is as in the model introduced by Tullock (1967).7 The initial stock, k0 , is given.
Each household i chooses 1 0, ,i i i
t t t tc a θ
∞
+ = to maximize (3) subject to (4). In doing
so, it acts competitively by taking prices, policy variables and aggregate outcomes,
∑=
−I
i
it
1)1( θ , as given. The solution of this problem is in Appendix B.
2.4. Government budget constraint
The government runs a balanced budget by taxing households’ income at a rate 10 << tτ .
( )∑=
++=+I
i
it
itt
ittttt wrTG
1πθατ (5a)
where tG is spending on infrastructure services and tT is total transfers at t . Without loss
of generality, we rewrite (5a) as:
( )∑=
++=I
i
it
itt
itttt wrbG
1
πθατ (5b)
( ) ( )∑=
++−=I
i
it
itt
itttt wrbT
1
1 πθατ (5c)
7 For a similar rent seeking technology like in (4), see e.g. Murphy et al. (1991), Mauro (2002), Grossman and Mendoza (2003) and Park et al. (2003). For a survey of rent seeking models, see Mueller (2003, chapter 15).

7
where 10 ≤< b is a parameter that shows the allocation of total tax revenue between public
investment and transfer payments.8 Inspection of (5a)-(5c) reveals that, given 10 ≤< b , the
path of the income tax rate, ∞=0ttτ , fully summarizes fiscal policy.
2.5. Competitive decentralized equilibrium
Given tax policy ∞=0 ttτ , a Competitive Decentralized Equilibrium (CDE) is defined to be a
sequence of allocations 1 0 , , , , , , i i i i it t t t t t t tk l c a G Tθ ∞
+ = and prices 0 , t t tr w ∞= such that: (i)
households maximize utility and firms maximize profits by taking prices, policy variables
and aggregate outcomes as given; (ii) all budget constraints are satisfied; (iii) all markets
clear.9 For simplicity, we focus on a symmetric (Nash) equilibrium in which households are
alike ex post.10
Then, Appendix C shows:
Result 1: In a Competitive Decentralized Equilibrium (for any feasible tax policy), we have
for private decisions (quantity variables are per capita except otherwise defined):
( )( ) ( )[ ] ( ) tttttt kbAbc αα
α θτταβτ−
−+−−=11
111 (6a)
( ) ( ) ttttt kbAk αα
α θτταβ−
+ −=11
1 1 (6b)
( )( )( )( ) ( ) 1
11111
0 <−+−−
−−=<
tt
tt b ττα
ταθ (6c)
and for the two types of aggregate government spending, tG and tT :
( ) ttttt kbAb
IG
αα
α θττ−
=11
(6d)
( ) ttttt kbAb
IT
αα
α θττ−
−=11
)1( (6e)
8 When we study policy determination below, we will assume that 0 1b< ≤ is a parameter. This is for algebraic simplicity. This is because the aim of this paper is mainly empirical. Nevertheless, we wish to say that there are several ways of endogenizing b . For instance, we could assume that b is determined as the outcome of a Rubinstein bargaining solution, where the bargaining is between those that demand more resources for productive reasons (e.g. firms) and those that demand more resources for cash transfers (e.g. households). Or, in equilibrium, b could increase with aggregate rent seeking activities (see e.g. Park et al. (2003)). We have experimented with solutions like this, and we report that the main predictions do not change. We therefore prefer to keep b as exogenously given.
9 In the labor and capital markets, the market-clearing conditions are ∑=
=I
i
ittl
1
θ and ∑=
=I
i
ittk
1
α .
10 See e.g. Cooper and John (1988) for symmetric (Nash and cooperative) equilibria and their properties.
8
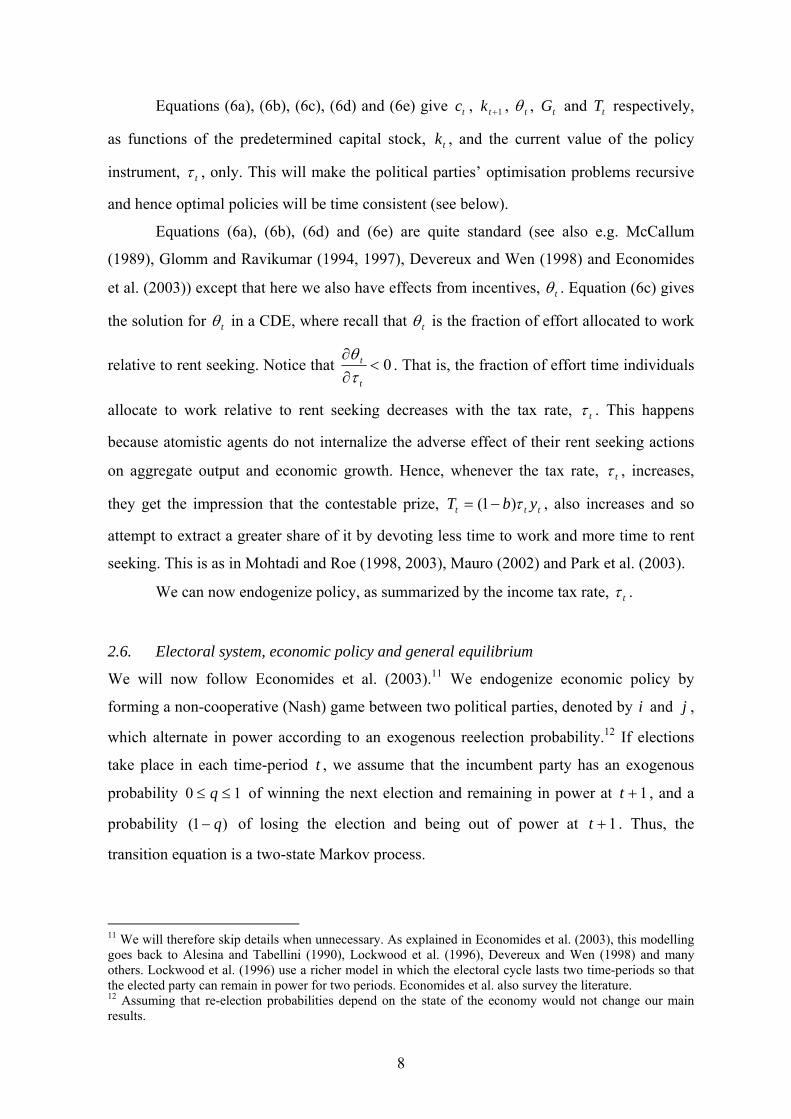
Equations (6a), (6b), (6c), (6d) and (6e) give ct , kt+1 , tθ , tG and tT respectively,
as functions of the predetermined capital stock, tk , and the current value of the policy
instrument, tτ , only. This will make the political parties’ optimisation problems recursive
and hence optimal policies will be time consistent (see below).
Equations (6a), (6b), (6d) and (6e) are quite standard (see also e.g. McCallum
(1989), Glomm and Ravikumar (1994, 1997), Devereux and Wen (1998) and Economides
et al. (2003)) except that here we also have effects from incentives, tθ . Equation (6c) gives
the solution for tθ in a CDE, where recall that tθ is the fraction of effort allocated to work
relative to rent seeking. Notice that 0<∂∂
t
t
τθ
. That is, the fraction of effort time individuals
allocate to work relative to rent seeking decreases with the tax rate, tτ . This happens
because atomistic agents do not internalize the adverse effect of their rent seeking actions
on aggregate output and economic growth. Hence, whenever the tax rate, tτ , increases,
they get the impression that the contestable prize, ttt ybT τ)1( −= , also increases and so
attempt to extract a greater share of it by devoting less time to work and more time to rent
seeking. This is as in Mohtadi and Roe (1998, 2003), Mauro (2002) and Park et al. (2003).
We can now endogenize policy, as summarized by the income tax rate, tτ .
2.6. Electoral system, economic policy and general equilibrium
We will now follow Economides et al. (2003).11 We endogenize economic policy by
forming a non-cooperative (Nash) game between two political parties, denoted by i and j ,
which alternate in power according to an exogenous reelection probability.12 If elections
take place in each time-period t , we assume that the incumbent party has an exogenous
probability 10 ≤≤ q of winning the next election and remaining in power at t +1 , and a
probability )1( q− of losing the election and being out of power at t +1 . Thus, the
transition equation is a two-state Markov process.
11 We will therefore skip details when unnecessary. As explained in Economides et al. (2003), this modelling goes back to Alesina and Tabellini (1990), Lockwood et al. (1996), Devereux and Wen (1998) and many others. Lockwood et al. (1996) use a richer model in which the electoral cycle lasts two time-periods so that the elected party can remain in power for two periods. Economides et al. also survey the literature. 12 Assuming that re-election probabilities depend on the state of the economy would not change our main results.
9
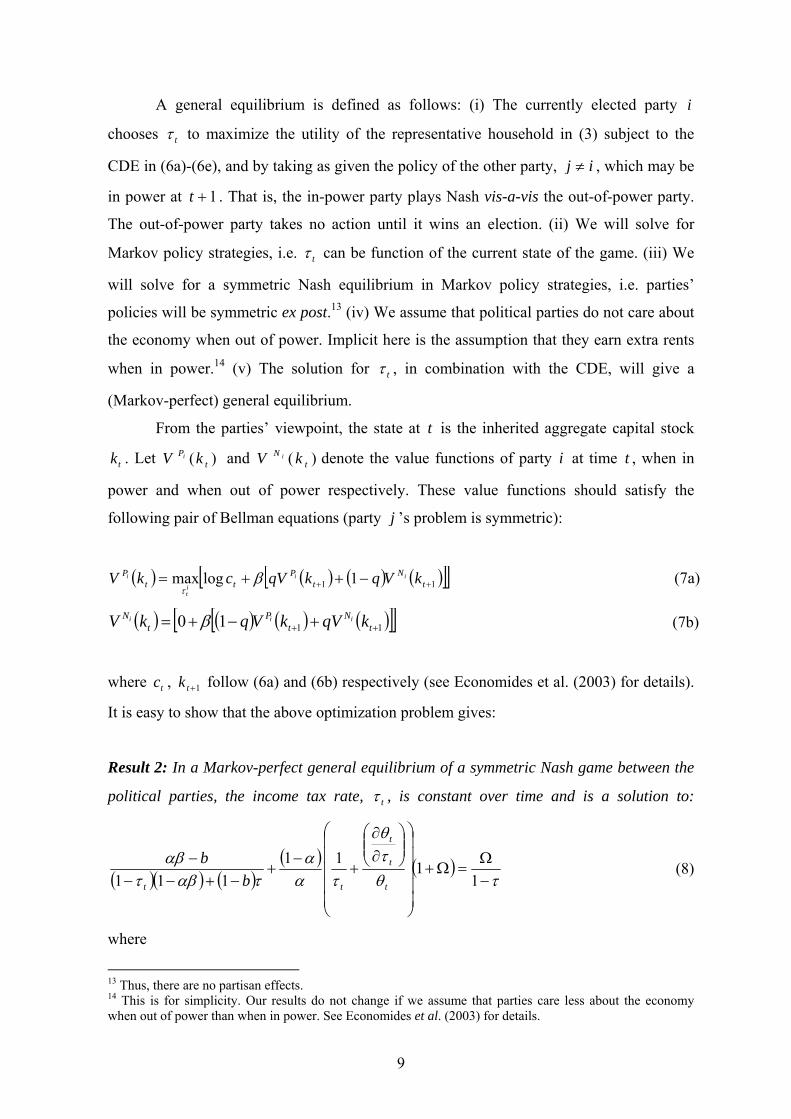
A general equilibrium is defined as follows: (i) The currently elected party i
chooses tτ to maximize the utility of the representative household in (3) subject to the
CDE in (6a)-(6e), and by taking as given the policy of the other party, ij ≠ , which may be
in power at t +1 . That is, the in-power party plays Nash vis-a-vis the out-of-power party.
The out-of-power party takes no action until it wins an election. (ii) We will solve for
Markov policy strategies, i.e. tτ can be function of the current state of the game. (iii) We
will solve for a symmetric Nash equilibrium in Markov policy strategies, i.e. parties’
policies will be symmetric ex post.13 (iv) We assume that political parties do not care about
the economy when out of power. Implicit here is the assumption that they earn extra rents
when in power.14 (v) The solution for tτ , in combination with the CDE, will give a
(Markov-perfect) general equilibrium.
From the parties’ viewpoint, the state at t is the inherited aggregate capital stock
kt . Let )( tP kV i and )( t
N kV i denote the value functions of party i at time t , when in
power and when out of power respectively. These value functions should satisfy the
following pair of Bellman equations (party j ’s problem is symmetric):
( ) ( ) ( ) ( )[ ][ ]11 1logmax ++ −++= tN
tP
ttP kVqkqVckV ii
it
i βτ
(7a)
( ) ( ) ( ) ( )[ ][ ]1110 ++ +−+= tN
tP
tN kqVkVqkV iii β (7b)
where ct , kt+1 follow (6a) and (6b) respectively (see Economides et al. (2003) for details).
It is easy to show that the above optimization problem gives:
Result 2: In a Markov-perfect general equilibrium of a symmetric Nash game between the
political parties, the income tax rate, tτ , is constant over time and is a solution to:
( )( ) ( )( ) ( )
τθτθ
ταα
ταβταβ
−Ω
=Ω+
⎟⎟⎟⎟⎟
⎠
⎞
⎜⎜⎜⎜⎜
⎝
⎛⎟⎟⎠
⎞⎜⎜⎝
⎛∂∂
+−
+−+−−
−1
111111 t
t
t
tt bb
(8)
where
13 Thus, there are no partisan effects. 14 This is for simplicity. Our results do not change if we assume that parties care less about the economy when out of power than when in power. See Economides et al. (2003) for details.

10
( )( )( )( ) ( )[ ]2111
11
ttt
t
bb
τταα
τθ
−+−−−−
−=∂∂
and ( )( ) ( )[ ]( ) ( )[ ]q
qquqqu NP
2111211 11 −+−
−+=−+≡Ω
ββββ
β
which is an equation in the tax rate, τ . Then, the solution for τ , in combination with the
DCE in (6a)-(6e), gives a general equilibrium.
Since equation (8) cannot be solved analytically, we resort to numerical solutions
by using commonly used parameter values. We set 75.0=α , 9.0=β , 5.0=b , 5.0=q
and 2.3=A . The value of α (the productivity of private capital vis-à-vis public capital in
private production) is motivated by the calibrations of Barro and Sala-i-Martin (2004, p.
59) and Glomm and Ravikumar (1994). The value of β (the time discount rate) is close to
the one used by the RBC literature. A value of b (the share of tax revenues allocated to
public infrastructure relative to transfer payments) equal to 0.5 reflects the neutral
assumption that social resources are allocated equally between infrastructure and transfers.
Finally, the value of A (aggregate productivity) is chosen so as to give a growing economy
(although this is unrealistically high, recall that A works as a scale effect only and its value
does not affect the key variables, tτ and tθ ).
Table 1 below reports the effects of a changing q (reelection probability) on the
main endogenous variables in general equilibrium.15 Namely, on the income tax rate or
equivalently the government expenditure-to-output ratio ( tτ ), the incentive to work relative
to rent seeking ( tθ ), economic growth (t
ttt k
kk −≡ +1γ ), the “effective” discount rate (Ω ),
and the consumption-to-output ratio (t
t
yc
). Notice that effects are monotonic, which is an
indication of a unique solution.
Table 1: General equilibrium effects of the reelection probability, q
q τ θ γ Ω y
c
3.0 2050.0 6602.0 0310.0 36.4 3608.0 4.0 2045.0 6607.0 0311.0 42.4 3607.0 5.0 2040.0 6613.0 0313.0 50.4 3606.0 6.0 2030.0 6622.0 0315.0 60.4 3605.0 7.0 2020.0 6635.0 0318.0 78.4 3604.0 8.0 2010.0 6656.0 0323.0 08.5 3601.0
Note: 75.0=α , 9.0=β , 5.0=b and 2.3=A . We use Maple V Release 5.1.
15 We focus on the effects of q . This is the important parameter for what we want to do in this paper.
11
2.7. Interpretation of results in Table 1
Starting from the effect of q on τ , we have 0<∂∂
qτ . Thus, as electoral uncertainty
increases (i.e. q falls), the party in power finds it optimal to go for a larger public sector,
where the latter is captured by the income tax rate (τ ). This is a standard result in the
political business cycle literature. Regarding the effect of q on θ , we have
0)()(
>∂∂
∂∂
=∂∂
−−
qqτ
τθθ . Thus, as electoral uncertainty increases (i.e. q falls), incentives to work
deteriorate (i.e. θ falls). This works through economic policy in general, and the size of
public sector in particular. Namely, uncertainty about remaining in power leads to larger
public sectors, which in turn push individuals to rent seeking activities. To put it
differently, atomistic individuals get the impression that the pie gets larger and hence they
find it optimal to allocate less effort to productive work and more effort to rent seeking.
Finally, the other results follow naturally: a higher reelection probability (i.e. a higher q )
leads to higher economic growth (γ ), higher effective discount rate (Ω ) and lower
consumption-to-output ratio ( cy
).
The mechanism that drives the above results is as follows. When there is electoral
uncertainty, and the political parties care less about economic outcomes when out of power
than when in power, the party in power cares effectively less about the future. This is
translated into shortsighted policies, in the form of a larger public sector. This is a standard
result in the political business cycle literature. What is novel is that here these large public
sectors have in turn a detrimental effect on private incentives by pushing rational
individuals away from productive work to rent-seeking competition for a share of extra
transfers. Finally, distorted incentives hurt growth. In other words, in addition to a direct
standard Laffer curve effect, a larger public sector due to elections has an indirect negative
effect on growth via private incentives. This is a testable scenario.
3. EMPIRICAL EVIDENCE
This section will test the above theoretical prediction by using data from two sets of
countries: an OECD panel data set of 25 countries over the period 1982-1996, and a cross
section of 108 countries for the decade 1990-2000.

12
3.1. The econometric model
We will consider a linear econometric model of the following form:
size of government=S(electoral uncertainty; control variables) (9a)
rent seeking behavior=R(size of government; control variables) (9b)
growth rate=G(size of government, rent seeking behavior; control variables) (9c)
where equation (9a) is equation (8) for the tax rate or equivalently the government
expenditure-to-output ratio, equation (9b) follows from (6c) and equation (9c) follows from
(6b). Notice that the size of public sector in (9a) depends only on electoral uncertainty. This
recursive structure is due to the fact that the government acts as a Stackelberg leader when
it chooses policy (size of public sector). Also notice that we have added a number of
auxiliary variables (called control variables) to take account of effects not included in the
theoretical model but usually included in such regressions (see below for details).
Concerning the data, we would like to make the following general points (further
details will be given later). First, long-term time series observations are not available for
rent seeking, and thus the analysis can only be confined to the medium-term impact of
these variables on growth. As a minimum, we will not use shorter than 5-year periods, so
that economic growth and rent-seeking regressions make sense. Second, rent-seeking
activities are hard to measure. Hence, any empirical methodology can only utilize proxy
variables, which can hopefully provide adequate description of this type of activities. A
third question is how general our measure of the size of government should be, given that -
in practice - it might be that only some parts of public spending are amenable to pre-
electoral manipulation and/or seen as a contestable prize by rent seekers. We have decided
to stay close to the theory, which suggests that it is the sum of public expenditure or tax
revenue that should matter. Thus, we will use a fairly general measure, which is the share
of government in GDP (see also e.g. Rodrik (1998)). Fourth, an important issue is how to
approximate electoral uncertainty. Here, we will use two different proxies. We will first
measure electoral uncertainty by using pre-election dummies, as it has been common
practice in the political business cycles literature (see e.g. Alesina et al. (1997)). The idea is
that the more elections are held in a given time interval (the 5-year period), the higher is the
uncertainty that policy makers are facing in this period. This will be described in some
detail in subsection 3.2 below. Moreover, since data on elections are hard to obtain for
many countries (and because democratic elections seem to be a privilege of a relatively
13
small subset of countries), we will also use, in subsection 3.3, as a proxy for uncertainty
about remaining in power, an index of political stability (see Drazen (2000, chapters 11.4-
11.6), for a survey of studies that use such socio-political indices to account for political
stability). This proxy for electoral uncertainty will allow us to estimate the model by using
a large cross section of countries.
3. 2. Comparison with the empirical literature
Equations (9a)-(9c) give a structural model that studies the joint determination of the above
three endogenous variables (size of government, rent seeking behaviour, and economic
growth) when the driving force is electoral and political uncertainty. As said above, the
contribution of our paper is that we identify the channel through which electoral and
political uncertainty affect the joint determination of the three key variables. This differs
from most of the relevant econometric literature that has, as far as we know, concentrated
on reduced-form bivariate relations, either between fiscal policy and electoral competition,
or between rent seeking activities and the size of government and/or political variables, or
between growth and rent seeking and/or fiscal policy.
Concerning the determinants of economic growth, there is a vast empirical literature
(see Barro and Sala-i-Martin (2004, chapter 12) and the papers cited there). Focusing on
the growth effects of rent extraction, Mauro (1995) and Knack and Keefer (1995) have,
among many others, provided evidence that entrenched corruption and poor institutions are
a significant impediment to growth. On the growth effects of government spending, Barro
(1997) and Barro and Sala-i-Martin (2004, chapter 12) provide evidence that government
consumption has a negative effect on growth rates, while the effects of more general
indicators of government spending are usually insignificant (see e.g. Barro (1990)). Alesina
et al (1997) investigate the effect of electoral competition on economic outcomes; electoral
uncertainty is not found to have a significant direct impact on growth in reduced-form
regressions (see also Drazen (2000, chapter 11.6), for a review of the empirical findings of
the literature on the institutional and political determinants of growth).
Concerning the determinants of rent seeking, the most extensive study is
Treisman’s (2000) work on the variables explaining the CPI index of perceptions of
corruption.16 In his cross-national study, Treisman finds a negative, albeit not significant,
16The CPI index, developed by Transparency International, focuses on the extent of corruption in government. As we discuss below, we prefer to use instead the ICRG index as a measure of rent seeking activities, because it has a sufficiently long-time series dimension and is a more general measure of rent

14
effect of various measures of government intervention and policy on the CPI index.17
Treisman also reports that political uncertainty, as measured by the average number of
leaders the country had per year in the preceding period (see p. 414 on how this period is
defined), is not significantly causing (perceived) corruption in any of his regressions.
However, Persson, Tabellini and Trebbi (2003) have recently documented a link between
electoral rules and corruption.
Finally, concerning the determinants of government size, and in particular how this
size if affected by elections, Alesina et al. (1997, chapter 7) provide evidence that
government spending increases in pre-electoral periods (Drazen (2000, chapter 7) and
Mueller (2003, chapter 19) survey the literature). A more general study of the empirical
determinants of the size of public sector can be found in Persson and Tabellini (2003,
chapter 3), where estimates of the effects of several intuitive variables on different
measures of the size of government are presented by using panel and cross-section data sets
(although political uncertainty is not included as a possible explanatory variable).
3.3 Evidence from a panel of 25 OECD countries
3.3.1 Description of data
We have collected data on elections for 25 OECD countries,18 over the years 1982-1996
(where the choice of the time period is dictated by the availability of the rent-seeking
index). We thus have a panel of 25 countries and three 5-year periods/observations for each
country. Note that, in a similar panel for OECD, Alesina et al. (1997) have used quarterly
data on 18 OECD countries over the period 1960-1993.
Following most of the political business cycles literature, a pre-election dummy is
constructed by taking the value of one at the year before the election and zero otherwise.
Specifically, suppose that there is an election held in a country in month x of a given year.
Then, the year of the election is assigned the value x/12, and the previous year the value
(12-x)/12. We then construct a variable, denoted as electoral uncertainty, which is the
average of this pre-election dummy over the five-year period.19 A larger value implies
seeking than bureaucratic corruption. It should be noted, however, that the CPI and the ICRG indices are highly correlated (see Treisman (2000, p. 411) and Persson, Tabellini and Trebbi (2003, p. 967)). 17 See Tanzi (2002) and Angelopoulos et al. (2004) for the role of public sector in rent seeking. 18 The countries are: Australia, Austria, Belgium, Canada, Denmark, Finland, France, Germany, Greece, Iceland, Ireland, Italy, Japan, Korea, Mexico, the Netherlands, New Zealand, Norway, Portugal, Spain, Sweden, Switzerland, Turkey, the United Kingdom and the United States. 19As discussed above, Treisman (2000) uses a similar proxy for political uncertainty, by constructing a measure of the average number of government leaders per year in the recent period.
15
more elections in these five years, so that incumbent parties face a larger probability of
losing power on average.
To obtain a measure of rent seeking, we will follow usual practice by using the IRIS
dataset (version IRIS-3, obtained by countrydata.com). This index contains annual values
for indicators of the quality of governance, corruption and violation of property rights over
the period 1982-1997, as constructed by Stephen Knack and the IRIS Center, University of
Maryland, from monthly ICRG data provided by Political Risk Services. This dataset has
been used in a series of papers (see, among many others, Knack and Keefer (1995), Barro
(1997), Rodrik (1999), Barro and Sala-i-Martin (2004), Hall and Jones (1999) and Persson
et al. (2003)). Notice that although there are other datasets available that can also provide a
measure of rent extraction activities (like e.g. the CPI index explained above, or the
Kaufman, Kraay and Mastruzzi (2003) dataset), the ICRG index is the only panel dataset
on rent seeking and has a sufficiently long-time series dimension (1982-1997) which makes
it suitable for our purposes. Therefore, by following Keefer and Knack (2002),20 we
construct a rent-seeking variable denoted as ICRG. A higher value of ICRG will indicate
smaller rent seeking. By taking advantage of its time series dimension, we get three 5-year
averages of this index.
The Penn World Tables, version 6.1 (Heston, Summers and Aten (2002)), will
provide us the GDP per capita in constant prices, which is then used to obtain the five-year
average of annual growth rates (denoted as growth rate), as well as the government share in
GDP in constant prices,21 which is also averaged over the 5-year period to give a measure
of a variable denoted as size of government.
20 There are five subjective indices available by the IRIS dataset: “corruption in government”, “rule of law”, “risk of repudiation of government contracts”, “risk of expropriation” and “quality of bureaucracy”. We follow the literature in obtaining an aggregate measure for the quality of institutions by summing these 5 different indices, with higher scores indicating better institutions. Note that from these indices, “corruption in government”, “rule of law”, and “quality of bureaucracy” range in value from 0 to 6, whereas “risk of repudiation of government contracts” and “risk of expropriation” are scaled from 0 to 10 with higher values indicating better ratings, i.e. less corruption and less risk. The aggregate measure of the quality of institutions is then constructed from these variables at a 50-point scale by converting “corruption in government”, “rule of law”, and “quality of bureaucracy” to a 10-point scale and summing them up with the other two indices. 21 This is public consumption in GDP, as public investment is included in the Penn World Tables 6.1 in the investment share of GDP. Note that a large part of government spending on education, health, defense, law enforcement and public administration, is recorded in national accounts as public consumption. We choose not to use a more general variable, like total government expenditure over GDP, as a measure of the size of government because a large part of this is made up by interest payments which are not subject to pre-electoral manipulation.

16
3.3.2 Econometric methodology
Our dataset is a balanced panel of 25 countries and 3 time periods. In order to control for
unobserved heterogeneity, one could include a dummy for each country so as to look for
within country variations over time. However, as is known, important sources of variation
are left out by restricting the analysis to the “within” dimension of the data. More
efficiency can be gained if the across countries variation is instead captured by a random
effects technique. In this case, since any country-specific effects are appended into the error
term, one has to control adequately for those country characteristics that can be correlated
with the right hand-side variables, so that random effects estimators are consistent and
efficient. This is usually tested by Hausman (1978) tests.
The set of control variables, being used to account for possible heterogeneity, will
be standard. In particular, this set will include the log of initial level of GDP in each
country (the 1981 observation), which is denoted as lgdp and is obtained from the Penn
World Tables. We will also control for education by using the average years of education
in each country (denoted as education),22 the degree of each country’s openness (denoted
as openness) by using the Penn World Tables measure,23 and a degree of democracy
(denoted as democracy) by using the Gastil Index.24 We will also use some demographic
variables in the fiscal policy regression, which have been found to be significant in related
studies (see e.g. Persson and Tabellini (2003, chapter 3)); specifically, we will use the
percentage of the population between 15 and 64 (denoted as pop15-64) and the percentage
of population above 65 (denoted as pop 65)).
The model in (9a)-(9c) is a recursive system with error components. If the error
terms across equations are correlated, we need valid instruments for the endogenous
variables in order to apply 2SLS methods. As such instruments, we will use the exogenous
variables.25 Although 2SLS estimation can provide consistent estimates, it is not
appropriate for inference because the standard errors are estimated under the assumption
that the error term is i.i.d. When the error term has a random effects structure, the efficient
22 This is obtained from the Barro and Lee (2001) dataset, which is available at www.cid.harvard.edu/ciddata/ciddata.html 23 Openness is the sum of exports plus imports (in constant prices) over GDP (in constant prices). We use the average value over the 5-year period. 24 Democracy is the 5-year average of the Gastil index developed by the Freedom House. This is available at www.freedomhouse.org 25 Identification of the rent-seeking equation is hence achieved by using electoral uncertainty and the demographic variables as additional instruments for the size of government; identification of the growth equation is achieved by using the electoral uncertainty, the demographic variables and democracy as additional instruments for size of government and ICRG.

17
estimator (within the limited-information framework) can be obtained by using Baltagi’s
(1981) error-component two stage least squares (EC2SLS) method, which is exploiting the
known restrictions on the error structure (for a general treatment of systems of equations
with error components, see Baltagi (2001, chapter 7) and Hsiao (2003, chapter 5)).
Moreover, more efficiency can be gained by full-information methods, which exploit the
random effects structure of the error term, such as Baltagi’s EC3SLS. Here, we will use
GMM-EC3SLS estimators, proposed by Cornwell, Schmidt and Wyhowski (1992), since
we also want to allow for different instruments in each equation. Table 1 below will present
estimates obtained by using these three methods (2SLS, EC2SLS and GMM-EC3SLS).
3.3.3 Results
Columns (1) in Table 1 present 2SLS estimates of the growth and the ICRG equations (see
(9c) and (9b) respectively, where all exogenous variables are used as instruments) and OLS
estimates of the size of government equation (see (9a), where no endogenous variables
appear on the right-hand side). The estimates are in line with the predictions of the theory.
However, since the standard errors are not appropriate for inference, it is wise to hold off
discussions of significance. The usefulness of the 2SLS estimates reported here is that,
given that they are consistent, they can serve as a basis for comparison with the estimates
obtained from efficient methods such as EC2SLS and EC3SLS that are reported in columns
(2) and (3).26 Indeed, the estimates of the coefficients in the three columns do not differ
greatly, so we can have some confidence in the specification of our model.
Efficient estimates are presented in columns (2), where each equation is again
estimated independently, but the random effects structure of the disturbances is exploited in
a GLS framework. The size of government equation is estimated by standard random
effects-GLS (since no endogenous variables appear on the right hand side), while the
growth and ICRG equations are each estimated by one-way EC2SLS. The “within” and
“between” transformations of all exogenous variables are effectively used as instruments
under EC2SLS.
We can now discuss results. We start with the fiscal policy regression. Electoral
uncertainty leads to a larger size of government. It is interesting to point out the economic
significance of the estimated coefficient that is close to 10. This means that if a country had
26 Baltagi (1984) presents Monte Carlo evidence in favor of using EC2SLS and EC3SLS, compared to pooled 2SLS, but also finds that the latter may produce smaller bias in small samples. This is the reason we present 2SLS coefficient estimates in Table 1 as well.
18
one more election during the five year period, this would increase the electoral uncertainty
variable by 0.2 and thus would lead to an increase of about 2 points of the share of
government in GDP.27 Concerning the effects of the control variables, notice that richer
countries have larger public sectors, in accordance with Wagner’s law, but this effect is not
significant. The pop 15-64 variable has a negative and significant effect, implying that
countries with a higher age dependency ratio (i.e. population younger than 15 and older
than 64) require more government involvement. The specification of the size of
government equation is supported by a Hausman (1978) specification test that is comparing
the fixed effects and the random effects estimates. For the equation in column (2), this test
gives a χ2 statistic of 4.17, which cannot reject the null of no significant difference between
the random and the fixed effects specification at the 5% level (the relevant critical χ2(2) is
5.991). We may conclude, therefore, that the country effects can be treated as random for
the specification in column (2).28
In the rent seeking regression, all the exogenous variables are used as instruments
for obtaining the results reported in column (2). In accordance with the theory, larger
governments are, on average, associated with more rent seeking. The effects of the other
variables are also as expected. Richer countries have better institutions. Also more open
economies, more democratic rights, and more education, all improve incentives. A
Hausman type specification test is also performed for this equation in order to check
whether the country effects can be treated as random. In this case, we compare the EC2SLS
estimates, which are consistent and efficient under the null, to the fixed effects 2SLS
estimates,29 which are always consistent but inefficient under the null. The value of the
Hausman test statistic is 2.87, which is below the critical χ2(4).
27 Notice that in practice there are usually either one or two elections held during the five year period; in fact, the electoral uncertainty variable takes values in the range 0.183 – 0.483, as elections may take place in the beginning or near the end of each period. Also note that the share of government in GDP variable has a mean of 12.59% and a standard deviation of 5.66; hence, an increase of 2 percentage units is not trivial. 28 As a robustness check, we have also included pop65 and openness as regressors in the size of government equation (see e.g. Persson and Tabellini (2003)). Concerning openness, the idea is that more open economies are associated with larger public sectors (see e.g. Rodrik (1998)). However, we report that these two variables turn out to be insignificant (openness gives an estimated coefficient of -0.009 with an associated t-ratio of -0.27, and pop65 a coefficient of 0.015 with a t-ratio of 0.04, while the results for the rest of variables remain practically unchanged). The specification reported in column (2) of Table 1 is preferred because it is supported by the Hausman test, whereas, when the two insignificant controls are added, the value of the test statistic is larger than the respective critical value. In addition, if we include openness and pop65 in the fiscal policy equation, the estimated covariance matrix of the country specific random effect for the whole system is not positive definite. Therefore, omitting these two insignificant variables seems to be the correct specification. Finally, if we add the rest of the control variables used elsewhere in the system as independent variables in the fiscal policy equation, we get insignificant estimates and a rejection from the Hausman test. 29 Note that the simple fixed effects estimator (as opposed to 2SLS fixed effects) is not consistent, neither under the null nor under the alternative, because it does not take into account the correlation of the size of

19
Finally, in the growth regression in column (2), we again use all the exogenous
variables as instruments. A higher rating in the ICRG index is clearly good for growth,
while the size of government is not found to have a significant impact. Maybe, this happens
because we have also included years of education in the regressions, or because (as Barro
(1990) has pointed out) the actual size of government is close to its optimal value in OECD
countries. There is also evidence of conditional convergence within the OECD, in the sense
that a higher initial level of GDP implies lower growth. Average years of education have a
positive sign although the estimated coefficient is not significant.30 Openness does not have
a significant effect either. A Hausman test gives a χ2 statistic of 6.46, which cannot reject
the null that the country effects can be treated as random for this equation too.
To obtain fully efficient estimates, we also estimate (9a)-(9c) simultaneously by
using Baltagi’s (1981) EC3SLS. The Hausman tests presented above support the use of all
the exogenous variables as instruments for the growth and the ICRG equations; on the
other hand, our discussion of the specification of the size of government equation (see
footnote 28) implies that only the right hand-side variables in columns (1) or (2) of this
regression can be treated as valid instruments. Therefore, we estimate the system by GMM-
EC3SLS, as proposed by Cornwell, Schmidt and Wyhowski (1992), which allows for
different instruments in different equations. The results are reported in columns (3) in
Table 1.31 The resulting estimates for the coefficient vectors are close to those obtained by
EC2SLS and there is also a substantial improvement in the accuracy of the estimated
coefficients.
The theoretical model predicts a specific channel for the effect of electoral
uncertainty on economic outcomes. It is worth checking the economic significance of this
channel. As said above, one more election in a five-year period results in an increase in the
share of government in GDP by 2 percentage points. In turn, this is estimated to reduce the
ICRG index by approximately 0.6 according to the error components estimates, or by 1.3 government with the idiosyncratic error component (see Wooldridge (2002), p. 289, for the assumptions of Hausman tests). 30 Barro (1997) finds that only secondary and higher years of education of the male population have a direct effect on growth, because, he argues, they are a better proxy for human capital. He suggests that other forms of education are important for growth, but not as human capital; for example, female education is associated with lower infant mortality ratio. This could be the case here as well. Years of education have a positive indirect effect on growth via improving institutions, so that when the ICRG index is already included in the model, the effect of education is no longer important. Indeed, running the growth regression without ICRG results in a higher estimated coefficient for years of education and a t-ratio of 1.15. 31 The system has been also estimated by using as instruments for the fiscal policy equation, in addition to (the “within” and “between” transformations of) electoral uncertainty, lgdp and pop15-64, the “within” transformations of the rest of the exogenous variables of the system. This gives very similar results to those reported in columns (3).
20
units, according to the standard 2SLS estimates. These two increases in rent seeking cause,
respectively, a fall of the growth rate by approximately 0.18 and 0.39 percentage points,
using a value of 0.3 for the coefficient of the effect of (less) rent seeking on growth. This
result is obtained by controlling for the effects of other variables.
Some robustness tests have already been discussed (see, in particular, footnotes 28,
30, and 31). As an additional test, we will also include in the growth equation the share of
investment in GDP (denoted as investment share), averaged over the 5-year periods, which
is obtained from the Penn World Tables. We do not want to include this variable in the
main specification of the model, discussed above, because in the theoretical model the rate
of growth in the economy cannot be distinguished from the rate of the increase in capital,
on a balanced growth path. Nevertheless, it is useful to test for robustness by including the
investment share in the growth equation. We do so for two reasons: first, because it is
commonly used in empirical related studies as an explanatory variable of growth (see, for
instance, the papers referred to earlier); second, because this can provide some indication of
whether the effect of rent seeking on growth is only realized via the disincentives it creates
for private capital accumulation, or, if there is an additional effect, by hindering the
efficient allocation of factor inputs in general. It is worth noting that Mauro (1995) finds
that if he controls for investment in his growth regressions, his measure of extraction
activities (the Business International indices of corruption) loses its explanatory power,
while Knack and Keefer (1995) find that the ICRG index retains its statistical significance
even if investment is controlled for.
Column (1) in Table 2 presents EC2SLS results when the investment share is
included in the growth equation as an explanatory variable. The investment share is
significant, while the estimated coefficient of ICRG is smaller and not significant (although
the t-ratio is high). This specification of the growth equation is again supported by a
Hausman test, as the test statistic is 6.04, which is below the critical χ2(5). Efficient
estimates are presented in Columns (2), where the results are obtained by estimating the
system by GMM-EC3SLS, as in Table 1, using the investment share as an instrument only
for the growth equation. The joint estimation again results in a coefficient for ICRG which
is smaller when the investment share is included in the growth equation, but now it remains
clearly significant. One may conclude, therefore, that rent seeking seems to induce a
misallocation of resources that is more general than just reducing investment.

21
3.4. Evidence from a cross-section of 108 countries
3.4.1. Description of data
To test the predictions of the model for a large cross section of countries, we give up our
previous measure of electoral uncertainty because democratic elections are not a regularity
in many countries. Instead, as a proxy for electoral uncertainty, we will use a more general
measure of political stability. The idea is that high levels of political instability are
associated with uncertainty about remaining in power.
The measure of political stability that we use is obtained from the Kaufmann et al.
(2003) dataset on governance.32 This dataset contains six indices - or clusters - on the
quality of governance, which are based on a number of different surveys that assess a
country’s performance in the relative areas. Kaufmann et al. combine the observed survey
results by using a statistical, unobserved-components procedure. We will use the second
cluster, labeled “political stability and absence of violence”, as a measure of political
uncertainty. This dataset does not have a time series dimension, so we use the 1996
observation for each country.
The rest of the variables used are those presented in the previous section, the
difference is that now we use the average of each variable over the period 1990-2000 (lgdp
is now the 1989 observation). In addition, three regional dummies are included in each
equation to control for possible regional effects, as is common in cross-country growth
regressions. The dummies are East Asia, Sub-Saharan Africa and Latin America. We do
not use the education variable, because this would unnecessarily restrict our sample. Data
on 108 industrial and developing countries are available for this set of variables.
3.4.2 Results
As with the previous dataset, allowing for correlation among the error terms of the
equations implies the need of instrumental variables. Again, all the exogenous variables
will be used as instruments. The results are presented in Table 3. Columns (1) report 2SLS
estimations, while columns (2) report 3SLS estimations. Overall, there are important
efficiency gains by using 3SLS. The results are again supportive of the theoretical
predictions.
In the fiscal policy regression, political stability is an important factor in explaining
the size of government, in the sense that the less threatened governments are to be
32 This is available at www.worldbank.org/wbi/governance/govdata2002.
22
overthrown, the smaller the size they choose. Also, openness is positively significant. Thus,
Rodrik’s (1998) result holds during the 1990s for a cross section of 108 countries (compare
this with the previous OECD sample, where openness was insignificant). Also, richer
countries have smaller public sectors (compare this with the OECD sample, where there
was a positive - although insignificant - effect). The demographic variables, as well as the
regional dummies for East Asia and Latin America are not significant in this sample.
Finally, the Sub-Saharan countries have smaller public sectors.33
In the rent seeking regression, larger governments are, on average, associated with
worse incentives (see the coefficient on ICRG). The control variables have expected signs,
but only the index for democratic freedom and the regional dummies for Sub-Saharan
Africa and Latin America are significant. As expected, Latin American countries are
associated with a particularly strong negative effect on incentives or institutions. A
Hausman (1978) over-identification test for this equation (see Wooldridge (2002) for
obtaining a regression form of the test) gives a statistic of 3.402, which cannot reject the
null that the instruments are not correlated with the error term (the critical χ2(2) value is
5.991).
In the growth regression, better institutions (ICRG) lead to higher growth, whereas
the size of government does not have a significant growth effect. Also, in this sample, more
open economies are associated with higher growth rates, although this is not significant.
However, if East Asia is dropped, openness becomes significant. This is not surprising,
given that East Asian countries have been following open economy policies to promote
growth. Conditional convergence is strongly supported as well with poorer countries
growing faster. The 1990s have been a bad decade for Sub-Saharan Africa, but this is not
true for Latin American countries. To test whether our instruments can be treated as
exogenous, we perform a Hausman (1978) over-identification test for the growth equation.
The χ2 obtained from the test is 2.3328, which is below the critical χ2(2). As a robustness
check, we have also included the investment share in the growth regression (averaged over
the nineties). The estimated coefficient of the investment share is positive, although
insignificant, under both 2SLS and 3SLS estimations, while the effects of ICRG and the
rest of the variables in the growth regression are not practically affected.
33 Our results in the size of government regression are comparable to those obtained by Persson and Tabellini (2003, chapter 3) for a cross-section analysis in the 1990s. Differences in the degree of significance of some estimated parameters are probably due to the fact that Persson and Tabellini use total government expenditure, while here we use the share of government in GDP, as a measure of the size of government.

23
4. CONCLUSIONS AND POLICY IMPLICATIONS
We solved a dynamic general equilibrium model to study the link between fiscal policy,
incentives and economic growth in the presence of probabilistic electoral uncertainty. The
predictions of the model were tested by using first a panel of 25 OECD countries for the
time period 1982-1996 and second a cross-section of 108 industrial and developing
countries over 1990-2000. The focus was on the effects of electoral uncertainty and party
competition on the choice of fiscal policy instruments and private incentives and in turn on
the macro-economy. The main result is that electoral competition pushes governments to
follow relatively shortsighted policies in the form of a relatively large public sector, which
in turn distorts private incentives and hurts the economy.
We close with two remarks of caution (see also the Introduction). First, we focused
on the adverse effects of electoral uncertainty. However, as we said, political competition
between selfish political parties can also lead to the implementation of efficient policies
(this is the Chicago school of thought).34 Hence, the policy message is obviously not
against elections. The policy message is that societies should seek ways to secure that
electoral competition does not lead to myopia and corruption. In this respect, the
constitutional design of electoral competition (see e.g. Persson et al. (2003)), as well as the
degrees of information and political freedom, are of great importance. Second, what we
found is that large public sectors, when caused by electoral uncertainty, are bad for
incentives and growth. Angelopoulos et al. (2004) divide countries by using an index of
public sector efficiency, which is similar to that introduced by Afonso, Shuknecht and
Tanzi (2003), and show that, only in countries with inefficiently large public sectors, a
larger size is associated with worse incentives and lower growth.
34 See e.g. the introduction in Persson and Tabellini (1999b).
24
APPENDICES
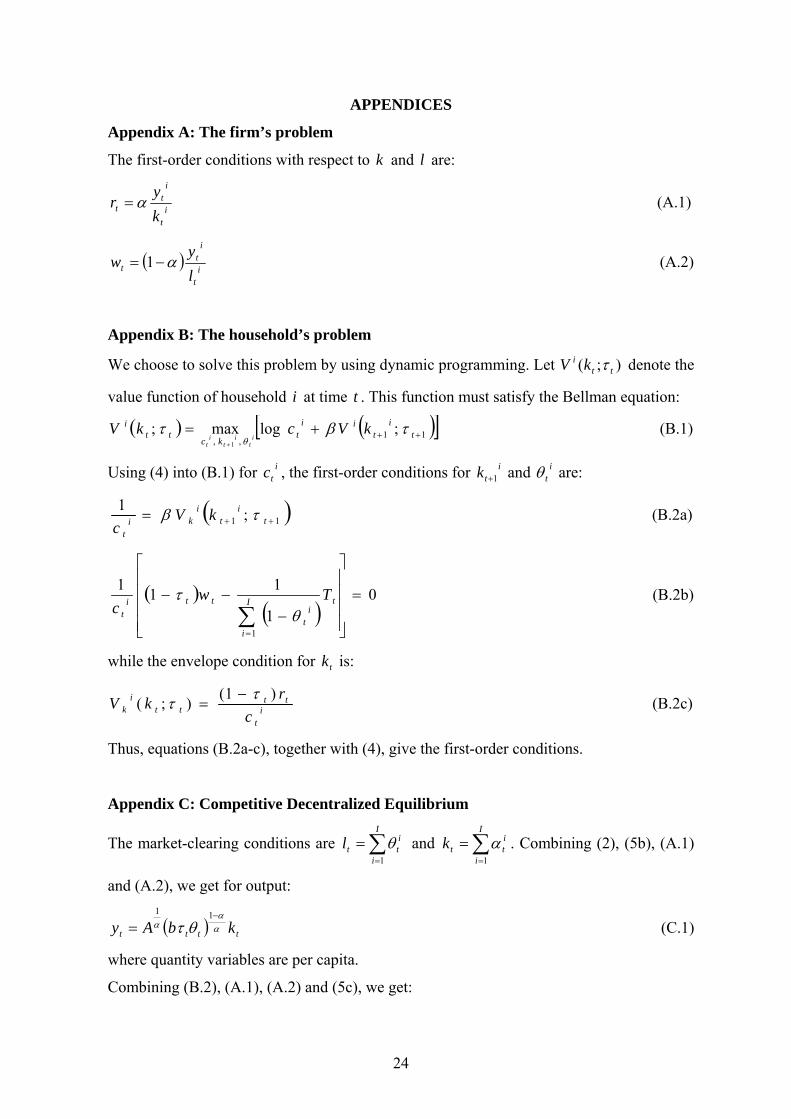
Appendix A: The firm’s problem
The first-order conditions with respect to k and l are:
it
it
t ky
r α= (A.1)
( ) it
it
t ly
w α−= 1 (A.2)
Appendix B: The household’s problem
We choose to solve this problem by using dynamic programming. Let );( tti kV τ denote the
value function of household i at time t . This function must satisfy the Bellman equation:
( ) ( )[ ]11 , ,
;logmax ;1
+++=+
ti
tii
tkc
tti kVckV
it
it
it
τβτθ
(B.1)
Using (4) into (B.1) for itc , the first-order conditions for i
tk 1+ and itθ are:
( )11 ;1++= t
it
iki
t
kVc
τβ (B.2a)
( )( )
01
111
1
=
⎥⎥⎥⎥
⎦
⎤
⎢⎢⎢⎢
⎣
⎡
−−−
∑=
tI
i
it
ttit
Twc θ
τ (B.2b)
while the envelope condition for tk is:
it
tttt
ik c
rkV )1();( ττ −= (B.2c)
Thus, equations (B.2a-c), together with (4), give the first-order conditions.
Appendix C: Competitive Decentralized Equilibrium
The market-clearing conditions are ∑=
=I
i
ittl
1
θ and ∑=
=I
i
ittk
1
α . Combining (2), (5b), (A.1)
and (A.2), we get for output:
( ) tttt kbAy αα
α θτ−
=11
(C.1)
where quantity variables are per capita.
Combining (B.2), (A.1), (A.2) and (5c), we get:
25
( )( )( )( ) ( ) 1
11111
0 <−+−−
−−=<
tt
tt b ττα
ταθ
(C.2)
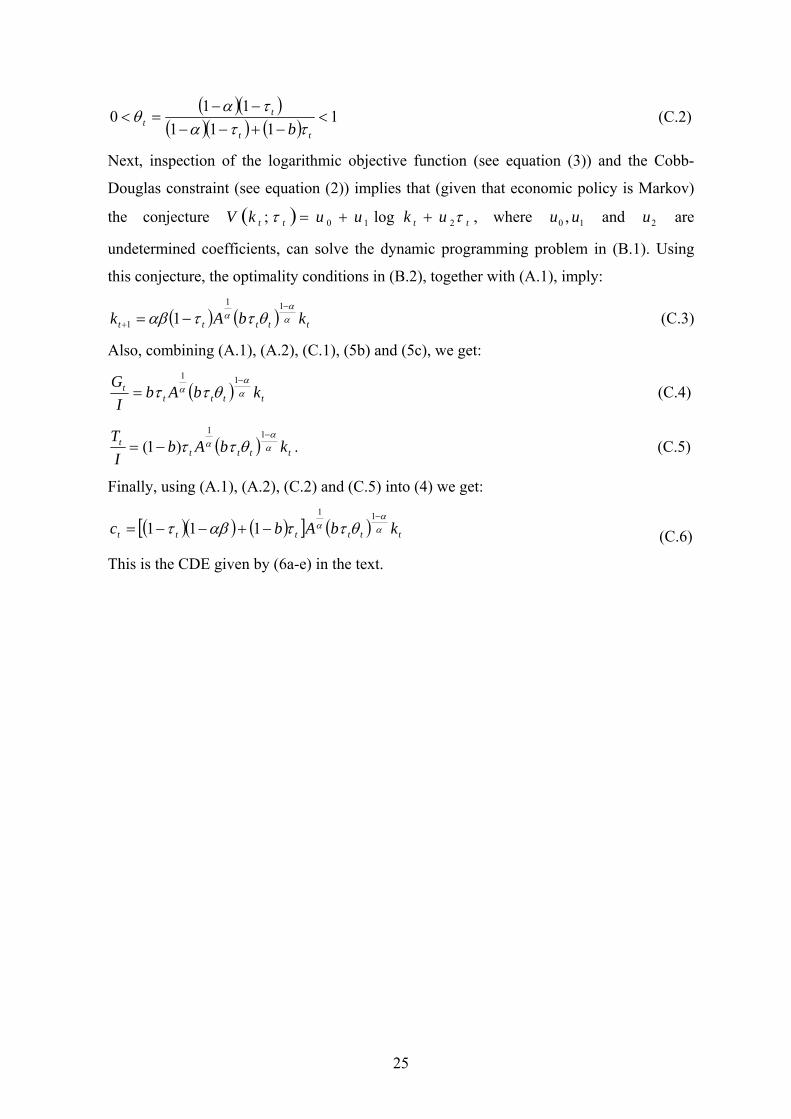
Next, inspection of the logarithmic objective function (see equation (3)) and the Cobb-
Douglas constraint (see equation (2)) implies that (given that economic policy is Markov)
the conjecture ( ) tttt ukuukV ττ 210 log ; ++= , where 10 , uu and 2u are
undetermined coefficients, can solve the dynamic programming problem in (B.1). Using
this conjecture, the optimality conditions in (B.2), together with (A.1), imply:
( ) ( ) ttttt kbAk αα
α θτταβ−
+ −=11
1 1 (C.3)
Also, combining (A.1), (A.2), (C.1), (5b) and (5c), we get:
( ) ttttt kbAb
IG
αα
α θττ−
=11
(C.4)
( ) ttttt kbAb
IT
αα
α θττ−
−=11
)1( . (C.5)
Finally, using (A.1), (A.2), (C.2) and (C.5) into (4) we get:
( )( ) ( )[ ] ( ) tttttt kbAbc αα
α θτταβτ−
−+−−=11
111 (C.6)
This is the CDE given by (6a-e) in the text.

26
REFERENCES
Afonso A., L. Shuknecht and V. Tanzi (2003): Public sector efficiency: An international comparison, European Central Bank, Working Paper, no. 242. Alesina A., N. Roubini and G. Cohen (1997): Political Cycles and the Macroeconomy. The MIT Press, Cambridge, Mass. Alesina A. and G. Tabellini (1990): A positive theory of fiscal deficits and government debt, Review of Economic Studies, 57, 403-414. Angelopoulos K., A. Philippopoulos and E. Tsionas (2004): Is small always beautiful? Laffer curves in fiscal policy, Athens University of Economics and Business, Mimeo. Baltagi B. H. (1981): Simultaneous equations with error components, Journal of Econometrics, 17, 189-200. Baltagi B. H. (1984): A Monte Carlo study for pooling time series of cross section data in the simultaneous equations model, International Economic Review, 25, 603-624. Baltagi B. H. (2001): Econometric Analysis of Panel Data. Second Edition. Wiley. Barro R. (1990): Government spending in a simple model of economic growth, Journal of Political Economy, 98, S103-S125. Barro R. (1997): Determinants of Economic Growth: A Cross-Country Empirical Study. The MIT Press, Cambridge, Mass. Barro R. and J. W. Lee (2001): International data on educational attainment: Updates and implications, Oxford Economic Papers, 53, 541-563. Barro R. and X. Sala-i-Martin (2004): Economic Growth. Second edition. The MIT Press, Cambridge, Mass. Cooper, R. and A. John (1988): Coordinating coordination failures in Keynesian models, Quarterly Journal of Economics, 103, 441-463 Cornwell, C., P. Schmidt and D. Wyhowski (1992): Simultaneous equations and panel data, Journal of Econometrics, 51, 151-181. Drazen A. (2000): Political Economy in Macroeconomics. Princeton University Press, Princeton, New Jersey.
Devereux M. and J-F. Wen (1998): Political instability, capital taxation and growth, European Economic Review, 42, 1635-1651. Economides G., A. Philippopoulos and S. Price (2003): Elections, fiscal policy and growth: Revisiting the mechanism, European Journal of Political Economy, 19, 777-792.

27
Glomm G. and B. Ravikumar (1994): Public investment in infrastructure in a simple growth model, Journal of Economic Dynamics and Control, 18, 1173-1187. Glomm G. and B. Ravikumar (1997): Productive government expenditures and long-run growth, Journal of Economic Dynamics and Control, 21, 183-204. Grossman H. and J. Mendoza (2003): Scarcity and appropriative competition, European Journal of Political Economy, 19, 747-758. Hall R. E. and C. I. Jones (1999): Why do some countries produce so much more output per worker than others? Quarterly Journal of Economics, 83-116 Hausman J. A. (1978): Specification tests in econometrics, Econometrica, 46, 1251-1271.
Heston A., R. Summers and B. Aten (2002): Penn World Table Version 6.1, Center for International Comparisons at the University of Pennsylvania (CICUP).
Hsiao C. (2003): Analysis of Panel Data. Second Edition. Cambridge University Press.
Kaufmann D., A. Kraay and M. Mastruzzi (2003): Governance matters III: Governance indicators for 1996-2002, World Bank Policy Research Working Paper, no. 3106, Washington, D.C. Keefer P. and S. Knack (2002): Polarization, politics and property rights: Links between inequality and growth, Public Choice, 111, 127-154. Knack S. and P. Keefer (1995): Institutions and economic performance: Cross-country tests using alternative institutional measures, Economics and Politics, 7, 207-227. Lockwood B., A. Philippopoulos and A. Snell (1996): Fiscal policy, public debt stabilization and politics: Theory and UK evidence, Economic Journal, 106, 894-911. Mauro P. (1995): Corruption and growth, Quarterly Journal of Economics, 110, 681-712. Mauro P. (2002): The persistence of corruption and slow economic growth, IMF Working Paper, no. 02/213, International Monetary Fund, Washington. McCallum B. (1989): Real business cycle models, in Modern Business Cycle Theory, edited by R. Barro. Blackwell, London. Mohtadi H. and T. Roe (1998): Growth, lobbying and public goods, European Journal of Political Economy, 14, 453-473 Mohtadi H. and T. Roe (2003): Democracy, rent seeking, public spending and growth, Journal of Public Economics, 87, 445-466 Mueller D. (2003): Public Choice III. Cambridge University Press, Cambridge. Murphy K., A. Shleifer and R. Vishny (1991): The allocation of talent: Implications for growth, Quarterly Journal of Economics, 106, 503-530.
28
Park H., A. Philippopoulos and V. Vassilatos (2003): On the optimal size of public sector under rent-seeking competition from state coffers, CESifo Working Paper, no. 991, Munich. Perotti R. (1996): Income distribution, democracy and growth: What the data say, Journal of Economic Growth, 1, 149-187.
Persson T. and G. Tabellini (1999a): Political economics and macroeconomic policy, in Handbook of Macroeconomics, vol. 1C, edited by J. Taylor and M. Woodford, North-Holland, Amsterdam. Persson T. and G. Tabellini (1999b): The size and scope of government: Comparative politics with rational politicians, European Economic Review, 43, 699-735. Persson T. and G. Tabellini (2000): Political Economics: Explaining Economic Policy. The MIT Press, Cambridge, Mass. Persson T. and G. Tabellini (2003): The Economic Effects of Constitutions. The MIT Press, Cambridge, Mass. Persson T., G. Tabellini and F. Trebbi (2003): Electoral rules and corruption, Journal of the European Economic Association, 4, 958-989. Rodrik D. (1998): Why do more open economies have bigger governments?, Journal of Political Economy, 106, 997-1032. Rodrik D. (1999): Where did all the growth go? External shocks, social conflict and growth collapses, Journal of Economic Growth, 4, 385-412. Tanzi V. (2002): Corruption around the world: Causes, consequences, scope and cures, in Governance, Corruption and Economic Performance, edited by G. Abed and S. Gupta, International Monetary Fund, Washington, D.C. Treisman D. (2000): The causes of corruption: A cross-national study, Journal of Public Economics, 76, 399-457 Tullock G. (1967): The welfare costs of tariffs, monopolies and theft, Western Economic Journal, 5, 224-232. Wooldridge J. W. (2002): Econometric Analysis of Cross Section and Panel Data. The MIT Press, Cambridge, Mass.

29
TABLE 1: The effects of electoral uncertainty on fiscal policy, rent-seeking and growth
(25 OECD countries, 82-86, 87-91, 92-96)
Dep. variable:
growth rate
(1) 2SLS†
(2)
EC2SLS
(3)
GMM-EC3SLS
Dep. variable:
ICRG
(1) 2SLS†
(2)
EC2SLS
(3)
GMM-EC3SLS
Dep. variable: size of
government
(1) OLS†
(2) Random Effects GLS
(3)
GMM-EC3SLS
size of government
-0.2595 (-1.22)
0.0394 (0.49)
0.0483 (0.52)
size of government
-0.6521 (-1.75)
-0.2871** (-2.05)
-0. 3026** (-2.36)
electoral uncertainty
9.2220 (1.36)
9.5080* (1.68)
11.5019** (2.73)
ICRG 0.3271 (1.76)
0.2246** (1.98)
0 .4187** (3.37)
democracy (gastil)
2.4544 (2.85)
1.7517** (2.42)
1.4461** (2.18)
lgdp 1.6105 (0.93)
2.5912 (1.06)
2.7394 (1.28)
lgdp -5.1225 (-2.35)
-4.8775** (-3.58)
-6.8068** (-4.54)
lgdp 6.4391 (2.78)
5.5576** (2.09)
6.3737** (2.62)
pop 15-64 -0.3697 (-1.60)
-0.6637** (-2.39)
-0.7207** (-3.78)
openness -0.0031 (-0.14)
-0.0110 (-0.82)
-0.0222 (-1.48)
openness 0.0879 (3.42)
0.0726** (2.66)
0.0821** (3.43)
constant 18.2402 (1.10)
28.1494 (1.20)
29.9136 (1.46)
education -0.2157 (-0.81)
0.0756 (0.41)
-0.0945 (-0.48)
education 0.6472 (1.59)
1.2305** (2.75)
1.1360** (2.89)
constant 41.3667 (3.03)
38.0329** (4.13)
49.6937** (4.93)
constant -15.5431 (-0.74)
-16.5347 (-0.69)
-24.3025 (-1.10)
Notes: t-ratios are in parentheses. An asterisk denotes significance at the 10% level and two asterisks at the 5% level † The t-ratios are obtained using inconsistent standard errors.

30
TABLE 2: The effects of electoral uncertainty on fiscal policy, rent-seeking and growth, controlling for investment
(25 OECD countries, 82-86, 87-91, 92-96)
Dep. variable:
growth rate
(1)
EC2SLS
(2)
GMM-EC3SLS
Dep. variable:
ICRG
(2)
GMM-EC3SLS
Dep. variable: size of
government
(2)
GMM-EC3SLS
size of government
0.0353 (0.54)
0.0467 (0.63)
size of government
-0.2982** (-2.33)
electoral uncertainty
11.3108**(2.64)
ICRG 0.1511 (1.41)
0.3878** (3.56)
democracy (gastil)
1.5894** (2.43)
lgdp 2.4774 (1.15)
lgdp -3.9318** (-3.12)
-6.2268** (-4.75)
lgdp 5.9292** (2.44)
pop 15-64 -0.6414**(-3.20)
openness -0.0032 (-0.27)
-0.0188 (-1.46)
openness 0.0811** (3.38)
constant 27.2510 (1.32)
education 0.0541 (0.34)
-0.1618 (-0.99)
education 1.1904** (3.01)
investment share
0.1250** (2.59)
0.0986** (2.04)
constant -20.3012 (-0.92)
constant 29.2534** (3.31)
43.6899** (4.74)
Notes: t-ratios are in parentheses. An asterisk denotes significance at the 10% level and two asterisks at the 5% level
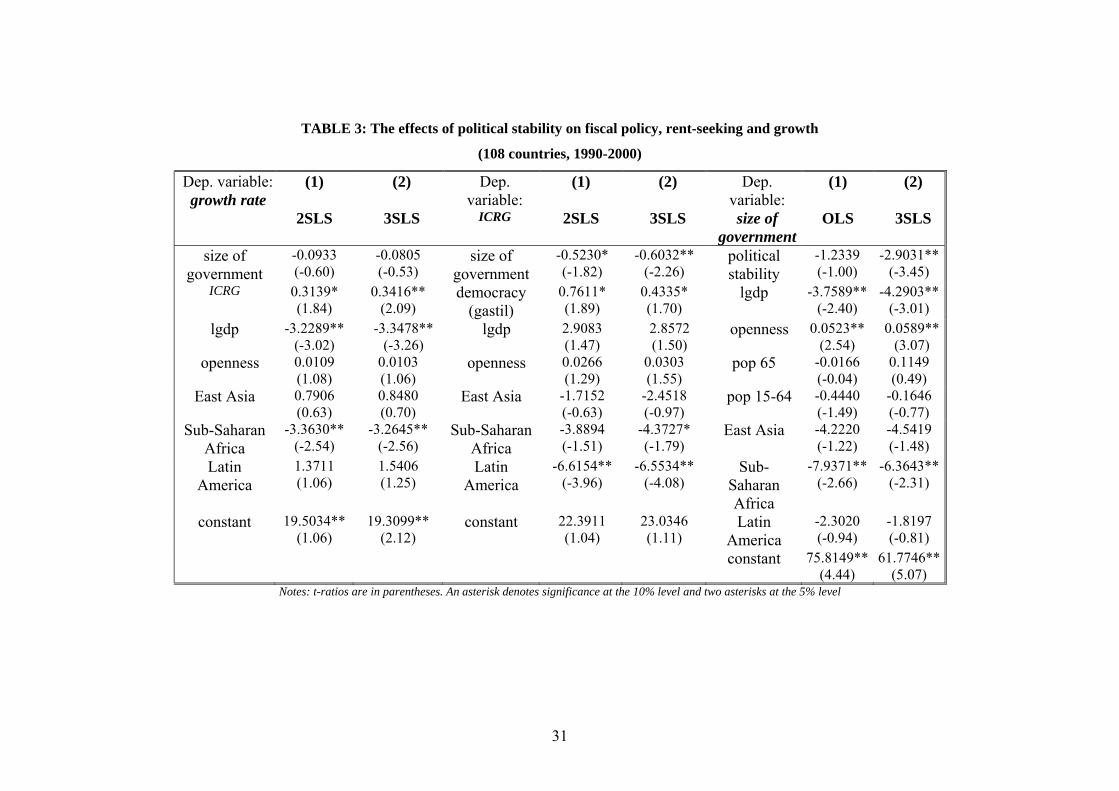
31
TABLE 3: The effects of political stability on fiscal policy, rent-seeking and growth
(108 countries, 1990-2000)
Dep. variable: growth rate
(1)
2SLS
(2)
3SLS
Dep. variable:
ICRG
(1)
2SLS
(2)
3SLS
Dep. variable: size of
government
(1)
OLS
(2)
3SLS
size of government
-0.0933 (-0.60)
-0.0805 (-0.53)
size of government
-0.5230* (-1.82)
-0.6032** (-2.26)
political stability
-1.2339 (-1.00)
-2.9031**(-3.45)
ICRG 0.3139* (1.84)
0.3416** (2.09)
democracy (gastil)
0.7611* (1.89)
0.4335* (1.70)
lgdp -3.7589** (-2.40)
-4.2903**(-3.01)
lgdp -3.2289** (-3.02)
-3.3478** (-3.26)
lgdp 2.9083 (1.47)
2.8572 (1.50)
openness 0.0523** (2.54)
0.0589**(3.07)
openness 0.0109 (1.08)
0.0103 (1.06)
openness 0.0266 (1.29)
0.0303 (1.55)
pop 65 -0.0166 (-0.04)
0.1149 (0.49)
East Asia 0.7906 (0.63)
0.8480 (0.70)
East Asia -1.7152 (-0.63)
-2.4518 (-0.97)
pop 15-64 -0.4440 (-1.49)
-0.1646 (-0.77)
Sub-Saharan Africa
-3.3630** (-2.54)
-3.2645** (-2.56)
Sub-Saharan Africa
-3.8894 (-1.51)
-4.3727* (-1.79)
East Asia -4.2220 (-1.22)
-4.5419 (-1.48)
Latin America
1.3711 (1.06)
1.5406 (1.25)
Latin America
-6.6154** (-3.96)
-6.5534** (-4.08)
Sub-Saharan Africa
-7.9371** (-2.66)
-6.3643**(-2.31)
constant 19.5034** (1.06)
19.3099** (2.12)
constant 22.3911 (1.04)
23.0346 (1.11)
Latin America
-2.3020 (-0.94)
-1.8197 (-0.81)
constant 75.8149**(4.44)
61.7746**(5.07)
Notes: t-ratios are in parentheses. An asterisk denotes significance at the 10% level and two asterisks at the 5% level