Renewable Energy Project Finance in the U.S.: 2010 … Foresight: 2012-2013 In forecasting capital...
57
greenpaper Renewable Energy Project Finance in the U.S.: 2010-2013 Overview and Future Outlook Produced in Collaboration with January 2012
Transcript of Renewable Energy Project Finance in the U.S.: 2010 … Foresight: 2012-2013 In forecasting capital...

greenpaper
Renewable Energy Project Finance in the U.S.: 2010-2013 Overview and Future Outlook
Produced in Collaboration with
January 2012

greenpaper
Renewable Energy Project Finance in the U.S.: 2010-2013 Overview and Future Outlook
2Copyright © 2012 Mintz, Levin, Cohn, Ferris, Glovsky and Popeo, P.C.
1 EXECUTIVE SUMMARY 31.1 Hindsight: 2010 & 2011 31.2 Foresight: 2012-2013 3
2 KEY FINDINGS 52.1 Hindsight 52.2 Foresight: 2012-2013 62.2.1 Macro Trends 62.2.2 Tax Equity Market 72.2.3 Impact of 1603 Cash Grant’s Expiration 8
3 OVERVIEW: RENEWABLE PROJECT FINANCE 93.1 Corporate Structure 93.2 Capital Formation 103.2.1 Direct Equity 123.2.1.1 Terms & Availability 123.2.1.2 Market Trends 12
3.2.2 Tax Equity 133.2.2.1 Tax Equity Financing Structures 153.2.2.2 Terms & Availability 163.2.2.3 Market Trends 18
3.2.3 Project Debt 193.2.3.1 Loan Characterization 203.2.3.2 Terms & Availability 213.2.3.3 Market Trends 21
3.2.4 Non-Traditional Financing Structures & Instruments 22
4 FEDERAL TAX INCENTIVES & PROGRAMS 244.1 Investment Tax Credit (“ITC”) 244.2 Production Tax Credit (PTC) 244.3 Accelerated Depreciation (MACRS) & Bonus Depreciation 254.3.1 Accelerated Depreciation 254.3.2 Bonus Depreciation 25
4.4 Department Of Energy Title XVII Loan Guarantee Program (Section 1703) Program 254.5 Department of Agriculture’s Biorefinery Assistance (9003) Program 264.5.1 Overview 264.5.2 Program Rules & Bond Financing Structures 274.5.3 Impact 28
5 THE AMERICAN RECOVERY & REINVESTMENT ACT OF 2009 295.1 Title XVII Section 1705 Loan Guarantee Program 295.1.1 Overview 295.1.1.1 Credit Subsidy 29
5.1.1.2 Financial Institution Partnership Program 295.1.2 Impact 30
5.2 ITC Election for PTC Property 335.3 1603 Cash Grant Program 335.3.1 Overview 335.3.2 Impact 345.3.2.1 Onshore Wind 355.3.2.2 Solar 365.3.2.3 Geothermal 365.3.2.4 Biopower 375.3.2.5 Other Renewable Cash Grants 38
6 DEMAND SCENARIOS: PROJECT FINANCING FORECAST THROUGH 2013 396.1 Methodology 406.2 Forecasts by Technology: 2011-2013 416.2.1 Onshore Wind 416.2.1.1 Assumptions 416.2.1.2 Confidence Factors 42
6.2.2 Solar 426.2.2.1 Assumptions 42
6.2.3 Forecast for Other Renewable Energy Technologies 436.2.3.1 Assumptions 43
6.2.4 Biofuels (Ethanol & Biodiesel) 44
7 SUPPLY SCENARIOS: FINANCING AVAILABILITY FORECASTS THROUGH 2013 457.1 Section 1603 Cash Grant Program 457.1.1 Impact 467.1.2 Assumptions 46
7.2 Extension or Expiration of PTC for Utility-Scale Wind 487.3 Other Novel Policy Concepts 487.3.1 Master Limited Partnerships 487.3.2 Technology Neutral Production Cash Grant 49
8 CONCLUSION 50
9 APPENDIX: 2010 Project Data 51
TABLE OF CONTENTS

greenpaper
Renewable Energy Project Finance in the U.S.: 2010-2013 Overview and Future Outlook
3Copyright © 2012 Mintz, Levin, Cohn, Ferris, Glovsky and Popeo, P.C.
1 EXECUTIVE SUMMARY
The Mintz Levin law firm and GTM Research are pleased to provide an analysis of project financing trends for utility-scale renewable power projects and advanced project financing biofuel refineries constructed in the United States, as well as forecasting the anticipated supply and demand levels sought through 2013.
1.1 Hindsight: 2010 & 2011
Since the fourth quarter of 2008, U.S. renewable power project’s ability to secure both equity and debt project financing dropped precipitously due to the systemic turmoil experienced in the global financial markets. As we approach the third anniversary of that economic crisis, the prospects for project financing have improved considerably due to several market trends and significant legislative policy support mechanisms:
• Increased liquidity in the debt markets,
• Lower costs of capital attributable to reduced debt spreads,
• The availability of longer tenors for term-debt,
• The Payments for Specified Energy Property in Lieu of Tax Credits (2009 Recovery Act, Section 1603 Cash Grant
Program “1603 Cash Grants”) originally authorized the American Recovery & Reinvestment Act,
• The U.S. Departments of Energy & Agriculture’s Loan Guarantee Programs, and
• Emergence of Strategic Equity to Supplement Venture Capital and Private Equity Investments.
1.2 Foresight: 2012-2013
In forecasting capital markets and availability for renewable project developers seeking to secure non-recourse project financing, the three (3) most dispositive factors impacting future capital formation trends will be:
• The December 2011 expiration of the 1603 Cash Grants,
• The December 2012 expiration of the Production Tax Credit (“PTC”) for wind, and
• Macro-trends in tax equity financing, which are highly correlated to the financial health of a limited number of large financial institutions.

greenpaper
Renewable Energy Project Finance in the U.S.: 2010-2013 Overview and Future Outlook
4Copyright © 2012 Mintz, Levin, Cohn, Ferris, Glovsky and Popeo, P.C.
Figure1-1:MAP OF RENEWABLE ENERGY PROJECT FINANCE TRANSACTIONS THAT CLOSED IN 2010
Source: Source: GTM Research
Ivanpah
Shepherds Flat
Alta Wind Phases II-V
Agua Caliente
Davidson
Rollcast Piedmont Biomass Plant
Cedar or Oak
White Oak
Avenal
California Valley Solar Ranch (CVSR)
Adelanto
Hudson Ranch Power I Salton Sea
Dixie Valley
Blue Mountain
Neal Hot Springs
Windstar
Idaho WindPartners I
Vantage Wind Farm
Lynn
Fowler Ridge WindFarm Phase II
Sheffield
Central States Wind Farm
High LonesomeMesa
Kingman
Central States Wind Farm
Laredo Ridge Wind Farm
Central States Wind Farm
Valley View
Milford Wind CorridorPhase II
Rollins Wind
Berkshire Wind
Stephentown
Johnson City
Goshen NorthWind Warm
Keenan II Wind Farm
Solana
Kahuku
$M S
CA
LE
$2,180
$21
CSP PROJECTS
IvanpahSolana
$2,180$1,967
WIND PROJECTS
Shepherds FlatAlta Wind Phases II-VIdaho Wind Partners IGreen Frontier Wind Farm LynnFowler Ridge Wind Farm Phase IIKeenan II Wind FarmMilford Wind Corridor Phase IIGoshen North Wind WarmWindstarCentral States Wind FarmLaredo Ridge Wind FarmHigh Lonesome MesaRecord Hill WindKahukuRollins WindSheffieldVantage Wind FarmBerkshire WindKingmanValley View
$2,128$1,953
$391$377$376$348$319$312$285$275$255$200$190$153$148$140$136$116
$66$24$21
$1,719$1,637
$241$173$150
$50$50$32
$401$286$282$129
$208
STORAGE PROJECTS
StephentownJohnson City
$69$24
PV PROJECTS
Agua CalienteCalifornia Valley Solar Ranch (CVSR)AvenalDavidsonCedar or OakWhite OakAdelanto
GEOTHERMAL PROJECTS
Hudson Ranch Power I Salton SeaDixie ValleyBlue MountainNeal Hot Springs
BIOMASS PROJECTS
Rollcast Piedmont Biomass Plant

greenpaper
Renewable Energy Project Finance in the U.S.: 2010-2013 Overview and Future Outlook
5Copyright © 2012 Mintz, Levin, Cohn, Ferris, Glovsky and Popeo, P.C.
2 KEY FINDINGS
2.1 Hindsight
• In 2010, renewable energy projects secured a total of $18.5 billion in debt and equity capital.
Figure2-1:U.S. Renewable Energy Project Finance Debt and Equity by Technology in 2010
• From 2009 – 2011, the 1603 Cash Grants provided significant liquidity to renewable project developers by allowing thousands of projects to directly monetize the 30% and 10% Investment Tax Credits (“ITC”) , alleviating the need to identify a tax equity partner.
• Since its inception through November 2011, $9.78 billion in 1603 Cash Grants were distributed to 4,254 projects. Assuming private sector investments constituted the remaining ~70% of projects costs, the 1603 Cash Grants catalyzed approximately $22.8 billion in additional investment for a total deployment of approximately $32.6 billion.
Debt (To be repaidby Cash Grants),
$4.1B
Debt (Construction& Term), $6.8B
Equity, $7.6B
Wind, $8.4B
Solar, $1.7B
Other, $0.8B
Wind, $5.8B
Solar, $1.3BOther, $0.5B
$0
$2
$4
$6
$8
$10
$12
$14
$16
$18
$20
Finance Type By Technology
$18.5B $18.5B
Bill
ion
Equ
ity D
ebt

greenpaper
Renewable Energy Project Finance in the U.S.: 2010-2013 Overview and Future Outlook
6Copyright © 2012 Mintz, Levin, Cohn, Ferris, Glovsky and Popeo, P.C.
Figure2-4:# of Projects Awarded Cash Grants By Technology
Source: U.S. Department of the Treasury, GTM Research
Wind 79%
Solar 15%
Biomass, Geothermal,Hydro, Tidal, ect. 6%
Wind231
Solar 3,617
Biomass, Geothermal,Hydro, Tidal, etc. 176
Figure2-2:Cash Grants Issued Under Section 1603 (Inception in 2009 to November 16, 2011)
Source: U.S. Department of the Treasury, GTM Research
Type # of Projects Total Amount Awarded ($M) $M/per Project
Wind 231 $7,704 $33.4
Solar 3,617 $1,512 $0.4
Biomass, Biofuels, Geothermal, Hydro, Tidal, etc. 176 $566 $3.2
Total 4,254 $9,782 $2.3
Figure2-3:Percentage Awarded by Technology
Source: U.S. Department of the Treasury, GTM Research
2.2 Foresight: 2012-2013
2.2.1 Macro Trends
• For 2012-2013, we anticipate the renewable power sector to seek over $90 billion in project financing. We also predict—stipulating significant uncertainty exists for domestic energy policy and global capital markets— the capital demands of renewable projects seeking project financing will continue to grow at a compounded annual growth rate (CAGR) of approximately 16.2% over the next two (2) years, increasing to $41.2 billion in 2012, and $48.9 billion in 2013.

greenpaper
Renewable Energy Project Finance in the U.S.: 2010-2013 Overview and Future Outlook
7Copyright © 2012 Mintz, Levin, Cohn, Ferris, Glovsky and Popeo, P.C.
Figure2-5:U.S. Renewable Energy Project Finance Demand, Estimates 2011-2013
Source: GTM Research
• Of the more than $90 billion in anticipated project financing costs sought by large-scale, renewable projects in the U.S. through 2013, the ratios and availability of debt, tax equity, and direct equity in project finance structures will be attributable to several variables, including:
- Interest rate trends in commercial debt markets,
- Profitability, financial health—and therefore tax appetite— of institutions providing tax equity, and
- Congressional legislation (or inaction) related to Federal financing programs and tax incentives.
• High-quality projects sponsored by experienced developers will have signed power purchase agreements (“PPAs”) from credit-worthy off-takers will continue to secure project financing through 2013.
• Project financing constraints are likely to disproportionately impact smaller projects, less established developers, and/or projects with higher technology or regulatory risks.
2.2.2 Tax Equity Market
• The tax equity markets have improved, but are not expected to exceed pre-financial crisis levels of approximately $6 billion by 2013. For the foreseeable future, traditional tax equity investors will continue to demonstrate a reduced tax appetite while new, non-traditional entrants may continue to enter and grow the market.
• New entrants to the tax equity markets from non-financial industries such as oil, technology, and utility companies will experience steep learning curves which will limit their participation, but will continue to investigate investment opportunities in renewable project assets.
$-
$10.0
$20.0
$30.0
$40.0
$50.0
$60.0
2011 2012 2013
Am
ou
nt
(in
bill
ion
s)
Wind
Other
CSP
PV
$31.1B
$41.2B
$48.9B
Wind
Other
CSP
PV
Wind
Other
CSP
PV
Type 2011 2012 2013
Other $0.6B $0.8B $1.0B
CSP $9.9B $13.4B $16.0B
PV $9.5B $12.9B $15.0B
Wind $11.2B $14.1B $17.0B

greenpaper
Renewable Energy Project Finance in the U.S.: 2010-2013 Overview and Future Outlook
8Copyright © 2012 Mintz, Levin, Cohn, Ferris, Glovsky and Popeo, P.C.
• Tax equity investor participation will be limited to the largest renewable energy projects orproject portfolios. Tax equity investors will conduct protracted diligence on projects to minimize risk exposure, and seek guaranteed or increased returns on their investment as a condition of their continued participation.
2.2.3 Impact of 1603 Cash Grant’s Expiration
• The 1603 Cash Grant Program expired on December 31, 2011. Because Congress did not extend this incentive, many more renewable energy projects will be competing for the limited amount of available tax equity. In addtion, tax equity investors are likely to prefer wind projects through 2013, limiting the solar sector’s ability to monetize Federal tax incentives.
• A return to the tax equity market will undoubtedly raise renewable project developers’ capital costs due to the frictional costs that accompany a more complex transaction. We estimate that the cost of third party tax equity participation will add approximately 300 to 800 basis points (bps) to project capital costs.
• Solar Projects:
- The 1603 Cash Grants expiration would negatively impact the solar sector to the largest degree, as we estimate over 65% of projects planning to commence in 2012-2013 would be solar energy systems.
- If, at some point during 2012, Congress does extend the 1603 Cash Grants beyond 2011, we believe the solar sector will be the primary beneficiary of the program’s continuation. An extension of the 1603 Cash Grant has been predicted to catalyze an additional 2 – 7.4 GW in installed capacity through 2016. (SEIA, 2010)
- With 85% of Concentrating Solar Power (CSP) projects expected to seek project financing through 2013 exceeding ≥100 MW of nameplate capacity, the 1603 Cash Grants would enable project developers to secure financing that otherwise might not be available if only the ITC were available.
• Wind Projects:
- Based on onshore, utility-scale wind developer’s relatively lower participation in the 1603 Cash Grant program compared to other technologies, we do not expect the program’s expiration to heavily impact the pipeline of wind projects in the United States in 2012. Based on project economics, 25% of wind projects today with a choice between electing the cash grant or the PTC still utilize the underlying tax incentive over the cash grant.
- An extension of the 1603 Cash Grants could potentially be of greater significance to the nascent U.S. offshore wind industry. However, given the current regulatory uncertainty facing developers, it is unclear if even a one year extension of the 1603 Cash Grant program could provide the policy certainty necessary to utilize the incentives.
- The expiration of the wind PTC at the end of 2012 is a much more pressing policy issue to the onshore wind industry. In the absence of legislative action, the Federal government would no longer provide any tax incentives to utility-scale, onshore wind projects after 2012.

greenpaper
Renewable Energy Project Finance in the U.S.: 2010-2013 Overview and Future Outlook
9Copyright © 2012 Mintz, Levin, Cohn, Ferris, Glovsky and Popeo, P.C.
3 OVERVIEW: RENEWABLE PROJECT FINANCE
Both renewable power generation and biofuel project developers often finance projects using an asset-based financing structure commonly referred to as project finance. Project developers have preferred project financing structures either because: (a) funding projects entirely on a corporate balance sheet is an economically unfeasible or suboptimal approach, and/or (b) independent power projects present a more attractive investment as a stand-alone project. From an investor’s perspective, the primary factors influencing where a project will be financeable are:
• Projected future cash flows
• Commercial terms and creditworthiness of the power purchase agreement (“PPA”) or off-take agreement
• An engineering, procurement and construction (“EPC”) contract
• Perceived technology risk
• Availability of Federal & State tax and non-tax incentives.
A common development milestone renewable energy project developers must reach to secure any amount of project financing is a signed long-term PPA for power, or an off-take agreement for biofuels. Projects without PPAs maybe financeable, but at lower leverage ratios, higher debt costs, and only for select projects developed by experienced developers with a proven track record of managing market risk. Biofuels projects without off-takes are virtually not financeable.
3.1 Corporate Structure
In a typical project finance structure, debt and equity are provided directly to a company formed solely for the purpose of developing a renewable energy project, rather than to a project sponsor (e.g., parent company) or other equity investor. The project company is typically a limited-liability company (LLC) or, in some cases, a limited partnership (LP) owned by project equity investors.
A project company holds title to all of a project’s assets, is entitled to a project’s available Federal & State tax incentives, and is liable for contractual rights and obligations arising out of project activities. As an LLC or LP, equity investors are shielded from personal liability should the project fail to meet its loan servicing obligations, or other events triggering a default.
For debt providers extending credit to a project company, project-level loans are non-recourse or limited recourse in nature, meaning project debt is secured generally by the project’s assets (collateral), and paid off by the project’s cash flow. Non-recourse lenders are entitled only to repayment from the profits of the project and in the event of default have virtually no ability to pursue non-project assets owned by the developer and other equity investors.

greenpaper
Renewable Energy Project Finance in the U.S.: 2010-2013 Overview and Future Outlook
10Copyright © 2012 Mintz, Levin, Cohn, Ferris, Glovsky and Popeo, P.C.
Figure3-1:Typical Project Finance Structure for Renewable Energy in the U.S.
Source: GTM Research
3.2 Capital Formation
Although historically ad hoc and varying project by project, U.S. renewable energy projects generally rely upon a combination of four different sources of capital:
• Direct Equity
• Tax Equity
• Project Debt
• Non-Traditional Sources.
Based on robust data collected via public filings, press releases, project focus articles, and discussions with banks and developers, we assess the current market rates and returns required by those capital providers to invest in U.S. renewable energy projects.
Project Equity
Utility/Offtaker
* Sale-leaseback * Partnership flip* Lease pass-through
Tax Equity Debt
* Construction Loan* Term Loan* Bridge Loan* Mezzanine, etc.
Project Company (Borrower)
$ $ $$ $
Contractor EquipmentSupplier Service Provider Other
PPA EPC Supply Contractand Warranties
O&MAgreement
TechnologyLicense, RECAgreement, etc.
* Direct Equity - Project Developer - Private Equity Investor
$

greenpaper
Renewable Energy Project Finance in the U.S.: 2010-2013 Overview and Future Outlook
11Copyright © 2012 Mintz, Levin, Cohn, Ferris, Glovsky and Popeo, P.C.
Figure3-2:Estimates of Current Debt and Equity Terms
Source: GTM Research, Dealogic, Project Finance Magazine
2.2%
2.5%
2.5%
5.5%
5.75%
7.0%
7.5%
7%
7.5%
8.0%
9%
9.5%
10%
7.5%
8%
8%
11%
12%
12%
Wind (7-25 yrs.)
PV
CSP
Wind
PV
CSP
Wind
PV
CSP
Wind
PV
CSP
Wind
PV
CSP
0% 5% 10% 15% 20%
Direct / Sponsor
Equity** (Long Term)
10%
10%
12%
15%
16%
17%
3.7% (LIBOR+175-325bp)
PV (8-15 yrs.)
Wind (4-18 yrs.)
Tax Equity** (levered)
Tax Equity** (unlevered)
Fixed Debt*
Floating Debt*
3.5% (LIBOR+200-300bp)
CSP (22 yrs.)
8.0%
7.25%
5.5%
3.5% (LIBOR+200-300bp)
13%
Wind (Bridge Loan)
11%
12%
12%
* Debt has an upfront fee of 200-275bp ** Equity returns are after-tax. Tax equity investors may also request a small, e.g., 2% annualcash return in addition to tax credits.
Direct / Sponsor Equity**
(Development) 14.5%
15%
15%

greenpaper
Renewable Energy Project Finance in the U.S.: 2010-2013 Overview and Future Outlook
12Copyright © 2012 Mintz, Levin, Cohn, Ferris, Glovsky and Popeo, P.C.
3.2.1 Direct Equity
A component of essentially all project financings, project equity (“cash equity” or “private equity”) is invested by project sponsors as well as other private equity investors. Generally, direct equity investors provide a specified amount of capital in a project in return for a share of the project’s future cash flows.
The amount of equity provided by a project sponsor’s equity contribution will depend on a projects sponsors’ financial strength and the scope of participation by other debt, tax equity, and equity providers.
3.2.1.1 Terms & Availability
Expected returns vary widely for direct equity investors who may accept lower returns in order to secure PPAs — the typical condition precedent to securing other sources of capital.
Currently, hurdle rates (the required rate of return on investment) for direct equity participants in renewable energy projects are largely contingent on project size and type of technology deployed.
Figure3-3:Direct Equity Investor Hurdle Rates for Renewable Energy Projects by Technology
The lower bound for direct equity returns is typically associated with larger projects using proven technologies and attracting numerous equity investors competing to participate. Smaller projects or projects using more nascent technologies with higher perceived investor risk (due to lack of operational track record and technology performance) would command returns approaching the upper hurdle rate bound.
3.2.1.2 Market Trends
The single largest direct equity investment in 2010 was an $835M equity contribution from an undisclosed foreign investor in the CanTex wind development in Texas. The second and third largest equity investments were project developers taking significant equity positions in their own projects – Spanish-based Abengoa invested over $500M its Solana CSP plant in Arizona, and Caithness invested $351M in its Shepherds Flat wind project in Oregon which when placed in service will be the largest wind project in the world.
Project Technology Hurdle Rate
Onshore Wind 7.5 -10%
Solar: PV & CSP 8.0 -15%
Geothermal
10 - 15%Biopower & Biofuels
Energy Storage

greenpaper
Renewable Energy Project Finance in the U.S.: 2010-2013 Overview and Future Outlook
13Copyright © 2012 Mintz, Levin, Cohn, Ferris, Glovsky and Popeo, P.C.
Figure3-4:Top 10 Providers of Direct Equity to Renewables Projects in 2010
Source: GTM Research, Project Finance Magazine
3.2.2 Tax Equity
A tax equity market exists because the renewable energy industry does not often possess a significant level of tax liability—a prerequisite to fully realizing the maximum value of the primary Federal policy support mechanisms for renewable energy - tax incentives.
To overcome tax inefficiencies resulting from the disconnect between Federal policy mechanisms and targeted beneficiaries, renewable energy project developers often construct project financing models to attract participation by third-party tax equity partners who—due to their large tax liabilities (appetite) —are better positioned to utilize Federal tax benefits accruing to renewable energy projects under current Federal tax policies. Such an arrangement provides a structure in which renewable energy project developers may leverage their tax incentive as a capital formation tool, while an investor with a large tax appetite may gain access to an additional tax incentive to reduce their corporate liabilities.
$835M
$517M
$351M
$329M
$210M
$203M
$186M $115M $107M
$92M
$974M
$0
$500
$1,000
$1,500
$2,000
$2,500
$3,000
$3,500
$4,000
All Renewables
CanTex Wind Projects in TX
Solana Solar (CSP) in AZ
Wild Prairie Wind in IA & SD
$245M Alta Wind II-V in CA $85M Alta Wind I in CA
Shepherd's Flat Wind in OR
Top of the World Wind in WY
$3,919M
Blue Mountain Geothermal in NV
Keenan II Wind in OK Vantage Wind in WA
Piedmont Green Biomass in GA
Mill
ion
All Others
InvenergyCPV
All Others
Atlantic PowerDuke Energy
NGP
Nextera Energy
UndisclosedForeign Investor
Terra-Gen Power, LLC
Caithness Energy
Abengoa Solar
greenpaper
Renewable Energy Project Finance in the U.S.: 2010-2013 Overview and Future Outlook
14Copyright © 2012 Mintz, Levin, Cohn, Ferris, Glovsky and Popeo, P.C.
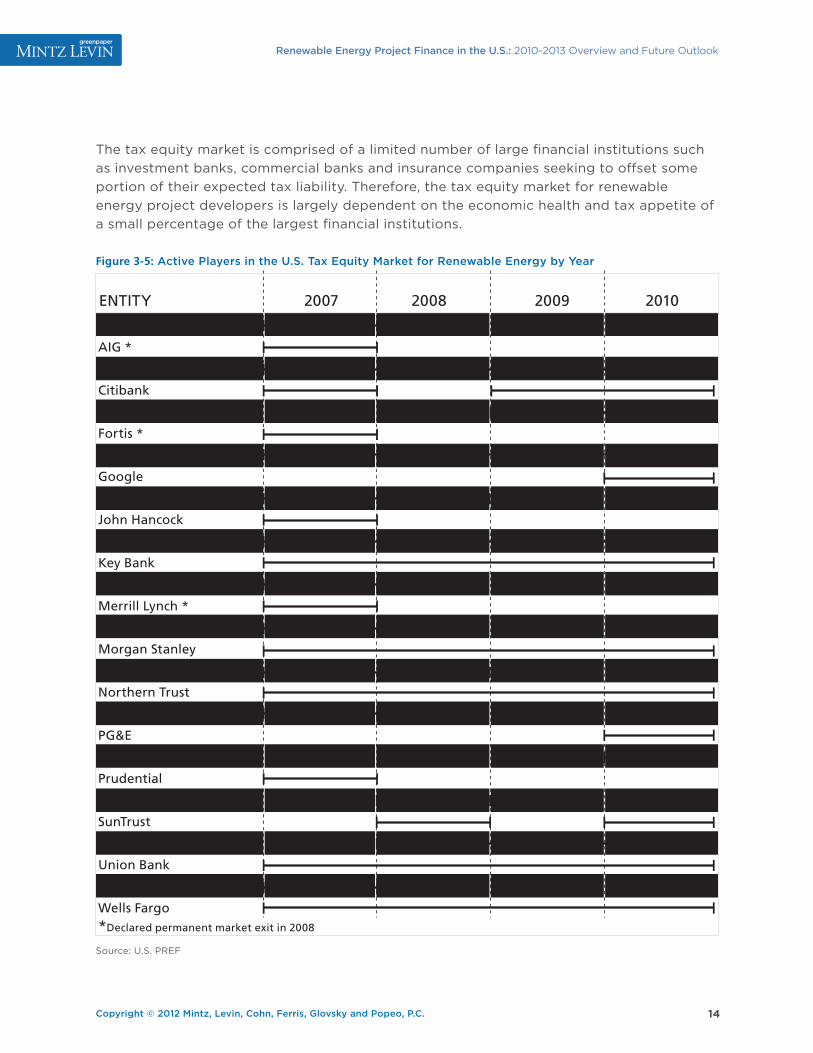
The tax equity market is comprised of a limited number of large financial institutions such as investment banks, commercial banks and insurance companies seeking to offset some portion of their expected tax liability. Therefore, the tax equity market for renewable energy project developers is largely dependent on the economic health and tax appetite of a small percentage of the largest financial institutions.
Figure3-5:Active Players in the U.S. Tax Equity Market for Renewable Energy by Year
Source: U.S. PREF
ENTITY 2007 2008 2009 2010
ABN Armo *
AIG *
Bank of America
Citibank
Credit Suisse
Fortis *
GE EFS
HSH Nordbank
John Hancock
JP Morgan Chase
Key Bank
Lehman Brothers *
Merrill Lynch *
MetLife
Morgan Stanley
New York Life
Northern Trust
U.S. Bank
PG&E
PNC
Prudential
Sempra Energy
SunTrust
Northwestern Mutual
Union Bank
Wachovia *
Wells Fargo*Declared permanent market exit in 2008

greenpaper
Renewable Energy Project Finance in the U.S.: 2010-2013 Overview and Future Outlook
15Copyright © 2012 Mintz, Levin, Cohn, Ferris, Glovsky and Popeo, P.C.
3.2.2.1 Tax Equity Financing Structures
The two most commonly used tax equity financing structures for renewable energy projects in the U.S. are (a) the sale-leaseback model, and (b) the partnership-flip model.
A. Sale-Leaseback Model.
Figure3-6:Typical Sale-Leaseback Model
Source: GTM Research
In a sale-leaseback project financing structure, a renewable energy project developer will finance and construct a project, then arrange to sell the equipment eligible for Federal tax incentives to a third party tax-equity partner at fair market value (“FMV”) within 90 days of the project being placed in service.
After executing the sale, the tax-equity partner— now holding title to the renewable energy equipment—leases the equipment back to the developer at a fixed rent for a period equal to or exceeding the PPA or off-take contract.
The developer (now a leasee) continues to operate the project, and uses project revenues to repay the rent owed to the tax-equity partner (now a lessor) for leasing the equipment. At the end of the lease term which is typically longer than 15 years for renewable power projects, the tax equity investor (lessor) has the option to retain ownership of the project equipment, or sell it to the developer at its fair market value.
A sale-leaseback project finance structure model can be mutually beneficial to both the project developer and the tax equity investor. For the tax equity investor, owning title to the renewable energy project equipment entitles that entity to claim all available Federal tax incentives and environmental attributes (e.g., renewable electricity credits) associated with the project, offsetting other tax liabilities incurred by the entity during the fiscal year and generating another source of revenue through direct or indirect participation in various renewable energy credit (“REC”) markets. For the project developer, a sale-leaseback structure affords the developer an ability to recoup its entire equity investment in a project, plus a development fee, when the project is placed in service.
Project
Project Developer
Utility/ Offtaker ITC, PTC, Bonus
Depreciation/MACRS
Equipment Sale
Sale Leaseback
Rent
PPA
Electricity
Dev
elo
pm
ent
Tax Lessor
Collateral

greenpaper
Renewable Energy Project Finance in the U.S.: 2010-2013 Overview and Future Outlook
16Copyright © 2012 Mintz, Levin, Cohn, Ferris, Glovsky and Popeo, P.C.
B. Partnership Flip-Model.
Figure3-7:Partnership Flip Model Under IRS Safe Harbor
Source: GTM Research
In a partnership-flip model, a project developer and tax equity investor create, capitalize, and co-own a special purpose entity formed to build and operate a renewable energy project. This entity is usually a partnership, which collects all project cash flows revenue and tax benefits.
At the outset of a partnership-flip venture, the tax equity investor makes a disproportionately larger equity investment in the partnership (99%) in exchange for all near-term project revenues and Federal tax incentives generated by the project. The distribution of future revenues and tax credits from the partnership to the tax equity investor, project sponsor, and other investors is negotiated on a project-by-project basis, and can vary significantly.
In all partnership-flip structures, the tax equity investor will require a certain internal rate of return (“IRR”) for his participation, often designed to be achieved at the point in time when all known, available Federal tax incentives to a project have been realized. Once the tax equity investor realizes the negotiated IRR, the allocation of the project’s cash flows “flips”, and the developer is allocated the majority (~95%) of project revenues realized by the partnership vis-à-vis the negotiated PPA agreement.
After the partnership flips, the project developer often holds an option to buy out the tax equity investor’s remaining post-flip equity stake (~5%) at fair market value, positioning the developer to realize all future project revenues free and clear of the tax equity investor.
3.2.2.2 Terms & Availability
The three primary project characteristics that will determine the availability of tax equity are project:
• Size
• Technology maturity
• Gearing ratios (debt to equity ratios commonly referred to as project leverage).
Tax Equity Investors
Project
Project Developer
Utility/Offtaker
Revenue:
99%Pre-Flip
5%Post-Flip
PPA
Electricity
Reve
nue:
1%Pr
e-Fl
ip
95%
Post
-Flip
Capital
Devel
opm
ent
ITC, PTC, Depreciation/MACRS: 99%

greenpaper
Renewable Energy Project Finance in the U.S.: 2010-2013 Overview and Future Outlook
17Copyright © 2012 Mintz, Levin, Cohn, Ferris, Glovsky and Popeo, P.C.
Tax equity yields are primarily market driven, although some correlation between commercial interest rates and tax equity yields exists. Additionally, tax equity investors also may seek a small, (~2%) annual cash return on top of revenues generated from monetizing Federal tax credits.
U.S. tax equity supply for renewable energy projects essentially disappeared in late 2008, but has begun to experience a resurgence as institutional banks return to profitability and reaching $3.7 billion in 2010. While this growth trend is a positive, tax equity capacity remains far below pre-crisis levels which peaked at $6.1 billion. Near-term capacity constriction can be attributable to creation of the 1603 Cash Grant Program in 2009.
Figure3-8:Historical Tax Equity Investments Made in the U.S. Renewable Energy Sector Through 2010
Source: U.S. PREF, GTM Research
Leveraged projects incorporating project-level debt increase the cost of tax equity capital by 200-500 bps, and reduce a project’s ability to attract investor participation. Projects with higher gearing ratios present a higher risk profile to tax equity investors, as lenders stand are in a senior position in the event of a default.
Figure3-9:Tax Equity Rates of Return Spreads
Source: GTM Research
$3.2
$6.1
$3.4
$1.2
$3.7
-100%
-50%
0%
50%
100%
150%
200%
250%
$0.0
$1.0
$2.0
$3.0
$4.0
$5.0
$6.0
$7.0
2006 2007 2008 2009 2010
Inve
stm
ents
(in
bill
ion
s)
Percent Change
Project Technology Unleveraged Hurdle Rate Leveraged Hurdle Rate
Onshore Wind 7.0 -10% 9.0 -15%
Solar: PV & CSP 7.5-13% 9.5-18%
Geothermal
10-12% 12-17%Biopower & Biofuels
Energy Storage

greenpaper
Renewable Energy Project Finance in the U.S.: 2010-2013 Overview and Future Outlook
18Copyright © 2012 Mintz, Levin, Cohn, Ferris, Glovsky and Popeo, P.C.
3.2.2.3 Market Trends
Approximately nine (9) established, and sixteen (16) total, tax equity investors continue to actively pursue deals, primarily in the U.S. wind market. The number of players has decreased considerably during the financial crisis as a result of insolvencies, bankruptcies consolidations, and weakened tax bases.
However, profitable non-financial services companies in conventional energy, industrial, and utility sectors are beginning to enter or consider entering the tax equity market. The most notable market entrant was Google, whose entrance to the tax equity market marked a departure from Google’s historical renewable investment strategy, which has been focused on equity investments in early stage companies.
For wind projects using proven technologies, tax equity is fairly accessible. However, securing tax equity for projects deploying either PV or more advanced solar technologies is more difficult. In particular, smaller projects requiring less than $100 million of tax equity will experience the most difficulty in securing such financing.
Figure3-10:Figure III 10: Top 10 Providers of Tax Equity to U.S. Renewables in 2010
Source: GTM Research, Project Finance Magazine
$930M
$875M
$300M
$275M
$260M
$241M
$307M
$200M $187M
$52M $67M
$0
$500
$1,000
$1,500
$2,000
$2,500
$3,000
$3,500
$4,000
All Renewables
$266M Nextera's Heartland Wind $60M First Wind's Sheffield $60M SunEdison Solar PV fund $42M Rollins Wind $502M Other wind projects
$100M SunRun Solar PV fund $60M SolarCity Solar PV fund $140M 2 SunRun/SolarCity transactions
2 Wind & 1 Geothermal
Alta Wind I & 1 other wind deal
3 Wind deals
$351M Shepherds Flat Wind $37M Idaho Wind in ID $487M Alta Wind I & another wind deal
Sungevity & Borrego Solar PV funds
1 Wind deal
$141M Horizon Vento III Wind $100M GCL Solar PV fund
$3,693M
2 Wind deals
All others
Mill
ion
JP Morgan Chase
GE EFS
PG&E
Union Bank
Citibank
Wells Fargo
MetLife
Credit Suisse
Bank of America
U.S. Bank All Others

greenpaper
Renewable Energy Project Finance in the U.S.: 2010-2013 Overview and Future Outlook
19Copyright © 2012 Mintz, Levin, Cohn, Ferris, Glovsky and Popeo, P.C.
A. Institutional Investors
The number of traditional tax equity investors is likely to remain limited over a near to medium-term time frame. The existing tax equity market is niche, and only appeals to a small number of large, profitable institutions with large tax liabilities. Finally, the potential expiration of the PTC for onshore wind in 2012 — the most common type of project involving tax equity investors — would significantly impact the size of the tax equity market.
B. Non-Traditional Investors
Technology companies and utilities represent the newest interest in the tax equity market for renewable projects. Google’s entrance into tax equity is a positive indicator, but insiders question the speed with which non-traditional tax equity investors will enter the market—new entrants have a high learning curve, limiting initial investments.
Google’s total investment in renewable energy projects now exceeds $700 million, with the majority of their participation as a tax equity investor. The company’s initial foray into the market occurred in 2010, with a $40 million tax equity play in two wind farms developed by NextEra Energy Resources in North Dakota. Then, it invested $168 million into BrightSource’s Ivanapah Solar Plant, DOE’s first renewable project loan guarantee recipient.
Utilities such as Duke Energy, Pacific Gas and Electric (PG&E), and Southern California Edison (SCE) are increasingly opting to own renewable energy projects themselves. This trend is largely attributable to amendments to the PTC/ITC eligibility made by the Recovery Act in 2009, increasing the appeal of developing projects on their own balance sheet.
Companies like Google and utilities like PG&E also are gravitating toward a business model in which they capitalize funds to provide debt financing for distributed, solar residential solar systems. These tax equity funds serve as debt financing facilities for solar installers like SunRun, Sungevity, and SolarCity. The solar market is poised for significant growth due to the policy stability of the solar ITC through 2017, and the significant drop in PV prices over the last two years.
However, exiting barriers to other non-institutional investors (i.e., “passive-loss” and “at-risk” rules) will persist, and discourage high-net worth individuals with large tax appetites from participating in tax equity partnerships because they cannot directly on their personal income taxes.
3.2.3 PROJECT DEBT
Project debt is supplied by a bank or syndicate of banks or other financial institutions, which is lent against the expected future cash flow of a project, and secured only by project assets associated with the loan.

greenpaper
Renewable Energy Project Finance in the U.S.: 2010-2013 Overview and Future Outlook
20Copyright © 2012 Mintz, Levin, Cohn, Ferris, Glovsky and Popeo, P.C.
Figure3-11:Main Players in the U.S. Debt Market for Renewable Energy
Source: U.S. PREF
3.2.3.1 Loan Characterization
Debt packages vary by project size and technology, but most renewable power generation projects incorporate one or more of the following debt components:
A. Construction Loans
Construction loans are generally disbursed in several installments triggered by certain project milestones. Over the term of the construction loan, the borrower makes interest-only payments from borrowed funds. When construction is complete, the entire loan matures. In some cases, construction loans will convert to term loans once the project achieves commercial operation. Construction loan interest rates are generally higher than term loans because investor risk prior to commercial operation is typically higher than after a project is placed-in-service.
2007 2008 2009 2010Banco Santander Banco Espirito Santo Banco Espirito Santo Banco Santander
Bayern LB Banco Sabadell Banco Santander Bank of Montreal
BBVA BBVA BNP Paribas Barclays
Dexia BTMU BTMU BBVA
Fortis Calyon (Credit Agricole) Calyon (Credit Agricole) BTMU
HSH Nordbank Citibank CoBank Caja Madrid
JPMorgan Chase Dexia Credit Suisse Citibank
Mizuho HSH Nordbank Dexia Credit Agricole
Natixis ING Helaba Credit Suisse
Nord/LB Lloyds TSB HSH Nordbank Deutsche Bank
Prudential Morgan Stanley John Hancock Dexia
RBS Nord/LB Key Bank Helaba
Union Prudential LBBW ING
RBS Lloyds TSB John Hancock
Scotia Bank Nord/LB Key Bank
UniCredit Prudential LBBW
Union RBS Morgan Stanley
Scotia Bank Natixis
Societe Generale Prudential
UniCredit Rabobank
Union RBS
WestLB Societe Generale
UniCredit
Union
WestLB
=Non-US entity

greenpaper
Renewable Energy Project Finance in the U.S.: 2010-2013 Overview and Future Outlook
21Copyright © 2012 Mintz, Levin, Cohn, Ferris, Glovsky and Popeo, P.C.
B. Equity Bridge Loans
Furnished by debt or equity investors until a project’s primary source of capital is secured, equity bridge loans are short-term credit arrangements which provide financing enabling projects to proceed through their construction phase. Once a developer receives the identified capital, the bridge loan is repaid. Equity bridge financing spreads are similar to construction debt spreads, and have grown in popularity and significance since the inception of the 1603 Cash Grant program in 2009. Because Treasury disburses cash grants covering 30% of a project’s eligible costs within 60 days after the project is placed in service, developers have utilized equity bridge loans to finance construction costs prior to receipt of the cash grant.
C. Term Loans
Project finance term loans are securitized commercial loans with project assets serving as collateral. Term loans typically have floating rates based on a spread above LIBOR, with monthly or quarterly repayment schedules. Term loans for renewable energy projects require long tenors ranging between 10-20 years, although banks have been reluctant to extend loans with such long tenors.
3.2.3.2 Terms & Availability
Tenors on term debt can range widely depending on the technology employed and the firms involved. Term loan tenors contracted significantly following the financial crisis, but have started to lengthen again.
Project debt continues to be available for high-quality wind and solar PV projects, while remaining more difficult for CSP technologies due to higher associated technology and resource development risks. Best-in-class developers and projects can obtain project debt for CSP projects. However, project developers in 2010 relied primarily on government-guaranteed debt to finance large CSP projects. Term debt interest rate spreads for wind projects trended downward in 2010 and early 2011 as the debt markets continue to thaw, but still require an upfront fee of 200-275 bps.
Figure3-12:Floating & Fixed Project Debt Rates by Technology
Source: GTM Research, Dealogic, Project Finance Magazine
3.2.3.3 Market Trends
Due to market maturity and favorable policy schemes abroad, foreign banks—particularly European banks and insurance companies—represent the majority of U.S. renewable project lenders. Other than U.S. Government financing, only six (6) of the 26 primary renewable energy private sector lenders inactive in the market during 2010 were U.S financial institutions.
Project TechnologyFloating Rate
Fixed RateLIBOR +
Onshore Wind 1.75-3.25% 5.5-7.25%
Solar: PV & CSP 2.0%-3% 7.0-10%
Geothermal 3.25% n/a

greenpaper
Renewable Energy Project Finance in the U.S.: 2010-2013 Overview and Future Outlook
22Copyright © 2012 Mintz, Levin, Cohn, Ferris, Glovsky and Popeo, P.C.
Figure3-13:Top 10 Project Debt Providers to U.S. Renewnable Energy Projects in 2010
Source: GTM Research, Project Finance Magazine
However, the number of domestic lenders to renewable energy projects has increased in recent years, filling a financing gap formed as European banks scaled back their exposure in U.S. markets. In particular, Union Bank, a wholly owned subsidiary of The Bank of Tokyo-Mitsubishi UFJ (BTMU), recently has provided significant debt financing for U.S. renewable energy projects.
Finally, the largest single provider of debt to renewable energy projects is the United States government. The U.S. Department of Energy and the U.S. Treasury’s Federal Financing Bank have supplied more than $40 billion to renewable power generation, manufacturing, transmission, and storage projects through loans and loan guarantees since 2009.
3.2.4 Non-Traditional Financing Structures & Instruments
Several other niche financing structures and instruments are available in the commercial market for renewable energy projects such as tax-exempt bonds, private placement bonds, mezzanine debt, and energy savings performance contracts. While this report focuses on traditional project finance structures, a short description of one non-traditional capital pool—tax-exempt bonds—is discussed below.
$1,627M
$698M
$448M
$332M $326M $324M $304M $265M $254M $238M
$6,089M
$0
$2,000
$4,000
$6,000
$8,000
$10,000
All Renewables
12 Wind deals, 1 Biomass deal
8 Wind deals 1 Solar PV deal
7 Wind deals 5 Wind deals, 1 Solar PV, 1 Geothermal
4 Wind deals, 1 Solar PV
5 Wind deals, 1 Solar PV
4 Wind deals, 1 Geothermal 3 Wind deals, 1 Geothermal
$1,450M Abengoa Solana Solar (CSP) $117M First Wind Kahuku Wind in HI $43M Beacon Power Storage $17M AES Johnson City Storage
$10,905M
All others
5 Wind deals Mill
ion
FederalFinancing Bank
Bank of Tokyo-Misubishi UFJ
SantanderRabobank
Union BankBBVA
Credit AgricoleING
Societe GeneraleDexia
All Others

greenpaper
Renewable Energy Project Finance in the U.S.: 2010-2013 Overview and Future Outlook
23Copyright © 2012 Mintz, Levin, Cohn, Ferris, Glovsky and Popeo, P.C.
Tax-exempt entities such as municipalities, local governments, and utility co-operatives who cannot take advantage of tax credits have utilized Clean Energy Renewable Bonds (“CREBs”) until the program expired in November 2010. The list of qualifying technologies was generally the same as that used for the federal renewable energy production tax credit (“PTC”).
The borrower (a public entity) pays back only the principal of the bond at maturity, and the bondholder receives federal tax credits in lieu of the traditional bond interest. The tenor of a CREB is between 15-16 years. The “tax credit” received by the bondholder is calculated by Treasury. It is based on a formula that would permit issuance of such bonds without discount and interest cost to the issuer (e.g., public entity).
Treasury determines rates for CREBs based on general assumptions about credit quality of the class of potential eligible issuers and other factors such as general credit market yield indexes. In practice, Treasury has applied a 70% discount rate on yield estimates for outstanding bonds with investment grade ratings between “single A” and “BBB” for bonds of a similar maturity.
In March 2010, Congress allowed CREB issuers to irrevocably elect to receive a direct payment from the Treasury, instead of issuing tax credits to bondholders. Bondholders now would receive a taxable interest payment (paid by the subsidy) in lieu of a tax credit. The latest round of CREBS authorized in 2009 under the Recovery Act had a “volume limit” of $2.4 billion, which has been allocated fully based on a statutorily prescribed formula.

greenpaper
Renewable Energy Project Finance in the U.S.: 2010-2013 Overview and Future Outlook
24Copyright © 2012 Mintz, Levin, Cohn, Ferris, Glovsky and Popeo, P.C.
4 FEDERAL TAX INCENTIVES & PROGRAMS
4.1 Investment Tax Credit (“ITC”)
Owners of commercial renewable energy generating can receive an investment tax credit for eligible business expenditures related to the development of qualified renewable energy facilities based upon nameplate capacity, placed in service date, and technology. The ITC ranges from 10% to 30%, and applies to solar electricity and thermal technologies, small wind (<100 kW), geothermal electricity and thermal technologies, microturbines, fuel cells, combined heat and power. The credit expires at the end of 2016 for all technologies, except for solar, wind, and geothermal technologies, which have no expiration date.
Figure4-1:ITC by Technology
Source: GTM Research, DSIRE
4.2 Production Tax Credit (PTC)
Owners of commercial renewable energy generating assets are eligible to receive a 1.1 - 2.2 ¢/ KWh of electricity produced for 10 years after the facility is placed in service. Eligible technologies include wind, solar, geothermal, landfill gas, qualified hydropower, marine and hydrokinetic technologies, open and closed-loop biomass, and municipal solid waste technologies. PTC eligibility is limited by size in some instances (open-loop biomass and marine & hydrokinetic < 150 kW). The credit expires at the end of 2012 for wind, and the end of 2013 for all other PTC-eligible technologies.
Figure4-2:PTC by Technology
Source: GTM Research
RESOURCE TYPEITC AS A % OF BASIS
MAXIMUM INCENTIVE
MINIMUM / MAXIMUM SIZE
PLACED IN SERVICE DEADLINE
SOLAR (WATER & SPACE HEAT, THERMAL ELECTRIC, PV)
30% 12/31/16
FUEL CELLS 30% $1,500 PER 0.5 KW 0.5 KW OR GREATER 12/31/16
SMALL WIND 30% 100 KW OR LESS 12/31/16
GEOTHERMAL (ELECTRIC, HEAT PUMPS, DIRECT-USE)
10% 12/31/16
MICROTURBINES 10% $200 PER KW 2 MW OR LESS 12/31/16
CHP/COGENERATION 10% 50 MW OR LESS 12/31/16
Resource Type Eligible In-Service Dates PTC Ammount
Wind 1/1/2009-12/31/12 2.2¢/kWh
Closed-Loop Biomass 1/1/2009-12/31/13 2.2¢/kWh
Open-Loop Biomass (150 kW or larger) 1/1/2009-12/31/13 1.1¢/kWh
Geothermal 1/1/2009-12/31/13 2.2¢/kWh
Landfill Gas 1/1/2009-12/31/13 1.1¢/kWh
Municipal Solid Waste 1/1/2009-12/31/13 1.1¢/kWh
Qualified Hydro 1/1/2009-12/31/13 1.1¢/kWh
Marine & Hydrokinetic (150 kW or larger) 1/1/2009-12/31/13 1.1¢/kWh

greenpaper
Renewable Energy Project Finance in the U.S.: 2010-2013 Overview and Future Outlook
25Copyright © 2012 Mintz, Levin, Cohn, Ferris, Glovsky and Popeo, P.C.
4.3 Accelerated Depreciation (MACRS) & Bonus Depreciation
In addition to the ITC or PTC, renewable energy project developers also can utilize accelerated depreciation schedules for qualifying renewable energy equipment authorized under the tax code. Further, in 2010, Congress passed legislation providing “bonus” depreciation for certain qualifying renewable energy equipment.
4.3.1 Accelerated Depreciation
Accelerated depreciation allowances are provided under the modified accelerated cost recovery system (“MACRS”) for investments in certain energy property. Generally, 95-100% of solar, wind, microturbines, geothermal, CHP, and fuel cell property have permanent, 5-year depreciation schedules under the existing MACRS. Taxpayers must reduce their basis in property by ½ the value of the ITC/1603 Cash Grant, but no reduction is required for projects electing the PTC. Therefore, 85% - 100% of property can benefit from accelerated depreciation.
MACRS provides a significant tax benefit to renewable energy developers. It reduces a project’s taxable income considerably in the first six (6) years of operation and thus improve the project’s overall return on investment. However, developers have not typically used accelerated depreciation to reduce their own tax liability. Instead, they have monetized this incentive in conjunction with other Federal tax incentives to secure capital provided by tax equity investors.
Lawrence Berkeley National Lab (LBNL) estimated that prior to the Recovery Act, accelerated depreciation represented up to 25-27% of installed project costs (in conjunction with either PTC/ITC election), but only 6.8% - 12% of which is due to acceleration (LBNL, 2010). Even after enactment of the 1603 Cash Grant Program, project developers continued to monetize accelerated depreciation to secure additional debt financing in the tax equity markets.
4.3.2 Bonus Depreciation
Since 2008, Congress has authorized, amended, and reauthorized bonus depreciation allowances for qualifying renewable energy property on multiple occasions—and sometimes retroactively—allowing 50% - 100% bonus depreciation during the first year of operation (after reducing the value of ITC/1603 Cash Grant). For eligible projects placed in service before September 8, 2010, the bonus was 50%, and for projects through the end of 2010, project developers could fully depreciate 100% of a project’s adjusted tax basis in the first year of operation.
4.4 Department Of Energy Title XVII Loan Guarantee Program (Section 1703) Program
Section 1703 of Title XVII of the Energy Policy Act of 2005 authorized the Department of Energy (due) to provide financial support in the form of loan guarantees for innovative clean energy technologies that avoid, reduce, or sequester air pollutants or anthropogenic emissions of GHG gases, including: biomass, hydrogen, solar, wind/hydropower, nuclear, advanced fossil energy coal, carbon sequestration practices/technologies, electricity

greenpaper
Renewable Energy Project Finance in the U.S.: 2010-2013 Overview and Future Outlook
26Copyright © 2012 Mintz, Levin, Cohn, Ferris, Glovsky and Popeo, P.C.
delivery and energy reliability, alternative fuel vehicles, industrial energy efficiency projects, and pollution control equipment. Under the Title XVII program, DOE characterizes technologies with more than three (3) implementations or operating for more than five (5) years in the United States and “commercial”, and therefore not eligible for a loan guarantee under the Section 1703 program.
The Section 1703 program provides loan guarantees for up to 100% of 80% a project’s eligible capital costs. At least 20% of the total project costs must be attributable to private sector sourced equity. In instances where the Department of Energy commits to guarantee 100% of 80% of a project’s eligible capital costs, OMB policy and DOE regulations require the Loan Programs Office (“LPO”) to use the Department of Treasury’s Federal Financing Bank (“FFB”) which issues a direct loan to the project sponsor. The policy justification for issuing a direct loan is that if the DOE guarantees the full cost of a commercial loan, commercial lenders would not be taking any project risk, and commercial rates would essentially approximate FFB rates, with a slight premium to reflect the fact that it is agency paper.
While the program had been authorized for five (5) years prior to 2010, the Section 1703 program remained essentially dormant until 2009, and was not used by any renewable energy projects until the passage of the Recovery Act.
4.5 Department of Agriculture’s Biorefinery Assistance (9003) Program
Title IX of the 2008 Farm Bill authorized the U.S. Department of Agriculture (“USDA”) to administer several financing programs to support private sector investment in renewable power and biofuel projects in the United States. Although the DOE’s Title XVII loan guarantee programs can support biofuel projects, USDA’s Biorefinery Loan Assistance Program (9003 Program) made significant headway in 2010 by rewriting program rules to allow developers and lenders to utilize more innovative financing structures.
4.5.1 Overview
Largely modeled on the USDA Business and Industry (B&I) program, USDA’s Section 9003 program can guarantee private sector debt issued for project costs for the development, construction, and retrofitting of advanced bioenergy and bioproduct commercial-scale refineries.
From 2009-2012, Congress authorized $320M in mandatory funding for Section 9003 Program’s credit subsidy costs provided by the Credit Commodity Corporation, and $600 million in discretionary funding for the program which—leveraging 3-4x in anticipated private sector investment—would support over ~ $1 billion in projects. From 2008-2010, Congress did not appropriate any authorized discretionary funding.
The Section 9003 Program can guarantee up to $250 million of senior debt per project. However, until recently, and still in most cases, this funding will not cover more than 80% of the total project costs. Although the program issued a series of Notice of Funding Announcements ( “NOFAs”) from 2008-2010, the program had not issued a rulemaking for the program until April 2010. Instead, it had used the series of NOFAs to provide the rules for the program.

greenpaper
Renewable Energy Project Finance in the U.S.: 2010-2013 Overview and Future Outlook
27Copyright © 2012 Mintz, Levin, Cohn, Ferris, Glovsky and Popeo, P.C.
However, the network of USDA applicants—mostly small agricultural, U.S. regulated commercial banks— were unable or unwilling to offer competitive commercial loans at the low interest rates and long tenors necessary for amortizing the large advanced biofuels projects Congress envisioned when supporting Section 9003. As a result, advanced biofuels projects were unable to utilize the 9003 Program to attract the necessary debt financing from the commercial lending market.
4.5.2 Program Rules & Bond Financing Structures
In response to the Section 9003 Program’s demonstrable difficulties fulfilling the policy objectives originally intended for the program, USDA issued a proposed rule in April 2010, and an interim final rule in February 2011 that ushered in a host of significant changes to the Section 9003 Program. These new rules included an ability to use a novel project financing structure, developed entirely by Mintz Levin, Stern Brothers and Krieg DeVault, allowing capital-constrained projects to access the $1 trillion bond market, providing biofuel project developers access to a much larger pool of capital from an essentially untapped source.
Under the new Section 9003 rules, USDA signaled it will now guarantee up to 90% of eligible project costs under certain conditions, and subject to the program’s $250 million funding ceiling per project. More importantly, the USDA—acting upon the significant input of Mintz Levin, Stern Brothers, and Krieg DeVault—designed a unique bond financing mechanism to enhance the Section 9003 Program.
Under the new Section 9003 Program’s bond financing structure, a project sponsor would issue up to 100% of the debt guaranteed by USDA in the form of credit-enhanced project company bonds (commercial debt) for sale to qualified private investors such as high net worth individuals and larger institutional investors (e.g., hedge, mutual and pension funds). A commercial lender that would have traditionally underwritten a loan guaranteed by USDA would now serve in a new capacity— as a “trustee” for the proceeds of an advanced biofuel project’s bond sale, the bonds’ legal title and other project securities. In the new bond structure, a project issues and sells the bonds in the market, using the sale proceeds to fund project costs, now held in trust by the project’s lending institution, whose trustee status allows the bank to participate in the Section 9003 Program with very little risk exposure.
In the event of additional or unforeseen project costs, a project company may use the bond financing structure to secure further capital by placing additional bonds for sale—still guaranteed by USDA—to secure new proceeds in lieu of seeking a new loan, or modifying/increasing its existing loan.
The proposed bond financing structure approved by USDA has several advantages that will enable commercial-scale bioenergy and bioproduct projects to attract and secure historically elusive debt financing at lower capital costs, and with longer tenors by allowing more liquid, sophisticated, and less risk-averse bond investors to participate in the Section 9003 Federal loan guarantee program.

greenpaper
Renewable Energy Project Finance in the U.S.: 2010-2013 Overview and Future Outlook
28Copyright © 2012 Mintz, Levin, Cohn, Ferris, Glovsky and Popeo, P.C.
4.5.3 Impact
From December 2009 – January, 2011, the Section 9003 Program has announced six (6) conditional loan guarantees commitments with four (4) of the six (6) commitments reaching closure:
• $54.5 Million to Sapphire Energy (closed)
• $80 Million Range Fuels (closed)
• $75 million to INEOS Bio (Bond Financing) (closed)
• $80 million to Enerkem (Bond Financing)
• $250 million to Coskata (Bond Financing)
• $13 million to Freemont Community Digester (closed)
Figure4-3:USDA Section 9003 Biorefinery Assistance Program Loan Guarantees
Three (3) recipients used the new credit-enhanced 100% bond financing mechanism in lieu of commercial loans for their respective projects. Because the Section 9003 Program’s authority is available until 2012, previously unexpended authority is available until the program’s expiration.
Company Project Name Location
Letter of Intent
Date Issued
Expected Comp. Date
Cellulosic ethanol prod. (M of gallons/yr)
Gross electricity prod. cap. (MW)
Amount ($M)
Total Project Cost
Status Feedstock
Sapphire Energy IABR Columbus,
NM Dec-09 Oct-11 1 $55 $135 Closed Algae
Range Fuels
Soperton, GA Jan-09 Mar-11 2Q2011 $80 Closed
non-food biomass (wood chips)
INEOS Bio
BioEnergy Center
Vero Beach, FL Jan-11 Aug-11 2012 8 6 MW $75 Closed
Citrus fruit, vegetable & yard wastes
INDUS Energy
Fremont Communuty Digester
Fremont, MI 3 MW $13 $22 Closed food
waste
Enerkem Pontotoc, MS Jan-11 10 $80 Pending
Municipal solid waste
Coskata AL Jan-11 55 $250 Pending Woody biomass
Total 74 9 MW $552

greenpaper
Renewable Energy Project Finance in the U.S.: 2010-2013 Overview and Future Outlook
29Copyright © 2012 Mintz, Levin, Cohn, Ferris, Glovsky and Popeo, P.C.
5 THE AMERICAN RECOVERY & REINVESTMENT ACT OF 2009
The most consequential Federal investment and incentive package for renewable energy in U.S. history, the Recovery Act fundamentally impacted the project finance landscape in 2010 through a series of grant programs, loan guarantees, and amendments to existing tax incentives.
5.1 Title XVII Section 1705 Loan Guarantee Program
5.1.1 Overview
The Recovery Act amended DOE’s Title XVII Program by authorizing a new, temporary program designed to stimulate job creation. The Section 1705 program, unlike the Section 1703 program, authorized loan guarantees for commercial renewable energy systems, electric power transmission systems and biofuels projects that commenced construction no later than September 30, 2011.
In addition to general technology and economic due diligence, LPO emphasized two (2) criteria factors when assessing projects under the Section 1705 program: (i) “Readiness to Proceed”, a factor arising out of the Recovery Act’s overarching policy objective to stimulate job creation, and (ii) if a project presented “a reasonable prospect of repayment” to the Treasury, a statutory requirement codified in Title XVII of the Energy Policy Act of 2005. Projects DOE determined were both eligible, and good candidates and for a loan guarantee under Section 1705 first received a conditional commitment, with the loan closing in a relatively short, two to eight month time frame.
5.1.1.1 Credit Subsidy
Title XVII also specifies DOE must receive either an appropriation for the credit subsidy cost or payment of that cost by the borrower – the expected long-term liability to the U.S. Government in issuing the loan guarantee. Until the Recovery Act, Congress had not provided DOE with credit subsidy funding—a key obstacle to renewable energy developers utilizing the program. Under the Recovery Act, Congress did so appropriate $5.965 billion in credit subsidy costs, but reprogrammed the monies twice over the life of the program. Initially, $2.5 billion for the “Cash for Clunkers” program, and an additional $1.5 billion for emergency state aid programs, netting out roughly $1.7 billion – less than half the originally intended amount, for use in the loan guarantee program.

greenpaper
Renewable Energy Project Finance in the U.S.: 2010-2013 Overview and Future Outlook
30Copyright © 2012 Mintz, Levin, Cohn, Ferris, Glovsky and Popeo, P.C.
5.1.1.2 Financial Institution Partnership Program
In order to expedite the Section 1705 loan guarantee process and expand senior credit capacity for commercial renewable energy generation projects, DOE allowed qualified financing institutions—which would be providing the underlying loan guaranteed by DOE—to apply with project sponsors as co-applicant/lenders under the Financial Institution Partnership Program (“FIPP”). The policy rationale for instituting the FIPP program was that it allowed financial institutions to identify and pre-screen promising projects. The FIPP Program also had financial institutions perform traditional credit and project risk due diligence routinely performed by financial institutions, before submitting them to the DOE.
In a FIPP financing arrangement, DOE limited project debt to 80% of total project costs (with at least 20% required to be equity), and guaranteed up to 80% of that debt component, requiring renewable energy generation project lenders to hold at least 20% of the unguaranteed credit exposure to the project, aligning lenders interests with the Department and project sponsors by putting “skin in the game”.
While much more could be said about the Section 1703 and Section 1705 programs’ nuances, the Section 1705 program has expired as of September 30, 2011. Further, the future of DOE’s role in financing large-scale renewable projects under the Section 1703 program are highly uncertain given the default of the first two (2) loan guarantee recipients (Solyndra and Beacon Power).
5.1.2 Impact
In 2010, the LPO program issued its first conditional commitment for a renewable power project recipient to BrightSource Energy, project sponsor for the largest CSP project in the world. As shown in Figures V-1, DOE issued 28 loan guarantees between the 1705 program’s inception and its end date of September 30, 2011, for a total of $16 billions in loan guarantees.

greenpaper
Renewable Energy Project Finance in the U.S.: 2010-2013 Overview and Future Outlook
31Copyright © 2012 Mintz, Levin, Cohn, Ferris, Glovsky and Popeo, P.C.
Figure5-1:DOE 1705 Loan Guarantee Awards Closed (inception to end of program)
Project Name Developer (Owner) System supplier FIPP? Debt Providers Loan Guarantee
Amount ($M)
Solar Manufacturing
1366 Technologies N $150M
Abound Solar N $400M
SoloPower N $197M
Solyndra N $535M
Energy Storage
Johnson City AES N $17M
Stephentown Beacon Power Beacon Power N $43M
Biofuel
Bioenergy Biomass of KS Abengoa Abengoa N $132M
POET N $105M
Geothermal
Blue Mountain NGP NGP FIPP John Hancock $99M
Neal Hot Springs US Geothermal US Geothermal N $97M
Ormat Nevada Ormat Ormat FIPP John Hancock $350M
Solar Generation
Agua Caliente First Solar (NRG) First Solar N $967M
Alamosa Cogentrix Amonix N $91M
Antelope Valley First Solar (Exelon) First Solar N $646M
Crescent Dunes SolarReserve SolarReserve N $737M
California Valley SR SunPower (NRG) SunPower N $1,237M
Desert Sunlight First Solar (NextEra, GE EFS) First Solar FIPP Goldman Sachs, Citigroup $1,460M
Genesis Solar NextEra FIPP Credit Suisse, BBVA (LOC) $852M
Ivanpah BrightSource (NRG, Google) BrightSource N $1,600M
Mesquite Solar 1 Sempra N $337M
Mojave Solar Abengoa Abengoa N $1,200M
Prologis (Project Amp) NRG FIPP Bank of America $1,400M
Solana Abengoa Abengoa N $1,446M
Transmission
One Nevada Line LS Power N $343M
Wind Generation
Granite Reliable Brookfield FIPP $169M
Kahuku Wind First Wind N $117M
Record Hill Wind N $120M
Shepherds Flat Caithness/GE GE FIPP 11 banks $1,300M
Total $16,146M

greenpaper
Renewable Energy Project Finance in the U.S.: 2010-2013 Overview and Future Outlook
32Copyright © 2012 Mintz, Levin, Cohn, Ferris, Glovsky and Popeo, P.C.
Source: GTM Research, DOE
Project Name Total Cost ($M)
Debt as % of Total
MW-ac
Cost ($/W-ac) Locations Date of Closing
Solar Manufacturing
1366 Technologies MA Sep-11
Abound Solar CO & IN Dec-10
SoloPower OR Aug-11
Solyndra CA Sep-09
Energy Storage
Johnson City $24M 71% 20 $1.20/W NY Aug-10
Stephentown $69M 62% 20 $3.45/W NY Aug-10
Biofuel
Bioenergy Biomass of KS $176M 75% KS Aug-11
POET $140M 75% IA Sep-11
Geothermal
Blue Mountain $282M 35% 36 $7.83/W NV Sep-10
Neal Hot Springs $136M 71% 23 $5.91/W OR Feb-11
Ormat Nevada $467M 75% 121 $3.86/W NV Sep-11
Solar Generation
Agua Caliente $1,719M 56% 290 $5.93/W AZ Aug-11
Alamosa $145M 62% 30 $4.83/W CO Sep-11
Antelope Valley $1,360M 48% 230 $5.91/W CA Sep-11
Crescent Dunes $983M 75% 110 $8.93/W NV Sep-11
California Valley SR $1,581M 78% 250 $6.32/W CA Sep-11
Desert Sunlight $2,607M 56% 550 $4.74/W CA Sep-11
Genesis Solar $1,520M 56% 250 $6.08/W CA Aug-11
Ivanpah $2,180M 73% 370 $5.89/W CA Apr-11
Mesquite Solar 1 $602M 56% 150 $4.01/W AZ Sep-11
Mojave Solar $1,600M 75% 250 $6.40/W CA Sep-11
Prologis (Project Amp) $2,600M 54% 733 $3.55/W 28 States Sep-11
Solana $1,967M 74% 250 $7.87/W AZ Dec-10
Transmission
One Nevada Line NV Feb-11
Wind Generation
Granite Reliable $225M 75% 99 $2.28/W NH Sep-11
Kahuku Wind $148M 79% 30 $4.93/W HI Jul-10
Record Hill Wind $153M 78% 50 $3.06/W ME Aug-11
Shepherds Flat $2,300M 57% 845 $2.72/W OR Oct-10
Total $22,984M 4,707

greenpaper
Renewable Energy Project Finance in the U.S.: 2010-2013 Overview and Future Outlook
33Copyright © 2012 Mintz, Levin, Cohn, Ferris, Glovsky and Popeo, P.C.
5.2 ITC Election for PTC Property
The Recovery Act authorized PTC-eligible renewable energy property to elect the 30% ITC. This amendment significantly altered Federal incentives for some technologies deployed in 2010, and resulted in greater incentive parity across renewable energy systems. Specifically, wind-energy systems of all sizes—not just smaller systems less than 100 kW–qualified for the 30% ITC through December 31, 2012—the PTC in-service deadline. Certain geothermal and open-or closed- loop biomass systems (including biomass CHP projects qualified at 10%) also qualified for a 30% ITC through their respective PTC placed-in-service date of December 31, 2013.
5.3 Section 1603 Cash Grant Program
5.3.1 Overview
The Recovery Act provided taxpayers an ability to receive a cash grant equal to 10-30% of the qualified project costs for technologies eligible under the ITC and PTC. Although set to initially expire in December 2010, the program was extended until December 31, 2011. Projects placed-in-service from 2009-2011 must submit their Section 1603 application by October 31, 2012. However, projects do not have to be completed by December 31, 2011 to remain eligible for the cash grant.
Figure5-2:Cash Grant by Technology
Source: GTM Research
Projects commencing construction after Recovery Act enactment but before January 1, 2012 can remain eligible for the Section 1603 Cash Grant so long as they are placed-in-service by the underlying ITC/PTC credit termination dates. The Section 1603 Program also includes a “safe-harbor” rule allowing projects that expend at least 5% of a project’s total eligible costs by December 30, 2011 an ability to remain eligible for the cash grant so long as they submit their respective applications to Treasury by October 1, 2012.
Technology Cash Grant as % of Basis Placed in Service Deadline
Solar 30% 1/1/2017
Wind 30% 1/1/2013
Geothermal (Electricity) 30% 1/1/2017
Biomass 30% 1/1/2014
Fuel Cells 30% 1/1/2017
Landfill Gas 30% 1/1/2014
Trash to Electricity 30% 1/1/2014
Hydro 30% 1/1/2014
Marine & Hydrokinetic 30% 1/1/2014
Geothermal Heat Pumps 10% 1/1/2017
Microturbine 10% 1/1/2017
Combined Heat and Power (CHP) 10% 1/1/2017

greenpaper
Renewable Energy Project Finance in the U.S.: 2010-2013 Overview and Future Outlook
34Copyright © 2012 Mintz, Levin, Cohn, Ferris, Glovsky and Popeo, P.C.
Figure5-4:Total Amount of Cash Grants Awarded by Technology
Source: U.S. Department of the Treasury
5.3.2 Impact
The Section 1603 Cash Grant Program facilitated significant private sector investment in renewable power projects. From the program’s inception to November 16, 2011, Treasury distributed $9.78 billion cash grants to 4,254 projects. Assuming private sector investments constituted the remaining ~70% of projects costs, the Section 1603 Program catalyzed $22.8 billion in additional investment for a total deployment of $32.6 billion.
Figure5-3:Cash Grants Issued Under Section 1603 (Inception in 2009 to November 16, 2011)
Source: U.S. Department of the Treasury
Type # of Projects Total Amount Awarded ($M) $M/per Project
Wind 231 $7,704 $33.4
Solar 3,617 $1,512 $0.4
Biomass, Biofuels, Geothermal, Hydro, Tidal, etc. 176 $566 $3.2
Total 4,254 $9,782 $2.3
Wind 79%
Solar 15%
Biomass, Geothermal,Hydro, Tidal, ect. 6%
Wind231
Solar 3,617
Biomass, Geothermal,Hydro, Tidal, etc. 176
Figure5-5:Total Number of Cash Grants Awarded by Technology
Source: U.S. Department of the Treasury
The option to monetize the ITC in the form of a direct cash grant valued at ~30% of total project costs provided significant liquidity to the renewable energy market, as the Section 1603 Cash Grant program reduced renewable project developer’s dependence on scarce and/or costly third-party tax equity participation. Cash grants also simplified financing structures and reduced “frictional” (transactional) costs associated with tax equity structures by an estimated 300 basis points (bps) for renewable energy projects, but often higher depending on technology and specific project risks. It is also important to recognize renewable energy project costs have fallen drastically with capital expenditures, decreasing ~40% for wind projects and ~70% for PV projects on an average, per-installed watt basis.

greenpaper
Renewable Energy Project Finance in the U.S.: 2010-2013 Overview and Future Outlook
35Copyright © 2012 Mintz, Levin, Cohn, Ferris, Glovsky and Popeo, P.C.
From a budgetary and policy perspective, the Section 1603 Cash Grant Program proponents continue to argue the incentive is essentially revenue neutral because providing the cash grant in lieu of an underlying, existing tax credit should result in the same net impact on government revenues. However, due to reduced frictional costs, Bloomberg New Energy Finance and the Bipartisan Policy Center concluded that cash grants for renewable energy projects are significantly more efficient than other tax-incentives, asserting the U.S. government would only need to spend about half as much in cash grants to achieve the same deployment levels as using the PTC.
5.3.2.1 Onshore Wind
Although utility-scale wind projects only represented 6% of Section 1603 Program recipients since inception, the wind industry clearly benefited the greatest financially from the program. Two-hundred thirty one wind projects received a significantly disproportionate amount of total cash grants awarded— 79%, or $7.7 Billion. On average, 200 MW+ projects installed costs per watt (“W”) ranged from $1.82/W to $2.10/W, based on publicly available data.
Figure5-6:Top 10 Largest Cash Grant Awards to Wind Projects (Inception 2009 to November 16, 2011)
Source: GTM Research, U.S. Department of the Treasury
While utility-scale wind developers elected to use the underlying tax credit (PTC) more than any other renewable energy technology, the majority of the 5.1 GW of new onshore wind generating capacity installed in 2010—representing 26% of all new electric generating capacity installed in the United States—utilized the Section 1603 Program.
A 2009 Lawrence Berkely National Lab (LBNL) analysis concluded as of until March 1, 2010, 64% of all 2009 large-scale onshore wind projects eligible under the Section 1603 Program elected, or planned to elect, the cash grant, in lieu of the PTC or ITC.
Project Name Developer Capacity (MW)
Cash Grant ($M)
Estimated Cost
($/W)State
E.ON Climate & Renewables North America Inc. E.ON $543 TX
Windy Flats Partners, LLCCannon Power
Group 400 $218 $1.82/W WA
Pattern Gulf Wind LLCPattern
Energy 283 $178 $2.10/W TX
Streator-Cayuga Ridge Wind Power LLC Iberdrola 300 $170 $1.89/W IL
Big Sky Wind, LLC Edison Mission 239 $144 $2.00/W IL
FPL Energy Illinois Wind, LLC NextEra 227 $139 $2.04/W IL
Milford Wind Corridor Phase I, LLC First Wind 204 $120 $1.96/W UT
Blackstone Wind Farm II LLC Horizon 200 $116 $1.93/W IL
Penascal Wind Power LLC Iberdrola 207 $114 $1.84/W TX
Meadow Lake Wind Farm LLC Horizon 200 $113 $1.89/W IN

greenpaper
Renewable Energy Project Finance in the U.S.: 2010-2013 Overview and Future Outlook
36Copyright © 2012 Mintz, Levin, Cohn, Ferris, Glovsky and Popeo, P.C.
5.3.2.2 Solar
While 3,617 solar projects represented the largest number of installations receiving cash grants by technology representing 85% of total Section 1603 Program recipients, only 15% or $1,512 million of cash grants since the program’s inception were awarded to construct solar projects. This high volume, but low grant award per project can be attributed to the more diffuse nature of solar sector applications and technologies utilizing the Section 1603 Program, varying drastically from distributed PV commercial systems of less than 1 kW to large utility-scale PV and CSP projects like SunPower’s 19 MW Greater Sandhill PV project and NextEra’s Martin CSP 75 MW Next Generation Solar Center.
Figure5-7:Top 10 Largest Cash Grant Awards to Solar Projects (Inception 2009 to November 16, 2011)
Source: GTM Research, U.S. Department of the Treasury
5.3.2.3 Geothermal
From the program’s inception through November 16, 2011, 48 geothermal projects received $282 million in cash grants under the Section 1603 program, representing 3% of all cash grants awarded.
Project Name Developer Capacity (MW) State Property Type
Cash Grant ($M)
Estimated Cost ($/W)
Martin Next Generation Solar FPL 75 FL Solar Thermal $123.8 $5.50/W
DeSoto NG & Space Coast FPL 35 FL Solar Electricity $62.4 $5.94/W
Pacific Energy Capital 1, LLC SunRun CA Solar Electricity $30.4
SunRun Pacific Solar LLC SunRun CA Solar Electricity $29.8
Greater Sandhill I, LLC SunPower 19 CO Solar Electricity $25.4 $4.45/W
Solar Tenant I, LLC SunRun CA Solar Electricity $22.7
Sierra SunTower eSolar 5 CA Solar Thermal $19.5 $13.03/W
SunRun Solar Tenant IV, LLC SunRun CA Solar Electricity $19.4
National Bank of Arizona AZ Solar Electricity $19.0
SPP Fund III Master Tenant, LLC SPP AZ Solar Electricity $18.4

greenpaper
Renewable Energy Project Finance in the U.S.: 2010-2013 Overview and Future Outlook
37Copyright © 2012 Mintz, Levin, Cohn, Ferris, Glovsky and Popeo, P.C.
Figure5-8:Top 10 Largest Cash Grants to Geothermal Projects (Inception 2009 to November 16, 2011)
Source: GTM Research, U.S. Department of the Treasury
5.3.2.4 Biopower
Seventy three power plants utilizing biomass, landfill gas, or waste-to-energy technologies received $227 million in cash grants under the 1603 program in 2010, representing 2.3% of all cash grants awarded since the program’s inception, the largest of which was the Evergreen Community Power project in Pennsylvannia.
Figure5-9:Top 10 Largest Cash Grants to Biopower Projects (Inception 2009 to November 16, 2011)
Source: GTM Research, U.S. Department of the Treasury
Project Name Developer Capacity (MW) State Property Type
Cash Grant ($M)
Estimated Cost ($/W)
ORNI 18 LLC CA Geothermal Electricity $108.3
NGP Blue Mountain I LLC NGP 49.5 NV Geothermal Electricity $65.7 $4.43/W
Enel Stillwater, LLC NV Geothermal Electricity $40.3
Thermo No. 1 BE-01, LLC UT Geothermal Electricity $33.0
Enel Salt Wells, LLC NV Geothermal Electricity $21.2
Geysers Power Co., LLC CA Geothermal $5.7
Epic Systems Corporation WI Geothermal Heat Pump $3.4
Beowawe Binary, LLC NV Geothermal Electricity $1.7
Gebbers Farms WA Geothermal Heat Pump $0.3
Wheeler Terrace Development LP DC Geothermal Heat Pump $0.3
All other Geothermal $1.7
Total Geothermal $281.6
Project Name Developer Capacity (MW) State Property Type Cash Grant
($M)
Evergreen Community Power LLC PA Biomass (open loop, cellulosic) $39.2
Seneca Sustainable Energy, LLC OR Biomass (open loop, cellulosic) $18.6
Pratt Paper (GA), LLC GA Biomass (open loop, cellulosic) $18.5
Simpson Tacoma Kraft Company, LLC WA Biomass (open loop, cellulosic) $17.4
Ameresco, Inc. Ameresco CA Landfill Gas $16.1
L’Anse Warden Electric Company MI Biomass (open loop, cellulosic) $11.7
Rio Grande Valley Sugar Growers, Inc. TX Biomass (open loop, cellulosic) $10.2
Multitrade Rabun Gap LLC GA Biomass (open loop, cellulosic) $8.5
Concord Nurseries, LLC MA Biomass (open loop, cellulosic) $8.0
Thompson River Power, LLC MT Biomass (open loop, cellulosic) $6.5
All others $72.2
Total Biomass/LFG/W-to-E $227.0

greenpaper
Renewable Energy Project Finance in the U.S.: 2010-2013 Overview and Future Outlook
38Copyright © 2012 Mintz, Levin, Cohn, Ferris, Glovsky and Popeo, P.C.
5.3.2.5 Other Renewable Cash Grants
From the program’s inception through November 16, 2011, Treasury awarded the remaining $58 million under the Section 1603 Program, representing 0.6% of cash grants to 53 projects deploying other qualifying technologies. These technologies included stationary fuel cells, certain combined heat and power systems, and water technologies (marine, hydrokinetic, and incremental hydropower).
Figure5-10:Top 10 Largest Cash Grants to Other Projects (Inception 2009 to November 16, 2011)
Project Name State Property Type Cash Grant ($M)
Bloom Energy 2009 PPA Project Company, LLC CA Fuel Cell $23.5
Erie Boulevard Hydropower LP NY Hydropower (incremental) $4.1
Adobe Systems Incorporated CA Fuel Cell $3.6
FPL Energy Maine Hydro, LLC ME Hydropower (incremental) $2.6
Smart Papers Holdings LLC OH Combined Heat & Power $2.5
FirstEnergy Solutions Corp OH Fuel Cell $1.7
The Alhambra Office Community, LLC CA Fuel Cell $1.5
Odwalla, Inc. CA Fuel Cell $1.5
Somerset Leasing Corp IV IL Fuel Cell $1.4
Great Bay Hydro Corporation VT Hydropower (incremental) $1.3
All others $13.7
Total $57.5

greenpaper
Renewable Energy Project Finance in the U.S.: 2010-2013 Overview and Future Outlook
39Copyright © 2012 Mintz, Levin, Cohn, Ferris, Glovsky and Popeo, P.C.
6 DEMAND SCENARIOS: PROJECT FINANCING FORECAST THROUGH 2013
From 2011-2013, we anticipate the renewable power sector will seek over $121.3 billion in project financing. We also predict—stipulating significant uncertainty exists for domestic energy policy and global capital markets— that the capital demands of renewable energy projects seeking project financing will continue to grow at a compounded annual growth rate (CAGR) of 16.2% over the next two years, hitting $41.2 billion in 2012, and $48.9 billion in 2013.
Figure6-1:Project Financing to be sought by Renewable Energy Projects in the U.S., Estimated 2011-2013
Source: GTM Research
During the 2012-2013 timeframe, and based on our project debt and tax equity projections, the success rate of capital secured will decrease roughly by 5% annually, resulting in ~$30.2 billion in 2012 financing arrangements, and ~$34.2 billion in 2013.
$-
$10.0
$20.0
$30.0
$40.0
$50.0
$60.0
2011 2012 2013
Am
ou
nt
(in
bill
ion
s)
Wind
Other
CSP
PV
$31.1B
$41.2B
$48.9B
Wind
Other
CSP
PV
Wind
Other
CSP
PV
Type 2011 2012 2013
Other $0.6B $0.8B $1.0B
CSP $9.9B $13.4B $16.0B
PV $9.5B $12.9B $15.0B
Wind $11.2B $14.1B $17.0B

greenpaper
Renewable Energy Project Finance in the U.S.: 2010-2013 Overview and Future Outlook
40Copyright © 2012 Mintz, Levin, Cohn, Ferris, Glovsky and Popeo, P.C.
Figure6-2:Project Financing to be secured by Renewable Energy Projects in the U.S., Estimated 2011-2013
In 2011, our preliminary research indicates the U.S. renewable power generation sector—primarily driven by the solar industry—sought $31.1 billion in project financing. However, renewable project developers were only able to secure 79%, or $24.7 billion in financing sought in the debt and equity markets.
6.1 Methodology
Our aggregate renewable project financing demand figures are based on “live” projects contained in databases compiled by GTM Research, the American Wind Energy Association (“AWEA”), and the Global Wind Energy Council. We define “live” deals as projects across various stages of development for which representatives are actively seeking project financing before 2014, and whose principals may be engaged in negotiations with potential financiers, but which have not yet reached financial closure.
We also recognize a certain margin of error will be present in our findings. Our data sets—as with all estimates—do not represent perfect market information, and projects may have inadvertently been excluded because they:
• Have not been made public
• May seek alternative, non-project financing structures (e.g. corporate balance sheets or Federal procurement)
• Have regulatory barriers that may impede project development -- such as permitting, or
• Have other requirements necessary to be considered “financeable projects
$-
$5.0
$10.0
$15.0
$20.0
$25.0
$30.0
$35.0
$40.0
2011 2012 2013
Am
ou
nt
(in
bill
ion
s)
$24.7B
$30.2B
$34.1B
Wind
Other
CSP
PV
Wind
Other
CSP
PV
Wind
Other
CSP
PV
Type 2011 2012 2013
Other $0.5B $0.6B $0.7B
CSP $6.5B $8.0B $9.6B
PV $7.6B $10.3B $12.0B
Wind $10.0B $11.3B $11.9B

greenpaper
Renewable Energy Project Finance in the U.S.: 2010-2013 Overview and Future Outlook
41Copyright © 2012 Mintz, Levin, Cohn, Ferris, Glovsky and Popeo, P.C.
To account for this margin of error, we applied a confidence factor for each sector to account for some projects not reaching the financing stage.
6.2 Forecasts by Technology: 2011-2013
6.2.1 Onshore Wind
We anticipate ~22 GW of utility-scale, onshore wind projects in the United States representing $42.3 billion of potential investment will seek to secure project financing by 2013. This includes 10.6 GW of announced utility-scale wind projects in the U.S. by credible developers and an estimated additional 11 GW of unannounced projects in the pipeline.
We forecast 5.3 GW of wind projects will actually close $10 billion in project financing during 2011, followed by 5.9 GW of projects closing $11.3 billion in 2012, and 6.6 GW closing $11.9 billion in 2013.
Figure6-3:Forecast Amount of Project Financing to Be Sought by U.S. Wind Sector Through 2013
6.2.1.1 Assumptions
Most of the identified assets are not yet associated with financing leads and are in various stages of development, though most aim to commence commercial operation by 2014. We expect onshore wind projects currently in discussions with potential financiers to attempt to reach financial close by the end of 2011, given the added incentive securing a Section 1603 Cash Grant while still available. For projects in advanced development that have either (a) not commenced construction, or (b) not signed PPAs, developers will seek financing in 2012. For projects also in advanced development that must still clear other development hurdles and have neither commenced construction nor signed PPAs, we assume developers will attempt to secure financing in 2013.
Installed wind costs in the U.S. are largely impacted by commodity price fluctuations (steel, etc.), and potential economies-of-scale improvements as turbine and wind farm sizes increase. However, we anticipate the installed cost of one MW of large-scale, onshore wind in the U.S. to remain relatively stable from 2011-2013, and our analysis does not assume significant changes to the wind industry’s supply chain or manufacturing base.
To estimate the value of the onshore, utility-scale project pipeline, we assume an installed cost per MW of $1.9 million — the average installed cost seen in large-scale, onshore wind installations receiving Section 1603 Cash Grants to date. We assert that our cost estimates align with current industry standards for large-scale, onshore wind projects.
Wind 2011 2012 2013 2014 2015
Total MW Seeking Financing 5,874 7,434 9,441 – – – –
Total Financing Sought ($M) $11,161 $14,125 $16,995 – – – –
MW That Achieve Financing 5,287 5,948 6,609 – – – –
Financing Achieved ($M) $10,045 $11,300 $11,896 – – – –
Cost/MW ($M) $1.9 $1.9 $1.8 – – – –
Total MW Installed 5,116 7,049 7,930 8,812 9,693

greenpaper
Renewable Energy Project Finance in the U.S.: 2010-2013 Overview and Future Outlook
42Copyright © 2012 Mintz, Levin, Cohn, Ferris, Glovsky and Popeo, P.C.
6.2.1.2 Confidence Factors
To account for projects that are stalled or abandoned due to development and permitting issues, we apply a declining confidence factor of 10% in each of the next three (3) years. Assuming projects seeking to commence operation in the nearer term have greater visibility with regard to project permitting and feasibility than projects requiring longer development pipelines, we estimate 90% of projects securing financing in 2011 will be successful, 80% in 2012 and 70% in 2013.
6.2.2 Solar
We anticipate ~11.9 GW of utility-scale (>10 MW) solar projects in the United States representing $76.6 billion of potential investment will seek to secure project financing by 2013. When comparing the two leading commercially available solar technologies—we anticipate the projects will be split fairly evenly between PV and CSP technologies with 6.6 GW of PV representing $37.4 billion and 7.2GW of CSP representing $39.1 billion of potential project financing.
We forecast 3.7 GW of solar projects will actually close $14 billion in financing during 2011, followed by 5.2 GW of projects closing $18.3 billion in 2012, and 6.5 GW closing $21.5 billion in 2013.
Figure6-4:Forecast Amount of Project Financing to Be Sought by U.S. Solar Sector Through 2013
6.2.2.1 Assumptions
We expect solar projects in advanced development stages (i.e., with signed PPAs in place) and in discussions with potential financiers to seek financial close as soon as possible in order to begin construction.
Both PV and CSP are expected to experience cost reductions over the midterm. While current installed solar costs may seem high compared to onshore wind, a solar energy systems maximum output occurs during peak load periods during the day, Solar projects are therefore potentially more valuable to grid operators when compared to wind systems that typically generate more power during off-peak hours at night.
PV 2011 2012 2013 2014 2015
Total MW Seeking Financing 2,712 3,912 5,008 – – – –
Total Financing Sought ($M) $9,491 $12,911 $15,025 – – – –
MW That Achieve Financing 2,169 3,130 4,007 – – – –
Financing Achieved ($M) $7,593 $10,329 $12,020 – – – –
Cost/MW ($M) $3.5 $3.3 $3.0 – – – –
Total MW Installed 1,228 1,738 2,384 3,264 4,253
CSP 2011 2012 2013 2014 2015
Total MW Seeking Financing 2,526 3,518 4,316 – – – –
Total Financing Sought ($M) $9,851 $13,368 $15,970 – – – –
MW That Achieve Financing 1,677 2,106 2,584 – – – –
Financing Achieved ($M) $6,539 $8,002 $9,559 – – – –
Cost/MW ($M) $3.9 $3.8 $3.7 – – – –
Total MW Installed 5 126 2,148 2,173 2,584

greenpaper
Renewable Energy Project Finance in the U.S.: 2010-2013 Overview and Future Outlook
43Copyright © 2012 Mintz, Levin, Cohn, Ferris, Glovsky and Popeo, P.C.
To estimate the value of the utility-scale solar project pipeline, we assume an installed cost of $3.50/MW for PV and $3.90/MW for CSP. This assumption is in line with GTM Research’s solar forecasts for average installed costs for large-scale PV and CSP projects.
6.2.3 Forecast for Other Renewable Energy Technologies
We anticipate ~600MW of other renewable energy projects in the United States representing approximately $2.4 billion of potential investment will seek to secure project financing by 2013. We forecast all other renewable energy technologies—but primarily biopower and geothermal projects—will seek $0.6 billion in project finance in 2011, $0.8 billion in 2012, and $1.0B in 2013.
6.2.3.1 Assumptions
To estimate the value of the biopower and geothermal pipelines specifically, we assume an average installed cost of $4/W for biomass/geothermal.
While new biopower installations contracted in 2010, wood-fired, municipal solid waste (“MSW”), landfill gas and projects using other organic feedstocks remain more prevalent than solar and geothermal power projects, representing 11GW of total installed capacity in the U.S. While we anticipate continued growth in this category, our estimates show that it will remain under 3% of the total market for renewable energy project finance.
As shown in the chart below, the U.S. in 2010 added 100 MW of new biomass plant capacity. This amount is well below the 1,000 MW of new biomass capacity added annually in the early 1990s, but is still an improvement over the 40 MW added in 2005.
Figure6-5:New Biomass Plant Additions in the U.S., 1982-2011
Source: GTM Research, DOE, EIA
-
100
200
300
400
500
600
700
800
900
1,000
1,100
1982
1983
1984
1985
1986
1987
1988
1989
1990
1991
1992
1993
1994
1995
1996
1997
1998
1999
2000
2001
2002
2003
2004
2005
2006
2007
2008
2009
2010
2011
New
Bio
mas
s Pl
ant
Cap
acit
y A
dd
ed (
MW
)
Black Liquor Other Biomass Landfill Gas Municipal Solid Waste Wood Solids

greenpaper
Renewable Energy Project Finance in the U.S.: 2010-2013 Overview and Future Outlook
44Copyright © 2012 Mintz, Levin, Cohn, Ferris, Glovsky and Popeo, P.C.
6.2.4 Biofuels (Ethanol & Biodiesel)
While the primary focus of this report is renewable electricity generation, the size and project finance requirements of the biofuels industry are notable.
In terms of volume, ethanol represents 98% of all biofuels produced in the US, with biodiesel representing the remaining 2%. In the US in 2010, nameplate capacity for ethanol plants increased from 13.03 billion gallons per year to 13.77 billion gallons per year, a net increase of 0.74 billion gallons per year. This amount represents a 6% growth in total ethanol capacity in 2010, which is a significant reduction from the 20% growth in total capacity in 2009.
To build an ethanol plant costs ~$1.30 per gallon of annual capacity. This implies a total cost of $1.0 billion in 2010 CAPEX that was likely project financed. If the ethanol industry grows another 6% in 2011, that would represent additions of 0.83 billion gallons per year – which would require $1.1 billion of CAPEX. These historical and future financings are not included in this report’s analysis, nor are they considered in the project finance forecasts.
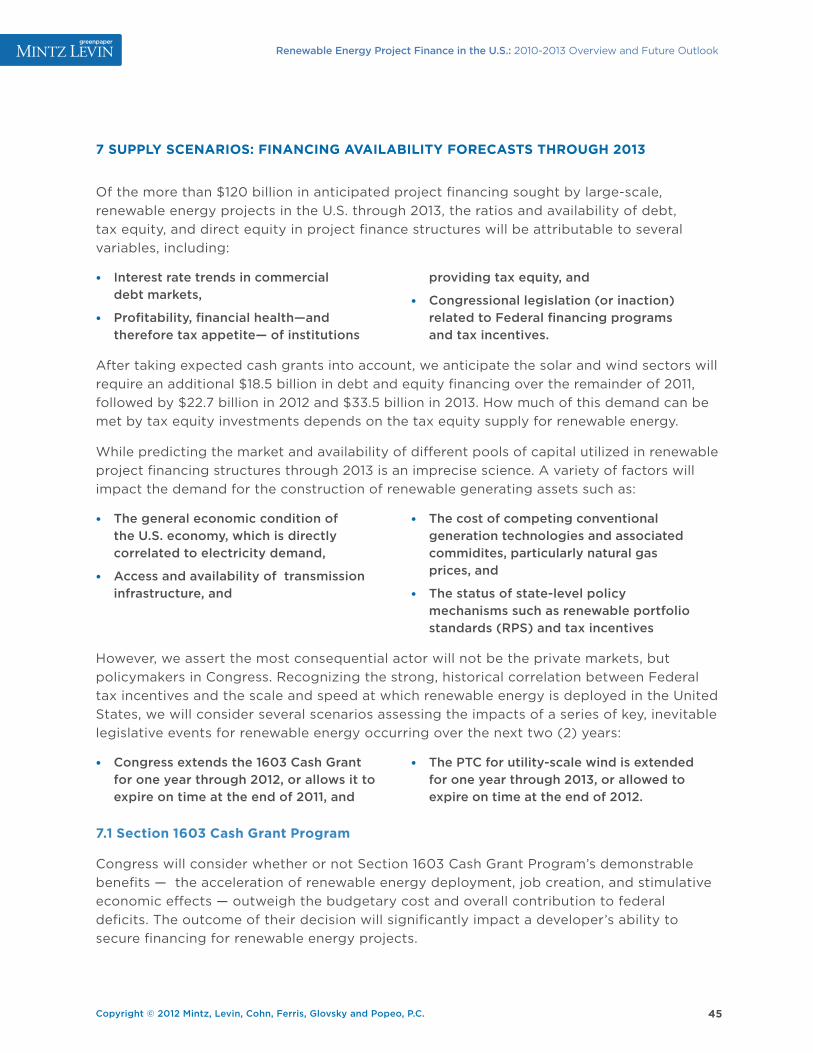
greenpaper
Renewable Energy Project Finance in the U.S.: 2010-2013 Overview and Future Outlook
45Copyright © 2012 Mintz, Levin, Cohn, Ferris, Glovsky and Popeo, P.C.
7 SUPPLY SCENARIOS: FINANCING AVAILABILITY FORECASTS THROUGH 2013
Of the more than $120 billion in anticipated project financing sought by large-scale, renewable energy projects in the U.S. through 2013, the ratios and availability of debt, tax equity, and direct equity in project finance structures will be attributable to several variables, including:
• Interest rate trends in commercial debt markets,
• Profitability, financial health—and therefore tax appetite— of institutions
providing tax equity, and
• Congressional legislation (or inaction) related to Federal financing programs and tax incentives.
After taking expected cash grants into account, we anticipate the solar and wind sectors will require an additional $18.5 billion in debt and equity financing over the remainder of 2011, followed by $22.7 billion in 2012 and $33.5 billion in 2013. How much of this demand can be met by tax equity investments depends on the tax equity supply for renewable energy.
While predicting the market and availability of different pools of capital utilized in renewable project financing structures through 2013 is an imprecise science. A variety of factors will impact the demand for the construction of renewable generating assets such as:
• The general economic condition of the U.S. economy, which is directly correlated to electricity demand,
• Access and availability of transmission infrastructure, and
• The cost of competing conventional generation technologies and associated commidites, particularly natural gas prices, and
• The status of state-level policy mechanisms such as renewable portfolio standards (RPS) and tax incentives
However, we assert the most consequential actor will not be the private markets, but policymakers in Congress. Recognizing the strong, historical correlation between Federal tax incentives and the scale and speed at which renewable energy is deployed in the United States, we will consider several scenarios assessing the impacts of a series of key, inevitable legislative events for renewable energy occurring over the next two (2) years:
• Congress extends the 1603 Cash Grant for one year through 2012, or allows it to expire on time at the end of 2011, and
• The PTC for utility-scale wind is extended for one year through 2013, or allowed to expire on time at the end of 2012.
7.1 Section 1603 Cash Grant Program
Congress will consider whether or not Section 1603 Cash Grant Program’s demonstrable benefits — the acceleration of renewable energy deployment, job creation, and stimulative economic effects — outweigh the budgetary cost and overall contribution to federal deficits. The outcome of their decision will significantly impact a developer’s ability to secure financing for renewable energy projects.

greenpaper
Renewable Energy Project Finance in the U.S.: 2010-2013 Overview and Future Outlook
46Copyright © 2012 Mintz, Levin, Cohn, Ferris, Glovsky and Popeo, P.C.
7.1.1 Impact
Unless Congress extends the Section 1603 Cash Grant Program before December 31, 2011, projects unable to meet Treasury’s construction deadline requirements will be ineligible to elect the cash grant. However, the PTC or ITC, which—absent a repeal— will remain authorized through 2013 except for utility-scale wind, which we discuss in the next section.
With only the underlying tax incentives available, renewable project developers seeking project financing would inevitably gravitate back to the tax equity market, which the U.S. Partnership for Renewable Energy Finance (USPREF) estimates could result in a 52% reduction in total financing available for renewable energy in 2012 (USPREF, 2011). The Solar Energy Industries Association (SEIA) has come to a similar conclusion that if the Section 1603 Cash Grant Program is allowed to expire 2011, Congressional inaction would reduce the availability of financing from an estimated $7.5 billion in 2011 to approximately $3.6 billion in 2012 – a reduction of more than 50% (SEIA, 2010).
A return to tax equity financing structures would also eliminate additional, ancillary benefits that accrue to developers with a cash grant incentive such as:
• Full Alterntive Minimum Tax (AMT) exemption. Taxpayers electing the PTC are only exempt from AMT for four years.
• Exemption from Subsidized Financing Reductions. Taxpayers electing the PTC must reduce the amount of the credit by the value of any grants, tax-exempt bonds, other forms of subsidized energy financing secured.
• Flexible Owner-Operator Requirements. Taxpayers electing the PTC cannot use sale-lease back structures because the taxpayer must own and operate the facility.
• Flexible Power Sales Requirements. Taxpayers electing the PTC cannot lease facilities to tax-exempt entities in a “behind-the-meter” arrangement because the power must be sold to an unrelated party.
• Exemption from “Passive Credit Limitations.” Taxpayers (e.g. investors) not playing an active role in a renewable energy project cannot use the PTC to offset income that is not also classified as “passive”, restricting the value of the credit.
While the anticipated contraction in available financing would negatively impact all renewable projects, the expiration of the Section 1603 Program would be signficant to the solar industry as the value of the cash grant is arguably more valuable to developers because it reduces the relatively high installation costs associated with PV and CSP technologies.
By comparison, the PTC can often generate more value than the cash grant over the life of a technologies with higher capacity factors and low upfront capital costs such as wind, who realize a larger benefit from the PTC because an incentive linked to the kWh units produced over the ten (10) year length of the PTC represent a larger percentage of a project’s total, installed costs.
7.1.2 Assumptions
Based on cash grant and PTC incentives’ relative values to wind and solar project developers, we assume that 75% of upcoming wind projects will elect the cash grant over the PTC and 80% of upcoming solar projects will opt to elect the cash grant over the ITC.

greenpaper
Renewable Energy Project Finance in the U.S.: 2010-2013 Overview and Future Outlook
47Copyright © 2012 Mintz, Levin, Cohn, Ferris, Glovsky and Popeo, P.C.
For wind projects, this is a middle-of-the-road assumption grounded in a previously cited Lawrence Berkeley National Lab report and industry estimates which assert ~ 65% to 85% of utility-scale wind projects have opted to elect the cash grant over the PTC. We do not anticipate any wind projects to elect the traditional ITC over the cash grant.
We also assume that a project electing the Section 1603 Cash Grant incentive will be able to obtain the necessary bridge loans as part of its overall financing package, with the anticipation that the short-term debt will be repaid upon receipt of the cash grant. Because a project’s financial closing typically occurs before a project begins construction, and a cash grant is awarded approximately 60 days after a project submits its application after being placed-in-service, bridge financing is often necessary to finance construction costs during that time frame. However, the availability of cash grants makes securing a cash grant bridge loan straight-forward for good projects.
Figure7-1:Forecast Election of the Cash Grant in Wind and Solar if the Cash Grant is Extended Through 2012
Source: GTM Research
Figure7-2:Forecast Election of the Cash Grant in Wind and Solar if the Cash Grant is Not Extended Through 2012
Source: GTM Research
2011 2012 2013
Wind Project Achieved Financing Requirement ($M) $10,045 $11,300 $11,896
Wind Projects Electing Cash Grant 75% 0% 0%
Cash Grant (as percentage of CAPEX) 30% 0% 0%
Wind Cash Grants ($M) $2,260 $0 $0
Remaining Wind Project Financing Requirement (M) $7,785 $11,300 $11,896
Solar Project Achieved Financing Requirement ($M) $14,132 $18,331 $21,580
Solar Projects Electing Cash Grant 80% 0% 0%
Cash Grant (as percentage of CAPEX) 30% 0% 0%
Solar Cash Grants ($M) $3,392 $0 $0
Remaining Solar Project Financing Requirement (M) $10,740 $18,331 $21,580
Cumulative Cash Grants ($M) $5,652 $0 $0
Cumulative Remaining Financing Requirements ($M) $18,525 $29,631 $33,476
* Cash grant award timelines will not sync with financial close.
2011 2012 2013
Wind Project Achieved Financing Requirement ($M) $10,045 $11,300 $11,896
Wind Projects Electing Cash Grant 75% 75% 0%
Cash Grant (as percentage of CAPEX) 30% 30% 0%
Wind Cash Grants ($M) $2,260 $2,543 $0
Remaining Wind Project Financing Requirement (M) $7,785 $8,758 $11,896
Solar Project Achieved Financing Requirement ($M) $14,132 $18,331 $21,580
Solar Projects Electing Cash Grant 80% 80% 0%
Cash Grant (as percentage of CAPEX) 30% 30% 0%
Solar Cash Grants ($M) $3,392 $4,399 $0
Remaining Solar Project Financing Requirement (M) $10,740 $13,931 $21,580
Cumulative Cash Grants ($M) $5,652 $6,942 $0
Cumulative Remaining Financing Requirements ($M) $18,525 $22,689 $33,476
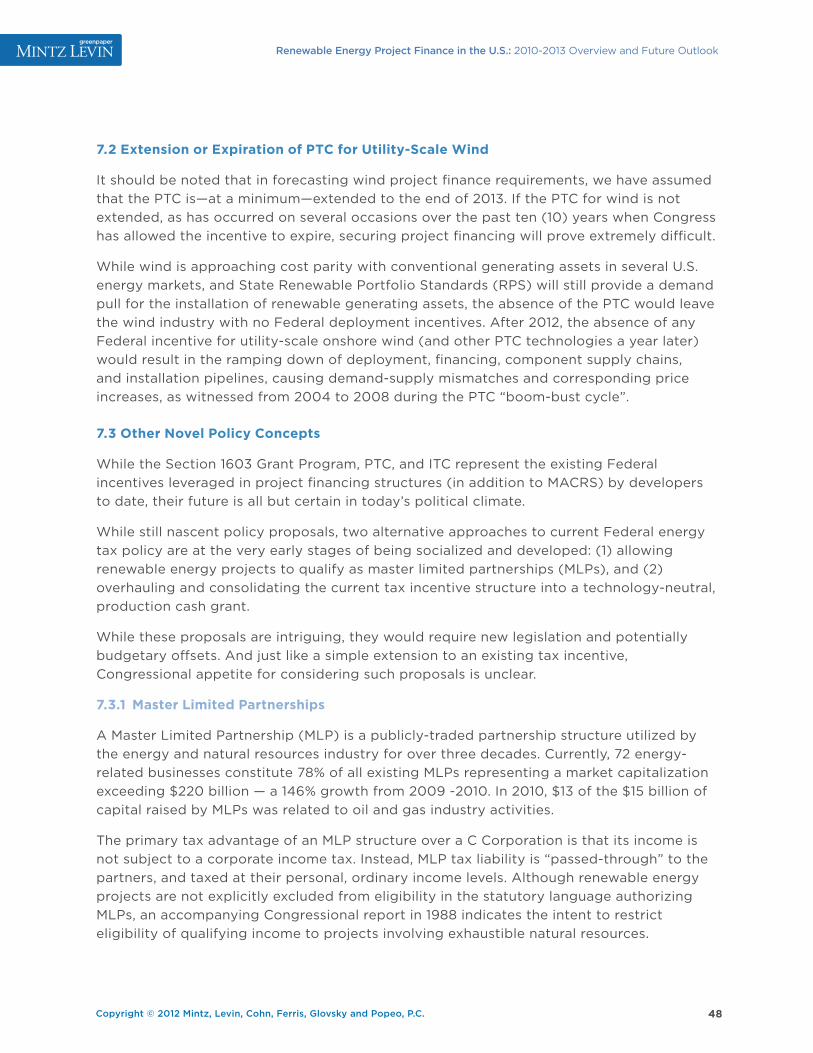
greenpaper
Renewable Energy Project Finance in the U.S.: 2010-2013 Overview and Future Outlook
48Copyright © 2012 Mintz, Levin, Cohn, Ferris, Glovsky and Popeo, P.C.
7.2 Extension or Expiration of PTC for Utility-Scale Wind
It should be noted that in forecasting wind project finance requirements, we have assumed that the PTC is—at a minimum—extended to the end of 2013. If the PTC for wind is not extended, as has occurred on several occasions over the past ten (10) years when Congress has allowed the incentive to expire, securing project financing will prove extremely difficult.
While wind is approaching cost parity with conventional generating assets in several U.S. energy markets, and State Renewable Portfolio Standards (RPS) will still provide a demand pull for the installation of renewable generating assets, the absence of the PTC would leave the wind industry with no Federal deployment incentives. After 2012, the absence of any Federal incentive for utility-scale onshore wind (and other PTC technologies a year later) would result in the ramping down of deployment, financing, component supply chains, and installation pipelines, causing demand-supply mismatches and corresponding price increases, as witnessed from 2004 to 2008 during the PTC “boom-bust cycle”.
7.3 Other Novel Policy Concepts
While the Section 1603 Grant Program, PTC, and ITC represent the existing Federal incentives leveraged in project financing structures (in addition to MACRS) by developers to date, their future is all but certain in today’s political climate.
While still nascent policy proposals, two alternative approaches to current Federal energy tax policy are at the very early stages of being socialized and developed: (1) allowing renewable energy projects to qualify as master limited partnerships (MLPs), and (2) overhauling and consolidating the current tax incentive structure into a technology-neutral, production cash grant.
While these proposals are intriguing, they would require new legislation and potentially budgetary offsets. And just like a simple extension to an existing tax incentive, Congressional appetite for considering such proposals is unclear.
7.3.1 Master Limited Partnerships
A Master Limited Partnership (MLP) is a publicly-traded partnership structure utilized by the energy and natural resources industry for over three decades. Currently, 72 energy-related businesses constitute 78% of all existing MLPs representing a market capitalization exceeding $220 billion — a 146% growth from 2009 -2010. In 2010, $13 of the $15 billion of capital raised by MLPs was related to oil and gas industry activities.
The primary tax advantage of an MLP structure over a C Corporation is that its income is not subject to a corporate income tax. Instead, MLP tax liability is “passed-through” to the partners, and taxed at their personal, ordinary income levels. Although renewable energy projects are not explicitly excluded from eligibility in the statutory language authorizing MLPs, an accompanying Congressional report in 1988 indicates the intent to restrict eligibility of qualifying income to projects involving exhaustible natural resources.

greenpaper
Renewable Energy Project Finance in the U.S.: 2010-2013 Overview and Future Outlook
49Copyright © 2012 Mintz, Levin, Cohn, Ferris, Glovsky and Popeo, P.C.
Expanding the definition of “natural resources” in the Master Limited Partnership statute to include projects currently eligible for the Section 1603 Cash Grant Program would allow renewable energy project developers in the U.S. to utilize the same successful business structure—and associated tax status—actively used by the fossil fuel industries.
7.3.2 Technology Neutral Production Cash Grant
A more technology-neutral approach to energy tax policy could streamline the currently complicated, targeted incentives in the tax code and attract enough private investment to phase out the subsidies in a predictable, timely way, according to sources working in the renewable energy industry. In theory, such an incentive would be awarded on technology or feedstock characteristics, but rather on performance metrics such as emissions.
A well-designed mechanism would alleviate many concerns and inefficiencies inherent in the current Federal tax incentives for renewable energy such as the “picking winners and losers” argument (technology neutral), a need to engage the tax equity market (cash grant), awarding projects on production, and policy stability (orderly phase-out).

greenpaper
Renewable Energy Project Finance in the U.S.: 2010-2013 Overview and Future Outlook
50Copyright © 2012 Mintz, Levin, Cohn, Ferris, Glovsky and Popeo, P.C.
8 CONCLUSION
Nearly three (3) years since the onset of the financial crisis, the availability of project financing to renewable energy projects in the U.S. has improved somewhat due to the thawing of the lending markets and the passage of the Recovery Act Programs. However, considerable uncertainty remains as the industry awaits final word on the potential extension of the the Section 1603 Cash Grant Program now, the PTC for wind in 2012, and as tax equity markets continue their tenuous rebound from their historically low, recessionary depths.
Overall, we predict the forecasted supply for project financing will not be able to meet the demand sought by the renewable energy sector through 2013. We believe that larger, high-quality projects from established developers with well-priced PPAs from creditworthy off-takers will continue to be able to access project financing at reasonable terms over the next several years. However, limitations or retrenchment in the project financing markets—whether for debt, tax equity or direct equity—are likely to constrain financings for smaller projects, less-established developers, and/or projects with higher technology or development risks.

greenpaper
Renewable Energy Project Finance in the U.S.: 2010-2013 Overview and Future Outlook
51Copyright © 2012 Mintz, Levin, Cohn, Ferris, Glovsky and Popeo, P.C.
9 APPENDIX 1: 2010 PROJECT DATA
Figure9-1:Shepherds Flat Wind Financing Summary
Source: GTM Research, Project Finance Magazine
GEN
ERA
L
Project Shepherds Flat
Type Wind
State OR
Developers Caithness, GE EFS
Size 845 MW-AC
Signing Date Dec-10
Construction Commencement Apr-10
Est. Completion Apr-12
Loan Guarantee Amount($M)/Conditional Commitment/Close
$960 Oct-10Dec-10
Cash Grant Amount ($M) $494.1
Cost/W $2.52
Debt & Equity ($M) $2,128.1
EQU
ITY Total Equity ($M) $702.2
Equity Providers Caithness Energy, GE EFS
Average Amount Provided ($M) $351.1
DEB
T
Total Debt ($M) $1,425.9
Debt Providers/Deal Margin
BTMULibor 137.5bp
Citibank
RBS
Libor 262.5bpWestLB
Banco Sabadell
Bayern
Libor 70bpCoBank
Dexia
Helaba
Libor 262.5bpSantander
Scotia Capital
Average Amount Provided ($M) $81.9
Tranches/Tenors/Value ($M)
Letters of Credit 7 $114
Letters of Credit 7 $112
Construction & Term 14 $540
Construction & Term 14 $135
Private Placement Bonds 21.5 $525
Private Placement Bonds Citibank
Amount ($M) $525

greenpaper
Renewable Energy Project Finance in the U.S.: 2010-2013 Overview and Future Outlook
52Copyright © 2012 Mintz, Levin, Cohn, Ferris, Glovsky and Popeo, P.C.
Figure9-2:Idaho Wind Partners Project Financing Summary
Source: GTM Research, Project Finance Magazine
GE
NE
RA
L
Project Idaho Wind Partners I
Type Wind
State Idaho
Developers Exergy, GE EFS
Size 183 MW-AC
Signing Dates Oct 2010 / Jan 2011
Construction Commencement Unknown
Est. Completion Unknown
Loan Guarantee Amount($M)/Conditional Commitment/Close
None
Cash Grant Amount ($M) $131 (est.)
Cost/W $2.14
Debt & Equity ($M) $390.8
EQ
UIT
Y
Total Equity ($M) $149.8
Equity Providers/Amount ($M)
Reunion Power $36.6
Atlantic Power $40.0
GE EFS $36.6
Exergy $36.6
DE
BT
Total Debt ($M) $241.0
Debt Providers/Deal Margin
BTMU Libor 250-275bp
ING Libor 250-275bp
Nord/LB Libor 250-275bp
Average Amount Provided ($M) $80.0
Tranches/Tenors/Value ($M)
Construction & Term 17 $139
Cash Grant Bridge $83
Construction & Term $19
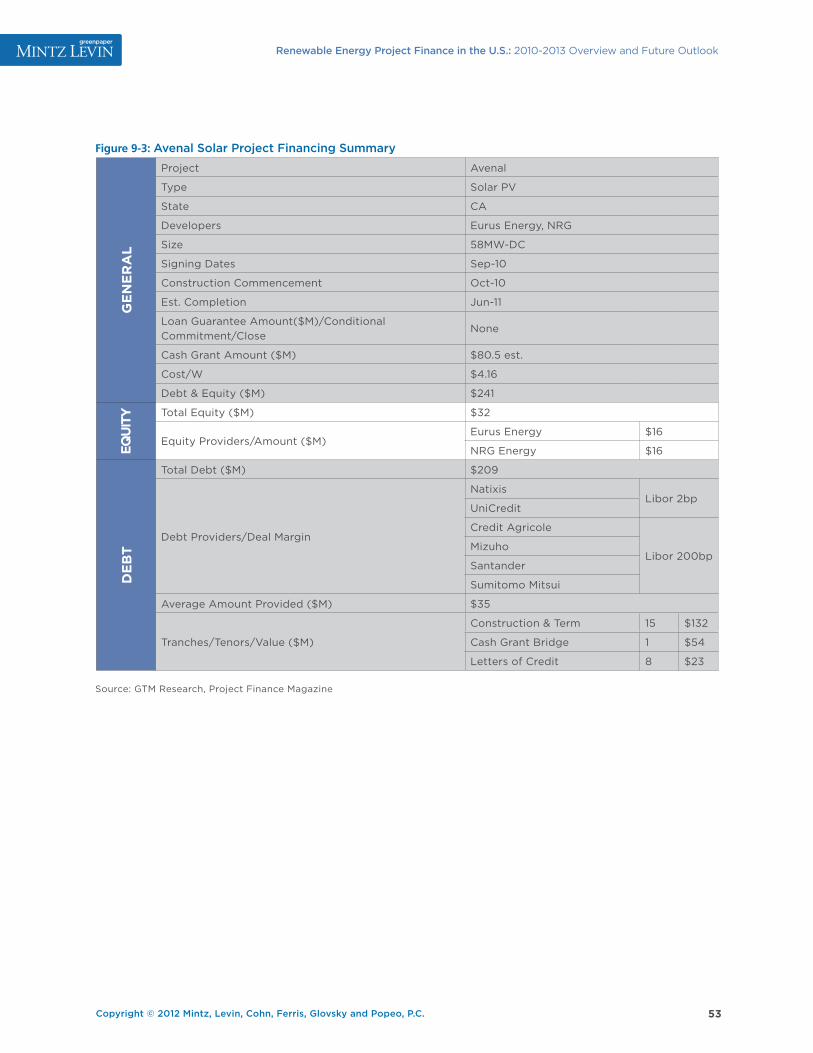
greenpaper
Renewable Energy Project Finance in the U.S.: 2010-2013 Overview and Future Outlook
53Copyright © 2012 Mintz, Levin, Cohn, Ferris, Glovsky and Popeo, P.C.
Figure9-3:Avenal Solar Project Financing Summary
Source: GTM Research, Project Finance Magazine
GE
NE
RA
L
Project Avenal
Type Solar PV
State CA
Developers Eurus Energy, NRG
Size 58MW-DC
Signing Dates Sep-10
Construction Commencement Oct-10
Est. Completion Jun-11
Loan Guarantee Amount($M)/Conditional Commitment/Close
None
Cash Grant Amount ($M) $80.5 est.
Cost/W $4.16
Debt & Equity ($M) $241
EQU
ITY Total Equity ($M) $32
Equity Providers/Amount ($M)Eurus Energy $16
NRG Energy $16
DE
BT
Total Debt ($M) $209
Debt Providers/Deal Margin
NatixisLibor 2bp
UniCredit
Credit Agricole
Libor 200bpMizuho
Santander
Sumitomo Mitsui
Average Amount Provided ($M) $35
Tranches/Tenors/Value ($M)
Construction & Term 15 $132
Cash Grant Bridge 1 $54
Letters of Credit 8 $23

greenpaper
Renewable Energy Project Finance in the U.S.: 2010-2013 Overview and Future Outlook
54Copyright © 2012 Mintz, Levin, Cohn, Ferris, Glovsky and Popeo, P.C.
Figure9-4:Ivanpah Solar Project Financing Summary
Source: GTM Research, Project Finance Magazine
Figure9-5:Solana Solar Project Financing Summary
Source: GTM Research, Project Finance Magazine
GE
NE
RA
L
Project Ivanpah
Type Solar CSP
State CA
Developers BrightSource
Size 392 MW-AC
Signing Date Apr-11
Construction Commencement 2010
Est. Completion 2012-2013
Loan Guarantee Amount($M)/Conditional Commitment/Close $1,600 Feb-10 Apr-11
Cash Grant Amount ($M) None
Cost/W $5.02
Debt & Equity ($M) $2,360
EQU
ITY Total Equity ($M) $760
Equity Providers NRG Energy, Google
Amount Provided ($M) $592, $168
DE
BT
Total Debt ($M) $1,600
Debt Providers/Deal Margin US Federal Financing Bank
Tranches/Tenors/Value ($M) N/A
GE
NE
RA
L
Project Solana
Type Solar CSP
State AZ
Developers Abengoa
Size 280 MW-AC
Signing Date Dec-10
Construction Commencement 2010
Est. Completion 2012-2013
Loan Guarantee Amount($M)/Conditional Commitment/Close $1,450 Jul-10Dec-10
Cash Grant Amount ($M) None
Cost/W $7.03
Debt & Equity ($M) $1,967
EQU
ITY Total Equity ($M) $517
Equity Providers Abengoa
Amount Provided ($M) $517
DE
BT Total Debt ($M) $1,450
Debt Providers/Deal Margin US Federal Financing Bank
Tranches/Tenors/Value ($M) N/A

greenpaper
Renewable Energy Project Finance in the U.S.: 2010-2013 Overview and Future Outlook
55Copyright © 2012 Mintz, Levin, Cohn, Ferris, Glovsky and Popeo, P.C.
MINTZ LEVIN CONTACTS
Thomas R. Burton IIIChair, Energy and Clean Tech PracticeMintz [email protected], MA
Sahir SurmeliCo-chair, Energy and Clean Tech PracticeMintz [email protected], MA
Brady BergCorporate and Energy and Clean Tech PracticeMintz [email protected] Alto, CA
Travis BlaisTax and Energy and Clean Tech PracticeMintz [email protected], MA
Jordan M. CollinsDirector of Government RelationsML [email protected], D.C.
Jeremy D. GlaserCorporate and Energy and Clean Tech PracticeMintz [email protected] Diego, CA
Carl A. Kukkonen IIIIntellectual Property and Energy and Clean Tech PracticeMintz [email protected] Diego, CA
David J. LeiterPresidentML [email protected], D.C.
Audrey C. LouisonCorporate and Energy and Clean Tech Practice Mintz [email protected], D.C.
David L. O’ConnorSenior Vice President forEnergy and Clean TechnologyML [email protected], MA
Mark J. RiedyCorporate and Energy and Clean Tech PracticeMintz [email protected], D.C.
GTM RESEARCH CONTACTS
Brett Prior, CFASenior AnalystGTM Research / Greentech [email protected], MA
Andrew KrulewitzResearch AssociateGTM Research / Greentech [email protected], MA

greenpaper
Renewable Energy Project Finance in the U.S.: 2010-2013 Overview and Future Outlook
56Copyright © 2012 Mintz, Levin, Cohn, Ferris, Glovsky and Popeo, P.C.
THIS COMMUNICATION MAY BE CONSIDERED ATTORNEY ADVERTISING UNDER THE RULES OF SOME STATES. THE INFORMATION AND MATERIALS CONTAINED HEREIN HAVE BEEN PROVIDED AS A SERVICE BY THE LAW FIRM OF MINTZ, LEVIN, COHN, FERRIS, GLOVSKY AND POPEO, P.C.; HOWEVER, THE INFORMATION AND MATERIALS DO NOT, AND ARE NOT INTENDED TO, CONSTITUTE LEGAL ADVICE. NEITHER TRANSMISSION NOR RECEIPT OF SUCH INFORMATION AND MATERIALS WILL CREATE AN ATTORNEY-CLIENT RELATIONSHIP
BETWEEN THE SENDER AND RECEIVER. THE HIRING OF AN ATTORNEY IS AN IMPORTANT DECISION THAT SHOULD NOT BE BASED SOLELY UPON ADVERTISEMENTS OR SOLICITATIONS. USERS ARE ADVISED NOT TO TAKE, OR REFRAIN FROM TAKING, ANY ACTION BASED UPON THE INFORMATION AND MATERIALS CONTAINED HEREIN WITHOUT CONSULTING LEGAL COUNSEL ENGAGED FOR A PARTICULAR MATTER. FURTHERMORE, PRIOR RESULTS DO NOT GUARANTEE A SIMILAR OUTCOME.
DISCLAIMER

For more info please visit www.greentechmedia.com/sponsored/resource-center/
A joint white paper produced by:
A Greentech Media Company