Renewable Energy Dividends Effective Renewable Energy Policies For Florida John Burges 2009 Bayonne.
57
Renewable Energy Dividends Effective Renewable Energy Policies For Florida John Burges 2009 Bayonne
-
Upload
angela-barrett -
Category
Documents
-
view
216 -
download
0
Transcript of Renewable Energy Dividends Effective Renewable Energy Policies For Florida John Burges 2009 Bayonne.

Renewable Energy Dividends Effective Renewable Energy Policies
For Florida
John Burges
2009
Bayonne

2

3
RPS REDs Amendment Integrate into RPS legislation 20% by 2020 German / Gainesville model; similar to CA Energy
Comm recommendation A RED for all < 20MW renewable producers Pricing determined cost of power + profit Pricing differentiated by size, technology Cheapest $/MWhr of RE for ratepayers Drive green jobs

4
What’s Required?
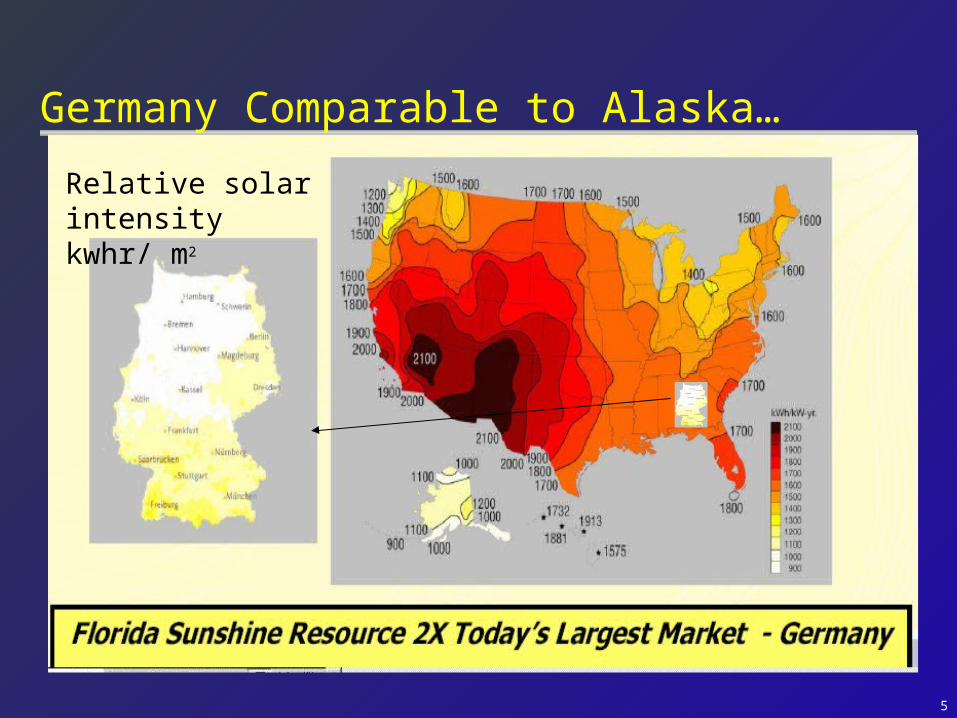
Adequate insolation/wind/bio (incoming solar radiation) – Sunshine State very high; 85% of max.
Long-term fixed pricing/same as utilities X
– Payment/Recovery mechanism
– Renewables priority grid access Available/affordable land near demand
– ~10,000 acres per 1000MW Simple siting and permitting process X
– Statewide Leadership for Renewables Entrepreneurs/Developers
– State must allow new entrants
5
Germany Comparable to Alaska…
Relative solar intensity kwhr/ m2

6
Florida’s Total Installed Capacity On One German Roof
Munich Trade Fair (Germany), 2.1 MWpCompletion November 2002

7
US Utility Trip to Europe - Solar Factory
8
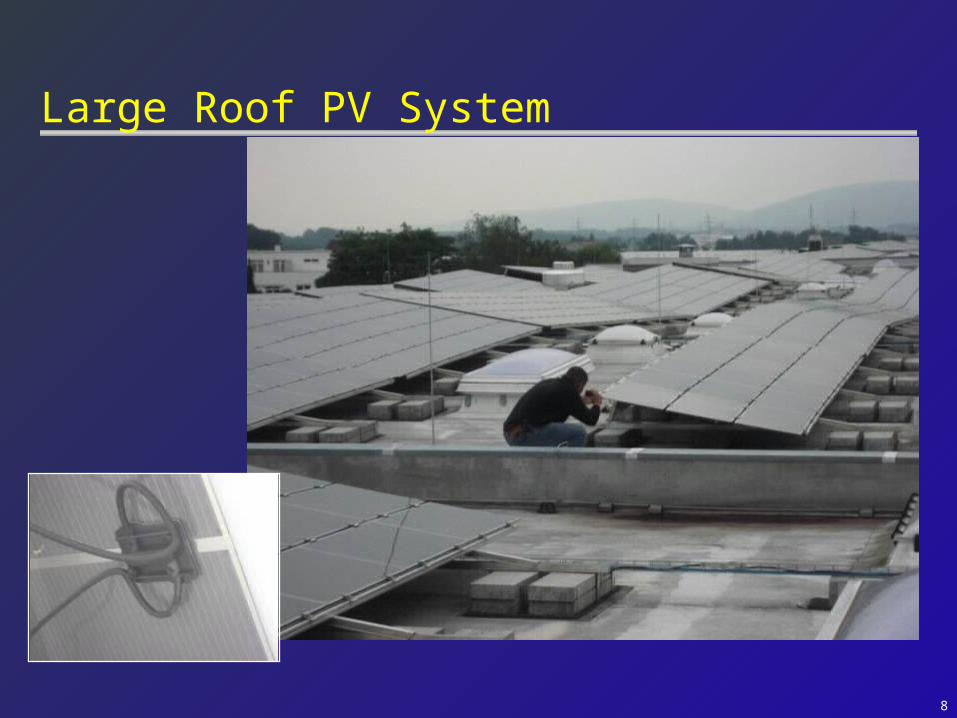
Large Roof PV System

9
Facades and Skylights
10
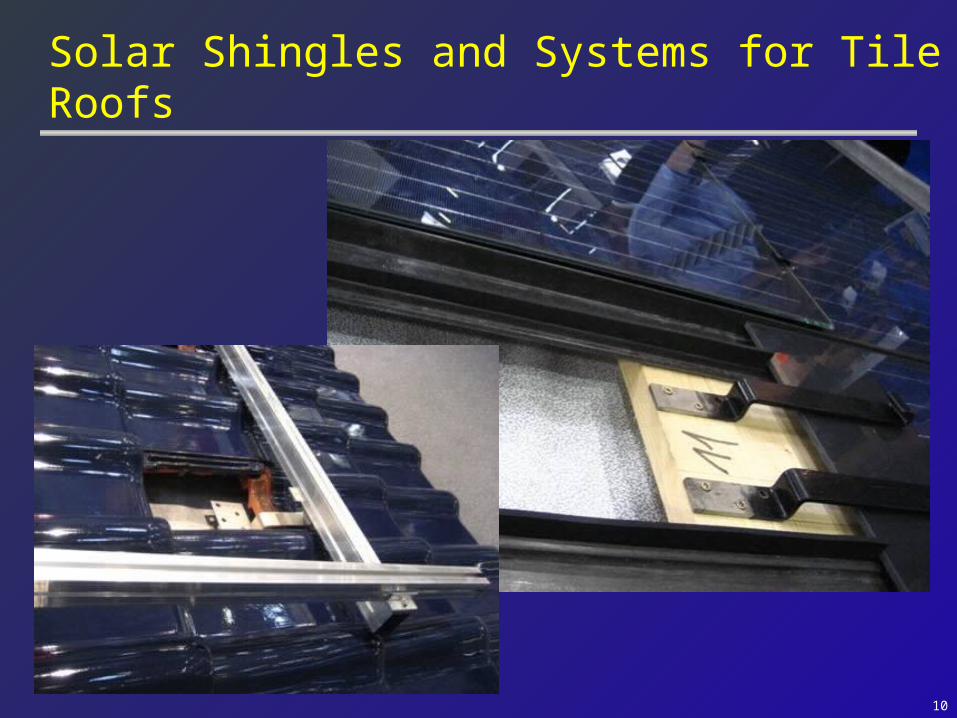
Solar Shingles and Systems for Tile Roofs
11
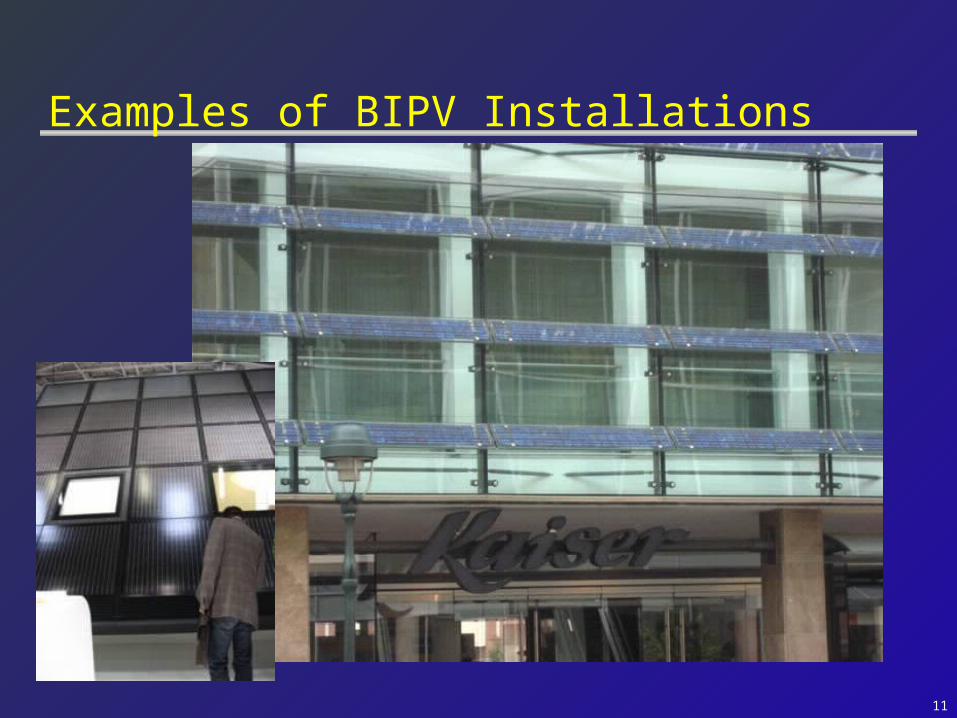
Examples of BIPV Installations

12
Notice The Bicycle Sheds!

13
Concentrator Systems

14
New Forms and Ideas

15
Jobs and Opportunity

16
Solar Job Creation in Germany, 2003 – 2010
0
10,000
20,000
30,000
40,000
50,000
60,000
1998 1999 2000 2001 2002 2003 2004 2005 2006 2007 2008e 2009e 2010e
Source: EuPD Research
Germany enactsFeed-in Tariff Law
Jobs

17
Area
Germany: 357,030 km² US*: 8,154,157 km² *23 times larger, without Alaska
Installed Capacity
Germany*: 22,247 MW US: 16,818 MW
*1.3 times largerMap credit: Ryan Perroy, University of California, Santa Barbara
Landmass vs. Wind energy (MW) in Germany and Continental United States (2007)
Renewables - US Is Left in the Dust…

18
Renewables – Why Bother?
Energy Security - Pickens/Woolsey Reduce dependency Russia/Ukraine, Gazprom, Chavez, Iran Grid security
Wealth Creation - Jobs – Friedman Higher local ownership; beneficial impact on local economy Germany employs 250,000 – forecasting 500,000; “Export
Machine” Germany – 2006 - Net benefit to country $9BN per annum
Environmental Benefits Biomass, wind, solar minimal CO2
19
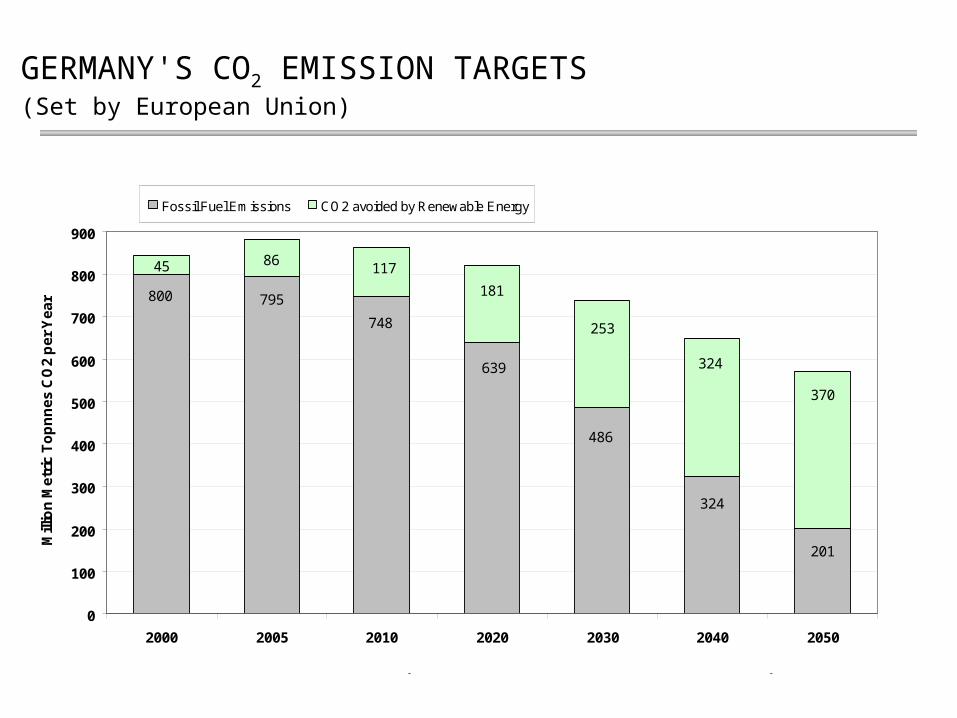
GERMANY'S CO2 EMISSION TARGETS(Set by European Union)
45 86
201
324
486
639
748
795800
370
324
253
181
117
0
100
200
300
400
500
600
700
800
900
2000 2005 2010 2020 2030 2040 2050
Mill
ion
Me
tric
To
pn
ne
s C
O2
pe
r Y
ea
r
Fossil Fuel Emissions CO2 avoided by Renewable Energy
SOURCE: German Federal Ministry for the Environment, Nature Conservation, and Nuclear Safety
2006 Actuals-- 878 million tonnes emitted-- 100 million tonnes avoided

20
Business Perspective – The Opportunity
VC investment in clean energy - $117 BN + 35% 2007 (NEF) Solar is a $ 30 billion industry – $120BN sales by 2011 - 50% CAGR
~$100BN stock market valuation for solar US solar producers largely for export; overseas cannot get enough US / Florida solar initiatives deeply flawed; deterring investment Florida is missing massive solar investment opportunity:
$5BN sales - export industry
Employing 25-50,000 people; Construction/Manufacturing, High tech R&D
Florida has ~ 2MW of solar. Germany installed over 2000MW in 2008 - $12BN Private Investment

21
Strong Global Solar PV Market Growth
QCell Presentation 09-30-07
~$30BN sales
~$100BN Sales

22
PV Financing Requirements: Who Lends?
Source: Good Energies

23
Downward Spiral Global financial meltdown Less tax capacity & capital available by institutional investors
Federal Tax credits become “worthless”
Equity supply dries up; returns increase Fewer renewable energy projects
~3,000 MW less wind farms installed in US in ‘09 vs. ’08 Loss of ~38,000* “green collar” jobs

24
Senior Loan Volume
This chart reflects the estimated primary volume to the US and European loan markets. The US Market includes tranches denominated in non-USD currencies as well as US dollars. The European Market includes tranches denominated in non-Euro or Sterling currencies as well as Euros and Sterling.
Exchange rates from non-USD currencies are based upon date of launch of the individual transactions.
251.9192.9
138.5 144.8 165.7
274.4 297.9
480.6536.2
154.5
36.2
54.8
65.7 38.253.7
81.4
147.0
163.2
226.2
81.2
235.7
288.2
247.7
204.2183.0
219.3
355.8
444.8
$0B
$100B
$200B
$300B
$400B
$500B
$600B
$700B
$800B
1999 2000 2001 2002 2003 2004 2005 2006 2007 2008
US Market European Market
643.8
762.4
Source: S&P
25
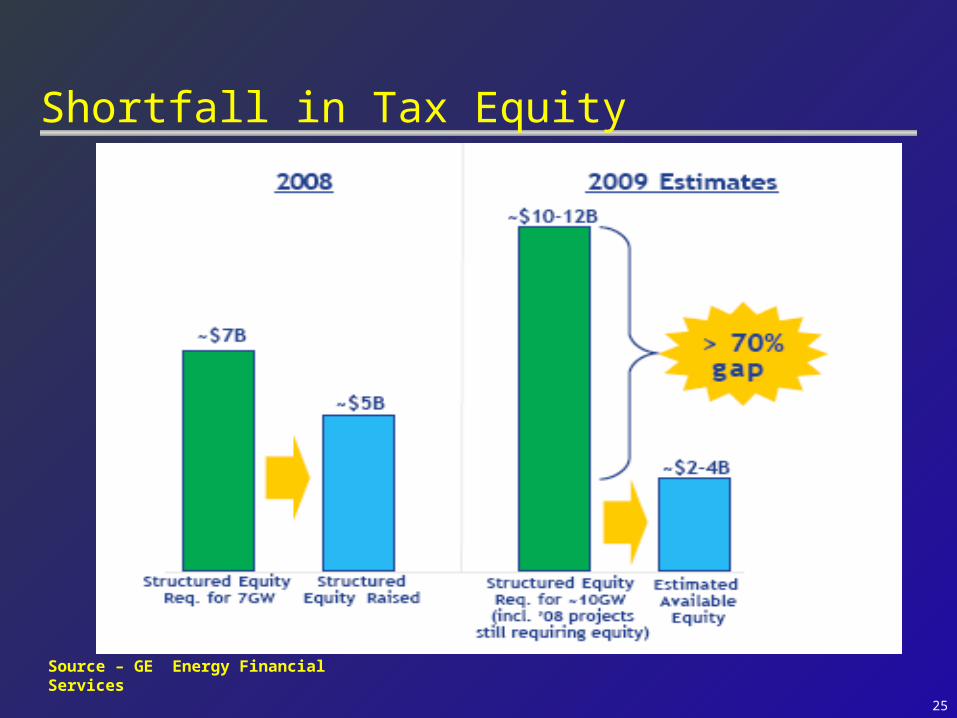
Shortfall in Tax Equity
Source – GE Energy Financial Services

26
Solutions
Modify Federal ITC
Refundable RE Performance Based Incentives
Feed In Tariffs
Quotas – tradable RECs

27
Regulatory Regimes – High Risk ROCs (UK)
RPS / RECs / SRECs (US)
Price risk for electricity
Price risk for the ROCs / RECs (usually)
Lending restricted to duration of RPS obligation and stability of regime
Price & volume risk reduces maturities; reduces leverage and increases price

28
Regulatory Regimes – Low Risk
Feed-in Tariffs
No price risk
No volume risk
Limited or no regulatory risk once project is built
Counterparty risk is utility/sovereign
Attracts more capital on better terms

29
Post Banking Crisis…creates new uncertainty
(end 2007)
Feed-in
RECs / RPS
PTC
Leverage (debt, %)
>90%
70-80%
60-80%
50-70%
75% ???
Maturity (after completion)
15-18y
13-15y
3-15y
Mini-perms
12y ???
Margins
60-100pb
170-200bp
90-120pb
200-250bp
100-125pb
???
Capital will flow to least risk regulatory mechanism
Dexia Bank

30
What are Feed in Tariffs ?

31
Renewable Energy Dividendsor Feed in tariffs Simple, transparent – available to all
Priority access to the grid for all renewable producers
Long term standard offer contracts; fixed price guaranteed
– 20 years
Cost + reasonable profit (tba by PSC)
– Price Differentiation by size, technology
Price degression
– Germany 9-10% fall
– Spain 30%

32
Renewables - Issues ► Solution Utilities finance fossil fuel under 20 yr rate base
Guaranteed – cost pass through Renewables require same treatment; private sector will finance Solution:
Covers all renewables; solar likely to be most productive
RE priority access to grid, 20 yr contracts, differentiated pricing,
We need every school, church, farmer, household and real estate developer to become entrepreneurs & sell back power & so drive us to a more secure clean electricity future
FACT – happening now throughout Europe; growing in US

33
Renewable Energy Dividends Policies Deliver More Capacity--
--More Quickly --More Equitably
By Enabling Participation --Everyone
18 EU Countries use Electricity Feed Laws 46 Countries world wide 2008 additions: UK, Switzerland, Ukraine, India US – Hawaii, OR, CA, IL, MI, MN, RI, LADWP, City of
Gainsville
Paul Gipe, wind-works.org

34
35
Feed In Policies &Solar Photovoltaics in Germany
Renewable Tariffs Launched
90 91 92 93 94 95 96 97 98 99 00 01 02 03 04 05 06 07
Year
0
1
2
3
4
MW Total (Thousands)
Renewable Tariffs Launched
1,000-Rooftops (2,500 x 3kW)
100,000 Rooftops

36
Solar Photovoltaic Development
90 91 92 93 94 95 96 97 98 99 00 01 02 03 04 05 06 07
Year
0
1
2
3
4
Total Installed MW (Thousands)
USA
Japan
Germany

37
Paul Gipe, wind-works.org
World PV Capacity 2007~8,000 MW
Germany53%
Japan28%
USA11%
Rest of World7%
3,963
2,120
806
550
38
Paul Gipe, wind-works.org
World Wind Generating Capacity
80 81 82 83 84 85 86 87 88 89 90 91 92 93 94 95 96 97 98 99 00 01 02 03 04 05 06 07
Year
0
20
40
60
80
100
Megawatts (Thousands)
Europe
North America
Asia

39
German Homeowners
500 MW on Home Rooftops/yr 2,000 MW+ Total 2 TWh/yr ~ €1 Billion/yr Revenue Anyone with a Roof Can Do Solar in
Germany!
Paul Gipe, wind-works.org

40
German Farms--Solar PV Crop ~700 MW on Barn Rooftops in 2007 ~1,500 MW Total in 2007 (€9 Billion) ~1.5 TWh/yr (€700 Million)
Paul Gipe, wind-works.org

41
sGermany’s Feed in PoliciesThe Results (2007)
Renewables 15% of Supply; 27% target 2020, 45% 2030 Renewables 6% of Primary Energy 70,000 Employed in Wind Industry 50,000 Employed in PV Industry 8,000 Employed in Biogas Industry 250,000 Employed in Renewables €22 (~$30) Billion Turnover Net Benefit $9BN annually
Paul Gipe, wind-works.org

42
NREL Research Findings Countries with REDs:
Have highest RE deployment
Have highest job creation; highest economist benefits tied to industry, manufacturing & services
Have counter-intuitively delivered lower-cost RE generation than countries employing “competitive” policies like the RPS & RO in the UK
National Renewable Energy Laboratory

43
REDs/FITS vs. Alternative Policies Wind power deployment in the EU:
0
10
20
30
40
50
60
70
80
1995 1996 1997 1998 1999 2000 2001 2002 2003 2004 2005 2006
Elec
tric
ity
Gen
erati
on (T
Wh)
Counties with wind FIT Counties with alternative support
Source: EUROSTAT, 2008; NREL, 2008
National Renewable Energy Laboratory Innovation for Our Energy Future

44
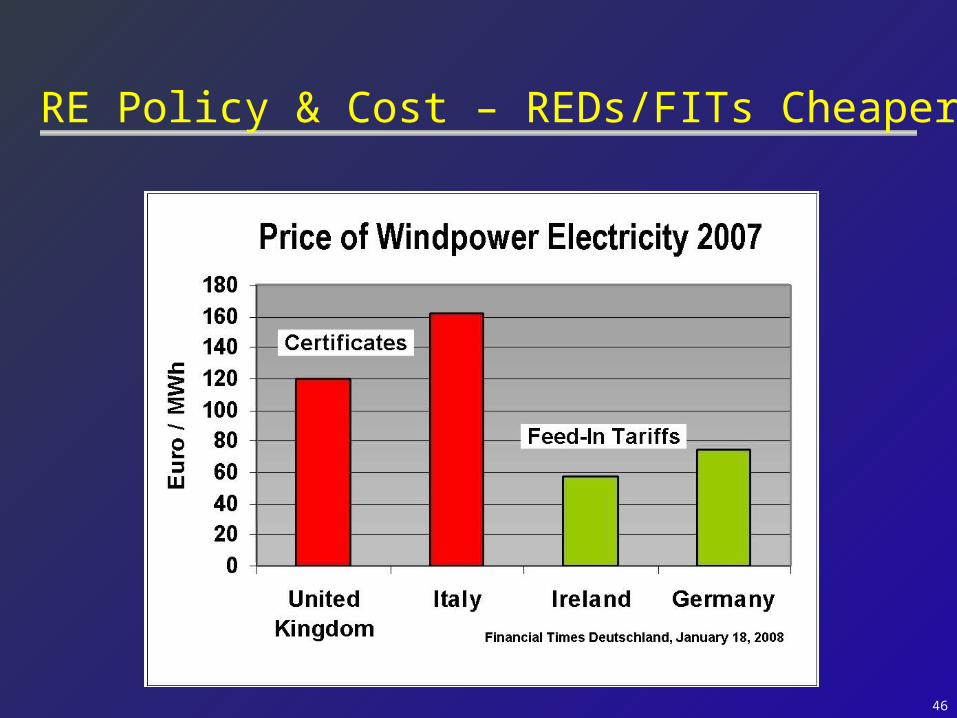
NREL Findings - RE Policy & Cost
Average per kWh Payment for Onshore Wind (2008)
0
5
10
15
20
25
Germany Spain UK* Italy*
Countries
Pu
rch
ase
Pri
ce
(US
D c
ents
/kW
h)
* Electricity price + Tradable Green Certificate (i.e. REC)
Source: BMU 2008; ISI, 2008; Fouquet, D. et al., 2008
FITs
RPS + RECs

45
NREL - REDs vs. RPS on Cost Expected Profit/kWh for
Onshore Wind 2006
0
1
2
3
4
5
6
7
8
Ge
rma
ny
Sp
ain
UK
Ita
ly
Ex
pe
cte
d P
rofi
t (E
uro
ce
nts
/kW
h)
Source: OPTRES, 2007; NREL 2009
NREL Research finding that REDs/FITs offer better value for money
46
RE Policy & Cost – REDs/FITs Cheaper

47
Florida’s Energy Issues Over-reliant on fossil fuels; imported Gas > 50%
power• $50+ oil - (IEA - $200 by 2030 ) FL’s long term
electricity costs?• Utility rate increases of 10-15%
Renewables - Speed
• Currently < 3% of power generation mix
48
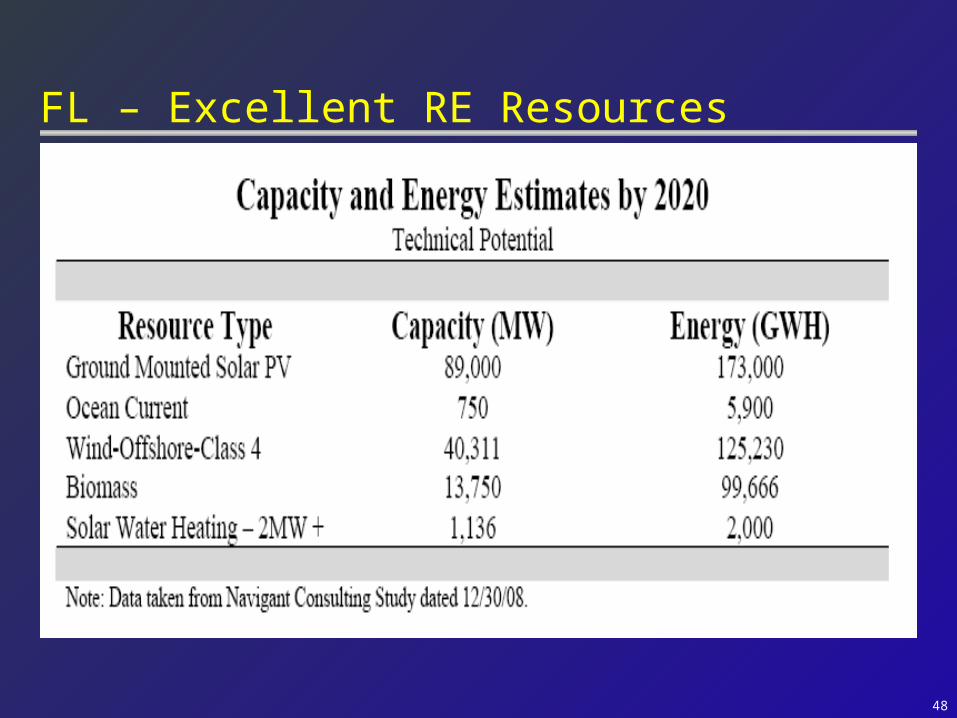
FL – Excellent RE Resources

49
Florida PSC RPS Rule/Senate Bill
20% RE & Nuclear by 2020 Rate cap of 2% IOU sales ~ $370MM Recommended tradable REC market
Spot; longer term contracts (unclear how) Nuclear 25% of targets; RE 75% Carve out for wind and solar Utility decides which projects get done, by whom ROE penalties for non-compliance 3rd party administrator appointed by IOUs

50
A Trading System

51
SRECs – Not A “Trading” System
TRADABLE SRECS GIVE NO INVESTMENT SECURITY

52
GRU’s Solar Feed in Tariff ScheduleEffective March 1, 2009
Building or Pavement Mounted (any size) or Ground Mounted
< 25 kW
2009 2030 $0.32 $0.262010 2031 $0.32 $0.262011 2032 $0.30 $0.252012 2033 $0.28 $0.232013 2034 $0.27 $0.222014 2035 $0.26 $0.212015 2036 $0.25 $0.202016 2037 $0.23 $0.19
Contract Entered into Under This Policy
During Calendar Year
Fixed Rate per kWh Applied Uniformly From the Date of
Installation Through December 31,
Fixed Rate $/kWh Over Life of Contract
Free Standing (Non-Building or Non-Pavement
Mounted)

53
GRU Achieves First Year Target for Solar Program equaling $35MM of private investment
4MW completed applications; doubles FL capacity
“We are extremely excited about the popularity of the program - our efforts to stimulate the market have been successful,” said Bob Hunzinger, GRU GM
Guarantees purchase of all electricity produced by the PV system at a fixed rate for 20 years at $0.32 kwhr for customers for first 2 yrs
The rate of $0.32 per kilowatt hour will remain in effect for 2010, falls 5% per annum thereafter
FIT Results – Feb 5th – March 1st

54Summit Blue Consulting 54
NJ BPU Analysis By Summit Blue – Projected Tradable SREC ~ 50% More Expensive For Ratepayers
Ratepayer ImpactsWgt. Avg. by Project Type
$0.0000 $0.0005 $0.0010 $0.0015 $0.0020 $0.0025 $0.0030
Base Case (w/o $300 SCAP)
SREC Only
Underwriter Model 15y
Commodity Market Model
Auction Model
15 Yr Tariff Model
Hybrid-Tariff Model
$/kWh
Source: Summit Blue

55
NJ – REC Market - What Actually Happened
2.1% solar by 2021; 1500MW or ~ 117-140MW per annum 2008 target – 90MW; 63MW actual – off track for RPS ACP 71c kwhr REC value - declines 3% Spot: 65-67c/kwhr + 15c net metered energy = 2.5x GRU FIT Some 3 yr contract -5-7 yr rare; 50-55c > 2x GRU FIT BPU recognizes that lack of long term contract a problem –
securitization being discussed
Source: Vanguard Energy Partners
Without must take long term fixed price contracts – ratepayers pay 2x GRU

56
What Can You Do? Contact local Representatives Contact House Leadership
Speaker – Larry Cretul - 850 488-1450 Contact Senate Leadership
Jim King – Chair of Utility - 850 487-5030
Thad Altman – Chair of Finance & Tax
57
Contact Details
www.FAREnergy.org
Executive Director – Mike Antheil
Tel # 561 703 4345