RENEWABLE ENERGY DEVELOPMENT Energy … ENERGY DEVELOPMENT IN ASEAN 2nd Asia Renewable Energy...
36
RENEWABLE ENERGY DEVELOPMENT IN ASEAN 2 nd Asia Renewable Energy Workshop Jakarta, 02 – 04 December 2015 1 Badariah Yosiyana ASEAN Centre for Energy
Transcript of RENEWABLE ENERGY DEVELOPMENT Energy … ENERGY DEVELOPMENT IN ASEAN 2nd Asia Renewable Energy...

RENEWABLE ENERGY DEVELOPMENT IN ASEAN
2nd Asia Renewable
Energy Workshop
Jakarta, 02 – 04 December 2015
1
Badariah YosiyanaASEAN Centre for Energy

OUTLINE
• Introduction
• What is RE Program in ASEAN : - potential, installed power capacity, power generation, the relevant RE policies
• 4th ASEAN Energy Outlook
• RE Financing
• Way forward
2

ASEAN CENTER FOR ENERGY (ACE) IN ASEAN’S STRUCTURE
Intergovernmental
Organisation on
Energy Matters
7 specialized areas
ACE reports to the
ACE Governing
Council
4
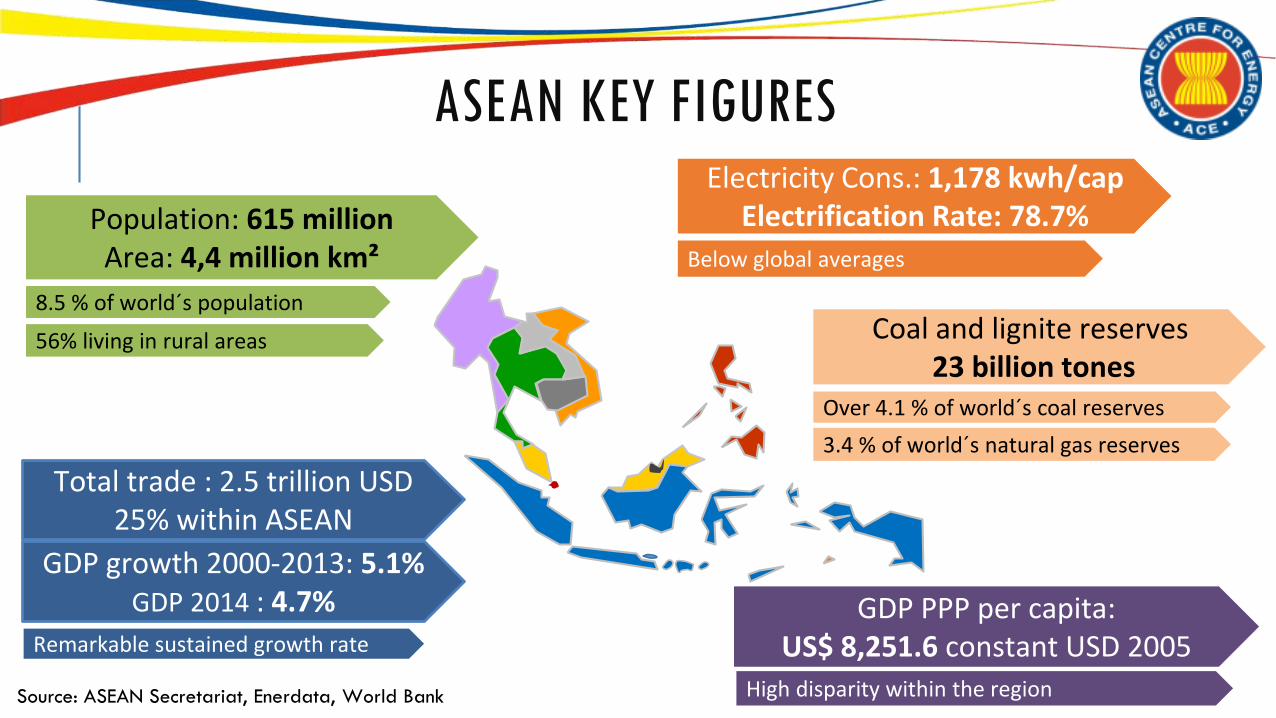
ASEAN KEY FIGURES
GDP growth 2000-2013: 5.1%GDP 2014 : 4.7%
Remarkable sustained growth rate
GDP PPP per capita:US$ 8,251.6 constant USD 2005
High disparity within the region
Electricity Cons.: 1,178 kwh/capElectrification Rate: 78.7%
Below global averages
Coal and lignite reserves23 billion tones
Over 4.1 % of world´s coal reserves
3.4 % of world´s natural gas reserves
Population: 615 millionArea: 4,4 million km²
8.5 % of world´s population
56% living in rural areas
Total trade : 2.5 trillion USD25% within ASEAN
Source: ASEAN Secretariat, Enerdata, World Bank
RENEWABLE ENERGY DEVELOPMENT IN ASEAN
5

REGIONAL COMMITMENTS
ASEAN Plan of Actions for Energy Cooperation (APAEC) 2010 - 2015
15%Share of Renewable Energy in the ASEAN
Installed Power Capacity by 2015
ASEAN Plan of Actions for Energy Cooperation (APAEC) 2016 - 2025
23% Share of Renewable Energy in the ASEAN
Energy Mix by 2025
“Enhancing Energy Connectivity and Market Integration in ASEAN to Achieve Energy Security, Accessibility, Affordability and Sustainability for All”

AMS COMMITMENTS IN RE
7
10% RE share in power generation by 2035
More than 2 GW of hydropower in 2020
23% NRE share of total energy consumption in 2025
30% RE share of total energy consumptions by 2025
34% RE share in installed capacity, 13% RE share in power generation in 2050
15 GW installed capacity in 2030
350 MW installed capacity of solar by 2020
25% AE share in total energy consumption by 2021
15% - 20% RE share in installed capacity by 2030
6% RE share in power generation in 2030
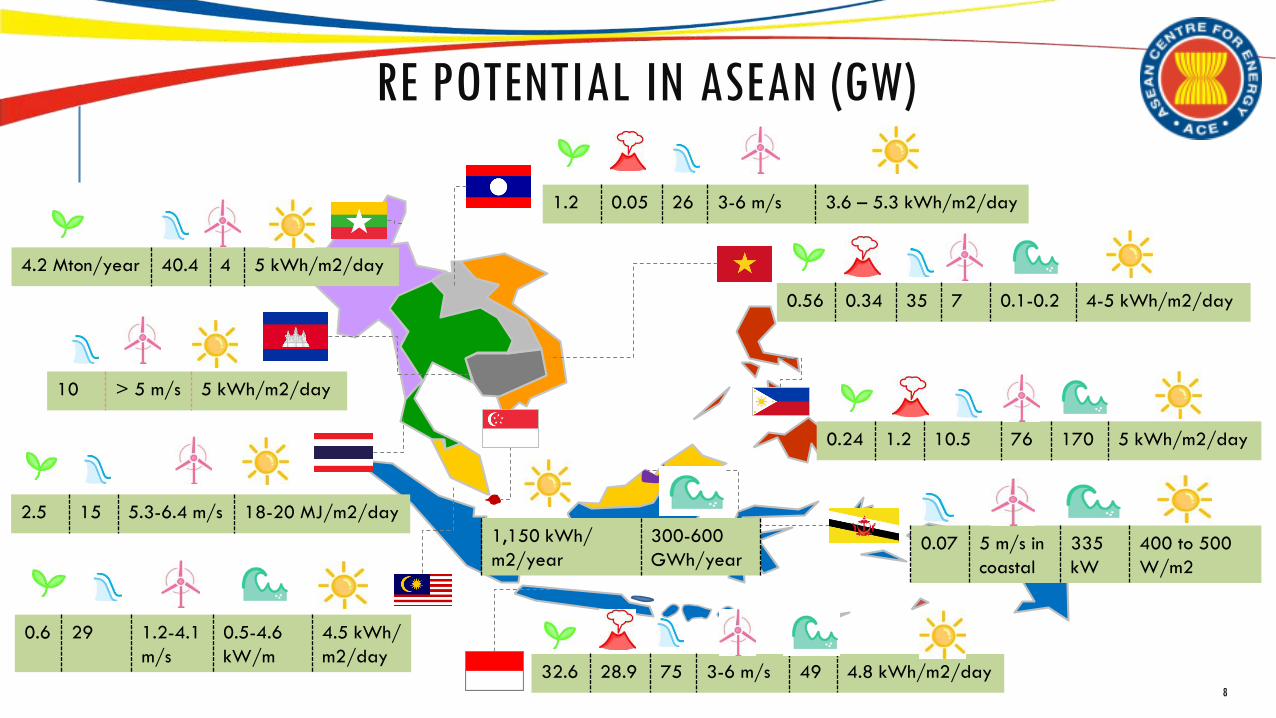
RE POTENTIAL IN ASEAN (GW)
32.6 28.9 75 3-6 m/s 49 4.8 kWh/m2/day
0.24 1.2 10.5 76 170 5 kWh/m2/day
0.56 0.34 35 7 0.1-0.2 4-5 kWh/m2/day
1.2 0.05 26 3-6 m/s 3.6 – 5.3 kWh/m2/day
0.6 29 1.2-4.1
m/s
0.5-4.6
kW/m
4.5 kWh/
m2/day
2.5 15 5.3-6.4 m/s 18-20 MJ/m2/day
10 > 5 m/s 5 kWh/m2/day
4.2 Mton/year 40.4 4 5 kWh/m2/day
0.07 5 m/s in
coastal
335
kW
400 to 500
W/m2
1,150 kWh/
m2/year
300-600
GWh/year
8

ASEAN INSTALLED CAPACITY AND GENERATION (2013)
Installed Power Capacity for Renewable Energy :
45,584.9 MW
Sources : ACE Database, as of 2013.*Others : Biogas and waste
Renewable Energy24.8%
Non-renewable
Energy75.2%
184,068 MW
Renewable Energy20.6%
Non-renewable
Energy79.4%
820,834GWh
Power Generation for Renewable Energy
169,073 GWh
9
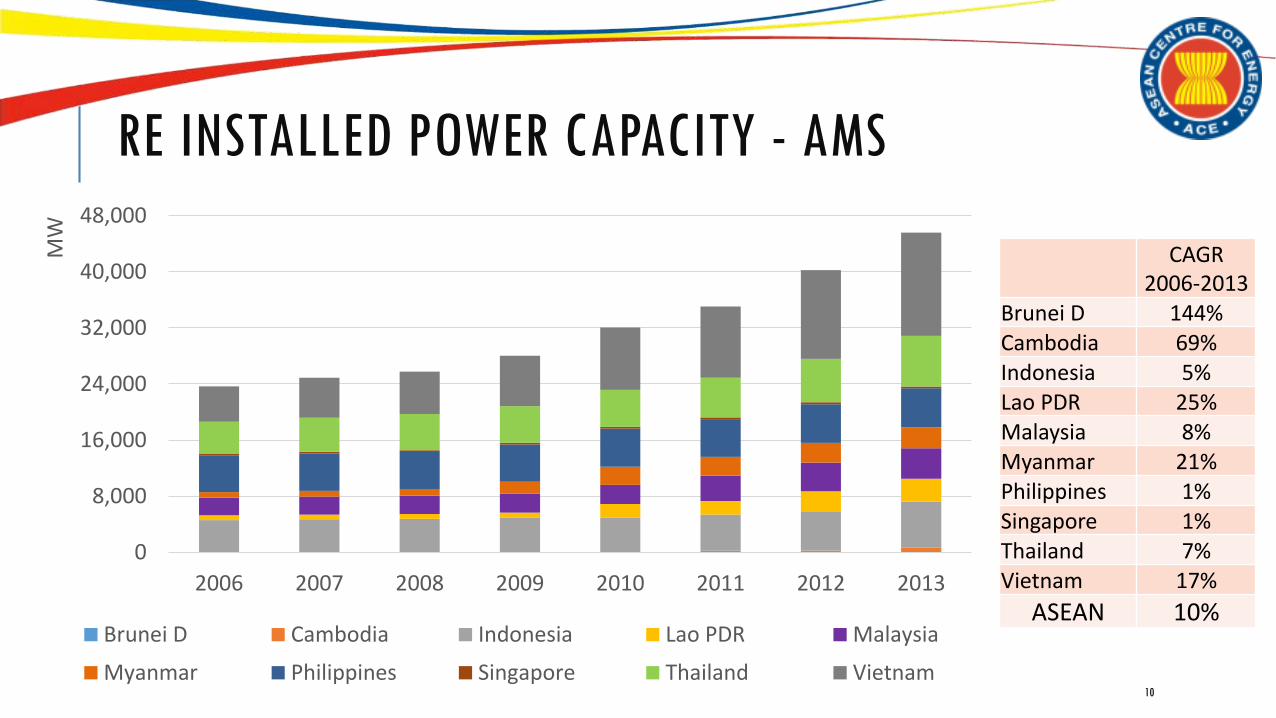
RE INSTALLED POWER CAPACITY - AMS
10
0
8,000
16,000
24,000
32,000
40,000
48,000
2006 2007 2008 2009 2010 2011 2012 2013
MW
Brunei D Cambodia Indonesia Lao PDR Malaysia
Myanmar Philippines Singapore Thailand Vietnam
CAGR 2006-2013
Brunei D 144%Cambodia 69%Indonesia 5%Lao PDR 25%Malaysia 8%Myanmar 21%Philippines 1%Singapore 1%Thailand 7%Vietnam 17%
ASEAN 10%

RE INSTALLED POWER CAPACITY – SOURCES1
11
0
10,000
20,000
30,000
40,000
50,000
2006 2007 2008 2009 2010 2011 2012 2013
MW
Biomass Biogas Geothermal Solar Wind Hydro Waste
RE SourcesCAGR
2006-2013Biomass 11 %Biogas 102 %
Geothermal 2 %Solar 62 %Wind 39 %Hydro 10 %ASEAN 10 %
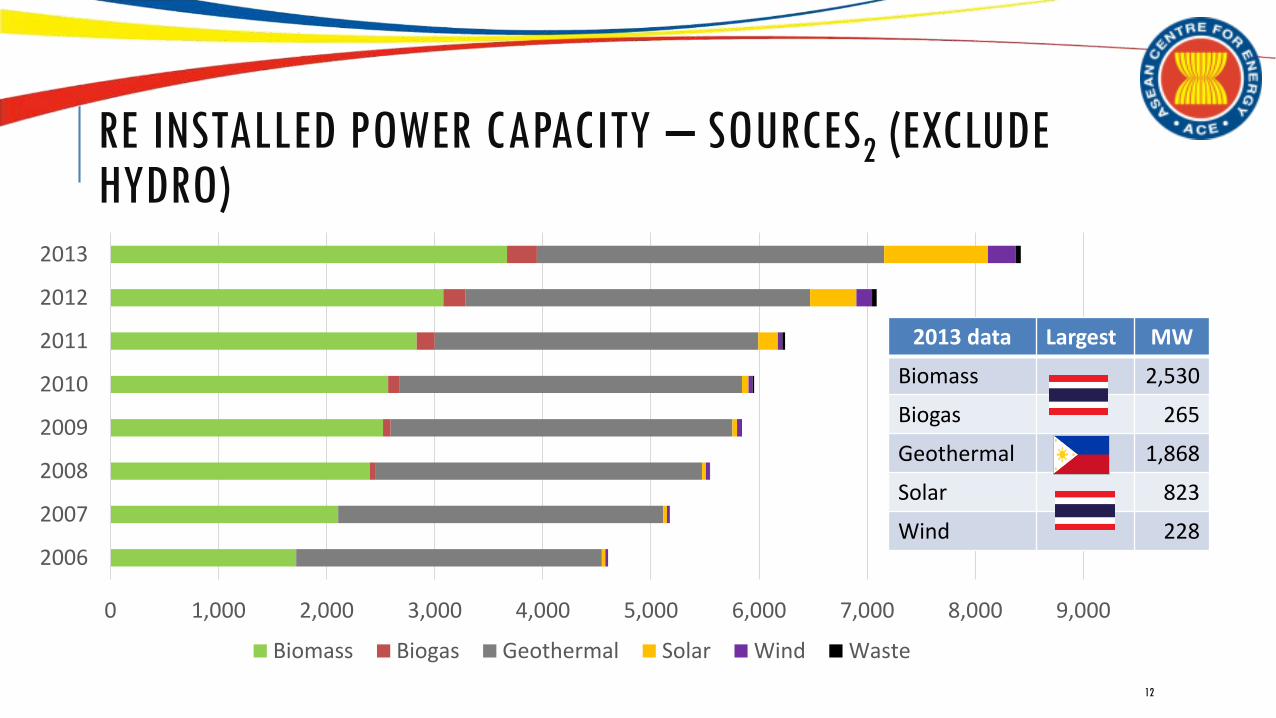
0 1,000 2,000 3,000 4,000 5,000 6,000 7,000 8,000 9,000
2006
2007
2008
2009
2010
2011
2012
2013
Biomass Biogas Geothermal Solar Wind Waste
2013 data Largest MW
Biomass 2,530
Biogas 265
Geothermal 1,868
Solar 823
Wind 228
RE INSTALLED POWER CAPACITY – SOURCES2 (EXCLUDE HYDRO)
12
-
2,000
4,000
6,000
8,000
10,000
2007 2008 2009 2010 2011 2012 2013
MW
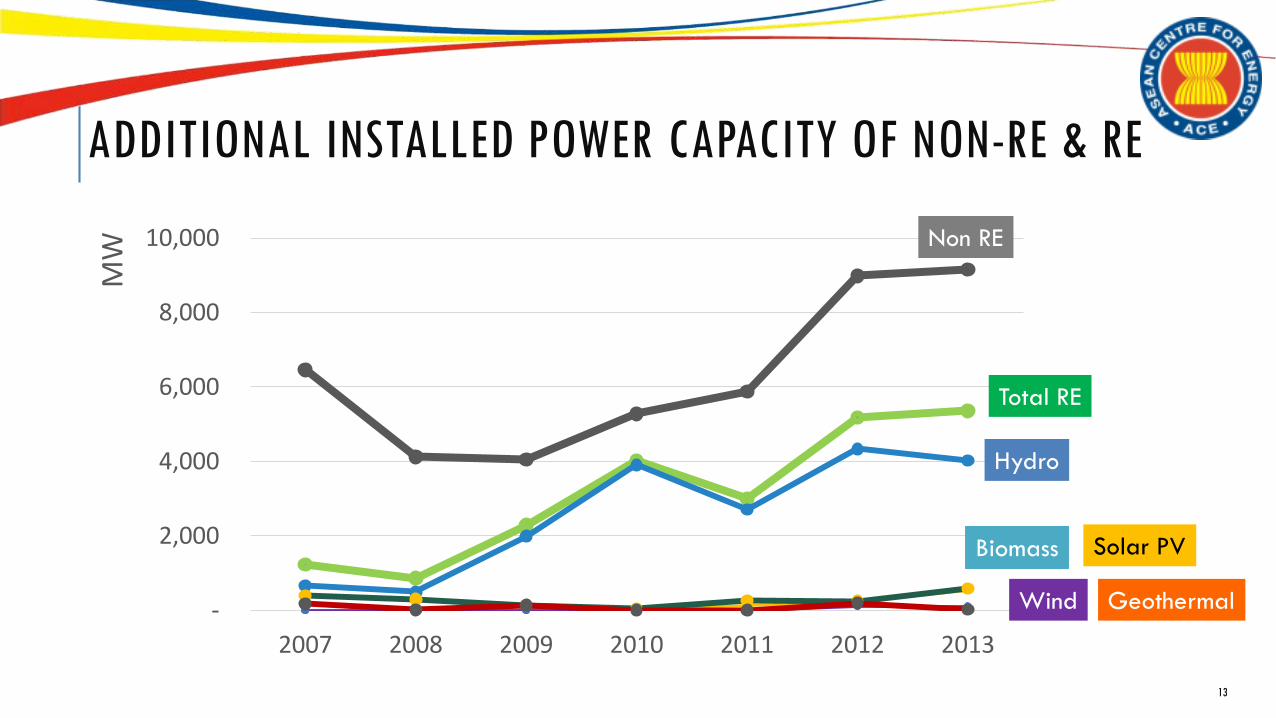
ADDITIONAL INSTALLED POWER CAPACITY OF NON-RE & RE
Non RE
Total RE
Hydro
Biomass Solar PV
Wind Geothermal
13
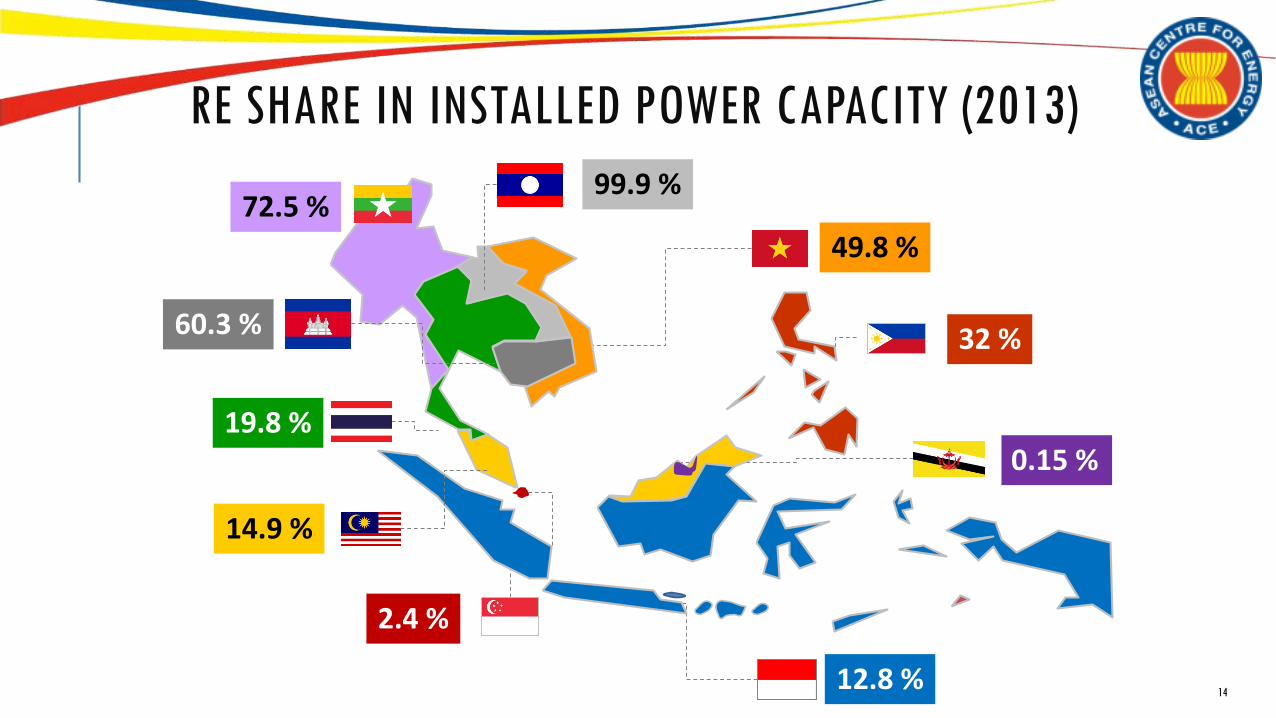
RE SHARE IN INSTALLED POWER CAPACITY (2013)
14
0.15 %
32 %
49.8 %
99.9 %72.5 %
60.3 %
19.8 %
14.9 %
2.4 %
12.8 %

CURRENT STATUS ON RE POLICIESCountry RE Target Feed in Tariff
RE Financing/
Incentives
Brunei 10% RE share in Power Generation by 2035 No No
Cambodia More than 2 GW of hydropower by 2020 No Yes
Indonesia 23% NRE share in total energy consumption in 2025 Yes Yes
Lao PDR 30% RE share of total energy consumptions by 2025 No Yes
Malaysia 34% RE share in installed capacity, 13% RE share in power generation in 2050
Yes Yes
Myanmar 15% - 20% RE share in installed capacity by 2030 No No
Philippines 15 GW installed capacity in 2030 Yes Yes
Singapore 350 MW installed capacity of solar by 2020 Net-settlement No
Thailand 25% AE share in total energy consumption by 2021 Yes Yes
Vietnam 6% RE share in power generation in 2030 Yes Yes15

FEED-IN-TARIFF FOR RE IN ASEAN
0
5
10
15
20
25
30
Cent
/kW
h
8.5
3 P
HP
6.6
3 P
HP
9.6
8 P
HP
5.9
0 P
HP
0.7 RM
0.24 RM
0.92 RM
0.27 RM
0.32 RM
4.5 THB
3.5 THB
0.3 THB
0.5 THB1.5 THB
0.8 THB
3.5 THB
3.5 THB
MSW
7.8 US
cent5.8 US
cent7.28
US cent
10.05
US cent
MSW
1,050 IDR
1,500 IDR
750 IDR
2.032 IDR
25 US cent
30 US cent
16
FiT for Solar
PV is being
reviewed
FiT for wind is
being
reviewed

4TH ASEAN ENERGY OUTLOOK (AEO4)
17

THE 4TH ASEAN ENERGY OUTLOOK (4AEO)
Controlled approachFraunhofer developed a regional model to countercheck and discuss findings
Cooperative ApproachNational ASEAN officials developed country projections and included knowledge on national policies and projections
Harmonized approachThe ASEAN Centre for Energy (ACE) and Fraunhofer guided country representatives in the development of national models
www.aseanenergy.org

4AEO SCENARIOS
Both scenarios based on AMS socio-economic and policy framework assumptions
Advancing Policies Scenario (APS)
Successful implementation of stronger policies as defined by the AMS’ official targets for renewable
energy and energy efficiency.
Business as Usual Scenario (BAU)
Continuation of past developments while taking into consideration
future changes in activities driving energy consumption

KEY FINDINGS: TPES
-
150
300
450
600
750
900
1,050
1,200
1,350
1,500
1,650
1,800
1990 1995 2000 2005 2010 2015 2020 2025 2030 2035 2040
Mto
e
Historical BAU APS
1,468 Mtoe
1,685 Mtoe
BAU ( CAGR)– 4.7 %
APS ( CAGR)– 4.0 %
BAU APSCoal 7.0% 5.3%Oil 2.7% 2.7%Natural gas 5.5% 3.3%Renewables 5.3% 7.4%
Year BAU APS2013 10.2% 10.2%2020 10.6% 15.4%2035 11.2% 20.0%
GAGR 2013 - 2035
RE % mix of TPES
TPES (2013~2035) increases by:
BAU - 272%
APS - 237%) Coal is expected to have the highest increase,
overshadowing oil with 33% share
Higher efficiency standards in the transformation sector, demand side management, and deployment of RE are the key factors in APS

KEY FINDINGS: POWER GENERATION - BAU VS APS
21
-
500
1,000
1,500
2,000
2,500
3,000
3,500
2013 2020 2025 2030 2035 2013 2020 2025 2030 2035
TWh
Coal Oil Natural gas Nuclear Hydro Geothermal Other Renewables
BAU APS
In 2035:
BAU of electricity generation reaches 2,883 TWh; while in APS reaches 2,473 TWh.
Both in BAU and APS, coal share is expected to significantly grow to 55% and 45% respectively.
Renewable Energy is predicted to reach 399 TWh in BAU; and 548 TWh in APS
RE Potential still mainly untapped. Gas/oil/coal reserves intensively deployed

KEY FINDINGS: INSTALLED POWER CAP. - BAU VS APS
22
-
100
200
300
400
500
600
700
2013 2015 2020 2025 2030 2035 2013 2015 2020 2025 2030 2035
GW
Coal Oil Natural Gas Nuclear Hydro Geothermal Other Renewables
In 2035:
Installed power cap. will reach around 607 GW in; while in APS reaches 588 GW.
Renewable Energy is predicted to reach 149 GW in BAU; and 156 GW in APS
BAU APS

CLOSER LOOK ON RE INSTALLED POWER CAPACITY
The share of biomass, wind and solar increases strongly in APS Hydro share to shrink and geothermal share stable
0
30
60
90
120
150
180
2013 2025BAU
2025APS
2035BAU
2035APS
GW
0%
20%
40%
60%
80%
100%
2013 2025BAU
2025APS
2035BAU
2035APS
Share of RE Technologies
Biomass
Hydro
Wind
Solar
Geothermal
RENEWABLE ENERGY FINANCING
24
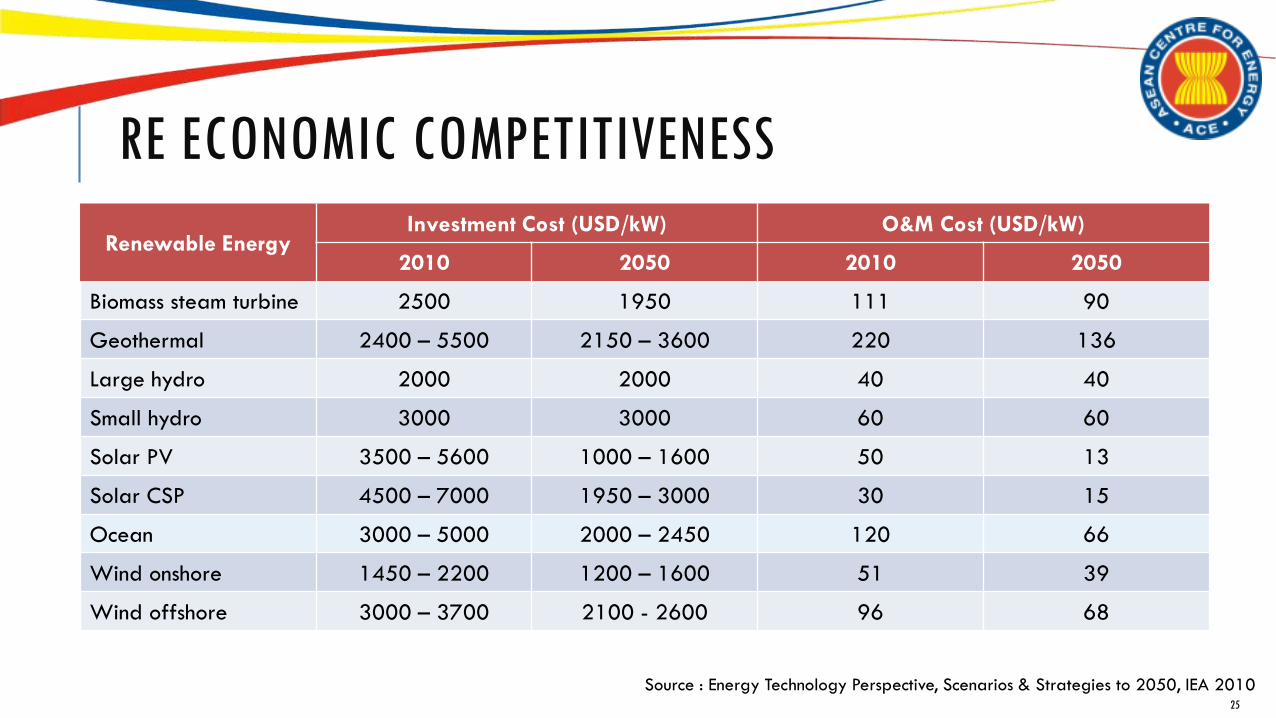
RE ECONOMIC COMPETITIVENESS
Renewable EnergyInvestment Cost (USD/kW) O&M Cost (USD/kW)
2010 2050 2010 2050
Biomass steam turbine 2500 1950 111 90
Geothermal 2400 – 5500 2150 – 3600 220 136
Large hydro 2000 2000 40 40
Small hydro 3000 3000 60 60
Solar PV 3500 – 5600 1000 – 1600 50 13
Solar CSP 4500 – 7000 1950 – 3000 30 15
Ocean 3000 – 5000 2000 – 2450 120 66
Wind onshore 1450 – 2200 1200 – 1600 51 39
Wind offshore 3000 – 3700 2100 - 2600 96 68
Source : Energy Technology Perspective, Scenarios & Strategies to 2050, IEA 201025

LCOE FOR RENEWABLE ENERGY
0
10
20
30
40
50
60
70
US C
ent
/kW
h
1
2
3
4
5
26
Source : 1. IRENA. Renewable Power Generation Costs. 20122. SI Ocean, Ocean Energy: Cost of Energy and Cost Reduction Opportunities, 20133. Doshi, et.al, The Economics of Solar PV in Singapore. 2013
4. GIZ-GDE/MOIT 2014. Summary of Studies on Supporting Mechanism for Grid-connected Bioenergy Power in Viet Nam. 2014
5. NREL and DOE 2013. Simple LCOE Calculator Documentation

LANDSCAPE FOR RE PROJECTS
Renewable Energy Project
Project Developer
Govern-mental
Institution
Local Community
Power Utilities
Financial Institutions
Security of energy supply
No negative impacts
Poverty alleviation
Job creationStable power networks
Economical viability, profitable
and sustainable

CHALLENGES IN RE DEPLOYMENT
b. Non Technical Issues• Complex and time-consuming procedures
• Difficult to get external financing
• Feasibility study is not bankable
• Lack of reference RE projects
• Reliable supply of the fuel (e.g. biomass or biogas power plant)
a. Technical Issues• Unavailable of data for preliminary assessment
• Have knowledge, but still lack of know-how in the project development
• Skill and reliability of technical consultant who develop the project
• Locating the grid connection point,
• Scale or size of the project does matter, etc
• Bad previous experiences with failed RE project / bad track record
• Necessary document cannot be provided in the early phase
• Power utility has a final decision (go-no go for RE project)
• Environmental issues, etc
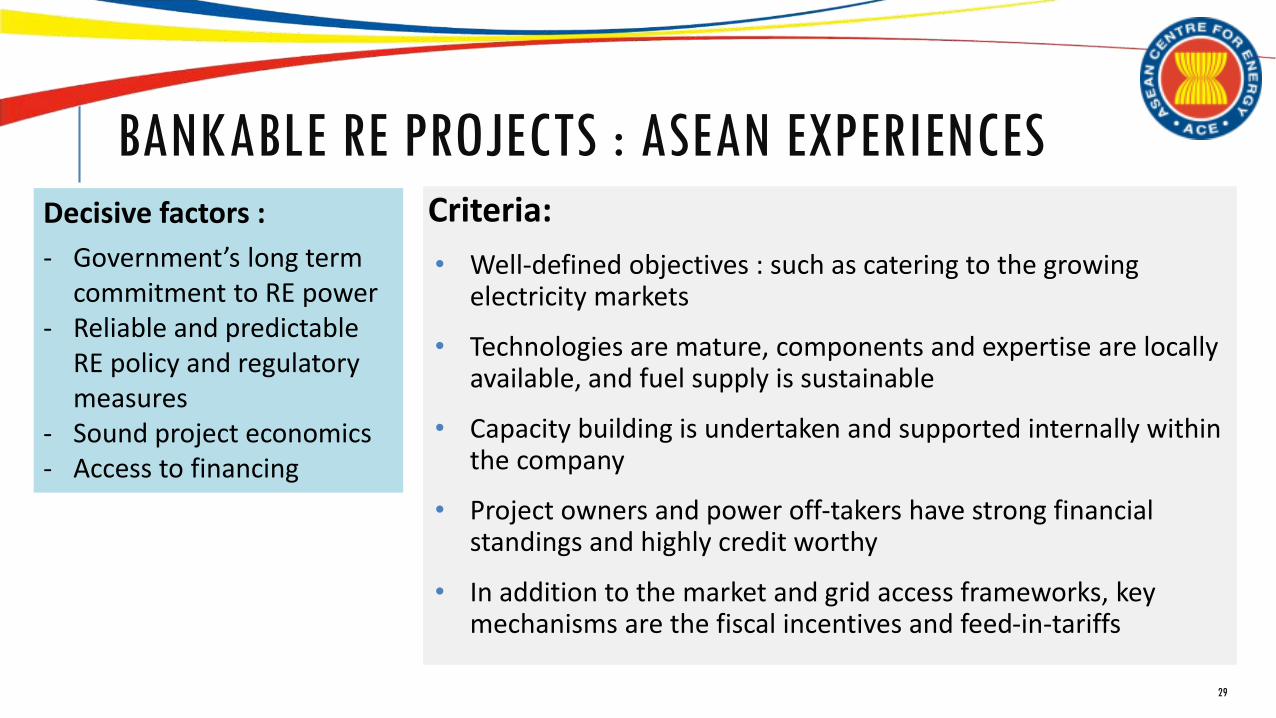
BANKABLE RE PROJECTS : ASEAN EXPERIENCES Criteria:
• Well-defined objectives : such as catering to the growing electricity markets
• Technologies are mature, components and expertise are locally available, and fuel supply is sustainable
• Capacity building is undertaken and supported internally within the company
• Project owners and power off-takers have strong financial standings and highly credit worthy
• In addition to the market and grid access frameworks, key mechanisms are the fiscal incentives and feed-in-tariffs
Decisive factors :
- Government’s long term commitment to RE power
- Reliable and predictable RE policy and regulatory measures
- Sound project economics- Access to financing
29

RENEWABLE ENERGY FINANCING IN ASEAN
ACE, under Renewable Energy Support Programme for ASEAN (RESP) has been conducting Renewable Energy Lending Guidelines for Bankers in ASEAN : Thailand, Philippines, Indonesia and Malaysia
The focus of the workshop:• Technology and Design: Key technologies and technology-related
risks, certification and guarantees-related risks, civil design risks, and electrical design risks;
• Plant Performance: Robust resource prediction, energy yield modelling considerations, uncertainty and probability scenarios, and plant operation risks;
• Contracts and Costs: PPA risks, construction contracting risks, operation contracting risks, construction and operation cost, etc.
30

RE PERMIT PROCEDURES
Key items discussed: Administrative procedures including requirements for project developers and/or investors, Legal and regulatory provisions and necessary permit, country specific challenges for project
development, information on how to obtain financial closure
Biomass and Biogas
Power Project
Development in Indonesia
Large Solar Photovoltaic
Project Development in
the Philippines
Small Solar Photovoltaic
Project Development in the
Philippines
31
Next Year:
Malaysia : Solar PV
&
Vietnam : Biomass
http://re-guidelines.info/

WAY FORWARD
32
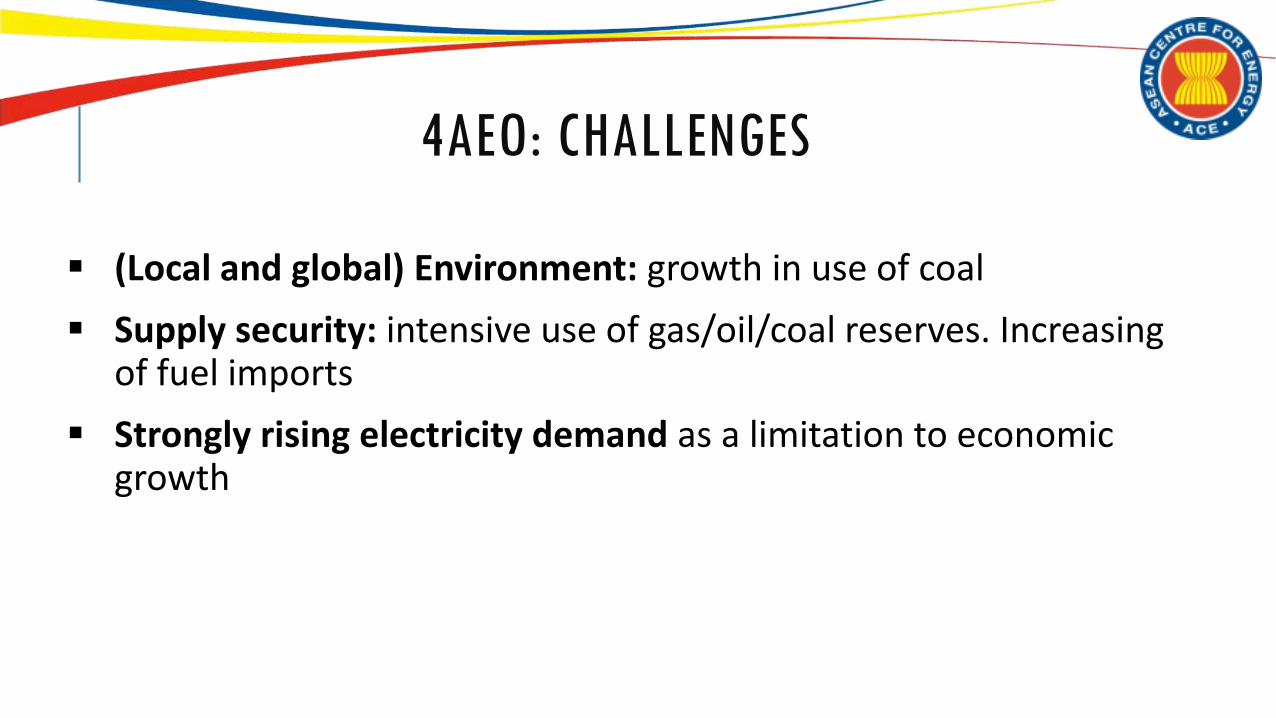
4AEO: CHALLENGES
(Local and global) Environment: growth in use of coal
Supply security: intensive use of gas/oil/coal reserves. Increasing of fuel imports
Strongly rising electricity demand as a limitation to economic growth
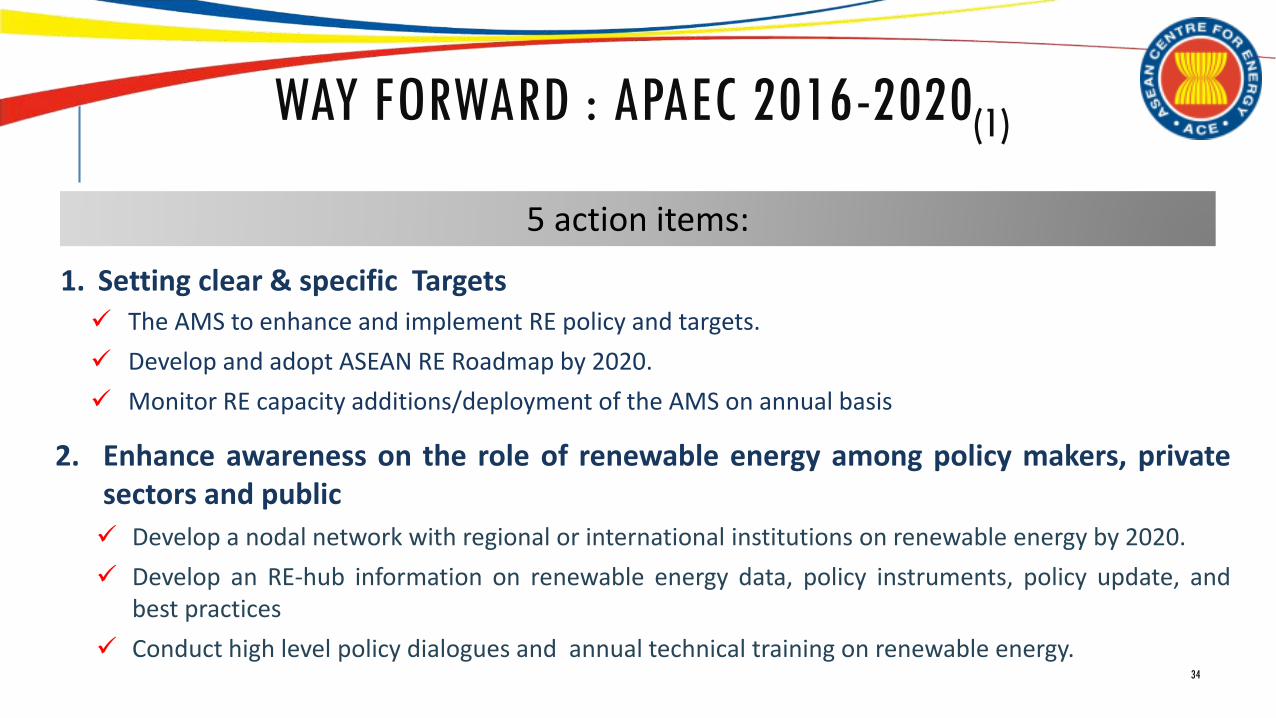
WAY FORWARD : APAEC 2016-2020(1)
34
5 action items:
1. Setting clear & specific Targets The AMS to enhance and implement RE policy and targets.
Develop and adopt ASEAN RE Roadmap by 2020.
Monitor RE capacity additions/deployment of the AMS on annual basis
2. Enhance awareness on the role of renewable energy among policy makers, privatesectors and public
Develop a nodal network with regional or international institutions on renewable energy by 2020.
Develop an RE-hub information on renewable energy data, policy instruments, policy update, andbest practices
Conduct high level policy dialogues and annual technical training on renewable energy.

3. Enhance R&D network on RE technology development and utilisation within the region.
Establish a nodal network with at least minimum two (2) research institutions or universities to promote cooperation,
technology development, sharing of research facilities and exchange and mobility of researchers on renewable by
2020.
4. Increase the promotion of renewable energy financing scheme
Establish a nodal network with at least two (2) national / regional / international financial institutions for
renewable energy financing.
Develop a guideline of RE Support Mechanism for Bankable Projects.
Conduct regular training on renewable energy financing.
5. Increase the commercial development and utilization of biofuels with a reference standard to facilitate deployment.
Develop a nodal network with automotive and related industries on technological know-how and R&D activities
for biofuel.
Conduct market studies to fully determine the commercial potential of bioenergy.35
WAY FORWARD : APAEC 2016-2020(2)