Remote Sensing of Agriculture - USDA · Remote Sensing of Agriculture NASS’ Cropland Data Layer...
35
Remote Sensing of Agriculture NASS’ Cropland Data Layer Program Claire Boryan [email protected] USDA/NASS
Transcript of Remote Sensing of Agriculture - USDA · Remote Sensing of Agriculture NASS’ Cropland Data Layer...

Remote Sensing of Agriculture
NASS’ Cropland Data Layer Program
Claire Boryan
USDA/NASS

NASS Overview Provider of timely, accurate, and useful statistics in service to U.S. agriculture

Research and Development Division Geospatial Information Branch
Spatial Analysis Research

Remote Sensing Acreage Estimation Program
Objectives
“Census by Satellite” Without area duplication
Major corn and soybean regions
Provide timely, accurate, useful independent
estimates Measurable error
County and state level
Public domain crop specific crop classification
http://nassgeodata.gmu.edu/CropScape
NRCS Geospatial Data Gateway
http://www.nass.usda.gov/research/Cropland/SARS1a.htm
Google CropScape!

What is the Cropland Data Layer (CDL)? The Cropland Data Layer product is a raster-formatted, geo-referenced, crop
specific, land cover map.
Released Jan. 31, 2012 National 30m Product

Satellite Imagery – Landsat
2006 NLCD & Derivative products Farm Service Agency: Common Land Unit
2011 Cropland Data Layer Inputs Satellite Imagery – Deimos & UK2

Landsat Imagery
1997-2012
Landsat 5 launched 1984 (3 yr design life!)
– Thematic Mapper (TM) Sensor
Landsat 7 launched 1999 Thematic Mapper (ETM+)
Sensor

The Landsat Data Gap
Source: USGS, Landsat Project: http://landsat.usgs.gov/slc_enhancements/slc_off_level1_standard.php
Landsat 7 ETM+ Landsat 5 TM

Deimos and UK2 Micro Satellites (22-metre, multi-spectral DMC imager
600km imaging swath)

Sensor Specifications Compared
TM Deimos/UK2
Launch Date 1984 2009
Altitude 705 km 686 km
Temporal Resolution 16 days 4 days
Spatial Resolution 30 x 30 m (reflective)
120 x 120 m (thermal)
22 x 22 m (reflective)
Radiometric Resolution 8 bit (256) 10 bit (1024)
Spectral Resolution 6 (B, G, R, NIR, SWIR,
MIR) + Thermal IR
3 (G, R, NIR)
Swath wide 185 km 600 km

Image Timing
http://www.nass.usda.gov/Charts_and_Maps/Crop_Progress_&_Condition/2010

April
May
June
July
August with farm
data
Final
CDL

Cropland Data Layer Program
Components
Satellite Imagery : Landsat TM, Deimos and UK2 data
Ground truth: FSA/CLU + 578 & NLCD
Ancillary data sets
Commercial Software Suite
See5 Decision Tree Methodology
Estimation
CropScape

Ground Truth – Land Cover Agriculture Ground Truth
Provided by Farm Service Agency
Identifies known fields and crops
Divide known fields into 2 sets
70% used for training software
30% used for validating results
Non-Agriculture Ground Truth
USGS National Land Cover
Dataset
Identifies urban infrastructure and
non-agriculture land cover
Forest, grass, water, cities

Cropland Data Layer Program
Components
Satellite Imagery: Landsat TM and Deimos and UK2
data
Ground truth: FSA/CLU + 578 & NLCD
Ancillary data
Commercial Software Suite
See5 Decision Tree Methodology
Estimation
CropScape

Ancillary Data – USGS/NASA Products
Elevation Imperviousness Forest Canopy
NASA MODIS Terra
(16-day NDVI composite)

Cropland Data Layer Program
Components
Satellite Imagery: Landsat TM , Deimos and UK2 data
Ground truth: FSA/CLU + 578 & NLCD
Ancillary data sets
Commercial Software Suite
See5 Decision Tree Methodology
Estimation
CropScape

Commercial Software Suite
Imagery Preparation Leica Geosystems ERDAS Imagine
Image classification Decision tree software
See5.0 www.rulequest.com
Ground Truth Preparation ESRI ArcGIS
Acreage Estimation SAS/IML workshop

See5 Decision Tree Classifier
State-of-the-art technique for image
classification
– Relatively cheap ($750)
Incorporates a powerful ensemble
method known as “boosting”
The “NLCD Mapping Tool” was
integrated into ERDAS Imagine
• Provided gratis by USGS

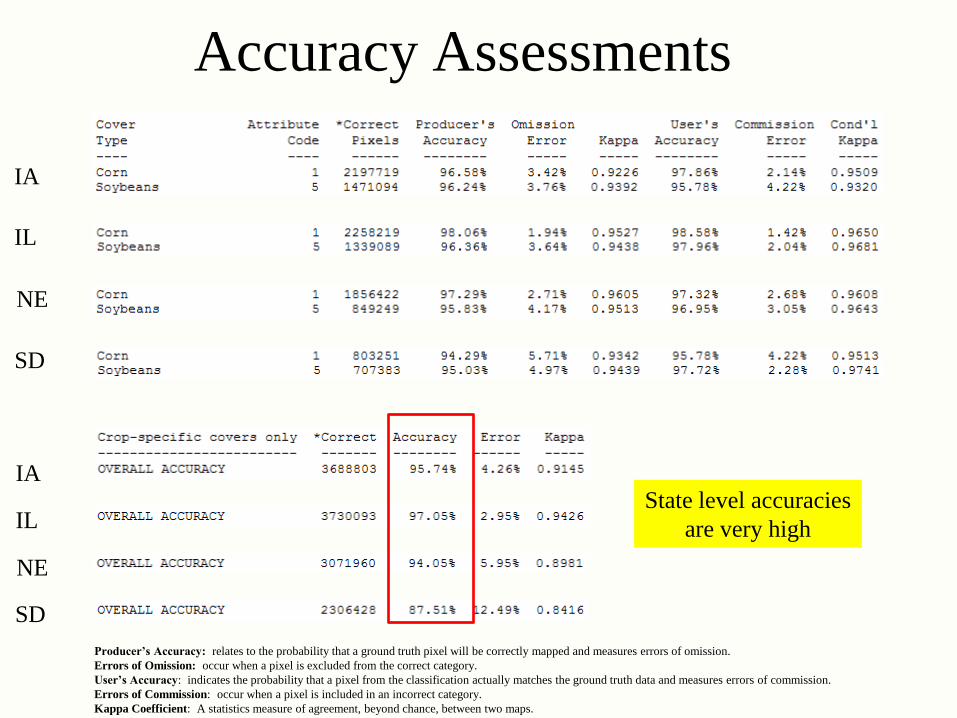
Accuracy Assessments
IA
NE
IL
Producer’s Accuracy: relates to the probability that a ground truth pixel will be correctly mapped and measures errors of omission.
Errors of Omission: occur when a pixel is excluded from the correct category.
User’s Accuracy: indicates the probability that a pixel from the classification actually matches the ground truth data and measures errors of commission.
Errors of Commission: occur when a pixel is included in an incorrect category.
Kappa Coefficient: A statistics measure of agreement, beyond chance, between two maps.
SD
IA
NE
IL
SD
Accuracy Assessments
State level accuracies
are very high

Cropland Data Layer Program
Components
Satellite Imagery: Landsat TM, Deimos and UK2 data
Ground truth: FSA/CLU + 578 & NLCD
Ancillary data sets
Commercial Software Suite
See5 Decision Tree Methodology
Estimation
CropScape

Regression-based Acreage Estimator
Regression used to relate
categorized pixel counts to the ground reference data
– (X) – Cropland Data Layer (CDL)
classified acres
– (Y) – June Agricultural Survey (JAS) reported acres
Using both CDL and JAS acreage results in estimates with reduced error rates over JAS alone
Outlier segment detection - removal from regression analysis
Acreage not just about
counting pixels

Crop Production Report
CDL all crops
Crop Production Report
CDL all crops
Crop Acreage Report
CDL winter wheat
Historical:
Crop Production Annual Summary
CDL all crops/county estimates
Small Grains Annual Summary
CDL small grains
CDL Production Schedule

Research
Education
Agribusiness Land Cover Modeling
Mapping
Land Use
Crop Rotation
Pesticides
Water Use Soil and Water
Watersheds
Carbon
Crop Protection Disaster Assessment
Epidemiology
Crop Production
Yield
Fertilizer
Transportation
Ethanol
Irrigation Climate
Fertilizer Usage
Biofuel
Erosion
Data Mining
Environmental Risk
Planning
Commodity
CRP
Forest
Change Detection
Crop Intensity
Ecosystem
Land Management
Ecology
Pest Control
Soil Utilization
Acreage Estimates
Biodiesel
Water Quality
Urban Growth
Wildlife Habitat
Condition Assessment
NASS Cropland Data Layer Applications

CropScape Portal
nassgeodata.gmu.edu/CropScape
Upcoming Release:
2008 & 2011 national coverage
Future portal upgrade:
Map Printing
Change detection
Cultivated masks/crop intensity

CropScape
• CropScape web portal
• A web service based interactive map visualization,
dissemination and querying system for U.S. cropland – No burden on users
• No client software development & installation
• No special software tools needed
– Equitable cropland information access, automatic and timely
delivery, geospatial navigation, retrieval, queries and
dissemination
• Collaboration with George Mason University/ Center
for Spatial Information Science and Systems

CropScape Cont.
• State of the art CDL visualization, querying
and dissemination tool
• Interactive geospatial statistical analysis tools
– Online/interactive analytics, charting and mapping
– Geospatial information access, navigation
– CDL map and statistical result retrieval and
dissemination web services
• Open geospatial standards compliant
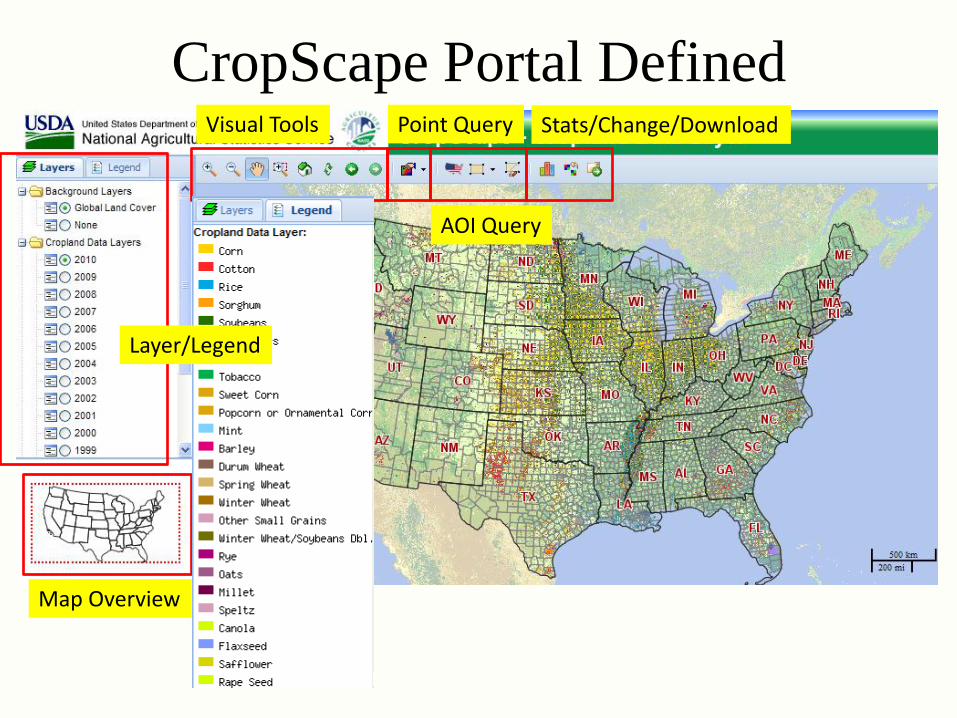
Visual Tools Point Query
AOI Query
Stats/Change/Download
Map Overview
Layer/Legend
CropScape Portal Defined

Select Area of Interest
www.nassgeodata.gmu/CropScape
State County
ASD

CropScape Change Analysis
nassgeodata.gmu/CropScape

CropScape Download & Export
Specify Years and Projection
Preview and Download
nassgeodata.gmu/CropScape

CropScape w/ Google Earth
nassgeodata.gmu/CropScape

CDL Distribution
http://nassgeodata.gmu.edu/CropScape
http://datagateway.nrcs.usda.gov
http://www.nass.usda.gov/Research_and_Science