Remote sensing and GIS tools for soil salinity assessments...
41
Remote sensing and GIS tools for soil salinity assessments in Uzbekistan Alim Pulatov Tashkent Institute of Irrigation and Melioration, EcoGIS center
Transcript of Remote sensing and GIS tools for soil salinity assessments...
Remote sensing and GIS tools for soil salinity assessments in Uzbekistan
Alim Pulatov Tashkent Institute of Irrigation and Melioration, EcoGIS center
Contents
Introduction
Problem description
Study in Syrdarya
Experience in Djizak Province
Research in Khorezm Province
Summary

Introduction
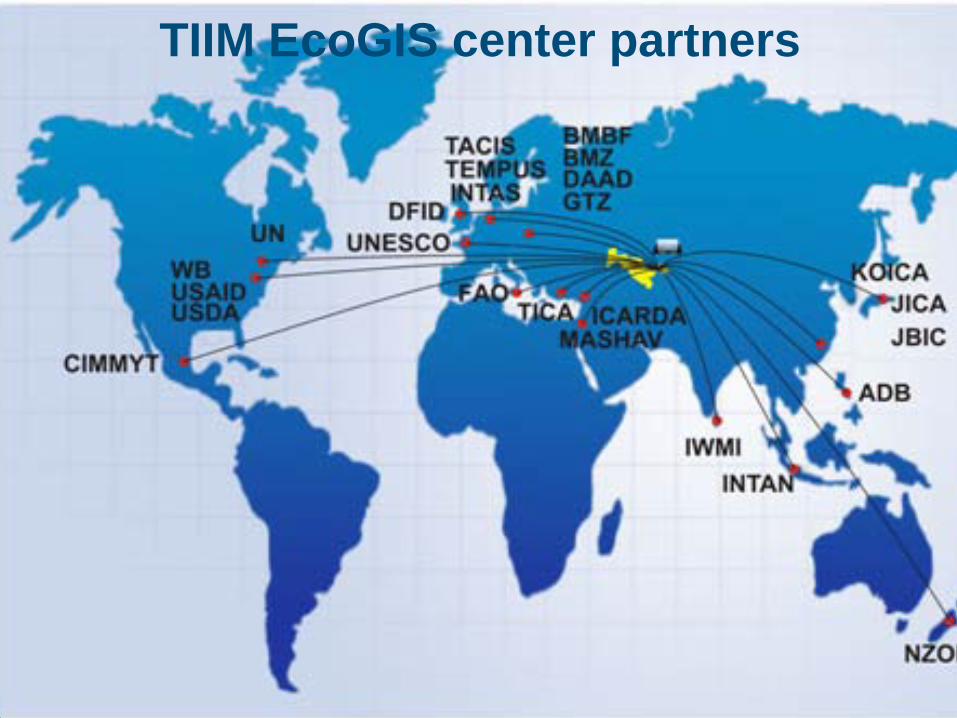
TIIM EcoGIS center partners
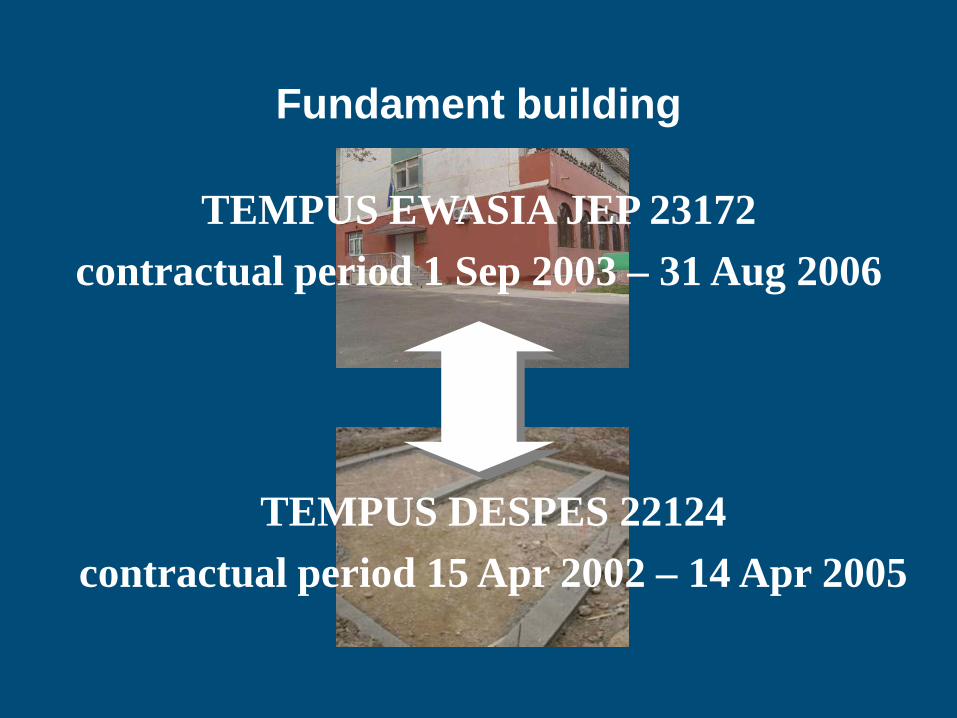
TEMPUS EWASIA JEP 23172contractual period 1 Sep 2003 – 31 Aug 2006
TEMPUS DESPES 22124contractual period 15 Apr 2002 – 14 Apr 2005
Fundament building
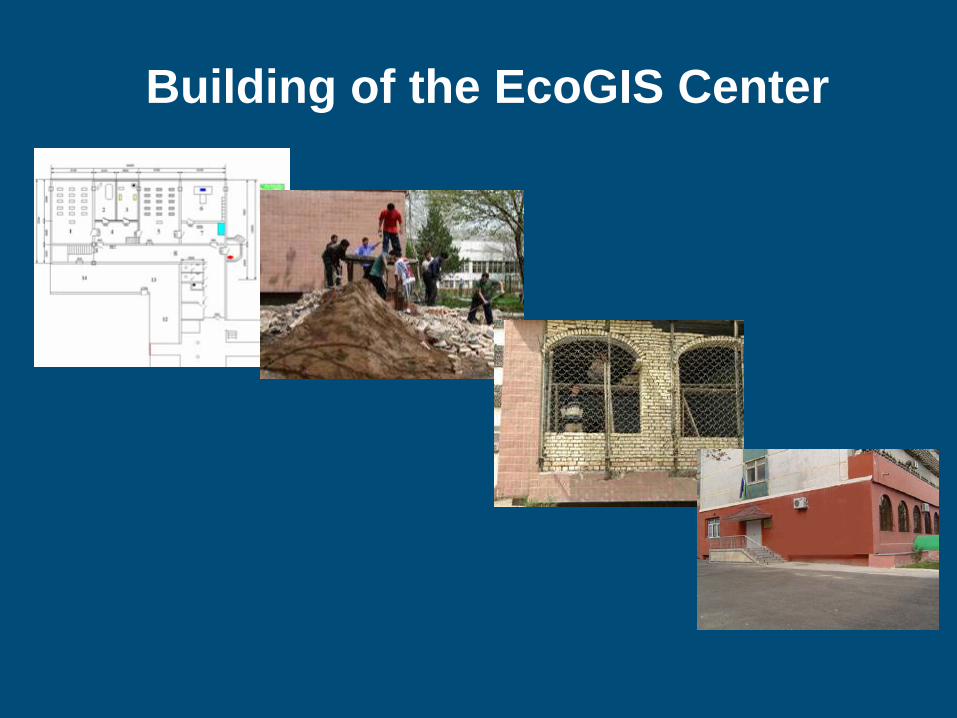
Building of the EcoGIS Center
Local construction companies were employed for building the center. Also, bachelor and master students showed great enthusiasm in any way possible to speed up the construction works.
The scheme of the new center was developed and starting from March till end of May 2003, old classes were redesigned and repaired.
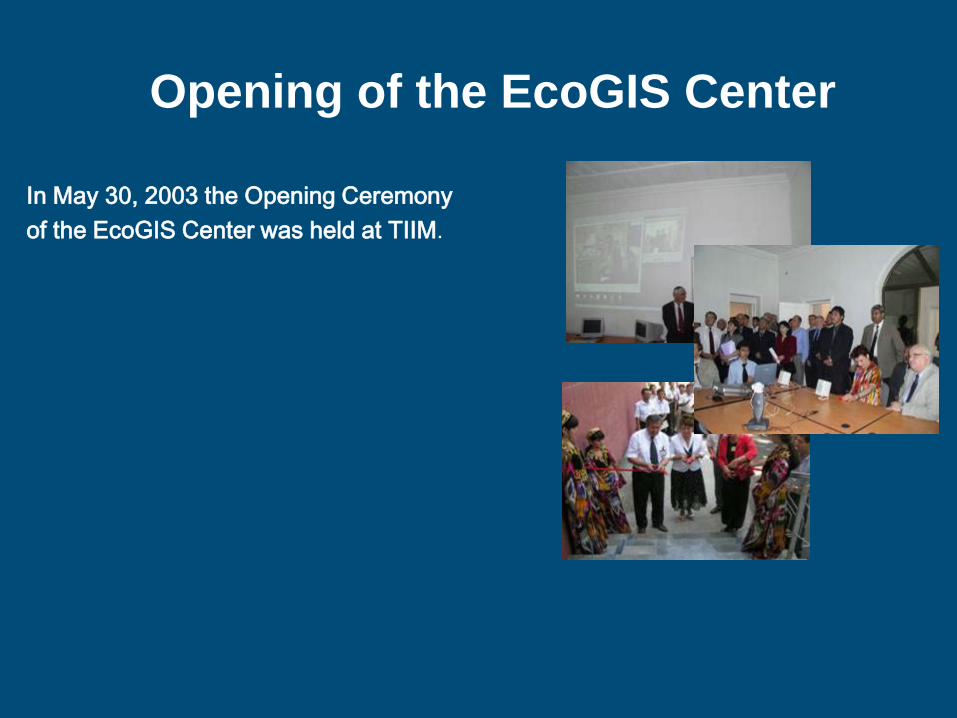
In May 30, 2003 the Opening Ceremony of the EcoGIS Center was held at TIIM.
The Minister of Higher Education of Uzbekistan and government officials from the Ministry of Agriculture and Water Resources Management of Uzbekistan, TACIS, NRMP (USAID), professors and representatives from WUR (The Netherlands), BOKU (Austria), WAU (Poland), TUHH (Germany), Rectors of three Uzbek Agrarian Universities and Moscow State Environmental Engineering University
Main participants:
Opening of the EcoGIS Center
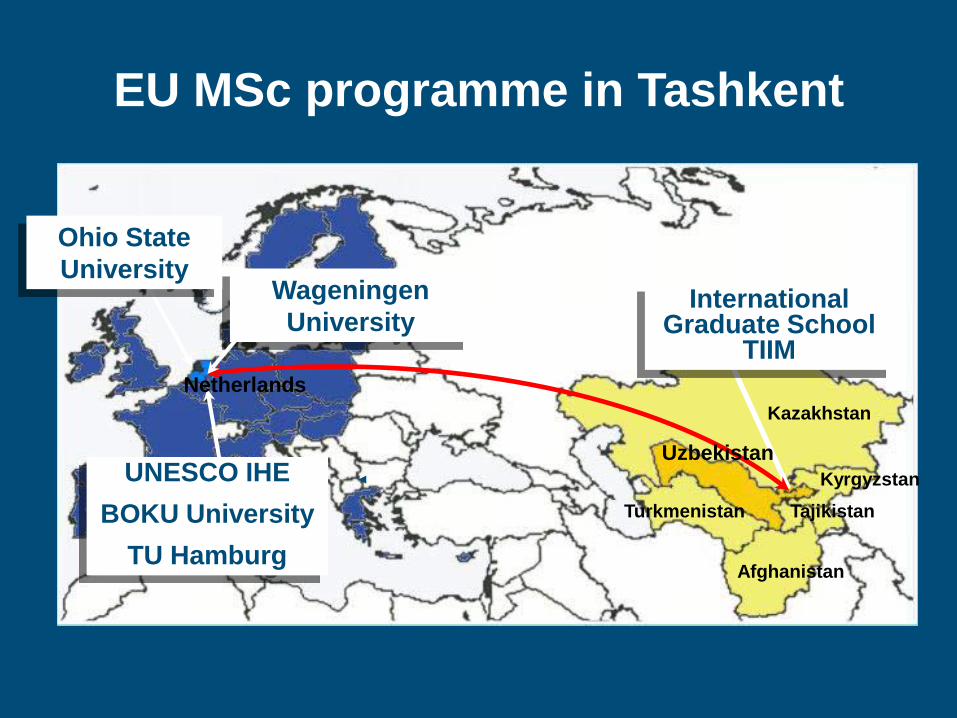
EU MSc programme in Tashkent
Wageningen University
International Graduate School
TIIM
Turkmenistan
Uzbekistan
Afghanistan
KyrgyzstanTajikistan
KazakhstanNetherlands
UNESCO IHE BOKU University
TU Hamburg
Ohio State University

Master Students of the project 2004-2006
Research areas of EcoGIS center in RS and GIS
Soil salinity assessment by RS and GIS tools Crop yield forecasting Forestry inventory Land use and cover estimation Soil erosion study Ground water quality and quantity mapping and
modeling Soil quality Statistical methods for land survey
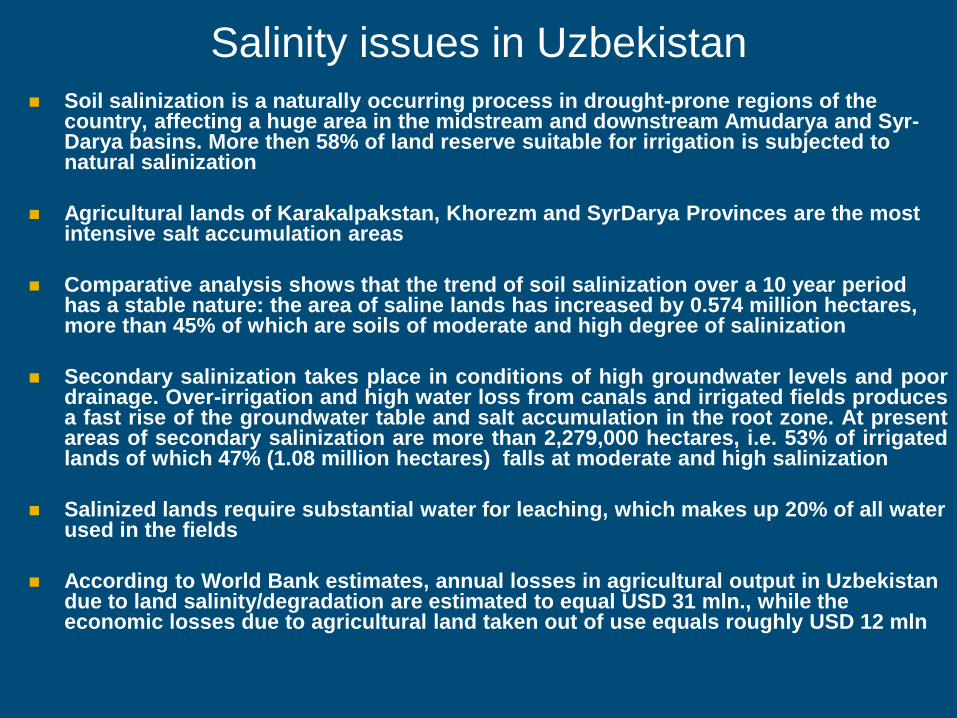
Soil salinization is a naturally occurring process in drought-prone regions of the country, affecting a huge area in the midstream and downstream Amudarya and Syr-Darya basins. More then 58% of land reserve suitable for irrigation is subjected to natural salinization
Agricultural lands of Karakalpakstan, Khorezm and SyrDarya Provinces are the most intensive salt accumulation areas
Comparative analysis shows that the trend of soil salinization over a 10 year period has a stable nature: the area of saline lands has increased by 0.574 million hectares, more than 45% of which are soils of moderate and high degree of salinization
Secondary salinization takes place in conditions of high groundwater levels and poordrainage. Over-irrigation and high water loss from canals and irrigated fields producesa fast rise of the groundwater table and salt accumulation in the root zone. At presentareas of secondary salinization are more than 2,279,000 hectares, i.e. 53% of irrigatedlands of which 47% (1.08 million hectares) falls at moderate and high salinization
Salinized lands require substantial water for leaching, which makes up 20% of all water used in the fields
According to World Bank estimates, annual losses in agricultural output in Uzbekistan due to land salinity/degradation are estimated to equal USD 31 mln., while the economic losses due to agricultural land taken out of use equals roughly USD 12 mln
Salinity issues in Uzbekistan
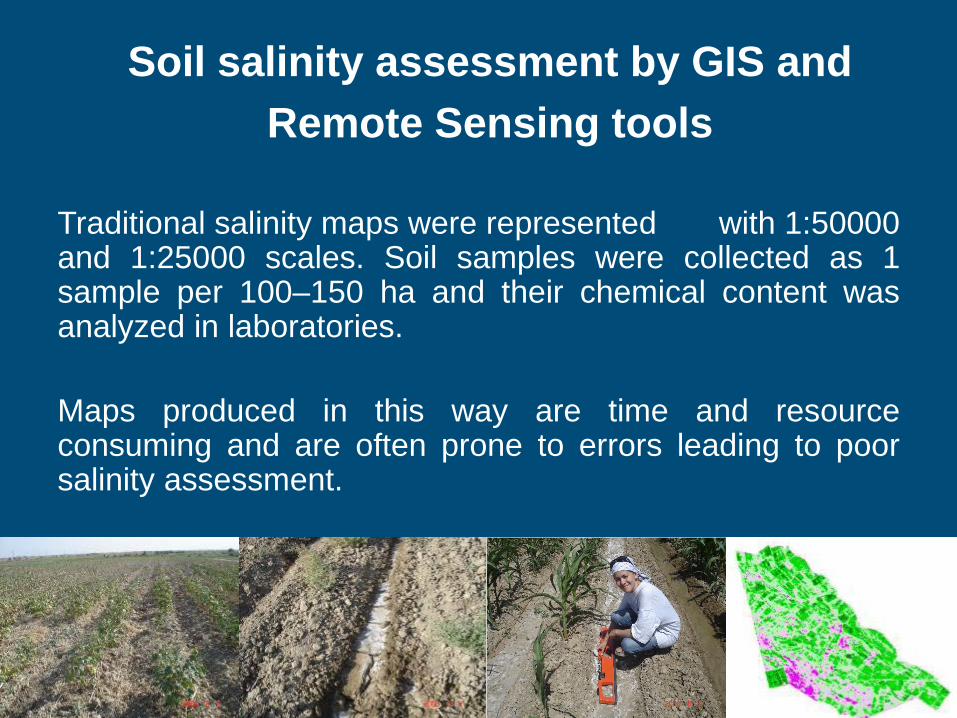
Soil salinity assessment by GIS and Remote Sensing tools
Traditional salinity maps were represented with 1:50000and 1:25000 scales. Soil samples were collected as 1sample per 100–150 ha and their chemical content wasanalyzed in laboratories.
Maps produced in this way are time and resourceconsuming and are often prone to errors leading to poorsalinity assessment.
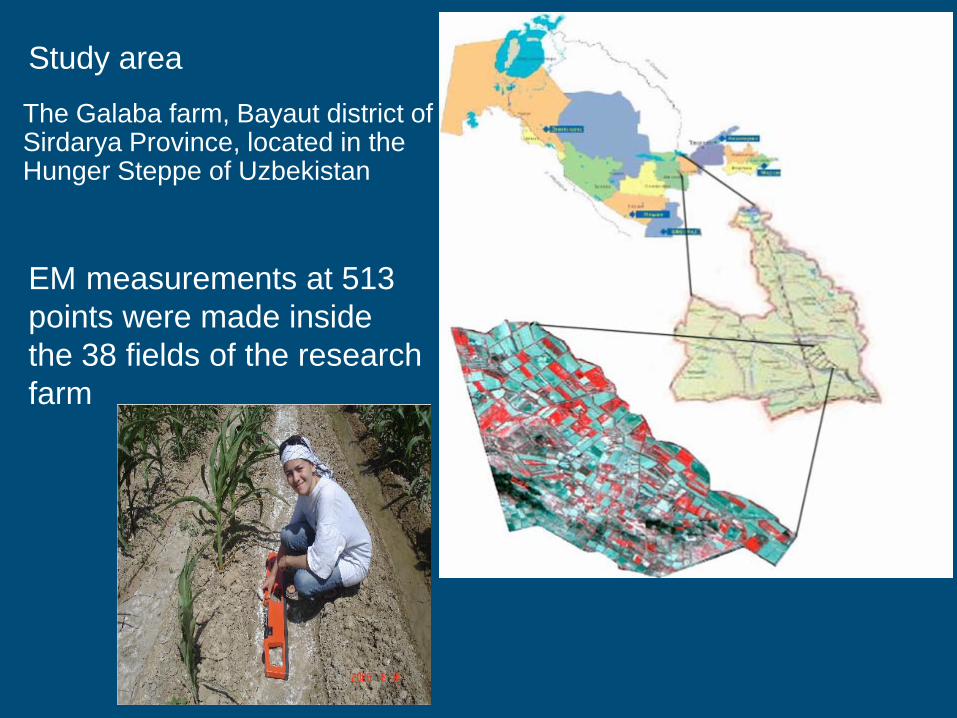
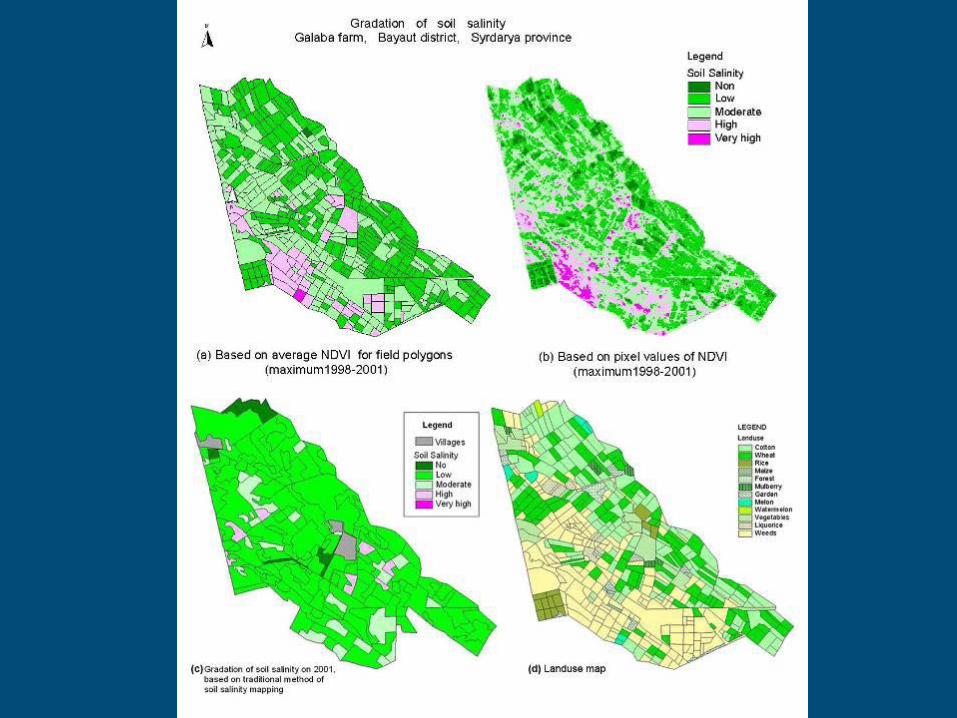
Study area
The Galaba farm, Bayaut district of Sirdarya Province, located in the Hunger Steppe of Uzbekistan
EM measurements at 513 points were made inside the 38 fields of the research farm
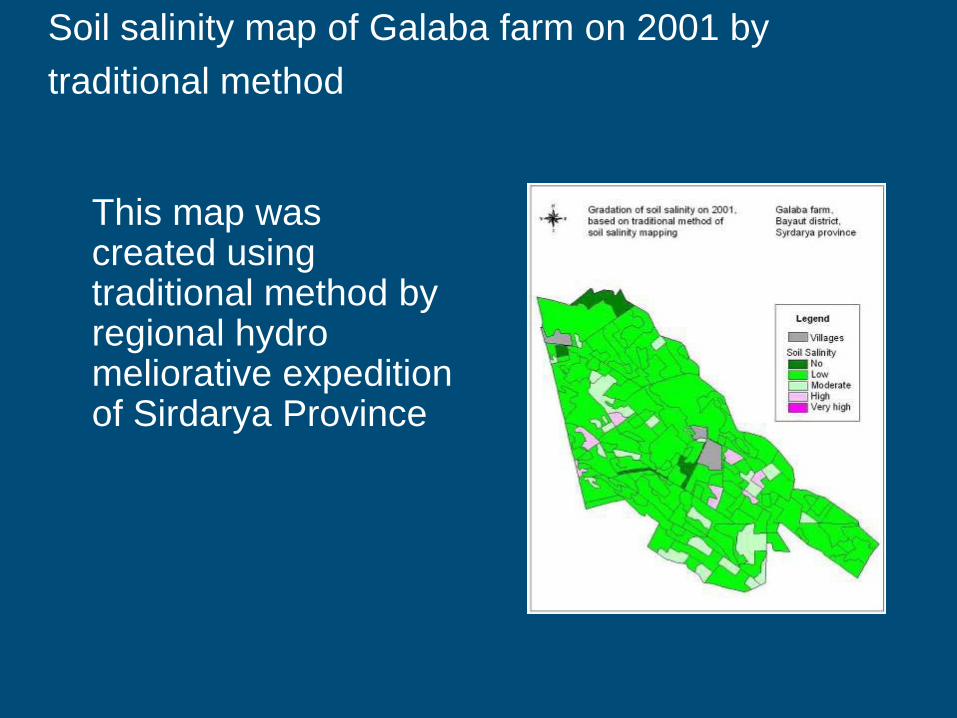
Soil salinity map of Galaba farm on 2001 by traditional method
This map was created using traditional method by regional hydro meliorative expedition of Sirdarya Province
Method
Multi-temporal analysis of satellite images (Landsat)
Selected of Vegetation Index (VI) for reflects vegetation condition
Ground truth data collection Mapping salinity through selected VI
Relationships between Vegetation Indices and soil salinity
Two approaches were applied to asses soil salinity based on the VI analysis and their response to soil salinity:
Pixel based approach Field based approach
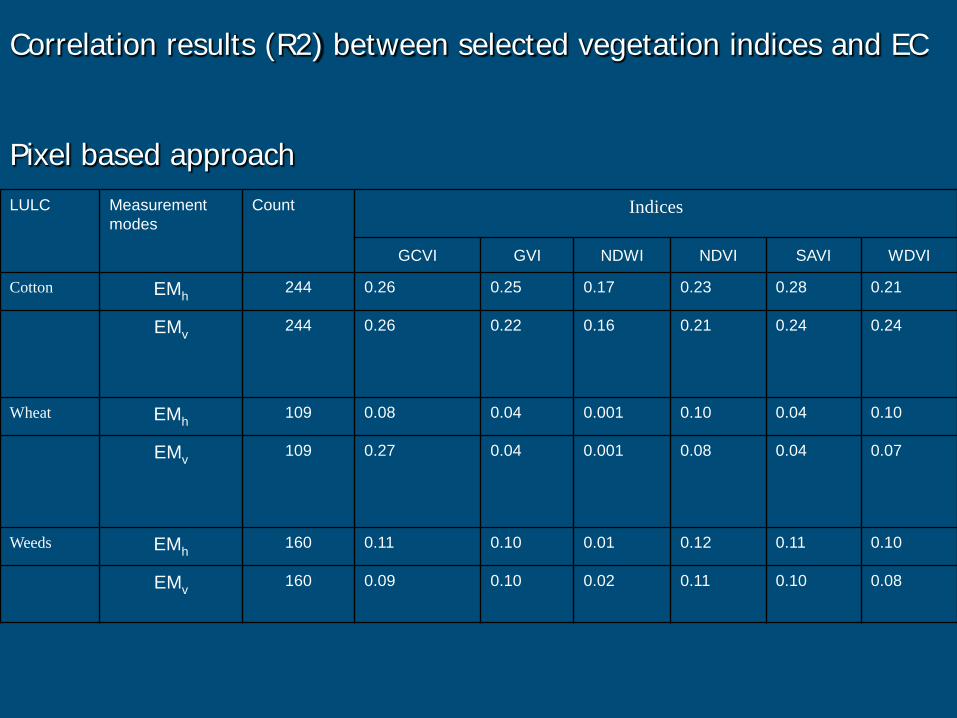
LULC Measurement modes
Count Indices
GCVI GVI NDWI NDVI SAVI WDVI
Cotton EMh 244 0.26 0.25 0.17 0.23 0.28 0.21
EMv 244 0.26 0.22 0.16 0.21 0.24 0.24
Wheat EMh 109 0.08 0.04 0.001 0.10 0.04 0.10
EMv 109 0.27 0.04 0.001 0.08 0.04 0.07
Weeds EMh 160 0.11 0.10 0.01 0.12 0.11 0.10
EMv 160 0.09 0.10 0.02 0.11 0.10 0.08
Correlation results (R2) between selected vegetation indices and EC
Pixel based approach
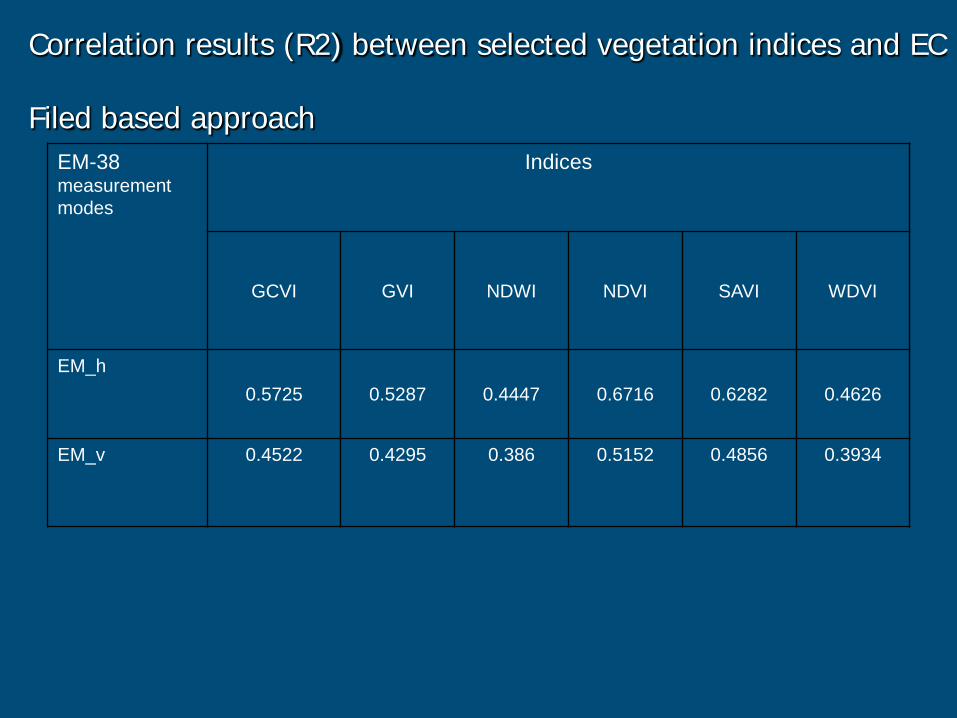
EM-38 measurement modes
Indices
GCVI GVI NDWI NDVI SAVI WDVI
EM_h 0.5725 0.5287 0.4447 0.6716 0.6282 0.4626
EM_v 0.4522 0.4295 0.386 0.5152 0.4856 0.3934
Correlation results (R2) between selected vegetation indices and EC
Correlation results (R2) between selected vegetation indices and EC
Filed based approach

Conclusion
Method can be useful for farmers, decision makers and local authorities to provide leaching at proper field and to collect soil sample
Can give spatial extent of soil salinity over large areas
Based on the results of the study, it can be concluded that vegetation indices can be used as an indicator of soil salinity in the study area
Integrated use of remotely sensed satellite data, readily available spatial data and GIS tools is useful and efficient in assessment and mapping of soil salinity
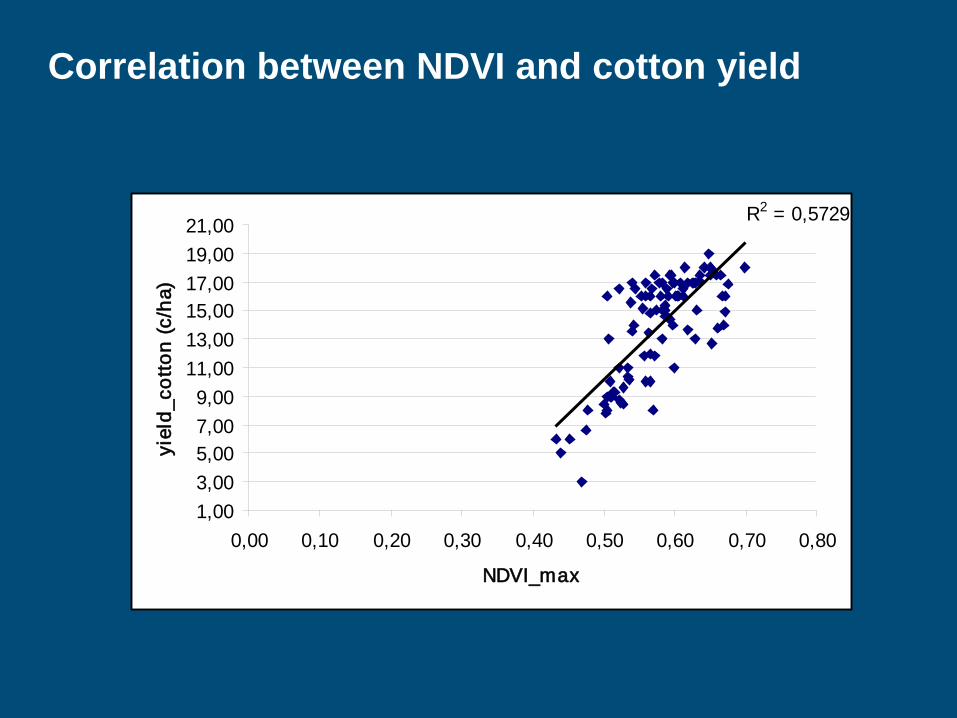
Correlation between NDVI and cotton yield
R2 = 0,5729
1,003,005,007,009,00
11,0013,0015,0017,0019,0021,00
0,00 0,10 0,20 0,30 0,40 0,50 0,60 0,70 0,80
NDVI_max
yiel
d_co
tton
(c/h
a)
Linear correlation of cotton yield and NDVI (all averaged for per field)
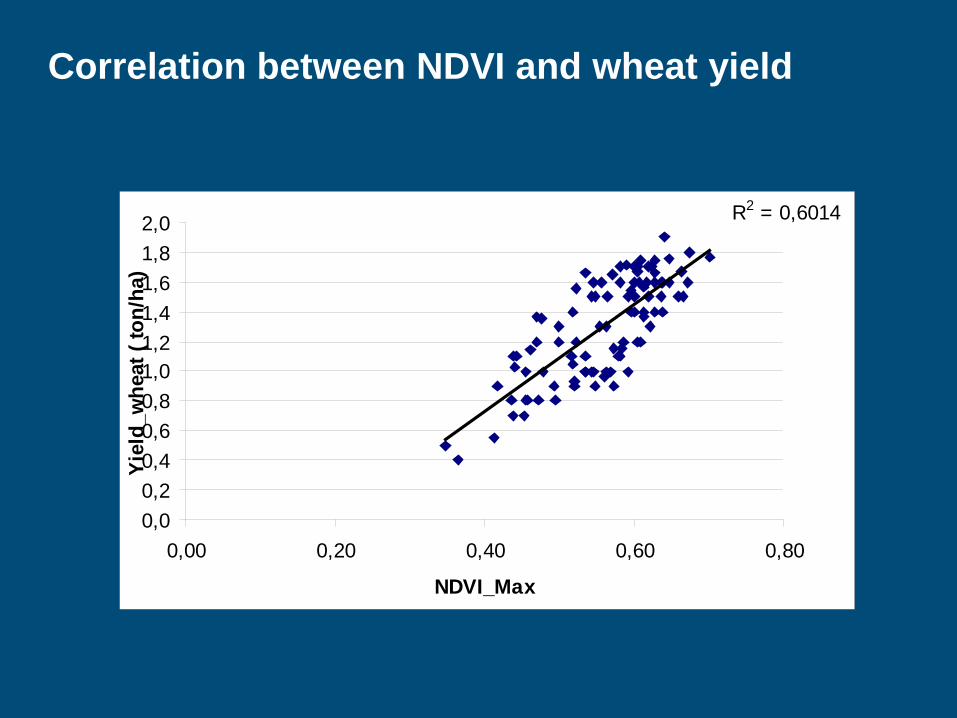
Correlation between NDVI and wheat yield
R2 = 0,6014
0,00,20,40,60,81,01,21,41,61,82,0
0,00 0,20 0,40 0,60 0,80
NDVI_Max
Yiel
d_w
heat
( to
n/ha
)
Linear correlation of wheat yield and NDVI (all averaged for per field)
Spectral reflectance as tool by study of soil salinity in semi-arid areas in Uzbekistan
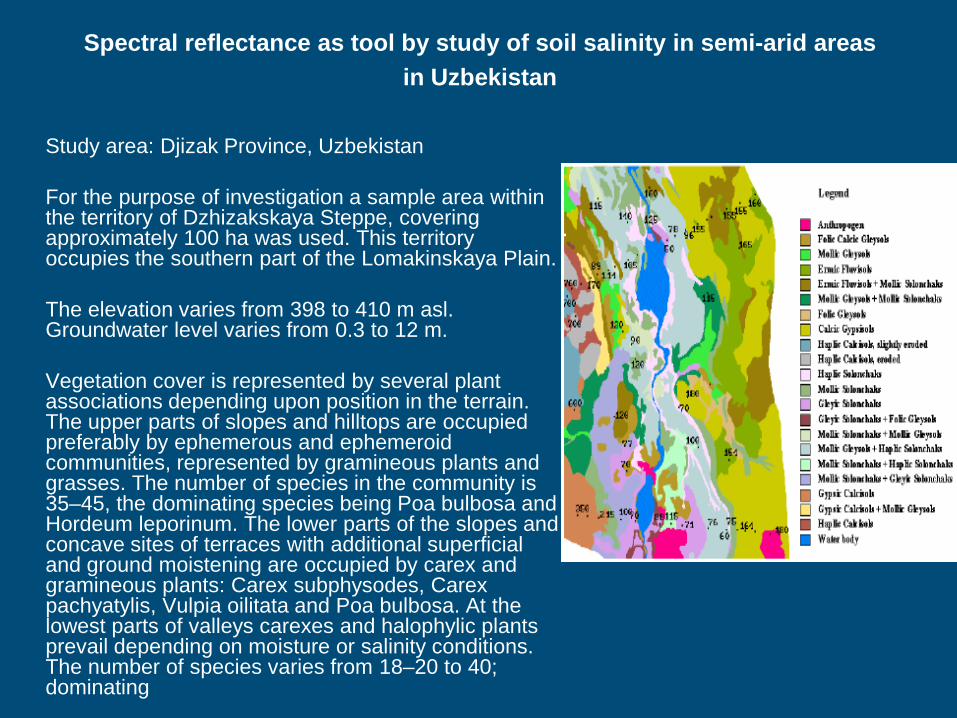
Study area: Djizak Province, Uzbekistan
For the purpose of investigation a sample area within the territory of Dzhizakskaya Steppe, covering approximately 100 ha was used. This territory occupies the southern part of the Lomakinskaya Plain.
The elevation varies from 398 to 410 m asl. Groundwater level varies from 0.3 to 12 m.
Vegetation cover is represented by several plant associations depending upon position in the terrain. The upper parts of slopes and hilltops are occupied preferably by ephemerous and ephemeroid communities, represented by gramineous plants and grasses. The number of species in the community is 35–45, the dominating species being Poa bulbosa and Hordeum leporinum. The lower parts of the slopes and concave sites of terraces with additional superficial and ground moistening are occupied by carex and gramineous plants: Carex subphysodes, Carex pachyatylis, Vulpia oilitata and Poa bulbosa. At the lowest parts of valleys carexes and halophylic plants prevail depending on moisture or salinity conditions. The number of species varies from 18–20 to 40; dominating
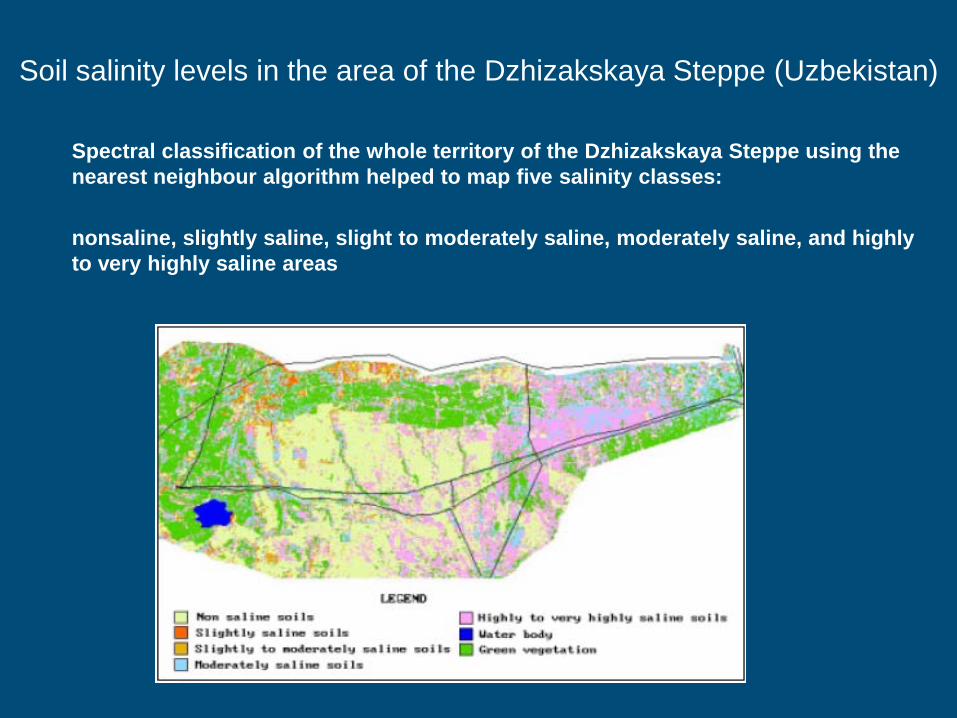
Soil salinity levels in the area of the Dzhizakskaya Steppe (Uzbekistan)
Spectral classification of the whole territory of the Dzhizakskaya Steppe using the nearest neighbour algorithm helped to map five salinity classes:
nonsaline, slightly saline, slight to moderately saline, moderately saline, and highly to very highly saline areas
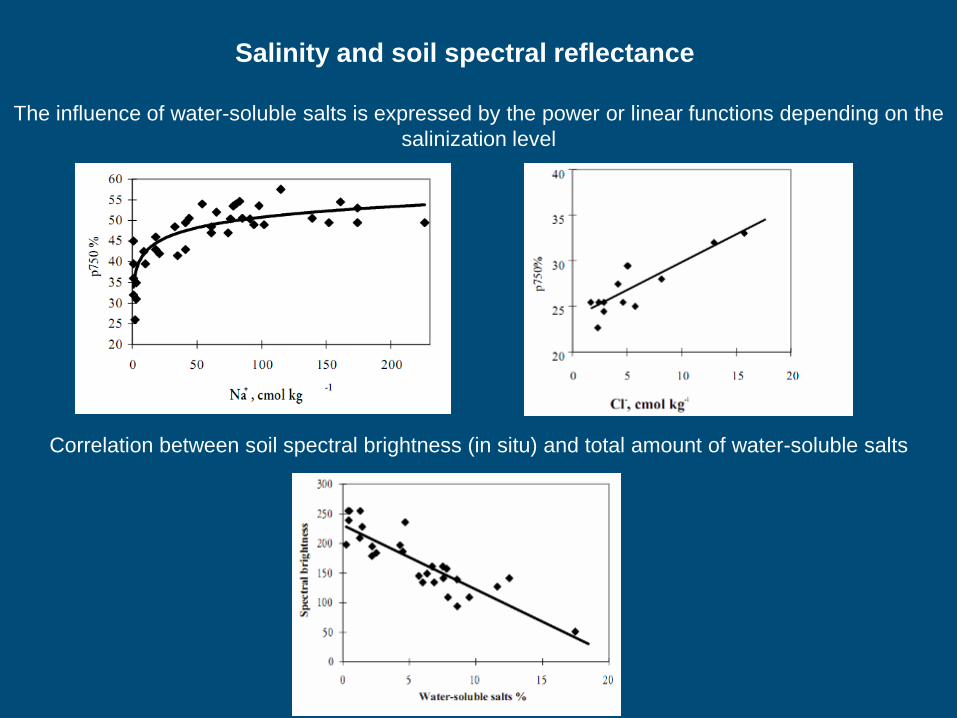
Salinity and soil spectral reflectance
The influence of water-soluble salts is expressed by the power or linear functions depending on the salinization level
Correlation between soil spectral brightness (in situ) and total amount of water-soluble salts
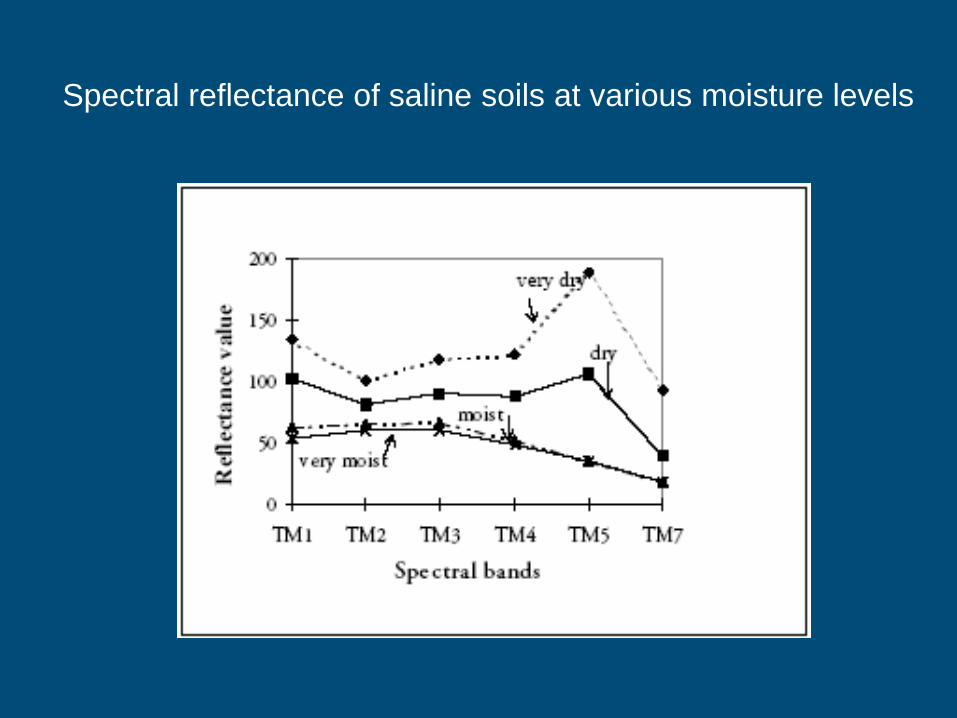
Spectral reflectance of saline soils at various moisture levels
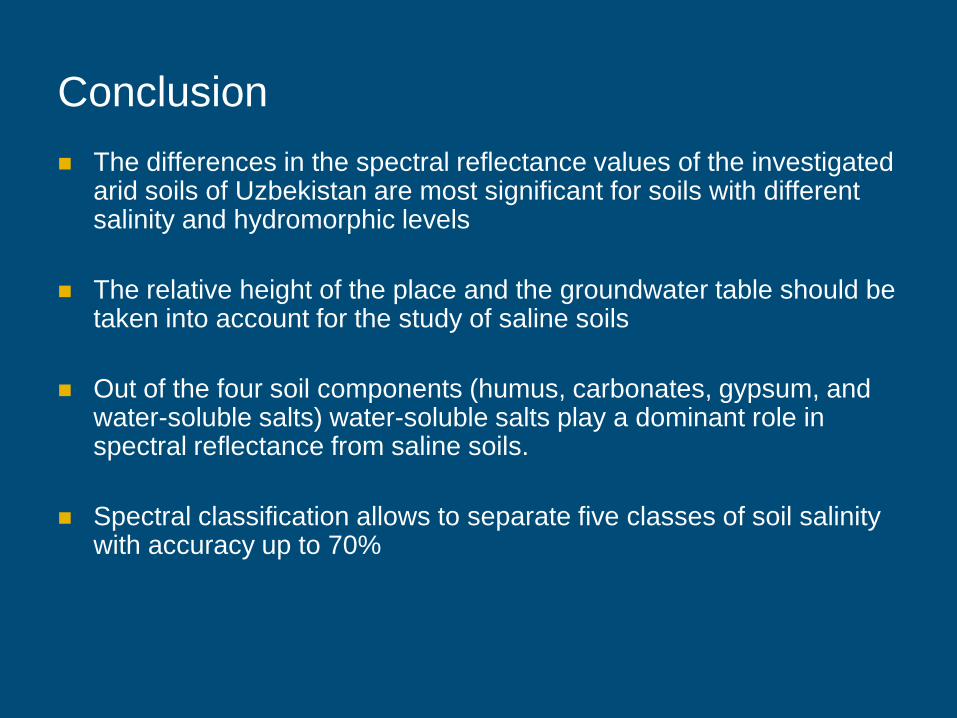
Conclusion The differences in the spectral reflectance values of the investigated
arid soils of Uzbekistan are most significant for soils with different salinity and hydromorphic levels
The relative height of the place and the groundwater table should be taken into account for the study of saline soils
Out of the four soil components (humus, carbonates, gypsum, and water-soluble salts) water-soluble salts play a dominant role in spectral reflectance from saline soils.
Spectral classification allows to separate five classes of soil salinity with accuracy up to 70%
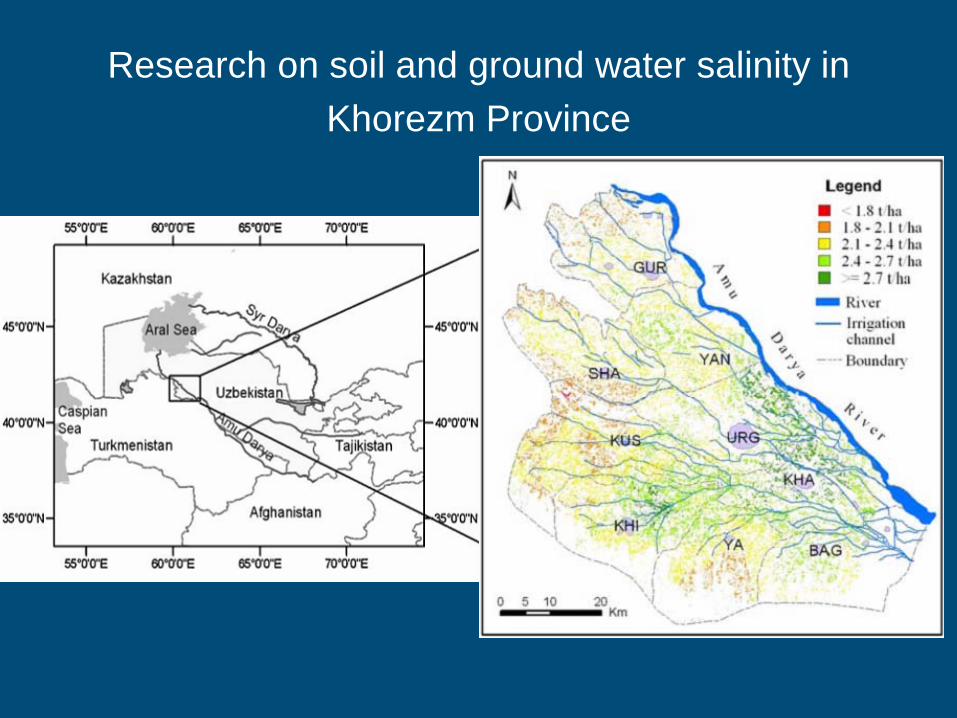
Research on soil and ground water salinity in Khorezm Province
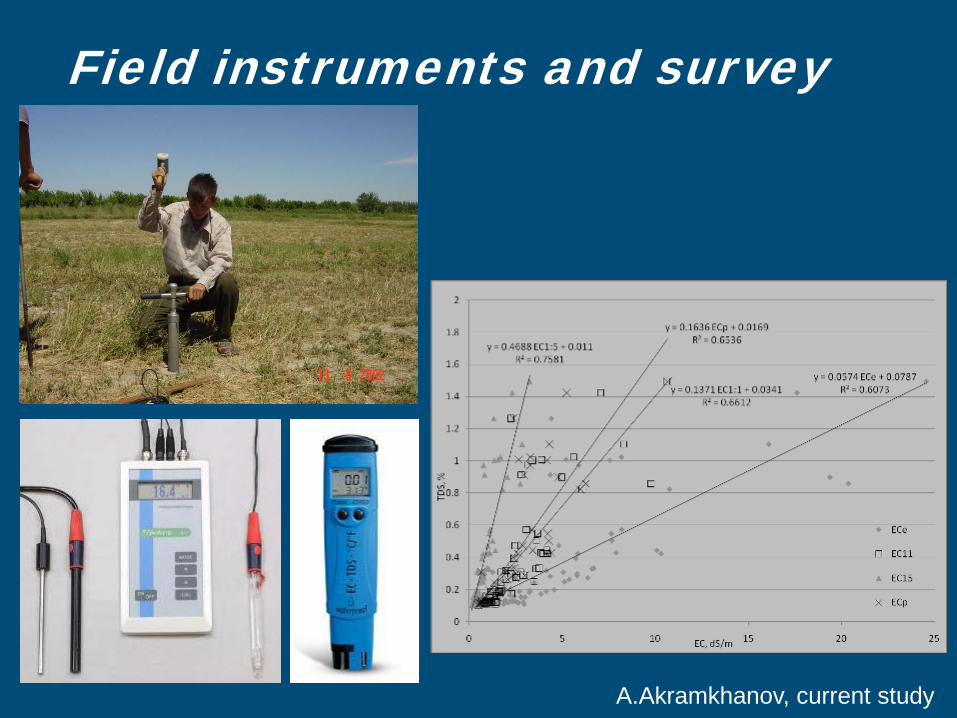
Field instruments and survey
A.Akramkhanov, current study

Field survey
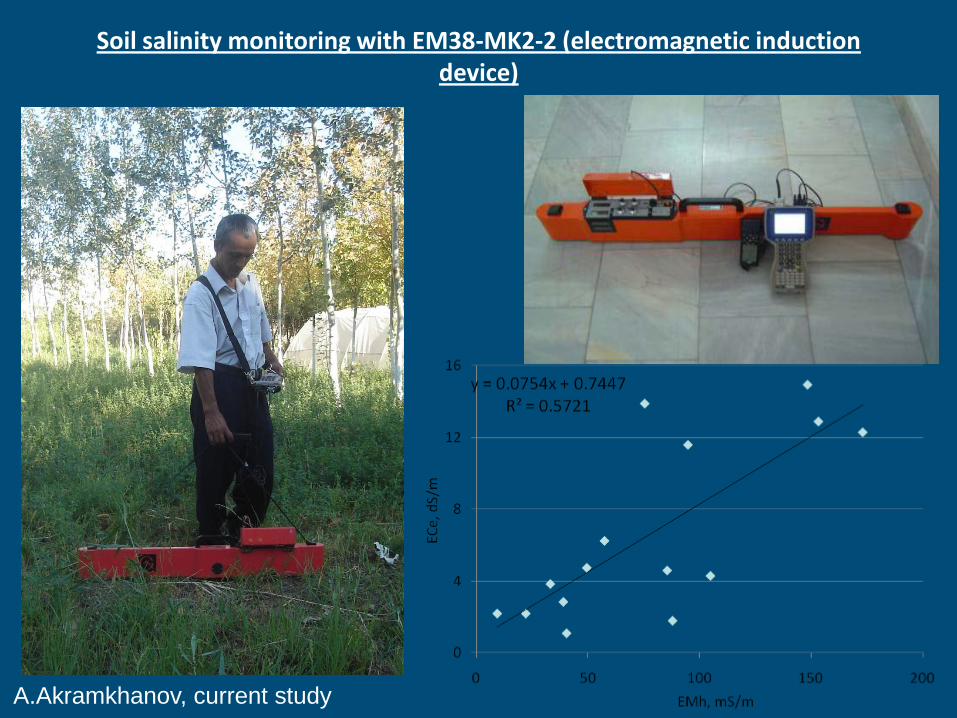
Soil salinity monitoring with EM38-MK2-2 (electromagnetic induction device)
A.Akramkhanov, current study
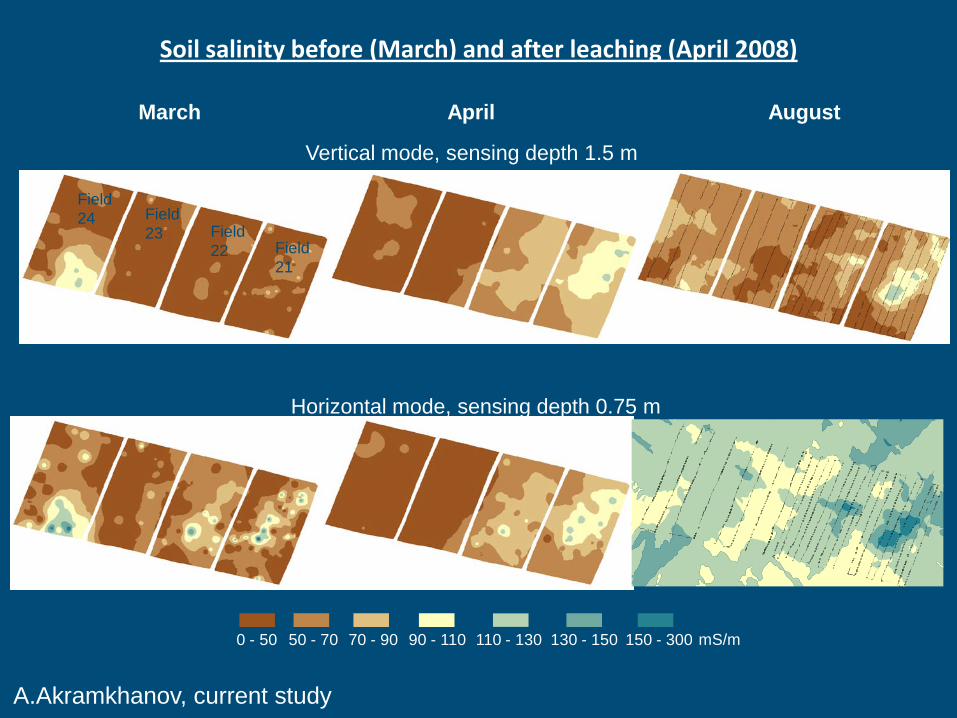
Soil salinity before (March) and after leaching (April 2008)
Vertical mode, sensing depth 1.5 m
Horizontal mode, sensing depth 0.75 m
0 - 50 50 - 70 70 - 90 90 - 110 110 - 130 130 - 150 150 - 300 mS/m
March April
Field 21
Field 22
Field 23
Field 24
August
A.Akramkhanov, current study
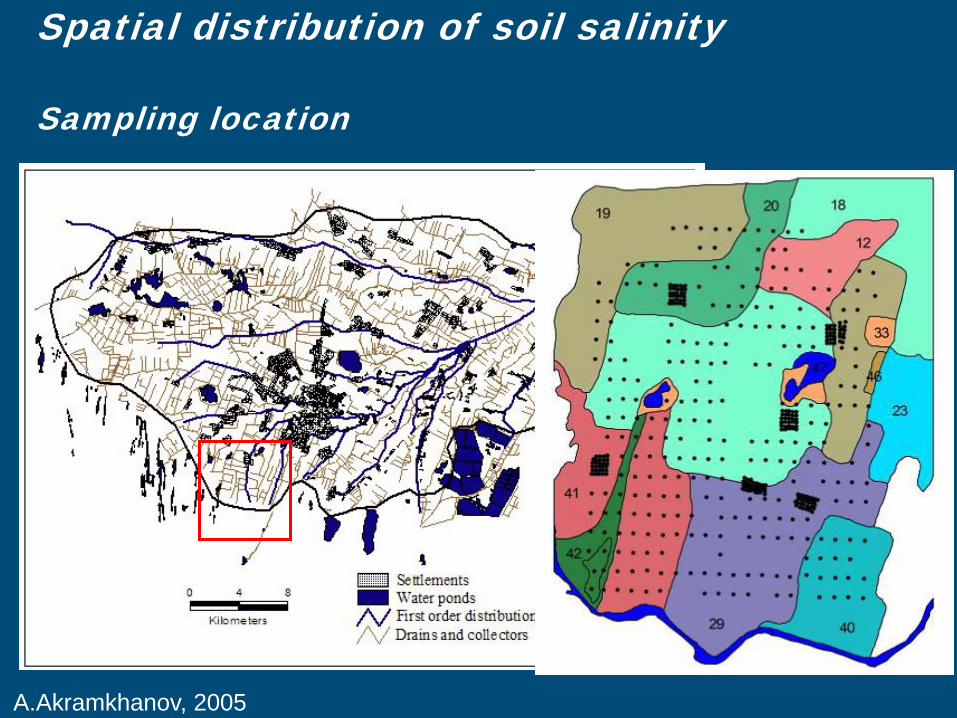
Sampling location
A.Akramkhanov, 2005
Spatial distribution of soil salinity

ResultsSpatial distribution of soil salinity
A.Akramkhanov, 2005
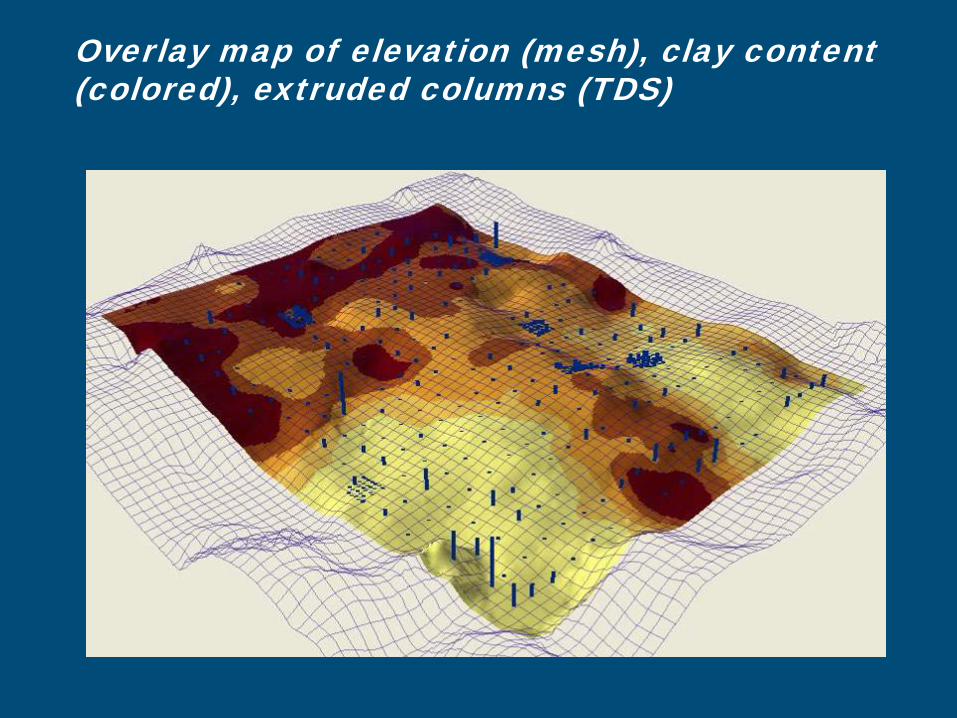
Overlay map of elevation (mesh), clay content (colored), extruded columns (TDS)
A.Akramkhanov, 2005
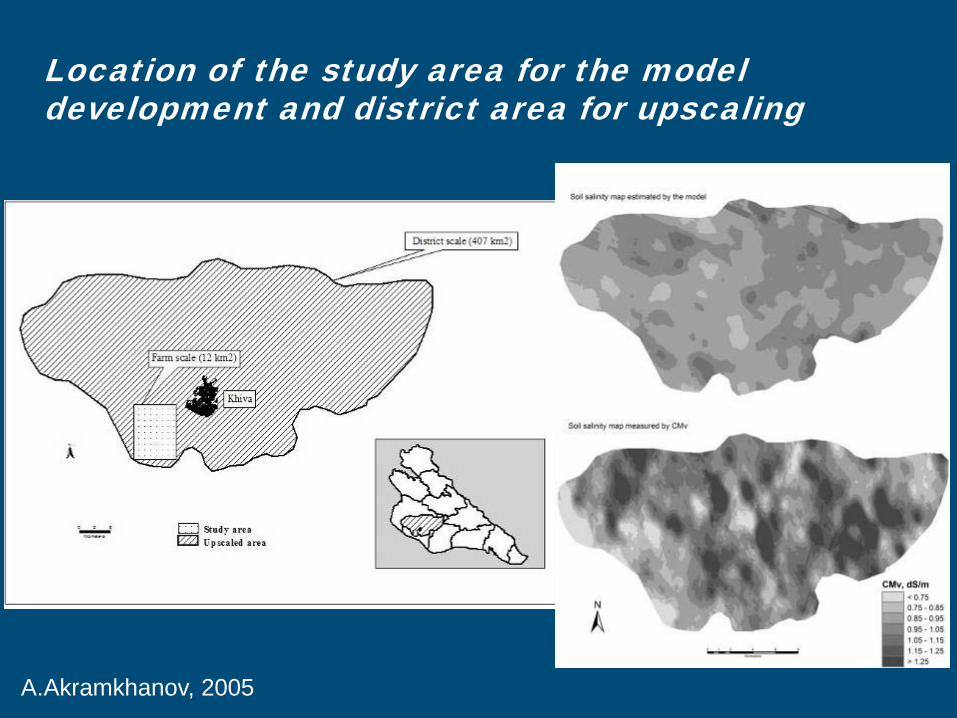
Location of the study area for the model development and district area for upscaling
A.Akramkhanov, 2005
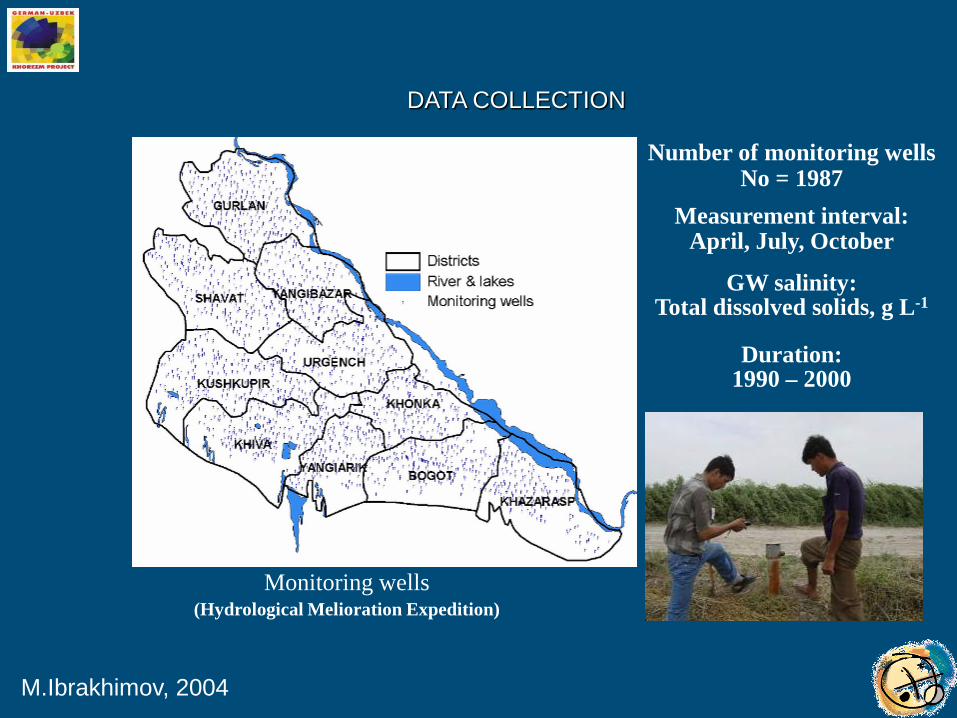
Number of monitoring wellsNo = 1987
Measurement interval:April, July, October
GW salinity:Total dissolved solids, g L-1
Duration:1990 – 2000
DATA COLLECTION
Monitoring wells(Hydrological Melioration Expedition)
M.Ibrakhimov, 2004
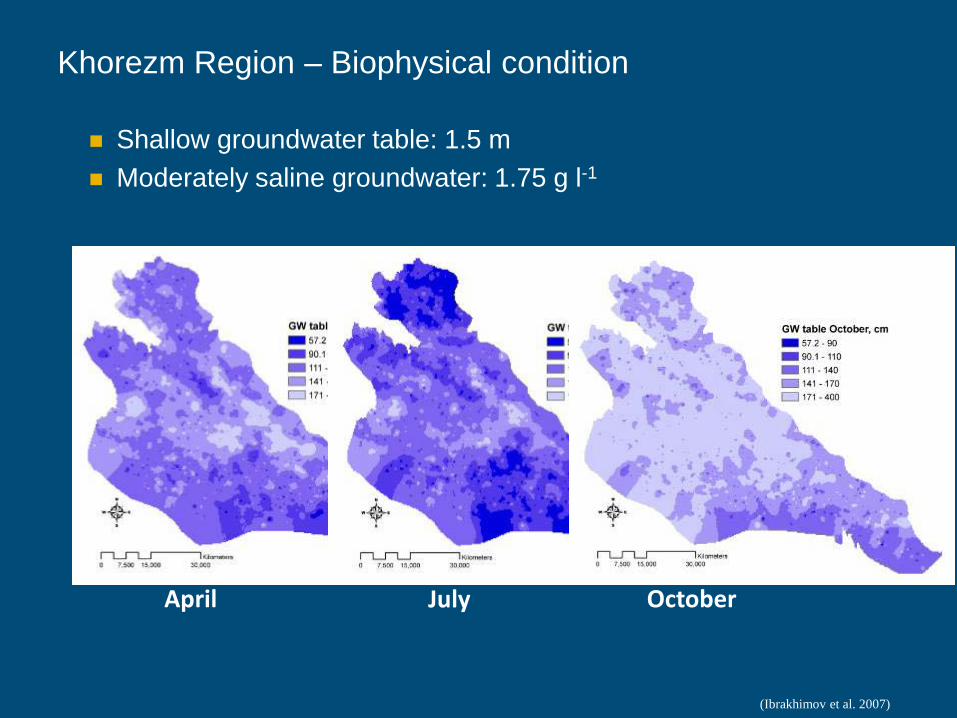
Khorezm Region – Biophysical condition
(Ibrakhimov et al. 2007)
Shallow groundwater table: 1.5 m Moderately saline groundwater: 1.75 g l-1
April July October
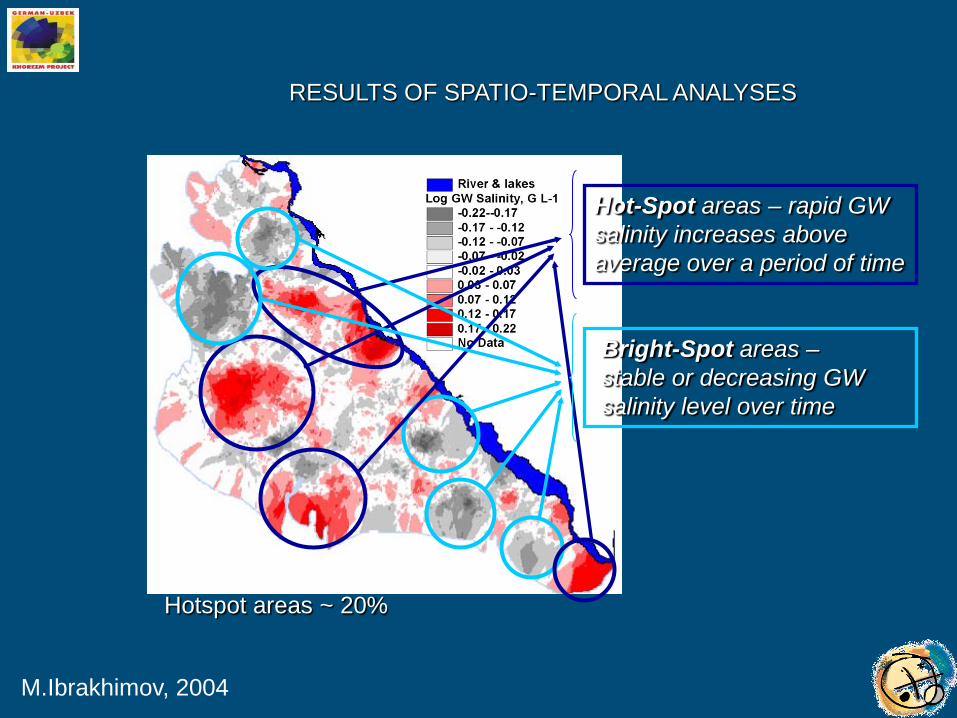
RESULTS OF SPATIO-TEMPORAL ANALYSES
Hot-Spot areas – rapid GW salinity increases above average over a period of time
Bright-Spot areas –stable or decreasing GW salinity level over time
Hotspot areas ~ 20%
M.Ibrakhimov, 2004

Thank you for attention