USE OF REAL-TIME REMOTE SENSING DATA FOR … · USE OF REAL-TIME REMOTE SENSING DATA FOR EVALUATING...
8
USE OF REAL-TIME REMOTE SENSING DATA FOR EVALUATING SOIL MOISTURE AND SALINITY EFFECTS ON LIGHT PENETRATION DEPTH C. Ormeci a & S. Ekercin b, * a ITU, Civil Engineering Faculty, Remote Sensing Division, 80626 Maslak Istanbul, Turkey - [email protected] b University of Aksaray, Dept. of Geodesy and Photogrammetry, 68100 Aksaray, Turkey - [email protected] WG II/2 KEY WORDS: Remote sensing, Soil moisture, Salinity, Real-time, Radiometric correction, Light penetration. ABSTRACT: Active and passive microwave remote sensing systems have been widely used for determination of soil moisture and salinity due to the high penetration depth and sensitivity of microwaves. We used optical remote sensing data and investigated the effects of soil moisture and salinity on the penetration depth of light into the soil using real-time ground spectral measurements around Salt Lake, Turkey. Reflectance spectra were simultaneously measured using field spectroradiometer at different depths starting from the soil surface during the overpass of Landsat-5 over the study area. The correlation between the reflectance spectra of each layer and spectral radiance obtained from TM data was examined. The results indicate a good correlation between observed and predicted reflectance spectra for each layer and are consistent with results obtained from the same instrument in previous experiments. One of the most important result of the study is that soil moisture formed under salt crust into the crusted saline soil (CSS) negatively affects the light penetration depth in the shortwave infrared region of the electromagnetic spectrum. Experimental results obtained in the study show that light penetration depth into the CSS is just 0-0,5cm, while it is between 0 and 2,5cm into the bare saline soil (BSS). The results also show that spectral bands having relatively long wavelength such as TM5, TM7 are more correlated with the lower layers. 1. INTRODUCTION Characterization of soil properties is one of the earliest applications of remotely sensed data in agriculture. Bushnell (1932) described efforts in the 1920s to use aerial photos to map boundaries of different soil series. Aerial photographs have been used as a mapping aid in most of the soil surveys in the United States since the late 1950s. A majority of the studies examining quantitative relationships between remotely sensed data and soil properties have focused on the reflective region of the spectrum (0.3 to 2.8 μm), with some relationships established from data in the thermal and microwave regions. Most of the spectral responses in the reflective spectrum can be related to differences in organic matter content, iron content, and texture (Stoner and Baumgardner, 1981). The soil property that is most directly correlated to reflectance-based data is soil albedo (Post et al., 2000). Additional soil properties have been inferred from reflectance measurements under laboratory conditions such as moisture, organic carbon, total nitrogen, and other chemical properties (Barnes et al., 2003; Baumgardner et al., 1985; Dalal and Henry, 1986; Shonk et al., 1991; Ben-Dor and Banin, 1994). Some of the relationships have also been established for data acquired over tilled or fallow fields, as described in the following paragraphs. Most salt-affected soils can be identified by a white salt crust that will form on the soil surface; thus, these soils tend to have higher visible and NIR reflectance (Rao et al., 1995). This spectral response cannot always be used to identify saline soils, because soils with high sand contents will have visible and NIR spectral properties similar to salt crusted soils (Verma et al., 1994). Microwave data (both passive and active) have been related to surface soil moisture (Jackson, 1993; Moran et al., 1998). The approach is limited when vegetation is present and is often only sensitive to conditions at the surface (~5 to 20 cm depth); however, use of different bands and integrating the data with soil-water balance models have shown that microwave data can be useful in mapping soil moisture conditions. Soil moisture has been correlated to visible and NIR reflectance of bare-soil fields if the data are taken a few days after rainfall (Milfred and Kiefer, 1976). Similarly, thermal imagery has also been related to differences in surface soil moisture content (Davidoff and Selim, 1988; Barnes et al., 2003). Most types of remotely sensed spectral observations still require site-specific calibration using ground-sampling techniques. When remotely sensed data are used to infer soil properties which are correlated with soil electrical conductivity data (such as salinity, texture, or water holding capacity), accuracy of ground calibration data could be improved by using ground- based soil electrical conductivity surveying techniques. For example, detailed ground based soil electrical conductivity surveys (used in conjunction with appropriate soil calibration sampling designs) could be undertaken within selected sub- areas of a much larger remotely sensed survey region. The ground-based electrical conductivity data provide a better estimate of the soil attribute of interest (within the sub-areas) and produce more calibration data for an analysis of the remotely sensed data (Barnes et al., 2003; Ekercin, 2007; Ekercin and Ormeci, 2008). The objective of this paper is to investigate the effects of soil moisture and salinity on the penetration depth of light into the soil using real-time ground spectral measurements and optical remote sensing data around Salt Lake, Turkey. 167
Transcript of USE OF REAL-TIME REMOTE SENSING DATA FOR … · USE OF REAL-TIME REMOTE SENSING DATA FOR EVALUATING...

USE OF REAL-TIME REMOTE SENSING DATA FOR EVALUATING SOIL MOISTURE AND SALINITY EFFECTS ON LIGHT PENETRATION DEPTH
C. Ormeci a & S. Ekercin b, *
a ITU, Civil Engineering Faculty, Remote Sensing Division, 80626 Maslak Istanbul, Turkey - [email protected] b University of Aksaray, Dept. of Geodesy and Photogrammetry, 68100 Aksaray, Turkey - [email protected]
WG II/2
KEY WORDS: Remote sensing, Soil moisture, Salinity, Real-time, Radiometric correction, Light penetration. ABSTRACT: Active and passive microwave remote sensing systems have been widely used for determination of soil moisture and salinity due to the high penetration depth and sensitivity of microwaves. We used optical remote sensing data and investigated the effects of soil moisture and salinity on the penetration depth of light into the soil using real-time ground spectral measurements around Salt Lake, Turkey. Reflectance spectra were simultaneously measured using field spectroradiometer at different depths starting from the soil surface during the overpass of Landsat-5 over the study area. The correlation between the reflectance spectra of each layer and spectral radiance obtained from TM data was examined. The results indicate a good correlation between observed and predicted reflectance spectra for each layer and are consistent with results obtained from the same instrument in previous experiments. One of the most important result of the study is that soil moisture formed under salt crust into the crusted saline soil (CSS) negatively affects the light penetration depth in the shortwave infrared region of the electromagnetic spectrum. Experimental results obtained in the study show that light penetration depth into the CSS is just 0-0,5cm, while it is between 0 and 2,5cm into the bare saline soil (BSS). The results also show that spectral bands having relatively long wavelength such as TM5, TM7 are more correlated with the lower layers.
1. INTRODUCTION
Characterization of soil properties is one of the earliest applications of remotely sensed data in agriculture. Bushnell (1932) described efforts in the 1920s to use aerial photos to map boundaries of different soil series. Aerial photographs have been used as a mapping aid in most of the soil surveys in the United States since the late 1950s. A majority of the studies examining quantitative relationships between remotely sensed data and soil properties have focused on the reflective region of the spectrum (0.3 to 2.8 µm), with some relationships established from data in the thermal and microwave regions. Most of the spectral responses in the reflective spectrum can be related to differences in organic matter content, iron content, and texture (Stoner and Baumgardner, 1981). The soil property that is most directly correlated to reflectance-based data is soil albedo (Post et al., 2000). Additional soil properties have been inferred from reflectance measurements under laboratory conditions such as moisture, organic carbon, total nitrogen, and other chemical properties (Barnes et al., 2003; Baumgardner et al., 1985; Dalal and Henry, 1986; Shonk et al., 1991; Ben-Dor and Banin, 1994). Some of the relationships have also been established for data acquired over tilled or fallow fields, as described in the following paragraphs. Most salt-affected soils can be identified by a white salt crust that will form on the soil surface; thus, these soils tend to have higher visible and NIR reflectance (Rao et al., 1995). This spectral response cannot always be used to identify saline soils, because soils with high sand contents will have visible and NIR spectral properties similar to salt crusted soils (Verma et al., 1994). Microwave data (both passive and active) have been related to surface soil moisture (Jackson, 1993; Moran et al.,
1998). The approach is limited when vegetation is present and is often only sensitive to conditions at the surface (~5 to 20 cm depth); however, use of different bands and integrating the data with soil-water balance models have shown that microwave data can be useful in mapping soil moisture conditions. Soil moisture has been correlated to visible and NIR reflectance of bare-soil fields if the data are taken a few days after rainfall (Milfred and Kiefer, 1976). Similarly, thermal imagery has also been related to differences in surface soil moisture content (Davidoff and Selim, 1988; Barnes et al., 2003). Most types of remotely sensed spectral observations still require site-specific calibration using ground-sampling techniques. When remotely sensed data are used to infer soil properties which are correlated with soil electrical conductivity data (such as salinity, texture, or water holding capacity), accuracy of ground calibration data could be improved by using ground-based soil electrical conductivity surveying techniques. For example, detailed ground based soil electrical conductivity surveys (used in conjunction with appropriate soil calibration sampling designs) could be undertaken within selected sub-areas of a much larger remotely sensed survey region. The ground-based electrical conductivity data provide a better estimate of the soil attribute of interest (within the sub-areas) and produce more calibration data for an analysis of the remotely sensed data (Barnes et al., 2003; Ekercin, 2007; Ekercin and Ormeci, 2008). The objective of this paper is to investigate the effects of soil moisture and salinity on the penetration depth of light into the soil using real-time ground spectral measurements and optical remote sensing data around Salt Lake, Turkey.
167

The International Archives of the Photogrammetry, Remote Sensing and Spatial Information Sciences. Vol. XXXVII. Part B2. Beijing 2008
Figure 1. Location of the study area and field sampling points (CSS-crusted saline soil, BSS-bare saline soil).
2. STUDY REGION
The study area is located at the northeast of Konya (between latitudes 38° 20' and 39° 10' N and longitudes 33° 03' and 33° 45' E) and covers Salt Lake which is the second largest lake in Turkey. Further information is given in Figure 1. The Salt Lake occupying a depression in the dry central plateau of Turkey lies at an elevation of 905 m. It is a huge (1,500 km2) and very shallow (with a maximum depth of 1.5 m. in spring) lake and extremely saline with a salt ratio of 32%. The lake bottom is covered with a 1 to 30 cm. thick salt layer, which has given rise to a local salt industry providing 55% of all Turkish
salt (average 750,000 tons annually). The climate is semiarid with the lowest annual precipitation in Turkey, less than 400 mm yr-1 and a mean annual temperature of 11.4 °C. The lake is fed by two major streams, groundwater and surface water. Brackish marshes have formed where channels and streams enter the lake, and the lake is surrounded by (only partially irrigated) cereal fields in the north, east and west (www.britannica.com, www.bcs.gov.tr). Spectral ground measurements were performed at a pilot region located in the west coasts of the lake. A significant amount of bare saline soil and crusted saline soil is present in all areas around the lake.
168

The International Archives of the Photogrammetry, Remote Sensing and Spatial Information Sciences. Vol. XXXVII. Part B2. Beijing 2008
3. DATA AND METHODS
3.1 Landsat-5 TM Image Analysis
LANDSAT-5 TM sub-image (Path/Row = 177/33) acquired on June 20, 2006 (10:31 local time) was used as real-time satellite remote sensing data The Landsat TM instrument has four spectral bands in the visible near infrared-VNIR (0.45-0.52µm, 0.52-0.60µm, 0.63-0.69µm and 0.76-0.90µm-30m), two bands in the short wave infrared-SWIR (1.55-1.75µm and 2.08-2.35µm-30m) and one band in the thermal infrared-TIR regions (10.4-12.5µm-120m). However, only visible near infrared and short wave infrared bands were used in the study to enable comparison of satellite data with spectral (in-situ) measurements. Image processing procedure and the evaluation of spectral measurements were carried out using Erdas Imagine© and ASD ViewSpecPro© software packages. In the image processing step, firstly, satellite remote sensing data were geometrically transformed to real world coordinates using UTM projection and WGS 84 datum. The Landsat-5 TM data having 30m spatial resolution (acquired on June 20, 2006) and base maps (1:25 000) were used for the ground control, resulting in a RMS accuracy of less than a half pixel utilizing approximately 50 ground control points. Nearest neighbour resampling method (Dymond and Shepherd, 2004; Marcus et al., 2003; Yamaguchi and Naitov, 2003) and a first-order polynomial transformation method (Lee et al., 2002; Lillesand et al. 2004; Rembold and Maselli, 2004; Yang and Lo, 2000) were carried out to create the output images with 30m ground resolution for Landsat-5 sensor data. Image processing procedure and the evaluation of the remote sensing data were performed using Erdas Imagine©, Arc GIS© and ASD ViewSpecPro© software packages. Secondly, Landsat-5 TM, 2006 image was radiometrically corrected to be able to compare with in-situ measurements and each other. The aim of radiometric correction is to minimize the atmospheric effects and to convert remotely sensed digital numbers (DN) to ground surface reflectance in order to make
the data spectrally comparable (Chavez, 1996; Green et al. 2000; Lu et al. 2002; Yang and Lo, 2000). We adopted two main equations proposed by Chander and Markham (2003) to convert DNs to at-satellite reflectance. The first equation described as follows is used to perform conversion from DNs to radiance: L Gain DN Biasλ λ λ λ= +* (1) where Gain = units of W/(m2.sr.μm)/DN Bias = units of W/(m2.sr.μm) The next step is used to make the satellite data comparable with the spectral (in-situ) measurements. We used, in this step, the following equation for conversion from radiance to at-satellite reflectance:
R L dESUN Cos s
=π
θλ
λ
. .. (
2
) (2)
where R = unitless planetary reflectance Π = a constant (3.141592654) Lλ = spectral radiance at the sensor’s aperture d = earth–sun distance in astronomical units ESUNλ = mean solar exoatmospheric irradiances θs = solar zenith angle in degrees (90°- Sun Elevation) 3.2 Field Work on Ground Sampling
Field work stage of this study including spectral measurements was performed in a site along the north coasts of the lake. During the simultaneously performed field work on June 20, 2006 (between 0930- 1230 local time) with the overpass of Landsat-5 TM, an ASD FieldSpec®Pro field portable spectroradiometer and a hand held Magellan GPS receiver were used.
Figure 2. Field work on collecting soil samples and reflectance spectra.
169
The International Archives of the Photogrammetry, Remote Sensing and Spatial Information Sciences. Vol. XXXVII. Part B2. Beijing 2008
The measurements were done using an ASD FieldSpec®Pro field portable spectroradiometer which consists of a data analyser attached to a laptop computer at different depths starting from soil surface up to 15cm depth (Figure 2). The spectral range of this device is 350–2500 nm with a resolution of 3 nm for the region 350–1000 nm, 10 nm for the region 1000–2500 nm. However, the working range was limited to specific region of the electromagnetic spectrum corresponding spectral ranges of the TM bands except thermal (450nm-2350nm). The sensor, with a field of view of 8°, was positioned 1,6 m above the ground at nadir position. Five target measurements were made after measuring the reference panel.
4. RESULTS AND DISCUSSION
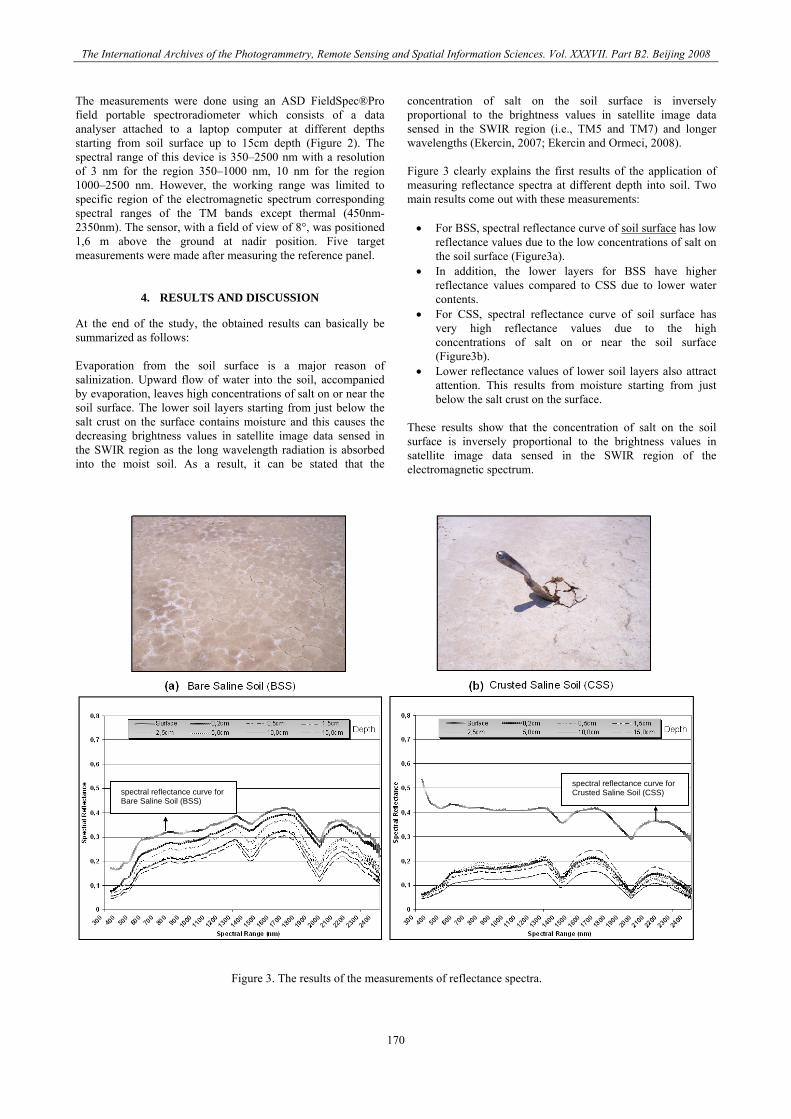
At the end of the study, the obtained results can basically be summarized as follows: Evaporation from the soil surface is a major reason of salinization. Upward flow of water into the soil, accompanied by evaporation, leaves high concentrations of salt on or near the soil surface. The lower soil layers starting from just below the salt crust on the surface contains moisture and this causes the decreasing brightness values in satellite image data sensed in the SWIR region as the long wavelength radiation is absorbed into the moist soil. As a result, it can be stated that the
concentration of salt on the soil surface is inversely proportional to the brightness values in satellite image data sensed in the SWIR region (i.e., TM5 and TM7) and longer wavelengths (Ekercin, 2007; Ekercin and Ormeci, 2008). Figure 3 clearly explains the first results of the application of measuring reflectance spectra at different depth into soil. Two main results come out with these measurements:
• For BSS, spectral reflectance curve of soil surface has low
reflectance values due to the low concentrations of salt on the soil surface (Figure3a).
• In addition, the lower layers for BSS have higher reflectance values compared to CSS due to lower water contents.
• For CSS, spectral reflectance curve of soil surface has very high reflectance values due to the high concentrations of salt on or near the soil surface (Figure3b).
• Lower reflectance values of lower soil layers also attract attention. This results from moisture starting from just below the salt crust on the surface.
These results show that the concentration of salt on the soil surface is inversely proportional to the brightness values in satellite image data sensed in the SWIR region of the electromagnetic spectrum.
spectral reflectance curve for Crusted Saline Soil (CSS) spectral reflectance curve for
Bare Saline Soil (BSS)
Figure 3. The results of the measurements of reflectance spectra.
170
The International Archives of the Photogrammetry, Remote Sensing and Spatial Information Sciences. Vol. XXXVII. Part B2. Beijing 2008
Crusted Saline Soil (CSS)
Bare Saline Soil (BSS)
TM1 TM2 TM3 TM4 TM5 TM7
TM1 TM2 TM3 TM4 TM5 TM7
Layer No
0,45
-0,5
2µm
0,52
-0,6
0µm
0,63
-0,6
9µm
0,76
-0,9
0µm
1,55
-1,7
5µm
2,08
-2,3
5µm
0,45
-0,5
2µm
0,52
-0,6
0µm
0,63
-0,6
9µm
0,76
-0,9
0µm
1,55
-1,7
5µm
2,08
-2,3
5µm
Layer No
1 (Surface) 0,9789 0,9732 0,9966 0,8899 0,8684 0,4609
0,9903 0,3632 0,4326 0,3356 0,0520 0,1490 1
(Surface)
2 (Depth: 0,2cm) 0,8798 0,8663 0,9319 0,9120 0,9683 0,8913
0,8461 0,9269 0,9566 0,9700 0,3623 0,4733 2
(Depth: 0,2cm)
3 (Depth: 0,5cm) 0,7928 0,2501 0,4089 0,8302 0,8759 0,8451
0,6361 0,7872 0,7773 0,7923 0,4231 0,4547 3
(Depth: 0,5cm)
4 (Depth: 1,5cm) 0,5145 0,2621 0,3575 0,3641 0,5457 0,7334
0,6152 0,5466 0,5761 0,5598 0,9712 0,8599 4
(Depth: 1,5cm)
5 (Depth: 2,5cm) 0,3649 0,1883 0,2243 0,2255 0,4697 0,6294
0,5897 0,2947 0,4756 0,6671 0,9567 0,9798 5
(Depth: 2,5cm)
6 (Depth: 5,0cm) 0,4125 0,1002 0,3487 0,0196 0,2105 0,4566
0,5601 0,3138 0,1578 0,6334 0,8437 0,8880 6
(Depth: 5,0cm)
7 (Depth: 10,0cm) 0,3571 0,0885 0,2305 0,1312 0,2072 0,5329
0,4103 0,1125 0,1517 0,1944 0,4196 0,3705 7
(Depth: 10,0cm)
8 (Depth: 15,0cm) 0,2359 0,0492 0,0780 0,0328 0,1031 0,5097
0,2889 0,2785 0,1838 0,1873 8 0,1924 0,4308 (Depth: 15,0cm)
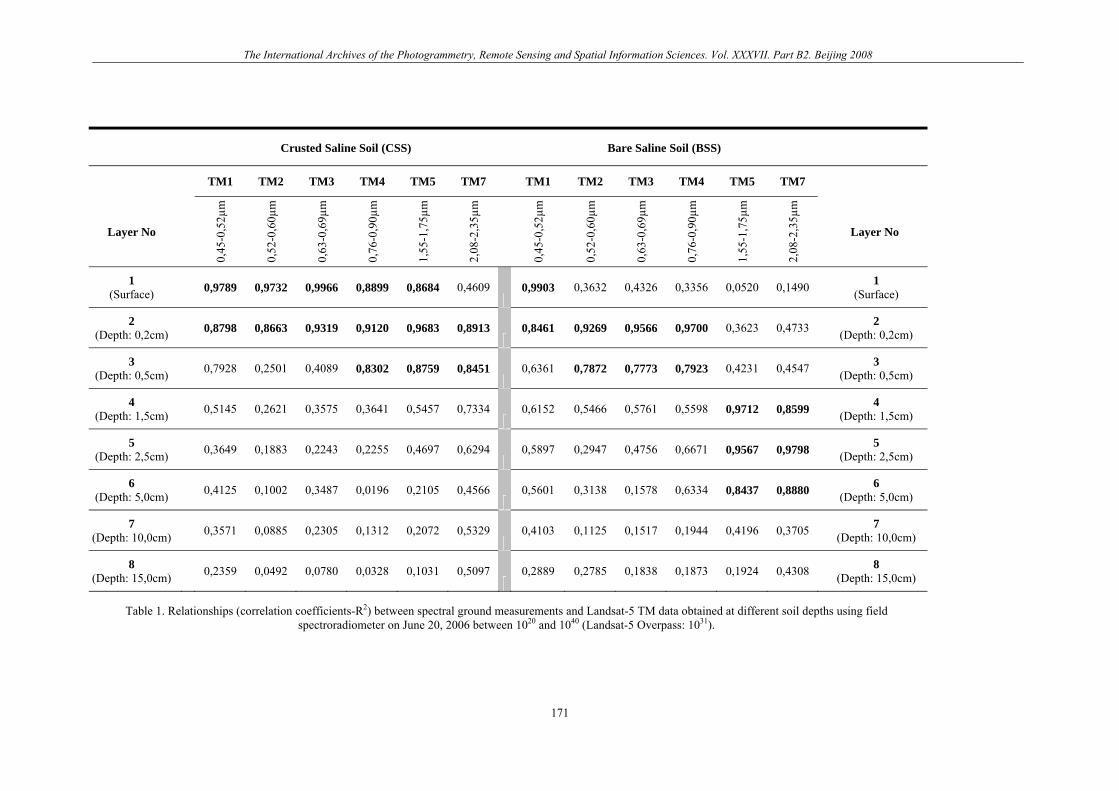
Table 1. Relationships (correlation coefficients-R2) between spectral ground measurements and Landsat-5 TM data obtained at different soil depths using field spectroradiometer on June 20, 2006 between 1020 and 1040 (Landsat-5 Overpass: 1031).
171

The International Archives of the Photogrammetry, Remote Sensing and Spatial Information Sciences. Vol. XXXVII. Part B2. Beijing 2008
Table 1 explains the second set of results of the application of measuring reflectance spectra at different depths into soil and satellite image data. The main results can be summarized as follows:
• Salinization negatively affects the penetration depth of light into the soil due to the moisture starting from just below the salt crust on the soil surface. Because of this, all TM spectral bands are mostly correlated with upper soil layer between 0-5mm. (see. Table 1 for CSS).
• In contrast to this, the penetration depth of light into the soil for BSS is higher than that of CSS due to the lower moisture contents (see. Table 1 for BSS). In BSS, Landsat TM SWIR bands are mostly correlated with the reflectance spectra obtained at deeper soil layer (0-25mm).
The results show that the concentration of salt on the soil surface is inversely proportional to the brightness values in satellite image data sensed in the SWIR region of the electromagnetic spectrum due to moisture starting from just below the salt crust on the surface.
5. CONCLUSION
In this study, we have presented an application of optical remote sensing data and investigated the effects of soil moisture and salinity on the penetration depth of light into the soil using real-time ground spectral measurements. The results show and demonstrate that the concentration of salt on the soil surface is inversely proportional to the brightness values in satellite image data sensed in the SWIR region of the electromagnetic spectrum due to moisture starting from just below the salt crust formed on the surface. This is an essential point for the interpretation of satellite remote sensing data. For example, it can be easily stated that this result will play a key role for distinction of saline soil and sandy soil on the satellite images due to the absorption in long spectral bands for lower soil layers of CSS.
ACKNOWLEDGEMENTS
This research was funded by The Scientific and Technological Research Council of Turkey-TUBITAK (Grant Number: 105Y283). The authors would like to thank to Prof. Dr. Doğan KANTARCI (University of Istanbul, Faculty of Forestry) for their generous supports during the field work.
REFERENCES
Barnes, E.M., Sudduth, K.A., Hummel, J.W., Lesch, S.M., Corwin, D.L., Yang, C., Daughtry, C.S.T., Bausch, W.C., 2003. Remote- and Ground-Based Sensor Techniques to Map Soil Properties. Photogrammetric Engineering and Remote Sensing, 69(6), pp. 619-630. Baumgardner, M.F., Silva, L.F., Biehl, L.L., Stoner, E.R., 1985. Reflectance properties of soils. Advances in Agronomy, 38, 1-44.
Ben-Dor, E., Banin, A., 1994. Visible and near-infrared (0.4-1.1 micrometer) analysis of and semiarid soils. Remote Sensing of Environment, 48(3), 261-274. Chander, G., Markham, B., 2003. Revised Landsat-5 TM Radiometric Calibration Procedures and Postcalibration Dynamic Ranges. IEEE Transactions on Geoscience and Remote Sensing, 41, pp. 2674-2677. Chavez, P.S., 1996. Image-based atmospheric corrections - revisited and improved. Photogrammetric Engineering and Remote Sensing, 62, pp. 1025-1036. Dalal, R.C., Henry, R.J. 1986. Sinıultaneous cleternıination of moisture, organic carbon, and total nitrogen by near infrared reflectance spectrophotometry. Soil Science Society of America Journal, 50, 120-123. Davidoff, B., Selim, H.M., 1988. Correlation between spatially variable soil moisture content and soil temperature. Soil Science, 145(1), 1-10. Dymond, J. R., Shepherd, J. D., 2004. The spatial distribution of indigenous forest and its composition in the Wellington region, New Zealand, from ETM+ satellite imagery. Remote Sensing of Environment, 90, 116-125. Ekercin, S., 2007. Multitemporal change detection on the Salt Lake and it vicinity by integrating remote sensing and geographic information system. PhD Thesis, Istanbul Technical University, Institute of Science and Technology, Istanbul, pp. 172. Ekercin, S., Ormeci, C., 2008. An application to estimating soil salinity using satellite remote sensing data and real-time field sampling. Environmental Engineering Science, in press. Green, G., Schweik, C.M, Hanson, M., 2000. Radiometric Calibration of Landsat Multispectral Scanner and Thematic Mapper Images: Guidelines for the Global Changes Community. Working Paper. Bloomington: Center for the Study of Institutions, Population, and Environmental Change, Indiana University. Jackson, T.J., 1993. Measuring surface soil moisture using passive microwave remote sensing. Hydrological Processes, 7, 139-152. Lee, S., Chwae, U., Min, K., 2002. Landslide susceptibility mapping by correlation between topography and geological structure: the Janghung area, Korea. Geomorphology, 46, pp. 149-162. Lillesand, T.M, Kiefer, R.W., Chipman, J.W., 2004. Remote Sensing and Image Interpretation, John Wiley & Sons, New York, pp. 321-332. Lu, D., Mausel, P., Brondızıo, E., Moran, E., 2002. Assessment of atmospheric correction methods for Landsat TM data applicable to Amazon basin LBA research. International Journal of Remote Sensing, 23, pp. 1671-2651. Marcus, W.A., Legleiter, C.J., Aspinall, R.J., Boardmanc, J.W., Crabtree, R.L., 2003. High spatial resolution hyperspectral mapping of in-stream habitats, depths, and woody debris in mountain streams. Geomorphology, 55, pp. 363-380.
172

The International Archives of the Photogrammetry, Remote Sensing and Spatial Information Sciences. Vol. XXXVII. Part B2. Beijing 2008
Milfred, C.J., Kiefer, R.W., 1976. Analysis of soil variability with repetitive aerial photography. Soil Science Society of America Journal, 40, 553-557. Moran, M.S., Vidal, A., Troufleau, D., İnoue, Y., Mitchell, T.A., 1998. Ku- and C-band SAR for discriminating agricultural crop and soil conditions. IEEE Geoscience and Remote Sensing Journal, 36, 265-272. Post, D.F., Finıbres, A., Matthias, A.D., Sano, E.E., Accioly, L., Batohiiy, A.K., Ferreira, L.G., 2000. Predicting soil albedo fronı soil color and spectral reflectance data. Soil Science Society of America Journal, 64(3), 1027-1034. Rao, B.R.M., Sankar, T.R., Dwivedi, R.S., Thanınıappa, S.S., Venkataratnam, L., Sharnıa, R.C., Das, S.N., 1995. Spectral behavior of salt-affected soils. International Journal of Remote Sensing, 16(12), 2125-2136. Rembold, F., Maselli, F., 2004. Estimating inter-annual crop area variation using multi-resolution satellite sensor images. International Journal of Remote Sensing, 25, pp. 2641-2647.
Shonk, J.L., Gaultney, L.D., Schulze, D.G., Van Scoyoc, G.E., 1991. Spectroscopic sensing of organic matter content. Transactions of the ASAE, 34(5), 1978-1984. Stoner, E.R., Baumgardner, F., 1981. Characteristic variations in reflectance of surface soils. Soil Science Society of America Journal, 45, 1161-1165. Verma, K.S., Saxena, R.K., Barthwal, A.K., Deshmukh, S.N., 1994. Remote sensing technique for mapping salt affected soils. International Journal of Remote Sensing, 15(9), 1901- 1914. Yamaguchi, Y., Naitov, C., 2003. Spectral indices for lithologic discrimination and mapping by using the ASTER SWIR bands. International Journal of Remote Sensing, 24, pp. 4311-4323. Yang, X., Lo, C.P., 2000. Relative radiometric normalization performance for change detection from multi-date satellite images. Photogrammetric Engineering and Remote Sensing, 66, pp. 967-980. Yang, X., Lo, C.P., 2000. Relative radiometric normalization performance for change detection from multi-date satellite images. Photogrammetric Engineering and Remote Sensing, 66, pp. 967-980.
173

The International Archives of the Photogrammetry, Remote Sensing and Spatial Information Sciences. Vol. XXXVII. Part B2. Beijing 2008
174