
Remittances and Economic Growth in Latin America and the
32
Remittances and Economic Growth in Latin America and the Caribbean: The Impact of Human Capital Development Pablo A. Garcia-Fuentes Department of Agricultural Economics and Agribusiness Louisiana State University 207 Agricultural Administration Building Baton Rouge, LA 70803 Office: (225)578-2728 [email protected] P. Lynn Kennedy Department of Agricultural Economics and Agribusiness Louisiana State University 101 Agricultural Administration Building Baton Rouge, LA 70803 Office: (225)578-2726 [email protected] Selected Paper prepared for presentation at the Southern Agricultural Economics Association Annual Meeting, Atlanta, Georgia, January 31-February 3, 2009 * * Copyright 2009 by Garcia-Fuentes and Kennedy. All rights reserved. Readers may make verbatim copies of this document for non-commercial purposes by any means, provided that this copyright notice appears on all such copies.
Transcript of Remittances and Economic Growth in Latin America and the

Remittances and Economic Growth in Latin America and the Caribbean: The Impact of
Human Capital Development
Pablo A. Garcia-Fuentes
Department of Agricultural Economics and Agribusiness
Louisiana State University
207 Agricultural Administration Building
Baton Rouge, LA 70803
Office: (225)578-2728
P. Lynn Kennedy
Department of Agricultural Economics and Agribusiness
Louisiana State University
101 Agricultural Administration Building
Baton Rouge, LA 70803
Office: (225)578-2726
Selected Paper prepared for presentation at the Southern Agricultural Economics Association
Annual Meeting, Atlanta, Georgia, January 31-February 3, 2009*
* Copyright 2009 by Garcia-Fuentes and Kennedy. All rights reserved. Readers may make verbatim copies of this
document for non-commercial purposes by any means, provided that this copyright notice appears on all such
copies.

2
Abstract
Remittances are one source of external financing for developing countries that have been
increasing in both size and importance as of late. However, the issue about the impact on
economic growth from remittances is still opened for discussion. This paper adds to this
discussion by investigating the impact of remittances on growth through human capital using a
panel data analysis for a sample of 14 Latin American and Caribbean (LAC) countries during the
period 1975-2000. The results indicate that remittances have a positive impact on economic
growth in the representative countries from the LAC region; however, the realization of this
impact holds only when the remittance receiving country has a minimum threshold of human
capital stock.
Key Words: Remittances, Human Capital, Growth, Latin America and the Caribbean

3
Remittances and Economic Growth in Latin America and the Caribbean: The Impact of
Human Capital Development
Introduction
Remittances are one source of external financing for developing countries that have been
increasing in both size and importance as of late. During 2006 inflows to developing countries of
Foreign Direct Investment (FDI), remittances and Official Development Assistance (ODA) in
billions of U.S. dollars were $324.7, $206.0 and $103.9, respectively (World Bank, 2007).
Remittances are second to FDI, but greater than ODA inflows. Among developing countries
Latin America and the Caribbean (LAC) have been the largest recipient of recorded remittances.
Remittance inflows to developing regions in 2006 were $47.0 billion for East Asia and the
Pacific (EAP), $32.0 billion for Europe and Central Asia (ECA), $53.0 billion for LAC, $25.0
billion for Middle East and North Africa (MNA), $41.0 billion for South Asia (SAS), and $9.0
billion for Sub-Saharan Africa (SSA) (World Bank, 2007, p.54). The remarkable increase in
remittances’ size has awakened the interest of researchers in the development economics area as
well as of policy makers to study the relationship between remittances and economic growth.
However, the impact on economic growth from remittances is still an open discussion.
Some studies find negative and significant impacts of remittances on economic growth (Chami,
Fullenkamp & Jahjah, 2003), or a negative but insignificant impact (International Monetary Fund
[IMF], 2005). On the other hand, the positive impact of remittances on economic growth is
associated with remittance’s potential for financing education and health (human capital
development) and/or productive investments. Some of the studies that find remittances’ positive
effect on growth are Acosta, Calderón, Fajnzylber and Lopez (2007); Catrinescu, Leon-Ledesma,
Piracha and Quillin (2006); and Guiliano and Ruiz-Arranz (2006). Suggesting remittances’
contributions to education are Cox Edwards and Ureta (2003), Hanson and Woodruff (2003),
López-Cordova (2006), and Rapoport and Docquier (2005). Suggesting remittances’
contributions to productive investments are Griffin (1976), Massey and Parrado (1998), and
Woodruff and Zenteno (2001).

4
Even though the research on remittances has been growing, the interesting question about
remittances’ impact on economic growth in developing economies is still opened for discussions.
In order to add to this discussion, the purpose of the current study is to assess empirically the
impact of remittances on economic growth through human capital. The empirical work is based
on a model of endogenous growth in which the growth rate of total factor productivity (TFP) is
modeled as being dependent on human capital and an interaction between human capital and
remittances. Remittances’ potential to affect economic growth may be associated with
remittances’ use for investment in education which can affect TFP. However, the impact of
remittances on growth may be affected by the requirement of an adequate level of human capital
in the remittance receiving economy, so that the level of human capital is conditioning the
utilization of remittances. It may be that human capital has a role similar to that in Nelson and
Phelps (1966) and Benhabib and Spiegel (1994) who suggest that human capital limits the
adoption and implementation of new technologies; or that the level of human capital limits the
absorptive capacity of an economy as in Borensztein, De Gregorio and Lee (1998). Therefore, in
this study we test the complementarity between human capital and remittances on growth.
To estimate the effect of remittances on growth, we use cross-country growth accounting
methods. A group of 14 countries from Latin America and the Caribbean is selected based on
data availability over the period 1975-20001. We model the growth of TFP as a function of
human capital and its interaction with remittances. The results indicate that remittances have a
positive impact on economic growth, though the realization of this impact depends upon the
level of human capital stock in the economy. This implies that a threshold of human capital stock
is needed for remittances to exert a positive effect on growth. In addition, the level of human
capital stock has a positive and significant effect on growth.
To accomplish this, this paper will proceed as follows. Section 2 will present an overview of
remittances in LAC. Section 3 provides a review of the literature on remittances and growth.
Section 4 describes the methodology and data. Section 5 presents a discussion of the results.
Finally, section 6 presents conclusions and areas for further research.
1 Barbados (BRB), Bolivia (BOL), Brazil (BRA), Colombia (COL), Costa Rica (CRI), Dominican Republic (DOM),
El Salvador (SLV), Guatemala (GTM), Honduras (HND), Jamaica (JAM), Mexico (MEX), Panama (PAN),
Paraguay (PRY), and Trinidad and Tobago (TTO).

5
Overview of remittance inflows to Latin America and the Caribbean
Remittance inflows to developing countries have been increasing and becoming an important
source of foreign exchange. In 2006 these inflows were estimated to be $206 billion, which is
composed of: $47 billion to East Asia and Pacific; $32 billion to Europe and Central Asia; $53
billion to Latin America and the Caribbean; $25 billion to the Middle East and North Africa; $41
billion to South Asia; and $9 billion to Sub-Saharan Africa (World Bank, 2007, p. 54). Figure 1
shows that, since the late 1990s, LAC has been the largest recipient of reported remittances
followed by East Asia and Pacific.
Remittances are one of the largest sources of external finance for the countries in the LAC
region. Total remittance inflows to LAC grew from $5.7 billion in 1990 to $57 billion in 2006
(World Development Indicators, 2007)2, a ten-fold increase. IMF (2005, p. 72) reports that five
countries (Mexico, Brazil, Colombia, El Salvador, and the Dominican Republic) from the LAC
region belong to the group of the top 20 largest recipients of remittances during the period 1990-
2003 (Figure 2), of which Mexico is second. Compared to FDI and ODA, remittance flows into
LAC have become the second most important source of external finance, both in levels and as a
percent of GDP (Figures 3 and 4). Figures 3 and 4 also show that while remittances have had a
steady increase since the early 1990s, ODA in billions of U.S. dollars seems to be constant but
seems to be decreasing as a percent of GDP, while FDI shows a downturn during the late 1990s
and earlier 2000s. Therefore, remittances are less volatile than ODA and FDI as a source of
foreign exchange. This shows the importance of remittances both in levels as well as a percent of
GDP for the countries in the LAC region3.
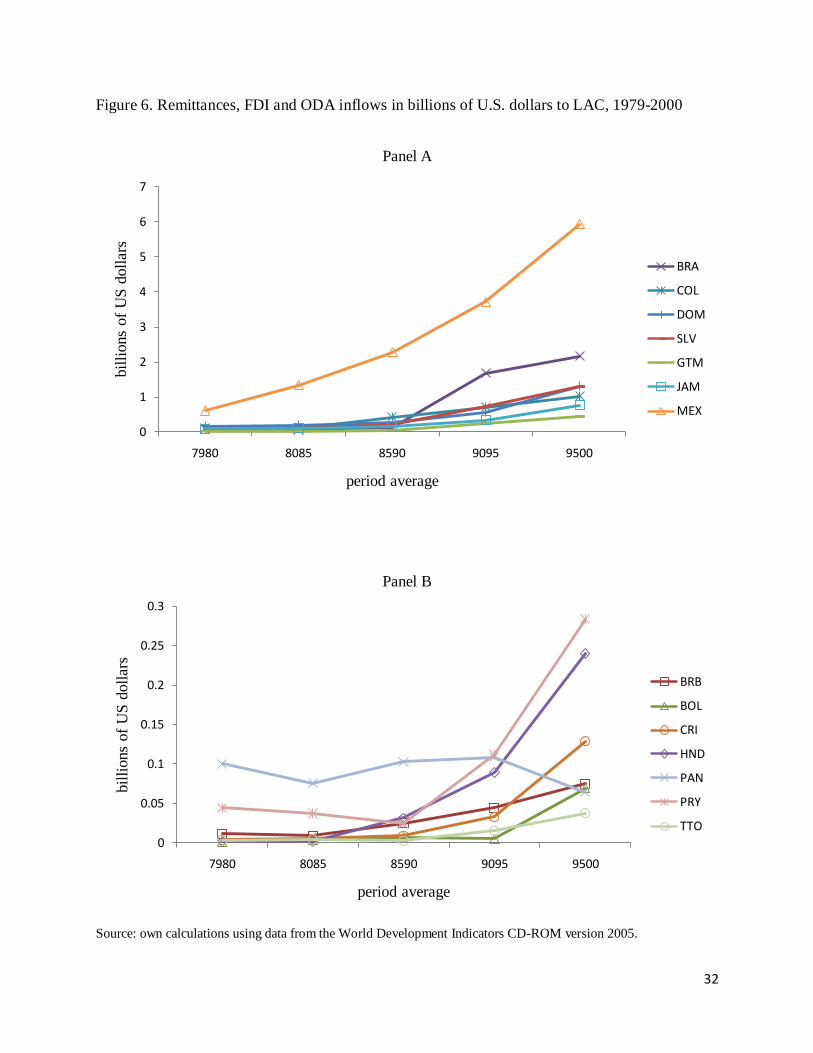
Figures 5 and 6 show remittance inflows to the countries in our sample for the period 1979-
2000, both in levels and a as a percent of GDP. Most of the countries show an increase in
remittances over the period, with the exception of Panama. For Panama Figures 5 and 6 show
that remittances both as a share of GDP and in levels have decreased during the period of the
study.
2 The data is from the online version.
3 That comprises the entire group of countries in Latin America and the Caribbean as grouped by the World Bank,
not just the 14 countries in this study.

6
Review of Literature
The impact of remittances on economic growth is still an open discussion. Remittances are used
either for consumption, investment, or both uses. Some strands of literature on remittances
suggest that using remittances for consumption does not make any good contribution to
economic growth. Another strand of literature argues that by easing liquidity constraints
remittances can contribute to investment in physical and human capital and affect growth.
The association of remittances with consumption relates to the economics of the family which
indentifies the existence of an altruistic relationship between the migrant and his/her family, so
that remittances behave as compensatory transfers that ease bad economic conditions (Chami et
al. 2003). On the relationship between remittances and investment, Rapoport & Docquier (2005)
suggest that remittances have distributive effects that are associated with its effects on growth
and present two models in which remittances promote investment in physical and human capital.
The first model, “Liquidity Constraint 1: Entrepreneurship”, considers that emigration does not
have a direct effect on the labor market of the immigrant home country but has an indirect effect
on the economy because of the migrants’ intergenerational transfers (remittances). The model
presents three cases with two of them resulting in promoting entrepreneurship in the immigrant
home economy. The second model, “Liquidity Constraint 2: Human Capital”, considers an
economy where individuals have a two period life, so that in the first period the individual earns
a minimum wage, receives a transfer from the previous generation and has the possibility to
engage in an educational program. In the second period, the model assumes that migration occurs
and at the end of the period migrants return to their home country and transfer their accumulated
savings to the next generation. This model divides the home country population in four groups
(A, B, C, and D) and distinguishes three cases, and under case number three groups B, C and D
emigrate whose transfers (remittances) allow their next generation to invest in education. Thus,
in these two models remittances are promoting both productive investment projects and
educational development.
Arguments against remittances’ contributions to development include Böhning (1975) and
Rempel and Lodbell (1978). In these studies, remittances are primarily used for consumption and
housing expenditures. Chami et al. (2003) find a significant and negative growth effect of

7
remittances while modeling the causes of remittances based on the economics of the family and
asymmetric information. However, it is argued that the estimate in this study is biased because of
the instrumental variables estimator used for remittances (Catrinescu, et al., 2006, p.11; IMF,
2005); and as Lucas argues that the lack of significance of the interest rate gap differential in the
first stage regression reduces the effectiveness in eliminating the bias of the estimate (as cited in
Catrinescu et al., 2006, p.3). Rapoport & Docquier, (2005, p. 66) also argue that Chami et al.
(2003) ignored the possibility that remittances could affect investment and human capital
formation due to the existence of liquidity constraints, so that human capital, an important factor
that affects growth, was absent in their analysis. On the importance of the association between
remittances and growth, Glytsos (2005) finds that remittance spending differs across countries
and that the negative effect of a decrease in remittances on growth is greater than the positive
effect of increasing them. Guiliano and Ruiz-Arranz (2006) find that remittances promote growth
in countries with less developed financial systems since remittances finance investment and help
to alleviate liquidity constraints. Catrinescu et al. (2006) find that remittances have a positive
impact on growth, although weakly, and suggest that the existence of good institutions could
allow remittances to be invested in greater amount and more efficiently. Thus, it seems that there
are some country conditions that affect the means by which remittances can affect growth.
Investment and education are two of the possible channels.
The above discussion suggests that remittances may affect growth via human capital and
investment. Endogenous growth theory supports modeling the growth of TFP as being affected
by human capital. Romer (1990a) models the growth of total factor productivity as being
affected by human capital employed in the research sector, and finds that the stock of human
capital in an economy is a determinant of the rate of growth. Nelson and Phelps (1966) argue that
including education (human capital) as an additional input in an aggregate production function to
represent the relationship between education and aggregate output may be a gross
misspecification; they argue that education promotes adoption and implementation of new
technologies and model the growth of technology as being affected by an interaction of human
capital in a catching up setting. Benhabib and Spiegel (1994) follow Nelson and Phelps (1966)
and Romer (1990a) and model TFP growth as a function of human capital itself and its
interaction in a catch-up setting. They suggest that the growth rates may differ among countries

8
because of differences in human capital stock levels. Thus, human capital enhances economic
growth by affecting the growth of TFP both directly and through its interactions.
The literature on FDI and growth include interesting findings about the effects on growth from
interactions of human capital and FDI. In this strand of literature, human capital affects the
absorptive capacity of the economy and conditions the positive effects of FDI on economic
growth (Borensztein et al., 1998). Borensztein et al. (1998) highlight the introduction of more
advanced technologies through FDI and test the effect of the interaction between human capital
and FDI on growth. They find a strong complementary effect between human capital and FDI on
growth and that a minimum threshold of human capital is needed for FDI to exert a positive
effect on growth. Xu (2000) finds that technology transfers from U.S. multinationals contributes
to productivity growth in developed countries but not in developing countries, and that a
threshold of human capital is required in the host country in order to benefit from the technology
transfer spillover. Other studies that find positive and significant effects of the interaction
between human capital and FDI on growth are Eller, Haiss and Steiner (2006) and Li & Liu
(2005). Balasubramanyam, Salisu and Sapsford (1999) and Makki and Somwaru (2004) find a
positive interaction though insignificant. Thus, the FDI literature shows how human capital stock
affects the absorptive capacity of an economy and, consequently, the positive effects of capital
inflows such as FDI on economic growth.
This literature review suggests that the impact of remittances on economic growth depends on
whether remittances are used for consumption or investment. However, it is important to note
that one of the uses of remittances is for investment in education, which contributes to the
development of human capital in the remittance receiving countries. In addition, the endogenous
growth literature points out the role of human capital in affecting the growth rate of TFP, in
which not only human capital itself but also its interactions have a role. This study aims to test
the hypothesis regarding the impact of remittances through human capital on economic growth in
the remittance receiving economy. It uses cross-country growth accounting methodology and
tests the effect of the interaction between human capital and remittances on growth. This study
covers a specific region of the world which is Latin America and the Caribbean and which has
been receiving large amounts of remittances.

9
Methodology and Data
The growth model
In this section we present an endogenous growth model based on growth accounting methods
that shows the relationship between the growth rate of GDP per worker and the growth rate of
physical capital, human capital and TFP. This is cross-country growth accounting. In the model,
human capital affects growth as an additional input and through TFP. It is through the interaction
between human capital and remittances that remittances affect growth. The model is in line with
endogenous growth theory in which the growth rate of TFP is a function of human capital. The
model demonstrates a channel by which remittances affect economic growth.
We model TFP as a function of human capital. This approach is in Benhabib and Spiegel (1994),
Nelson and Phelps (1966) and Romer (1990a) among others. Benhabib and Spiegel (1994, p.155)
model the growth of TFP as a function of exogenous technological progress, endogenous
technological progress which involves a human capital direct effect and is adopted from Romer
(1990a), and a technology catch-up factor that depends on human capital and is adapted from
Nelson and Phelps (1966). Temple (1999, p.125) argues that cross country growth accounting
allows for the modeling of the growth rate of TFP as a function of observable variables.
Additionally, Romer (1990b, p. 270) argues that the human capital level may affect the growth of
technology directly and through the catching-up process. We model the growth rate of TFP as a
function of human capital and the interaction between human capital and remittances.
The model starts with an augmented Cobb-Douglas production function in which output per
worker is dependent upon physical capital, human capital, and labor. We assume constant returns
to scale which allows specifying the production function in its intensive form to analyze the
growth of output per worker. The production function is given by
(3.1)
where Y is output, A represents total factor productivity, K is physical capital, H is human capital,
and L is labor force. The intensive form of the production function is given by
(3.2)

10
where y is the ratio of output to labor (Y/L), k is the ratio of physical capital to labor (K/L), and h
is the ratio of human capital to labor (H/L). Taking log differences of equation (3.2) and
expanding it to the cross-section and time dimension gives
(3.3)
where i = 1,…., N and represents the number of cross sections/countries, and t = 1,….., T and
represents the time dimension.
In Equation (3.3), the growth of TFP, , can be replaced by a function of some
observable factors (Temple, 1999, p. 125). One of the earlier studies that specify the growth of
TFP as a function of human capital is Nelson and Phelps (1966); they argue that education, a
proxy for human capital, contributes to the adoption and implementation of new technologies. In
Nelson and Phelps’ (1966) specification, , the rate for closing the gap
between a theoretical and actual level of knowledge depends on the level of human capital,
which is given by the function . Romer (1990a, p. S83) models the growth of TFP as
, where is total human capital employed in research and affects the growth of TFP.
Benhabib and Spiegel (1994, p.161) model the growth of TFP as
], which includes a term for exogenous technological
progress , a term for endogenous technological progress which represents domestic
innovation ability of a country and is the human capital direct effect , and a term for the
technology catch-up effect in which is human capital ]). In this study we
are not interested in any catching-up effect, but on the effect of remittances on TFP through
human capital.
The literature about the effect of remittances on economic growth is still an open discussion.
Chami et al. (2003) find a negative effect of remittances on growth. However, this study has
been criticized for not addressing the problem of autocorrelated errors in panel regressions and
for not having appropriate instruments for the remittance variable which yields biased estimates
(Catrinescu et al., 2006, p.10 & 11). Catrinescu et al. (2006, p.13) also find that remittances
affect growth positively when they are endogeneized and are tested in conjunction with
institutional variables. Other studies have found positive association between remittances and

11
education. Cox-Edwards and Ureta’s (2003) study of remittances and schooling in El Salvador
find that remittances have a large and significant contribution to school retention. Hanson and
Woodruff (2003) find that children at Mexican households having migrants completed more
years of schooling and argue that this is related to migrant remittances which relax credit
constraints and increase the educational attainment of children. Lopez-Cordova (2006) finds that
an increase in the fraction of Mexican households receiving remittances has a significant effect
in reducing illiteracy in children six to 14 years of age and in improving school attendance in
children five-years of age. These studies suggest that remittances contribute to human capital
development which may be one channel for remittances to affect TFP. We model the growth of
TFP to depend upon an exogenous component, the individual effect of human capital, and an
interaction between human capital and remittances. That is
(3.4)
where is the ratio of human capital to labor in country and directly affects the growth of ,
and is remittances as share of GDP in country and indirectly affects the growth of .
Inserting (3.4) into (3.3) then yields
(3.5)
Equation (3.5) states that the growth rate of output per worker in country is affected by the
level of human capital stock, the interaction between the level of human capital stock and
remittances, and the growth rates of both physical and human capital. Equation (3.5) allows for
testing as to whether remittances contribute to growth through human capital. In addition, some
control variables are added to equation (3.5) as well as the individual remittance variable. This
yields the following econometric model
(3.6)
where denotes the unobservable country effect; denotes the unobservable time effects
which are represented by time dummies in (3.6); and is the idiosyncratic error which is
assumed to be independently and identically distributed with zero mean and variance .

12
Investment , government and inflation are added as control variables; these variables
have been found to affect economic growth in earlier studies. Barro and Sala-i-Martin (2004,
p.518) present a set of control and environmental variables that are frequently included as
determinants of the growth rate in cross-countries studies. Among these variables are the control
variables added to equation (3.6). Investment in the neoclassical growth model is a proxy for the
effect of the savings rate (Barro & Sala-i-Martin, 2004, p.519). In the augmented Solow model,
investment, in addition to population growth rate and human capital level, affects income per
capita (Mankiw, Romer & Weil, 1992, p.418). Temple (1999, p.137) defines investment in
physical capital as one of the proximate sources of growth in addition to investment in human
capital and research and development. He also argues that the correlation between investment
rates and growth is robust. Positive impacts of investment on economic growth are observed in
Barro (1995, p.6), Barro & Sala-i-Martin (2004, p.532), and Mankiw, Romer and Weil (1992,
p.420) among others. In this study investment is expected to have a positive effect on growth.
Government consumption proxies for government expenses that, although they do not have a
direct effect on productivity, distort private decisions, thus an increase in government
consumption will negatively affect the growth rate of output per worker (Barro & Sala-i-Martin,
2004, p.519). Barro and Sala-i-Martin (1995, p.434) also argue that government consumption
proxies for political corruption and other undesirable government aspects, as well as for direct
effects of nonproductive public expenditures and taxation. An important issue regarding the use
of government consumption as a control variable involves controlling for the effect of taxes on
growth. Barro and Sala-i-Martin (2004, p.519) discuss about directly controlling for the effect of
taxes and blame inadequate data on public finance. Bassanini and Scarpetta (2001) argue that
government consumption represents the size of government whenever taxes are not controlled
for. Barro and Sala-i-Martin (1995, p.434; 1996, p. 526) find negative and significant
relationships between government consumption and economic growth. In this study government
proxies for the size of government and is expected to have a negative effect on growth.
Inflation can be used to proxy for macroeconomic stability (Barro & Sala-i-Martin, 2004, p.520).
Romer (2006, p.550) argues that one of the potential additional costs of inflation is that high
variability of inflation can depress long term investment since this can be regarded as a signal of
government malfunctioning that can result in government policies that hurt capital holders.
13
Temple (1999, p.144) states that the presence of high inflation is accompanied by the presence of
exchange rate volatility, political instability and other undesirable factors. Bruno and Easterly
(1998); Cukierman, Kalaitzidakis, Summers and Webb (1993); and Fischer (1993) find negative
relationships between inflation and investment, and between inflation and growth. Even though
these studies give evidence of a negative relation between inflation and growth, there is little
evidence on a causal relationship (Romer, 2006, p.250). Additionally, Temple (1999, p.144)
states that the association between inflation and growth is controversial. In this study inflation is
expected to have a negative impact on growth.
The Data
The data set used covers 14 Latin American countries over the period 1975-2000 which is
subdivided into five overlapping five-year periods4. The dependent variable is the growth rate of
real GDP per worker during a five-year period, and is calculated by running a least squares
regression of the log of the real GDP series on a constant and a time trend. The rate of growth is
the computed as , where is the estimate on the time trend. The data for this variable
is obtained from Penn World Table version 6.2.
The series for capital stock per worker is constructed using the perpetual inventory method5. The
growth rate of this variable over a five-year period is also computed using the least squares
method. The remittance variable refers to workers’ remittances, compensation of employees, and
migrants’ transfers, and is obtained from the World Development Indicators CD-ROM (2005).
Workers’ remittances are private transfers from migrant workers who reside in the host country
for more than a year to people in their home country; compensation of employees is the income
of migrants who have lived in the host country for less than a year; and migrant transfers are
transfers from one country to another at the time of migration of the net worth of migrants who
live in the host country for more than a year. This is the definition frequently used in the
literature (Acosta et al., 2006; Catrinescu et al., 2006; among others) and adopted by the IMF
(2005, p.97) and the World Bank (2006, p. 85). Remittances are expressed as a share of GDP.
4 The first period for the remittance variable is represented by observations on the years 1979 and 1980 because of
data limitations. 5 It is described in the appendix.

14
The level of human capital stock is represented by an index as in Collins and Bosworth (1996,
p.151). The index is constructed based on data on educational attainment of the total population
aged 15 and over from the Barro and Lee (2000) data set and the social returns to schooling for
each educational level. For country the index is given by
.
The index weights the share of the population with education level by which is the social
return to education estimate. The education levels are as follows: no schooling; incomplete
primary education; complete primary education; incomplete secondary education; complete
secondary education; incomplete tertiary education; and complete tertiary education. The social
return to education estimates are those of Psacharopoulos (1994) and are obtained from Loayza,
Fajnzylber and Calderón (2004, appendix A), these estimates are for no education = 1,
incomplete primary education = 1.68, complete primary education = 2.69, incomplete secondary
education = 3.91, complete secondary education = 5.53, incomplete college education = 5.87,
and complete college education = 8.80. The growth rate of the human capital index is the
exponential growth rate given by , where and are the last and initial
observation in each five-year overlapping period, is the number of periods, and is the
natural logarithm operator.
The data on government consumption and investment both as a share of GDP is obtained from
Penn World Table version 6.2. The data on inflation is from the International Financial Statistics
CD-ROM (2007). Complete definitions and data sources are provided in Table1. Descriptive
statistics are provided in Table 2.
Empirical Results
The purpose of the empirical analysis is to estimate the impact of remittances through human
capital on growth. Specifically, we examine the effect of the interaction between human capital
and remittances on growth rates of output per worker through the growth rate of TFP.

15
The results indicate that remittances have a positive impact on economic growth, though the
realization of this impact depends upon the level of human capital stock in the economy. This
means that for countries with low levels of human capital stock, remittances have a negative
impact on growth. In addition, the coefficient on the level of human capital stock is positive and
significant. The regressions are based on panel data for the period 1975-2000, and the methods
of estimation are pooled OLS, random effects, and random effects 2SLS. These regressions are
run using data from a sample of 14 Latin American and the Caribbean countries and 70
observations.
Table 3 reports the results on the association between economic growth and remittances, human
capital and the control variables. The standard growth determinants behave as follows. The
growth rate of the physical capital stock per worker is positively and significantly related to
economic growth. The growth rate of total human capital in the labor force is positive though not
significant. Government consumption as a share of GDP has the expected negative sign, but it is
insignificant. Inflation is negative and insignificant. Investment as share of GDP, surprisingly, is
negatively related to economic growth though not at a significant level. The results regarding the
association between human capital and remittances and economic growth are quite interesting.
The pooled OLS results indicate that the coefficient on remittances is negative but insignificant,
while the coefficient on the interaction between remittances and human capital is positive though
insignificant. The usual random effects estimation reports the same qualitative results as those
obtained with the pooled OLS; however, and interestingly, the interaction between remittances
and human capital is positive and significant at the 10% level6.
A potential problem with the estimates of model 2 is that they may be biased because of reverse
causality, measurement error and omitted variables. Reverse causality implies that improved
economic conditions due to increases in economic growth may increase remittance inflows.
Measurement error in remittances may arise because official recorded remittances are smaller
than the true size of remittances. The World Bank (2006, p. 85) states that because of unrecorded
remittance flows through both formal and informal channels the true size of remittances may be
50% greater than recorded remittances. Omitted factors may affect both remittances and
economic growth, which leads to biased estimates on remittances and the interaction between
6 P-value is 0.087.

16
human capital and remittances. Therefore, to address this problem, use of the instrumental
variable technique is required. Catrinescu et al. (2006) argue that contradictory results on the
relationship between remittances and economic growth have been found because of lack of
correct control of endogeneity of remittances. To manage the endogeneity problem of
remittances a random effects 2SLS (EC2SLS) model is estimated following Baltagi (2005,
chapter 7).
Model 3 in Table 3 is based on EC2SLS estimation. The instruments used are the first lag of
investment as a share of GDP, the second lag of real per capita GDP, the first lag of the human
capital index, two indexes based on economic conditions in the U.S., and an instrument based on
the per capita GDP of the top-eight migrant receiving countries. Rapoport and Docquier (2005,
p.10) argue that empirical models that explain remittances include income of both the sender and
the receiver countries as explanatory variables. Lueth and Ruiz-Arranz (2006) find a significant
effect of per capita GDP of the receiver country on remittances, while Ziesemer (2006) finds a
significant effect of the second lag of per capita GDP of the receiver country on remittances.
Following Ziesemer (2006) we include the second lag of per capita GDP of the receiver country
as an instrument which proxies for economic conditions in the remittance receiving country.
Vargas-Silva and Huang’s (2006) study on the effects of both host and home country economic
conditions on remittances includes two indices of the economic conditions in the rest of the
world (ROW)7 in the set of explanatory variables that explain U.S. net aggregate remittances.
Their results suggest that host country (U.S.) economic conditions are significant in explaining
remittances. To construct the indices, they weight the CPI and exchange rate from each of the
five countries in the ROW by the share of remittances of each country in the total amount of
remittances of the group (see Vargas-Silva and Huang, 2006, p. 89-90). We do the opposite of
Vargas-Silva and Huang (2006); we construct two indexes based on the economic conditions of
the U.S., one based on the U.S. CPI and the other based on the U.S. unemployment rate8. We
weight each five-year overlapping average of the U.S. CPI and the U.S. unemployment rate by
the share of remittances of each LAC country in the total amount of remittances received by the
group of 14 LAC countries during the period of the study. The other instrument which is based
7 ROW represents Brazil, Colombia, Dominican Republic, El Salvador and Mexico.
8 Adams and Page (2005) consider the US as one of the two main labor receiving countries.
17
on the economic conditions of the top-eight migrant receiving countries9 is adopted from Acosta
et al. (2007). The per capita GDP of each of these migrant receiving countries is weighted by the
inverse of the distance of each of these countries to each LAC country. The validity of the
instruments is a key issue for the consistency of the instrumental variable estimator, for that
purpose we report the Sargan test of overidentifying restrictions in Table 3; we fail to reject the
null hypothesis that the instruments are uncorrelated with the error process. The Hausman test
for random effects appropriateness of models 2 and 3 is also reported in Table 3; it justifies the
use of random effects estimation.
Model 3 is the main model in this study. Note that this model includes remittances and the level
of human capital stock individually, so the significance of the interaction term can not be the
result of the omission of any of these two factors. In model 3 the coefficient on remittances is
negative and significant. However, and interestingly, the coefficient on the interaction between
human capital and remittances is positive and significant10
and suggests that remittances have a
positive impact on growth, but only for certain levels of the human capital index. In addition, the
coefficient on the level of human capital stock is positive and significant. The values of the
coefficients on remittances and on the interaction term in model 3 indicate that countries with an
index value of total human capital greater than 0.95 will benefit from the positive effect of
remittances on growth. In our sample, the average value of the human capital index for eight out
of the 14 countries is greater than 0.95, so these countries pass this threshold11
; conversely,
remittances have a negative predicted effect on six out of the 14 LAC countries12
.
The positive effect of an increase in remittances on growth is dependent upon the level of the
human capital stock in the economy. An increase in remittances as a share of GDP of 0.026 (one
standard deviation) which is an increase of 130% relative to the sample mean in an economy
with a index of human capital stock of 0.98 (the sample average) increases the growth rate of
output per worker by 0.2%. If the same increase in remittances happens in an economy that has a
value for the human capital index of 1.39 (as in the case of Panama), the maximum value in the
9 Canada, France, Germany, India, Saudi Arabia, Spain, United Kingdom, and United States are the top migrant
receiving countries for our sample of LAC countries. Acosta et al. (2007) have ten countries as the top migrant
receiving countries. 10
P-value is 0.067. 11
Barbados, Colombia, Costa Rica, Jamaica, Mexico, Panama, Paraguay, and Trinidad and Tobago pass the
threshold. 12
Bolivia, Brazil, Dominican Republic, El Salvador, Guatemala, and Honduras do not pass the threshold.

18
sample, then the rate of growth increases by 2.5%. An example gives a better picture of the effect
of remittances on growth. The average of the human capital index in Guatemala during the
period 1975 to 2000 is 0.63, well below the threshold of 0.95. If remittances increase by one
standard deviation, the growth rate decreases by -1.8%. However, if Guatemala’s human capital
stock increases to the sample mean value, 0.98, growth increases by 0.2%, and if the increase is
to the level of the human capital stock of Panama, 1.23, the maximum average value during the
period of the study, Guatemala’s growth increases by 1.6%. Looking at the values of the human
capital index for the year 1995, ten out of the 14 countries in the sample pass the threshold of
0.9513
; the average value of the index for this year is 1.04. This means that an increase in
remittances of one standard deviation, a 130% increase, in a country with an index value of 1.04
for human capital stock increases growth in the remittance receiving country by 0.5%. This result
is in the range of 0.5% and 1.3% increase in the growth rate due to a 100% increase in
remittances as a share of GDP found by Acosta et al. (2007, p.94). They argue that the increase
in the growth rate due to increases in remittances hold for the representative country in the world
as well as for the representative country from the LAC region. Thus, our result is in line with that
of Acosta et al. (2007). If we allow for a 100% increase in remittances and take the 1.04 value of
the human capital index in 1995, the increase in the growth rate is 0.4% which is very close to
the lower value of Acosta et al. (2007). On the whole, taking the average value for the human
capital index, an increase in remittances has a positive impact on growth in the countries of the
LAC region.
The interesting point about the results from Table 3 is the significant complementary effect
between human capital and remittances on the growth of output per worker. Remittances seem to
promote economic growth depending upon the level of the human capital stock in the economy.
This implies that human capital is an important factor in determining the utilization of
remittances and their effect on economic growth. Koechlin and Léon (2006, p.25) find that the
interaction between education and remittances (a negative coefficient) significantly contributes
to decrease income inequality. They suggest that it is likely that families with a relatively high
educational level use remittances for productive investments which increase long-term income.
A strong complementary effect between human capital and FDI on growth is found in
13
Barbados, Bolivia, Colombia, Costa Rica, Dominican Republic, Jamaica, Mexico, Panama, Paraguay and Trinidad
and Tobago.

19
Borensztein et al. (1998). They interpret their result in that the advanced technology embedded in
FDI can promote economic growth only through the interaction with the countries’ absorptive
capacity, which is dependent upon human capital. They find a threshold for the stock of human
capital from which FDI starts having a positive effect on economic growth. In our study, it seems
that the absorptive capacity of the country is also conditioning the positive effect of remittances
on economic growth. Thus, it may be that countries with relatively higher human capital levels
use remittances for investment in education, which fosters human capital development and in
productive economic projects that promote investment which increases long-term growth.
Benhabib and Spiegel (1994, p. 165) finds that human capital has a positive and significant effect
in attracting physical capital. Giuliano and Ruiz-Arranz (2006) suggests positive effect of
remittances on economic growth because remittances finance investment in countries with less
developed financial systems. Aggarwal, Demirgü -Kunt and Martinez Peria (2006) find a
positive impact of remittances on the financial sector and argue that that is a channel for
remittances to promote development. On the other hand, the negative coefficient on remittances
implies that remittances make a negative contribution to growth in countries with low level of
human capital. This may be the case as in Chami et al. (2003) who argue that remittances are
compensatory transfers based on an altruistic relationship between the migrant and her/his
family, so remittances are a source of money that helps the family to overcome economic
problems.
Conclusions
This paper contributes to the body of literature regarding the impact of remittances on economic
growth by investigating on the impact of remittances through human capital on growth in a
group of countries from Latin America and the Caribbean for the period 1975-2000. An
endogenous model of growth based on cross-country growth accounting methods is estimated
using pooled OLS, random effects and random effects 2SLS techniques. The main results come
from the random effects 2SLS estimation because it is the econometric method that allows for
controlling endogeneity of remittances in the panel data setting.
The empirical results of this study are in line with Rapoport and Docquier’s (2005) models
examining the contributions of remittances to investment in both physical and human capital, as

20
well as with the other studies that find contributions of remittances to economic growth. The
results show a significant and complementary effect between human capital and remittances on
the growth rate of output per worker. In addition, the level of human capital stock positively and
significantly affects the growth rate of TFP which is in line with endogenous growth theory as in
Romer (1990b, p. 270) who argues that the human capital level may affect the growth of
technology directly and through the catching up process (a human capital interaction term), and
as in Benhabib and Spiegel (1994) who find positive effects of human capital on growth while
modeling TFP as dependent on human capital.
An important finding of this study is the significant and complementary effect between human
capital and remittances on economic growth. That is, the effect of remittances on growth is
dependent upon the level of human capital stock in the remittance receiving economy. After
instrumenting for the possible endogeneity of remittances, an increase in remittances as a share
of GDP of 130% (one standard deviation) relative to the sample mean in a LAC economy with
an index of human capital stock of 0.98 (the sample average) would lead, on average, to a 0.2%
increase in the growth rate of output per worker. It is likely that countries with higher
educational levels use remittances for investment in education which foster human capital
development and for investment in productive projects such as small businesses which
contributes to long term growth. Therefore, remittances promote growth in the representative
country of the LAC region through human capital. It would be interesting to assess the impact of
remittances on growth through human capital using a larger sample of countries as well as for
other developing regions of the world. In addition, the effects of remittances on the level of
human capital could be explored.
Acknowledgement
We thank Jose De Gregorio from the Central Bank of Chile and Harald Badinger from the
University of Economics and Business Administration, Vienna for their helpful comments.

21
References
Acosta, C., Calderón, C., Fajnzylber, P., & López, H. (2006). Remittances and development in
Latin America. The World Economy, 957-987.
Acosta, C., Calderón, C., Fajnzylber, P., & López, H. (2007). What is the impact of international
remittances on poverty and inequality in Latin America? World Development, 36(1), 89-
114.
Aggarwal, R., Demirgü -Kunt, A., & Martinez Peria, M. (2006). Do workers’ remittances
promote financial development? World Bank Policy Research Working Paper 3957.
Washington, D.C.
Balasubramanyam, V. N., Salisu, M., & Sapsford, D. (1999). Foreign direct investment as an
engine of growth. The Journal of International Trade & Economic Development, 8(1),
27-40.
Baltagi., B. (2005). Econometric analysis of panel data. 3rd edition. England: John Wiley &
Sons Ltd.
Barro, L., & Lee, J-W. (2000). International data on educational attainment: Updates and
implications. Center for International Development at Harvard University Working Paper
42.
Barro, R., & Sala-i-Martin, X. (1995). Economic growth. 1st edition. U.S.A.: McGraw-Hill, Inc.
Barro, R., & Sala-i-Martin, X. (2004). Economic growth. 2nd edition. Cambridge, MA, U.S.A:
MIT Press.
Bassanini, A., & Scarpetta, S. (2001). The driving forces of economic growth: Panel data
evidence for the OECD countries. OCDE Economic Studies, 33, II.
Benhabib, S., & Spiegel, M. (1994). The role of human capital in economic development
evidence from aggregate cross-country data. Journal of Monetary Economics, 34, 143-
173.
Böhning, W. (1975). Some thoughts on emigration from the Mediterranean Basin. International
Labor Review, 111(3), 251-277
Bruno, M., & Easterly, W. (1998). Inflation crises and long rung growth. Journal of Monetary
Economics, 41, 3-26.
Catrinescu, N., Leon-Ledesma, M., Piracha, M., & Quillin, B. (2006). Remittances, institutions
and economic growth. IZA Discussion Paper No. 2139. Bonn, Germany.
Chami, R., Fullenkamp, C., & Jahjah, S. (2003). Are immigrant remittance flows a source of
capital for development? IMF Working Paper. Washington, DC.
Collins, S., & Bosworth, B. (1996). Economic growth in East Asia: Accumulation versus
assimilation. Brookings Papers and Economic Activity, 2, 135-203.

22
Cox Edwards, A., & Ureta, M. (2003). International migration, remittances, and schooling:
evidence from El Salvador. Journal of Development Economics, 72, 429-461.
Cukierman, A., Kalaitzidakis, P., Summers, L., & Webb, S. (1993). Central bank independence,
growth, investment, and real states. Carnegie-Rochester Coference Series on Public
Policy, 39, 95-140.
De Gregorio, J. (1992). Economic growth in Latin America. Journal of Development Economics,
39, 59-84.
Easterly, W. & Levine, R. (2001). It’s not factor accumulation: Stylized facts and growth
models. Unpublished paper.
Eller, M., Haiss, P., & Steiner, K. (2006). Foreign direct investment in the financial sector and
economic growth in Central and Eastern Europe: The crucial role of the efficiency
channel. Emerging Markets Review, 7, 300-319.
Fischer, S. (1993). The role of macroeconomics factors in growth. Journal of Monetary
Economics 32, 485-512.
Giuliano, P., & Ruiz-Arranz. (2006). Remittances, financial development, and growth. IZA
Discussion Paper Series 2160. Bonn, Germany.
Glytsos, N. P. (2005). The contribution of remittances to growth, A dynamic approach and
empirical analysis. Journal of Economic Studies, 32(6), 468-496.
Griffin, K. (1976). On the emigration of the peasantry. World Development, 4(5), 353-361.
Hanson, G., & Woodruff, C. (2003). Emigration and education attainment in Mexico.
Unpublished paper, University of California at San Diego.
Heston, A., Summers, R., and Aten, B. Penn World Table Version 6.2. Center for International
Comparisons of production, income and prices at the University of Pennsylvania,
September 2006.
International Monetary Fund (IMF). (2005). World Economic Outlook: April 2005. Washington,
DC: IMF.
Koechlin, V., & Leon, G. (2006). International remittances and income inequality: An empirical
investigation. Inter-American Development Bank Working Paper 571. Washington, D.C.
Li, X., & Liu, X. (2005). Foreign direct investment and economic growth: An increasing
endogenous relationship. World Development, 33(3), 393-407.
Loayza, N., Fajnzylber, P., & Calderón, C. Economic growth in Latin America and the
Caribbean: Stylized facts, explanations, and forecasts. Central Bank of Chile Working
Paper 165. Santiago, Chile.
López-Córdova, Ernesto. (2006). Globalization, migration and development: The role of
Mexican migrant remittances. Intal-ITD Working Paper 20. Buenos Aires, Argentina.

23
Lueth E., & Ruiz-Arranz, M. (2006). A gravity model of worker’s remittances. IMF Working
Paper. Washington, D.C.
Makki, S. S., & Somwaru, A. (2004). Impact of foreign direct investment and trade on economic
growth: Evidence from developing countries. American Journal of Agricultural
Economics, 86(3), 795-801.
Mankiw, N., Romer, D., & Weil, D. (1992). A contribution to the empirics of economic growth.
The Quarterly Journal of Economics, 107, 407-437.
Massey, D., & Parrado, E. (1998). International migration and business formation in Mexico.
Social Science Quarterly, 79(1), 1-20.
Nelson, R., & Phelps, E. (1966). Investment in humans, technological diffusion, and economic
growth. The American Economic Review, 56(1/2), 69-75.
Psacharapoulos, G. (1994). Returns to investment in education: A global update. World
Development, 22(9), 1325-1343.
Rempel, H., & Lobdell, R. (1978). The role of urban-to-rural remittances in rural development.
Journal of Development Studies, 14, 324-341.
Rapoport, H., & Docquier F. (2005). The economics of migrants’ remittances. IZA Discussion
Paper 2139. Bonn, Germany.
Romer, D. (2006). Advanced macroeconomics. 3rd ed. New York: McGraw-Hill/Irwin.
Romer, P. (1990a). Endogenous Technological Change. Journal of Political Economy, 98, S71-
S102.
Romer, P. (1990b). Human capital and growth: Theory and evidence. Carnegie-Rochester
Coference Series on Public Policy, 32, 251-286.
Temple, J. (1999). The new growth evidence. Journal of Economic Literature, 37, 112-156.
Xu, B. (2000). Multinational enterprises, technology diffusion, and host country productivity
growth. Journal of Development Economics, 62, 477-493.
Vargas-Silva, C., & Huang, P. (2006). Macroeconomic determinants of worker’s remittances:
Host versus home country’s economic conditions. Journal of International Trade and
Economic Development, 15(1), 81-99.
Woodruff, C., & Zenteno, R. (2001). Remittances and Microenterprises in Mexico. Unpublished
paper, University of California at San Diego.
World Bank. (2006). Global Economic Prospects 2006. Washington, DC: World Bank.
World Bank. (2007). Global Development Finance 2006. Washington, DC: World Bank.

24
Ziesemer, T. (2006). Worker remittances and growth: The physical and human capital channels.
UNU-MERIT Working Paper Series No. 2006-020. The Netherlands: United Nations
University.

25
Appendix 1. Perpetual Inventory Method
The perpetual inventory method (PIM) is used to compute the capital stock series. In order to
compute the initial capital stock values, we follow the procedure outlined in Easterly and Levine
(2001, p. 55-56). The data used is in constant 2000 prices and obtained from the Penn World
Tables (PWT) version 6.2. This data is available since 1950 for most of the countries. The PIM is
based on the capital accumulation equation , where is real capital stock
in period t, is gross investment in period t, and is the depreciation rate assumed to be 0.07. In
order to use the capital accumulation equation we need to estimate the initial capital stock . To
estimate the initial capital stock, we assume that the country is at the steady state capital output
ratio , where and are initial capital and output respectively. At the steady state ,
g is the growth rate of real output, and . From the capital accumulation equation and the
steady state assumption, define the capital output ratio as . The next step is to
compute values for , and . Thus, is the average of the investment rate during the first ten
years of available data for each country. The investment rate which is the ratio of Investment to
real GDP is taken from PWT version 6.2. The growth rate of output is computed by applying
the least squares growth rate method during the first ten years of data on the log of real GDP per
capita chain. Real GDP per capita chain is taken from PWT version 6.2. Now that we have the
values for , and we can compute for each country, and since we
also need to compute initial output . Initial is given by the average of real GDP chain for the
years 1950-1952. Real GDP chain is from PWT version 6.2. Now we are able to estimate the
initial capital stock for the year 1950, which is given as . Once we have
estimated the initial capital stock, we input it into the capital accumulation equation to get the
next year (1951) capital stock value, and next values are generated in a similar way. To compute
capital stocks per worker, we divide each year’s capital stock value by the number of workers.
We compute workers by dividing real GDP chain by real GDP per worker; this data is also from
PWT version 6.2.

26
Table 1. Variable Definitions and Data Sources
Variable name Variable definitions Source
Growth Five-year average growth rate of real
GDP per worker.
Own calculations.
Capital growth Five-year average growth rate of real
capital per worker.
Own calculations.
Human capital
growth
Five-year growth rate of the human
capital index.
Own calculations.
Remittances Log of five-year average of remittances as
a share of GDP.
World Development
Indicators CD-ROM,
World Bank 2005.
Human capital Log of human capital index. Own calculations.
Human capital *
remittances
Interaction of the log of human capital
index and log of remittances.
Own calculations.
Investment Investment as a share of GDP in 2000
constant prices.
Penn World Tables version
6.2 (2006).
Government Government as a share of GDP in 2000
constant prices.
Penn World Tables version
6.2 (2006).
Inflation Log of 1 plus the five-year average of the
proportionate change of GDP deflator.
GDP deflator is from the
International Financial
Statistics CD-ROM, IMF
2007.
U.S. CPI index Five-year average of the U.S. CPI
weighted by each LAC country remittance
share. * U.S. CPI, = remittance
total value over the period 1979-2000 for
each LAC country divided by the
remittance total that results from adding
the total of each LAC country over the
period 1979-2000.
U.S. CPI is from the
International Financial
Statistics CD-ROM, IMF
2007.
U.S. unemployment
index
Five-year average of the U.S.
unemployment rate weighted by each
LAC country remittance share. * U.S.
unemployment rate, is the same as in
the U.S. CPI index.
U.S. unemployment rate is
from the International
Financial Statistics CD-
ROM, IMF 2007.
Education
Educational attainment of the population
aged 15 and over.
Barro and Lee (2000) data
set downloaded at
www.cid.harvard.edu/cidda
ta/ciddata.html.
Return to schooling Social returns to schooling for each
educational level.
Loayza, Fajnzylber and
Calderón (2004, appendix
A).
GDP per worker Real GDP chain per worker in 2000
constant prices.
Penn World Tables version
6.2 (2006).

27
Table 2. Summary statistics, five-year averages for the period 1975-2000
Variable Obs Mean Std. dev. Min Max
GDP growth 70 0.00384 0.02343 -0.05590 0.07475
Physical capital growth 70 0.00996 0.02830 -0.03669 0.09546
Human capital growth 70 0.00999 0.01279 -0.05245 0.04633
Investment 70 0.12510 0.05240 0.03638 0.28150
Remittances 70 -4.84298 1.59854 -8.17641 -2.17830
Human capital stock 70 0.98334 0.18392 0.59580 1.38871
Government 70 0.17807 0.04470 0.10403 0.28408
Inflation 70 0.31816 0.65444 0.01225 3.30528
Rem/GDP 70 0.02002 0.02573 0.00028 0.11323 Note: Rem/GDP is remittances as a share of GDP, while remittances are the log of Rem/GDP.

28
Table 3. Remittances, human capital and GDP per worker growth (Cross-country growth
accounting, panel data of five-year overlapping periods (1975-2000)
Dependent variable: Growth rate of GDP per
worker
Explanatory variables Model 1 Model 2 Model 3
constant -0.0400 -0.0400 -0.1819*
(1.13) (1.13) (1.70)
physical capital growth 0.3354** 0.3354** 0.3693***
(2.19) (2.19) (2.63)
human capital growth 0.2225 0.2225 0.1800
(1.12) (1.12) (0.86)
remittances -0.0098 -0.0098 -0.0395*
(1.57)
[0.141]
(1.57)
[0.117]
(1.79)
[0.074]
human capital stock 0.0619* 0.0619* 0.2112*
(1.95)
[0.073]
(1.95)
[0.051]
(1.93)
[0.054]
human capital stock * remittances 0.0102 0.0102* 0.0415*
(1.71)
[0.111]
(1.71)
[0.087]
(1.83)
[0.067]
investment -0.0810 -0.0810 -0.0803
(1.45) (1.45) (1.16)
government -0.0087 -0.0087 -0.0334
(0.16) (0.16) (0.43)
inflation -0.0002 -0.0002 -0.0011
(0.12) (0.12) (0.23)
d8085 -0.0311** -0.0311*** -0.0283***
(2.66) (2.66) (3.16)
d8590 -0.0106 -0.0106 -0.0054
(0.81) (0.81) (0.51)
d9095 -0.0047 -0.0047 -0.0006
(0.47) (0.47) (0.06)
d9500 -0.0051 -0.0051 -0.0029
(0.73) (0.73) (0.30)
R-squared 0.4526 0.4526 0.3836
Observations 70 70 70
Countries 14 14 14
Hausman test for random effects
6.06 3.59
P-value for Hausman test
0.9131 0.9897
Sargan test for overidentifying restrictions
2.747
P-value for Sargan test
0.6010
Asterisks indicate significance at the 10% (*), 5% (**) and 1% (***) levels respectively. Model 1 is pooled OLS
with fully robust standard errors. Model 2 is the usual random effects model with fully robust standard errors.
Values in parenthesis are t-values, while values in brackets are p-values for the variables of interest.

29
Figure 1. Remittance inflows to developing country regions, 1970-2006
Source: own calculations using data from the World Bank. The data is available at
www.Worldbank.org/prospects/migrationandremittances.
Figure 2. Top-twenty recipients of remittances, 1990-2003
Source: IMF, Balance of Payments Statistics Yearbook; and IMF staff calculations.
0
10
20
30
40
50
60
70
70 72 74 76 78 80 82 84 86 88 90 92 94 96 98 00 02 04 06
bil
lions
of
US
doll
ars
year
EAP
ECA
LAC
MNA
SAS
SSA

30
Figure 3. Remittances, FDI and ODA inflows to Latin America and the Caribbean, 1970-2006
Source: own calculations using data from the World Development Indicators online version 2007.
Figure 4. Remittances, FDI and ODA inflows to Latin America and the Caribbean, 1970-2006
Source: own calculations using data from the World Development Indicators online version 2007.
0
10
20
30
40
50
60
70
80
90
100
70 72 74 76 78 80 82 84 86 88 90 92 94 96 98 00 02 04 06
bil
lions
of
US
doll
ars
year
FDI
REM
ODA
0
1
2
3
4
5
6
70 72 74 76 78 80 82 84 86 88 90 92 94 96 98 00 02 04 06
per
cent
of
gdp
year
FDI
REM
ODA

31
Figure 5. Remittances, FDI and ODA inflows as percent of GDP to LAC, 1979-2000
Source: own calculations using data from the World Development Indicators CD-ROM version 2005.
0
0.02
0.04
0.06
0.08
0.1
0.12
7980 8085 8590 9095 9500
per
cent
of
gdp
period average
Panel A
BRB
DOM
SLV
GTM
HND
JAM
PRY
0
0.005
0.01
0.015
0.02
0.025
0.03
0.035
7980 8085 8590 9095 9500
per
cent
of
gdp
period average
Panel B
BOL
BRA
COL
CRI
MEX
PAN
TTO
32
Figure 6. Remittances, FDI and ODA inflows in billions of U.S. dollars to LAC, 1979-2000
Source: own calculations using data from the World Development Indicators CD-ROM version 2005.
0
1
2
3
4
5
6
7
7980 8085 8590 9095 9500
bil
lions
of
US
doll
ars
period average
Panel A
BRA
COL
DOM
SLV
GTM
JAM
MEX
0
0.05
0.1
0.15
0.2
0.25
0.3
7980 8085 8590 9095 9500
bil
lions
of
US
doll
ars
period average
Panel B
BRB
BOL
CRI
HND
PAN
PRY
TTO