Distant but close: The Impact of Immigrant Remittances on Latin America Manuel Orozco,...
156
The Impact of Immigrant The Impact of Immigrant Remittances on Latin Remittances on Latin America America Manuel Orozco, Manuel Orozco, Inter-American Dialogue Inter-American Dialogue May 30 May 30 th th 2005 2005
-
date post
21-Dec-2015 -
Category
Documents
-
view
217 -
download
3
Transcript of Distant but close: The Impact of Immigrant Remittances on Latin America Manuel Orozco,...

Distant but close:Distant but close:The Impact of Immigrant The Impact of Immigrant Remittances on Latin Remittances on Latin AmericaAmerica
Manuel Orozco, Manuel Orozco,
Inter-American DialogueInter-American Dialogue
May 30May 30thth 2005 2005

The Geography of migration and The Geography of migration and remittances: distant proximities remittances: distant proximities
through transnationalismthrough transnationalism
AsiaJapanHong Kong
PhilippinesChinaIndiaSingaporeVietnamThailandMalaysia
AfricaSouth AfricaCongoGhana
MoroccoMalawiEthiopiaMozambiqueLesothoSwaziland
AmericaUnited StatesCanadaBrazil
MexicoEl SalvadorDom. Rep.EcuadorJamaicaCubaColombiaParaguayVenezuelaHaiti
EuropeFranceU.K.GermanyItalyBelgium
SpainTurkeyAlbaniaArmeniaGreecePortugal
OceaniaAustraliaNew Zealand
Middle EastUnited Arab Em.Saudi ArabiaKuwait
JordanEgypt

GDP: (X-M) + I + G + C
-DOMESTIC SAVINGS - INVESTMENT-FOREIGN SAVINGS - INVESTMENT
-FDI: Transnational capital, migrant capital investment-TECHNOLOGY TRANSFER-UNILATERAL TRANSFERS
-ODA- BILATERAL & MULTILATERAL-PRIVATE DONATIONS
FOUNDATIONS, PPOs, HTAs-WORKER REMITTANCES
-Maquila, Tourism, Non-traditional exports-Transportation, Telecommunication, Nostalgic Trade
The national income equation in Latin America: a The national income equation in Latin America: a rent seeking and courtesan state?rent seeking and courtesan state?

Immigrant economic practices (annual expenses)
ConsumptionDonationsFamily remittancesCapital investment
Household economy (US$270)
Community(US$10,000 year)
Trade and services retail(US$3,000) Property
and other I(US$5,000)

Main remittance recipient countries worldwideMain remittance recipient countries worldwide
$0.00 $2,000,000,000.00 $4,000,000,000.00 $6,000,000,000.00 $8,000,000,000.00 $10,000,000,000.00 $12,000,000,000.00
India
Mexico
Philippines
Brazil
Morocco
Egypt, Arab Rep.
Turkey
El Salvador
Bangladesh
J ordan
Dominican Republic
Colombia
Yugoslavia, Fed. Rep.
Yemen, Rep.
Ecuador
Cuba
Sri Lanka
Pakistan
Indonesia
J amaica
Haiti
Albania
Croatia
Nicaragua
Guyana
Cape Verde
Tonga
Belize

Remittances per capita (2001)Remittances per capita (2001)
522363
360299
213
194176
169159
157134
130112110
106100
90
8581
60
4641
41
14
11
8
75
$0 $100 $200 $300 $400 $500 $600
Tonga
J amaica
J ordan
El Salvador
Dominican Republic
Albania
Cape Verde
Belize
Yugoslavia, Fed. Rep.
Guyana
Nicaragua
Croatia
Morocco
Ecuador
Cuba
Haiti
Mexico
Yemen, Rep.
Philippines
Sri Lanka
Egypt, Arab Rep.
Colombia
Turkey
Bangladesh
India
Pakistan
Brazil
Indonesia

The Latin American The Latin American contextcontext
The level of engagementThe level of engagement
The 5TsThe 5Ts

Remittances to Latin America and the Remittances to Latin America and the Caribbean by Region (%)Caribbean by Region (%)
Caribbean, $6,248, 14%
Central America, $7,791, 17%
Mexico, $16,613, 37%
South America, $14,629, 32%
US$ 45.2 billion
Annual Remittances to Selected Caribbean Countries
$0.00
$0.50
$1.00
$1.50
$2.00
$2.50
$3.00
1980 1981 1982 1983 1984 1985 1986 1987 1988 1989 1990 1991 1992 1993 1994 1995 1996 1997 1998 1999 2000 2001 2002 2003 2004
U.S. Billions
Dominican Rep.
Jamaica
Cuba
Haiti
Guyana
Trinidad and Tobago
Source: Central Bank of each country. Estimates for Cuba and Haiti

Commitment to families . . .Commitment to families . . .Average amount sent and number of remittance dependents
166.73
189.02
235.48
150
160
170
180
190
200
210
220
230
240
One to two Three to four Five or more

Length of Commitment . . .Length of Commitment . . .Average amount sent and length of time living in U.S.Average amount sent and length of time living in U.S.
140
240
340
440
540
640
740
840
940
Less than one year One to three Four to six Seven to nine Over ten
Jamaica Guyana Other Latin Americans
130
150
170
190
210
230
250
270
290
Less than one year One to three Four to six Seven to nine Over ten
Dominican Cuba Other Latin Americans

Percent of remittance senders who . . .Percent of remittance senders who . . .
55
5
9
3
62
22
38
61
5
55
20
20
12
58
38
36
73
1
63
33
43
40
16
66
54
67
75
21
52
46
37
19
26
77
39
41
48
16
52
16
21
6
3
47
21
59
60
12
63
Is a U.S. Citizen
Earns over US$35,000
Have completed theUniversity
Belong to an HTA
Have a bank account
Have debit or credit cards
are 35 or younger
Household have 3 or lesspeople
Send more than 500
Are males
Other Latin America
Guyana
Jamaica
Cuba
Dominican Republi
Jamaicans: younger with formal education, Bank accounts, higher income and live in smaller households

Caribbean immigrant home country engagement Caribbean immigrant home country engagement seems greater than other Latin immigrants . . .seems greater than other Latin immigrants . . .
Percent of immigrant remitters who . . . D.R. Cuba Jamaica GuyanaOther
L.A.
Travel at least once a year 69 13 69 45 24
Spends more than one thousand dollars per stay 64 50 52 54 62
Call at least once a week 77 48 73 42 62
Buys home country goods 65 29 64 84 78
Helps family meet other financial needs 14 9 33 47 19
Helps family pay for mortgage loans 13 1 16 21 12
Has a mortgage loan in home country 6 2 15 18 10
Has a bank account in home country 29 2 58 48 22
Has a small family business in home country 3 2 2 8 3

Effects and trends in Effects and trends in home countryhome country
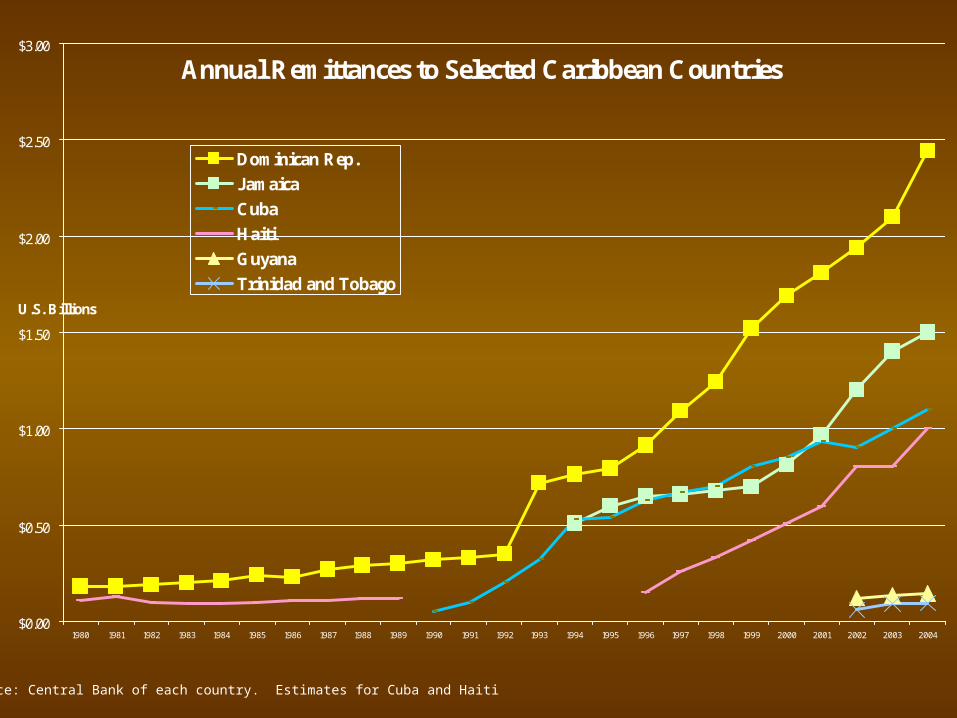
Distributive effect of remittancesDistributive effect of remittances
374
21712077 2059.25
1296
2104
1592
2037.666667
3.47
0.97
0.77
1.395
0
500
1000
1500
2000
2500
Haiti Jamaica Dominican Republic LAC
0
0.5
1
1.5
2
2.5
3
3.5
4GDP per capita
Average annual amount received
Ratio (right axis)

Remittance recipient householdsRemittance recipient households
0.00%
10.00%
20.00%
30.00%
40.00%
50.00%
60.00%
70.00%
México El Salvador Nicaragua R.D. Guyana Ecuador
UrbanaRural
Source: El Salvador, Honduras and Guatemala: Bendixen and Associates survey; Dominican Republic: Emmanuel Sylvestre & Associates survey (commissioned out by the author); Guyana: Laparkan Trading survey (commissioned out by the author); Ecuador: Mauricio Orbe (PulsoEcuador); Mexico: El Colegio de la Frontera Norte. “Problemas y Perspectivas de las Remesas de los Mexicanos y Centroamericanos en Estados Unidos,” El Colegio de la Frontera Norte: Departamento de Estudios Económicos. Mexico: 2002, p. 30.

Female remittance recipients (%)Female remittance recipients (%)
64
65
66
67
68
69
70
71
72
73
Female
REPUBLICA DOMINICANA GUYANA JAMAICA CUBA LAC average

Remittance recipient (relationship)Remittance recipient (relationship)
0
5
10
15
20
25
30
Spouse Children Parents Sibblings Other
REPUBLICA DOMINICANA CUBA GUYANA Total

Phone calls to selected Latin American countriesPhone calls to selected Latin American countries
0.7
0.3
0.5
0.6
0.7
0
200,000,000
400,000,000
600,000,000
800,000,000
1,000,000,000
1,200,000,000
El Salvador Guatemala Honduras Dominican Rep. Jamaica
0.0
0.1
0.2
0.3
0.4
0.5
0.6
0.7
0.8
Total minutes (2003 est.)
Household-to-household minutes (2003)
Ratio
Source: Encuesta de inmigrantes en New York; US Census Bureau; 2000 and 2001 International Telecommunications Data, Linda Blake and Jim Lande. Washington, FCC, December 2001, and January 2003. * calculo basedo en un promedio de 4 llamadas al mes por 5, 8, 15, 25 y 30 minutos por llamada Formula utilizada es ∑ de llamadas = minutos anuales * Porciento que llama * Porcentaje inmigrantes que remiten (Censo 2000 de pobl.)
$0
$20,000,000
$40,000,000
$60,000,000
$80,000,000
$100,000,000
$120,000,000
$140,000,000
El Salvador Guatemala Honduras Dominican Rep. Jamaica
U.S. revenue Payment to country

Goods bought by Guyanese diasporaGoods bought by Guyanese diaspora
62%
58%
51%
49%
47%
46%
42%
38%
36%
32%
32%
29%
27%
25%
22%
21%
0% 10% 20% 30% 40% 50% 60% 70%
Spices (curry, )
Fresh Fish
Peppers
Salted Fish
Noodles
Fresh Fruits and vegetables
Rum
Peas
Processed fruit
Sugar
Other
Cook utensils
Pickles
Craft Items
Cigarettes
Confectioneries

Products bought by Jamaicans in the U.S.Products bought by Jamaicans in the U.S.
0 20 40 60 80 100
OTHER
PEAS
SUGAR
NOODLES
CRAFT ITEMS
SALTED FISH
PICKLES
COOKING UTENSILS
FRESH FISH AND SHRIMP
CIGARETTES
PEPPERS
CONFECTIONERIES
FRESH FRUITS AND VEGETABLES
RUM
PROCESSED FRUIT
SPICES
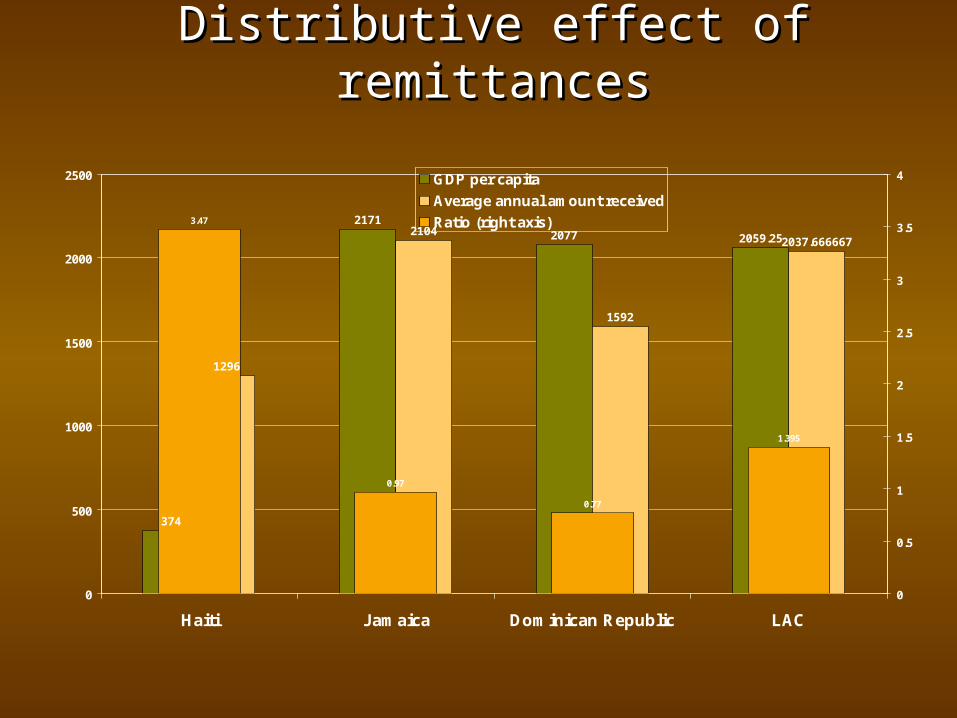
Counter-cyclical nature: Counter-cyclical nature: Quarterly flows to selected Latin American countriesQuarterly flows to selected Latin American countries
0
100
200
300
400
500
600
700
1999
-1Q
1999
-2Q
1999
-3Q
1999
-4Q
2000
-1Q
2000
-2Q
2000
-3Q
2000
-4Q
2001
-1Q
2001
-2Q
2001
-3Q
2001
-4Q
2002
-1Q
2002
-2Q
2002
-3Q
2002
-4Q
2003
-1Q
2003
-2Q
2003
-3Q
2004
-4Q
4
4.5
5
5.5
6
6.5
7
7.5
8
8.5
Jamaica Guatemala El Salvador Dominican Republic His. Unemp.

90
110
130
150
170
190
210
230
250
1/1/1999 5/1/1999 9/1/1999 1/1/2000 5/1/2000 9/1/2000 1/1/2001 5/1/2001 9/1/2001 1/1/2002 5/1/2002 Sept. 2002 1/1/2003 5/1/2003 9/1/2003 Jan.04 May. 04
15
20
25
30
35
Remittances (left axis)
Consumer Prices (left axis)
FX (right axis)
Dominican Republic: Remittances, prices, interest and exchange rates
Foreign Foreign ExchangeExchange
Current Current Price IndexPrice Index
Interest Interest LendingLending RateRate
Hispanic Hispanic UnemploymentUnemployment
-0.507-0.507 0.46 ***0.46 *** -0.105-0.105 0.1790.179
.09 ***.09 ***R2 = 0.54 adjusted R2 = 0.29, statistical significance p< .10 * , p < 0.05 **, p < 0.01 ***
•Home country variations in exchange rates and unemployment in the U.S. among Latinos do not have an effect on transfers. •Market of transfers occur independently from exchange rate variations: under the economic crisis affecting devaluation, remittance transfers, and the control of its volume by companies, were not related to exchange rates.•Remittances responded specifically to changes in prices

Jamaica: Macroeconomic determinantsJamaica: Macroeconomic determinants
0
50
100
150
200
250
1/1/
1999
3/1/
1999
5/1/
1999
7/1/
1999
9/1/
1999
11/1
/199
9
1/1/
2000
3/1/
2000
5/1/
2000
7/1/
2000
9/1/
2000
11/1
/200
0
1/1/
2001
3/1/
2001
5/1/
2001
7/1/
2001
9/1/
2001
11/1
/200
1
1/1/
2002
3/1/
2002
5/1/
2002
Jul.
2002
Sept.
2002
Dec. 2
002
2/1/
2003
4/1/
2003
6/1/
2003
8/1/
2003
Oct
. 200
3
Dec. 2
003
0
10
20
30
40
50
60
70
Remit cpi FX lending
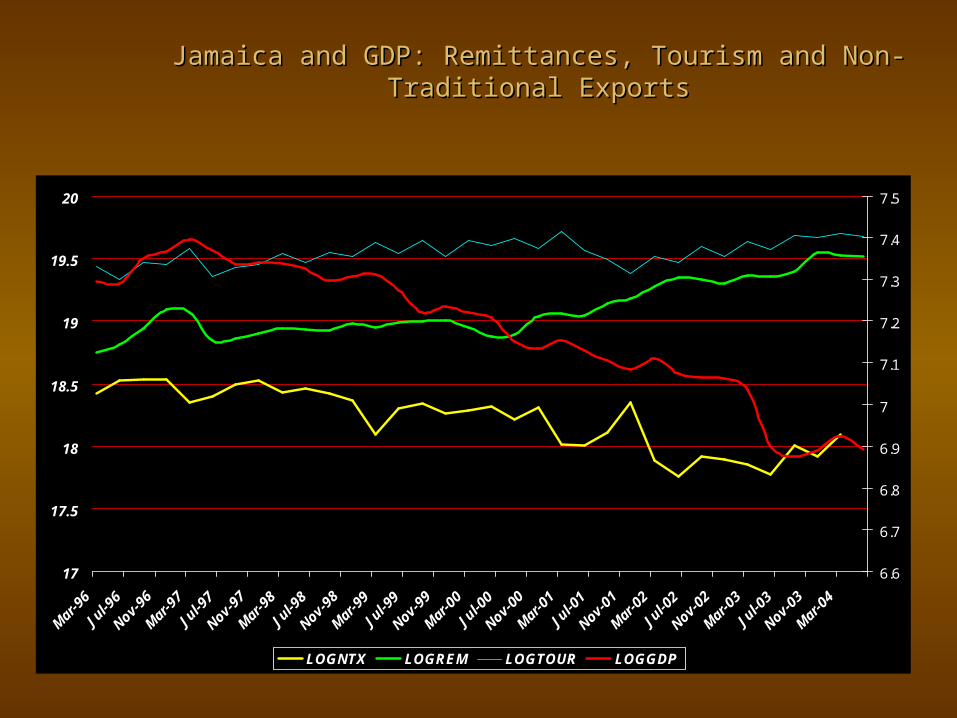
Jamaica and GDP: Remittances, Tourism and Non-Traditional ExportsJamaica and GDP: Remittances, Tourism and Non-Traditional Exports
17
17.5
18
18.5
19
19.5
20
Mar
-96
Jul-9
6
Nov-96
Mar
-97
Jul-9
7
Nov-97
Mar
-98
Jul-9
8
Nov-98
Mar
-99
Jul-9
9
Nov-99
Mar
-00
Jul-0
0
Nov-00
Mar
-01
Jul-0
1
Nov-01
Mar
-02
Jul-0
2
Nov-02
Mar
-03
Jul-0
3
Nov-03
Mar
-04
6.6
6.7
6.8
6.9
7
7.1
7.2
7.3
7.4
7.5
LOGNTX LOGREM LOGTOUR LOGGDP

Levels and determinants Levels and determinants of Engagementof Engagement
Comparisons among Latin Comparisons among Latin American and Caribbean American and Caribbean immigrants in the U.S.immigrants in the U.S.
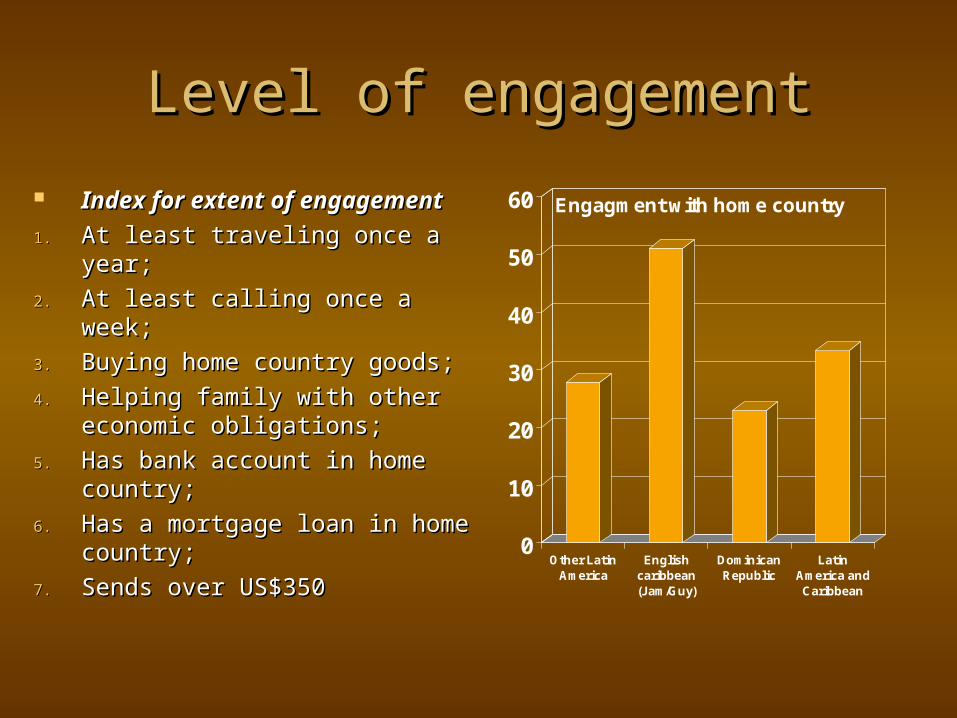
Level of engagementLevel of engagement
Index for extent of Index for extent of engagementengagement
1.1. At least traveling once a year;At least traveling once a year;
2.2. At least calling once a week;At least calling once a week;
3.3. Buying home country goods;Buying home country goods;
4.4. Helping family with other Helping family with other economic obligations;economic obligations;
5.5. Has bank account in home Has bank account in home country;country;
6.6. Has a mortgage loan in home Has a mortgage loan in home country;country;
7.7. Sends over US$350Sends over US$3500
10
20
30
40
50
60
Other LatinAmerica
Englishcaribbean(Jam/Guy)
DominicanRepublic
LatinAmerica andCaribbean
Engagment with home country

Determinants of engagementDeterminants of engagementEnglish
CaribbeanDominican
RepublicOther Latin
America
Independent variables:Independent variables: Significance Sign Significance Sign Significance Sign
Relative's relationship (spouse, parents or children) * (+) *** (+)
Length of time in the U.S. ** (+) *** (-)
Number of relatives living in U.S. household * (-)
Age *** (+)
Gender (male: 1; woman:0) *** (+)
Education ** (-)
Personal income *** (+)
Holding U.S. citizenship *** (-)
Has bank account in U.S.
OLS statistical procedure using level of engagement as dependent variable. Other Latin America: immigrants from Bolivia, Cuba, Colombia, Ecuador, El Salvador, Guatemala, Honduras, Mexico, and Nicaragua.

0
10
20
30
40
50
60
70
80
1970 1980 1990 2000
Costa Rica
El Salvador
Honduras
Nicaragua
Panama
Guyana
Jamaica
Haiti
Dominican Republic
Percent of Latin American and Caribbean people with a tertiary education and living in the US
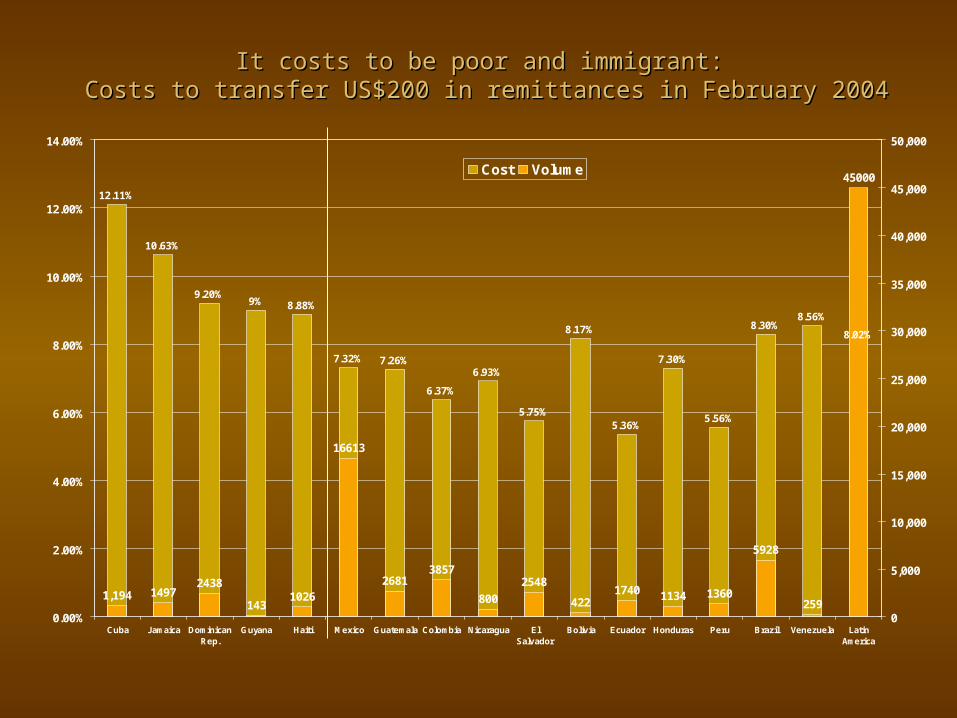
It costs to be poor and immigrant: It costs to be poor and immigrant: Costs to transfer US$200 in remittances in February 2004Costs to transfer US$200 in remittances in February 2004
12.11%
10.63%
9.20%9% 8.88%
7.32% 7.26%
6.37%
6.93%
5.75%
8.17%
5.36%
7.30%
5.56%
8.30%8.56%
8.02%
1,194 14972438
1431026
16613
26813857
800
2548
4221740 1134 1360
5928
259
45000
0.00%
2.00%
4.00%
6.00%
8.00%
10.00%
12.00%
14.00%
Cuba Jamaica DominicanRep.
Guyana Haiti Mexico Guatemala Colombia Nicaragua ElSalvador
Bolivia Ecuador Honduras Peru Brazil Venezuela LatinAmerica
0
5,000
10,000
15,000
20,000
25,000
30,000
35,000
40,000
45,000
50,000
Cost Volume
Country GlobalCell
AT&T MCI
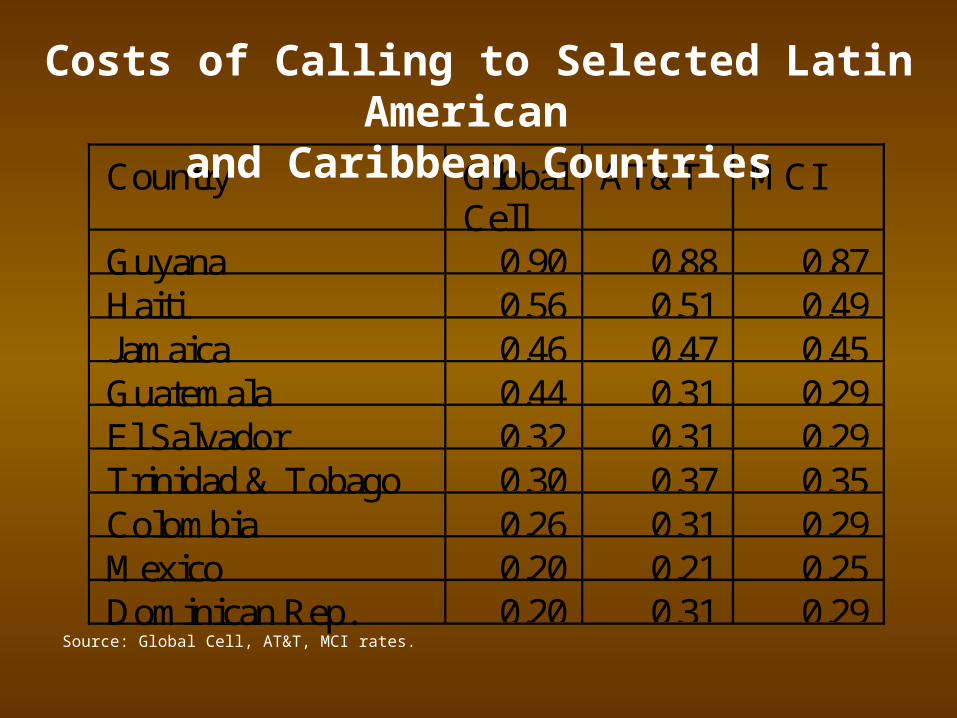
Guyana 0.90 0.88 0.87Haiti 0.56 0.51 0.49Jamaica 0.46 0.47 0.45Guatemala 0.44 0.31 0.29El Salvador 0.32 0.31 0.29Trinidad & Tobago 0.30 0.37 0.35Colombia 0.26 0.31 0.29Mexico 0.20 0.21 0.25Dominican Rep. 0.20 0.31 0.29Source: Global Cell, AT&T, MCI rates.
Costs of Calling to Selected Latin American and Caribbean Countries


Diaspora organizingDiaspora organizing
Hometown associations in Hometown associations in Latin AmericaLatin America

Philanthropy for the Philanthropy for the homelandhomeland
• HTAs are small voluntary philanthropic organizations;• Their organizational structure is commensurate to the
groups’ proposed goals;• The activities focus on basic health, education and public
infrastructure;• The resources raised are relatively small in volume
(US$10,000);• Donations are significant however in rural recipient
localities; • Partnership with governments enhance development goals.
Source: Orozco, Manuel (2003), Hometown Associations and their Present and Future Partnerships: New Development Opportunities? Inter-American Dialogue, Report commissioned by the U.S. Agency for International Development. Washington, DC. September.

40 41
7496
3920
112127
177
270
0
50
100
150
200
250
300
Guanajuato Jalisco San Luis P. Zacatecas Other
19982002
Mexican Clubs by State of Mexican Clubs by State of OriginOrigin
Source: Orozco, Manuel (2003), Hometown Associations and their Present and Future Partnerships: New Development Opportunities? Inter-American Dialogue, Report commissioned by the U.S. Agency for International Development. Washington, DC. September.
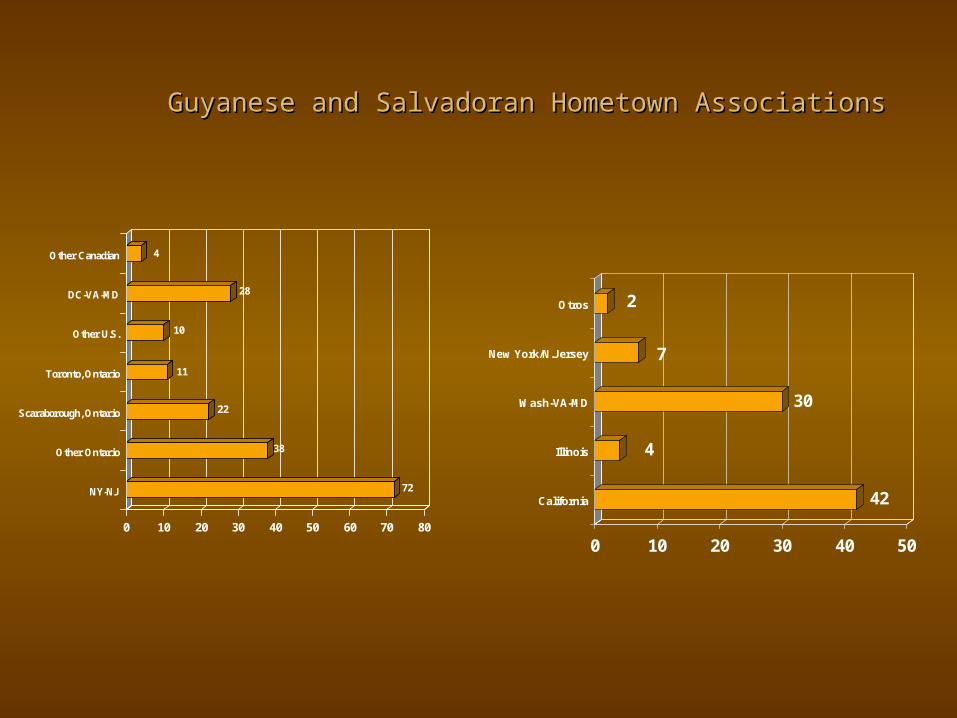
72
38
22
11
10
28
4
0 10 20 30 40 50 60 70 80
NY-NJ
Other Ontario
Scaraborough, Ontario
Toronto, Ontario
Other U.S.
DC-VA-MD
Other Canadian
Guyanese and Salvadoran Hometown Associations Guyanese and Salvadoran Hometown Associations
42
4
30
7
2
0 10 20 30 40 50
California
Illinois
Wash-VA-MD
New York/N.Jersey
Otros

Issue identification: Range of Activities in Mexico Issue identification: Range of Activities in Mexico ( of HTAs working on given project)( of HTAs working on given project)
0 10 20 30 40 50 60
Health and Education
Other Donations
Infrastructure
Church
Recreation
Town Beautification
Economic Investment
Cemetery

Resource allocationResource allocation
40%
29%
17%
8% 6%
0%
5%
10%
15%
20%
25%
30%
35%
40%
Less than5,000
5,000 to 10,000 10,000 to20,000
20,000 to40,000
Over 40,000
HTAs Donations (US$)
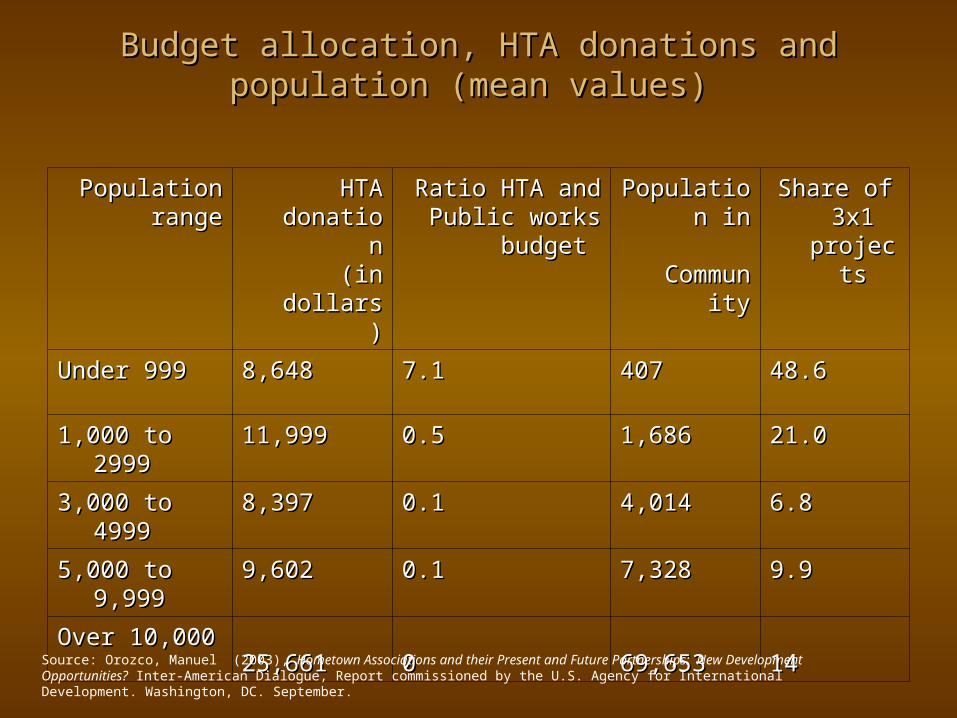
Budget allocation, HTA donations and population (mean Budget allocation, HTA donations and population (mean values) values)
Population rangePopulation range HTA donationHTA donation(in dollars)(in dollars)
Ratio HTA and Ratio HTA and Public works budget Public works budget
Population inPopulation in CommunityCommunity
Share of 3x1 Share of 3x1 projectsprojects
Under 999Under 999 8,6488,648 7.17.1 407407 48.648.6
1,000 1,000 to 2999to 2999 11,99911,999 0.50.5 1,6861,686 21.021.0
3,000 3,000 to 4999to 4999 8,3978,397 0.10.1 4,0144,014 6.86.8
5,000 5,000 to 9,999to 9,999 9,6029,602 0.10.1 7,3287,328 9.99.9
Over 10,000Over 10,00025,66125,661 00 69,65369,653 1414
Source: Orozco, Manuel (2003), Hometown Associations and their Present and Future Partnerships: New Development Opportunities? Inter-American Dialogue, Report commissioned by the U.S. Agency for International Development. Washington, DC. September.
The reality of The reality of transnational familiestransnational families
Is poverty out of the picture Is poverty out of the picture with transnational migration?with transnational migration?
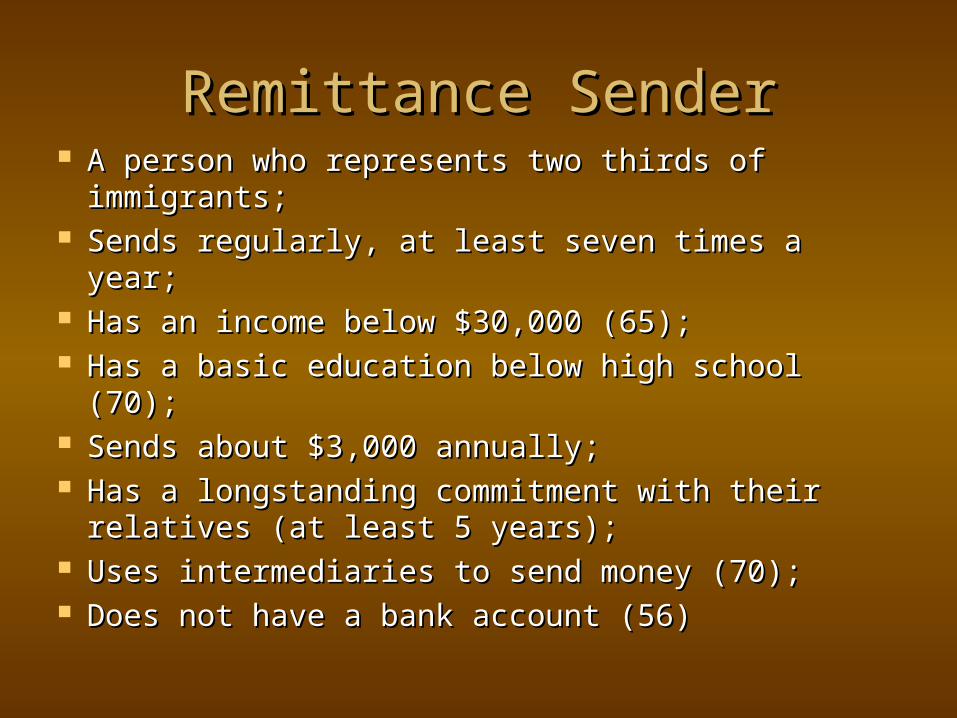
Remittance SenderRemittance Sender A person who represents two thirds of A person who represents two thirds of
immigrants;immigrants; Sends regularly, at least seven times a year;Sends regularly, at least seven times a year; Has an income below $30,000 (65);Has an income below $30,000 (65); Has a basic education below high school (70);Has a basic education below high school (70); Sends about $3,000 annually;Sends about $3,000 annually; Has a longstanding commitment with their Has a longstanding commitment with their
relatives (at least 5 years);relatives (at least 5 years); Uses intermediaries to send money (70);Uses intermediaries to send money (70); Does not have a bank account (56)Does not have a bank account (56)

Remittances from Latin American immigrants in the United StatesRemittances from Latin American immigrants in the United States
Sixty percent of Latin American immigrants send remittances; The average transactions that immigrants send is $240 and do it regularly over twelve times a year. The regularity of the amount is four times more than in 2001.The aggregate volume of such amounts adds to a little over 30 billion dollars a year from the continental United States;In six states immigrants are sending at least one billion dollars;Latinos in California alone send nearly ten billion;The total volume from these six states adds to twenty-one billion dollars
$0
$1,000,000,000
$2,000,000,000
$3,000,000,000
$4,000,000,000
$5,000,000,000
$6,000,000,000
$7,000,000,000
$8,000,000,000
$9,000,000,000
$10,000,000,000California
New York
Texas
Florida
Illinois
New Jersey

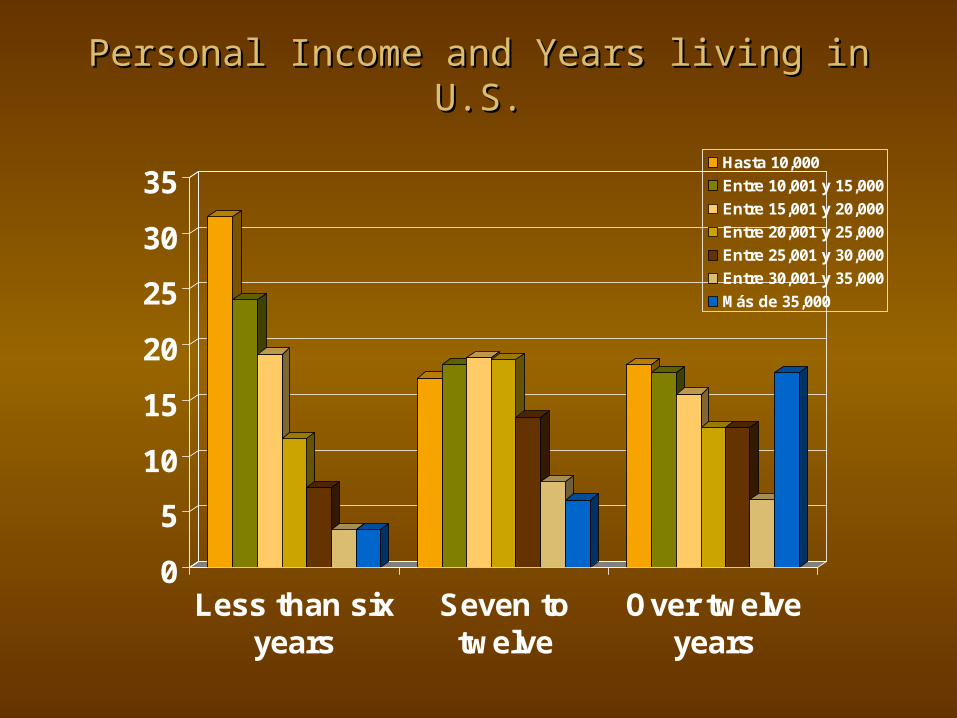
Personal Income and Years living Personal Income and Years living in U.S.in U.S.
0
5
10
15
20
25
30
35
Less than sixyears
Seven totwelve
Over twelveyears
Hasta 10,000
Entre 10,001 y 15,000
Entre 15,001 y 20,000
Entre 20,001 y 25,000
Entre 25,001 y 30,000
Entre 30,001 y 35,000
Más de 35,000

Remittance senders without bank accountsRemittance senders without bank accounts
0
5
10
15
20
25
30
35
40
45
No bank account
Cuba Dom. Rep. Jamaica Guyana LAC averege
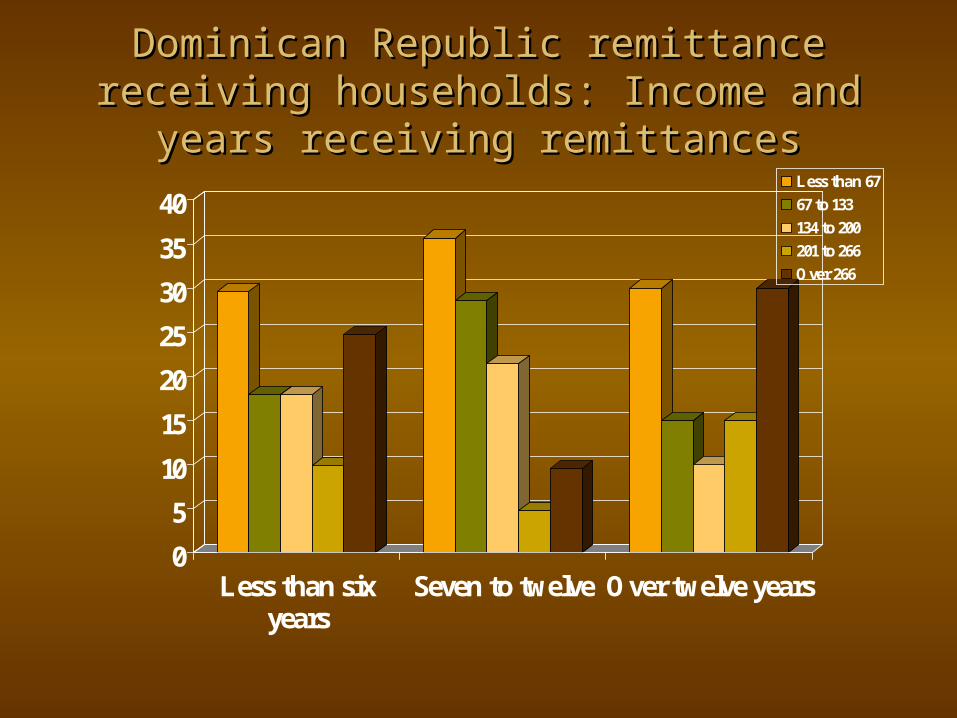
Dominican Republic remittance receiving Dominican Republic remittance receiving households: Income and years receiving households: Income and years receiving
remittancesremittances
0
5
10
15
20
25
30
35
40
Less than sixyears
Seven to twelve Over twelve years
Less than 6767 to 133134 to 200201 to 266Over 266

Remittance receiving households: Remittance receiving households: some financial characteristics some financial characteristics
0
10
20
30
40
50
60
70
Mexico El Salvador Nicaragua R.D. Guatemala Honduras Guyana
SavingsInvestmentBank account
Source: IDB. Receptores de Remesas en Centroamérica, Ciudad de Guatemala, Guatemala, 3 de Septiembre 2003. BID; IDSource: IDB. Receptores de Remesas en Centroamérica, Ciudad de Guatemala, Guatemala, 3 de Septiembre 2003. BID; IDB. Receptores de Remesas en B. Receptores de Remesas en Mexico, Ciudad de Mexico, Mexico, Octubre 2003. BID. Guyana: Laparkan Trading survey Mexico, Ciudad de Mexico, Mexico, Octubre 2003. BID. Guyana: Laparkan Trading survey (carried out by the author)(carried out by the author); ; . . Nicaragua: Nicaragua: ENCUESTA NACIONAL SOBRE GOBERNABILIDAD Y ELECCIONES: MODULO SOBRE MIGRACIÓN, USO DE ENCUESTA NACIONAL SOBRE GOBERNABILIDAD Y ELECCIONES: MODULO SOBRE MIGRACIÓN, USO DE REMESAS FAMILIARES Y AHORRO, Managua 05 de julio de 2001REMESAS FAMILIARES Y AHORRO, Managua 05 de julio de 2001, INSTITUTO DE ESTUDIOS NICARAGUENSES; DR: , INSTITUTO DE ESTUDIOS NICARAGUENSES; DR: Emmanuel Silvestre’s survey (commissioned out by the author)Emmanuel Silvestre’s survey (commissioned out by the author)

Remittances as Remittances as Institutions of Institutions of Development Development
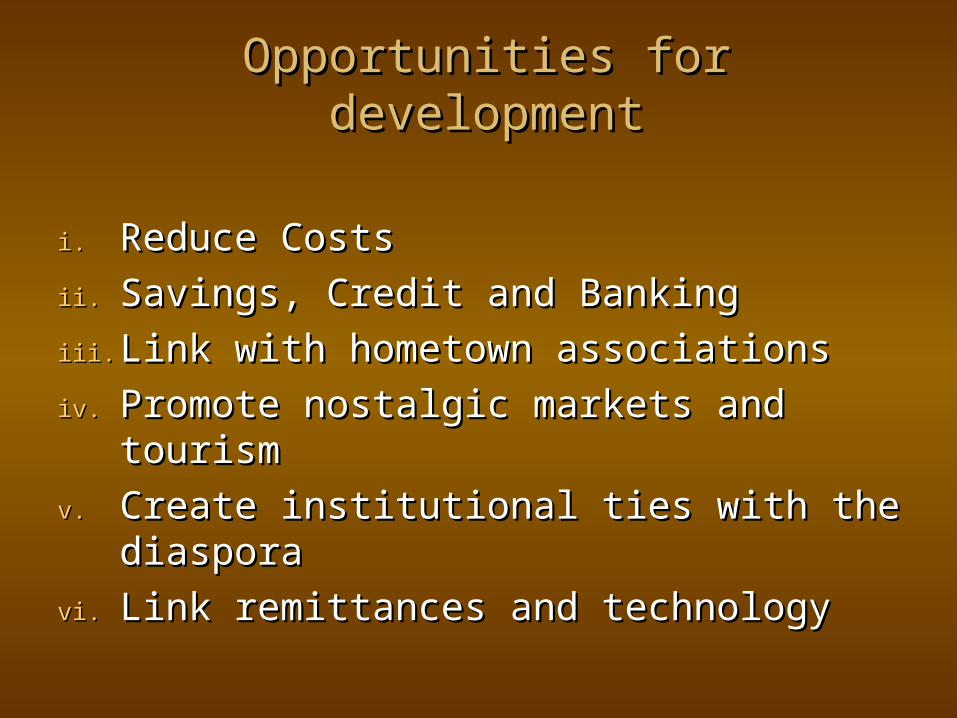
Opportunities for developmentOpportunities for development
i.i. Reduce CostsReduce Costs
ii.ii. Savings, Credit and BankingSavings, Credit and Banking
iii.iii. Link with hometown associationsLink with hometown associations
iv.iv. Promote nostalgic markets and Promote nostalgic markets and tourism tourism
v.v. Create institutional ties with the Create institutional ties with the diaspora diaspora
vi.vi. Link remittances and technologyLink remittances and technology

Strategy 1: Reduction in transfer costs Strategy 1: Reduction in transfer costs
Promotion strategic alliances between remittance agencies and Promotion strategic alliances between remittance agencies and banks, such as VISA with Quiqeyana, Banco Cuscatlan, Banco banks, such as VISA with Quiqeyana, Banco Cuscatlan, Banco Uno y Gigante Express in Central America and the Dominican Uno y Gigante Express in Central America and the Dominican Republic Republic
Strategic agreements between banks in the country of Strategic agreements between banks in the country of residence and the country of origin residence and the country of origin Bank of America, Citibank (C2iT), etc.Bank of America, Citibank (C2iT), etc. Software Platforms for banks: Mastrex InternationalSoftware Platforms for banks: Mastrex International ATMs and MAC: Mitchell’s Bank ATMs and MAC: Mitchell’s Bank Alliances among US and Latin American credit unions, such as Alliances among US and Latin American credit unions, such as
IRNet IRNet

Total cost of remittance transfer by industry sectorTotal cost of remittance transfer by industry sector
0.00%
2.00%
4.00%
6.00%
8.00%
10.00%
12.00%
14.00%
2001 2002 2003 2004.01 2004.06 2004.11
NMTA
Western Union
Moneygram
Vigo
US Banks and all Credit Unions
other

A score card on Remittance Transfers: What works best to the customer’s benefit.
CriteriaCriteria IndicatorsIndicators RankingRanking
1. 1. Transfer feeTransfer fee Lowered fees for customers may indicate lowered costs for Lowered fees for customers may indicate lowered costs for remittance companies.remittance companies.
2. 2. Exchange rate usedExchange rate used If there is no exchange rate, no currency purchase costs are If there is no exchange rate, no currency purchase costs are incurred by sender and recipients. Fees may be higher, incurred by sender and recipients. Fees may be higher, however.however.
3. 3. Transfer mechanism (hand delivery, Transfer mechanism (hand delivery, money order, electronic transfer: debit money order, electronic transfer: debit card, bank to bank, internet, courier card, bank to bank, internet, courier agency transfer, etc.)agency transfer, etc.)
More capital intensive the transactions mean lower costs for More capital intensive the transactions mean lower costs for the company, but not necessarily lower fees for the the company, but not necessarily lower fees for the consumer.consumer.
4. 4. Marketplace competition (supply Marketplace competition (supply side)side)
The higher number the number of companies in any The higher number the number of companies in any market, the lower the transfer costs. The exception is when market, the lower the transfer costs. The exception is when companies are formed in monopolies, oligopolies or companies are formed in monopolies, oligopolies or remittance ‘cartels’.remittance ‘cartels’.
5. 5. Business location and geographic Business location and geographic coveragecoverage
Companies located within areas with a better economic Companies located within areas with a better economic infrastructure exhibit lower transaction costsinfrastructure exhibit lower transaction costs
6. 6. Development supportDevelopment support Support to the local community adds value to the product Support to the local community adds value to the product and loyalty to the companyand loyalty to the company
7. 7. Relationship with Financial Services Relationship with Financial Services IntermediationIntermediation
Offering services such as banking or bill payment increases Offering services such as banking or bill payment increases interest in the companyinterest in the company
8. 8. TransparencyTransparency A company that advertises its exchange rates cultivates or A company that advertises its exchange rates cultivates or promotes more trust from the customer. promotes more trust from the customer.
9. 9. Compliance to regulationsCompliance to regulations A company that meets all the requirements operate as a A company that meets all the requirements operate as a remitter.remitter.
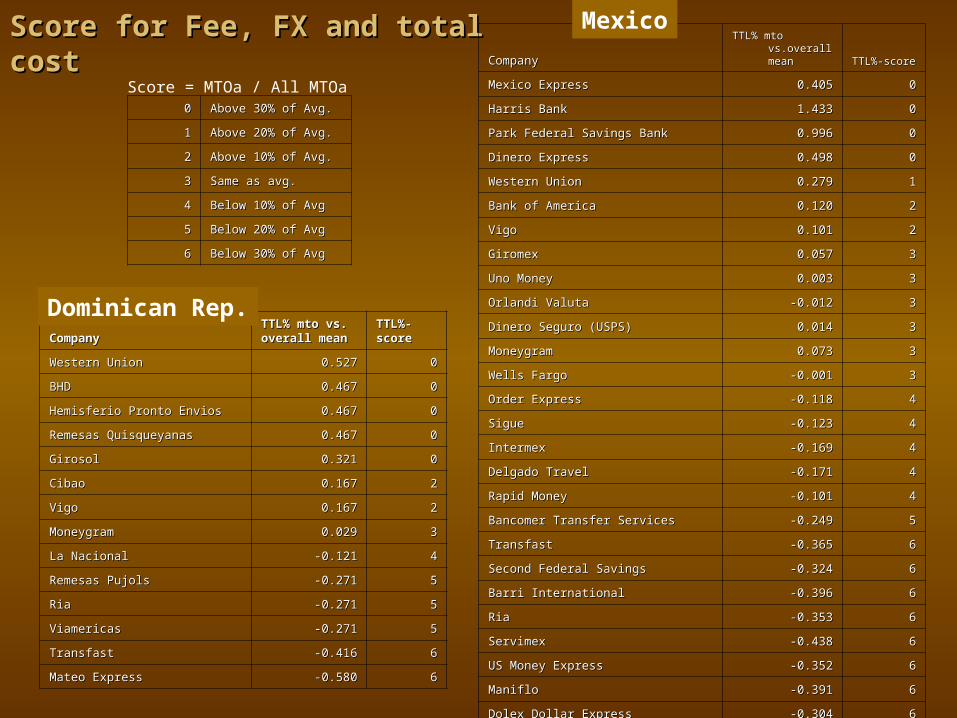
Score for Fee, FX and total costScore for Fee, FX and total cost
00 Above 30% of Avg.Above 30% of Avg.
11 Above 20% of Avg.Above 20% of Avg.
22 Above 10% of Avg.Above 10% of Avg.
33 Same as avg.Same as avg.
44 Below 10% of AvgBelow 10% of Avg
55 Below 20% of AvgBelow 20% of Avg
66 Below 30% of AvgBelow 30% of Avg
CompanyCompany
TTL% mto TTL% mto vs.overall vs.overall meanmean TTL%-scoreTTL%-score
Mexico ExpressMexico Express 0.4050.405 00
Harris BankHarris Bank 1.4331.433 00
Park Federal Savings BankPark Federal Savings Bank 0.9960.996 00
Dinero ExpressDinero Express 0.4980.498 00
Western UnionWestern Union 0.2790.279 11
Bank of AmericaBank of America 0.1200.120 22
VigoVigo 0.1010.101 22
GiromexGiromex 0.0570.057 33
Uno MoneyUno Money 0.0030.003 33
Orlandi ValutaOrlandi Valuta -0.012-0.012 33
Dinero Seguro (USPS)Dinero Seguro (USPS) 0.0140.014 33
MoneygramMoneygram 0.0730.073 33
Wells FargoWells Fargo -0.001-0.001 33
Order ExpressOrder Express -0.118-0.118 44
SigueSigue -0.123-0.123 44
IntermexIntermex -0.169-0.169 44
Delgado TravelDelgado Travel -0.171-0.171 44
Rapid MoneyRapid Money -0.101-0.101 44
Bancomer Transfer ServicesBancomer Transfer Services -0.249-0.249 55
TransfastTransfast -0.365-0.365 66
Second Federal SavingsSecond Federal Savings -0.324-0.324 66
Barri InternationalBarri International -0.396-0.396 66
RiaRia -0.353-0.353 66
ServimexServimex -0.438-0.438 66
US Money ExpressUS Money Express -0.352-0.352 66
ManifloManiflo -0.391-0.391 66
Dolex Dollar ExpressDolex Dollar Express -0.304-0.304 66
Mexico
Score = MTOa / All MTOa
CompanyCompanyTTL% mto vs. TTL% mto vs. overall meanoverall mean
TTL%-TTL%-scorescore
Western UnionWestern Union 0.5270.527 00
BHDBHD 0.4670.467 00
Hemisferio Pronto EnviosHemisferio Pronto Envios 0.4670.467 00
Remesas QuisqueyanasRemesas Quisqueyanas 0.4670.467 00
GirosolGirosol 0.3210.321 00
CibaoCibao 0.1670.167 22
VigoVigo 0.1670.167 22
MoneygramMoneygram 0.0290.029 33
La NacionalLa Nacional -0.121-0.121 44
Remesas PujolsRemesas Pujols -0.271-0.271 55
RiaRia -0.271-0.271 55
ViamericasViamericas -0.271-0.271 55
TransfastTransfast -0.416-0.416 66
Mateo ExpressMateo Express -0.580-0.580 66
Dominican Rep.

Remittance Market Composition in Latin AmericaRemittance Market Composition in Latin America
MatureMature ConsolidatingConsolidating IncipientIncipient
Composition of market share, Composition of market share, Efficiency of transactions (use of Efficiency of transactions (use of modern technology, extended modern technology, extended networks nation wide, safe networks nation wide, safe transfers), transfers), Compliance to regulatory Compliance to regulatory environment, environment, Tradition of transferring money, Tradition of transferring money, Multiple new and old Multiple new and old players(MTOs, banks, MFIs), players(MTOs, banks, MFIs), Costs to customers are lower than Costs to customers are lower than average, Information and average, Information and transparency, transparency, Investment accessibleInvestment accessible
NoneNone Mexico, Mexico, El Salvador, El Salvador,
Dominican Dominican Republic, Republic, Ecuador, Ecuador,
JamaicaJamaica
ColombiaColombia Honduras Honduras
PeruPeruGuyanaGuyana
HaitiHaitiCubaCuba
NicaraguaNicaraguaArgentina Argentina VenezuelaVenezuela

Strategy II: Savings, Credit and Strategy II: Savings, Credit and RemittancesRemittances
a.a. Monitoring transfers, especially the exchange Monitoring transfers, especially the exchange raterate
b.b. Motivate savings and credit institutions to Motivate savings and credit institutions to attract remittance senders and recipients attract remittance senders and recipients
c.c. Bring low cost banking centers where there is Bring low cost banking centers where there is a high concentration of families who receive a high concentration of families who receive remittancesremittances
d.d. Offer incentives to households that receive Offer incentives to households that receive remittances;remittances;
e.e. Allow micro-finance and credit unions to Allow micro-finance and credit unions to become agents of remittances and savings become agents of remittances and savings institutionsinstitutions

““The demand for financial services by remittance receiving households The demand for financial services by remittance receiving households rests on the intersection between the role of microfinance institutions, rests on the intersection between the role of microfinance institutions,
such as credit unions, and rural sector development.” such as credit unions, and rural sector development.”
$1.2$4.1
$9.6$13.5
$17.1
$24.0
$41.2
$0.0
$10.0
$20.0
$30.0
$40.0
$50.0
Q4 01 Q1 02 Q2 02 Q3 02 Q4 02 Q1 03 Q2 03
Volume of Remittances Distributed by 62 Central American CUs in US$ Millions

Mexico: Remittances to rural households Mexico: Remittances to rural households
$106,862 $442,704$1,053,786
$1,923,668
$3,256,231
$15,027,550
$0
$2,000,000
$4,000,000
$6,000,000
$8,000,000
$10,000,000
$12,000,000
$14,000,000
$16,000,000
Menos de 999 1,000 a 2999 3,000 a 4999 5,000 a 9,999 10,000 a 14,999 Mas de 15,000
15 recibe US$250 al mes, siete veces al año.

People with bank accounts People with bank accounts (remittance recipients and non-recipients) (remittance recipients and non-recipients)
0%
5%
10%
15%
20%
25%
30%
35%
40%
45%
50%
Guatemala Honduras El Salvador Mexico Ecuador
RecipientsNon-Recipients
Source: Multilateral Investment Fund-Inter-American Development Bank, Receptores de Remesas en Mexico, Octubre 2003; Receptores de remesas en Guatemala, El Salvador y Honduras, Septiembre 2003; Receptores de Remesas en Ecuador, Mayo 2003. Washington, DC: MIF-IADB/FOMIN-BID.

MFI Relevance: Zacatecas MFI Relevance: Zacatecas Municipalities Municipalities
(pop.)(pop.)BanksBanks Credit UnionsCredit Unions MTOsMTOs FINRURALFINRURAL
Jerez (55,000)Jerez (55,000) Bancomer, Bancomer, Banamex, Banamex, Bital, Bital, BanorteBanorte
Caja Popular Caja Popular MexicanaMexicana
Thirteen Thirteen money money transfer transfer ‘centros ‘centros de de cambio’cambio’
Tepetongo Tepetongo (5,000)(5,000)
Tlatenango Tlatenango (24,000)(24,000)
Bancomer, Bancomer, Bital, Bital, BanorteBanorte
Caja Popular Caja Popular MexicanaMexicana
FiveFive
Tepechitlan Tepechitlan (5,000)(5,000)
BanorteBanorte OneOne
MomaxMomax OneOne
Jalpa (20,000)Jalpa (20,000) Bancomer, Bancomer, Bital, Bital, BanorteBanorte
Caja Popular Caja Popular MexicanaMexicana
ThreeThree
JuchipilaJuchipila Bancomer, Bancomer, Bital, Bital, BanorteBanorte
ThreeThree

Jerez, Zacatecas: Jerez, Zacatecas: 15% of RRH have bank accounts15% of RRH have bank accounts
Lugar Frecuencia PorcentajeCasa de Cambio 75 34.4Bancomer 38 17.4Elektra 25 11.5HSBC 22 10.1Banamex 15 6.9Correo/telégrafos 11 5.0BANORTE 6 2.8Banco (No Especificado) 7 3.2Viajes Jerez 5 2.3Otros 6 2.8No sabe/no recuerda 8 3.7Total 218 100.0

Remittances and microfinanceRemittances and microfinance1. 1. Competitive position: The institution . . .Competitive position: The institution . . .
a. has offered remittances since ____a. has offered remittances since ____
b. offers money transfers on its own, through partnership or in a networkb. offers money transfers on its own, through partnership or in a network
c. has experienced growth in the transfers (number of transactions; market share)c. has experienced growth in the transfers (number of transactions; market share)
d. offers a competitive fee and enjoys profit marginsd. offers a competitive fee and enjoys profit margins
e. has a competitive foreign exchangee. has a competitive foreign exchange
f. has a remittance marketing toolf. has a remittance marketing tool
2.2. Financial intermediation: The institution Financial intermediation: The institution
a. offers remittance distribution to membersa. offers remittance distribution to members
b. opens bank accounts to remittance recipient households in the institution’s vicinity;b. opens bank accounts to remittance recipient households in the institution’s vicinity;
c. Has a crosselling marketing toolc. Has a crosselling marketing tool
d. Provides range of financial servicesd. Provides range of financial services
e. Provides credit for productive investment [mobilizes savings from remittance transfers]e. Provides credit for productive investment [mobilizes savings from remittance transfers]
f. Remittance senders has a financial relationship with institutionf. Remittance senders has a financial relationship with institution
3. 3. Regulatory environment: The institution . . .Regulatory environment: The institution . . .
a. Has awareness of regulatory issues in money transfersa. Has awareness of regulatory issues in money transfers
b. Report its activities to partner money transfer companyb. Report its activities to partner money transfer company
c. Report its activities to government agenciesc. Report its activities to government agencies
4. 4. Technological applicationsTechnological applications
a. The money transfer occurs through mainstream but modern platformsa. The money transfer occurs through mainstream but modern platforms
b. Innovative technologies are implemented (cards, wifi, online transfers, bundled softwares).b. Innovative technologies are implemented (cards, wifi, online transfers, bundled softwares).
5. 5. Data Management: The institution . . .Data Management: The institution . . .
a. Systematizes flowsa. Systematizes flows
b. Performs market research and client analysisb. Performs market research and client analysis
6.6. External assistance: The institution . . . External assistance: The institution . . .
a. Donors or investors provide technical assistance for remittance transfer incorporation or innovation (equipment, regulatory compliance, training, market research, etc.)a. Donors or investors provide technical assistance for remittance transfer incorporation or innovation (equipment, regulatory compliance, training, market research, etc.)
b. Donors or investors provide working capital for remittance operationb. Donors or investors provide working capital for remittance operation
7.7. Institutional efforts: The institution . . . Institutional efforts: The institution . . .
a. Has invested resources to compete in the marketa. Has invested resources to compete in the market
b. Business is generating non-negligible revenueb. Business is generating non-negligible revenue
c. Relationship to local economyc. Relationship to local economy
d. Relationship to local communityd. Relationship to local community

Minimum indicators leveraging the relationship Minimum indicators leveraging the relationship between financial intermediation and remittancesbetween financial intermediation and remittances
Remittance market service coverageRemittance market service coverage: The institution provides : The institution provides remittance transfer operations to its clients or members, as well as to remittance transfer operations to its clients or members, as well as to the communities where its branches operate.the communities where its branches operate.Indicator: Indicator: Coverage where there is competition (MFI branches / Competitor branches)Coverage where there is competition (MFI branches / Competitor branches)
Effective market presenceEffective market presence: As a minimum, market presence is : As a minimum, market presence is achieved through a combination of partnership with money transfer achieved through a combination of partnership with money transfer companies, offer of a low cost remittance transaction and a distribution companies, offer of a low cost remittance transaction and a distribution capacity.capacity.Indicators: Indicators: Transfer volume (transfers / month, rate of transactions per institution’s branch), Transfer volume (transfers / month, rate of transactions per institution’s branch), transaction cost (institution’s transfer cost / market average),transaction cost (institution’s transfer cost / market average), number of branches, .number of branches, .
Accessible financial servicesAccessible financial services: The institution markets, designs and : The institution markets, designs and provides recipients with an array of various product options, including provides recipients with an array of various product options, including savings, credit, insurance, pension funds.savings, credit, insurance, pension funds.Indicator: Indicator: financial services (number of remittance recipients that are clients)financial services (number of remittance recipients that are clients) ..
Information management and adaptationInformation management and adaptation: Institutional awareness : Institutional awareness and management of the market composition of recipients, adoption of and management of the market composition of recipients, adoption of adequate technologies linking MFI systems with remittance transfers.adequate technologies linking MFI systems with remittance transfers.Indicator: Indicator:

Banks, Credit Unions and Microfinance Banks, Credit Unions and Microfinance institutions offering remittancesinstitutions offering remittances
InstitutionInstitution CountryCountry TypeType
Banco Industrial (BI)Banco Industrial (BI) GuatemalaGuatemala Commercial Commercial bankbank
Cooperativa de Ahorro y Crédito SalcajáCooperativa de Ahorro y Crédito Salcajá GuatemalaGuatemala Credit UnionCredit Union
Banco Salvadoreño (BSal)Banco Salvadoreño (BSal) El SalvadorEl Salvador Commercial Commercial bankbank
Federation of Salvadoran Savings and Credit Federation of Salvadoran Savings and Credit Cooperative (FEDECACES)Cooperative (FEDECACES) El SalvadorEl Salvador Credit Union Credit Union
Banco Solidario (BSol)Banco Solidario (BSol) EcuadorEcuador Transformed Transformed MFIMFI
National Savings and Financial Services Bank (BANSEFI)National Savings and Financial Services Bank (BANSEFI) MexicoMexico State bankState bank
Oaxaca BankOaxaca Bank MexicoMexico MicrobankMicrobank
Wells FargoWells Fargo MexicoMexico Commercial Commercial bankbank
Financiera El ComercioFinanciera El Comercio ParaguayParaguay MFIMFI

CoverageCoverageEffective coverageby branch locationMFIs and operations
in rural areas
% % RuralRural (%)(%)
4040 1111
5050 1717
6060 1111
7070 2222
Over 75Over 75 39.239.2
TotalTotal 100.00100.00n=19
MFI Ratio MFI Ratio to WU to WU AgentsAgents
El SalvadorEl Salvador
AMC de RLAMC de RL 44%44%
Apoyo IntegralApoyo Integral 29%29%
Banco ProCreditBanco ProCredit 36%36%
FEDECACESFEDECACES 51%51%
Fundacion CampoFundacion Campo 14%14%
Fundacion Jose Napoleon Fundacion Jose Napoleon DuarteDuarte 22%22%
GuatemalaGuatemala
FENACOACFENACOAC 41%41%
Genesis EmpresarialGenesis Empresarial 36%36%
SalcajaSalcaja 47%47%
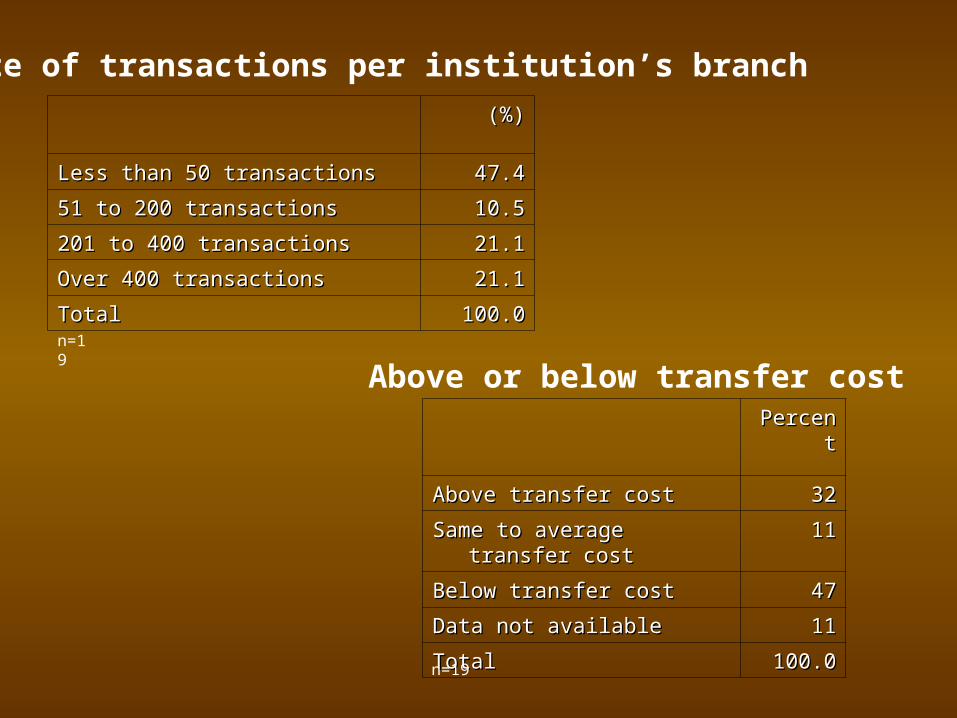
Rate of transactions per institution’s branch
(%)(%)
Less than 50 transactionsLess than 50 transactions 47.447.4
51 51 to 200 transactions to 200 transactions 10.510.5
201 201 to 400 transactionsto 400 transactions 21.121.1
Over 400 transactionsOver 400 transactions 21.121.1
TotalTotal 100.0100.0
n=19
PercentPercent
Above transfer costAbove transfer cost 3232
Same to average transfer Same to average transfer costcost
1111
Below transfer costBelow transfer cost 4747
Data not availableData not available 1111
Total Total 100.0100.0
Above or below transfer cost
n=19

Transfer volume, number of account holder Transfer volume, number of account holder and branches by institution (2004). and branches by institution (2004).
Transfer volume, number of account holder and branches by institution (2004).
Transfer Transfer cost cost (company / (company / market market average)average)
Volume Volume of of transfertransfers per s per monthmonth
Number Number of of remittancremittance e recipientrecipients that are s that are clientsclients
Total Total number number of clientsof clients
Number Number of of branchesbranches
FEDECACESFEDECACES 3.9% / 4.2% 3.9% / 4.2% 17,50017,500 4,375 4,375 90,00090,000 2626
Banco Salvadoreño Banco Salvadoreño (BSal)(BSal)
3.9% / 4.2%3.9% / 4.2% 58,00058,000 17,00017,000 n/an/a 110110
SalcajaSalcaja 6.1% / 5.8%6.1% / 5.8% 10001000 7,6507,650 15,00015,000 33
El ComercioEl Comercio 9.8% / 8.7%9.8% / 8.7% 200200 1,3301,330 7,0007,000 1111
Banco Industrial (BI)Banco Industrial (BI) 6.5% / 5.8%6.5% / 5.8% 200,000200,000 100,000100,000 500,000500,000 Over 250Over 250
Banco Solidario Banco Solidario (BSol)(BSol)
0% /4% 0% /4% 12,00012,000 4,0004,000 91,60091,600 3232
BANSEFIBANSEFI 5.4% / 5.4%5.4% / 5.4% 25,00025,000 2,5002,500 500,000500,000 550550
Wells FargoWells Fargo 5.4 % / 5.4% 5.4 % / 5.4% 70,00070,000 250,000250,000 Over 1 Over 1 millionmillion
Over 3000Over 3000
Source: Orozco, Manuel, Survey commissioned to Borge & Asociados, 2004; Institutional interviews, January 2004 & 2005.
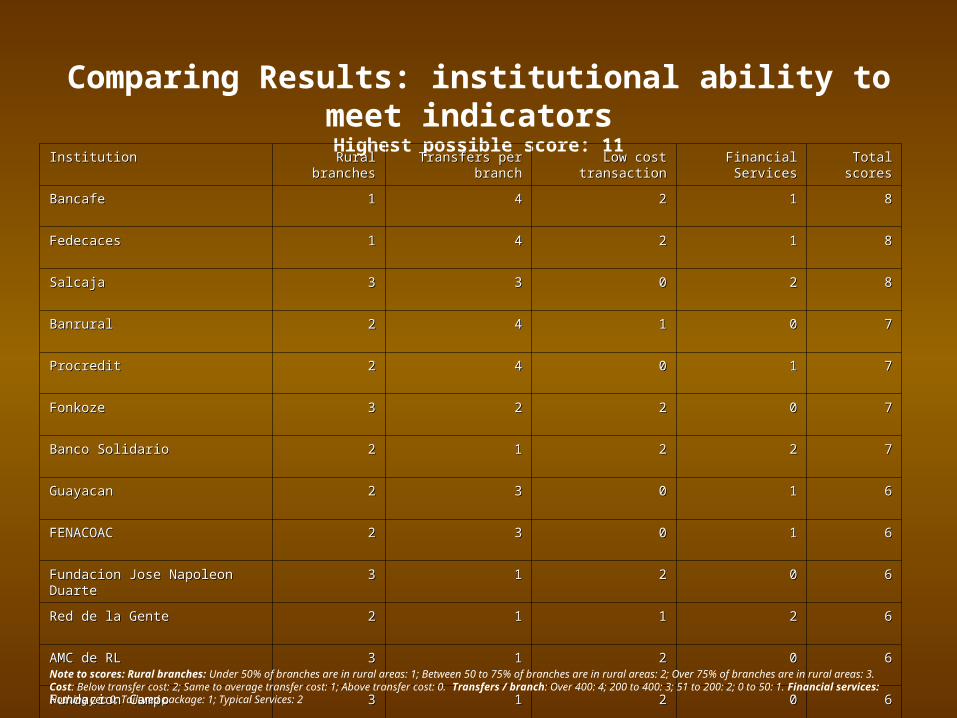
Comparing Results: institutional ability to meet indicators Highest possible score: 11
InstitutionInstitution Rural Rural branchesbranches
Transfers per Transfers per branchbranch
Low cost Low cost transactiontransaction
Financial Financial ServicesServices
Total Total scoresscores
Bancafe Bancafe 11 44 22 11 88
Fedecaces Fedecaces 11 44 22 11 88
Salcaja Salcaja 33 33 00 22 88
Banrural Banrural 22 44 11 00 77
Procredit Procredit 22 44 00 11 77
Fonkoze Fonkoze 33 22 22 00 77
Banco Solidario Banco Solidario 22 11 22 22 77
Guayacan Guayacan 22 33 00 11 66
FENACOAC FENACOAC 22 33 00 11 66
Fundacion Jose Napoleon Fundacion Jose Napoleon DuarteDuarte
33 11 22 00 66
Red de la Gente Red de la Gente
22 11 11 22 66
AMC de RL AMC de RL 33 11 22 00 66
Fundacion Campo Fundacion Campo
33 11 22 00 66
Coosadeco Coosadeco 22 22 00 11 55
El Comercio El Comercio 22 11 00 22 55
Integral Integral 22 11 22 00 55
Nu Nvu, Oaxaca Nu Nvu, Oaxaca
33 11 .. 11 55
Fedecredito Fedecredito 11 11 22 11 55
Genesis Genesis 33 .. .. 33
Note to scores: Rural branches: Under 50% of branches are in rural areas: 1; Between 50 to 75% of branches are in rural areas: 2; Over 75% of branches are in rural areas: 3. Cost: Below transfer cost: 2; Same to average transfer cost: 1; Above transfer cost: 0. Transfers / branch: Over 400: 4; 200 to 400: 3; 51 to 200: 2; 0 to 50: 1. Financial services: Nothing yet: 0; Tailored package: 1; Typical Services: 2

Money transfers by banksMoney transfers by banks20032003 20042004
Method employedMethod employed Charge Charge Percent ofPercent ofamount sent*amount sent*
Charge Charge Percent ofPercent ofamount amount
sent*sent*
Debit Card withdrawal at ATM Debit Card withdrawal at ATM (Community banks)(Community banks)
7.47.4 1.511.51 1.51.5
US Bank as MT, pick up at US Bank as MT, pick up at Mexican Bank/AgencyMexican Bank/Agency
16.216.2 3.363.36 17.7417.74 4.54.5
Credit UnionsCredit Unions 21.421.4 5.35.3 16.6516.65 3.93.9
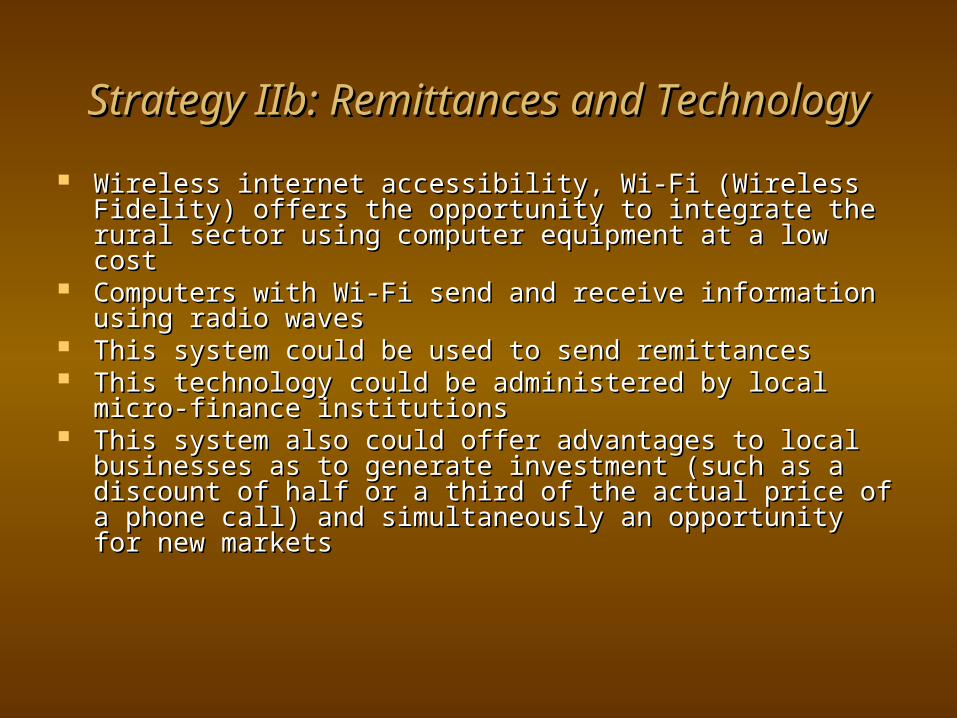
Strategy IIb: Remittances and TechnologyStrategy IIb: Remittances and Technology
Wireless internet accessibility, Wi-Fi (Wireless Fidelity) Wireless internet accessibility, Wi-Fi (Wireless Fidelity) offers the opportunity to integrate the rural sector using offers the opportunity to integrate the rural sector using computer equipment at a low costcomputer equipment at a low cost
Computers with Wi-Fi send and receive information using Computers with Wi-Fi send and receive information using radio wavesradio waves
This system could be used to send remittances This system could be used to send remittances This technology could be administered by local micro-This technology could be administered by local micro-
finance institutions finance institutions This system also could offer advantages to local businesses This system also could offer advantages to local businesses
as to generate investment (such as a discount of half or a as to generate investment (such as a discount of half or a third of the actual price of a phone call) and simultaneously third of the actual price of a phone call) and simultaneously an opportunity for new marketsan opportunity for new markets

Strategy III: Alliances with Home Town Strategy III: Alliances with Home Town Associations Associations
Seek communication and dialogue with HTAs;Seek communication and dialogue with HTAs; Social developmentSocial development
Donor technical assistance for project identification;Donor technical assistance for project identification; Support of a transnational community radio; Support of a transnational community radio; Donor support on governance and democratic Donor support on governance and democratic
participation; participation; Donor partnerships in social (health and education) and Donor partnerships in social (health and education) and
infrastructural projects infrastructural projects Economic development Economic development
Government incentives to attract private sector Government incentives to attract private sector involvement;involvement;
Government support in investment feasibility analysis;Government support in investment feasibility analysis; Financial infrastructureFinancial infrastructure
Support education on financial services;Support education on financial services; Support to link technology to education, communication Support to link technology to education, communication
and remittances in the rural areas.and remittances in the rural areas.
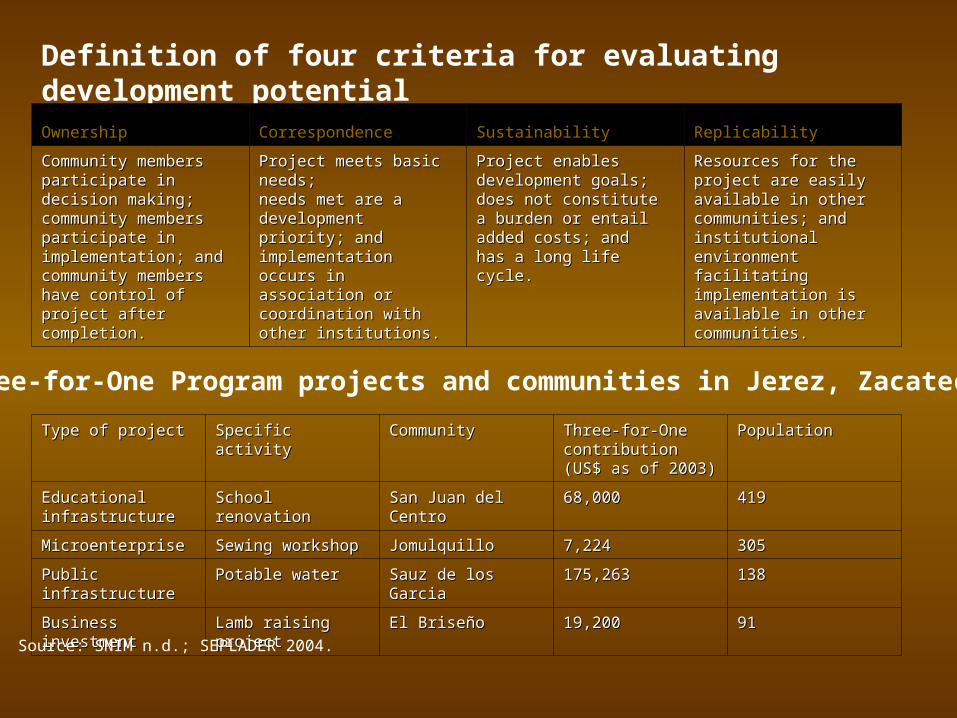
Definition of four criteria for evaluating development potential
OwnershipOwnership CorrespondenceCorrespondence SustainabilitySustainability ReplicabilityReplicability
Community members Community members participate in decision participate in decision making;making;community members community members participate in participate in implementation; andimplementation; andcommunity members community members have control of project have control of project after completion.after completion.
Project meets basic Project meets basic needs;needs;needs met are a needs met are a development priority; development priority; andandimplementation occurs implementation occurs in association or in association or coordination with other coordination with other institutions.institutions.
Project enables Project enables development goals;development goals;does not constitute a does not constitute a burden or entail added burden or entail added costs; andcosts; andhas a long life cycle.has a long life cycle.
Resources for the Resources for the project are easily project are easily available in other available in other communities; and communities; and institutional institutional environment facilitating environment facilitating implementation is implementation is available in other available in other communities.communities.
Type of projectType of project Specific activitySpecific activity CommunityCommunity Three-for-One Three-for-One contributioncontribution(US$ as of 2003)(US$ as of 2003)
PopulationPopulation
Educational Educational infrastructureinfrastructure
School renovationSchool renovation San Juan del San Juan del CentroCentro
68,00068,000 419419
MicroenterpriseMicroenterprise Sewing workshopSewing workshop JomulquilloJomulquillo 7,2247,224 305305
Public Public infrastructureinfrastructure
Potable waterPotable water Sauz de los GarciaSauz de los Garcia 175,263175,263 138138
Business Business investmentinvestment
Lamb raising Lamb raising projectproject
El BriseñoEl Briseño 19,20019,200 91 91
Three-for-One Program projects and communities in Jerez, Zacatecas
Source: SNIM n.d.; SEPLADER 2004.

Scorecard for evaluating a project’s potential for enhancing equity
CriteriaCriteria SchoolSchool
Micro-Micro-enterprisenterprisee
Potable Potable waterwater
LambLambraisinraisingg
OwnershipOwnership
Participation in decision making;Participation in decision making; 44 44 33 33
Participation in implementation;Participation in implementation; 55 55 33 44
Control of projectControl of project 33 55 44 44
CorrespondenceCorrespondence
Project meets basic needs;Project meets basic needs; 44 44 55 33
Needs met are a development priority;Needs met are a development priority; 33 33 55 33
Implementation in association or coordination with other Implementation in association or coordination with other institutionsinstitutions 44 55 33 55
SustainabilitySustainability
Enables development goals;Enables development goals; 44 44 55 44
Does not constitute burden or entail added costs;Does not constitute burden or entail added costs; 44 33 55 44
Long life cycle Long life cycle 33 22 55 44
ReplicabilityReplicability
Resources are easily available in other communities;Resources are easily available in other communities; 44 44 44 33
Institutional environment is available in other communities Institutional environment is available in other communities 44 44 44 44
TotalTotal 4242 4343 4646 4141Source: Scorecard developed by the authors.

Strategy IV: Expansion of Financial Investment Strategy IV: Expansion of Financial Investment
0
10
20
30
40
50
60
70
80
90
Mexico El Salvador Dominican Rep. Ecuador
Adquisición de productos nostálgicos
Rum
Cigars
Tamales
Bread
Tea
Cheese

Strategy IVa: Promotion of the nostalgic Strategy IVa: Promotion of the nostalgic market market
a.a. Risk and investment analysisRisk and investment analysisb.b. Build partnerships between the private Build partnerships between the private
sector and the immigrant community;sector and the immigrant community;c.c. Financing small investment projects Financing small investment projects
within rural sectorswithin rural sectorsd.d. Involve home town associations and Involve home town associations and
NGOs with strategies to invest NGOs with strategies to invest

Strategy IVb: Tourism and Migration Strategy IVb: Tourism and Migration
Establish travel packages to traditional Establish travel packages to traditional places places
Establish new and innovative products Establish new and innovative products for tourists for tourists
Create new investment strategies to Create new investment strategies to promote tourismpromote tourism

Strategy V: Connecting the external community with assistance Strategy V: Connecting the external community with assistance
a.a. Adopt linking with the diaspora as part of the Adopt linking with the diaspora as part of the country’s foreign policy. Use the consulates as country’s foreign policy. Use the consulates as points of contact.points of contact.
b.b. Forge mutual confidence: Forge mutual confidence: a.a. Support their activities carried out as an organized groupSupport their activities carried out as an organized groupb.b. Establish ties through meetings and conferences;Establish ties through meetings and conferences;c.c. Help in the creation of a diaspora agenda;Help in the creation of a diaspora agenda;d.d. Carry out services demanded by the community;Carry out services demanded by the community;e.e. Implement summer camps programsImplement summer camps programs
c.c. Create an office of attention to nationals linving Create an office of attention to nationals linving abroadabroad
a.a. Unit of community contactUnit of community contactb.b. Unit linking the state and the communityUnit linking the state and the communityc.c. Unit of study and analysisUnit of study and analysis
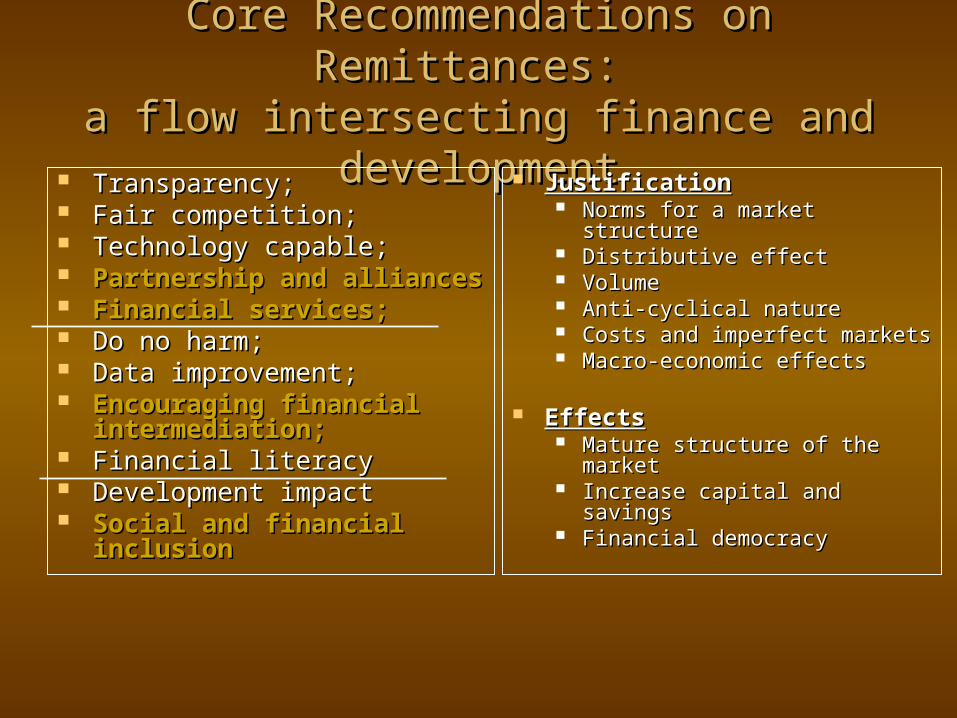
Core Recommendations on Remittances: Core Recommendations on Remittances: a flow intersecting finance and developmenta flow intersecting finance and development
Transparency;Transparency; Fair competition;Fair competition; Technology capable;Technology capable; Partnership and alliancesPartnership and alliances Financial services;Financial services; Do no harm;Do no harm; Data improvement;Data improvement; Encouraging financial Encouraging financial
intermediation;intermediation; Financial literacyFinancial literacy Development impactDevelopment impact Social and financial Social and financial
inclusion inclusion
JustificationJustification Norms for a market structureNorms for a market structure Distributive effectDistributive effect VolumeVolume Anti-cyclical natureAnti-cyclical nature Costs and imperfect marketsCosts and imperfect markets Macro-economic effectsMacro-economic effects
EffectsEffects Mature structure of the Mature structure of the
marketmarket Increase capital and savingsIncrease capital and savings Financial democracyFinancial democracy


Promoting financial literacy and consumer rightsPromoting financial literacy and consumer rights
Best Practices of Remittance Transfers: What works to the customer’s benefit.
CriteriaCriteria IndicatorsIndicators
1. 1. Transfer feeTransfer fee Lowered fees for customers may indicate Lowered fees for customers may indicate lowered costs for remittance companies.lowered costs for remittance companies.
2. 2. Exchange rate usedExchange rate used If there is no exchange rate, no currency If there is no exchange rate, no currency purchase costs are incurred by sender and purchase costs are incurred by sender and recipients. Fees may be higher, however.recipients. Fees may be higher, however.
3. 3. Transfer mechanism (hand delivery, money Transfer mechanism (hand delivery, money order, electronic transfer: debit card, bank to order, electronic transfer: debit card, bank to bank, internet, courier agency transfer, etc.)bank, internet, courier agency transfer, etc.)
More capital intensive the transactions More capital intensive the transactions mean lower costs for the company, but not mean lower costs for the company, but not necessarily lower fees for the consumer.necessarily lower fees for the consumer.
4. 4. Marketplace competition (supply side)Marketplace competition (supply side) The higher number the number of The higher number the number of companies in any market, the lower the companies in any market, the lower the transfer costs. The exception is when transfer costs. The exception is when companies are formed in monopolies, companies are formed in monopolies, oligopolies or remittance ‘cartels’.oligopolies or remittance ‘cartels’.
5. 5. Business location and geographic coverageBusiness location and geographic coverage Companies located within areas with a Companies located within areas with a better economic infrastructure exhibit better economic infrastructure exhibit lower transaction costslower transaction costs
6. 6. Development supportDevelopment support Support to the local community adds value Support to the local community adds value to the product and loyalty to the companyto the product and loyalty to the company
7. 7. Financial ServicesFinancial Services Offering services such as banking or bill Offering services such as banking or bill payment increases interest in the companypayment increases interest in the company
8. 8. TransparencyTransparency A company that advertises its exchange A company that advertises its exchange rates cultivates or promotes more trust rates cultivates or promotes more trust from the customer. from the customer.
9. 9. Compliance to regulationsCompliance to regulations A company that meets all the requirements A company that meets all the requirements operate as a remitter.operate as a remitter.
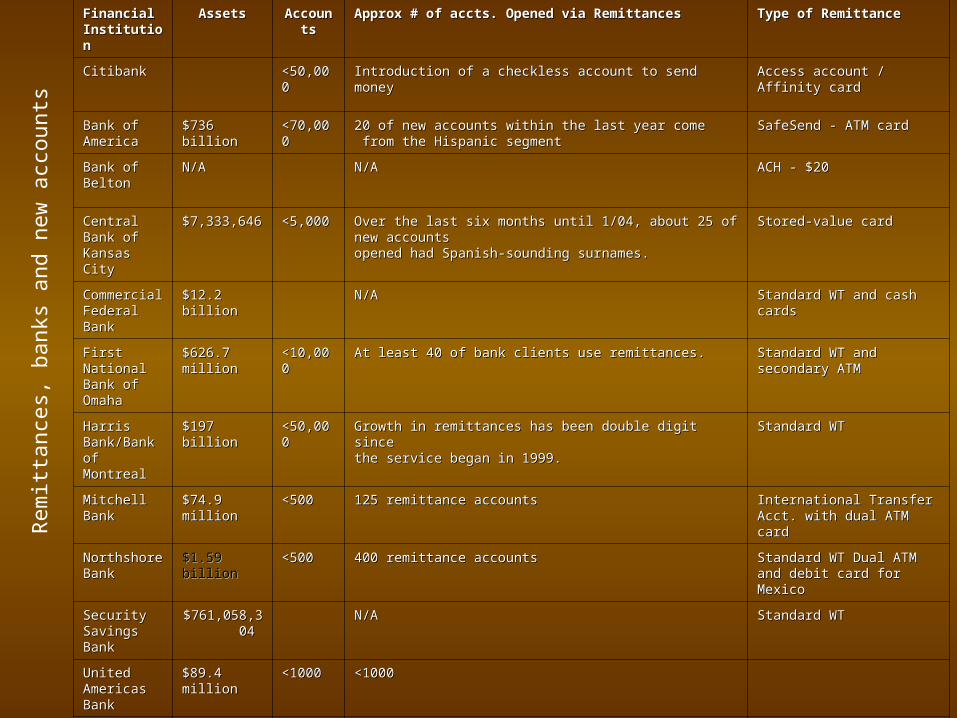
Financial Financial InstitutionInstitution
Assets Assets AccountsAccounts Approx # of accts. Opened via RemittancesApprox # of accts. Opened via Remittances Type of RemittanceType of Remittance
CitibankCitibank <50,000<50,000 Introduction of a checkless account to send moneyIntroduction of a checkless account to send money Access account / Affinity cardAccess account / Affinity card
Bank of Bank of AmericaAmerica
$736 $736 billion billion <70,000<70,000 20 20 of new accounts within the last year comeof new accounts within the last year come from the Hispanic segmentfrom the Hispanic segment
SafeSend - ATM cardSafeSend - ATM card
Bank of Bank of BeltonBelton
N/AN/A N/AN/A ACH - $20ACH - $20
Central Bank Central Bank of Kansas Cityof Kansas City
$7,333,646 $7,333,646 <5,000<5,000 Over the last six months until 1/04, about 25 of new accounts Over the last six months until 1/04, about 25 of new accounts opened had Spanish-sounding surnames. opened had Spanish-sounding surnames.
Stored-value cardStored-value card
Commercial Commercial Federal BankFederal Bank
$12.2 $12.2 billionbillion N/AN/A Standard WT and cash cards Standard WT and cash cards
First National First National Bank of Bank of OmahaOmaha
$626.7 $626.7 millionmillion <10,000<10,000 At least 40 of bank clients use remittances.At least 40 of bank clients use remittances. Standard WT and secondary Standard WT and secondary ATMATM
Harris Harris Bank/Bank of Bank/Bank of MontrealMontreal
$197 $197 billionbillion <50,000<50,000 Growth in remittances has been double digit since Growth in remittances has been double digit since the service began in 1999. the service began in 1999.
Standard WT Standard WT
Mitchell BankMitchell Bank $74.9 $74.9 millionmillion <500<500 125 125 remittance accounts remittance accounts International Transfer Acct. with International Transfer Acct. with dual ATM carddual ATM card
Northshore Northshore BankBank
$1.59 $1.59 billionbillion <500<500 400 400 remittance accountsremittance accounts Standard WT Dual ATM and Standard WT Dual ATM and debit card for Mexico debit card for Mexico
Security Security Savings BankSavings Bank
$761,058,304 $761,058,304 N/AN/A Standard WTStandard WT
United United Americas Americas BankBank
$89.4 $89.4 millionmillion <1000<1000 <1000<1000
US Bank US Bank $189 $189 billionbillion 12 12 overall increase in market share of Hispanics since the 2001 overall increase in market share of Hispanics since the 2001 launch of its Hispanic initiative. Since its launch, launch of its Hispanic initiative. Since its launch, 56 of all non-account holders have converted into regular customers 56 of all non-account holders have converted into regular customers
Secure Money Transfer (SMT) at Secure Money Transfer (SMT) at the ATM and Secure Money the ATM and Secure Money Transfer with the People’s Transfer with the People’s Network Network
Wells FargoWells Fargo $388 $388 billion billion <250,000<250,000 Above average cross-sales levels for border transaction customers. Above average cross-sales levels for border transaction customers. WF’s cross-sell ratio exceeds the banks’ average. WF’s cross-sell ratio exceeds the banks’ average.
Intercuenta Express, an account-Intercuenta Express, an account-to-account wire transfer service. to-account wire transfer service. Dinero al Instante, similar WTDinero al Instante, similar WT
Rem
ittan
ces,
ban
ks a
nd n
ew a
ccou
nts

Credit unions, remittance and membershipCredit unions, remittance and membership
Financial Financial InstitutionInstitution
Assets Assets AccouAccountsnts
Approx # of accts. Opened via RemittancesApprox # of accts. Opened via Remittances Type of RemittanceType of Remittance
Chicanos por Chicanos por la Causa la Causa Federal CUFederal CU
$4.47 $4.47 millionmillion
<500<500 In 2003, the CU made 355 transmissions worth $150,000.In 2003, the CU made 355 transmissions worth $150,000. IRnetIRnet
Greater El Greater El Paso's CUPaso's CU
$940,348,56$940,348,560 0
<500<500 Averages close to 70 transactions per month at about $Averages close to 70 transactions per month at about $300-$500 300-$500 each.each.
IRnetIRnet
Midwest Midwest Industrial Industrial Credit UnionCredit Union
$5.5 $5.5 millionmillion <500<500 25-35 25-35 remittance transactions per month. Over the past two remittance transactions per month. Over the past two years, years, the newest influence on the CU has been 75 Hispanic.the newest influence on the CU has been 75 Hispanic.
IRnetIRnet
Coasthills Coasthills Community Community CUCU
$402 $402 millionmillion <500<500 In 2002, the CU made 268 Vigo transactions and 394 in 2003. In 2002, the CU made 268 Vigo transactions and 394 in 2003. 75 of individuals who open accounts at the Santa Maria branches 75 of individuals who open accounts at the Santa Maria branches are Spanish-speaking. are Spanish-speaking.
IRnetIRnet
Latino Latino Community Community Credit UnionCredit Union
$14 $14 millionmillion <1000<1000 In 2003, the CU wired $1.5 million. In 2003, the CU wired $1.5 million. IRnet and Visa ATM check IRnet and Visa ATM check card.card.
Santa Cruz Santa Cruz Community Community CUCU
$58,215,520 $58,215,520 From 2002-2003, volume has doubled both in terms of number From 2002-2003, volume has doubled both in terms of number of transactions of transactions and dollar amounts. and dollar amounts.
VigoVigo
Laredo Laredo Federal Federal Credit UnionCredit Union
$81 $81 million million <500<500 30 30 transactions per monthtransactions per month VigoVigo

““The demand for financial services by remittance receiving households The demand for financial services by remittance receiving households rests on the intersection between the role of microfinance institutions, rests on the intersection between the role of microfinance institutions,
such as credit unions, and rural sector development.” such as credit unions, and rural sector development.”
$1.2$4.1
$9.6$13.5
$17.1
$24.0
$41.2
$0.0
$10.0
$20.0
$30.0
$40.0
$50.0
Q4 01 Q1 02 Q2 02 Q3 02 Q4 02 Q1 03 Q2 03
Volume of Remittances Distributed by 62 Central American CUs in US$ Millions

Mexico: Remittances to rural households Mexico: Remittances to rural households
$106,862 $442,704$1,053,786
$1,923,668
$3,256,231
$15,027,550
$0
$2,000,000
$4,000,000
$6,000,000
$8,000,000
$10,000,000
$12,000,000
$14,000,000
$16,000,000
Menos de 999 1,000 a 2999 3,000 a 4999 5,000 a 9,999 10,000 a 14,999 Mas de 15,000
15 recibe US$250 al mes, siete veces al año.

Strategy IIb: Remittances and TechnologyStrategy IIb: Remittances and Technology
Wireless internet accessibility, Wi-Fi (Wireless Fidelity) Wireless internet accessibility, Wi-Fi (Wireless Fidelity) offers the opportunity to integrate the rural sector using offers the opportunity to integrate the rural sector using computer equipment at a low costcomputer equipment at a low cost
Computers with Wi-Fi send and receive information using Computers with Wi-Fi send and receive information using radio wavesradio waves
This system could be used to send remittances This system could be used to send remittances This technology could be administered by local micro-This technology could be administered by local micro-
finance institutions finance institutions This system also could offer advantages to local businesses This system also could offer advantages to local businesses
as to generate investment (such as a discount of half or a as to generate investment (such as a discount of half or a third of the actual price of a phone call) and simultaneously third of the actual price of a phone call) and simultaneously an opportunity for new markets an opportunity for new markets

Volume and Price in Volume and Price in Latin AmericaLatin America
Manuel OrozcoManuel Orozco

Remittances to Latin America, 2001-2003
9,273
2,600
1,600
1,807
1,920
584
1,400
967
930
905
810
460
610
103
42
10,502
4,600
2,431
2,206
2,111
1,689
1,575
1,288
1,265
1,138
931
770
759
235
119
104
59
38
13,266
5200
3,067
2217
2316
2106
1656.9
1425.9
1194
1295
977
862
787.5
247
306
136.5
340
88
225
73.5
0 2,000 4,000 6,000 8,000 10,000 12,000 14,000
Mexico
Brazil a
Colombia
Dominicana
El Salvador
Guatemala
Ecuador
Jamaica
Cuba a
Peru
Haiti a
Honduras
Nicaragua a
Venezuela
Costa Rica
Guyana a
Bolivia
Trinidad y Tobago
Argentina
Belize
2003 (38 billion)2002 (32 billion)2001 (24 billion)

Quarterly flows to selected Latin American Quarterly flows to selected Latin American countriescountries
20
70
120
170
220
Jan-
99
Mar
-99
May
-99
Jul-9
9
Sep-9
9
Nov-99
Jan-
00
Mar
-00
May
-00
Jul-0
0
Sep-0
0
Nov-00
1-Ja
n
1-Mar
1-May
1-Ju
l
1-Sep
1-Nov
2-Ja
n
2-Mar
2-May
Jul.
2002
Sept.
2002
Nov. 200
2
3-Ja
n
3-Mar
3-May
3-Ju
l
3-Sep
5
5.5
6
6.5
7
7.5
8
8.5
9
Jamaica
Guatemala
El Salvador
Dominican Republic
Latino Unemployment

Remittances to Latin America: average amount sent by an immigrantRemittances to Latin America: average amount sent by an immigrant
393
365
340
300
299
286
281
273
266
263
244
236
223
208
199
183
173
156
154
153
146
0 50 100 150 200 250 300 350 400 450
El Salvador
Mexico
Costa Rica
Ecuador
Brazil
Chile
Paraguay
Guatemala
Jamaica
Colombia
Honduras
Bolivia
Argentina
Panama
Uruguay
Dom. Rep.
Peru
Venezuela
Guyana
Haiti
Nicaragua
2003 2002

Latin Remittance SenderLatin Remittance Sender
A person who represents two thirds of A person who represents two thirds of immigrants;immigrants;
Sends regularly, at least ten times a year;Sends regularly, at least ten times a year; Has an income below $25,000 (60);Has an income below $25,000 (60); Has a basic education below high school (50);Has a basic education below high school (50); Sends about $3,000 annually;Sends about $3,000 annually; Has a longstanding commitment with their Has a longstanding commitment with their
parents (at least 5 years);parents (at least 5 years); Uses intermediaries to send money (70);Uses intermediaries to send money (70); Does not have a bank account (40);Does not have a bank account (40); Is an adult over 36 years old;Is an adult over 36 years old;

Average amount sent and length of time living in the Average amount sent and length of time living in the U.S.U.S.
0
5
10
15
20
25
30
35
Menos de un año Entre uno y tresaños
Entre cuatro yseis años
Entre siete ynueve años
Mas de diez
Cuba Guyana Dominican Republic LAC average

Immigrants and bank accountsImmigrants and bank accounts
0
10
20
30
40
50
60
70
80
Bank Account (%) No Bank Account (%)
Cuba Guyana Dominican Republic Total

Why doesn’t have a bank account?Why doesn’t have a bank account?
0.00%
5.00%
10.00%
15.00%
20.00%
25.00%
30.00%
Do not trust banks Doesn't have papers Doesn't need bank acc.
Cuba Guyana Dominican Republic LAC average

Do you have debit, credit card, or bothDo you have debit, credit card, or both
0.00%
10.00%
20.00%
30.00%
40.00%
50.00%
60.00%
I have both Credit Debit I have none
Cuba Guyana Dominican Republic LAC average

Do you have financial obligations (loans)?Do you have financial obligations (loans)?
0.00%
5.00%
10.00%
15.00%
20.00%
25.00%
30.00%
35.00%
Cuba Guyana Dominican Republic LAC average
Personal Income and Years living in U.S.Personal Income and Years living in U.S.
0
5
10
15
20
25
30
35
Less than sixyears
Seven totwelve
Over twelveyears
Hasta 10,000
Entre 10,001 y 15,000
Entre 15,001 y 20,000
Entre 20,001 y 25,000
Entre 25,001 y 30,000
Entre 30,001 y 35,000
Más de 35,000

Remittances and the Remittances and the MarketMarket
Some features and trendsSome features and trends

Money TransferCompany
MTC’s bank
MTC’s rec. country Agent Distributor
AD’s bank
Data Transfer Report(customer’s sendingInformation)
Wire Transfer (cash transferAmount)
MTC’s AgentPOS
MTC’s AgentPOS
Remittance sender
Remittance
recip
ient
Regulatory EnvironmentComplianceMonitoring
International money transfer operation
MTC: Money transfer companyPOS: Point of saleAD: Agent distributor (on receiving side)
TWO DATASTREAMS

The Transfer of Remittances: A Diffuse The Transfer of Remittances: A Diffuse MarketMarket
• Change•Proliferation of companies in process of consolidation, • Slow but gradual decline in the transfer costs;•New practices and services provided•Growing interest of the banking community and governments
•Continuity•Charges remain expensive, as well as exchange rate•Charges vary among countries•Competition has yet to affect oligopolies•Little incentives on senders or recipients

Competition among major remittance Competition among major remittance recipientsrecipients
0
2
4
6
8
10
12
14
16
Company 90s Company 02 Prices 90s Prices 02
MexicoEl SalvadorDominican RepublicGuatemalaJamaica
Number of money transfer companies holding 50 or more of market share
Cost of sending money to selected countries (as percent of principal sent)

Cost to transfer remittances in February 2004Cost to transfer remittances in February 2004
12.11%
10.63%
8.88%
11.32%
7.32% 7.26%
6.37%
6.93%
5.75%
8.17%
5.36%
7.30%
5.56%
8.56%
8.02%
7.20%
0.00%
2.00%
4.00%
6.00%
8.00%
10.00%
12.00%
14.00%
Cuba J amaica Haiti Dominican Rep. Mexico Guatemala Colombia Nicaragua El Salvador Bolivia Ecuador Honduras Peru Venezuela Latin America
2004 Banks

Cost comparison between principal amount sent and sending $200Cost comparison between principal amount sent and sending $200
12.11%
11.32%
10.63%
10.33%
8.88%
7.48%
0.00% 2.00% 4.00% 6.00% 8.00% 10.00% 12.00% 14.00%
Cuba
Dominican Rep.
Jamaica
Haiti
Latin America PrincipalUS200

Percent cost to send $200 to Latin AmericaPercent cost to send $200 to Latin America
0.00%
2.00%
4.00%
6.00%
8.00%
10.00%
12.00%
14.00%
Cuba Jamaica Haiti Dominican Rep. Latin America
2001 2002 2003 2004

Changes over time in costs to send principal amountChanges over time in costs to send principal amount
0.00%
2.00%
4.00%
6.00%
8.00%
10.00%
12.00%
14.00%
Jamaica (260) Dom. Rep. (200) Cuba (150) Guyana (200) Latin America(250)
2001 2002 2003 2004

Percent cost to send $200Percent cost to send $200
9.00%
8.25%8.18%8.02% 8.07%
9.20%
7.35%7.32% 7.20%
6.69%
6.02%5.83%5.75% 5.65%5.45%5.36%
8.80%
8.24%7.84%
7.10%
0.00%
2.00%
4.00%
6.00%
8.00%
10.00%
Latin America Mexico El Salvador Ecuador Mean cost ofprincipal sent
2001 2002 2003 2004 US Banks

Remittances Via ATM/Debit Cards and Resulting Fees for Sending $300 to MexicoRemittances Via ATM/Debit Cards and Resulting Fees for Sending $300 to Mexico
CompanyCompanyWithdrawal Withdrawal FeesFees
Subject to Subject to additional additional withdraw withdraw fees from fees from Mexican Mexican
ATMATM
Number of Number of ATM/Debit ATM/Debit
Cards Cards issued with issued with
accountaccount
Average Average Exchange Exchange
Rate of Two Rate of Two Major Major
Mexican Mexican BanksBanks[1][1]
InterbankInterbankExchange Exchange
RateRate30-Jan-0330-Jan-03[2][2]
Exchange Exchange Charge Plus Charge Plus Fee ChargeFee Charge
Other FeesOther Fees
First Bank of First Bank of the the
Americas, Americas, QuickcashQuickcash
$1.50 $1.50 for first 4 for first 4 withdrawalswithdrawals
/month ($1.50 /month ($1.50 extra after 4 extra after 4
withdrawals in a withdrawals in a month)month)
XX 22 10.7810.78 10.8610.86 $3.85$3.85
Banco Banco Popular,Popular,Acceso Acceso PopularPopular
$1.00 (2 $1.00 (2 free free Banco Popular Banco Popular
ATM ATM withdrawals per withdrawals per
month)month)
XX 22 10.7810.78 10.8610.86 $3.35$3.35
Fifth Third Fifth Third BankBank
$3.00$3.00 XX 11 10.7810.78 10.8610.86 $2.35$2.35
Michell Michell BankBank $2.50$2.50 XX 22 10.7810.78 10.8610.86 $4.85$4.85
$3 $3 to open a cash to open a cash deposit only accountdeposit only account
Citibank, Citibank, $5$5Not at Not at
BanamexBanamex 11 10.7810.78 10.8610.86 $10.30$10.30
Elgin State Elgin State BankBank
$1.50$1.50 XX 22 10.7810.78 10.8610.86 $5.35$5.35
Bank of Bank of America, America,
Safe SendSafe Send[3][3]
$10.00 $10.00 per per transfer ($15 if transfer ($15 if
not BofA not BofA cardholder); $3 cardholder); $3 per withdrawal, per withdrawal,
and one free and one free withdrawal per withdrawal per
transfertransfer
xx 22 10.7810.78 10.8610.86 $12.35$12.35
$12 $12 to open account; to open account; $3 fee if ATM $3 fee if ATM
withdrawal is used withdrawal is used more than once per more than once per
transfertransfer[1] Average Exchange rate of Bancomer and Banamex for 30-Jan-03. The bank that owns the ATM usually applies the exchange rate at the time of ATM withdrawal. Therefore, this average approximates exchange rate received by a customer accessing his remittances through an ATM.[2] Banco Central de Mexico Official Exchange Rate.[3] Other fees that apply: A US$4.00 Representative Assisted Fee will be charged each time You or the Recipient talk directly with a person. This fee will be waived for the first 4 such calls each annual period beginning with the enrollment date. A US$1.00 Automated Inquiry Service Fee will be charged each time the Sender or the Recipient make an inquiry using a voice response system. This fee will be waived for the first 2 inquiries following a transfer of money to the Card account. A US$0.50 ATM Balance Inquiry Fee will be charged each time the Sender or the Recipient makes a balance inquiry through an ATM. This fee will be waived for the first 2 balance inquiries following a transfer of money to the Card account. A US$3.00 Fee for Statement Copy Request will be charged each time the Recipient orders an additional statement to be printed and mailed to the Recipient.

Remittances Sent through American Banks and Picked Up at Mexican Banks/Agencies and Resulting Fees for Sending $300
Remittances Sent through American Banks and Picked Up at Mexican Banks/Agencies and Resulting Fees for Sending $300
CompanyCompanyTransactiTransacti
on Feeon Fee
Exchange Exchange RateRate
30-Jan-0330-Jan-03
Interbank Interbank Exchange Exchange RateRate[1][1]
Exchange Charge Exchange Charge Plus Fee ChargePlus Fee Charge
Other FeesOther Fees Affiliated Affiliated Bank/Agency in Bank/Agency in
MexicoMexico
Second Second Federal Federal Savings, Savings, CoofiaCoofia
$15.00$15.00 10.6810.68 10.8610.86 $19.97$19.97Uses many different Uses many different recipient agenciesrecipient agencies
Second Second Federal Federal Savings, Savings, UnitellerUniteller
$10.00$10.00 10.7910.79 10.8610.86 $11.93$11.93Uses many different Uses many different recipient agenciesrecipient agencies
Park Park Federal Federal Savings Savings Bank, Bank,
UnitellerUniteller
$10.00$10.00 10.7210.72 10.8610.86 $13.87$13.87
MX$10.00 MX$10.00 when money when money
is picked up in is picked up in Mexico.Mexico.
Uses many different Uses many different recipient agenciesrecipient agencies
Wells Wells Fargo,Fargo,
Intercuenta Intercuenta Express to Express to BancomerBancomer
$10.00$10.00 10.5610.56 10.8610.86 $18.29$18.29 BancomerBancomer
Wells Wells Fargo, Fargo,
Dinero al Dinero al InstanteInstante
$10.00$10.00 10.6510.65 10.8610.86 $15.80$15.80 BanamexBanamex
[1] Banco Central de Mexico Official Exchange Rate.

Wire Transfers (the exchange rate is determined by receiving bank and the money is directly deposited into an account of the receiving bank)
CharacteristicsCharacteristics Transaction FeeTransaction Fee
Lincoln Park Savings BankLincoln Park Savings Bank $45.00$45.00
Metropolitan BankMetropolitan Bank For customers only-service is free of charge.For customers only-service is free of charge.
Lake City BankLake City Bank $50.00$50.00
Archer BankArcher Bank $50.00 ($50.00 (for customers having an account for a minimum of 2 months only)for customers having an account for a minimum of 2 months only)
Chicago Community Bank (merged with Chicago Community Bank (merged with Universal Federal Savings, summer 2002)Universal Federal Savings, summer 2002)
$52.00$52.00
Edens BankEdens Bank $40.00$40.00
North Community BankNorth Community Bank $21.00 ($21.00 (service is for customers only)service is for customers only)
Plaza BankPlaza Bank $40.00 ($40.00 (customers only)customers only)
MidAmerica BankMidAmerica Bank $40.00 ($40.00 (service is for customers only)service is for customers only)
Banco PopularBanco Popular $30.00 ($30.00 (service is for customers only)service is for customers only)
Cardunal Savings BankCardunal Savings Bank $40.00 ($40.00 (customers and non-customers)customers and non-customers)
Bank OneBank One $40.00$40.00
US BankUS Bank $35.00 ($35.00 (service is for customers only)service is for customers only)
Park Federal Savings BankPark Federal Savings Bank $60.00$60.00
CitibankCitibank $40.00$40.00
Elgin State BankElgin State Bank $50.00$50.00
Fifth Third BankFifth Third Bank $30.00$30.00
First Bank of the AmericasFirst Bank of the Americas $35.00$35.00
Mitchell BankMitchell Bank $10.00$10.00
Second Federal SavingsSecond Federal Savings $40.00$40.00

Financial Financial InstitutionInstitution
Assets Assets AccountsAccounts Approx # of accts. Opened via RemittancesApprox # of accts. Opened via Remittances Type of RemittanceType of Remittance
CitibankCitibank <50,000<50,000 Introduction of a checkless account to send moneyIntroduction of a checkless account to send money Access account / Affinity cardAccess account / Affinity card
Bank of Bank of AmericaAmerica
$736 $736 billion billion <70,000<70,000 20 20 of new accounts within the last year comeof new accounts within the last year come from the Hispanic segmentfrom the Hispanic segment
SafeSend - ATM cardSafeSend - ATM card
Bank of Bank of BeltonBelton
N/AN/A N/AN/A ACH - $20ACH - $20
Central Bank Central Bank of Kansas Cityof Kansas City
$7,333,646 $7,333,646 <5,000<5,000 Over the last six months until 1/04, about 25 of new accounts Over the last six months until 1/04, about 25 of new accounts opened had Spanish-sounding surnames. opened had Spanish-sounding surnames.
Stored-value cardStored-value card
Commercial Commercial Federal BankFederal Bank
$12.2 $12.2 billionbillion N/AN/A Standard WT and cash cards Standard WT and cash cards
First National First National Bank of Bank of OmahaOmaha
$626.7 $626.7 millionmillion <10,000<10,000 At least 40 of bank clients use remittances.At least 40 of bank clients use remittances. Standard WT and secondary Standard WT and secondary ATMATM
Harris Harris Bank/Bank of Bank/Bank of MontrealMontreal
$197 $197 billionbillion <50,000<50,000 Growth in remittances has been double digit since Growth in remittances has been double digit since the service began in 1999. the service began in 1999.
Standard WT Standard WT
Mitchell BankMitchell Bank $74.9 $74.9 millionmillion <500<500 125 125 remittance accounts remittance accounts International Transfer Acct. with International Transfer Acct. with dual ATM carddual ATM card
Northshore Northshore BankBank
$1.59 $1.59 billionbillion <500<500 400 400 remittance accountsremittance accounts Standard WT Dual ATM and Standard WT Dual ATM and debit card for Mexico debit card for Mexico
Security Security Savings BankSavings Bank
$761,058,304 $761,058,304 N/AN/A Standard WTStandard WT
United United Americas Americas BankBank
$89.4 $89.4 millionmillion <1000<1000 <1000<1000
US Bank US Bank $189 $189 billionbillion 12 12 overall increase in market share of Hispanics since the 2001 overall increase in market share of Hispanics since the 2001 launch of its Hispanic initiative. Since its launch, launch of its Hispanic initiative. Since its launch, 56 of all non-account holders have converted into regular customers 56 of all non-account holders have converted into regular customers
Secure Money Transfer (SMT) at Secure Money Transfer (SMT) at the ATM and Secure Money the ATM and Secure Money Transfer with the People’s Transfer with the People’s Network Network
Wells FargoWells Fargo $388 $388 billion billion <250,000<250,000 Above average cross-sales levels for border transaction customers. Above average cross-sales levels for border transaction customers. WF’s cross-sell ratio exceeds the banks’ average. WF’s cross-sell ratio exceeds the banks’ average.
Intercuenta Express, an account-Intercuenta Express, an account-to-account wire transfer service. to-account wire transfer service. Dinero al Instante, similar WTDinero al Instante, similar WT
Rem
ittan
ces,
ban
ks a
nd n
ew a
ccou
nts

Credit unions, remittance and membershipCredit unions, remittance and membership
Financial Financial InstitutionInstitution
Assets Assets AccouAccountsnts
Approx # of accts. Opened via RemittancesApprox # of accts. Opened via Remittances Type of RemittanceType of Remittance
Chicanos por Chicanos por la Causa la Causa Federal CUFederal CU
$4.47 $4.47 millionmillion
<500<500 In 2003, the CU made 355 transmissions worth $150,000.In 2003, the CU made 355 transmissions worth $150,000. IRnetIRnet
Greater El Greater El Paso's CUPaso's CU
$940,348,56$940,348,560 0
<500<500 Averages close to 70 transactions per month at about $Averages close to 70 transactions per month at about $300-$500 300-$500 each.each.
IRnetIRnet
Midwest Midwest Industrial Industrial Credit UnionCredit Union
$5.5 $5.5 millionmillion <500<500 25-35 25-35 remittance transactions per month. Over the past two remittance transactions per month. Over the past two years, years, the newest influence on the CU has been 75 Hispanic.the newest influence on the CU has been 75 Hispanic.
IRnetIRnet
Coasthills Coasthills Community Community CUCU
$402 $402 millionmillion <500<500 In 2002, the CU made 268 Vigo transactions and 394 in 2003. In 2002, the CU made 268 Vigo transactions and 394 in 2003. 75 of individuals who open accounts at the Santa Maria branches 75 of individuals who open accounts at the Santa Maria branches are Spanish-speaking. are Spanish-speaking.
IRnetIRnet
Latino Latino Community Community Credit UnionCredit Union
$14 $14 millionmillion <1000<1000 In 2003, the CU wired $1.5 million. In 2003, the CU wired $1.5 million. IRnet and Visa ATM check IRnet and Visa ATM check card.card.
Santa Cruz Santa Cruz Community Community CUCU
$58,215,520 $58,215,520 From 2002-2003, volume has doubled both in terms of number From 2002-2003, volume has doubled both in terms of number of transactions of transactions and dollar amounts. and dollar amounts.
VigoVigo
Laredo Laredo Federal Federal Credit UnionCredit Union
$81 $81 million million <500<500 30 30 transactions per monthtransactions per month VigoVigo

Remittances and costs to CubaRemittances and costs to Cuba
11.60%
11.80%
12.00%
12.20%
12.40%
12.60%
12.80%
13.00%
13.20%
2001 2002 2003 2004
0
200
400
600
800
1000
1200
1400
Cost to send 200 Cost to send principal Remittances (thousands)

JamaicaJamaica
10.00%10.50%
12.50%
10.63%
967
1,288
1425.9
9.76% 9.71%
12.05%
10.33%
0.00%
2.00%
4.00%
6.00%
8.00%
10.00%
12.00%
14.00%
2001 2002 2003 2004
0
200
400
600
800
1000
1200
1400
1600
Cost to send 200
Remittances
Cost to send principal

HaitiHaiti
810
931
850.5
0.00%
2.00%
4.00%
6.00%
8.00%
10.00%
12.00%
14.00%
2001 2002 2003 2004
740
760
780
800
820
840
860
880
900
920
940
960
Cost to send $200
Remittances

Dominican RepublicDominican Republic
9.40%
8.43% 8.29%
11.30%
1,807
2,1112217
0.00%
2.00%
4.00%
6.00%
8.00%
10.00%
12.00%
2001 2002 2003 2004
0
500
1,000
1,500
2,000
2,500
Cost
Remittances (thousands)

MexicoMexico
6572
13929
10,502
9,273
6.29%
4.99%5.30%
4.40%4.10%
0.00%
2.00%
4.00%
6.00%
8.00%
10.00%
12.00%
14.00%
2000 2001 2002 2003 2004
0
2000
4000
6000
8000
10000
12000
14000
16000
Cost to send $200
Remittances
Cost to send principal
Cost to send via banks/Cu

GuatemalaGuatemala
7.39%7.34%
7.88%
7.26%
7.39%
6.67%
6.85%
6.69%
584
1,689
2106
6.00%
6.20%
6.40%
6.60%
6.80%
7.00%
7.20%
7.40%
7.60%
7.80%
8.00%
2001 2002 2003 2004
0
500
1000
1500
2000
2500
Cost to send $200 Cost to send principal Remittances

10.05%
8.67%
5.99%6.37%6.49%
6.22%6.70%
1,600
2,431
3,067
0.00%
2.00%
4.00%
6.00%
8.00%
10.00%
12.00%
2001 2002 2003 2004
0
500
1,000
1,500
2,000
2,500
3,000
3,500
Cost to send $200 Cost to send principal Remittances
ColombiaColombia
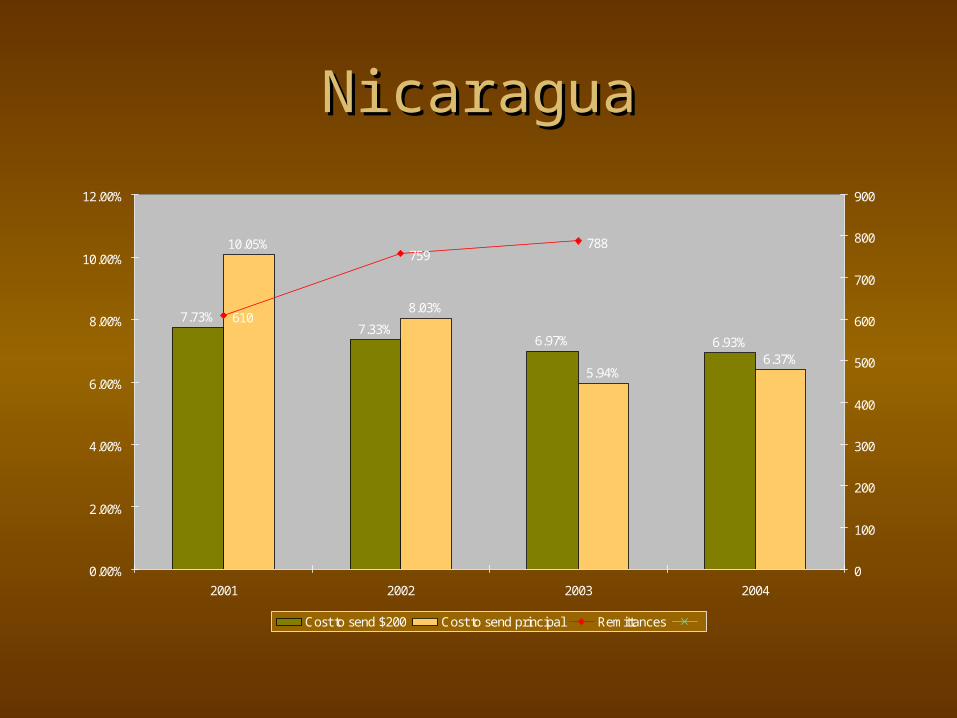
NicaraguaNicaragua
7.73%7.33%
6.97% 6.93%
10.05%
8.03%
5.94%6.37%
610
759788
0.00%
2.00%
4.00%
6.00%
8.00%
10.00%
12.00%
2001 2002 2003 2004
0
100
200
300
400
500
600
700
800
900
Cost to send $200 Cost to send principal Remittances

El SalvadorEl Salvador
6.69%
6.02%5.83% 5.75%
6.69%
5.25%
4.40%4.70%
1,920
2,2062316
0.00%
1.00%
2.00%
3.00%
4.00%
5.00%
6.00%
7.00%
8.00%
2001 2002 2003 2004
0
500
1,000
1,500
2,000
2,500
Cost to send $200 Cost to send principal Remittances

BoliviaBolivia
10.07%
8.17%
9.02%
7.57%
9.75%
103 104
340
0.00%
2.00%
4.00%
6.00%
8.00%
10.00%
12.00%
2001 2002 2003 2004
0
50
100
150
200
250
300
350
400
Cost to send $200 Cost to send principal Remittances

EcuadorEcuador
5.65%5.45% 5.36%
7.07%
4.50%
5.67%
1,400
1,575
1657
0.00%
1.00%
2.00%
3.00%
4.00%
5.00%
6.00%
7.00%
8.00%
2001 2002 2003 2004
1,250
1,300
1,350
1,400
1,450
1,500
1,550
1,600
1,650
1,700
Cost to send $200 Cost to send principal Remittances

HondurasHonduras
7.17%
6.94%
7.30%
6.49%
6.70%
6.22%
460
770
862
5.60%
5.80%
6.00%
6.20%
6.40%
6.60%
6.80%
7.00%
7.20%
7.40%
2001 2002 2003 2004
0
100
200
300
400
500
600
700
800
900
1000
Cost to send $200 Cost to send principal Remittances

PeruPeru
7.00%
5.67% 5.56%
7.07%
5.56%5.67%
905
1,1381194
0.00%
1.00%
2.00%
3.00%
4.00%
5.00%
6.00%
7.00%
8.00%
2001 2002 2003 2004
0
200
400
600
800
1000
1200
1400
Cost to send $200 Cost to send principal Remittances

VenezuelaVenezuela
13.54%
6.54%
8.56%
235
247
0.00%
2.00%
4.00%
6.00%
8.00%
10.00%
12.00%
14.00%
16.00%
2001 2002 2003 2004
228
230
232
234
236
238
240
242
244
246
248
Cost to send $200 Remittances

GuyanaGuyana
10.56%
10.10%
10.00%
100
137
9.70%
9.80%
9.90%
10.00%
10.10%
10.20%
10.30%
10.40%
10.50%
10.60%
10.70%
2001 2002 2003 2004
0
20
40
60
80
100
120
140
160
Cost to send $200 Remittances

Cost of remittances and volumeCost of remittances and volume
0.050 0.075 0.100 0.125 0.150
percent
0.00
1000000000.00
2000000000.00
3000000000.00
volu
me
Cuba
Venezuel
NicaraguHaiti
Bolivia
Dom. Rep
JamaicaPeru
Colombia
Guatemal
Honduras
Mexico
El Salva
Ecuador

Average amount sent and costsAverage amount sent and costs
0
50
100
150
200
250
300
350
400
0 5 10 15 20
0.00%
2.00%
4.00%
6.00%
8.00%
10.00%
12.00%
14.00%
Avg./Mo.
Jan. 04
Expon. (Avg./Mo.)
Expon. (Jan. 04)

Remittance transfers to Mexico: by method employed
0.00%
10.00%
20.00%
30.00%
40.00%
50.00%
60.00%
70.00%
80.00%
90.00%
100.00%
Jan-
95
Apr-95
Jul-9
5
Oct-9
5
Jan-
96
Apr-96
Jul-9
6
Oct-9
6
Jan-
97
Apr-97
Jul-9
7
Oct-9
7
Jan-
98
Apr-98
Jul-9
8
Oct-9
8
Jan-
99
Apr-99
Jul-9
9
Oct-9
9
Jan-
00
Apr-00
Jul-0
0
Oct-0
0
Jan-
01
Apr-01
Jul-0
1
Oct-0
1
Jan-
02
Apr-02
Jul-0
2
Oct-0
2
Jan-
03
Apr-03
Jul-0
3
Oct-0
3
Jan-
04
Money Order
Wire transfer
Cash

0
0.1
0.2
0.3
0.4
0.5
0.6
0.7
1994 1995 1996 1997 1998 1999 2000 2001 2002 2003
COMMERCIALS BANKS REMITTANCE COMPANIES BUILDING SOCIETIES

Flights from the United Flights from the United StatesStates
Fuente: "International Aviation Development Series," U.S. Department of Transportation
PaisPais FlightsFlights SeatsSeatsDaily Daily
flightsflights RevenueRevenue
Dominican RepublicDominican Republic 14411441 226586226586 4848 $147,280,900.00 $147,280,900.00
HaitiHaiti 317317 5585855858 1111 $ 36,307,700.00 $ 36,307,700.00
JamaicaJamaica 966966 165289165289 3232 $107,437,850.00 $107,437,850.00
CubaCuba 104104 75007500 33 $ 4,875,000.00 $ 4,875,000.00
El SalvadorEl Salvador 551551 7560575605 1818 $ 49,143,250.00 $ 49,143,250.00
GuatemalaGuatemala 465465 6094060940 1616 $ 39,611,000.00 $ 39,611,000.00
NicaraguaNicaragua 235235 3313733137 88 $ 21,539,050.00 $ 21,539,050.00
HondurasHonduras 410410 5636756367 1414 $ 36,638,550.00 $ 36,638,550.00

Immigrants with financial obligations (loans) in Immigrants with financial obligations (loans) in home country?home country?
0.00%
5.00%
10.00%
15.00%
20.00%
25.00%
30.00%
35.00%
Colombia Cuba Ecuador El Salvador Guatemala Guyana Honduras Mexico Nicaragua Dominican Republic
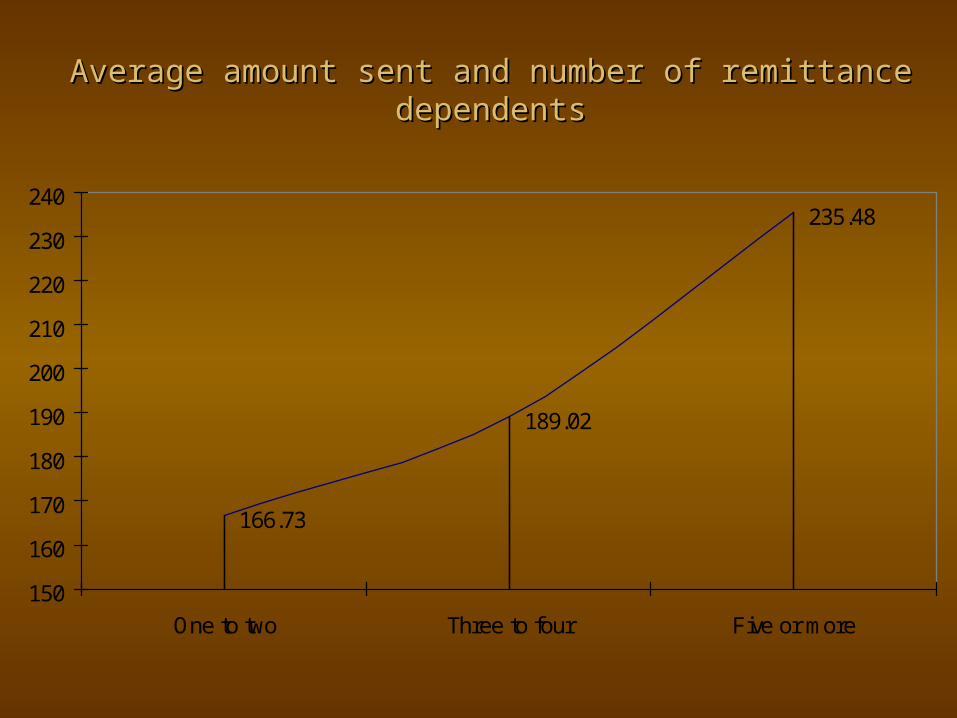
Average amount sent and number of remittance dependentsAverage amount sent and number of remittance dependents
166.73
189.02
235.48
150
160
170
180
190
200
210
220
230
240
One to two Three to four Five or more
Dynamics of migration and Dynamics of migration and developmentdevelopment
Migration from Latin America to the Migration from Latin America to the U.S.U.S.
A global pattern A global pattern The level of engagement: the 5TsThe level of engagement: the 5Ts Impacts in Latin AmericaImpacts in Latin America Sender and recipient profilesSender and recipient profiles Hometown associationsHometown associations Policy issuesPolicy issues

0
1,000,000
2,000,000
3,000,000
4,000,000
5,000,000
6,000,000
7,000,000
8,000,000
9,000,000
1820
1821
-183
0
1831
-184
0
1841
-185
0
1851
-186
0
1861
-187
0
1871
-188
0
1881
-189
0
1891
-190
0
1901
-191
0
1911
-192
0
1921
-193
0
1931
-194
0
1941
-195
0
1951
-196
0
1961
-197
0
1971
-198
0
1981
-199
0
1991
-200
1
Europe Asia L. America (-Mex) Africa Canada Mexico
Immigration to the United StatesImmigration to the United States

Recent migration to the U.S.Recent migration to the U.S.
0
500,000
1,000,000
1,500,000
2,000,000
2,500,000
3,000,000
3,500,000
4,000,000
1931-1940 1941-1950 1951-1960 1961-1970 1971-1980 1981-1990 1991-2001
Europe Asia L. America (-Mex) Africa Canada Mexico

Latin American migrationLatin American migration
0
200000
400000
600000
800000
1000000
1200000
1881-1890
1891-1900
1901-1910
1911-1920
1921-1930
1931-1940
1941-1950
1951-1960
1961-1970
1971-1980
1981-1990
1991-2001
0
500,000
1,000,000
1,500,000
2,000,000
2,500,000
3,000,000
C.America S.America Caribe Mexico

Main Latin American migration in Main Latin American migration in the U.S. by country of originthe U.S. by country of origin
0
10,000
20,000
30,000
40,000
50,000
60,000
70,000
80,000
90,000
1978
1979
1980
1981
1982
1983
1984
1985
1986
1987
1988
1989
1990
1991
1992
1993
1994
1995
1996
1997
1998
1999
2000
2001
0
100,000
200,000
300,000
400,000
500,000
600,000
700,000
800,000
900,000
1,000,000
Colombia Dom. Rep. El Salvador Guatemala Nicaragua Cuba Mexico
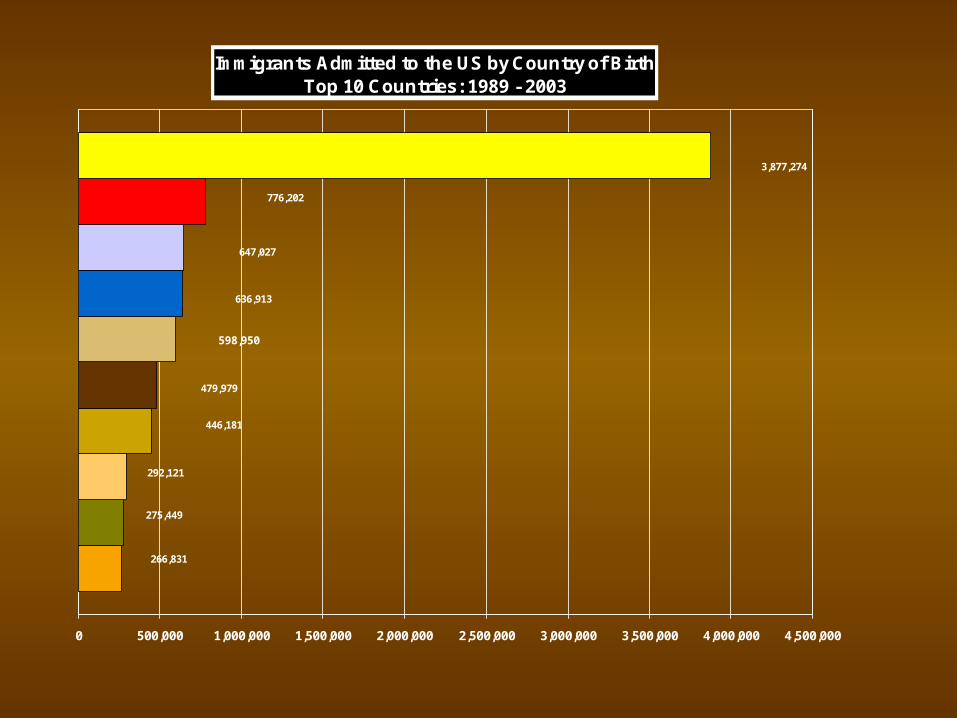
Immigrants Admitted to the US by Country of Birth Top 10 Countries: 1989 - 2003
266,831
275,449
292,121
446,181
479,979
598,950
636,913
647,027
776,202
3,877,274
0 500,000 1,000,000 1,500,000 2,000,000 2,500,000 3,000,000 3,500,000 4,000,000 4,500,000

Immigrants Admitted to the US by Country of Birth Top 10 Latin American Countries: 1989 - 2003
3,877,274
479,979
446,181
275,449
266,831
266,750
220,749
198,668
164,199
153,025
0 500,000 1,000,000 1,500,000 2,000,000 2,500,000 3,000,000 3,500,000 4,000,000 4,500,000

Immigrants Admitted to the US by Region of Birth: 1989 - 20037,207,565 LPR from Latin America
54%3,877,274
20%1,469,217
14%978,532
8%585,121
4%Southern Cone 297,421
0%
10%
20%
30%
40%
50%
60%
70%
80%
90%
100%

Latin American immigrants in the U.S. (2000)Latin American immigrants in the U.S. (2000)
0 5000000 10000000 15000000 20000000 25000000
Mexicans
Cubans
Dominicans
El Salvador
Colombia
Jamaica
Guatemalan
Ecuador
Peru
Honduran
Nicaraguan
Guyana
Brazil
Trinidad & Tobago
Argentina
Panamanian
Venezuela
Chile
Costa Rican
Bolivia
Uruguay
Paraguay
Caribbean
Other Latin

1983 1984 1985 1986 1987 1988 1989 1990 1991 1992
0
500
1000
1500
2000
2500
3000
3500
4000
Nicaragua El Salvador
Honduras Guatemala
Political asylum cases granted to Central Americans
Source: INS, various years.

Escaping bullets and repressionEscaping bullets and repression


Worldwide remittance flows in 2002Worldwide remittance flows in 2002
East Asia & Pacific, 14%
South Asia, 20%
Europe & Central Asia, 13%
Southern Africa, 5%
Middle East & N. Africa, 18%
Latin America & Caribbean, 31%
0% 10% 20% 30% 40% 50% 60% 70% 80% 90% 100%
Fuente: Orozco, Manuel, Worker Remittances in an International Scope Inter-American Dialogue. Washington, D.C. March, 2003, p3.

Main origin of remittancesMain origin of remittances
0
5
10
15
20
25
30
35
1972
1974
1976
1978
1980
1982
1984
1986
1988
1990
1992
1994
1996
1998
2000
2002
2004
To all countries, $ billion
United States
Saudi Arabia

Income distribution and remittancesIncome distribution and remittances
0.30 0.40 0.50 0.60
Distrib. of Income differences
0.000
0.100
0.200
0.300
RE
MIT
(GD
P)
Hungary Romania
Croatia
Egypt
Lithuania
PolandLatviaIndonesia
Pak Mongolia
Yemen
Kazak
Azerb
Banglad
SL
Jamaica
Jordan
Estonia
Nepal
GhanaT&T
India
MoldovaChina
Guinea
Kyrgyz
Mozamb
Morocco
Guyana
Cambod
TurkeySenegal
Tunisia
Ethiopia
Ecuador
CRPeru
Philip
Niger
DR
Venez
Burkina
ELS
Mali
NIG
MEXGB Parag
Colombia
GUA
Haiti
Bolivia
Honduras
Brazil
NICAR

Remittance Income for Receiving Homes and GDP pc
0.8
3.5
2.2
0.9
0
1000
2000
3000
4000
5000
6000
7000
Bangla
desh
India
Pakist
an
Ghana
Philipp
ines
Haiti
Nicara
gua
Bolivia
Hondur
as
Paragu
ay
Guyan
a
Ecuado
r
Egypt,
Arab
Rep.
El Salv
ador
Colombia
Mex
ico Peru
Costa R
ica
Jam
aica
Brazil
Dominica
n Repu
blic
Venez
uela
0.0
2.0
4.0
6.0
8.0
10.0
12.0
14.0
16.0
18.0
Homes receiving remittances
GDP pc
Ratio (rigth axis)

Percent cost to send $200 to Latin AmericaPercent cost to send $200 to Latin America
0.00%
2.00%
4.00%
6.00%
8.00%
10.00%
12.00%
14.00%
Cuba J amaica Haiti DominicanRep.
Mexico Guatemala Colombia Nicaragua El Salvador Bolivia Ecuador Honduras Peru Venezuela LatinAmerica
2001 2002 2003 2004 Banks

Remittances to Latin America, 2001-2004
1,807
967 930
2,206
1,288 1,265
119
2217
1425.9
1194
136.5
2,438
1,497
1,194
143
0
500
1,000
1,500
2,000
2,500
3,000
Dominicana Jamaica Cuba Guyana
2001 (24 billion)2002 (32 billion)2003 (38 billion)2004 (45 billion)
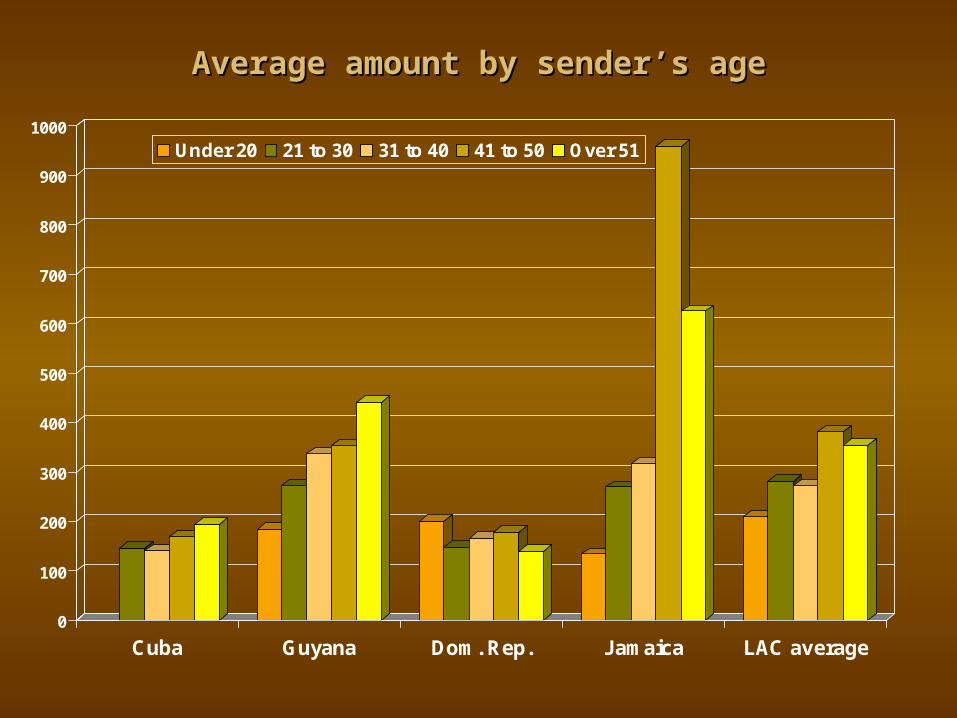
0
100
200
300
400
500
600
700
800
900
1000
Cuba Guyana Dom. Rep. Jamaica LAC average
Under 20 21 to 30 31 to 40 41 to 50 Over 51
Average amount by sender’s ageAverage amount by sender’s age

0
100
200
300
400
500
600
700
800
900
1000
Cuba Guyana Dom. Rep. Jamaica LAC average
University DegreeSome College/UniversityHigh SchoolElementary SchoolDid not Complete Elementary School
Average amount by sender’s educationAverage amount by sender’s education

0
100
200
300
400
500
600
700
Cuba Guyana Dom. Rep. Jamaica LAC average
Under 10,000 10,001 to 15,000 15,001 to 20,000 20,001to 25,00025,001 to 30,000 30,001 to 35,000 Over 35,000
Average amount by sender’s income level (US$)Average amount by sender’s income level (US$)
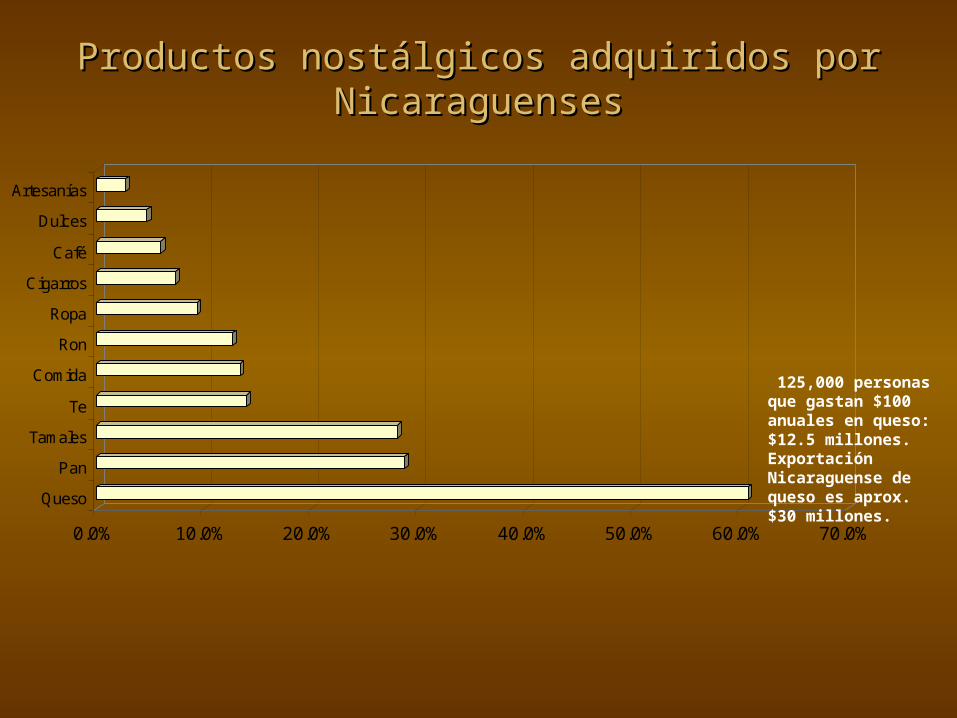
Productos nostProductos nostálgicos adquiridos por álgicos adquiridos por NicaraguensesNicaraguenses
0.0% 10.0% 20.0% 30.0% 40.0% 50.0% 60.0% 70.0%
Queso
Pan
Tamales
Te
Comida
Ron
Ropa
Cigarros
Café
Dulces
Artesanías
125,000 personas que gastan $100 anuales en queso: $12.5 millones. Exportación Nicaraguense de queso es aprox. $30 millones.

Remittances to Latin America: average amount sent by an immigrantRemittances to Latin America: average amount sent by an immigrant
209
176
179
245
266
183
154
245
263
199
261
0 50 100 150 200 250 300
Jamaica
Dom. Rep.
Guyana
LAC average
2004 2003 2002

0%
10%
20%
30%
40%
50%
60%
70%
80%
90%
Dom. Rep. Jamaica Guyana Cuba LAC average
At least once a year Once every two or three years Travels rarely or never
Frequency in traveling back to home country (%)Frequency in traveling back to home country (%)

Frequency of phone calls to relatives () Frequency of phone calls to relatives ()
0
10
20
30
40
50
60
70
Twice or more a week Once a week At most twice a month
GuyanaCubaJamaicaDom. Rep.LAC average
Datos recogidos de la encuesta e inmigrantes enNew York conducida por el autor, administrada por Emmanuel Sylvestre & Assoc. Resultados presentados en Orozco, Manuel (2004), Distant but close: Guyanese transnational communities and their remittances from the United States Inter-American Dialogue, Informe encargado por la U.S. Agency for International Development. Washington, DC. Enero..

Percent buying home country goods and typesPercent buying home country goods and types
84
65 64
29
71
0
10
20
30
40
50
60
70
80
90
Guyana Dom. Rep. Jamaica Cuba LAC
Data reported from survey of immigrants in New York conducted out by the author, administered by Emmanuel Sylvestre and Assoc. Results reported in Orozco, Manuel (2004), Distant but close: Guyanese transnational communities and their remittances from the United States Inter-American Dialogue, Report commissioned by the U.S. Agency for International Development. Washington, DC. January..