Relative valuation and Technical Analysisfaculty.bus.olemiss.edu/bvanness/Fall 2006/FIN...
25
Relative valuation and Technical Analysis
Transcript of Relative valuation and Technical Analysisfaculty.bus.olemiss.edu/bvanness/Fall 2006/FIN...

Relative valuation and Technical Analysis
Relative vs. fundamental valuation
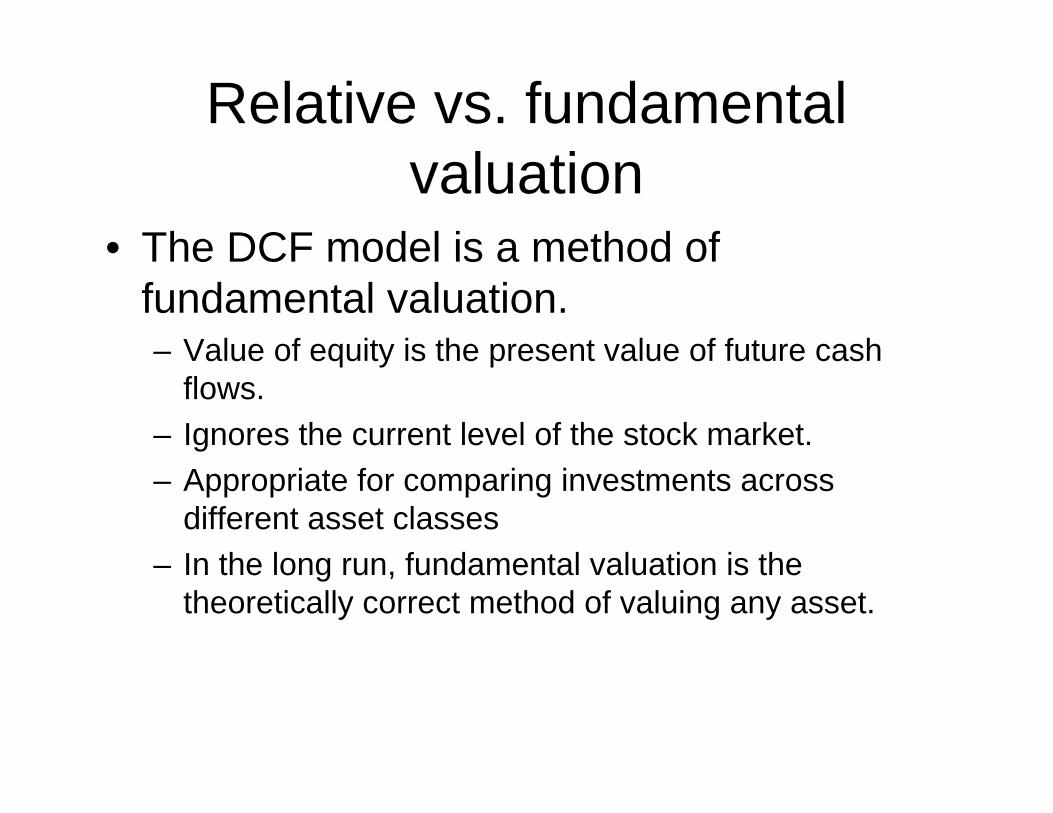
• The DCF model is a method of fundamental valuation.– Value of equity is the present value of future cash
flows. – Ignores the current level of the stock market.– Appropriate for comparing investments across
different asset classes – In the long run, fundamental valuation is the
theoretically correct method of valuing any asset.

Relative vs. fundamental valuation
• Relative valuation is based on P/E ratios and a host of other “multiples”– Popular with the press, stock brokers,– Used to value one stock against another. – Cannot compare values across different asset
classes
Prices can be standardized using a common variable such as earnings, cashflows, book value or revenues.
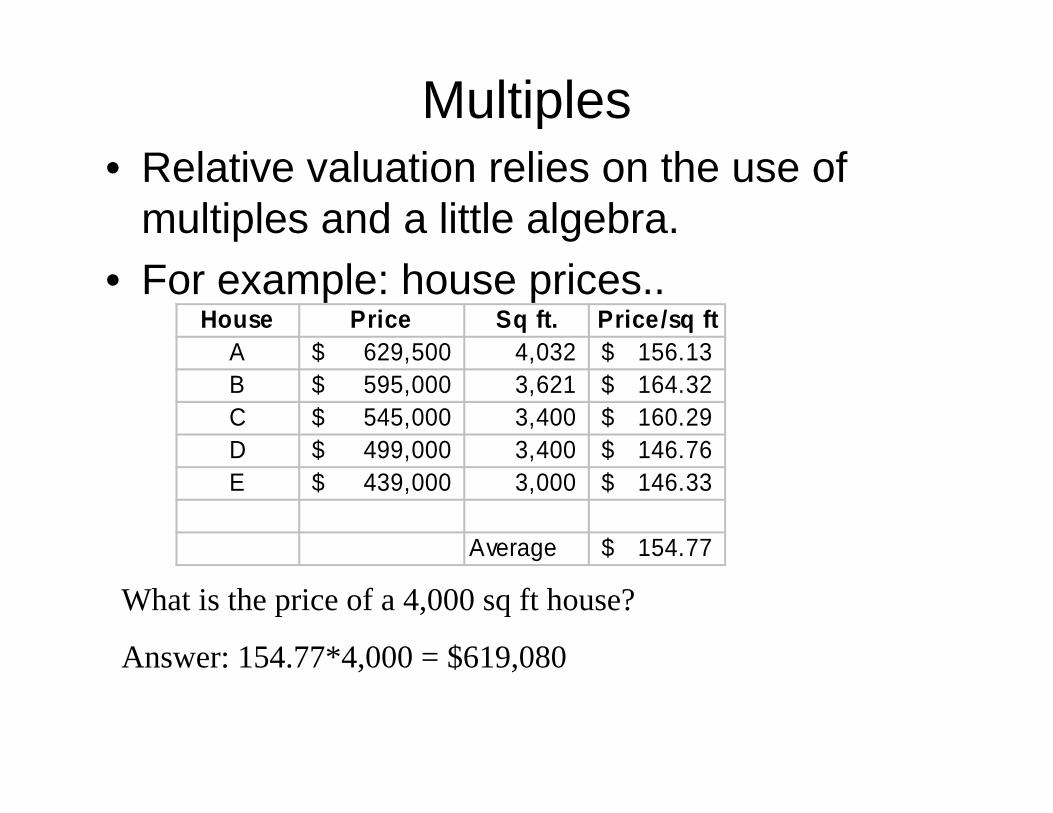
Multiples• Relative valuation relies on the use of
multiples and a little algebra.• For example: house prices..
House Price Sq ft. Price/sq ftA 629,500$ 4,032 156.13$ B 595,000$ 3,621 164.32$ C 545,000$ 3,400 160.29$ D 499,000$ 3,400 146.76$ E 439,000$ 3,000 146.33$
Average 154.77$
What is the price of a 4,000 sq ft house?
Answer: 154.77*4,000 = $619,080
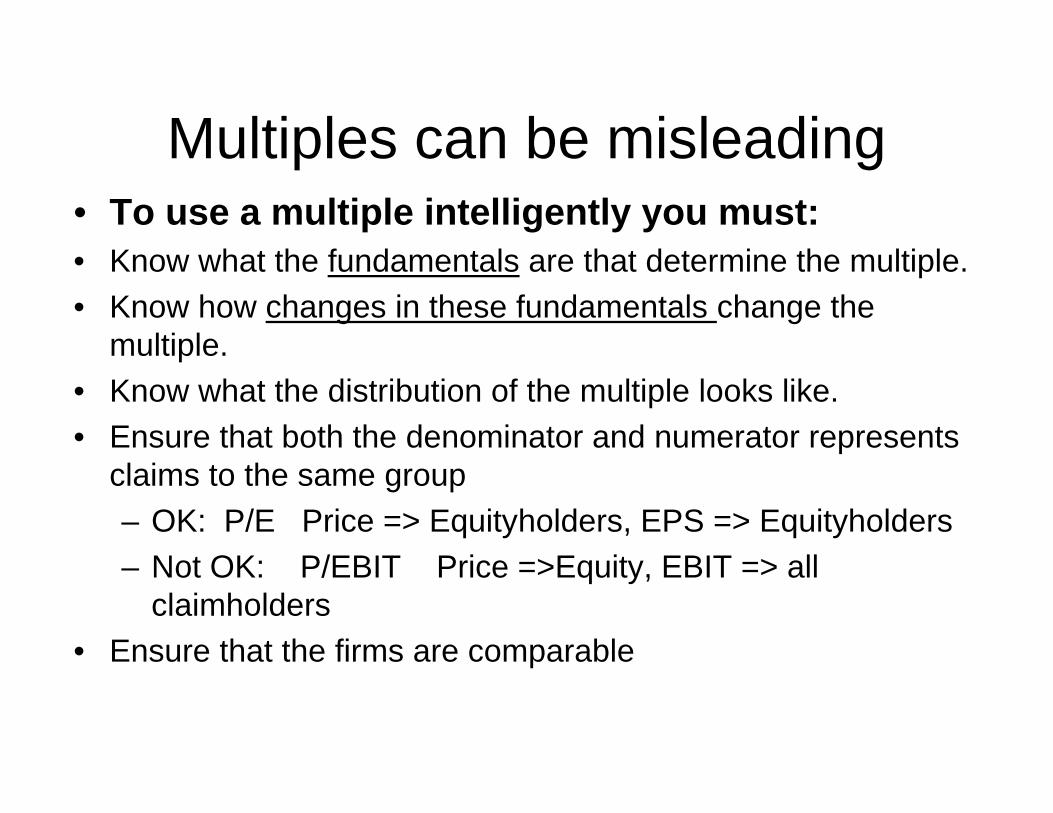
Multiples can be misleading• To use a multiple intelligently you must:• Know what the fundamentals are that determine the multiple.• Know how changes in these fundamentals change the
multiple.• Know what the distribution of the multiple looks like.• Ensure that both the denominator and numerator represents
claims to the same group– OK: P/E Price => Equityholders, EPS => Equityholders– Not OK: P/EBIT Price =>Equity, EBIT => all
claimholders• Ensure that the firms are comparable
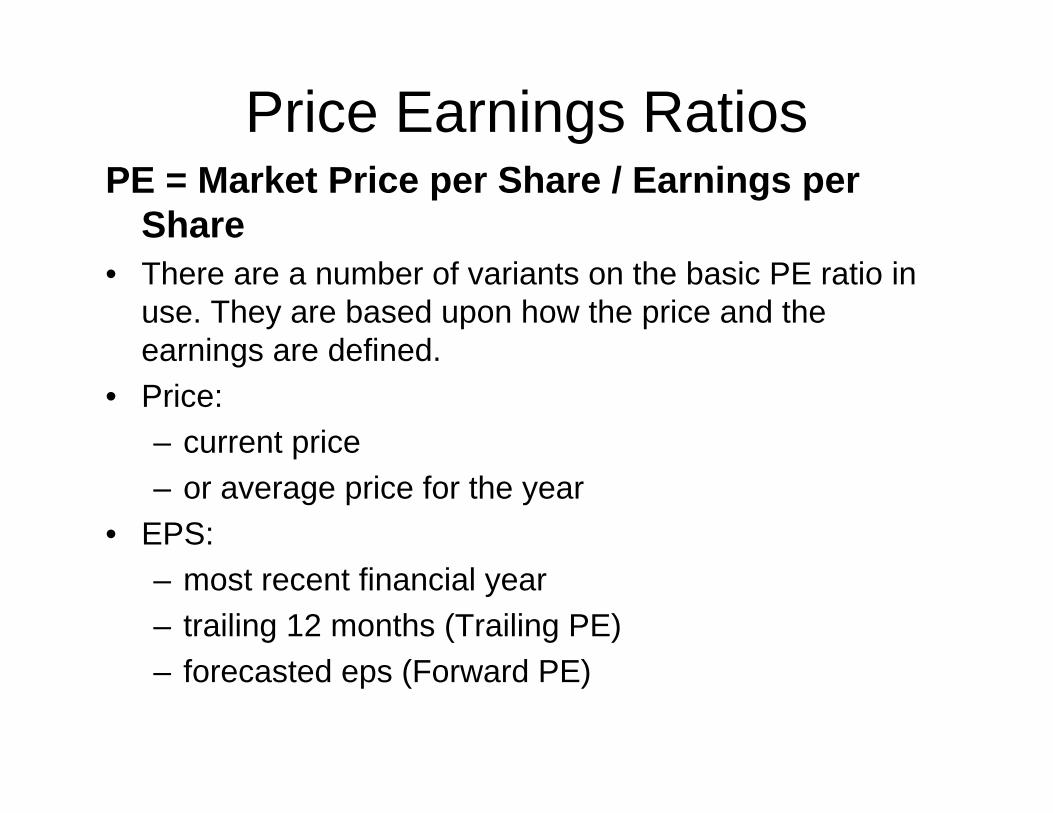
Price Earnings RatiosPE = Market Price per Share / Earnings per
Share• There are a number of variants on the basic PE ratio in
use. They are based upon how the price and the earnings are defined.
• Price:– current price– or average price for the year
• EPS:– most recent financial year– trailing 12 months (Trailing PE) – forecasted eps (Forward PE)

PE Ratio: Understanding the Fundamentals
• To understand the fundamentals, start with a basic equity discounted cash flow model.
• With the constant growth dividend discount model,
• Dividing both sides by the (forecasted) earnings per share,
gkDV 1
0 −=
ROE(g)-k
b-1 =PEEV
1
0 =

PE Ratio: Understanding the Fundamentals
• Holding all else equal:
– higher growth firms
– higher risk firms
– firms with lower reinvestment needs
• Of course, other things are difficult to hold equal since high growth firms, tend to have risk and high reinvestment rates.
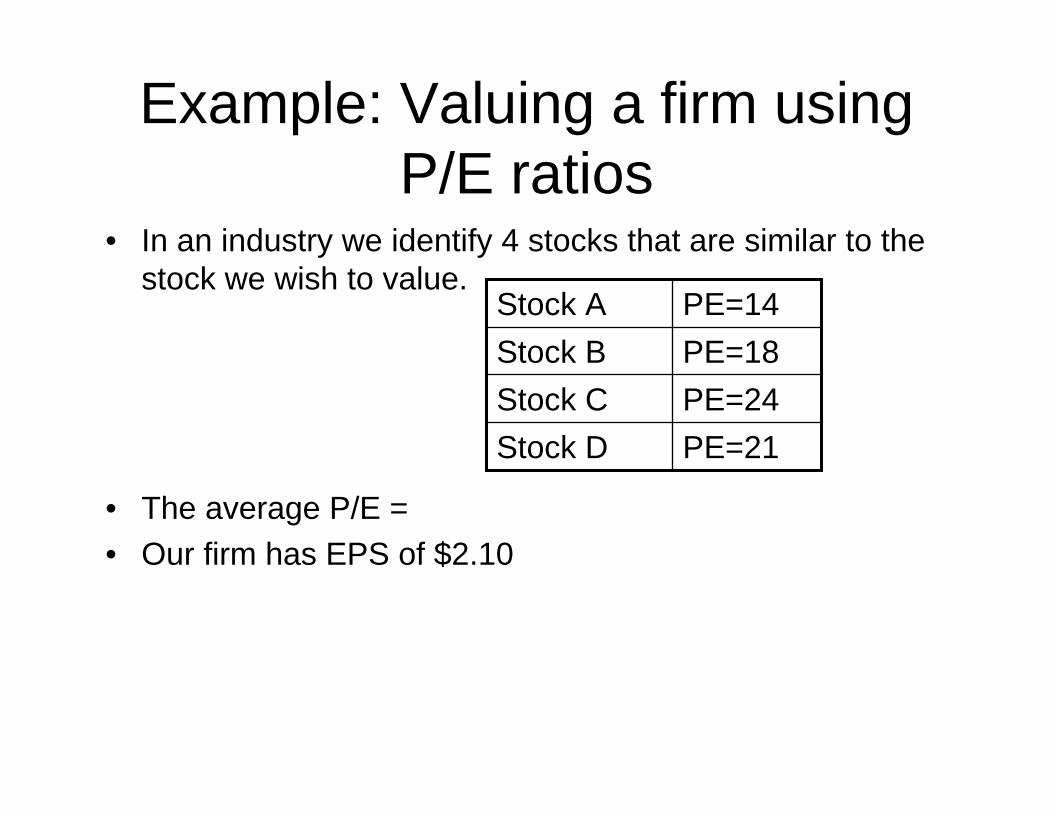
Example: Valuing a firm using P/E ratios
• In an industry we identify 4 stocks that are similar to the stock we wish to value.
• The average P/E = • Our firm has EPS of $2.10
PE=21Stock DPE=24Stock CPE=18Stock BPE=14Stock A
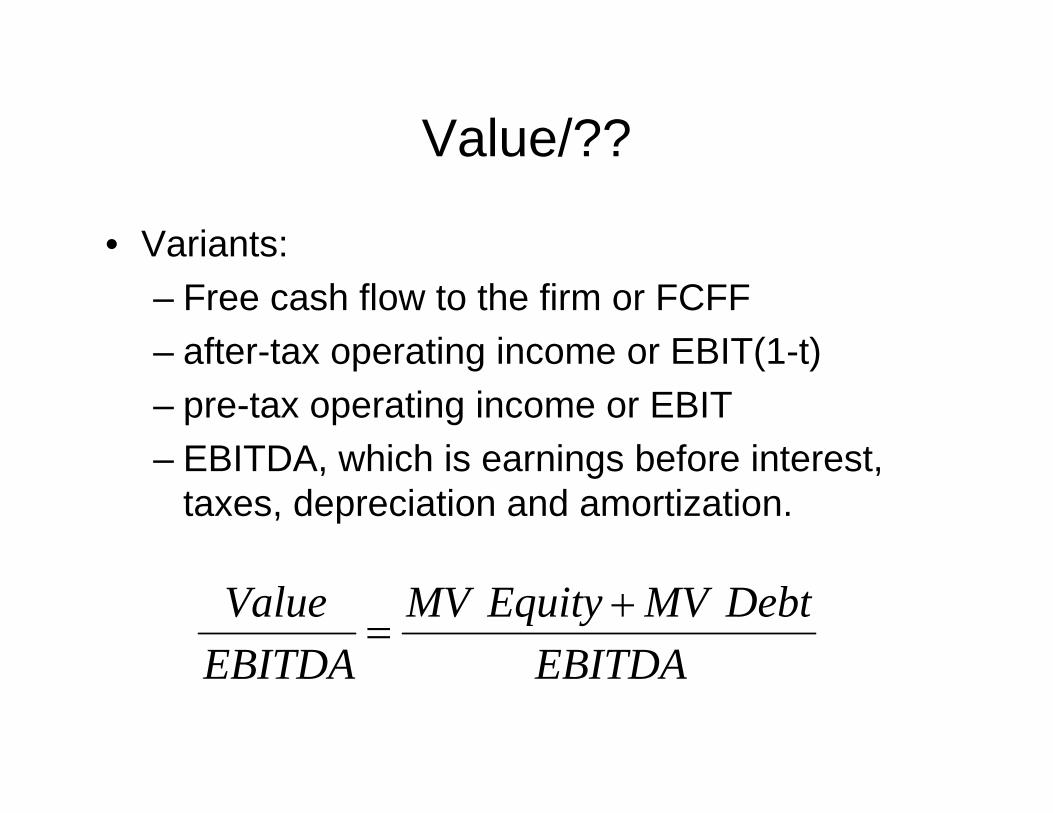
Value/??
• Variants:– Free cash flow to the firm or FCFF – after-tax operating income or EBIT(1-t)– pre-tax operating income or EBIT– EBITDA, which is earnings before interest,
taxes, depreciation and amortization.
EBITDADebtMVEquityMV
EBITDAValue +
=
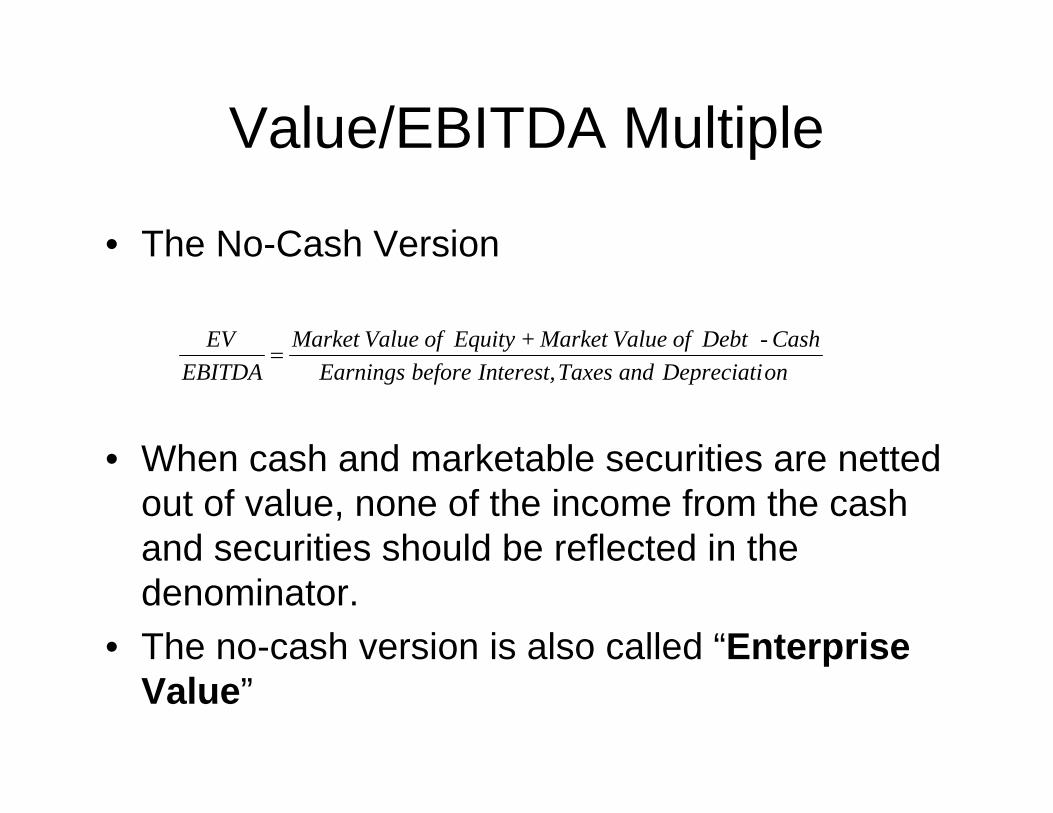
Value/EBITDA Multiple
• The No-Cash Version
• When cash and marketable securities are netted out of value, none of the income from the cash and securities should be reflected in the denominator.
• The no-cash version is also called “Enterprise Value”
onDepreciati and Taxes Interest, before EarningsCash - Debt of Value Market+Equity of Value Market
EBITDAEV
=

Enterprise value
• EV =Market value of equity+debt-cash and marketable securities

Reasons for Increased Use of Value/EBITDA
1. The multiple can be computed even for firms that are reporting net losses, since EBITDA is usually positive.
2. More appropriate than the price/earnings ratio for high growth firms.
3 Allows for comparisons across firms with different financial leverage.

Price (market) to Book Value Ratio
• Ratio of the market value of equity to the book value of equity, i.e., the measure of shareholders’ equity in the balance sheet.
In 2004 the average Price/book for US firms was a little less than 4.
EquityofValueBookEquityofValueMarket
BP=
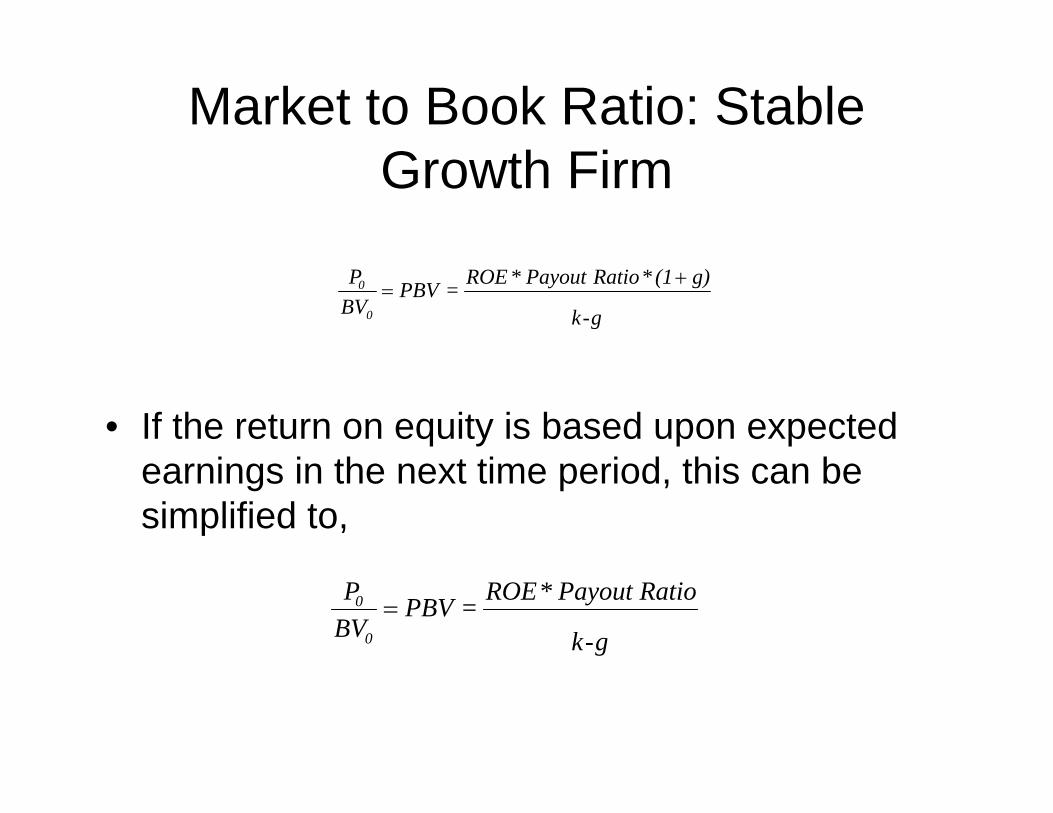
Market to Book Ratio: Stable Growth Firm
• If the return on equity is based upon expected earnings in the next time period, this can be simplified to,
g-k
g)(1*Ratio Payout*ROE =PBVBVP
0
0 +=
g-k
Ratio Payout*ROE =PBVBVP
0
0 =

Market to Book Ratio: Stable Growth Firm
• This formulation can be simplified even further by relating growth to the return on equity:g = (1 - Payout ratio) * ROE=> payout ratio = 1 -
g/ROE
• Substituting back into the P/BV equation,
g-k
g - ROE g-kROE
gROEPBV
BVP
0
0 =⎥⎦⎤
⎢⎣⎡ −
==1
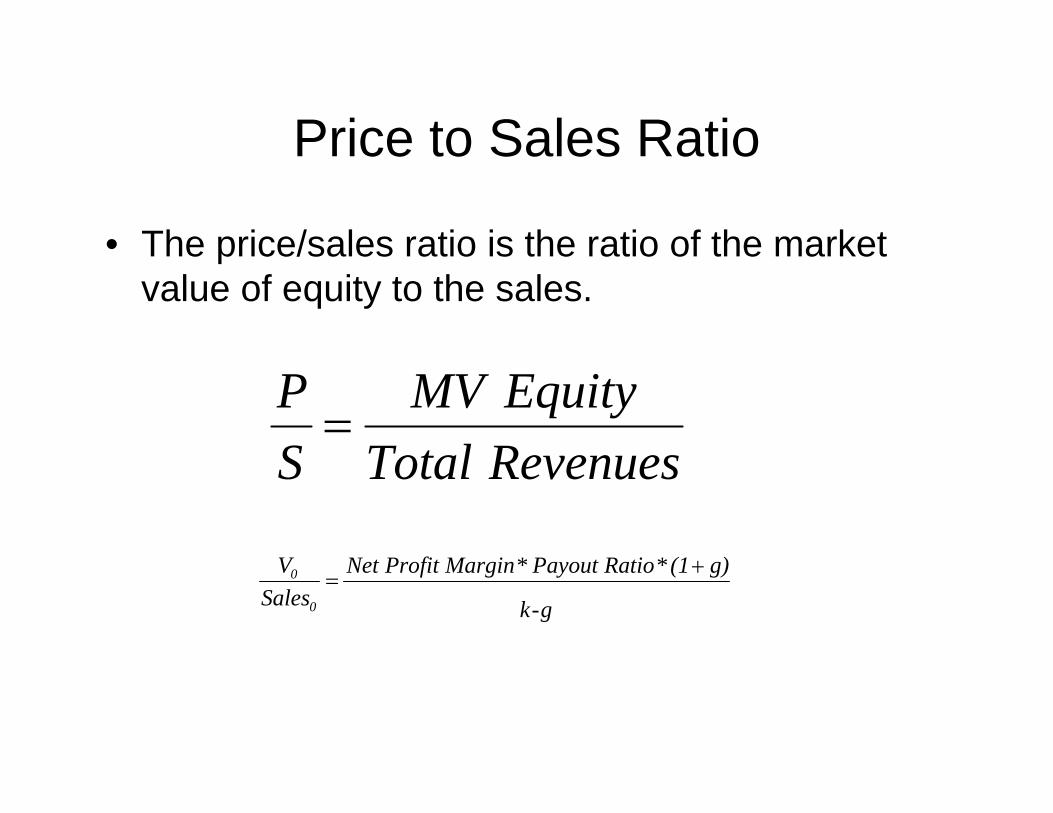
Price to Sales Ratio
• The price/sales ratio is the ratio of the market value of equity to the sales.
RevenuesTotalEquityMV
SP=
g-k
g)(1*Ratio Payout* MarginProfit Net Sales
V
0
0 +=
Price Sales Ratios and Profit Margins
• A key determinant of price-sales ratios is the profit margin.
• A decline in profit margins has a two-fold effect.
Choosing Between the Multiples
• There are dozens of multiples. • The multiple that is used can be chosen in
one of two ways:– Use the multiple that best fits your objective.
Thus, if you want the company to be undervalued, you pick the multiple that yields the highest value.
– Use the multiple that seems to make the most sense for that sector, given how value is measured and created.
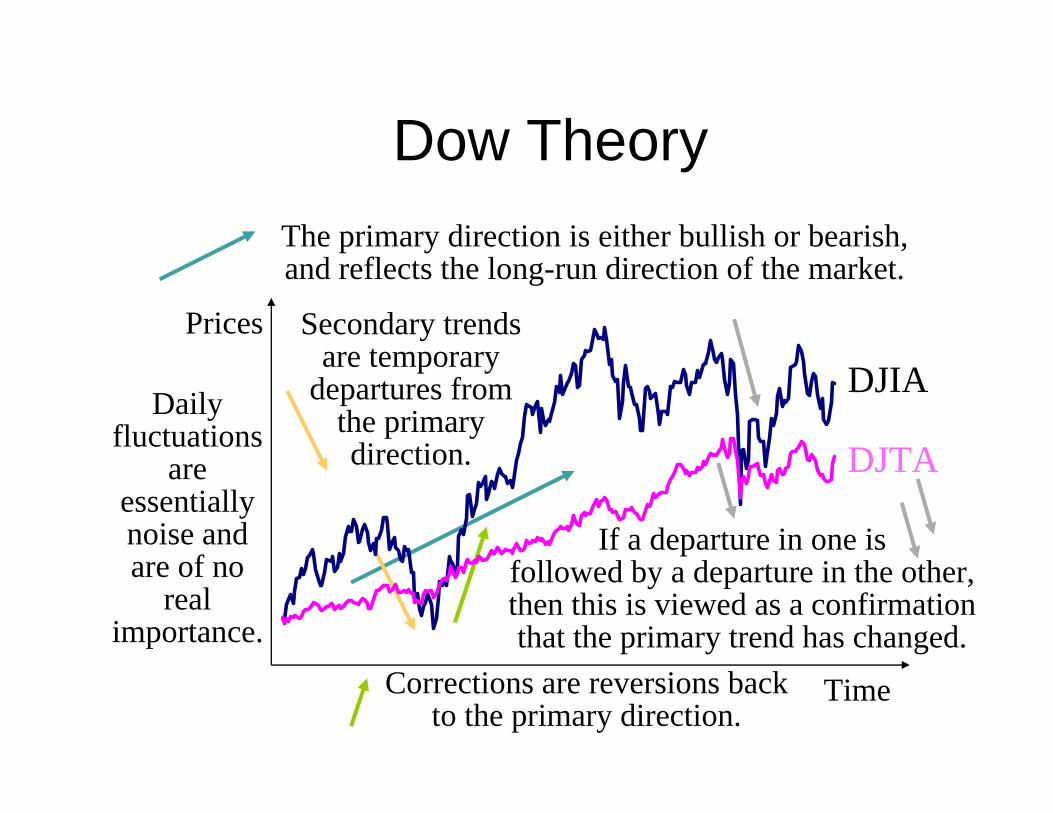
Daily fluctuations
are essentially noise and are of no
real importance.
Dow TheoryThe primary direction is either bullish or bearish, and reflects the long-run direction of the market.
Secondary trends are temporary
departures from the primary direction.
Corrections are reversions back to the primary direction.
Time
Prices
DJIA
DJTA
If a departure in one isfollowed by a departure in the other, then this is viewed as a confirmation that the primary trend has changed.

Support and Resistance Levels
• Support level
• Resistance level
• Resistance and support areas are usually viewed as psychological barriers - bargain hunters help “support” the lower level, while profit takers “resist” the upper level.

Point and Figure Chart

Candlestick

Technical Indicators—Sentiment
• trin
• Odd-lot trading
• Confidence index
• Put/call ratio
• Mutual fund cash position
Technical Indicators
• Flow of Funds– Short interest– Credit balances in brokerage accounts
• Market Structure– Moving averages– Breadth – Relative strength