Softening point by Ring & Ball Density and relative density of liquids ...
Upload
fasakin-akinwoleCategory
view
409download
16
CONTENTS PAGE
Title Page............................................................................................................................ ii
Table of Contents.............................................................................................................. iii
List of Figures..................................................................................................................... iv
List of Tables...................................................................................................................... iv
SECTION ONE: INTRODUCTION
1. Introduction........................................................................................................1
1.1 Objective of Experiment......................................................................................3
SECTION TWO: APPARATUS AND EXPERIMENTAL PROCEDURE
2.1 Apparatus............................................................................................................4
2.2 Experimental Procedure......................................................................................5
SECTION 3
3.1 Results.................................................................................................................7
SECTION 4: DISCUSSION OF RESULTS AND CONCLUSIONS
4.1 Discussion of Results.........................................................................................10
4.2 Conclusion………………………………………………………………………………………………………11
REFERENCES

L I S T O F F I G U R E S
FIGURE TITLE PAGE
1.0 Burdeng Tester and A Simple Piston 2
2.0 240 Air- Operated Dead Weight Tester 4
3.1 Graph of Gauge Pressure against Dead Weight Pressure 8 3.2 Graph of (PG-PDWT) Against (PDWT) 9
L I S T O F T A B L E S
TABLE TITLE PAGE
2.0 Weights with Corresponding Pressures 5
3.0 Experimental Results 7

S E C T I O N O N E : I N T R O D U C T I O N
Relative density is the ratio of the density (mass per unit volume) of a substance to the
density of a given reference material. For gases, this reference substance is usually air.
Therefore, a ratio of the density of the any gas to that of air gives the relative density of the
particular gas.
To measure the relative density of a gas, we make use of the Graham’s law of effusion. This
law states that the rate of effusion of a gas through an orifice is inversely proportional to the
square root of its density. Stating this mathematically, we have
R ARB
=√ ρB√ ρA
Where RA is the rate of effusion/escape of gas A through the orifice; RB is the rate of effusion
of gas B through same orifice.
ρBis the density of gas B while ρAis the density of gas A.
Now, RA is volume of gas A, VA effused through the orifice in time A, TA, while RB is the
volume of gas B, VB effused through the orifice in time B, TB.
Therefore, RA = VA/TA while RB = VB/TB
Combining these equations with the earlier one above, we get
R ARB
=V A
T A÷V BT B
= √ρB√ ρA
=V A
T A×T BV B
=√ ρB√ ρA
Now VA = VB. therefore we arrive at T BT A
=√ ρB√ ρA
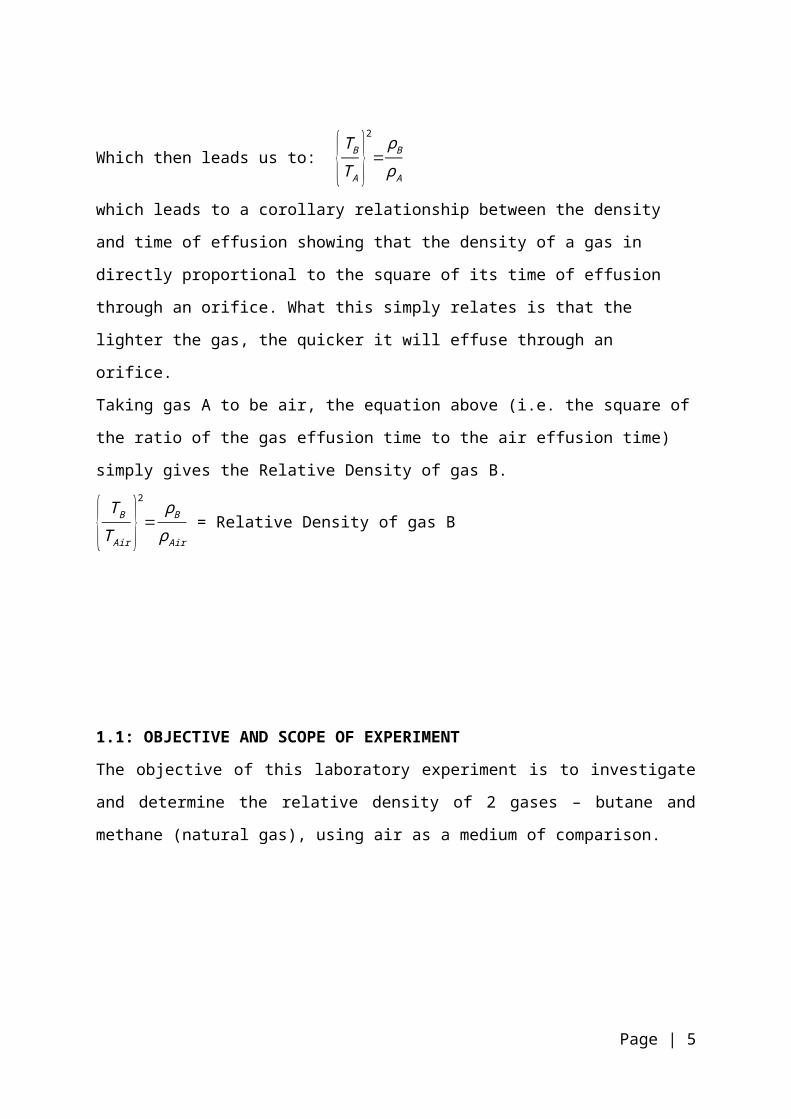
Which then leads us to: {T BT A }2
=ρBρA
which leads to a corollary relationship between the density and time of effusion showing
that the density of a gas in directly proportional to the square of its time of effusion through
an orifice. What this simply relates is that the lighter the gas, the quicker it will effuse
through an orifice.
Taking gas A to be air, the equation above (i.e. the square of the ratio of the gas effusion
time to the air effusion time) simply gives the Relative Density of gas B.
Page | 3

{ T BT Air }2
=ρBρAir
= Relative Density of gas B
1.1: OBJECTIVE AND SCOPE OF EXPERIMENT
The objective of this laboratory experiment is to investigate and determine the relative
density of 2 gases – butane and methane (natural gas), using air as a medium of
comparison.
S E C T I O N T W O : A P P A R A T U S A N D E X P E R I M E N T A L P R O C E D U R E
Page | 4
2.1 APPARATUS
The apparatus employed to carry out this experiment is the ‘Simmance’ Specific Gravity Bell
(see Figure 1.2). The Specific Gravity Bell is basically an upturned bell suspended in a water
tank from a beam carrying a pointer. The pointer is free to move over a scale plate on which
is engraved two lines. These two lines correspond to the upper and lower heights the bell
will be timed to move through for a constant volume of gas to effuse out of the Simmance
Bell into the atmosphere. A balance weight is mounted on the other end of the pointer to
control the rate of effusion which is through an orifice (of 0.75 – 0.8mm diameter) on top of
the bell. This nipple is protected by a removable dust cap to prevent clogging of the nipple
holes.
Provision is made for two cocks (valves) through which either gas or air can be introduced
by the means of a connecting tube into the water-immersed bell.
Page | 5

Figure 2.1. ‘Simmance’ Specific Gravity Bell apparatus
2.2: EXPERIMENTAL PROCEDURE
PRECAUTIONS
1. The water level in the tank was checked to make sure it is at the correct level i.e. just
covering the dome of the upturned bell.
Page | 6

2. The scale plate was checked and polished to ensure its reflection can be observed in
line with the indicator lines, thereby eliminating parallax errors.
3. The orifice was examined and thence cleaned to remove any dust, fluff or moisture
accumulation that can hinder effusion.
4. Effort were made to ensure the time of effusion of the first run was not more than
80 seconds so as to ensure that the pressure drop across the orifice is sufficiently
small enough to prevent condensation of water at the orifice.
PROCEDURE
a. Air Effusion
1. The experiment was set up as in the figure above (see Fig. 2.1)
2. The apparatus was levelled using the levelling screws to make sure the bell hangs
centrally in the tank.
3. All necessary connections were made between the gas supply points and the
bell.
4. One of the 2 cocks connecting gas supply to the bell was connected leaving the
other disconnected, for air to gain entry into the bell.
5. The 3 cocks (valves) on the pipeline were lined up opened and the weighted end
of the pointer beam depressed so that air can enter into the bell. This was
continued until the pointer is located well above the upper mark on the scale.
The 2 inlet cocks were then closed, leaving only the effusion orifice cock open.
6. At this point, the bell is released to descend on its own weight until the tank
water covers the crown of the bell. This operation is repeated again to ensure
the bell is purged of all gases except air.
7. Steps 5 and 6 are then repeated again, this time taking record of the time it takes
the pointer to move from the upper indicator mark to the lower one.
8. Step 7 is repeated 2 more times to give 3 readings altogether.
b. Butane Gas Effusion
9. The bell is filled with butane gas by closing the air cock and opening the gas cock,
thus allowing the bell to rise up under gas pressure till the pointer is way beyond
the upper mark.
10. The bell is emptied by closing the gas cock and opening the air cock. This process
is repeated again to purge the bell of air traces of pollutant air.
Page | 7

11. Step 9 above is repeated.
12. Then the bell is released and the time taken to travel between the upper mark
and the lower one on the scale plate is taken.
13. Steps 11 and 12 are repeated twice again to get 3 readings altogether.
Page | 8

S E C T I O N T H R E E : R E S U L T S A N D D I S C U S S I O N
3.1 Results
The results of the experiment performed are as shown below:
Effusion Times (sec) Air Methane Butane
Run 1 65.25 53.47 101.35
Run 2 65.32 53.35 101.48
Run 3 66.02 53.72 102.08
Ave Effusn time (s) 65.53 53.51 101.64
Table 3.1: Table of Experimental results
Other readings taken include:
Ambient Temp = 22.6 C; Barometric Pressure = 755mmHg; Tank water temp = 23 C
3.2 Results Discussion
To determine the Relative density of the Methane and Butane gases from the effusion times, use is made of the earlier determined relationship as shown below viz:
{ T BT Air }2
=ρBρAir
= Relative Density of gas B.
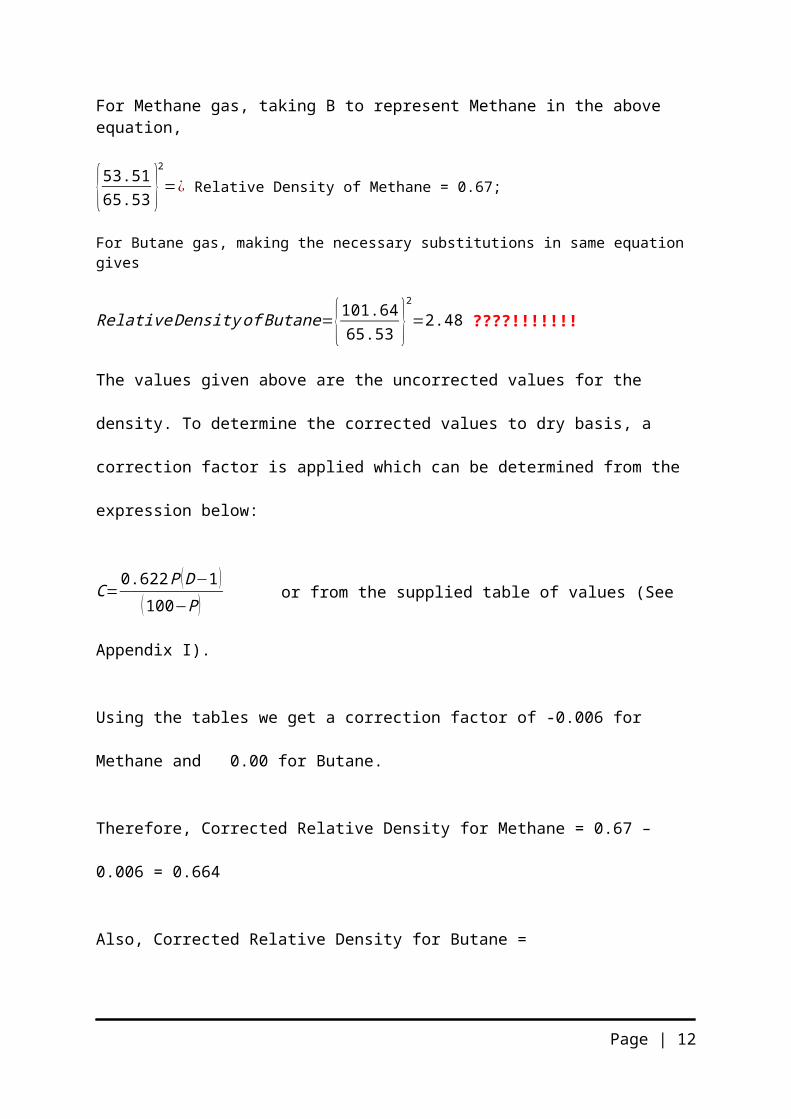
For Methane gas, taking B to represent Methane in the above equation,
{53.5165.53 }
2
=¿ Relative Density of Methane = 0.67;
For Butane gas, making the necessary substitutions in same equation gives
RelativeDensity of Butane={101.6465.53 }
2
=2.48 ????!!!!!!!
Page | 9

The values given above are the uncorrected values for the density. To determine the
corrected values to dry basis, a correction factor is applied which can be determined from
the expression below:
C=0.622P (D−1 )
(100−P ) or from the supplied table of values (See Appendix I).
Using the tables we get a correction factor of -0.006 for Methane and 0.00 for Butane.
Therefore, Corrected Relative Density for Methane = 0.67 – 0.006 = 0.664
Also, Corrected Relative Density for Butane =
Page | 10

S E C T I O N F O U R : D I S C U S S I O N O F R E S U L T S
4.1 Discussion of Results
Table 3.0 shows the results obtained from the experiment carried out. From the values
obtained one can observe that as the weight applied on the Dead- Weight tester device
increased, the pressure read by the gauge also increased, proving that the higher the force
acting on a small area, the higher the pressure.
Figure 3.1 shows an almost perfect calibration curve and looking at it, one would hardly
notice the discrepancies between the pressure measured by the gauge and the dead weight
pressure. This is because the slopes of the plot of the increasing pressure and decreasing
pressures are almost overlapping each other because of the similarities in their values
measured by the pressure gauge. The almost perfect reading is due to the fact that the
errors due to static friction are eliminated due to the rotation of the piston.
In experimental measurements, a difference graph or plot is normally plotted to compare
two quantities having the same measured values; in the case of this experiment the values
are the increasing and decreasing pressures.
Figure 3.2 is a difference plot that shows the magnitude of errors or discrepancies between
the pressure measured by the gauge and the dead weight pressure. From the graph it can
be seen that the points were evenly distributed above and below the zero line, indicating
that the Dead Weight Pressure is either below or above the calibration standard. If more
points were below the zero line on the graph, then the Dead-Weight Pressure Gauge Tester
would be below the calibration standard and vice versa.
The reason for this even distribution of points is due to the errors that must have occurred
during the experiments. These errors could have been caused by:
1. Air leakage in the system.
Page | 11
2. Improper cleaning of dirty or chemically contaminated gauges
3. Probability of the gauge containing a liquid that was not probably flushed out properly
with a syringe.
4. Error due to parallax while taking readings from the Pressure Gauge on the Air
Operated Dead Weight Pressure Gauge tester.
Calibration is usually carried out periodically on several instruments to test how valid the
performance of an equipment or device is. It involves comparing specific input and output
values of an equipment or device with their reference standards. It is a relevant process,
because in industries need to know that their measuring devices or equipment are
performing up to the required standard. Also calibration is carried out to ensure safety,
efficiency and accuracy of instruments.
Venturi meters, thermometers, orifice plates to mention just a few, are among the very
many devices used various industries that are calibrated.
4.2 Conclusion
The objective of the experiment was conducted to calibrate a Budenberg 240 Air-operated
Dead –weight Pressure Gauge Tester. Two sets of readings for the increasing and decreasing
pressures were obtained and their values were plotted against the corresponding weights
applied on the pressure gauge tester. Also the differences between the measured values
and the applied weights were obtained and a difference chart was plotted.
In conclusion, it can be said the objective of the experiment was achieved.
Page | 12
APPENDIX
Page | 13

REFERENCES
1) Pressure Gauge Calibration Laboratory Manual 2009, School of Computing, Science
and Engineering, University of Salford, United Kingdom
2) Module 4: Experimental Measurement and Methods MSc. Lecture Notes, School of
Computing, Science and Engineering, University of Salford
3) Armfield Engineering Teaching& Research Equipment, www.discoverarmfield.co.uk,
accessed on 01-12-09
4) Apex Control Instruments, www.intapex.com/principle, accessed on the 02-02-09.
Page | 14