
Relative change in weight (%) Weeks after surgery · Supplem 25,212 tr Box plot Averagin base 2) i...
16
Supplemental Figure 1. (a) HFD consumption and (b) relative changes in body weight of DIO, GB-D, GB-J, GB-IL, RYGB and pair-fed to GB-IL mice up to eight weeks post-op. * P < 0.05, **P<0.01, ***P<0.001 versus DIO controls. Values shown are means SEM (one-way ANOVA with Dunn’s post- test). N=15 DIO, 14 GB-D, 14 GB-J, 15 GB-IL, 7 RYGB, 6 PF to GB-IL. Weeks after surgery Relative change in weight (%) 0 1 2 3 4 5 6 7 8 -60 -40 -20 0 20 GB-D DIO GB-J GB-IL RYGB PF to GB-IL *** *** *** *** *** * *** ** *** *** *** *** ** ** ** * * * a b 0 1 2 3 4 5 6 7 8 0.0 0.5 1.0 1.5 2.0 2.5 3.0 Weeks after surgery HFD consumption (g/d) *** * * * * *** ** **
Transcript of Relative change in weight (%) Weeks after surgery · Supplem 25,212 tr Box plot Averagin base 2) i...

Supplemental Figure 1. (a) HFD consumption and (b) relative changes in body weight of DIO, GB-D, GB-J, GB-IL, RYGB and pair-fed to GB-IL mice up to eight weeks post-op. * P < 0.05, **P<0.01, ***P<0.001 versus DIO controls. Values shown are means SEM (one-way ANOVA with Dunn’s post-test). N=15 DIO, 14 GB-D, 14 GB-J, 15 GB-IL, 7 RYGB, 6 PF to GB-IL.
Weeks after surgery
Rel
ativ
e ch
ang
e in
wei
gh
t (%
)
0 1 2 3 4 5 6 7 8-60
-40
-20
0
20 GB-DDIOGB-JGB-ILRYGBPF to GB-IL
****** *** *** *** * ***
***** *** *** *** ****
**
**
*
a b
0 1 2 3 4 5 6 7 80.0
0.5
1.0
1.5
2.0
2.5
3.0
Weeks after surgery
HF
D c
on
sum
pti
on
(g
/d)
****
* *
*
***
**
**

Supplemental Figure 2. Extracted ion chromatograms of serum bile acids resolved by high-performance liquid chromatographic ESI-MS/MS. Individual samples spikes with deuterated bile acid standards were resolved over a 28 min gradient. Eluting bile acid species were subjected to mass analysis and area under the curve (AUC) determinations were made.

Supplemental Figure 3. Extracted ion chromatograms of deuterated bile acids standards used as internal standards in the quantitation analysis. Individual samples spiked with deuterated bile acid standards were resolved over a 28 min gradient and used to quantify bile acid species as described in Materials and Methods.

Supplemental Figure 4. Glucose excursion curves in DIO WT, bile diversion and RYGB mice after Intraperitoneal glucose tolerance tests (IPGTT) at A) 2 weeks post-op, B) 4 weeks post-op, and c) 8 weeks post-op. Data are shown as mean SEM. *P<0.05, **P<0.01, ***P< 0.001 versus DIO by one-way ANOVA with post-test.
2 weeks post-opa
4 weeks post-opb
8 weeks post-opc
* ** ****
** *** *** *** ***
*
**
***
** * * *
*** **
**
**
*
**
*
***
*
***
*
**
*
********* *** *** *** *** ***
** *
Time (min)
Blo
od
glu
cose
(m
gd
L-1
)
0 10 20 30 45 60 75 90 1200
200
400
600DIOGB-DGB-J
GB-ILRYGB
Time (min)
Blo
od
glu
cose
(m
gd
L-1
)
0 10 20 30 45 60 75 90 1200
200
400
600
GB-DGB-J
GB-IL
DIO
RYGB
Time (min)
Blo
od
glu
cose
(m
gd
L-1
)
0 10 20 30 45 60 75 90 1200
200
400
600
GB-DGB-JGB-IL
DIO
RYGB

Supplemental Figure 5. Regression lines for ANCOVA predicted energy expenditure adjusted for total body mass (TBM) when comparing GB-IL (N=6) versus DIO (N=4) (a) and RYGB (N=6) versus DIO (N=4) (b). Energy expenditure using indirect calorimetry was measured 4 weeks after surgical procedures on diet-induced obese (DIO) mice and analyzed by analysis of covariance using surgical procedure as main effects and testing for interactions as described in the Materials and Methods and on the Mouse Metabolic Phenotyping Center website (http://www.mmpc.org). GB-IL mice compared to DIO mice displayed parallel linear regression lines suggestive of an increased energy expenditure that was independent of a TBM interaction (a). In contrast, ANCOVA-adjusted comparisons of RYGB to DIO controlling for TBM indicated an increased energy expenditure in RYGB mice that was dependent on a TBM interaction (b).
a b
2419 29 34 39 440
0.2
0.4
0.6
0.8
Total Body Mass (g)
Ave
rag
e D
aily
En
erg
y E
xpen
dit
ure
(kC
al/h
)
DIOGB-IL
DIORYGB
25.6720.67 30.67 35.67 40.670
0.2
0.6
0.8
1.0
Total Body Mass (g)
Ave
rag
e D
aily
En
erg
y E
xpen
dit
ure
(kC
al/h
)
0.4

Supplem25,212 trBox plotAveraginbase 2) iextendinwhichevfold-changene is dDIO mic
mentary Figuranscripts) frt depicting thng (RMA). Bntensities. Th
ng from the ber is smaller.nge (x-axis)
differentially ce (d).
ure 6. RNA-rom GB-IL anhe difference Boxes show the median isoxes) illustra. The circles versus −log1expressed) i
seq analysisnd DIO mouamong RNA
the 25th and 7 the horizontate the maximdisplay any p
10 FDR-correin RNA-seq d
(all transcripuse livers (a,bA-seq dataset75th percentital bar in the mum value orpoints beyonected p-valuedata of mous
pts representeb) or RYGB ts after normailes in the dismiddle of thr 1.5 times th
nd these whise (y-axis, repe livers from
ed, filtered toand DIO moalization by Rstribution of
he box. The whe interquartiskers. (b,d). Vpresenting them GB-IL vs D
o remove zerouse livers (c,Robust Microlog-transform
whiskers (dotile range of dVolcano plote probability
DIO (b) and R
ro values; ,d). (a, c) oarray med (log tted lines data (IQR), ts of log2 that the
RYGB vs

Rel
ativ
e ex
pre
ssio
n
Pparg
Nr1h3
Ppard
Lipe
Mlx
ipl
Cpt1c
Srebf1
Ppara
Dgat1
Nr1i2
Cpt1a
Fasn
Cpt2
Ppargc1
a
Dgat2
Ppargc1
bScd
1Acc
s
Elovl
6
Cpt1b
0.0
1.0
2.0
3.0
4.0
5.0 DIOGB-ILRYGB
**
*
*
*
*
*
**
Rel
ativ
e E
xpre
ssio
n
Nfkb2
Nfkbia Tnf
Rela
Relb
Il1b
Ikbka
p
Nfkbib
Ikbkb
Cxcl1
0
Cebpa
Ccl2
Ifng
0
2
4
6
8 DIOGB-ILRYGB
*
**
**
*
Rel
ativ
e ex
pre
ssio
n
Bcl2l
1Bax Ie
r3
Cd274
Cidea Fas
Xiap
Cflar
Traf1
Traf2
Bcl2l
11
Casp9
Pycar
d
Casp3
Casp4
Ptpn13 Tifa
Bcl2
Bnip3
Bcl2a
1a0.0
1.0
2.0
3.0
4.0
5.0 DIOGB-ILRYGB
*
**
*
*
*
*
*
Lipogenesis
a
b
cApoptosis
NFB
Rel
ativ
e ex
pre
ssio
n
Ccl24
Ccr5
Ccl25
Cxcl1
Cxcl9
Ccr9
Ccl22
Ccl5
Ccl2
Ccr7
Ccr6
Ccrl2
Ccr10
Ccr2
Cxcl2
Cxcl1
1
Cxcl1
2
Ccl27
a
Ccl28
Ccl21
a0.0
1.0
2.0
3.0
4.0
5.0 DIOGB-ILRYGB
***
*
**
*
dInflammation

Supplementary Figure 7. Bile diversion to the ileum (GB-IL) and RYGB have differential effects on hepatic gene expression. RNA-seq analysis of (a) NFB-related genes, (b) lipogenesis genes, (c) apoptosis genes and (d) inflammatory genes in the livers of DIO, GB-IL and RYGB mice as assigned to canonical pathways curated by Ingenuity Pathway Analysis. Expression was normalized as described in Supplementary Materials and Methods. N= 4-5 mice per group. Data are presented as mean SEM, unpaired two-tailed Student’s t-test. *P<0.05, *P<0.01 compared with DIO controls.

Supplemental Figure 8. Representative micrographs of DIO, GB-IL and RYGB mouse livers at 4 weeks post-operative stained for hematoxylin and eosin (a-c) and F4/80 (d-f), Ki-67 (g-i) and caspase 3 (j-l) revealed by DAB reactivity and counter-stained for eosin. Mag bar = 100 m.

Supplemental Figure 9. High fat diet decreases gut microbial diversity. Cecal contents were obtained 8 weeks after surgery. Microbial diversity was analyzed by bacterial tag encoded FLX amplicon pyrosequencing (bTEFAP) using a Roche 454 pyrosequencer and titanium reagents, and 3-5k nominal sequences per sample of high quality extracted DNA (a) Rarefaction curves (OUT at sequences dissimilarity cutoff < 3%). Rarefaction curves were calculated for OTUs and indicated that the analysis neared plateau but could benefit from additional sequencing. (b) Chao1 estimates of gut microbial diversity. *P < 0.05 (c) Principal component analysis indicating each sample microbiota variance relative to each other. N= 5 per group.

Supplemental Table 1. Analytical settings for detected bile acids.
Species m/z R.T. Internal Standard
TMCA 514.3 2.72 TβMCA-d4
MCA 407.3 2.80 CA-d4
TMCA 514.3 3.01 TβMCA-d4
MCA 407.3 3.17 CA-d4
TβMCA 514.3 3.17 TβMCA-d4
βMCA 407.3 3.49 CA-d4
THCA 514.3 5.80 GCA-d4
HCA 407.3 6.22 CA-d4
TUDCA 498.3 8.06 GCDCA-d4
UDCA 391.3 8.37 CDCA-d4
THDCA 498.3 8.70 GCDCA-d4
CA 407.3 9.00 CA-d4
HDCA 391.3 9.36 CDCA-d4
TCA 514.3 9.50 TCA-d4
TCDCA 498.3 16.19 TCA-d4
CDCA 391.3 17.00 CDCA-d4
TDCA 498.3 17.48 TCA-d4
DCA 391.3 17.94 CDCA-d4
TLCA 482.3 21.59 CDCA-d4
GCDCA-d4 452.3 14.50
CDCA-d4 395.3 17.00
TCA-d4 518.3 9.50
CA-d4 411.3 9.00
TβMCA-d4 518.3 3.17
GCA-d4 468.3 8.14
Bold: deuterated internal standards

Supplemental Table 2. Mean SEM bile acid species levels in bile diverted and RYGB mouse serum.
BA Species Obese GB-D GB-J GB-IL RYGB
TMCA 291.1 ± 80.2 291.8 ± 157 376.9 ± 81.2 1609.6 ± 437.4 185.9 ± 74.8
TβMCA 1145.3 ± 273.6 662 ± 234.1 692.3 ± 257.9 9741.9 ± 2040.2 947.3 ± 515.9
TMCA 179.7 ± 50.6 131.3 ± 77.6 128.3 ± 50.9 110.9 ± 34 89.3 ± 42.1
CA 191.6 ± 51.2 544 ± 356.9 199.4 ± 80.5 76.4 ± 13.5 485.5 ± 427.1
TCDCA 46.1 ± 11.3 18.7 ± 39.2 25.1 ± 9.4 29.9 ± 13 17 ± 2.3
DCA 51.6 ± 8.6 120.8 ± 77.2 24.4 ± 8.6 28.4 ± 14.3 76.5 ± 46.4
TCA 1216.9 ± 369.6 665.6 ± 163.6 740.5 ± 166.6 2202.1 ± 846.6 476.2 ± 245.4
βMCA 15.2 ± 0.6 30.8 ± 7.9 0 ± 0 42.5 ± 5.6 38.5 ± 14.9
TUDCA 42.5 ± 12.3 51 ± 20.2 41.1 ± 10.8 64.5 ± 11.6 0 ± 0
TDCA 11.1 ± 3.2 167.2 ± 77.3 40.2 ± 14.1 21.3 ± 5.4 31.7 ± 10.3
THDCA 10.8 ± 3.8 55.4 ± 11.7 24.7 ± 7.5 32.9 ± 13.4 62.1 ± 24.8
CDCA 5.8 ± 0 64 ± 45.3 22.4 ± 15.8 0 ± 0 38.2 ± 27 n = 5 mice per group

Supplemental Table 3. Basic mean and two-way ANOVA contrasts adjusted for total body mass (TBM) and fat-free mass (FFM).
Basic Stats Model Overall
Covariate Phase Variable DIO GBIL DIO RYGB DIO GBIL p-value DIO RYGB p value
TBM Light Avg_EE 0.42 (0.031) 0.28 (0.037) 0.42 (0.031) 0.36 (0.052) 0.3 (0.013) 0.36 (0.009) 0.016 0.32 (0.03) 0.5 (0.019) 0.003
FFM Light Avg_EE 0.42 (0.031) 0.28 (0.037) 0.42 (0.031) 0.36 (0.052) 0.36 (0.012) 0.32 (0.009) 0.050 0.37 (0.017) 0.4 (0.013) 0.241 TBM Light Tot_EE 4.32 (0.321) 2.9 (0.391) 4.32 (0.321) 3.75 (0.547) 3.07 (0.135) 3.73 (0.093) 0.019 3.31 (0.32) 5.13 (0.203) 0.003
FFM Light Tot_EE 4.32 (0.321) 2.9 (0.391) 4.32 (0.321) 3.75 (0.547) 3.74 (0.122) 3.28 (0.09) 0.040 3.78 (0.169) 4.11 (0.129) 0.227 TBM Light Avg_VO2 1.45 (0.108) 0.98 (0.134) 1.45 (0.108) 1.26 (0.18) 1.03 (0.047) 1.26 (0.033) 0.018 0.93 (0.099) 1.61 (0.068) 0.004
FFM Light Avg_VO2 1.45 (0.108) 0.98 (0.134) 1.45 (0.108) 1.26 (0.18) 1.26 (0.044) 1.1 (0.033) 0.055 1.28 (0.058) 1.38 (0.044) 0.269 TBM Light Avg_VCO2 1.13 (0.087) 0.79 (0.087) 1.13 (0.087) 0.99 (0.145) 0.83 (0.037) 0.99 (0.025) 0.035 0.85 (0.079) 1.36 (0.05) 0.002
FFM Light Avg_VCO2 1.13 (0.087) 0.79 (0.087) 1.13 (0.087) 0.99 (0.145) 0.99 (0.032) 0.88 (0.023) 0.051 0.98 (0.045) 1.09 (0.034) 0.143 TBM Light Avg_RQ 0.77 (0.007) 0.81 (0.028) 0.77 (0.007) 0.79 (0.008) 0.81 (0.03) 0.78 (0.021) 0.639 0.76 (0.011) 0.79 (0.008) 0.107
FFM Light Avg_RQ 0.77 (0.007) 0.81 (0.028) 0.77 (0.007) 0.79 (0.008) 0.79 (0.018) 0.8 (0.014) 0.747 0.77 (0.005) 0.79 (0.004) 0.031
TBM Dark Avg_EE 0.48 (0.032) 0.29 (0.078) 0.48 (0.032) 0.41 (0.078) 0.36 (0.044) 0.46 (0.021) 0.081 0.38 (0.044) 0.61 (0.028) 0.004
FFM Dark Avg_EE 0.48 (0.032) 0.29 (0.078) 0.48 (0.032) 0.41 (0.078) 0.38 (0.022) 0.36 (0.016) 0.599 0.41 (0.021) 0.46 (0.016) 0.108 TBM Dark Tot_EE 5.76 (0.383) 3.51 (0.941) 5.76 (0.383) 4.95 (0.93) 4.28 (0.534) 5.52 (0.25) 0.081 4.5 (0.524) 7.28 (0.332) 0.004
FFM Dark Tot_EE 5.76 (0.383) 3.51 (0.941) 5.76 (0.383) 4.95 (0.93) 4.54 (0.261) 4.33 (0.193) 0.599 4.87 (0.253) 5.54 (0.192) 0.108 TBM Dark Avg_VO2 1.66 (0.11) 1.01 (0.274) 1.66 (0.11) 1.42 (0.263) 0.92 (0.121) 1.51 (0.084) 0.020 1.3 (0.154) 2.08 (0.098) 0.005
FFM Dark Avg_VO2 1.66 (0.11) 1.01 (0.274) 1.66 (0.11) 1.42 (0.263) 1.31 (0.077) 1.25 (0.057) 0.629 1.41 (0.072) 1.59 (0.055) 0.131 TBM Dark Avg_VCO2 1.32 (0.092) 0.8 (0.206) 1.32 (0.092) 1.16 (0.233) 0.75 (0.087) 1.18 (0.06) 0.018 1.02 (0.119) 1.75 (0.076) 0.002
FFM Dark Avg_VCO2 1.32 (0.092) 0.8 (0.206) 1.32 (0.092) 1.16 (0.233) 1.04 (0.055) 0.98 (0.04) 0.469 1.09 (0.063) 1.3 (0.048) 0.056 TBM Dark Avg_RQ 0.79 (0.01) 0.79 (0.024) 0.79 (0.01) 0.81 (0.027) 0.8 (0.028) 0.78 (0.02) 0.744 0.75 (0.028) 0.84 (0.02) 0.087
FFM Dark Avg_RQ 0.79 (0.01) 0.79 (0.024) 0.79 (0.01) 0.81 (0.027) 0.79 (0.017) 0.79 (0.013) 0.860 0.77 (0.014) 0.82 (0.011) 0.059
TBM Total Avg_EE 0.45 (0.031) 0.29 (0.057) 0.45 (0.031) 0.39 (0.064) 0.28 (0.02) 0.4 (0.014) 0.010 0.35 (0.033) 0.55 (0.021) 0.002
FFM Total Avg_EE 0.45 (0.031) 0.29 (0.057) 0.45 (0.031) 0.39 (0.064) 0.37 (0.015) 0.34 (0.011) 0.221 0.39 (0.018) 0.43 (0.014) 0.137 TBM Total Tot_EE 10.08 (0.699) 6.41 (1.325) 10.08 (0.699) 8.7 (1.467) 6.29 (0.48) 8.94 (0.333) 0.011 7.81 (0.763) 12.41 (0.484) 0.002
FFM Total Tot_EE 10.08 (0.699) 6.41 (1.325) 10.08 (0.699) 8.7 (1.467) 8.29 (0.346) 7.61 (0.256) 0.234 8.65 (0.403) 9.65 (0.306) 0.131 TBM Total Avg_VO2 1.56 (0.108) 0.99 (0.203) 1.56 (0.108) 1.34 (0.219) 0.98 (0.074) 1.38 (0.051) 0.011 1.21 (0.116) 1.9 (0.073) 0.002
FFM Total Avg_VO2 1.56 (0.108) 0.99 (0.203) 1.56 (0.108) 1.34 (0.219) 1.28 (0.055) 1.18 (0.041) 0.243 1.34 (0.062) 1.48 (0.047) 0.162 TBM Total Avg_VCO2 1.22 (0.089) 0.79 (0.145) 1.22 (0.089) 1.08 (0.187) 0.79 (0.047) 1.08 (0.033) 0.007 0.94 (0.086) 1.55 (0.054) 0.001
FFM Total Avg_VCO2 1.22 (0.089) 0.79 (0.145) 1.22 (0.089) 1.08 (0.187) 1.02 (0.036) 0.93 (0.027) 0.150 1.04 (0.051) 1.2 (0.039) 0.069 TBM Total Avg_RQ 0.78 (0.009) 0.8 (0.025) 0.78 (0.009) 0.8 (0.015) 0.8 (0.029) 0.78 (0.02) 0.685 0.75 (0.016) 0.82 (0.011) 0.046
FFM Total Avg_RQ 0.78 (0.009) 0.8 (0.025) 0.78 (0.009) 0.8 (0.015) 0.79 (0.017) 0.79 (0.013) 0.934 0.77 (0.008) 0.8 (0.006) 0.020 For ANOVA of main effects, cells indicating *P 0.05 are shaded pink, cells indicating *P 0.01 are shaded red and cells indicating *P 0.001 are shaded dark red. (n=4 DIO, 6 GB-IL and 6 RYGB). Indirect calorimetry parameters were compared by a 3-way analysis of variances using surgical procedure (GB-IL or RYGB) as main effects and testing for interactions with covariates being either total body mass (TBM) or fat-free mass (FFM; italics). Least squares means were compared using residual variance as the error term and presented as mean SEM. Abbreviations: Avg EE, mean energy expenditure in kcal/hr; Tot_EE, Summed energy expenditure for entire cycle; Avg_VO2, mean volume of O2 ml/min; Avg_VCO2, mean volume of CO2 ml/min; Avg_RQ, mean respiratory quotient).
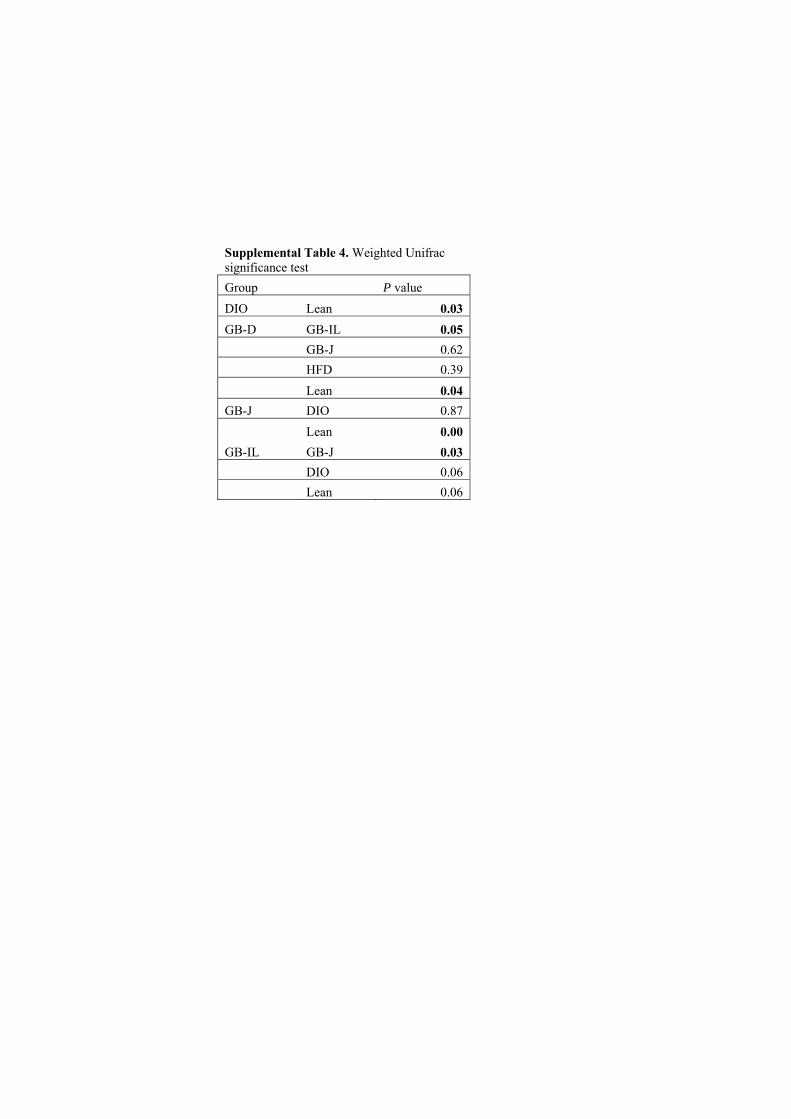
Supplemental Table 4. Weighted Unifrac significance test
Group P value
DIO Lean 0.03
GB-D GB-IL 0.05
GB-J 0.62
HFD 0.39
Lean 0.04
GB-J DIO 0.87
Lean 0.00
GB-IL GB-J 0.03
DIO 0.06
Lean 0.06

Supplemental Table 5. OTU table.
Taxon Lean GB-IL GB-D GB-J DIO
None;Other;Other;Other;Other;Other 7159 7186 4041 5991 6392
k__Bacteria;Other;Other;Other;Other;Other 2 0 0 1 0
k__Bacteria;p__Actinobacteria;c__Actinobacteria;o__Bifidobacteriales;f__Bifidobacteriaceae;g__Bifidobacterium 25 103 8 54 38
k__Bacteria;p__Actinobacteria;c__Thermoleophilia;o__Gaiellales;f__Gaiellaceae;g__ 2 0 2 0 0
k__Bacteria;p__Bacteroidetes;c__Bacteroidia;o__Bacteroidales;Other;Other 4 0 0 0 0
k__Bacteria;p__Bacteroidetes;c__Bacteroidia;o__Bacteroidales;f__;g__ 36 0 0 11 0
k__Bacteria;p__Bacteroidetes;c__Bacteroidia;o__Bacteroidales;f__Bacteroidaceae;g__Bacteroides 2329 1338 7 18 5
k__Bacteria;p__Bacteroidetes;c__Bacteroidia;o__Bacteroidales;f__Porphyromonadaceae;g__Parabacteroides 250 404 0 26 0
k__Bacteria;p__Bacteroidetes;c__Bacteroidia;o__Bacteroidales;f__Prevotellaceae;g__Prevotella 276 0 0 1 0
k__Bacteria;p__Bacteroidetes;c__Bacteroidia;o__Bacteroidales;f__Rikenellaceae;g__ 2607 80 258 125 27
k__Bacteria;p__Bacteroidetes;c__Bacteroidia;o__Bacteroidales;f__Rikenellaceae;g__AF12 38 1 0 27 2
k__Bacteria;p__Bacteroidetes;c__Bacteroidia;o__Bacteroidales;f__S24-7;g__ 10038 117 85 87 5
k__Bacteria;p__Bacteroidetes;c__Bacteroidia;o__Bacteroidales;f__[Odoribacteraceae];g__Odoribacter 64 1 6 44 0
k__Bacteria;p__Deferribacteres;c__Deferribacteres;o__Deferribacterales;f__Deferribacteraceae;g__Mucispirillum 14 3 1 24 0
k__Bacteria;p__Firmicutes;c__Bacilli;o__Bacillales;f__Staphylococcaceae;g__Staphylococcus 0 7 0 0 0
k__Bacteria;p__Firmicutes;c__Bacilli;o__Lactobacillales;f__Enterococcaceae;g__Enterococcus 185 2431 301 293 364
k__Bacteria;p__Firmicutes;c__Bacilli;o__Lactobacillales;f__Lactobacillaceae;g__ 4002 2366 2819 955 1577
k__Bacteria;p__Firmicutes;c__Bacilli;o__Lactobacillales;f__Lactobacillaceae;g__Lactobacillus 29938 31835 4571 32303 28501
k__Bacteria;p__Firmicutes;c__Bacilli;o__Lactobacillales;f__Streptococcaceae;Other 4 75 42 6 11
k__Bacteria;p__Firmicutes;c__Bacilli;o__Lactobacillales;f__Streptococcaceae;g__Streptococcus 0 2 2 2 0
k__Bacteria;p__Firmicutes;c__Bacilli;o__Turicibacterales;f__Turicibacteraceae;g__Turicibacter 0 3 50 22 440
k__Bacteria;p__Firmicutes;c__Clostridia;Other;Other;Other 20 6 25 10 0
k__Bacteria;p__Firmicutes;c__Clostridia;o__;f__;g__ 54 18 5 9 2
k__Bacteria;p__Firmicutes;c__Clostridia;o__Clostridiales;Other;Other 7869 888 1 3 21
k__Bacteria;p__Firmicutes;c__Clostridia;o__Clostridiales;f__;g__ 37 0 7 5 0
k__Bacteria;p__Firmicutes;c__Clostridia;o__Clostridiales;f__Clostridiaceae;g__ 96 32 39 21 12
k__Bacteria;p__Firmicutes;c__Clostridia;o__Clostridiales;f__Clostridiaceae;g__Clostridium 0 1548 3172 1019 629
k__Bacteria;p__Firmicutes;c__Clostridia;o__Clostridiales;f__Dehalobacteriaceae;g__Dehalobacterium 48 3 2 1 1
k__Bacteria;p__Firmicutes;c__Clostridia;o__Clostridiales;f__Lachnospiraceae;Other 354 578 3144 990 221
k__Bacteria;p__Firmicutes;c__Clostridia;o__Clostridiales;f__Lachnospiraceae;g__ 1639 616 3015 1391 235
k__Bacteria;p__Firmicutes;c__Clostridia;o__Clostridiales;f__Lachnospiraceae;g__Anaerostipes 36 0 0 0 0
k__Bacteria;p__Firmicutes;c__Clostridia;o__Clostridiales;f__Lachnospiraceae;g__[Ruminococcus] 272 128 1022 13 54
k__Bacteria;p__Firmicutes;c__Clostridia;o__Clostridiales;f__Peptococcaceae;g__ 3 0 1 0 0
k__Bacteria;p__Firmicutes;c__Clostridia;o__Clostridiales;f__Peptostreptococcaceae;g__ 552 4394 11249 1433 2100
k__Bacteria;p__Firmicutes;c__Clostridia;o__Clostridiales;f__Ruminococcaceae;Other 271 41 42 38 17
k__Bacteria;p__Firmicutes;c__Clostridia;o__Clostridiales;f__Ruminococcaceae;g__ 1602 12 26 16 143
k__Bacteria;p__Firmicutes;c__Clostridia;o__Clostridiales;f__Ruminococcaceae;g__Anaerotruncus 7 25 5 0 0
k__Bacteria;p__Firmicutes;c__Clostridia;o__Clostridiales;f__Ruminococcaceae;g__Oscillospira 812 89 62 105 18
k__Bacteria;p__Firmicutes;c__Clostridia;o__Clostridiales;f__Ruminococcaceae;g__Ruminococcus 132 6 13 9 0
k__Bacteria;p__Firmicutes;c__Clostridia;o__Coriobacteriales;f__;g__ 5 0 0 0 0
k__Bacteria;p__Firmicutes;c__Clostridia;o__Coriobacteriales;f__Coriobacteriaceae;g__ 45 0 0 0 0
k__Bacteria;p__Firmicutes;c__Clostridia;o__Coriobacteriales;f__Coriobacteriaceae;g__Adlercreutzia 1475 198 1895 552 362
k__Bacteria;p__Firmicutes;c__Erysipelotrichi;o__Erysipelotrichales;f__Erysipelotrichaceae;g__ 105 2 4 2 4
k__Bacteria;p__Firmicutes;c__Erysipelotrichi;o__Erysipelotrichales;f__Erysipelotrichaceae;g__Allobaculum 7075 55 16044 20682 12585
k__Bacteria;p__Firmicutes;c__Erysipelotrichi;o__Erysipelotrichales;f__[Coprobacillaceae];g__ 0 4 0 0 0
k__Bacteria;p__Firmicutes;c__Erysipelotrichi;o__Erysipelotrichales;f__[Coprobacillaceae];g__Coprobacillus 156 0 0 0 0
k__Bacteria;p__Proteobacteria;c__Alphaproteobacteria;o__;f__;g__ 6 0 0 0 0
k__Bacteria;p__Proteobacteria;c__Alphaproteobacteria;o__RF32;f__;g__ 8 0 0 0 0
k__Bacteria;p__Proteobacteria;c__Betaproteobacteria;o__Burkholderiales;f__Alcaligenaceae;g__Sutterella 258 10 0 0 0
k__Bacteria;p__Proteobacteria;c__Betaproteobacteria;o__Burkholderiales;f__Burkholderiaceae;g__ 2 0 0 0 0
k__Bacteria;p__Proteobacteria;c__Deltaproteobacteria;o__Desulfovibrionales;f__Desulfovibrionaceae;g__Bilophila 0 0 0 1 1
k__Bacteria;p__Proteobacteria;c__Deltaproteobacteria;o__Desulfovibrionales;f__Desulfovibrionaceae;g__Desulfovibrio 155 25 219 89 31
k__Bacteria;p__Proteobacteria;c__Epsilonproteobacteria;o__Campylobacterales;f__Helicobacteraceae;Other 38 2 0 0 0
k__Bacteria;p__Proteobacteria;c__Epsilonproteobacteria;o__Campylobacterales;f__Helicobacteraceae;g__Helicobacter 377 1143 0 23 2
k__Bacteria;p__Proteobacteria;c__Gammaproteobacteria;o__Enterobacteriales;f__Enterobacteriaceae;Other 0 2611 26 233 0
k__Bacteria;p__Proteobacteria;c__Gammaproteobacteria;o__Enterobacteriales;f__Enterobacteriaceae;g__Erwinia 0 0 0 2 0
k__Bacteria;p__Proteobacteria;c__Gammaproteobacteria;o__Enterobacteriales;f__Enterobacteriaceae;g__Escherichia 0 1784 46 107 0
k__Bacteria;p__Proteobacteria;c__Gammaproteobacteria;o__Enterobacteriales;f__Enterobacteriaceae;g__Klebsiella 0 5507 0 0 0
k__Bacteria;p__Proteobacteria;c__Gammaproteobacteria;o__Enterobacteriales;f__Enterobacteriaceae;g__Trabulsiella 0 113 1 0 0
k__Bacteria;p__Spirochaetes;c__[Brachyspirae];o__[Brachyspirales];f__Brachyspiraceae;g__Brachyspira 5 0 0 0 0
k__Bacteria;p__TM7;c__TM7-3;o__CW040;f__F16;g__ 1333 0 726 851 2108
k__Bacteria;p__Verrucomicrobia;c__Verrucomicrobiae;o__Verrucomicrobiales;f__Verrucomicrobiaceae;g__Akkermansia 0 32 0 19 0

Supplemental Table 6. Oligonucleotides used for quantitative RT-PCR. Target Forward Primer Reverse Primer BACS ACC CTG GAT CAG CTC CTG GAT GTT CTC AGC TAG CAG CTT GG BAT GGA AAC CTG TTA GTT CTC AGG C GTG GAC CCC CAT ATA GTC TCC BSEP CTG CCA AGG ATG CTA ATG CA CGA TGG CTA CCC TTT GCT TCT IBAT ACC ACT TGC TCC ACA CTG CTT CGT TCC TGA GTC AAC CCA CAT MRP3 TCC CAC TTT TCG GAG ACA GTA AC ACT GAG GAC CTT GAA GTC TTG GA NTCP ATG ACC ACC TGC TCC AGC TT GCC TTT GTA GGG CAC CTT GT OATP1 CAG TCT TAC GAG TGT GCT CCA GAT ATG AGG AAT ACT GCC TCT GAA GTG OST TGT TCC AGG TGC TTG TCA TCC CCA CTG TTA GCC AAG ATG GAG AA OSTβ GAT GCG GCT CCT TGG AAT TA GGA GGA ACA TGC TTG TCA TGA C IBABP CAG GAG ACG TGA TTG AAA GGG GCC CCC AGA GTA AGA CTG GG A. muciniphila CAG CAC GTG AAG GTG GGG AC CCT TGC GGT TGG CTT CAG AT C. minuta TTC GGG AGG AAC TGT GGG TAT GGT TGC TCA CGC GTT ACT CA