Relationships between leader reward and punishment ... Classes/Fall 07/Org Psy/Cases... ·...
30
Organizational Behavior and Human Decision Processes 99 (2006) 113–142 www.elsevier.com/locate/obhdp 0749-5978/$ - see front matter 2005 Elsevier Inc. All rights reserved. doi:10.1016/j.obhdp.2005.09.002 Relationships between leader reward and punishment behavior and subordinate attitudes, perceptions, and behaviors: A meta-analytic review of existing and new research Philip M. PodsakoV a,¤ , William H. Bommer b , Nathan P. PodsakoV c , Scott B. MacKenzie a a Indiana University, USA b Cleveland State University, USA c University of Florida, USA Received 7 June 2004 Available online 9 November 2005 Abstract Despite decades of research on the relationships between leader reward and punishment behaviors and employee attitudes, per- ceptions, and performance, no comprehensive examination of these relationships has been reported in the literature. This paper reports the results of two studies that address this issue. In the Wrst study, data from 20 new samples were gathered on the relation- ships between leader reward and punishment behaviors and some criterion variables that have not been examined extensively in pre- vious research. In the second study, a meta-analytic review was conducted incorporating both the new and existing research in order to provide estimates of the bivariate relationships between these leader behaviors and a variety of employee criterion variables across 78 studies containing 118 independent samples. Results of regression analyses designed to control for the eVects of the other leader behaviors showed that: (a) the relationships between leader reward and punishment behaviors and employee attitudes, perceptions, and behaviors were more functional when the rewards or punishments were administered contingently than when they were adminis- tered non-contingently, and (b) these leader reward and punishment behaviors were strongly related to two variables (employees’ perceptions of justice and role ambiguity) that were expected to be key mediators of the relationships between these leader behaviors and the employee criterion variables. In addition, meta-analytic evidence from longitudinal studies suggested that the same leader behavior can be a cause of some employee criterion variables, and a consequence of others. Implications of these Wndings for future research in the area are discussed. 2005 Elsevier Inc. All rights reserved. Keywords: Leader reward and punishment behavior; Contingent reward and punishment behavior; Transactional leadership behavior; Leadership meta-analysis Ever since leader reward and punishment behaviors were introduced into the Weld in the 1970s (cf. Scott, 1977; Sims, 1977; Sims & Szilagyi, 1975) they have been seen as central to the role of leaders, because they are important determinants of employee attitudes, percep- tions and behavior. For example, in what he termed a reinforcement analysis of leadership, Sims (1977) pro- posed that leadership itself may be viewed as the man- agement of reinforcement contingencies in work settings, and that the administration of reinforcing events contin- gent upon desirable or appropriate forms of employee behavior is critical to the development and maintenance of employee performance. From this perspective, posi- tive reinforcers made contingent upon appropriate task behaviors should increase subordinate performance, * Corresponding author. Fax: +1 812 855 8679. E-mail addresses: [email protected] (P.M. PodsakoV), [email protected] (W.H. Bommer), podsakof@uX.edu (N.P. PodsakoV), [email protected] (S.B. MacKenzie).
Transcript of Relationships between leader reward and punishment ... Classes/Fall 07/Org Psy/Cases... ·...
Organizational Behavior and Human Decision Processes 99 (2006) 113–142
www.elsevier.com/locate/obhdp
Relationships between leader reward and punishment behavior and subordinate attitudes, perceptions, and behaviors: A meta-analytic review of existing and new research
Philip M. PodsakoVa,¤, William H. Bommer b, Nathan P. PodsakoV
c, Scott B. MacKenzie a
a Indiana University, USAb Cleveland State University, USA
c University of Florida, USA
Received 7 June 2004Available online 9 November 2005
Abstract
Despite decades of research on the relationships between leader reward and punishment behaviors and employee attitudes, per-ceptions, and performance, no comprehensive examination of these relationships has been reported in the literature. This paperreports the results of two studies that address this issue. In the Wrst study, data from 20 new samples were gathered on the relation-ships between leader reward and punishment behaviors and some criterion variables that have not been examined extensively in pre-vious research. In the second study, a meta-analytic review was conducted incorporating both the new and existing research in orderto provide estimates of the bivariate relationships between these leader behaviors and a variety of employee criterion variables across78 studies containing 118 independent samples. Results of regression analyses designed to control for the eVects of the other leaderbehaviors showed that: (a) the relationships between leader reward and punishment behaviors and employee attitudes, perceptions,and behaviors were more functional when the rewards or punishments were administered contingently than when they were adminis-tered non-contingently, and (b) these leader reward and punishment behaviors were strongly related to two variables (employees’perceptions of justice and role ambiguity) that were expected to be key mediators of the relationships between these leader behaviorsand the employee criterion variables. In addition, meta-analytic evidence from longitudinal studies suggested that the same leaderbehavior can be a cause of some employee criterion variables, and a consequence of others. Implications of these Wndings for futureresearch in the area are discussed. 2005 Elsevier Inc. All rights reserved.
Keywords: Leader reward and punishment behavior; Contingent reward and punishment behavior; Transactional leadership behavior; Leadershipmeta-analysis
Ever since leader reward and punishment behaviorswere introduced into the Weld in the 1970s (cf. Scott,1977; Sims, 1977; Sims & Szilagyi, 1975) they have beenseen as central to the role of leaders, because they areimportant determinants of employee attitudes, percep-
* Corresponding author. Fax: +1 812 855 8679.E-mail addresses: [email protected] (P.M. PodsakoV),
[email protected] (W.H. Bommer), [email protected] (N.P.PodsakoV), [email protected] (S.B. MacKenzie).
0749-5978/$ - see front matter 2005 Elsevier Inc. All rights reserved.doi:10.1016/j.obhdp.2005.09.002
tions and behavior. For example, in what he termed areinforcement analysis of leadership, Sims (1977) pro-posed that leadership itself may be viewed as the man-agement of reinforcement contingencies in work settings,and that the administration of reinforcing events contin-gent upon desirable or appropriate forms of employeebehavior is critical to the development and maintenanceof employee performance. From this perspective, posi-tive reinforcers made contingent upon appropriate taskbehaviors should increase subordinate performance,
114 P.M. PodsakoV et al. / Organizational Behavior and Human Decision Processes 99 (2006) 113–142
while negative reinforcers (or aversive stimuli) shouldincrease escape and/or avoidance responses on the partof employees. If these escape responses include func-tional task behaviors, then negative feedback may alsolead to increases in employee performance.
Similar predictions regarding the eVects of leader con-tingent and non-contingent reward behaviors were alsoincorporated into the path-goal model of leadership (cf.Evans, 1970; Fulk & Wendler, 1982; House, 1971; House& Mitchell, 1974). Path-goal theory suggests when aleader establishes a close linkage between subordinateperformance and rewards it will increase performance,because such linkages increase the subordinate’s percep-tion of instrumentality (cf. Evans, 1970; House, 1971),and increase job satisfaction, because high performersshould receive rewards of greater magnitude and fre-quency.
Leader reward and punishment behavior is also theheart of what is called transactional leadership (cf. Avo-lio, 1999; Bass, 1985; Burns, 1978; Howell & Avolio,1993). According to Burns (1978), Bass (1985, 1998), andothers (cf. Atwater, Cambobreco, Dionne, Avolio, &Lau, 1997; Avolio, 1999), transactional leaders are thosewho establish a “give and take” relationship with theirsubordinates in which the leader provides rewards toemployees in exchange for their performance on the job.In their theories, transactional leaders can motivate fol-lowers either by clarifying expectations and identifyingthe rewards that they will receive for meeting theseexpectations (e.g., using contingent rewards), or by tak-ing corrective actions when followers do not performeVectively. More speciWcally, Bass (1985, p. 122) arguesthat:
Directly or indirectly, leaders can provide rewards forprogress toward ƒ goals or for reaching them. Or, theycan impose penalties for failure ranging from negativefeedback to dismissal. Such positive and aversivecontingent reinforcement are seen as the two ways man-agers in organizational settings engage in transactionalleadership to motivate employees. Contingent positivereinforcementƒ reinforcesƒ employee performance.Contingent aversive reinforcement is a manger’s reac-tion to an employee’s failure to achieve the agreed-uponperformance. The manager’s reaction signals the needtoƒmodify or change the employee’s behavior. It signalsthe need for a reclariWcation of what needs to be doneand how (Bass, 1985, p. 122).
However, despite the obvious importance of leaderreward and punishment behavior to these theories ofleadership, no comprehensive meta-analytic review ofthe relationships between these key managerial behav-iors and subordinate criterion variables exists. Of course,this is not to say that this important area has been totallyneglected. Indeed, two meta-analyses (Lowe, Kroeck, &Sivasubramaniam, 1996; Judge & Piccolo, 2004) have
been conducted, and both show the potential impor-tance of contingent reward behavior in determiningleadership eVectiveness. For example, Lowe et al. (1996)reported that transactional leadership (in the form ofcontingent reward behavior) had a mean corrected cor-relation of .41 with leadership eVectiveness, and Judgeand Piccolo (2004) found that contingent reward behav-ior had stronger relationships than transformationalleadership with three of the six criterion variables theyexamined (follower job satisfaction, motivation, andleader job performance), leading them to conclude thatfuture research should study these behaviors in moredetail.
Unfortunately, both the Lowe et al. (1996) and theJudge and Piccolo (2004) meta-analyses are somewhatlimited in scope with respect to the forms of leaderreward and punishment behavior and the range of crite-rion variables they examined. For example, becausethese meta-analytic reviews focused on the transforma-tional/transactional leadership model, they were limitedto studies that included both transactional and transfor-mational leadership behavior. Thus, research examiningleader reward and punishment behavior using alterna-tive leadership frameworks, such as the path-goal orreinforcement approaches, were outside the scope ofthese reviews. This is an important issue, because therehave actually been more studies conducted on leaderreward and punishment behavior using other conceptualframeworks, than there have been using the transforma-tional/transactional approach. In addition, because oftheir interest in the transformational/transactional lead-ership model, the Lowe et al. (1996) and Judge and Pic-colo (2004) meta-analyses focused on a relatively limitedset of criterion variables, and did not consider the rela-tionships between leader reward and punishment behav-iors and important employee criterion variables like roleperceptions (e.g., role ambiguity), justice perceptions(e.g., distributive justice, procedural justice), employeeattitudes (e.g., organizational commitment, trust in one’ssupervisor), and employee behaviors (e.g., task perfor-mance, extra-role behaviors). Finally, these meta-analy-ses did not include all four forms of leader contingentand non-contingent reward and punishment behavior.This is noteworthy because the predicted relationshipsbetween contingent forms of leader reward and punish-ment behaviors and employee attitudes, perceptions, andbehaviors are substantially diVerent from the predictedrelationships between non-contingent forms of leaderreward and punishment behavior and these same crite-rion variables; and because it is important to understandthe relative magnitudes of their unique eVects on thesecriterion variables.
Therefore, the purpose of this paper is to report theresults of two studies that provide a more comprehensiveempirical summary of what is known about (a) the rela-tionships between leader contingent and noncontingent
P.M. PodsakoV et al. / Organizational Behavior and Human Decision Processes 99 (2006) 113–142 115
reward and punishment behaviors and employee atti-tudes, role perceptions and performance, and (b) theirrelative (unique) eVects on these criterion variables.More speciWcally, the goal of Study 1 was to gather dataon the relationships between leader reward and punish-ment behaviors and a wide variety of criterion variables,some of which have not been examined extensively inprevious research in the Weld. In Study 2, we provide ameta-analytic review incorporating all of the publisheddata on the relationships between leader reward andpunishment behavior and a wide variety of employeeattitudes, perceptions and behaviors, plus the previouslyunpublished data from Study 1. In contrast to the lim-ited scope of previous meta-analyses, an attempt wasmade in Study 2 to include every published article thathas examined leader reward and punishment behavior,regardless of the theoretical orientation of the authors.Before presenting the results of our two studies, we willWrst brieXy review several hypotheses regarding thediVerential relationships expected between leader contin-gent and non-contingent reward and punishment behav-iors and employee criterion variables included in thisresearch.
Hypotheses
Although leader reward and punishment behaviorshave been recognized as key forms of leader behavior fordecades, surprisingly little attention has been given toarticulating the reasons why they inXuence employee cri-terion variables. On the one hand, one could argue thatit does not matter why these behaviors inXuence perfor-mance; all one needs to know is that they do. Indeed,Scott (1977) and Luthans and Kreitner (1975) and Sta-jkovic and Luthans (1997) would argue that it is noteven necessary for employees to consciously recognizethe contingency between the rewards and punishmentsadministered by the leader and their own behavior. Thiswould suggest that leader reward and punishmentbehaviors may be directly related to employee outcomevariables without any mediating cognitive mechanisms;and there is evidence to support this (cf. Keller &Szilagyi, 1978; PodsakoV, Todor, Grover, & Huber,1984; Sims, 1977).
However, there is also evidence that the manner inwhich leaders administer rewards and punishmentsaVects internal cognitive processes on the part ofemployees that subsequently inXuence employee atti-tudes and behaviors. This would suggest that we need tounderstand how leader reward and punishment behav-iors inXuence employee cognitive processes. We proposetwo main mechanisms through which leader reward andpunishment behaviors inXuence employee attitudes, per-ceptions, and behaviors. One is that leader reward andpunishment behaviors aVect employee perceptions of
fairness (Ball, Trevino, & Sims, 1992; Greenberg, 1990;Trevino, 1992). Many employees believe that the out-comes they receive from an organization should belinked to the contributions they make to the organiza-tion. So leaders who administer reward/punishmentsbased on this equity rule will be perceived as fairer thanleaders who allocate rewards/punishments based onsome other rule (e.g., equality, need, seniority, etc.).Indeed, Greenberg (1990, p. 175), has noted that one wayleaders can enhance employee perceptions of fairness isto clarify their “ƒbeliefs about what outcomes they mayexpect to receive for the work they do.” This is also con-sistent with Farh, PodsakoV, and Cheng’s (1987)hypothesis that, because they explicitly link their praise,commendations, and social approval to the performancelevels of their employees, leaders who administerrewards contingently will be perceived to be fairer thanleaders who administer rewards non-contingently. Thus,because many employees feel that for equity reasonsrewards ought to be linked to job performance, they rec-ognize the fairness of a procedure that administersrewards in this manner. Leaders who administer rewardscontingently will be perceived to be fairer in a proce-dural sense because they are adhering more closely toequity principles in their reward allocation procedures,and in a distributive sense, because employees will per-ceive the outcomes of this type of reward allocation pro-cedure to be deserved.
Similarly, leaders who administer punishments con-tingently should be perceived to be fairer than leaderswho administer punishments non-contingently, becausethey clearly link their reprimands and social disapprovalto the performance levels of their employees. This is con-sistent with Ball et al. (1992) who proposed that, “pun-ishment contingent upon undesired behavior will bepositively related to subordinate’s procedural justiceevaluations” (p. 311); and that when subordinates per-ceive that they have been punished appropriately they“will evaluate the punishment as more distributivelyjust” (p. 315). It is also consistent with Trevino (1992),who has noted that punishment administered contin-gently enhances employees’ perceptions of retributivejustice. Thus, there is good reason to believe that leaderswho administer punishments contingently will be per-ceived to be fairer from a distributive, procedural andretributive justice perspective, than leaders who adminis-ter punishments non-contingently.
It is important that employees perceive they are treatedfairly, because these perceptions have been found to berelated to a variety of important outcomes, includingemployee satisfaction, commitment to the organization,trust in one’s leader, withdrawal behaviors, task perfor-mance and organizational citizenship behaviors (e.g.,Cohen-Charash & Spector, 2001; Colquitt, Conlon, Wes-son, Porter, & Ng, 2001; Folger & Konovosky, 1989;Greenberg, 1990). Although it makes sense that leader
116 P.M. PodsakoV et al. / Organizational Behavior and Human Decision Processes 99 (2006) 113–142
reward and punishment behavior might inXuence theseoutcomes through its eVect on perception of fairness, theonly empirical evidence in support of this mechanism isfrom a single study (Pillai, Schriesheim, & Williams, 1999)that examined the eVect of leader contingent rewardbehavior (but neither contingent punishment behaviornor non-contingent reward or punishment behavior) onperceptions of distributive justice. Therefore, additionalevidence of the relationship between leader reward andpunishment behavior and employee perceptions of justiceis needed, but our expectation is that:
Hypothesis 1. The relationships between leader reward(punishment) behavior and employee perceptions of jus-tice will be more positive when the rewards (punishments)are administered contingently upon subordinate perfor-mance than when they are administered non-contingently.
A second important mechanism through which leadercontingent reward and punishment behavior inXuencesemployee criterion variables is that it clariWes whichbehaviors the leader desires the employee to exhibit. Whenemployees consciously recognize that some behaviors arerewarded by the leader and some are punished, it clariWestheir understanding of what the leader would like them todo. This is important because reducing role ambiguity hasbeen shown to increase job satisfaction, organizationalcommitment and task performance, and decrease employ-ees’ anxiety, tension, and propensity to leave (Jackson,Schwab, & Schuler, 1986; MacKenzie, PodsakoV, &Ahearne, 1998; MacKenzie, PodsakoV, & Rich, 2001;Tubre & Collins, 2000). In contrast, when leaders adminis-ter rewards and punishments in a manner that is unrelatedto an employee’s behavior, the employee may be likely tobecome confused about what he or she can do to obtaindesired outcomes. Thus, when leaders administer rewardsand punishments contingent upon certain behaviors, theyclarify their expectations of what they want employees todo, and thereby reduce role ambiguity (or enhance roleclarity). Indeed, Sims and Szilagyi (1975) have argued thatleader contingent punishment behavior “is related to satis-faction through [its ability to reduce] perceived role ambi-guityƒ” (p. 436). This expectation has been supported inseveral studies (Bateman, Strasser, & Dailey, 1983; Pod-sakoV et al., 1984; Sims & Szilagyi, 1975). Therefore, weexpect that:
Hypothesis 2. The relationships between leader reward(punishment) behavior and subordinate role ambiguitywill be more negative when the rewards (punishments) areadministered contingent upon subordinate performancethan when they are administered non-contingently.
Employee eVort and performance
As noted by Farh, PodsakoV, and Organ (1990), con-tingent rewards and punishments enhance employee
perceptions of fairness and, when employees feel they arebeing treated fairly, they are more likely to work harder,resulting in higher levels of in-role and extra-role behavior(cf. Ball et al., 1992, Ball, Trevino, & Sims, 1994;Konovsky & Pugh, 1994; Moorman, 1991; Organ, 1988).In contrast, rewards and punishments administered in amanner that is perceived not to be contingent upon per-formance are likely to be seen as unfair because they areadministered arbitrarily, and thus should be de-motivat-ing and be negatively related to employee in-role andextra-role (citizenship) behavior. The negative relationshipshould especially hold true for non-contingent punishmentbehaviors, because employee performance is more likely tobe disrupted when employees receive punishments thatthey do not think they deserve, than when they receiverewards that they do not think they deserve. Thus,
Hypothesis 3. The relationship between leader reward(punishment) behavior and subordinate eVort and in-role and extra-role performance will be more positive (orless negative) when the rewards (punishments) areadministered contingent upon subordinate performancethan when they are administered non-contingently.
Group-level or unit performance
Several authors (cf. Hardin, 1968; Lawler, 1971;Schelling, 1971) have provided examples of the poten-tially dysfunctional consequences that may result fromrewarding group members on an individual basis. Theseexamples suggest that although individually adminis-tered rewards may increase the motivation of groupmembers, this motivation may be channeled into behav-ior that is counterproductive to the group as a whole.However, Stogdill (1972) reported that group drive (ormotivation) is generally positively related to group pro-ductivity, suggesting that leader behaviors that increasea group’s drive will also increase a group’s productivity.Moreover, Zander (1971) has noted that group drivegenerally results in increased group productivity, butonly when group members are provided with accuratefeedback (i.e., feedback that is contingent upon theirlevel of performance). Since leaders who administer con-tingent rewards and punishments provide feedback thatis perceived to be fair with respect to the level of perfor-mance of group members (cf. Trevino, 1992), but leaderswho administer rewards and punishments non-contin-gently do not provide feedback that is perceived to befair with respect to group members’ performance levels,we would expect the following:
Hypothesis 4. The relationship between leader reward(punishment) behavior and group or unit-level perfor-mance will be more positive (or less negative) when therewards (punishments) are administered contingentupon subordinate performance than when they areadministered non-contingently.
P.M. PodsakoV et al. / Organizational Behavior and Human Decision Processes 99 (2006) 113–142 117
Employee attitudes and perceptions
As noted earlier, leaders who administer rewards andpunishment contingently are expected to reduce employ-ees’ perceptions of role ambiguity. This should have apositive eVect on employee attitudes and perceptions oftheir organization, because role ambiguity creates stress,decreases employees’ motivation to learn, and hinderstheir ability to achieve valued goals (Cavanaugh, Bos-well, Roehling, & Boudreau, 2000; LePine, LePine, &Jackson, 2004). In addition, because leaders who admin-ister rewards and punishments contingently provide pos-itive feedback, compliments, and special recognition tothose employees who deserve to be rewarded, and verbalreprimands, expressions of disapproval, and demonstra-tions of their displeasure to employees who deserve to bepunished, they will be perceived to be fairer (distribu-tively, procedurally, and retributively) than those thatadminister rewards and punishments non-contingently(cf. Adams, 1965; Farh et al., 1990; Pillai et al., 1999;Trevino, 1992). And, because employees who are treatedfairly will have more positive attitudes toward their jobsand the organization (cf. Greenberg, 1990; Organ, 1988;PodsakoV, MacKenzie, Moorman, & Fetter, 1990; Shore& Shore, 1995; Rhoades & Eisenberger, 2002), we expectthat:
Hypothesis 5. The relationships between leader reward(punishment) behavior and employee (a) expressions oftrust in their leader, (b) satisfaction, (c) commitment, (d)perceptions of organizational support, and (e) intentionsto stay will be more positive (or less negative) when therewards (punishments) are administered contingentlythan when they are administered non-contingently.
Employee cynicism about organizational change
Finally, Andersson (1996) has argued that employeeswho are not treated with respect by their managers, orwho perceive that their managers misuse their authority,are likely to become less trusting and more cynical oftheir organization and the leaders within it. Similar argu-ments have been made by Wanous, Reichers, and Austin(2000), when discussing the causes of employee’s cyni-cism about organizational changes. These authors alsonote that it is important for managers to reinforceappropriate behavior during times of change. Since lead-ers who use non-contingent rewards and punishmentsare more likely to be seen as abusing their authority, nottreating people with respect, and not reinforcing appro-priate behavior, such leader behaviors would beexpected to produce more employee cynicism aboutchange than leaders who use contingent rewards. Thus,
Hypothesis 6. The relationships between leader reward(punishment) behavior and employee cynicism aboutorganizational change will be more negative (or less pos-
itive) when the rewards (punishments) are administeredcontingent upon subordinate performance than whenthey are administered non-contingently.
Study 1—Research conducted in new samples
As noted earlier, our Wrst study was designed toreport the Wndings of some new research on the relation-ships between leader reward and punishment behaviorsand a variety of subordinate criterion variables. Thisstudy reports data from 20 new samples with a total N of4988. These samples came from a large-scale studydesigned to examine the relationships between leaderreward and punishment behaviors and employee crite-rion variables in a variety of manufacturing Wrms. Thecompany contacts came from two major sources: (1) aletter sent out to manufacturing Wrms employingbetween 100 and 500 people in a Midwestern state, and(2) presentations made at local Chamber of Commercemeetings in areas with large numbers of manufacturingcompanies. The samples were diVerent enough to pro-vide signiWcant variation in the type of individualemployed, but comparable in that they were all organi-zations whose primary function was to manufacture andsell products.
Method
Samples and data acquisition
The study’s second author administered an employeesurvey on-site as each location scheduled time for allemployees to take part in the study. Each employeereceived a survey, a letter from the researcher assuringthe conWdentiality of his or her responses, and a letterfrom the company’s president guaranteeing the conW-dentiality of the data. During the same day that theemployee data were collected, the researcher providedsupervisors with performance appraisal forms contain-ing the names of their immediate subordinates. Thenames for the performance appraisal forms wereobtained from company records. These researcher-pro-vided instruments were necessary because the companydid not have a consistent performance appraisal mecha-nism across locations and levels.
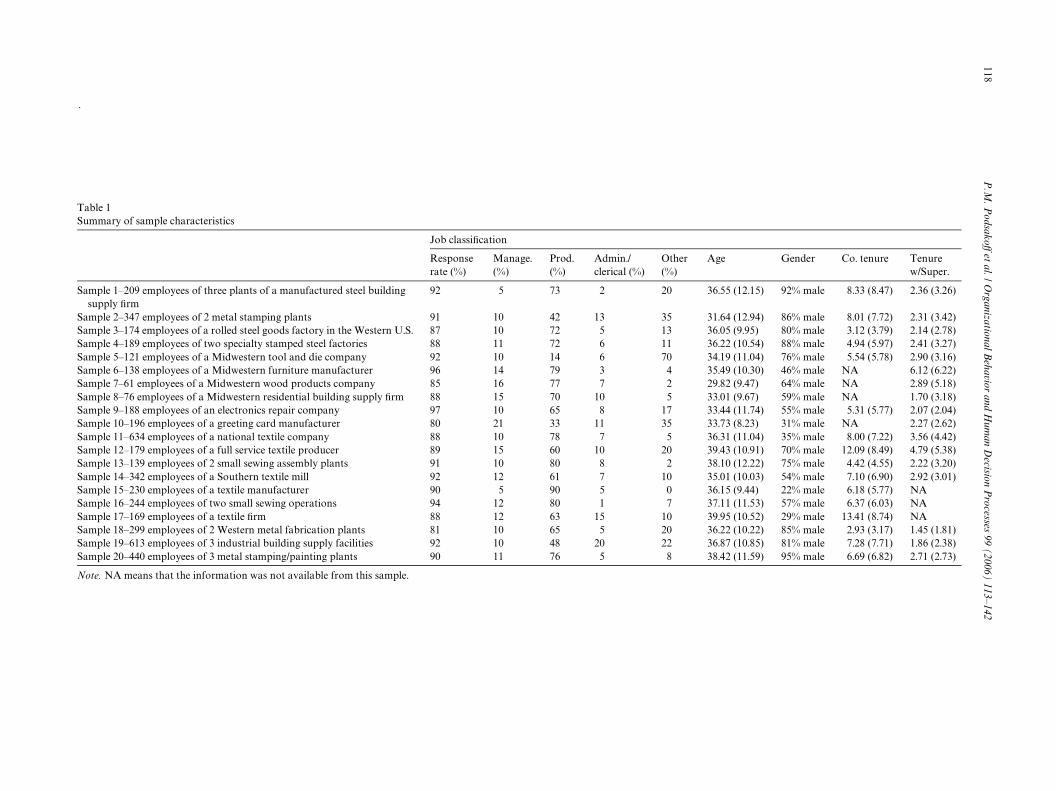
Table 1 summarizes the characteristics of the 20 newsamples obtained for this study. As indicated in thistable, the samples ranged in size from a low of 61 to ahigh of 634 employees with an average sample size of249. The response rates in these samples were extremelyhigh, ranging from 80 to 94% with an average of 89.55%.These atypical response rates were probably due to thefact that the data gathering was endorsed by senior man-agement in each company and employees were given
118P
.M. P
odsakoV et al. / O
rganizational Behavior and H
uman D
ecision Processes 99 (2006) 113–142
.
Table 1Summary of sample chara
Note. NA means that the
dmin./erical (%)
Other (%)
Age Gender Co. tenure Tenure w/Super.
Sample 1–209 employees supply Wrm
20 36.55 (12.15) 92% male 8.33 (8.47) 2.36 (3.26)
Sample 2–347 employees 35 31.64 (12.94) 86% male 8.01 (7.72) 2.31 (3.42)Sample 3–174 employees o 13 36.05 (9.95) 80% male 3.12 (3.79) 2.14 (2.78)Sample 4–189 employees 11 36.22 (10.54) 88% male 4.94 (5.97) 2.41 (3.27)Sample 5–121 employees 70 34.19 (11.04) 76% male 5.54 (5.78) 2.90 (3.16)Sample 6–138 employees 4 35.49 (10.30) 46% male NA 6.12 (6.22)Sample 7–61 employees o 2 29.82 (9.47) 64% male NA 2.89 (5.18)Sample 8–76 employees o 5 33.01 (9.67) 59% male NA 1.70 (3.18)Sample 9–188 employees 17 33.44 (11.74) 55% male 5.31 (5.77) 2.07 (2.04)Sample 10–196 employees 35 33.73 (8.23) 31% male NA 2.27 (2.62)Sample 11–634 employees 5 36.31 (11.04) 35% male 8.00 (7.22) 3.56 (4.42)Sample 12–179 employees 20 39.43 (10.91) 70% male 12.09 (8.49) 4.79 (5.38)Sample 13–139 employees 2 38.10 (12.22) 75% male 4.42 (4.55) 2.22 (3.20)Sample 14–342 employees 10 35.01 (10.03) 54% male 7.10 (6.90) 2.92 (3.01)Sample 15–230 employees 0 36.15 (9.44) 22% male 6.18 (5.77) NASample 16–244 employees 7 37.11 (11.53) 57% male 6.37 (6.03) NASample 17–169 employees 10 39.95 (10.52) 29% male 13.41 (8.74) NASample 18–299 employees 20 36.22 (10.22) 85% male 2.93 (3.17) 1.45 (1.81)Sample 19–613 employees 22 36.87 (10.85) 81% male 7.28 (7.71) 1.86 (2.38)Sample 20–440 employees 8 38.42 (11.59) 95% male 6.69 (6.82) 2.71 (2.73)
cteristics
information was not available from this sample.
Job classiWcation
Response rate (%)
Manage.(%)
Prod. (%)
Acl
of three plants of a manufactured steel building 92 5 73 2
of 2 metal stamping plants 91 10 42 13f a rolled steel goods factory in the Western U.S. 87 10 72 5
of two specialty stamped steel factories 88 11 72 6of a Midwestern tool and die company 92 10 14 6of a Midwestern furniture manufacturer 96 14 79 3f a Midwestern wood products company 85 16 77 7f a Midwestern residential building supply Wrm 88 15 70 10of an electronics repair company 97 10 65 8 of a greeting card manufacturer 80 21 33 11 of a national textile company 88 10 78 7 of a full service textile producer 89 15 60 10 of 2 small sewing assembly plants 91 10 80 8 of a Southern textile mill 92 12 61 7 of a textile manufacturer 90 5 90 5 of two small sewing operations 94 12 80 1 of a textile Wrm 88 12 63 15 of 2 Western metal fabrication plants 81 10 65 5 of 3 industrial building supply facilities 92 10 48 20 of 3 metal stamping/painting plants 90 11 76 5
P.M. PodsakoV et al. / Organizational Behavior and Human Decision Processes 99 (2006) 113–142 119
company time to complete the questionnaires. Almosttwo-thirds (64.9%) of the employees included in thesesamples were production workers, although the percent-age of production workers ranged across the samplesfrom a low of 14% in sample 5 to a high of 90% in sam-ple 15. The average age across all 20 samples was 35.69years old, and the majority of employees were males(65%) who had worked in their company for almost 7years, and for their present supervisor for almost 3 years.
Measures
All of the measures used in the present study havebeen reported in previous research in the Weld. Measuresof leader behaviors, job attitudes, and job perceptionswere collected from employees, while the matching mea-sures of employee eVort and performance were obtainedfrom their supervisors. However, given the desire of thesenior management teams in all of the samples to keepthe questionnaires to a reasonable length, not all of themeasures were included in all of the samples.
Leader reward and punishment behaviorsA slightly shortened version of the questionnaire
developed by PodsakoV and Skov, and reported Wrst inPodsakoV, Todor, and Skov (1982) was used to measureleader reward and punishment behaviors in this study.This scale measures four aspects of leader behavior: (1)contingent reward behavior (5 items, shortened from 10items), contingent punishment behavior (5 items), non-contingent reward behavior (4 items), and non-contin-gent punishment behavior (4 items). Previous research(cf. Barge & Schlueter, 1991; PodsakoV et al., 1984;Schriesheim, Hinkin, & Tetrault, 1991) has shown theindividual items on this questionnaire load on theirintended factors and that each of the scale’s four dimen-sions possesses adequate internal consistency reliability.A shortened version of this scale was used in thisresearch because most of the organizations wanted tokeep the length of the questionnaire to a minimum, andbecause preliminary work we had conducted in othersamples had indicated that the shortened version of thequestionnaire had good reliability and produced rela-tionships that were very similar to those with the full 10-item scale.
Employee attitudes and job perceptionsGeneral satisfaction was measured with the Michigan
Organizational Assessment Questionnaire (MOAQ;Cammann, Fichman, Jenkins, & Klesh, 1983). This scalemeasures overall job satisfaction using three items, andhas been shown (cf. Sanchez, Kraus, White, & Williams,1999) to be factorially distinct from constructs such asorganizational muniWcence, high-involvement humanresource practices, and benchmarking, and to possessadequate internal consistency reliabilities (cf. McFarlin
& Rice, 1992; McLain, 1995; Pearson, 1991). TheMOAQ was also used to measure Wve facets of employeesatisfaction, including satisfaction with: supervision (3items), coworkers (3 items), pay (2 items) job security (2items), and growth opportunities (4 items). Cammannet al. (1983) have reported that these facet measures ofsatisfaction possess adequate psychometric properties.Organizational commitment was measured with the shortform (9 items) of Porter, Steers, Mowday, and Boulian’s(1974) Organizational Commitment Questionnaire(OCQ), while aVective and continuance commitment weremeasured with Meyer and Allen’s (1997) 6-item mea-sures. Mowday, Steers, and Porter (1979) and Porteret al. (1974) have provided evidence in support of theconstruct validity of the OCQ. In addition, the short-ened version of this scale has been shown to correlatestrongly with the original 15-item version (Huselid &Day, 1991), and be factorially distinct (Cohen, 1996)from several related constructs such as job involvement,career commitment, and work involvement. Meyer,Allen, and Smith (1993) have shown the items on the 6-item aVective and continuance scales load on theirintended factors, and possess good internal consistencyreliabilities. Distributive justice was measured with Priceand Mueller’s (1986) 6-item distributive justice scale,while procedural justice and interactional justice wereassessed using NiehoV and Moorman’s (1993) 6-itemand 8-item measures, respectively. McFarlin andSweeney (1992), Moorman (1991), and Sweeney andMcFarlin (1993) have provided evidence that Priceand Mueller’s (1986) distributive justice scale possessesadequate internal consistency reliability; and NiehoV
and Moorman (1993) and Aquino et al. (1999), haveprovided evidence that NiehoV and Moorman’s (1993)procedural and interactional justice scales are unidimen-sional and possess adequate internal consistency reli-ability. Perceived organizational support was assessedusing Eisenberger, Huntington, Hutchison, and Sowa’s(1986) short form (9 items) from the Survey of PerceivedOrganizational Support. The shortened measure hasbeen used in a variety of studies (cf. Rhoades & Eisen-berger, 2002) and has been shown to possess good psy-chometric properties. Trust in and loyalty to one’ssupervisor was measured with PodsakoV et al.’s (1990) 6-item scale. This scale has been shown to be unidimen-sional and have good reliability (cf. PodsakoV et al.,1990; PodsakoV, MacKenzie, & Bommer, 1996).Employees’ intentions to leave were assessed withCammann et al.’s (1983) 3-item turnover intention scale.These authors have provided evidence that this scale isunidimensional, and possesses good internal consistencyreliability. Finally, Wanous et al.’s (2000) 8-item scalewas used to assess employees’ cynicism about organiza-tional change. Wanous et al. (2000) provide evidence thatthis scale factors into a single dimension, with accept-able internal consistency reliability.
120 P.M. PodsakoV et al. / Organizational Behavior and Human Decision Processes 99 (2006) 113–142
Employee eVort and performanceAs noted earlier, unlike the measures of leader behav-
ior and employees’ attitudes and perceptions, all of themeasures of employee eVort and performance taken inthe 20 samples included in this study were obtained fromthe employees’ supervisors. Employee eVort was mea-sured with a single-item from Bass’s (1985) extra eVortscale. Employee in-role (task) performance was assessedwith a shortened version (4-items) from Williams andAnderson’s (1991) in-role performance measure, whileoverall employee performance was assessed with the threeitem scale developed by MacKenzie, PodsakoV, andFetter (1991, 1993). Research has shown that the itemson Williams and Anderson’s (1991) in-role performancemeasure load on a single factor, and that the scale pos-sesses good internal consistency reliability (cf. Funder-burg & Levy, 1997; Morrison & Phelps, 1999; Thompson& Werner, 1997). Similar support for the psychometricproperties of MacKenzie et al.’s overall performancemeasure has also been reported (cf. MacKenzie et al.,1991, 1993). In addition to employee eVort and task per-formance, several measures of employee citizenshipbehavior were also assessed in the present study, using aslightly reduced version of the scales developed by Pod-sakoV et al. (1990). The items included on this scale mea-sure all Wve of “citizenship behavior” dimensionsidentiWed by Organ (1988), including altruism, courtesy,conscientiousness, civic virtue and sportsmanship. Previ-ous research (cf. MacKenzie et al., 1991, 1993; NiehoV &Moorman, 1993) has generally shown this scale to pos-sess good validity and quite acceptable levels of internalconsistency reliability.
Seven-point Likert scales ranging from (1) “stronglydisagree” to (7) “strongly agree” were utilized to assessall of the constructs measured in the present study.
Results
Our analysis indicated that the majority of the mea-sures used in the present study met or exceeded Nun-nally and Bernstein’s (1994) recommended internalconsistency reliability criterion level of .70. Indeed, allbut two of the scales (non-contingent reward behaviorand satisfaction with coworkers) had an average alphaof .70 or above. In addition, 87% of the 267 multi-itemmeasures used in all 20 samples in the present study metor exceeded this criterion level. Thus, with a few excep-tions, the measures included in our study possessed ade-quate levels of reliability. (Complete descriptivestatistics, including the means, standard deviations, andreliability estimates are available upon request from theWrst author.)
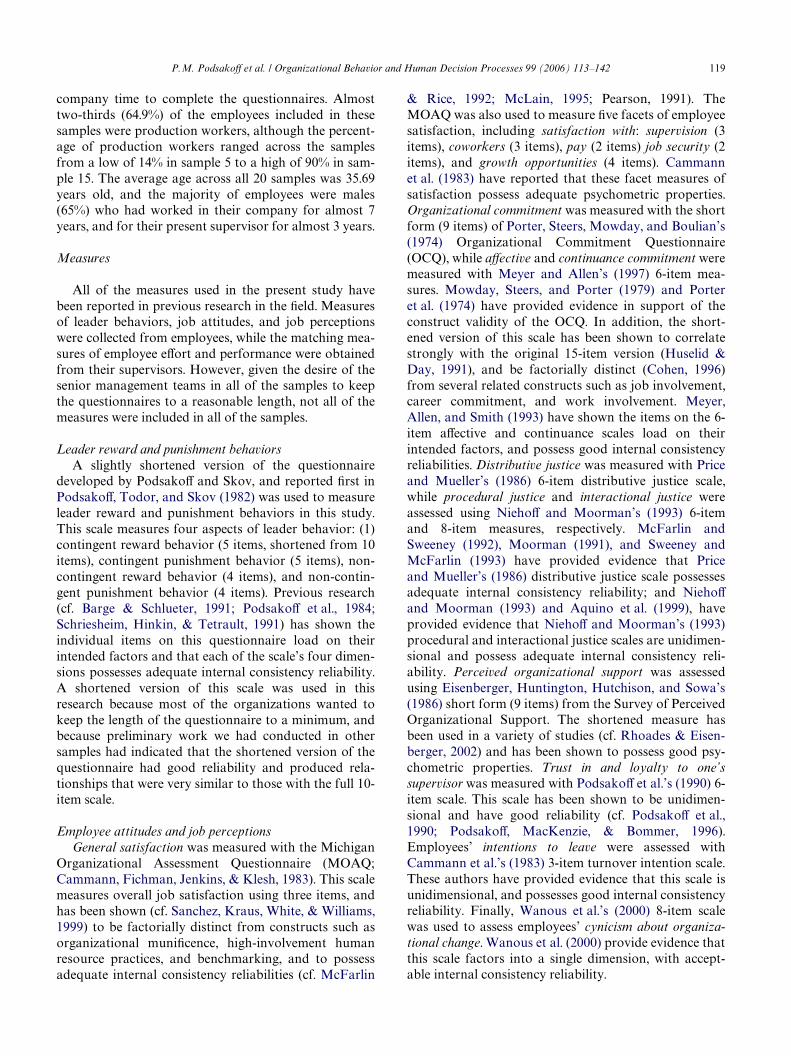
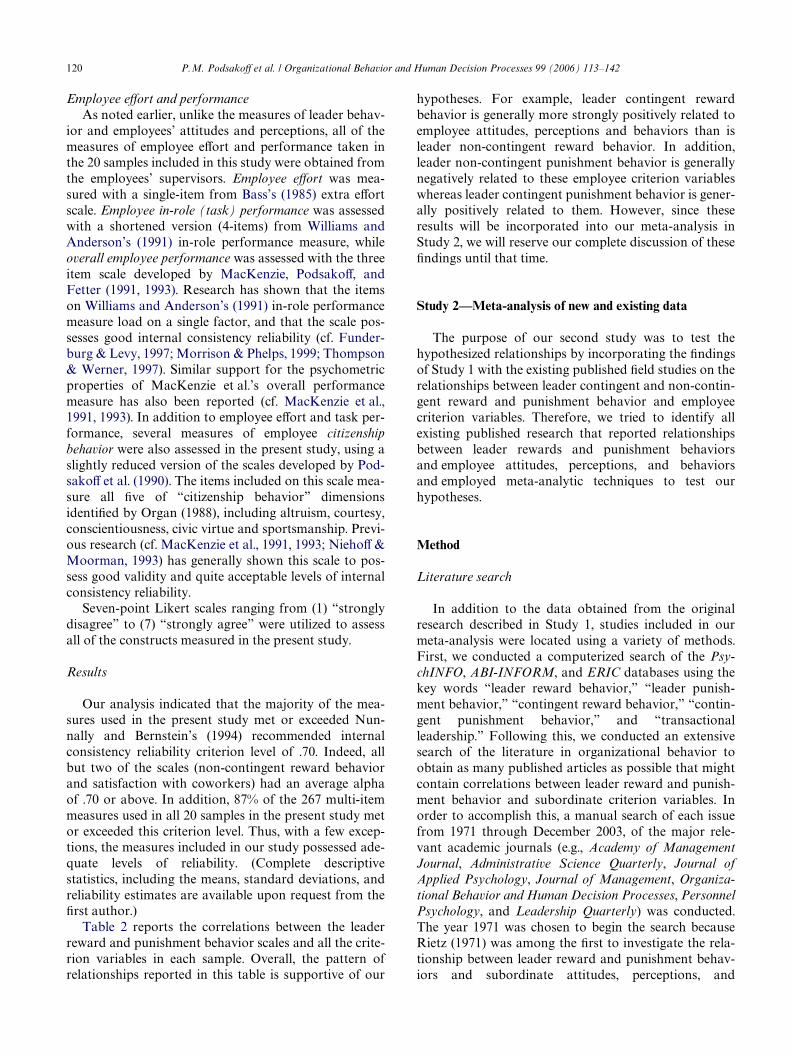
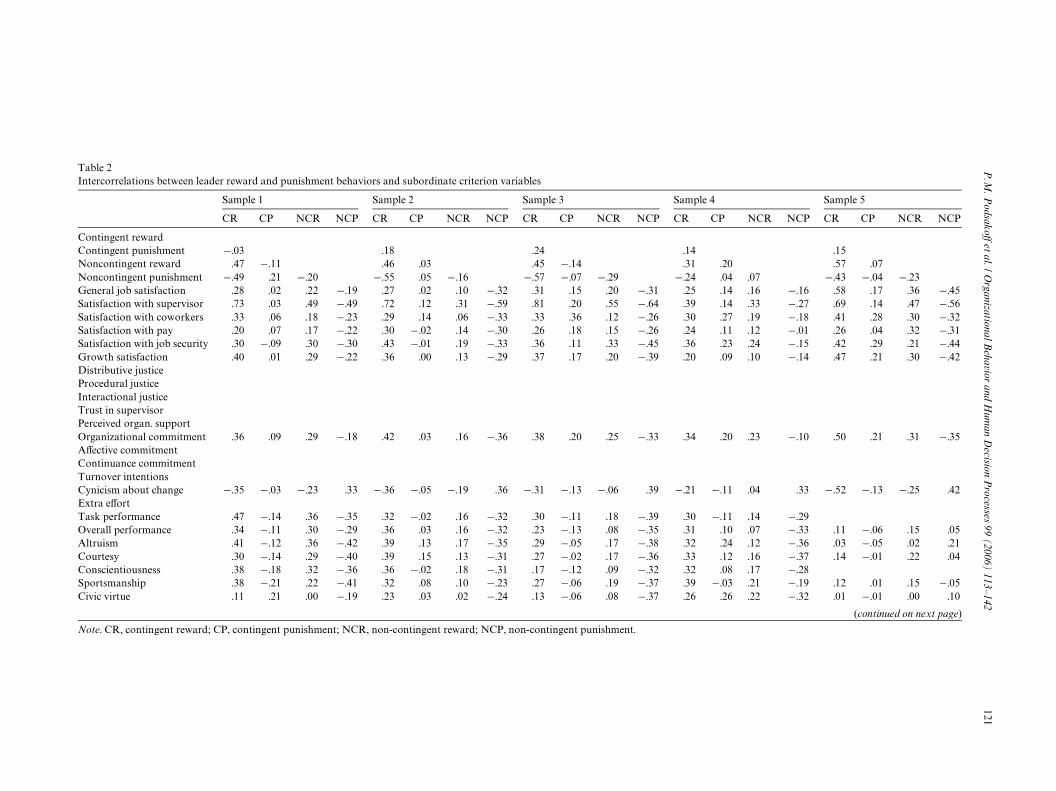
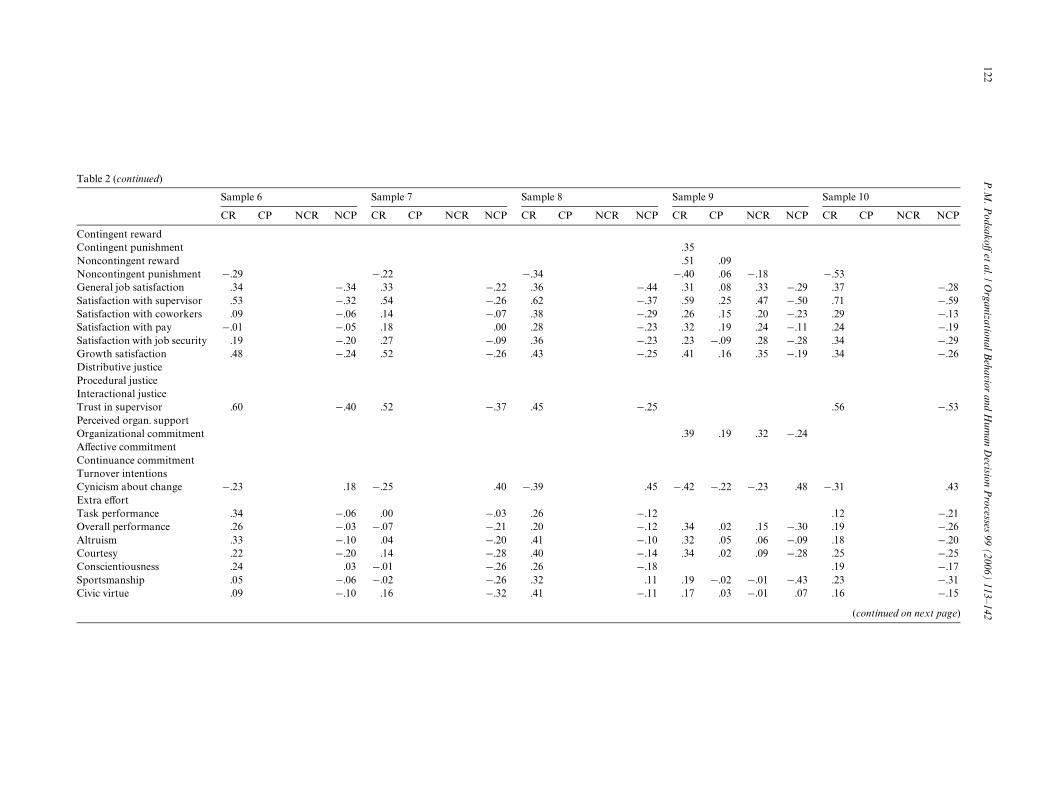
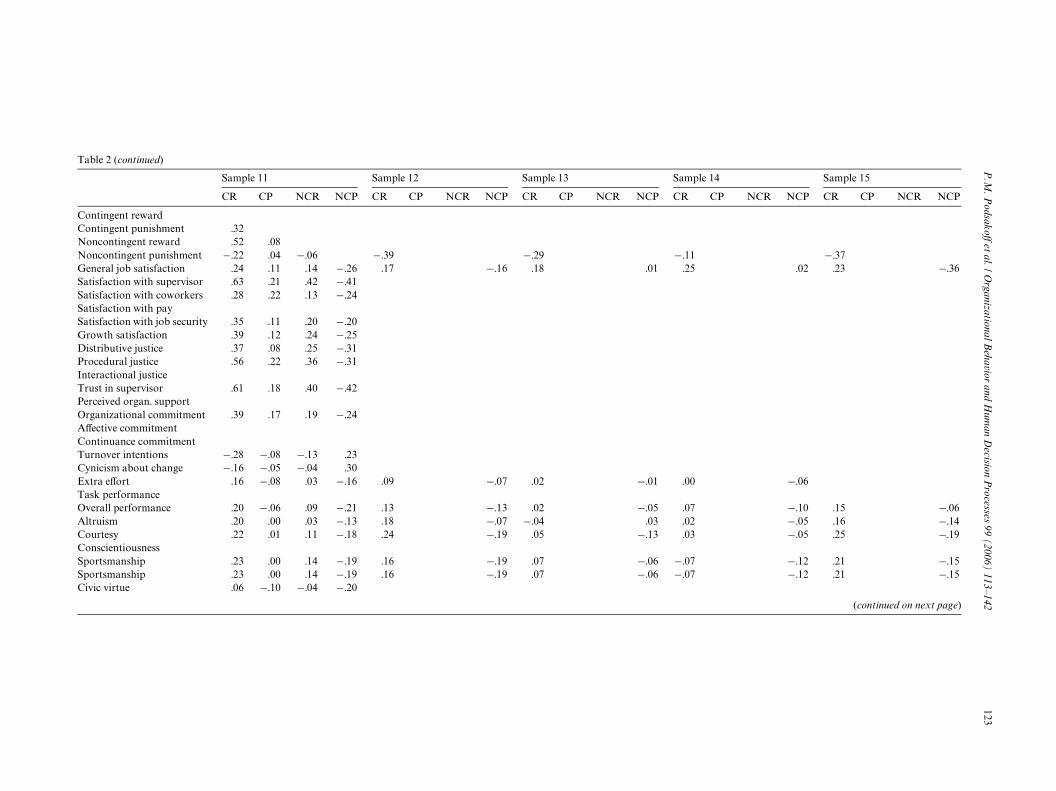
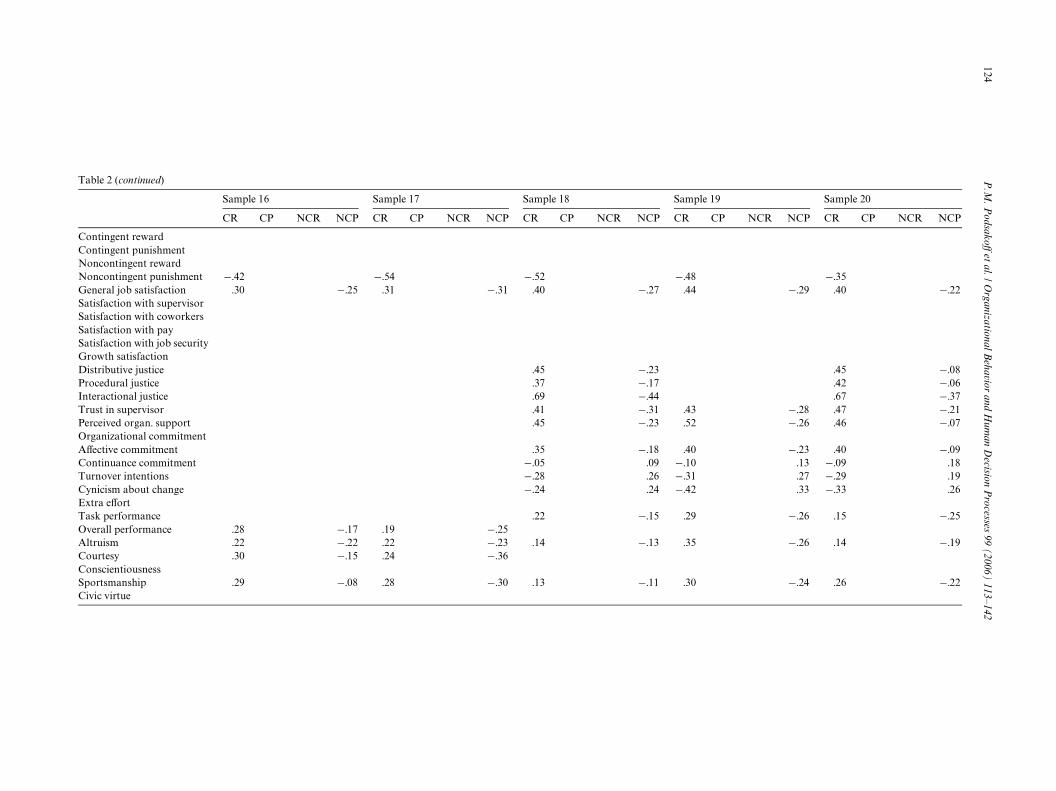
Table 2 reports the correlations between the leaderreward and punishment behavior scales and all the crite-rion variables in each sample. Overall, the pattern ofrelationships reported in this table is supportive of our
hypotheses. For example, leader contingent rewardbehavior is generally more strongly positively related toemployee attitudes, perceptions and behaviors than isleader non-contingent reward behavior. In addition,leader non-contingent punishment behavior is generallynegatively related to these employee criterion variableswhereas leader contingent punishment behavior is gener-ally positively related to them. However, since theseresults will be incorporated into our meta-analysis inStudy 2, we will reserve our complete discussion of theseWndings until that time.
Study 2—Meta-analysis of new and existing data
The purpose of our second study was to test thehypothesized relationships by incorporating the Wndingsof Study 1 with the existing published Weld studies on therelationships between leader contingent and non-contin-gent reward and punishment behavior and employeecriterion variables. Therefore, we tried to identify allexisting published research that reported relationshipsbetween leader rewards and punishment behaviorsand employee attitudes, perceptions, and behaviorsand employed meta-analytic techniques to test ourhypotheses.
Method
Literature search
In addition to the data obtained from the originalresearch described in Study 1, studies included in ourmeta-analysis were located using a variety of methods.First, we conducted a computerized search of the Psy-chINFO, ABI-INFORM, and ERIC databases using thekey words “leader reward behavior,” “leader punish-ment behavior,” “contingent reward behavior,” “contin-gent punishment behavior,” and “transactionalleadership.” Following this, we conducted an extensivesearch of the literature in organizational behavior toobtain as many published articles as possible that mightcontain correlations between leader reward and punish-ment behavior and subordinate criterion variables. Inorder to accomplish this, a manual search of each issuefrom 1971 through December 2003, of the major rele-vant academic journals (e.g., Academy of ManagementJournal, Administrative Science Quarterly, Journal ofApplied Psychology, Journal of Management, Organiza-tional Behavior and Human Decision Processes, PersonnelPsychology, and Leadership Quarterly) was conducted.The year 1971 was chosen to begin the search becauseRietz (1971) was among the Wrst to investigate the rela-tionship between leader reward and punishment behav-iors and subordinate attitudes, perceptions, and
P.M
. Podsako
V et al. / Organizational B
ehavior and Hum
an Decision P
rocesses 99 (2006) 113–142121
Table 2Intercorrelations
Sample 4 Sample 5
CR CP NCR NCP CR CP NCR NCP
Contingent rewaContingent puni .14 .15Noncontingent r .31 .20 .57 .07Noncontingent p ¡.24 .04 .07 ¡.43 ¡.04 ¡.23General job satis .25 .14 .16 ¡.16 .58 .17 .36 ¡.45Satisfaction with .39 .14 .33 ¡.27 .69 .14 .47 ¡.56Satisfaction with .30 .27 .19 ¡.18 .41 .28 .30 ¡.32Satisfaction with .24 .11 .12 ¡.01 .26 .04 .32 ¡.31Satisfaction with .36 .23 .24 ¡.15 .42 .29 .21 ¡.44Growth satisfact .20 .09 .10 ¡.14 .47 .21 .30 ¡.42Distributive justiProcedural justicInteractional jusTrust in supervisPerceived organ.Organizational c .34 .20 .23 ¡.10 .50 .21 .31 ¡.35AVective commitContinuance comTurnover intentiCynicism about ¡.21 ¡.11 .04 .33 ¡.52 ¡.13 ¡.25 .42Extra eVortTask performanc .30 ¡.11 .14 ¡.29Overall performa .31 .10 .07 ¡.33 .11 ¡.06 .15 .05Altruism .32 .24 .12 ¡.36 .03 ¡.05 .02 .21Courtesy .33 .12 .16 ¡.37 .14 ¡.01 .22 .04Conscientiousne .32 .08 .17 ¡.28Sportsmanship .39 ¡.03 .21 ¡.19 .12 .01 .15 ¡.05Civic virtue .26 .26 .22 ¡.32 .01 ¡.01 .00 .10
(continued on next page)
Note. CR, contin
between leader reward and punishment behaviors and subordinate criterion variables
Sample 1 Sample 2 Sample 3
CR CP NCR NCP CR CP NCR NCP CR CP NCR NCP
rdshment ¡.03 .18 .24eward .47 ¡.11 .46 .03 .45 ¡.14unishment ¡.49 .21 ¡.20 ¡.55 .05 ¡.16 ¡.57 ¡.07 ¡.29faction .28 .02 .22 ¡.19 .27 .02 .10 ¡.32 .31 .15 .20 ¡.31 supervisor .73 .03 .49 ¡.49 .72 .12 .31 ¡.59 .81 .20 .55 ¡.64 coworkers .33 .06 .18 ¡.23 .29 .14 .06 ¡.33 .33 .36 .12 ¡.26 pay .20 .07 .17 ¡.22 .30 ¡.02 .14 ¡.30 .26 .18 .15 ¡.26 job security .30 ¡.09 .30 ¡.30 .43 ¡.01 .19 ¡.33 .36 .11 .33 ¡.45ion .40 .01 .29 ¡.22 .36 .00 .13 ¡.29 .37 .17 .20 ¡.39ceeticeor supportommitment .36 .09 .29 ¡.18 .42 .03 .16 ¡.36 .38 .20 .25 ¡.33mentmitment
onschange ¡.35 ¡.03 ¡.23 .33 ¡.36 ¡.05 ¡.19 .36 ¡.31 ¡.13 ¡.06 .39
e .47 ¡.14 .36 ¡.35 .32 ¡.02 .16 ¡.32 .30 ¡.11 .18 ¡.39nce .34 ¡.11 .30 ¡.29 .36 .03 .16 ¡.32 .23 ¡.13 .08 ¡.35
.41 ¡.12 .36 ¡.42 .39 .13 .17 ¡.35 .29 ¡.05 .17 ¡.38
.30 ¡.14 .29 ¡.40 .39 .15 .13 ¡.31 .27 ¡.02 .17 ¡.36ss .38 ¡.18 .32 ¡.36 .36 ¡.02 .18 ¡.31 .17 ¡.12 .09 ¡.32
.38 ¡.21 .22 ¡.41 .32 .08 .10 ¡.23 .27 ¡.06 .19 ¡.37
.11 .21 .00 ¡.19 .23 .03 .02 ¡.24 .13 ¡.06 .08 ¡.37
gent reward; CP, contingent punishment; NCR, non-contingent reward; NCP, non-contingent punishment.
122P
.M. P
odsakoV et al. / O
rganizational Behavior and H
uman D
ecision Processes 99 (2006) 113–142
Table 2 (continued)
Sample 9 Sample 10
CP CR CP NCR NCP CR CP NCR NCP
Contingent rewardContingent punishm .35Noncontingent rew .51 .09Noncontingent pun ¡.40 .06 ¡.18 ¡.53General job satisfac .44 .31 .08 .33 ¡.29 .37 ¡.28Satisfaction with su .37 .59 .25 .47 ¡.50 .71 ¡.59Satisfaction with co .29 .26 .15 .20 ¡.23 .29 ¡.13Satisfaction with pa .23 .32 .19 .24 ¡.11 .24 ¡.19Satisfaction with job .23 .23 ¡.09 .28 ¡.28 .34 ¡.29Growth satisfaction .25 .41 .16 .35 ¡.19 .34 ¡.26Distributive justiceProcedural justiceInteractional justiceTrust in supervisor .25 .56 ¡.53Perceived organ. suOrganizational com .39 .19 .32 ¡.24AVective commitmeContinuance commTurnover intentionsCynicism about cha .45 ¡.42 ¡.22 ¡.23 .48 ¡.31 .43Extra eVortTask performance .12 .12 ¡.21Overall performanc .12 .34 .02 .15 ¡.30 .19 ¡.26Altruism .10 .32 .05 .06 ¡.09 .18 ¡.20Courtesy .14 .34 .02 .09 ¡.28 .25 ¡.25Conscientiousness .18 .19 ¡.17Sportsmanship .11 .19 ¡.02 ¡.01 ¡.43 .23 ¡.31Civic virtue .11 .17 .03 ¡.01 .07 .16 ¡.15
(continued on next page)
Sample 6 Sample 7 Sample 8
CR CP NCR NCP CR CP NCR NCP CR CP NCR N
entardishment ¡.29 ¡.22 ¡.34tion .34 ¡.34 .33 ¡.22 .36 ¡pervisor .53 ¡.32 .54 ¡.26 .62 ¡workers .09 ¡.06 .14 ¡.07 .38 ¡y ¡.01 ¡.05 .18 .00 .28 ¡ security .19 ¡.20 .27 ¡.09 .36 ¡
.48 ¡.24 .52 ¡.26 .43 ¡
.60 ¡.40 .52 ¡.37 .45 ¡pportmitmentntitment
nge ¡.23 .18 ¡.25 .40 ¡.39
.34 ¡.06 .00 ¡.03 .26 ¡e .26 ¡.03 ¡.07 ¡.21 .20 ¡
.33 ¡.10 .04 ¡.20 .41 ¡
.22 ¡.20 .14 ¡.28 .40 ¡
.24 .03 ¡.01 ¡.26 .26 ¡
.05 ¡.06 ¡.02 ¡.26 .32
.09 ¡.10 .16 ¡.32 .41 ¡
P.M
. Podsako
V et al. / Organizational B
ehavior and Hum
an Decision P
rocesses 99 (2006) 113–142123
Table 2 (contin
Sample 14 Sample 15
P CR CP NCR NCP CR CP NCR NCP
Contingent rewContingent punNoncontingentNoncontingent ¡.11 ¡.37General job sat 01 .25 .02 .23 ¡.36Satisfaction wiSatisfaction wiSatisfaction wiSatisfaction wiGrowth satisfaDistributive jusProcedural justInteractional juTrust in supervPerceived orgaOrganizationalAVective commContinuance coTurnover intenCynicism abouExtra eVort 01 .00 ¡.06Task performaOverall perform 05 .07 ¡.10 .15 ¡.06Altruism 03 .02 ¡.05 .16 ¡.14Courtesy 13 .03 ¡.05 .25 ¡.19ConscientiousnSportsmanship 06 ¡.07 ¡.12 .21 ¡.15Sportsmanship 06 ¡.07 ¡.12 .21 ¡.15Civic virtue
(continued on next page)
ued)
Sample 11 Sample 12 Sample 13
CR CP NCR NCP CR CP NCR NCP CR CP NCR NC
ardishment .32
reward .52 .08 punishment ¡.22 .04 ¡.06 ¡.39 ¡.29isfaction .24 .11 .14 ¡.26 .17 ¡.16 .18 .th supervisor .63 .21 .42 ¡.41th coworkers .28 .22 .13 ¡.24th payth job security .35 .11 .20 ¡.20ction .39 .12 .24 ¡.25tice .37 .08 .25 ¡.31ice .56 .22 .36 ¡.31sticeisor .61 .18 .40 ¡.42n. support commitment .39 .17 .19 ¡.24itmentmmitment
tions ¡.28 ¡.08 ¡.13 .23t change ¡.16 ¡.05 ¡.04 .30
.16 ¡.08 .03 ¡.16 .09 ¡.07 .02 ¡.nce
ance .20 ¡.06 .09 ¡.21 .13 ¡.13 .02 ¡..20 .00 .03 ¡.13 .18 ¡.07 ¡.04 ..22 .01 .11 ¡.18 .24 ¡.19 .05 ¡.
ess.23 .00 .14 ¡.19 .16 ¡.19 .07 ¡..23 .00 .14 ¡.19 .16 ¡.19 .07 ¡..06 ¡.10 ¡.04 ¡.20
124P
.M. P
odsakoV et al. / O
rganizational Behavior and H
uman D
ecision Processes 99 (2006) 113–142
Table 2 (continued)
Sample 19 Sample 20
CP CR CP NCR NCP CR CP NCR NCP
Contingent rewardContingent punishmNoncontingent rewNoncontingent pun ¡.48 ¡.35General job satisfac .27 .44 ¡.29 .40 ¡.22Satisfaction with suSatisfaction with coSatisfaction with paSatisfaction with joGrowth satisfactionDistributive justice .23 .45 ¡.08Procedural justice .17 .42 ¡.06Interactional justice .44 .67 ¡.37Trust in supervisor .31 .43 ¡.28 .47 ¡.21Perceived organ. su .23 .52 ¡.26 .46 ¡.07Organizational comAVective commitme .18 .40 ¡.23 .40 ¡.09Continuance comm .09 ¡.10 .13 ¡.09 .18Turnover intentions .26 ¡.31 .27 ¡.29 .19Cynicism about cha .24 ¡.42 .33 ¡.33 .26Extra eVortTask performance .15 .29 ¡.26 .15 ¡.25Overall performancAltruism .13 .35 ¡.26 .14 ¡.19CourtesyConscientiousnessSportsmanship .11 .30 ¡.24 .26 ¡.22Civic virtue
Sample 16 Sample 17 Sample 18
CR CP NCR NCP CR CP NCR NCP CR CP NCR N
entardishment ¡.42 ¡.54 ¡.52tion .30 ¡.25 .31 ¡.31 .40 ¡pervisorworkersy
b security
.45 ¡
.37 ¡
.69 ¡
.41 ¡pport .45 ¡mitmentnt .35 ¡itment ¡.05
¡.28nge ¡.24
.22 ¡e .28 ¡.17 .19 ¡.25
.22 ¡.22 .22 ¡.23 .14 ¡
.30 ¡.15 .24 ¡.36
.29 ¡.08 .28 ¡.30 .13 ¡
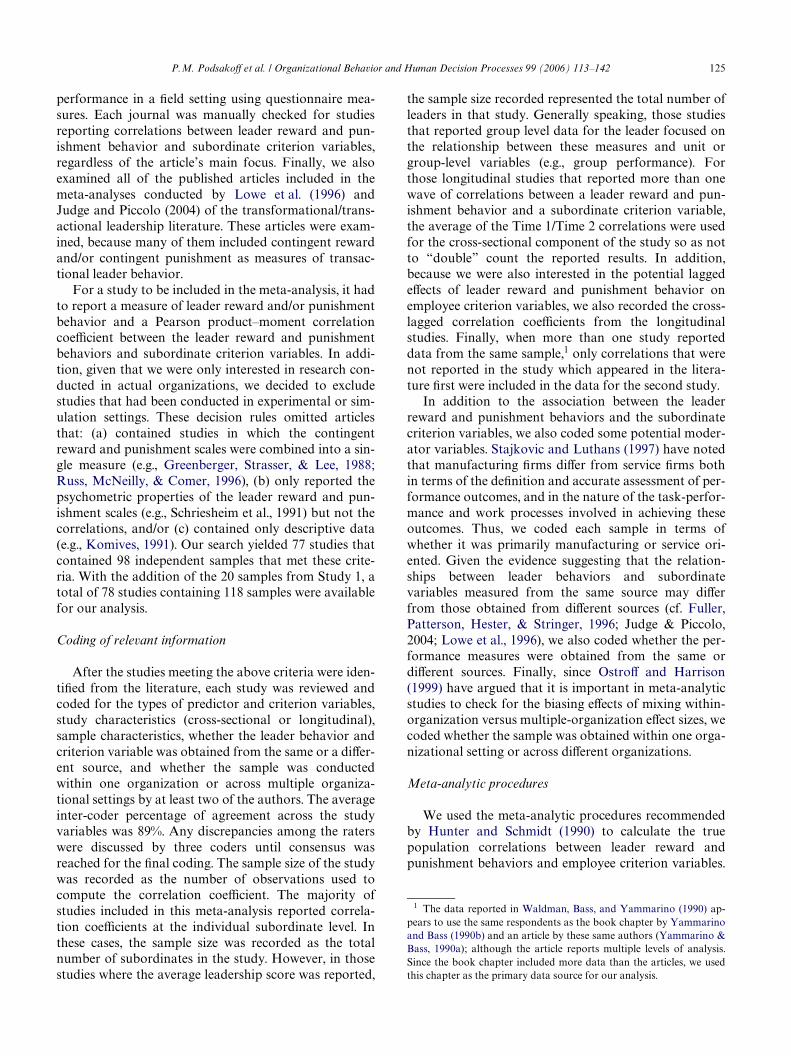
P.M. PodsakoV et al. / Organizational Behavior and Human Decision Processes 99 (2006) 113–142 125
performance in a Weld setting using questionnaire mea-sures. Each journal was manually checked for studiesreporting correlations between leader reward and pun-ishment behavior and subordinate criterion variables,regardless of the article’s main focus. Finally, we alsoexamined all of the published articles included in themeta-analyses conducted by Lowe et al. (1996) andJudge and Piccolo (2004) of the transformational/trans-actional leadership literature. These articles were exam-ined, because many of them included contingent rewardand/or contingent punishment as measures of transac-tional leader behavior.
For a study to be included in the meta-analysis, it hadto report a measure of leader reward and/or punishmentbehavior and a Pearson product–moment correlationcoeYcient between the leader reward and punishmentbehaviors and subordinate criterion variables. In addi-tion, given that we were only interested in research con-ducted in actual organizations, we decided to excludestudies that had been conducted in experimental or sim-ulation settings. These decision rules omitted articlesthat: (a) contained studies in which the contingentreward and punishment scales were combined into a sin-gle measure (e.g., Greenberger, Strasser, & Lee, 1988;Russ, McNeilly, & Comer, 1996), (b) only reported thepsychometric properties of the leader reward and pun-ishment scales (e.g., Schriesheim et al., 1991) but not thecorrelations, and/or (c) contained only descriptive data(e.g., Komives, 1991). Our search yielded 77 studies thatcontained 98 independent samples that met these crite-ria. With the addition of the 20 samples from Study 1, atotal of 78 studies containing 118 samples were availablefor our analysis.
Coding of relevant information
After the studies meeting the above criteria were iden-tiWed from the literature, each study was reviewed andcoded for the types of predictor and criterion variables,study characteristics (cross-sectional or longitudinal),sample characteristics, whether the leader behavior andcriterion variable was obtained from the same or a diVer-ent source, and whether the sample was conductedwithin one organization or across multiple organiza-tional settings by at least two of the authors. The averageinter-coder percentage of agreement across the studyvariables was 89%. Any discrepancies among the raterswere discussed by three coders until consensus wasreached for the Wnal coding. The sample size of the studywas recorded as the number of observations used tocompute the correlation coeYcient. The majority ofstudies included in this meta-analysis reported correla-tion coeYcients at the individual subordinate level. Inthese cases, the sample size was recorded as the totalnumber of subordinates in the study. However, in thosestudies where the average leadership score was reported,
the sample size recorded represented the total number ofleaders in that study. Generally speaking, those studiesthat reported group level data for the leader focused onthe relationship between these measures and unit orgroup-level variables (e.g., group performance). Forthose longitudinal studies that reported more than onewave of correlations between a leader reward and pun-ishment behavior and a subordinate criterion variable,the average of the Time 1/Time 2 correlations were usedfor the cross-sectional component of the study so as notto “double” count the reported results. In addition,because we were also interested in the potential laggedeVects of leader reward and punishment behavior onemployee criterion variables, we also recorded the cross-lagged correlation coeYcients from the longitudinalstudies. Finally, when more than one study reporteddata from the same sample,1 only correlations that werenot reported in the study which appeared in the litera-ture Wrst were included in the data for the second study.
In addition to the association between the leaderreward and punishment behaviors and the subordinatecriterion variables, we also coded some potential moder-ator variables. Stajkovic and Luthans (1997) have notedthat manufacturing Wrms diVer from service Wrms bothin terms of the deWnition and accurate assessment of per-formance outcomes, and in the nature of the task-perfor-mance and work processes involved in achieving theseoutcomes. Thus, we coded each sample in terms ofwhether it was primarily manufacturing or service ori-ented. Given the evidence suggesting that the relation-ships between leader behaviors and subordinatevariables measured from the same source may diVerfrom those obtained from diVerent sources (cf. Fuller,Patterson, Hester, & Stringer, 1996; Judge & Piccolo,2004; Lowe et al., 1996), we also coded whether the per-formance measures were obtained from the same ordiVerent sources. Finally, since OstroV and Harrison(1999) have argued that it is important in meta-analyticstudies to check for the biasing eVects of mixing within-organization versus multiple-organization eVect sizes, wecoded whether the sample was obtained within one orga-nizational setting or across diVerent organizations.
Meta-analytic procedures
We used the meta-analytic procedures recommendedby Hunter and Schmidt (1990) to calculate the truepopulation correlations between leader reward andpunishment behaviors and employee criterion variables.
1 The data reported in Waldman, Bass, and Yammarino (1990) ap-pears to use the same respondents as the book chapter by Yammarinoand Bass (1990b) and an article by these same authors (Yammarino &Bass, 1990a); although the article reports multiple levels of analysis.Since the book chapter included more data than the articles, we usedthis chapter as the primary data source for our analysis.
126 P.M. PodsakoV et al. / Organizational Behavior and Human Decision Processes 99 (2006) 113–142
To provide the most accurate estimates, the weightedmean correlations and their variances were corrected formeasurement and sampling error. In addition, in thosestudies in which there were multiple indicators of a focalconstruct, we used linear composites of correlations.Linear composites are superior to averaging techniquesbecause they provide a more construct valid estimate ofthe true correlation and avoid over- or underestimatingthe sampling error, thus improving the precision ofmeta-analysis. Further, linear composites are superior tothe independent inclusion of all correlations becausethey do not double count the study in the data set, whichsystematically underestimates sampling error.
In addition to reporting estimates of the mean truescore correlations, it is also important in meta-analysisto describe variability in the correlations. Accordingly,we report 80% credibility intervals and 90% conWdenceintervals around the estimated population correlations.Although some meta-analyses report only conWdenceintervals (e.g., Kossek & Ozekio, 1998), whereas othersreport only credibility intervals (e.g., Vinchur, Schipp-mann, Switzer, & Roth, 1998), it is important to reportboth because each tells us diVerent things about thenature of the correlations (Judge & Piccolo, 2004). Con-Wdence intervals provide an estimate of the variabilityaround the estimated mean correlation; a 90% conW-dence interval excluding zero indicates that we can be95% conWdent that the average true correlation is non-zero (5% of average correlations would lie beyond theupper limit of the distribution). Credibility intervals pro-vide an estimate of the variability of individual correla-tions across studies; a 80% credibility interval excludingzero indicates that 90% of the individual correlations inthe meta-analysis excluded zero (for positive correla-tions, 10% are zero or less and 10% lie at or beyond theupper bound of the interval). Thus, conWdence intervalsestimate variability in the mean correlation, whereas
credibility intervals estimate variability in the individualcorrelations across the studies.
To determine whether the hypothesized diVerences inthe relationships between leader contingent and non-con-tingent reward and punishment behaviors and theemployee criterion variables were supported, weregressed each of the employee criterion variables ofinterest on the leader reward and punishment behaviors.This procedure allowed us to test for the eVects of each ofthe leader behaviors on the criterion variables while hold-ing the eVects of the other leader behaviors constant.
Results
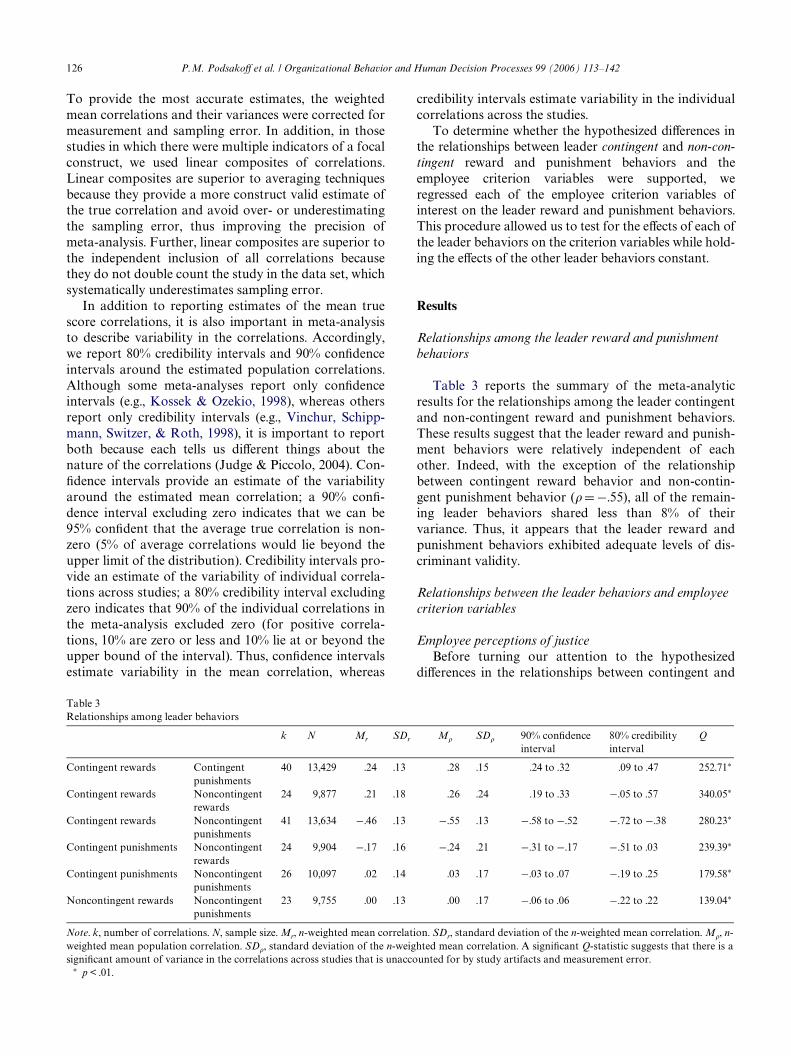
Relationships among the leader reward and punishment behaviors
Table 3 reports the summary of the meta-analyticresults for the relationships among the leader contingentand non-contingent reward and punishment behaviors.These results suggest that the leader reward and punish-ment behaviors were relatively independent of eachother. Indeed, with the exception of the relationshipbetween contingent reward behavior and non-contin-gent punishment behavior (�D ¡.55), all of the remain-ing leader behaviors shared less than 8% of theirvariance. Thus, it appears that the leader reward andpunishment behaviors exhibited adequate levels of dis-criminant validity.
Relationships between the leader behaviors and employee criterion variables
Employee perceptions of justiceBefore turning our attention to the hypothesized
diVerences in the relationships between contingent and
Table 3Relationships among leader behaviors
Note. k, number of correlations. N, sample size. Mr, n-weighted mean correlation. SDr, standard deviation of the n-weighted mean correlation. M�, n-weighted mean population correlation. SD�, standard deviation of the n-weighted mean correlation. A signiWcant Q-statistic suggests that there is asigniWcant amount of variance in the correlations across studies that is unaccounted for by study artifacts and measurement error.
¤ p < .01.
k N Mr SDr M� SD� 90% conWdence interval
80% credibility interval
Q
Contingent rewards Contingent punishments
40 13,429 .24 .13 .28 .15 .24 to .32 .09 to .47 252.71¤
Contingent rewards Noncontingent rewards
24 9,877 .21 .18 .26 .24 .19 to .33 ¡.05 to .57 340.05¤
Contingent rewards Noncontingent punishments
41 13,634 ¡.46 .13 ¡.55 .13 ¡.58 to ¡.52 ¡.72 to ¡.38 280.23¤
Contingent punishments Noncontingent rewards
24 9,904 ¡.17 .16 ¡.24 .21 ¡.31 to ¡.17 ¡.51 to .03 239.39¤
Contingent punishments Noncontingent punishments
26 10,097 .02 .14 .03 .17 ¡.03 to .07 ¡.19 to .25 179.58¤
Noncontingent rewards Noncontingent punishments
23 9,755 .00 .13 .00 .17 ¡.06 to .06 ¡.22 to .22 139.04¤
P.M. PodsakoV et al. / Organizational Behavior and Human Decision Processes 99 (2006) 113–142 127
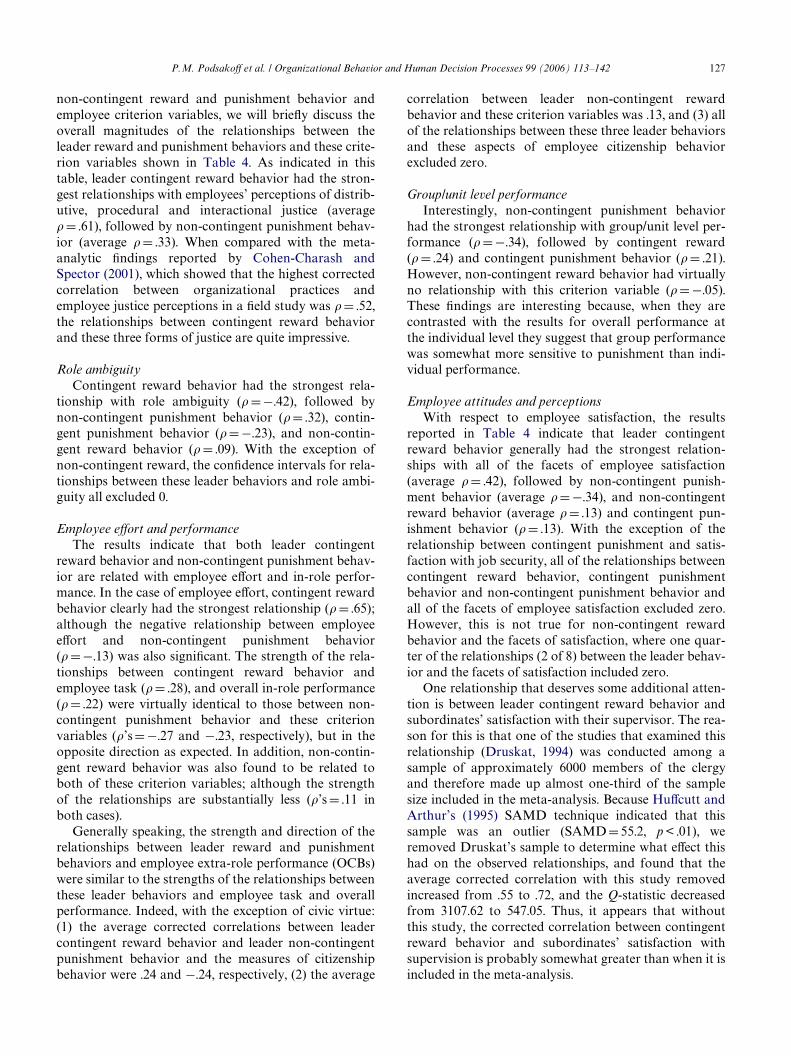
non-contingent reward and punishment behavior andemployee criterion variables, we will brieXy discuss theoverall magnitudes of the relationships between theleader reward and punishment behaviors and these crite-rion variables shown in Table 4. As indicated in thistable, leader contingent reward behavior had the stron-gest relationships with employees’ perceptions of distrib-utive, procedural and interactional justice (average� D .61), followed by non-contingent punishment behav-ior (average �D .33). When compared with the meta-analytic Wndings reported by Cohen-Charash andSpector (2001), which showed that the highest correctedcorrelation between organizational practices andemployee justice perceptions in a Weld study was �D .52,the relationships between contingent reward behaviorand these three forms of justice are quite impressive.
Role ambiguityContingent reward behavior had the strongest rela-
tionship with role ambiguity (� D ¡.42), followed bynon-contingent punishment behavior (�D .32), contin-gent punishment behavior (�D ¡.23), and non-contin-gent reward behavior (� D .09). With the exception ofnon-contingent reward, the conWdence intervals for rela-tionships between these leader behaviors and role ambi-guity all excluded 0.
Employee eVort and performanceThe results indicate that both leader contingent
reward behavior and non-contingent punishment behav-ior are related with employee eVort and in-role perfor-mance. In the case of employee eVort, contingent rewardbehavior clearly had the strongest relationship (� D .65);although the negative relationship between employeeeVort and non-contingent punishment behavior(� D ¡.13) was also signiWcant. The strength of the rela-tionships between contingent reward behavior andemployee task (�D .28), and overall in-role performance(� D .22) were virtually identical to those between non-contingent punishment behavior and these criterionvariables (�’s D ¡.27 and ¡.23, respectively), but in theopposite direction as expected. In addition, non-contin-gent reward behavior was also found to be related toboth of these criterion variables; although the strengthof the relationships are substantially less (�’s D .11 inboth cases).
Generally speaking, the strength and direction of therelationships between leader reward and punishmentbehaviors and employee extra-role performance (OCBs)were similar to the strengths of the relationships betweenthese leader behaviors and employee task and overallperformance. Indeed, with the exception of civic virtue:(1) the average corrected correlations between leadercontingent reward behavior and leader non-contingentpunishment behavior and the measures of citizenshipbehavior were .24 and ¡.24, respectively, (2) the average
correlation between leader non-contingent rewardbehavior and these criterion variables was .13, and (3) allof the relationships between these three leader behaviorsand these aspects of employee citizenship behaviorexcluded zero.
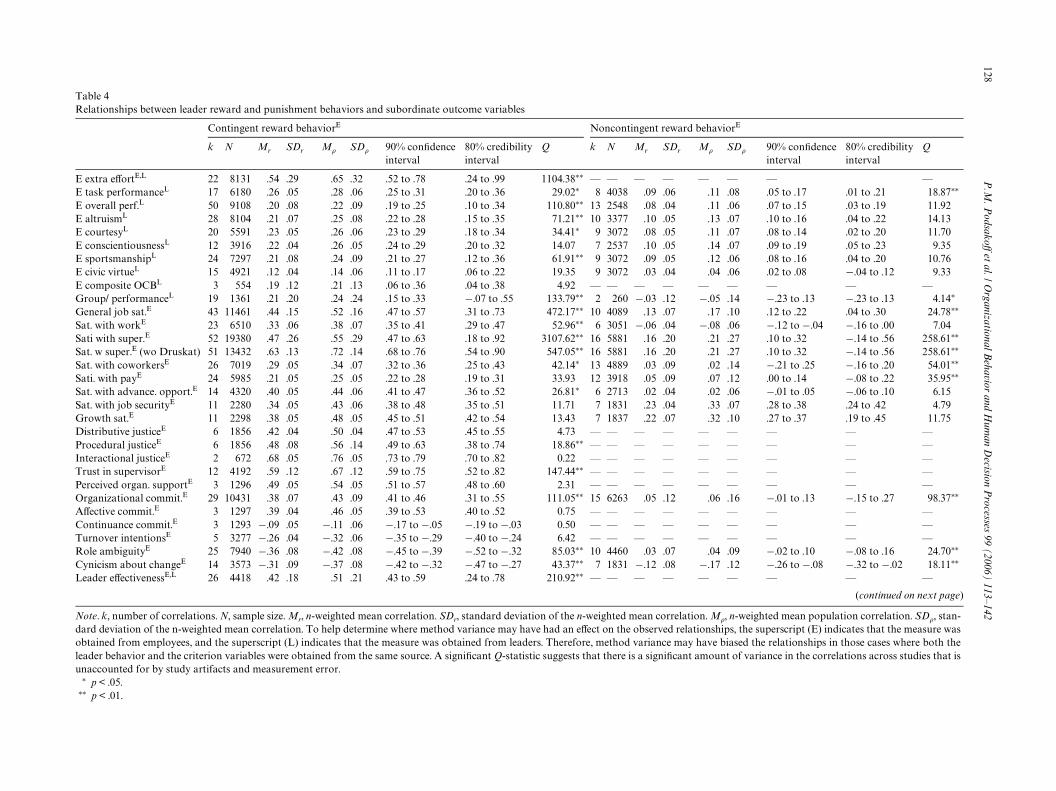
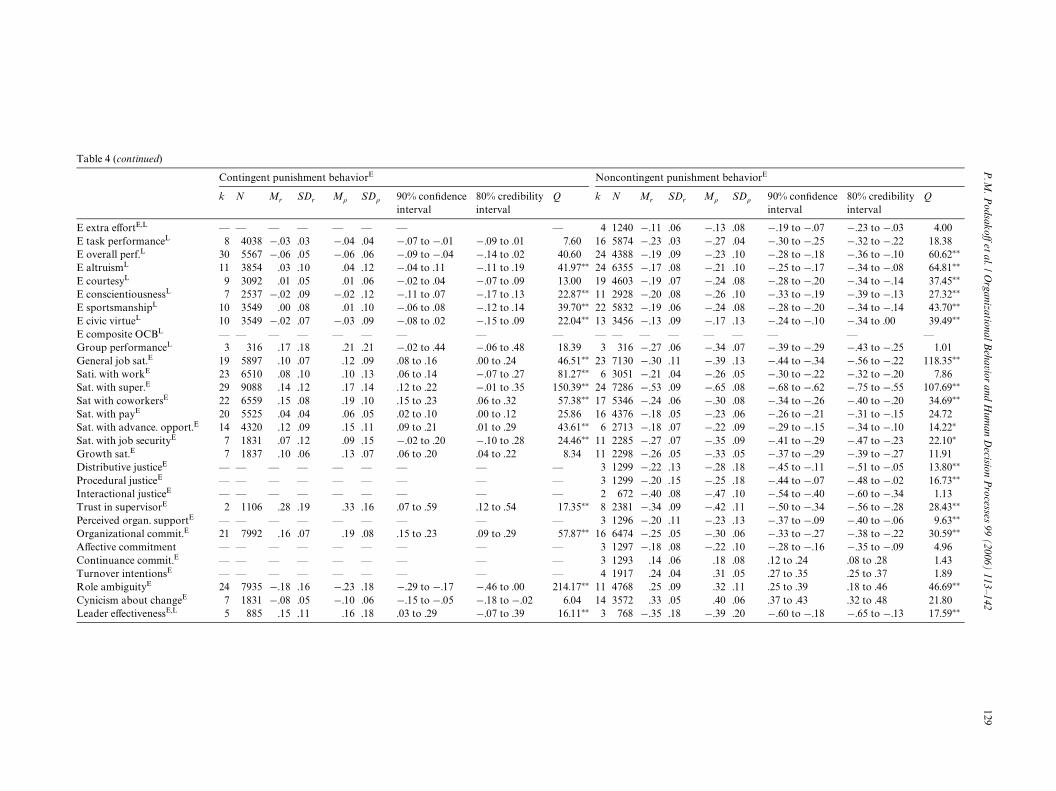
Group/unit level performanceInterestingly, non-contingent punishment behavior
had the strongest relationship with group/unit level per-formance (� D ¡.34), followed by contingent reward(� D .24) and contingent punishment behavior (�D .21).However, non-contingent reward behavior had virtuallyno relationship with this criterion variable (�D ¡.05).These Wndings are interesting because, when they arecontrasted with the results for overall performance atthe individual level they suggest that group performancewas somewhat more sensitive to punishment than indi-vidual performance.
Employee attitudes and perceptionsWith respect to employee satisfaction, the results
reported in Table 4 indicate that leader contingentreward behavior generally had the strongest relation-ships with all of the facets of employee satisfaction(average �D .42), followed by non-contingent punish-ment behavior (average �D ¡.34), and non-contingentreward behavior (average � D .13) and contingent pun-ishment behavior (�D .13). With the exception of therelationship between contingent punishment and satis-faction with job security, all of the relationships betweencontingent reward behavior, contingent punishmentbehavior and non-contingent punishment behavior andall of the facets of employee satisfaction excluded zero.However, this is not true for non-contingent rewardbehavior and the facets of satisfaction, where one quar-ter of the relationships (2 of 8) between the leader behav-ior and the facets of satisfaction included zero.
One relationship that deserves some additional atten-tion is between leader contingent reward behavior andsubordinates’ satisfaction with their supervisor. The rea-son for this is that one of the studies that examined thisrelationship (Druskat, 1994) was conducted among asample of approximately 6000 members of the clergyand therefore made up almost one-third of the samplesize included in the meta-analysis. Because HuVcutt andArthur’s (1995) SAMD technique indicated that thissample was an outlier (SAMD D 55.2, p < .01), weremoved Druskat’s sample to determine what eVect thishad on the observed relationships, and found that theaverage corrected correlation with this study removedincreased from .55 to .72, and the Q-statistic decreasedfrom 3107.62 to 547.05. Thus, it appears that withoutthis study, the corrected correlation between contingentreward behavior and subordinates’ satisfaction withsupervision is probably somewhat greater than when it isincluded in the meta-analysis.
128P
.M. P
odsakoV et al. / O
rganizational Behavior and H
uman D
ecision Processes 99 (2006) 113–142
TR
N �, n-weighted mean population correlation. SD�, stan-d ips, the superscript (E) indicates that the measure waso biased the relationships in those cases where both thele nt of variance in the correlations across studies that isu
¤
viorE
SD� 90% conWdence interval
80% credibility interval
Q
E — — —E .08 .05 to .17 .01 to .21 18.87¤¤
E .06 .07 to .15 .03 to .19 11.92E .07 .10 to .16 .04 to .22 14.13E .07 .08 to .14 .02 to .20 11.70E .07 .09 to .19 .05 to .23 9.35E .06 .08 to .16 .04 to .20 10.76E .06 .02 to .08 ¡.04 to .12 9.33E — — — —G .14 ¡.23 to .13 ¡.23 to .13 4.14¤
G .10 .12 to .22 .04 to .30 24.78¤¤
S .06 ¡.12 to ¡.04 ¡.16 to .00 7.04S .27 .10 to .32 ¡.14 to .56 258.61¤¤
S .27 .10 to .32 ¡.14 to .56 258.61¤¤
S .14 ¡.21 to .25 ¡.16 to .20 54.01¤¤
S .12 .00 to .14 ¡.08 to .22 35.95¤¤
S .06 ¡.01 to .05 ¡.06 to .10 6.15S .07 .28 to .38 .24 to .42 4.79G .10 .27 to .37 .19 to .45 11.75D — — — —P — — — —In — — — —T — — — —P — — — —O .16 ¡.01 to .13 ¡.15 to .27 98.37¤¤
A — — — —C — — — —T — — — —R .09 ¡.02 to .10 ¡.08 to .16 24.70¤¤
C .12 ¡.26 to ¡.08 ¡.32 to ¡.02 18.11¤¤
L — — — —
(continued on next page)
able 4elationships between leader reward and punishment behaviors and subordinate outcome variables
ote. k, number of correlations. N, sample size. Mr, n-weighted mean correlation. SDr, standard deviation of the n-weighted mean correlation. Mard deviation of the n-weighted mean correlation. To help determine where method variance may have had an eVect on the observed relationshbtained from employees, and the superscript (L) indicates that the measure was obtained from leaders. Therefore, method variance may haveader behavior and the criterion variables were obtained from the same source. A signiWcant Q-statistic suggests that there is a signiWcant amounaccounted for by study artifacts and measurement error.¤ p < .05.¤ p < .01.
Contingent reward behaviorE Noncontingent reward beha
k N Mr SDr M� SD� 90% conWdence interval
80% credibility interval
Q k N Mr SDr M�
extra eVortE,L 22 8131 .54 .29 .65 .32 .52 to .78 .24 to .99 1104.38¤¤ — — — — — task performanceL 17 6180 .26 .05 .28 .06 .25 to .31 .20 to .36 29.02¤ 8 4038 .09 .06 .11 overall perf.L 50 9108 .20 .08 .22 .09 .19 to .25 .10 to .34 110.80¤¤ 13 2548 .08 .04 .11 altruismL 28 8104 .21 .07 .25 .08 .22 to .28 .15 to .35 71.21¤¤ 10 3377 .10 .05 .13 courtesyL 20 5591 .23 .05 .26 .06 .23 to .29 .18 to .34 34.41¤ 9 3072 .08 .05 .11 conscientiousnessL 12 3916 .22 .04 .26 .05 .24 to .29 .20 to .32 14.07 7 2537 .10 .05 .14 sportsmanshipL 24 7297 .21 .08 .24 .09 .21 to .27 .12 to .36 61.91¤¤ 9 3072 .09 .05 .12 civic virtueL 15 4921 .12 .04 .14 .06 .11 to .17 .06 to .22 19.35 9 3072 .03 .04 .04 composite OCBL 3 554 .19 .12 .21 .13 .06 to .36 .04 to .38 4.92 — — — — —roup/ performanceL 19 1361 .21 .20 .24 .24 .15 to .33 ¡.07 to .55 133.79¤¤ 2 260 ¡.03 .12 ¡.05eneral job sat.E 43 11461 .44 .15 .52 .16 .47 to .57 .31 to .73 472.17¤¤ 10 4089 .13 .07 .17
at. with workE 23 6510 .33 .06 .38 .07 .35 to .41 .29 to .47 52.96¤¤ 6 3051 ¡.06 .04 ¡.08ati with super.E 52 19380 .47 .26 .55 .29 .47 to .63 .18 to .92 3107.62¤¤ 16 5881 .16 .20 .21at. w super.E (wo Druskat) 51 13432 .63 .13 .72 .14 .68 to .76 .54 to .90 547.05¤¤ 16 5881 .16 .20 .21at. with coworkersE 26 7019 .29 .05 .34 .07 .32 to .36 .25 to .43 42.14¤ 13 4889 .03 .09 .02ati. with payE 24 5985 .21 .05 .25 .05 .22 to .28 .19 to .31 33.93 12 3918 .05 .09 .07at. with advance. opport.E 14 4320 .40 .05 .44 .06 .41 to .47 .36 to .52 26.81¤ 6 2713 .02 .04 .02at. with job securityE 11 2280 .34 .05 .43 .06 .38 to .48 .35 to .51 11.71 7 1831 .23 .04 .33rowth sat.E 11 2298 .38 .05 .48 .05 .45 to .51 .42 to .54 13.43 7 1837 .22 .07 .32istributive justiceE 6 1856 .42 .04 .50 .04 .47 to .53 .45 to .55 4.73 — — — — —rocedural justiceE 6 1856 .48 .08 .56 .14 .49 to .63 .38 to .74 18.86¤¤ — — — — —teractional justiceE 2 672 .68 .05 .76 .05 .73 to .79 .70 to .82 0.22 — — — — —
rust in supervisorE 12 4192 .59 .12 .67 .12 .59 to .75 .52 to .82 147.44¤¤ — — — — —erceived organ. supportE 3 1296 .49 .05 .54 .05 .51 to .57 .48 to .60 2.31 — — — — —rganizational commit.E 29 10431 .38 .07 .43 .09 .41 to .46 .31 to .55 111.05¤¤ 15 6263 .05 .12 .06Vective commit.E 3 1297 .39 .04 .46 .05 .39 to .53 .40 to .52 0.75 — — — — —ontinuance commit.E 3 1293 ¡.09 .05 ¡.11 .06 ¡.17 to ¡.05 ¡.19 to ¡.03 0.50 — — — — —urnover intentionsE 5 3277 ¡.26 .04 ¡.32 .06 ¡.35 to ¡.29 ¡.40 to ¡.24 6.42 — — — — —ole ambiguityE 25 7940 ¡.36 .08 ¡.42 .08 ¡.45 to ¡.39 ¡.52 to ¡.32 85.03¤¤ 10 4460 .03 .07 .04ynicism about changeE 14 3573 ¡.31 .09 ¡.37 .08 ¡.42 to ¡.32 ¡.47 to ¡.27 43.37¤¤ 7 1831 ¡.12 .08 ¡.17eader eVectivenessE,L 26 4418 .42 .18 .51 .21 .43 to .59 .24 to .78 210.92¤¤ — — — — —
P.M
. Podsako
V et al. / Organizational B
ehavior and Hum
an Decision P
rocesses 99 (2006) 113–142129
Table 4 (continu
ngent punishment behaviorE
Mr SDr M� SD� 90% conWdence interval
80% credibility interval
Q
E extra eVortE,L ¡.11 .06 ¡.13 .08 ¡.19 to ¡.07 ¡.23 to ¡.03 4.00E task perform ¡.23 .03 ¡.27 .04 ¡.30 to ¡.25 ¡.32 to ¡.22 18.38E overall perf.L ¡.19 .09 ¡.23 .10 ¡.28 to ¡.18 ¡.36 to ¡.10 60.62¤¤
E altruismL ¡.17 .08 ¡.21 .10 ¡.25 to ¡.17 ¡.34 to ¡.08 64.81¤¤
E courtesyL ¡.19 .07 ¡.24 .08 ¡.28 to ¡.20 ¡.34 to ¡.14 37.45¤¤
E conscientious ¡.20 .08 ¡.26 .10 ¡.33 to ¡.19 ¡.39 to ¡.13 27.32¤¤
E sportsmansh ¡.19 .06 ¡.24 .08 ¡.28 to ¡.20 ¡.34 to ¡.14 43.70¤¤
E civic virtueL ¡.13 .09 ¡.17 .13 ¡.24 to ¡.10 ¡.34 to .00 39.49¤¤
E composite OC — — — — — — —Group perform ¡.27 .06 ¡.34 .07 ¡.39 to ¡.29 ¡.43 to ¡.25 1.01General job sat ¡.30 .11 ¡.39 .13 ¡.44 to ¡.34 ¡.56 to ¡.22 118.35¤¤
Sati. with work ¡.21 .04 ¡.26 .05 ¡.30 to ¡.22 ¡.32 to ¡.20 7.86Sat. with super. ¡.53 .09 ¡.65 .08 ¡.68 to ¡.62 ¡.75 to ¡.55 107.69¤¤
Sat with cowor ¡.24 .06 ¡.30 .08 ¡.34 to ¡.26 ¡.40 to ¡.20 34.69¤¤
Sat. with payE ¡.18 .05 ¡.23 .06 ¡.26 to ¡.21 ¡.31 to ¡.15 24.72Sat. with advan ¡.18 .07 ¡.22 .09 ¡.29 to ¡.15 ¡.34 to ¡.10 14.22¤
Sat. with job se ¡.27 .07 ¡.35 .09 ¡.41 to ¡.29 ¡.47 to ¡.23 22.10¤
Growth sat.E ¡.26 .05 ¡.33 .05 ¡.37 to ¡.29 ¡.39 to ¡.27 11.91Distributive jus ¡.22 .13 ¡.28 .18 ¡.45 to ¡.11 ¡.51 to ¡.05 13.80¤¤
Procedural just ¡.20 .15 ¡.25 .18 ¡.44 to ¡.07 ¡.48 to ¡.02 16.73¤¤
Interactional ju ¡.40 .08 ¡.47 .10 ¡.54 to ¡.40 ¡.60 to ¡.34 1.13Trust in superv ¡.34 .09 ¡.42 .11 ¡.50 to ¡.34 ¡.56 to ¡.28 28.43¤¤
Perceived organ ¡.20 .11 ¡.23 .13 ¡.37 to ¡.09 ¡.40 to ¡.06 9.63¤¤
Organizational ¡.25 .05 ¡.30 .06 ¡.33 to ¡.27 ¡.38 to ¡.22 30.59¤¤
AVective comm ¡.18 .08 ¡.22 .10 ¡.28 to ¡.16 ¡.35 to ¡.09 4.96Continuance co .14 .06 .18 .08 .12 to .24 .08 to .28 1.43Turnover inten .24 .04 .31 .05 .27 to .35 .25 to .37 1.89Role ambiguity .25 .09 .32 .11 .25 to .39 .18 to .46 46.69¤¤
Cynicism abou .33 .05 .40 .06 .37 to .43 .32 to .48 21.80Leader eVective ¡.35 .18 ¡.39 .20 ¡.60 to ¡.18 ¡.65 to ¡.13 17.59¤¤
ed)
Contingent punishment behaviorE Nonconti
k N Mr SDr M� SD� 90% conWdence interval
80% credibility interval
Q k N
— — — — — — — — 4 1240anceL 8 4038 ¡.03 .03 ¡.04 .04 ¡.07 to ¡.01 ¡.09 to .01 7.60 16 5874
30 5567 ¡.06 .05 ¡.06 .06 ¡.09 to ¡.04 ¡.14 to .02 40.60 24 438811 3854 .03 .10 .04 .12 ¡.04 to .11 ¡.11 to .19 41.97¤¤ 24 6355
9 3092 .01 .05 .01 .06 ¡.02 to .04 ¡.07 to .09 13.00 19 4603nessL 7 2537 ¡.02 .09 ¡.02 .12 ¡.11 to .07 ¡.17 to .13 22.87¤¤ 11 2928
ipL 10 3549 .00 .08 .01 .10 ¡.06 to .08 ¡.12 to .14 39.70¤¤ 22 583210 3549 ¡.02 .07 ¡.03 .09 ¡.08 to .02 ¡.15 to .09 22.04¤¤ 13 3456
BL — — — — — — — — — — —anceL 3 316 .17 .18 .21 .21 ¡.02 to .44 ¡.06 to .48 18.39 3 316.E 19 5897 .10 .07 .12 .09 .08 to .16 .00 to .24 46.51¤¤ 23 7130E 23 6510 .08 .10 .10 .13 .06 to .14 ¡.07 to .27 81.27¤¤ 6 3051E 29 9088 .14 .12 .17 .14 .12 to .22 ¡.01 to .35 150.39¤¤ 24 7286kersE 22 6559 .15 .08 .19 .10 .15 to .23 .06 to .32 57.38¤¤ 17 5346
20 5525 .04 .04 .06 .05 .02 to .10 .00 to .12 25.86 16 4376ce. opport.E 14 4320 .12 .09 .15 .11 .09 to .21 .01 to .29 43.61¤¤ 6 2713curityE 7 1831 .07 .12 .09 .15 ¡.02 to .20 ¡.10 to .28 24.46¤¤ 11 2285
7 1837 .10 .06 .13 .07 .06 to .20 .04 to .22 8.34 11 2298ticeE — — — — — — — — — 3 1299iceE — — — — — — — — — 3 1299sticeE — — — — — — — — — 2 672isorE 2 1106 .28 .19 .33 .16 .07 to .59 .12 to .54 17.35¤¤ 8 2381. supportE — — — — — — — — — 3 1296
commit.E 21 7992 .16 .07 .19 .08 .15 to .23 .09 to .29 57.87¤¤ 16 6474itment — — — — — — — — — 3 1297mmit.E — — — — — — — — — 3 1293
tionsE — — — — — — — — — 4 1917E 24 7935 ¡.18 .16 ¡.23 .18 ¡.29 to ¡.17 ¡.46 to .00 214.17¤¤ 11 4768t changeE 7 1831 ¡.08 .05 ¡.10 .06 ¡.15 to ¡.05 ¡.18 to ¡.02 6.04 14 3572nessE,L 5 885 .15 .11 .16 .18 .03 to .29 ¡.07 to .39 16.11¤¤ 3 768
130 P.M. PodsakoV et al. / Organizational Behavior and Human Decision Processes 99 (2006) 113–142
Although contingent reward behavior had the stron-gest relationship with employees’ trust in their supervi-sor (� D .67), both non-contingent punishment behavior(�D ¡.42), and contingent punishment behavior(�D .33), were also fairly strongly related to this criterionvariable. Taken together, these Wndings suggest thatleader reward and punishment behavior inXuenceemployees’ trust in their supervisors.
In addition to the eVects of reward and punishmentbehavior on job satisfaction and trust, the results showthat contingent reward, non-contingent reward, contin-gent punishment, non-contingent punishment behaviorwere related to overall organizational commitment(�’s D .43, .06, 19, and ¡.30, respectively). Contingentreward and non-contingent punishment behavior werealso related to aVective commitment (�’s D .46 and ¡.22,respectively), continuance commitment (�’s D ¡.11 and.18, respectively), perceived organizational support (�’sD .54 and ¡.23), and turnover intentions (�’s D ¡.32 and.31, respectively). With the exception of the relationshipbetween non-contingent reward and overall organiza-tional commitment, none of the conWdence intervals forthese relationships included zero.
Employee cynicism about changeGenerally speaking, contingent reward behavior, non-
contingent reward behavior, and contingent punishmentbehavior were all negatively related to employee cyni-cism about change (�’s D ¡.37, ¡.17, and ¡.10, respec-tively), while non-contingent punishment was positivelyrelated to this criterion variable (� D .40), and all of theserelationships excluded zero.
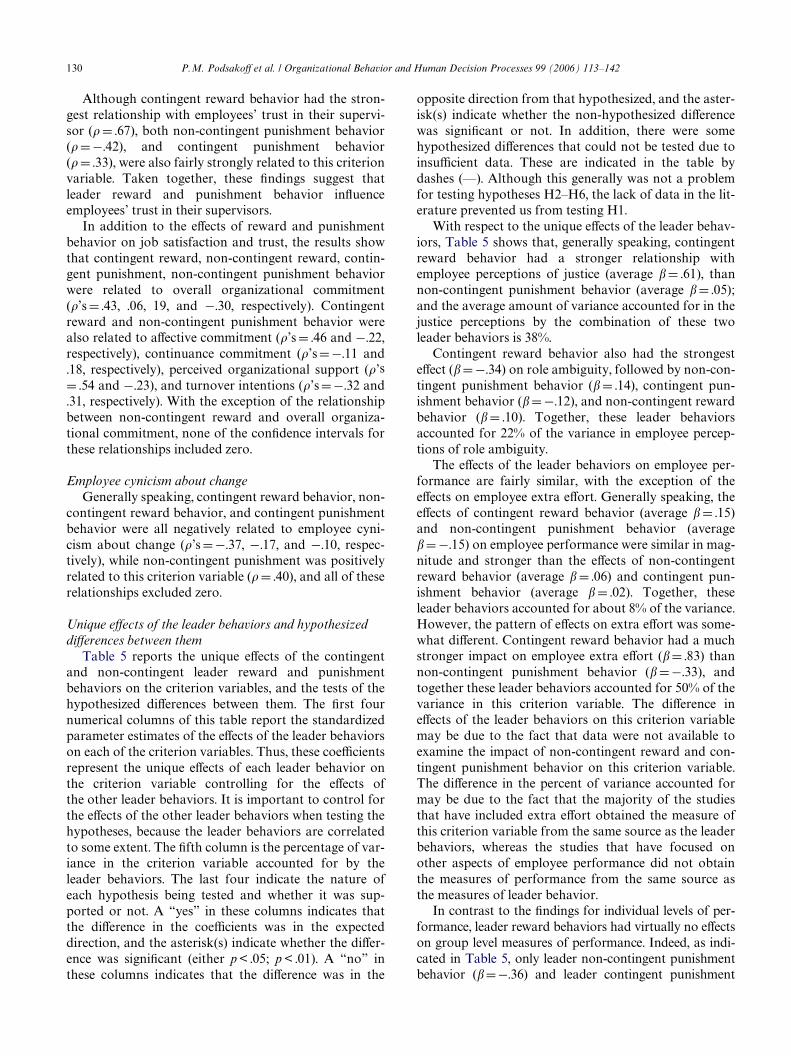
Unique eVects of the leader behaviors and hypothesized diVerences between them
Table 5 reports the unique eVects of the contingentand non-contingent leader reward and punishmentbehaviors on the criterion variables, and the tests of thehypothesized diVerences between them. The Wrst fournumerical columns of this table report the standardizedparameter estimates of the eVects of the leader behaviorson each of the criterion variables. Thus, these coeYcientsrepresent the unique eVects of each leader behavior onthe criterion variable controlling for the eVects ofthe other leader behaviors. It is important to control forthe eVects of the other leader behaviors when testing thehypotheses, because the leader behaviors are correlatedto some extent. The Wfth column is the percentage of var-iance in the criterion variable accounted for by theleader behaviors. The last four indicate the nature ofeach hypothesis being tested and whether it was sup-ported or not. A “yes” in these columns indicates thatthe diVerence in the coeYcients was in the expecteddirection, and the asterisk(s) indicate whether the diVer-ence was signiWcant (either p < .05; p < .01). A “no” inthese columns indicates that the diVerence was in the
opposite direction from that hypothesized, and the aster-isk(s) indicate whether the non-hypothesized diVerencewas signiWcant or not. In addition, there were somehypothesized diVerences that could not be tested due toinsuYcient data. These are indicated in the table bydashes (—). Although this generally was not a problemfor testing hypotheses H2–H6, the lack of data in the lit-erature prevented us from testing H1.
With respect to the unique eVects of the leader behav-iors, Table 5 shows that, generally speaking, contingentreward behavior had a stronger relationship withemployee perceptions of justice (average �D .61), thannon-contingent punishment behavior (average �D .05);and the average amount of variance accounted for in thejustice perceptions by the combination of these twoleader behaviors is 38%.
Contingent reward behavior also had the strongesteVect (�D ¡.34) on role ambiguity, followed by non-con-tingent punishment behavior (� D .14), contingent pun-ishment behavior (�D ¡.12), and non-contingent rewardbehavior (�D .10). Together, these leader behaviorsaccounted for 22% of the variance in employee percep-tions of role ambiguity.
The eVects of the leader behaviors on employee per-formance are fairly similar, with the exception of theeVects on employee extra eVort. Generally speaking, theeVects of contingent reward behavior (average � D .15)and non-contingent punishment behavior (average�D ¡.15) on employee performance were similar in mag-nitude and stronger than the eVects of non-contingentreward behavior (average � D .06) and contingent pun-ishment behavior (average � D .02). Together, theseleader behaviors accounted for about 8% of the variance.However, the pattern of eVects on extra eVort was some-what diVerent. Contingent reward behavior had a muchstronger impact on employee extra eVort (�D .83) thannon-contingent punishment behavior (� D ¡.33), andtogether these leader behaviors accounted for 50% of thevariance in this criterion variable. The diVerence ineVects of the leader behaviors on this criterion variablemay be due to the fact that data were not available toexamine the impact of non-contingent reward and con-tingent punishment behavior on this criterion variable.The diVerence in the percent of variance accounted formay be due to the fact that the majority of the studiesthat have included extra eVort obtained the measure ofthis criterion variable from the same source as the leaderbehaviors, whereas the studies that have focused onother aspects of employee performance did not obtainthe measures of performance from the same source asthe measures of leader behavior.
In contrast to the Wndings for individual levels of per-formance, leader reward behaviors had virtually no eVectson group level measures of performance. Indeed, as indi-cated in Table 5, only leader non-contingent punishmentbehavior (�D¡.36) and leader contingent punishment
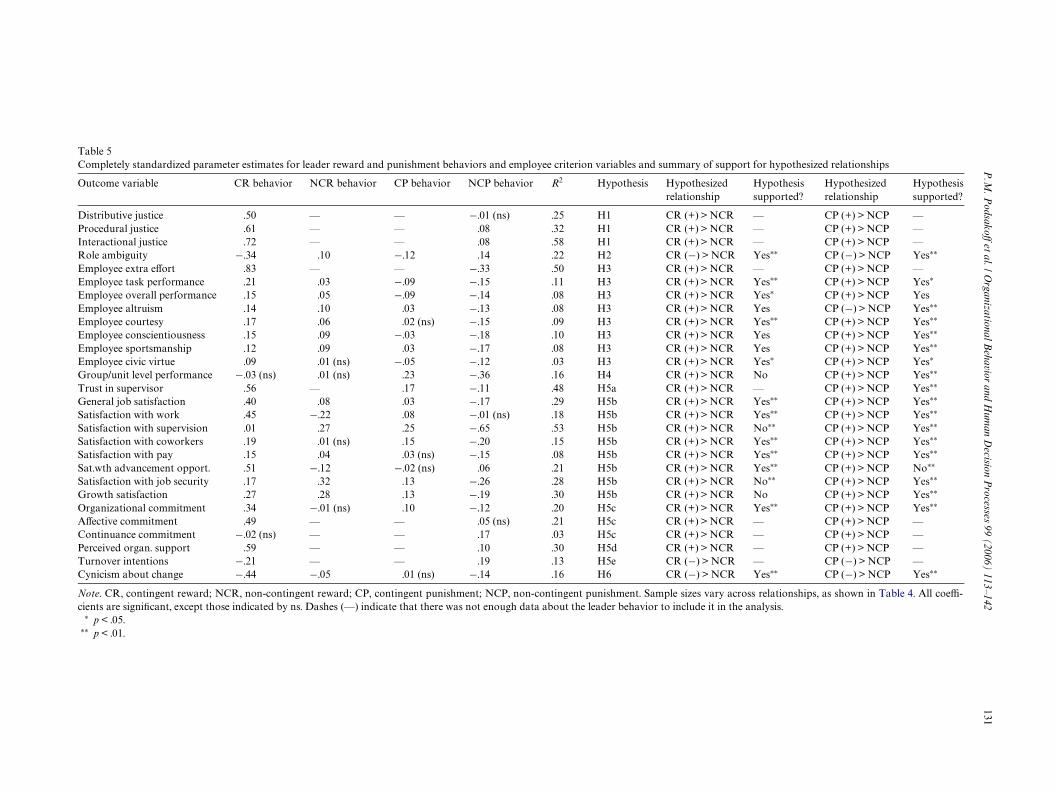
P.M
. Podsako
V et al. / Organizational B
ehavior and Hum
an Decision P
rocesses 99 (2006) 113–142131
Table 5Completely s summary of support for hypothesized relationships
Note. CR, co ple sizes vary across relationships, as shown in Table 4. All coeY-
cients are sign to include it in the analysis.¤ p < .05.
¤¤ p < .01.
Outcome var Hypothesized relationship
Hypothesis supported?
Hypothesized relationship
Hypothesis supported?
Distributive j CR (+) > NCR — CP (+) > NCP —Procedural ju CR (+) > NCR — CP (+) > NCP —Interactional CR (+) > NCR — CP (+) > NCP —Role ambigu CR (¡) > NCR Yes¤¤ CP (¡) > NCP Yes¤¤
Employee ext CR (+) > NCR — CP (+) > NCP —Employee tas CR (+) > NCR Yes¤¤ CP (+) > NCP Yes¤
Employee ov CR (+) > NCR Yes¤ CP (+) > NCP YesEmployee alt CR (+) > NCR Yes CP (¡) > NCP Yes¤¤
Employee co CR (+) > NCR Yes¤¤ CP (+) > NCP Yes¤¤
Employee co CR (+) > NCR Yes CP (+) > NCP Yes¤¤
Employee spo CR (+) > NCR Yes CP (+) > NCP Yes¤¤
Employee civ CR (+) > NCR Yes¤ CP (+) > NCP Yes¤
Group/unit le CR (+) > NCR No CP (+) > NCP Yes¤¤
Trust in supe CR (+) > NCR — CP (+) > NCP Yes¤¤
General job s CR (+) > NCR Yes¤¤ CP (+) > NCP Yes¤¤
Satisfaction w CR (+) > NCR Yes¤¤ CP (+) > NCP Yes¤¤
Satisfaction w CR (+) > NCR No¤¤ CP (+) > NCP Yes¤¤
Satisfaction w CR (+) > NCR Yes¤¤ CP (+) > NCP Yes¤¤
Satisfaction w CR (+) > NCR Yes¤¤ CP (+) > NCP Yes¤¤
Sat.wth adva CR (+) > NCR Yes¤¤ CP (+) > NCP No¤¤
Satisfaction w CR (+) > NCR No¤¤ CP (+) > NCP Yes¤¤
Growth satis CR (+) > NCR No CP (+) > NCP Yes¤¤
Organization CR (+) > NCR Yes¤¤ CP (+) > NCP Yes¤¤
AVective com CR (+) > NCR — CP (+) > NCP —Continuance CR (+) > NCR — CP (+) > NCP —Perceived org CR (+) > NCR — CP (+) > NCP —Turnover inte CR (¡) > NCR — CP (¡) > NCP —Cynicism abo CR (¡) > NCR Yes¤¤ CP (¡) > NCP Yes¤¤
tandardized parameter estimates for leader reward and punishment behaviors and employee criterion variables and
ntingent reward; NCR, non-contingent reward; CP, contingent punishment; NCP, non-contingent punishment. SamiWcant, except those indicated by ns. Dashes (—) indicate that there was not enough data about the leader behavior
iable CR behavior NCR behavior CP behavior NCP behavior R2 Hypothesis
ustice .50 — — ¡.01 (ns) .25 H1stice .61 — — .08 .32 H1 justice .72 — — .08 .58 H1ity ¡.34 .10 ¡.12 .14 .22 H2ra eVort .83 — — ¡.33 .50 H3k performance .21 .03 ¡.09 ¡.15 .11 H3erall performance .15 .05 ¡.09 ¡.14 .08 H3ruism .14 .10 .03 ¡.13 .08 H3urtesy .17 .06 .02 (ns) ¡.15 .09 H3nscientiousness .15 .09 ¡.03 ¡.18 .10 H3
rtsmanship .12 .09 .03 ¡.17 .08 H3ic virtue .09 .01 (ns) ¡.05 ¡.12 .03 H3vel performance ¡.03 (ns) .01 (ns) .23 ¡.36 .16 H4rvisor .56 — .17 ¡.11 .48 H5aatisfaction .40 .08 .03 ¡.17 .29 H5bith work .45 ¡.22 .08 ¡.01 (ns) .18 H5bith supervision .01 .27 .25 ¡.65 .53 H5bith coworkers .19 .01 (ns) .15 ¡.20 .15 H5bith pay .15 .04 .03 (ns) ¡.15 .08 H5b
ncement opport. .51 ¡.12 ¡.02 (ns) .06 .21 H5bith job security .17 .32 .13 ¡.26 .28 H5b
faction .27 .28 .13 ¡.19 .30 H5bal commitment .34 ¡.01 (ns) .10 ¡.12 .20 H5cmitment .49 — — .05 (ns) .21 H5c
commitment ¡.02 (ns) — — .17 .03 H5can. support .59 — — .10 .30 H5dntions ¡.21 — — .19 .13 H5eut change ¡.44 ¡.05 .01 (ns) ¡.14 .16 H6
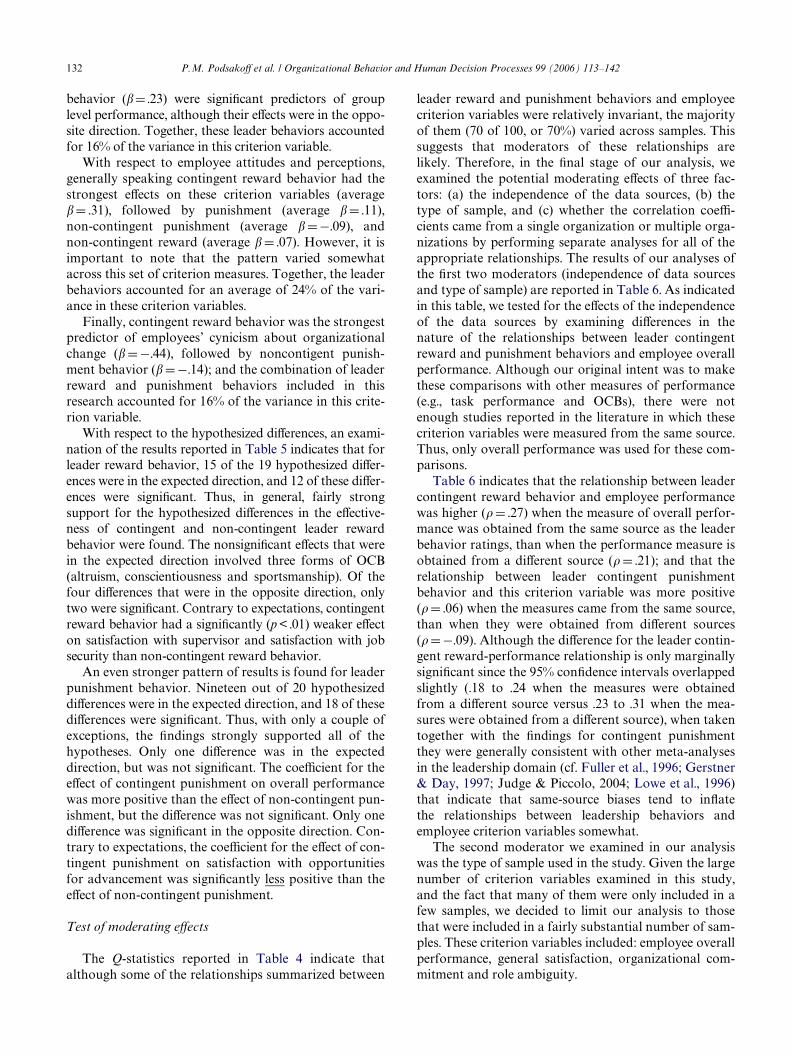
132 P.M. PodsakoV et al. / Organizational Behavior and Human Decision Processes 99 (2006) 113–142
behavior (�D .23) were signiWcant predictors of grouplevel performance, although their eVects were in the oppo-site direction. Together, these leader behaviors accountedfor 16% of the variance in this criterion variable.
With respect to employee attitudes and perceptions,generally speaking contingent reward behavior had thestrongest eVects on these criterion variables (average�D .31), followed by punishment (average �D .11),non-contingent punishment (average � D ¡.09), andnon-contingent reward (average � D .07). However, it isimportant to note that the pattern varied somewhatacross this set of criterion measures. Together, the leaderbehaviors accounted for an average of 24% of the vari-ance in these criterion variables.
Finally, contingent reward behavior was the strongestpredictor of employees’ cynicism about organizationalchange (� D ¡.44), followed by noncontigent punish-ment behavior (� D ¡.14); and the combination of leaderreward and punishment behaviors included in thisresearch accounted for 16% of the variance in this crite-rion variable.
With respect to the hypothesized diVerences, an exami-nation of the results reported in Table 5 indicates that forleader reward behavior, 15 of the 19 hypothesized diVer-ences were in the expected direction, and 12 of these diVer-ences were signiWcant. Thus, in general, fairly strongsupport for the hypothesized diVerences in the eVective-ness of contingent and non-contingent leader rewardbehavior were found. The nonsigniWcant eVects that werein the expected direction involved three forms of OCB(altruism, conscientiousness and sportsmanship). Of thefour diVerences that were in the opposite direction, onlytwo were signiWcant. Contrary to expectations, contingentreward behavior had a signiWcantly (p < .01) weaker eVecton satisfaction with supervisor and satisfaction with jobsecurity than non-contingent reward behavior.
An even stronger pattern of results is found for leaderpunishment behavior. Nineteen out of 20 hypothesizeddiVerences were in the expected direction, and 18 of thesediVerences were signiWcant. Thus, with only a couple ofexceptions, the Wndings strongly supported all of thehypotheses. Only one diVerence was in the expecteddirection, but was not signiWcant. The coeYcient for theeVect of contingent punishment on overall performancewas more positive than the eVect of non-contingent pun-ishment, but the diVerence was not signiWcant. Only onediVerence was signiWcant in the opposite direction. Con-trary to expectations, the coeYcient for the eVect of con-tingent punishment on satisfaction with opportunitiesfor advancement was signiWcantly less positive than theeVect of non-contingent punishment.
Test of moderating eVects
The Q-statistics reported in Table 4 indicate thatalthough some of the relationships summarized between
leader reward and punishment behaviors and employeecriterion variables were relatively invariant, the majorityof them (70 of 100, or 70%) varied across samples. Thissuggests that moderators of these relationships arelikely. Therefore, in the Wnal stage of our analysis, weexamined the potential moderating eVects of three fac-tors: (a) the independence of the data sources, (b) thetype of sample, and (c) whether the correlation coeY-cients came from a single organization or multiple orga-nizations by performing separate analyses for all of theappropriate relationships. The results of our analyses ofthe Wrst two moderators (independence of data sourcesand type of sample) are reported in Table 6. As indicatedin this table, we tested for the eVects of the independenceof the data sources by examining diVerences in thenature of the relationships between leader contingentreward and punishment behaviors and employee overallperformance. Although our original intent was to makethese comparisons with other measures of performance(e.g., task performance and OCBs), there were notenough studies reported in the literature in which thesecriterion variables were measured from the same source.Thus, only overall performance was used for these com-parisons.
Table 6 indicates that the relationship between leadercontingent reward behavior and employee performancewas higher (� D .27) when the measure of overall perfor-mance was obtained from the same source as the leaderbehavior ratings, than when the performance measure isobtained from a diVerent source (� D .21); and that therelationship between leader contingent punishmentbehavior and this criterion variable was more positive(�D .06) when the measures came from the same source,than when they were obtained from diVerent sources(�D ¡.09). Although the diVerence for the leader contin-gent reward-performance relationship is only marginallysigniWcant since the 95% conWdence intervals overlappedslightly (.18 to .24 when the measures were obtainedfrom a diVerent source versus .23 to .31 when the mea-sures were obtained from a diVerent source), when takentogether with the Wndings for contingent punishmentthey were generally consistent with other meta-analysesin the leadership domain (cf. Fuller et al., 1996; Gerstner& Day, 1997; Judge & Piccolo, 2004; Lowe et al., 1996)that indicate that same-source biases tend to inXatethe relationships between leadership behaviors andemployee criterion variables somewhat.
The second moderator we examined in our analysiswas the type of sample used in the study. Given the largenumber of criterion variables examined in this study,and the fact that many of them were only included in afew samples, we decided to limit our analysis to thosethat were included in a fairly substantial number of sam-ples. These criterion variables included: employee overallperformance, general satisfaction, organizational com-mitment and role ambiguity.
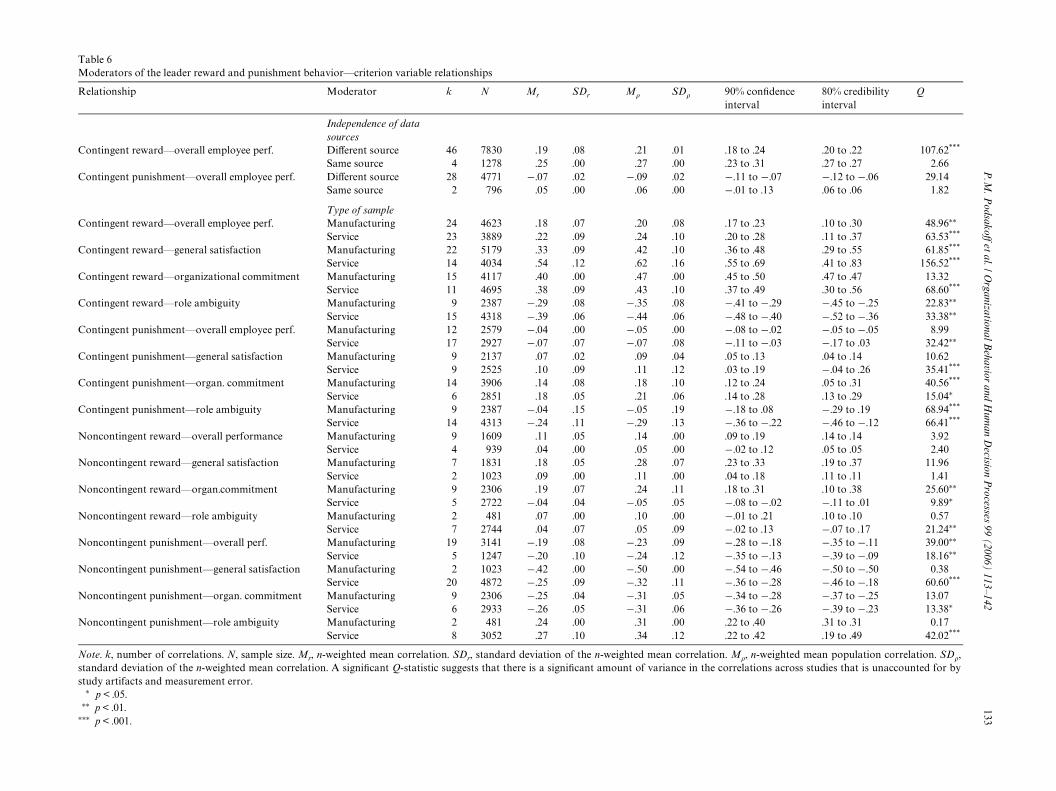
P.M
. Podsako
V et al. / Organizational B
ehavior and Hum
an Decision P
rocesses 99 (2006) 113–142133
Table 6Moderators of the leader reward and punishment behavior—criterion variable relationships
�, n-weighted mean population correlation. SD�,lations across studies that is unaccounted for by
conWdence rval
80% credibility interval
Q
to .24 .20 to .22 107.62***
to .31 .27 to .27 2.661 to ¡.07 ¡.12 to ¡.06 29.141 to .13 .06 to .06 1.82
to .23 .10 to .30 48.96¤¤
to .28 .11 to .37 63.53***
to .48 .29 to .55 61.85***
to .69 .41 to .83 156.52***
to .50 .47 to .47 13.32to .49 .30 to .56 68.60***
1 to ¡.29 ¡.45 to ¡.25 22.83¤¤
8 to ¡.40 ¡.52 to ¡.36 33.38¤¤
8 to ¡.02 ¡.05 to ¡.05 8.991 to ¡.03 ¡.17 to .03 32.42¤¤
to .13 .04 to .14 10.62to .19 ¡.04 to .26 35.41***
to .24 .05 to .31 40.56***
to .28 .13 to .29 15.04¤
8 to .08 ¡.29 to .19 68.94***
6 to ¡.22 ¡.46 to ¡.12 66.41***
to .19 .14 to .14 3.922 to .12 .05 to .05 2.40to .33 .19 to .37 11.96to .18 .11 to .11 1.41to .31 .10 to .38 25.60¤¤
8 to ¡.02 ¡.11 to .01 9.89¤
1 to .21 .10 to .10 0.572 to .13 ¡.07 to .17 21.24¤¤
8 to ¡.18 ¡.35 to ¡.11 39.00¤¤
5 to ¡.13 ¡.39 to ¡.09 18.16¤¤
4 to ¡.46 ¡.50 to ¡.50 0.386 to ¡.28 ¡.46 to ¡.18 60.60***
4 to ¡.28 ¡.37 to ¡.25 13.076 to ¡.26 ¡.39 to ¡.23 13.38¤
to .40 .31 to .31 0.17to .42 .19 to .49 42.02***
Note. k, number of correlations. N, sample size. Mr, n-weighted mean correlation. SDr, standard deviation of the n-weighted mean correlation. Mstandard deviation of the n-weighted mean correlation. A signiWcant Q-statistic suggests that there is a signiWcant amount of variance in the correstudy artifacts and measurement error.
¤ p < .05.¤¤ p < .01.
¤¤¤ p < .001.
Relationship Moderator k N Mr SDr M� SD� 90%inte
Independence of data sources
Contingent reward—overall employee perf. DiVerent source 46 7830 .19 .08 .21 .01 .18 Same source 4 1278 .25 .00 .27 .00 .23
Contingent punishment—overall employee perf. DiVerent source 28 4771 ¡.07 .02 ¡.09 .02 ¡.1Same source 2 796 .05 .00 .06 .00 ¡.0
Type of sampleContingent reward—overall employee perf. Manufacturing 24 4623 .18 .07 .20 .08 .17
Service 23 3889 .22 .09 .24 .10 .20 Contingent reward—general satisfaction Manufacturing 22 5179 .33 .09 .42 .10 .36
Service 14 4034 .54 .12 .62 .16 .55 Contingent reward—organizational commitment Manufacturing 15 4117 .40 .00 .47 .00 .45
Service 11 4695 .38 .09 .43 .10 .37 Contingent reward—role ambiguity Manufacturing 9 2387 ¡.29 .08 ¡.35 .08 ¡.4
Service 15 4318 ¡.39 .06 ¡.44 .06 ¡.4Contingent punishment—overall employee perf. Manufacturing 12 2579 ¡.04 .00 ¡.05 .00 ¡.0
Service 17 2927 ¡.07 .07 ¡.07 .08 ¡.1Contingent punishment—general satisfaction Manufacturing 9 2137 .07 .02 .09 .04 .05
Service 9 2525 .10 .09 .11 .12 .03 Contingent punishment—organ. commitment Manufacturing 14 3906 .14 .08 .18 .10 .12
Service 6 2851 .18 .05 .21 .06 .14 Contingent punishment—role ambiguity Manufacturing 9 2387 ¡.04 .15 ¡.05 .19 ¡.1
Service 14 4313 ¡.24 .11 ¡.29 .13 ¡.3Noncontingent reward—overall performance Manufacturing 9 1609 .11 .05 .14 .00 .09
Service 4 939 .04 .00 .05 .00 ¡.0Noncontingent reward—general satisfaction Manufacturing 7 1831 .18 .05 .28 .07 .23
Service 2 1023 .09 .00 .11 .00 .04 Noncontingent reward—organ.commitment Manufacturing 9 2306 .19 .07 .24 .11 .18
Service 5 2722 ¡.04 .04 ¡.05 .05 ¡.0Noncontingent reward—role ambiguity Manufacturing 2 481 .07 .00 .10 .00 ¡.0
Service 7 2744 .04 .07 .05 .09 ¡.0Noncontingent punishment—overall perf. Manufacturing 19 3141 ¡.19 .08 ¡.23 .09 ¡.2
Service 5 1247 ¡.20 .10 ¡.24 .12 ¡.3Noncontingent punishment—general satisfaction Manufacturing 2 1023 ¡.42 .00 ¡.50 .00 ¡.5
Service 20 4872 ¡.25 .09 ¡.32 .11 ¡.3Noncontingent punishment—organ. commitment Manufacturing 9 2306 ¡.25 .04 ¡.31 .05 ¡.3
Service 6 2933 ¡.26 .05 ¡.31 .06 ¡.3Noncontingent punishment—role ambiguity Manufacturing 2 481 .24 .00 .31 .00 .22
Service 8 3052 .27 .10 .34 .12 .22
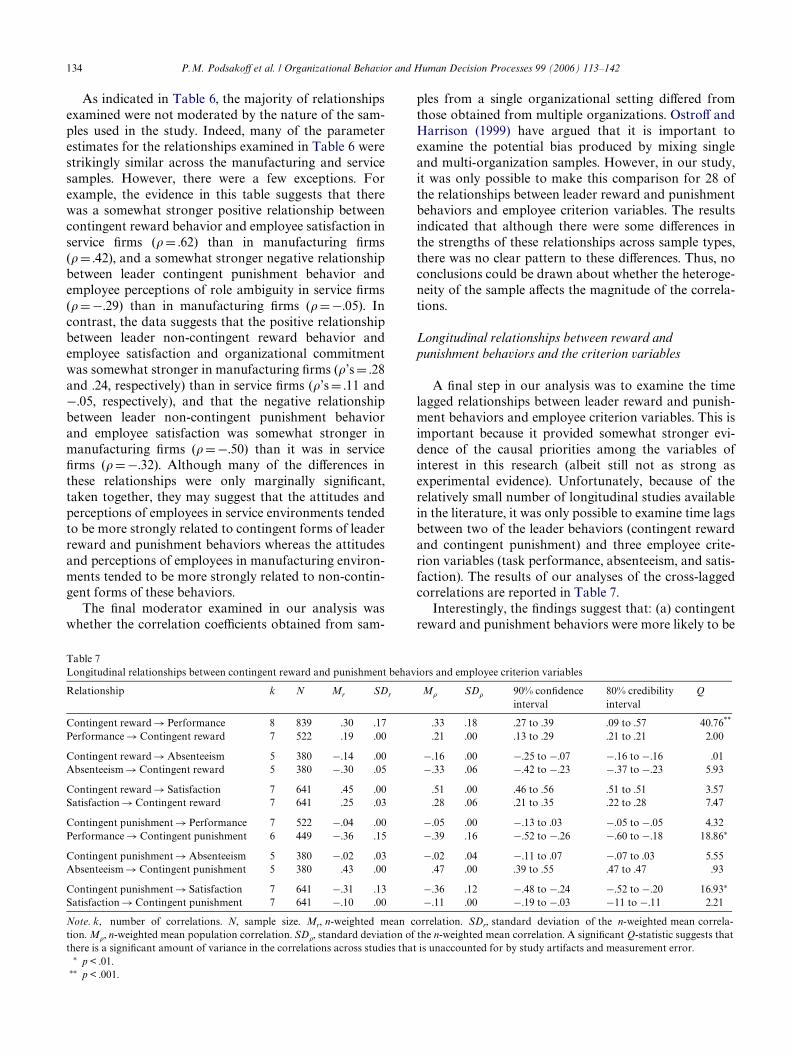
134 P.M. PodsakoV et al. / Organizational Behavior and Human Decision Processes 99 (2006) 113–142
As indicated in Table 6, the majority of relationshipsexamined were not moderated by the nature of the sam-ples used in the study. Indeed, many of the parameterestimates for the relationships examined in Table 6 werestrikingly similar across the manufacturing and servicesamples. However, there were a few exceptions. Forexample, the evidence in this table suggests that therewas a somewhat stronger positive relationship betweencontingent reward behavior and employee satisfaction inservice Wrms (� D .62) than in manufacturing Wrms(�D .42), and a somewhat stronger negative relationshipbetween leader contingent punishment behavior andemployee perceptions of role ambiguity in service Wrms(�D ¡.29) than in manufacturing Wrms (�D ¡.05). Incontrast, the data suggests that the positive relationshipbetween leader non-contingent reward behavior andemployee satisfaction and organizational commitmentwas somewhat stronger in manufacturing Wrms (�’s D .28and .24, respectively) than in service Wrms (�’s D .11 and¡.05, respectively), and that the negative relationshipbetween leader non-contingent punishment behaviorand employee satisfaction was somewhat stronger inmanufacturing Wrms (�D ¡.50) than it was in serviceWrms (�D ¡.32). Although many of the diVerences inthese relationships were only marginally signiWcant,taken together, they may suggest that the attitudes andperceptions of employees in service environments tendedto be more strongly related to contingent forms of leaderreward and punishment behaviors whereas the attitudesand perceptions of employees in manufacturing environ-ments tended to be more strongly related to non-contin-gent forms of these behaviors.
The Wnal moderator examined in our analysis waswhether the correlation coeYcients obtained from sam-
ples from a single organizational setting diVered fromthose obtained from multiple organizations. OstroV andHarrison (1999) have argued that it is important toexamine the potential bias produced by mixing singleand multi-organization samples. However, in our study,it was only possible to make this comparison for 28 ofthe relationships between leader reward and punishmentbehaviors and employee criterion variables. The resultsindicated that although there were some diVerences inthe strengths of these relationships across sample types,there was no clear pattern to these diVerences. Thus, noconclusions could be drawn about whether the heteroge-neity of the sample aVects the magnitude of the correla-tions.
Longitudinal relationships between reward and punishment behaviors and the criterion variables
A Wnal step in our analysis was to examine the timelagged relationships between leader reward and punish-ment behaviors and employee criterion variables. This isimportant because it provided somewhat stronger evi-dence of the causal priorities among the variables ofinterest in this research (albeit still not as strong asexperimental evidence). Unfortunately, because of therelatively small number of longitudinal studies availablein the literature, it was only possible to examine time lagsbetween two of the leader behaviors (contingent rewardand contingent punishment) and three employee crite-rion variables (task performance, absenteeism, and satis-faction). The results of our analyses of the cross-laggedcorrelations are reported in Table 7.
Interestingly, the Wndings suggest that: (a) contingentreward and punishment behaviors were more likely to be
Table 7Longitudinal relationships between contingent reward and punishment behaviors and employee criterion variables
Note. k, number of correlations. N, sample size. Mr, n-weighted mean correlation. SDr, standard deviation of the n-weighted mean correla-tion. M�, n-weighted mean population correlation. SD�, standard deviation of the n-weighted mean correlation. A signiWcant Q-statistic suggests thatthere is a signiWcant amount of variance in the correlations across studies that is unaccounted for by study artifacts and measurement error.
¤ p < .01.¤¤ p < .001.
Relationship k N Mr SDr M� SD� 90% conWdence interval
80% credibility interval
Q
Contingent reward ! Performance 8 839 .30 .17 .33 .18 .27 to .39 .09 to .57 40.76**
Performance ! Contingent reward 7 522 .19 .00 .21 .00 .13 to .29 .21 to .21 2.00
Contingent reward ! Absenteeism 5 380 ¡.14 .00 ¡.16 .00 ¡.25 to ¡.07 ¡.16 to ¡.16 .01Absenteeism ! Contingent reward 5 380 ¡.30 .05 ¡.33 .06 ¡.42 to ¡.23 ¡.37 to ¡.23 5.93
Contingent reward ! Satisfaction 7 641 .45 .00 .51 .00 .46 to .56 .51 to .51 3.57Satisfaction ! Contingent reward 7 641 .25 .03 .28 .06 .21 to .35 .22 to .28 7.47
Contingent punishment ! Performance 7 522 ¡.04 .00 ¡.05 .00 ¡.13 to .03 ¡.05 to ¡.05 4.32Performance ! Contingent punishment 6 449 ¡.36 .15 ¡.39 .16 ¡.52 to ¡.26 ¡.60 to ¡.18 18.86¤
Contingent punishment ! Absenteeism 5 380 ¡.02 .03 ¡.02 .04 ¡.11 to .07 ¡.07 to .03 5.55Absenteeism ! Contingent punishment 5 380 .43 .00 .47 .00 .39 to .55 .47 to .47 .93
Contingent punishment ! Satisfaction 7 641 ¡.31 .13 ¡.36 .12 ¡.48 to ¡.24 ¡.52 to ¡.20 16.93¤
Satisfaction ! Contingent punishment 7 641 ¡.10 .00 ¡.11 .00 ¡.19 to ¡.03 ¡11 to ¡.11 2.21
P.M. PodsakoV et al. / Organizational Behavior and Human Decision Processes 99 (2006) 113–142 135
a cause of employee satisfaction (�D .51 and �D ¡.36,respectively) than a consequence of it (�D .28 and� D ¡.11, respectively); (b) contingent reward and pun-ishment behaviors were more likely to be a consequenceof employee absenteeism (�D ¡.33 and �D .47, respec-tively) than a cause of it (�D ¡.16 and �D ¡.02, respec-tively); and (c) contingent reward was more likely to be acause than a consequence of employee performance(� D .33 versus �D .21), whereas contingent punishmentbehavior was more likely to be a consequence than acause of employee performance (�D ¡.39 versus� D ¡.05). This pattern of Wndings is interesting(although only suggestive), because it indicates thatthese two key leader behaviors are both shapers ofemployees’ attitudes and behaviors, and reactions tothem.
General discussion
Several conclusions are warranted from the pattern ofresults obtained in our study. First, the results of Table 5suggest that leader reward and punishment behaviorshave signiWcant relationships with many of the employeeattitudes, perceptions and behaviors considered impor-tant in the Weld, even after controlling for the eVects ofthe other leader behaviors. Although some of the strongrelationships obtained between the measures of leaderreward and punishment behaviors and employee atti-tudes and perceptions are undoubtedly inXuenced bymethod biases (cf. PodsakoV, MacKenzie, Lee, & Pod-sakoV, 2003; PodsakoV & Organ, 1986), the fact thatleader contingent reward behavior and leader non-con-tingent punishment behavior were also found to sharean average of 8% of the variance with a variety of diVer-ent employee performance measures (e.g., task perfor-mance, overall performance, organizational citizenshipbehaviors), which were generally obtained from diVerentsources, suggests that method variance cannot explainall of these relationships.
Second, consistent with the predictions of the fairlytraditional path-goal and reinforcement approaches toleadership, as well as the more recent transformationaland transactional approaches, the results indicated thatthe manner in which leaders administer rewards andpunishments is a critical determinant of the eVectivenessof these leader behaviors. More speciWcally, the Wndingsreported in Table 5 indicate that for reward behavior 15of the 19 hypothesized diVerences are in the expecteddirection, and 12 of these diVerences are signiWcant, andfor punishment behavior 19 of the 20 hypothesizeddiVerences are in the expected direction and 18 of thesediVerences are signiWcant. These are fairly compellingWndings, and suggest that leaders need to be aware of thefact that the real key to providing praise and commenda-tions to employees on the one hand, and reprimands and
social disapproval to them on the other hand, is whetherthese events are administered contingently uponemployee performance. In addition, these Wndings alsosuggest that leaders need to communicate to employeesthose speciWc behaviors that they feel merit their (theleader’s) praise and social approval.
Finally, consistent with hypotheses H1 and H2, theWndings reported in Table 5 also indicate that leaderreward and punishment behaviors are strongly related toemployees’ perceptions of justice and role ambiguity.These Wndings suggest that perceptions of justice androle ambiguity may be mediators of the eVects of leaderreward and punishment behaviors on employee attitudesand behaviors, because previous research (e.g., Cohen-Charash & Spector, 2001; Colquitt et al., 2001; Jacksonand Schuler, 1985) has found that justice perceptionsand role ambiguity inXuence many of the employee atti-tudes and behaviors included in our meta-analysis (e.g.,satisfaction, commitment, trust, task performance, andorganizational citizenship behaviors). Of these twopotential mediating eVects, justice appears to be morestrongly related to the leader reward and punishmentbehaviors. Unfortunately, this mediating eVect could notbe tested directly in our study because, to our knowl-edge, only one study has reported correlations among allof these variables. This suggests that examining themediating eVects of justice ought to be one of the priori-ties for future research.
Implications for future research
Along with the points made above, we believe thatthere are several additional avenues that are in need offuture research. One potentially useful direction forfuture research relates to leader contingent punishmentbehavior. Generally speaking, we found positive rela-tionships in this study between leader contingent punish-ment behavior and employee attitudes and perceptions,but not between this form of leadership behavior andemployee performance. These Wndings suggest that eventhough leaders who use punishment appropriately gen-erally enhance employee attitudes and perceptions, theseattitudes and perceptions do not necessarily translateinto improved levels of performance. One possible rea-son for this may have to do with the fact that the admin-istration of punishment is more complex than theadministration of rewards. For example, althoughrewards that are administered contingently signal thebehavior that the leader considers desirable, punish-ments that are administered contingently only signal thebehavior that the leader considers undesirable, but donot necessarily identify those behaviors that the leaderexpects the employee to exhibit to be eVective in the situ-ation. For this reason, it may be necessary for leaderswho use punishment contingently not only to identify
136 P.M. PodsakoV et al. / Organizational Behavior and Human Decision Processes 99 (2006) 113–142
the behaviors that they consider ineVective, but also toidentify those speciWc behaviors that the employeeshould perform to be eVective. Such behaviors on thepart of the leader, which may be called leader punish-ment clariWcation behaviors, should therefore beincluded in future research in this domain.
The Wnding that contingent and non-contingent pun-ishment had somewhat stronger eVects on group perfor-mance as opposed to individual performance alsowarrants further attention. Although it is not clear whypunishment should have stronger eVects on the perfor-mance of groups than on individuals, O’Reilly andPuVer (1989) have suggested that this may result fromthe social context in which punishment is administered:
While it may be true that negative sanctions may be lesseVective than positive sanctions in controlling individualbehavior, management occurs in a social context. Theprovision of rewards or punishments to an individual areoften observed and responded to by others. As Oliver(1980) has pointed out, positive and negative sanctionshave diVerent eVects when used to induce collectiveaction. The cost of providing positive incentives mayincrease when administered to an increasing number ofsubjects while the cost of selective sanctions maydecrease. This impact is heightened as others learn whatis important and desirable through simple observationof what is rewarded and what is punishedƒ.Properlyapplied, negative sanctions may act both to set speciWcgoals and to help establish group norms which governacceptable and unacceptable behaviors. Failure to usenegative sanctions may, from a social perspective, act asa reinforcer for undesired behaviors, lead to feelings ofinequity and establish unproductive norms. While posi-tive sanctions may be more eVective in shaping an indi-vidual’s behavior than negative sanctions, in a socialcontext the use of negative sanctions may be a highly vis-ible and eVective tool for increasing both productivityand satisfaction. (O’Reilly & PuVer, 1989, p. 42).
Similar points regarding the importance of the socialcontext in which punishment occurs have also beenmade by Trevino (1992). Building on the work ofO’Reilly and PuVer (1989), she argues that althoughmost of the research on punishment has focused on theeVects it has on the recipient of it, punishment is a socialevent that also has eVects on those who observe it beingadministered to others. Using a justice framework, Trev-ino develops a series of hypotheses regarding the eVectsof punishment administered by organizational leaderswill have on observers of the punishment events.
Consistent with the expectations of O’Reilly andPuVer (1989) and Trevino (1992), several studies havereported that punishment does, indeed, inXuence thebehavior of those who observe the punishment event.For example, O’Reilly and PuVer (1989) found that sub-jects in their studies reported that they were more willing
to work hard, felt more satisWed, expected higher levelsof group performance, and perceived more equitabletreatment from their supervisors when the supervisorspunished a team member who performed poorly thanwhen the poor performing team member received nopunishment. Also consistent with these expectations,NiehoV, Paul, and Bunch (1998) found that observerstended to perceive a violator to be more deserving ofpunishment when he/she had a history of poor perfor-mance than when he/she did not, and tended to expressmore positive attitudes toward the supervisor when theconsequences the supervisor administered were more asopposed to less severe. These Wndings are important,because coworkers are likely to pay particular attentionto those instances when one of their peers is punished.However, it is fair to say that many, if not most, of thehypotheses developed by Trevino (1992) have not beentested yet. Thus, future research on the eVects that pun-ishment has within a group or social context might beparticularly worthwhile to pursue.
Related to the above, the fact that non-contingentpunishment had so many detrimental eVects on so manycriterion variables suggests that future research shouldfocus on enhancing our understanding of the causes ofthis dysfunctional behavior and the reasons why it is sodetrimental. One reason leaders may engage in thisbehavior is to show their employees who the boss is andthereby assert their authority; or it is possible that whenmanagers become frustrated with their jobs, they mayreact disproportionately to minor examples of poor per-formance. Such instances of punishment will be per-ceived to be retributively unjust (Trevino, 1992), eitherbecause the punishment is not linked to their perfor-mance or because it is disproportionate to their behav-ior. This will be de-motivating for employees and sendthe wrong social signals. Therefore, managers need tounderstand how damaging non-contingent punishmentbehavior can be and control their desires to exert theirauthority or to vent their frustrations. However, anotherpossibility is that leaders who are perceived to use a lotof non-contingent punishment are really administeringpunishments contingent upon performance, but theyhave failed to communicate the criteria they use to judgeperformance or how employees measure up to thoseexpectations. In these instances, what the leader needs tochange is not the manner in which punishments areadministered, but rather he/she needs to do a better jobof communicating his or her expectations to employees.To the extent that the leader succeeds in doing this, thisshould enhance employees’ perceptions of justice, reducerole-ambiguity and produce a variety of beneWcial eVectsfor the organization.
In addition to gaining a better understanding of theeVects of non-contingent punishment, we also need togain a better understanding of the situations in whichcontingent punishment behaviors have their biggest
P.M. PodsakoV et al. / Organizational Behavior and Human Decision Processes 99 (2006) 113–142 137
eVects. The results of this meta-analysis showed thatcontingent punishment behavior reduced role ambiguitymore in service Wrms than in manufacturing Wrms. Onereason that this may have happened is that it is possiblethat service jobs are inherently more complex andambiguous than manufacturing jobs because often theymust be shaped to meet customer needs or situationalcontingencies. This may suggest that contingent punish-ment behavior will be most beneWcial in work settingswhere role ambiguity is high. This would be a good topicfor future research to examine.
Given that leader reward and punishment behaviorsdid have signiWcant relationships with many of the mostimportant employee criterion variables in the Weld,future research should also be directed at the anteced-ents of these behaviors. Although reviews of the determi-nants of a leader’s use of rewards and punishments havebeen reported previously by PodsakoV (1982) and Arveyand Jones (1985), both of these reviews are over twentyyears old, and it is fair to say that substantially lessattention has been directed at the determinants of leaderreward and punishment behaviors than at their conse-quences during the past two decades. However, a fewexceptions to this general rule do exist. For example,using a qualitative interview technique, ButterWeld,Trevino, and Ball (1996) identiWed several sources thatinXuence a manager’s decision about whether and howto administer punishment, including: (a) the manager’sexpectations, implicit theories, and attributions aboutthe subordinate’s behavior; (b) the subordinate’s ownexpectations, past work history, and relationship withthe manager; (c) the expectations of the work group; and(d) the organization’s expectations and policies regard-ing the use of punishment. Using a more traditionalquantitative approach, Atwater, Dionne, Cambobreco,Avolio, and Lau (1998), examined three attributes ofmilitary cadet leaders (i.e., their physical Wtness, moralreasoning and self-esteem) that might inXuence their useof contingent and non-contingent punishment behav-iors. They found that leaders who possessed high levelsof physical Wtness and moral reasoning were more likelyto use contingent punishment, whereas those with lowerlevels of self-esteem were more likely to use non-contin-gent punishment. However, despite these interestingWndings, little follow-up research has been conducted todetermine their generalizability, or to examine other fac-tors that inXuence a leader’s use of reward and punish-ment behaviors.
Finally, an important area for future research wouldbe to examine the direction of the causal relationshipsbetween contingent and non-contingent leader rewardand punishment behaviors and employee criterion vari-ables in greater detail. The Wndings summarized in Table7 suggest that the relationships between leader rewardand punishment behavior and employee criterion vari-ables may be complex. Based on the corrected cross-
lagged meta-analytic correlations, our results indicatethat the same leader behavior can be a cause of someemployee criterion variables, and a consequence of oth-ers. This suggests the need for not only more empiricalresearch, but for more careful theorizing about the con-ditions under which these behaviors are likely to be driv-ers of employee criterion variables and when they arelikely to be driven by them. To our knowledge, this is theonly meta-analysis to ever examine this issue.
However, even better evidence of causality could beobtained from controlled experiments. Although cross-lagged correlations are better evidence of causality thancross-sectional correlations, they are not as good asexperimental data. The few experimental studies thathave been reported (cf. Jung & Avolio, 2000; Manz &Sims, 1986) are promising, and suggest that leaderreward and punishment behaviors are causal determi-nants of important employee criterion variables. Forexample, in an experimental study designed to examinethe eVects of transformational and transactional leader-ship on the performance in a brain storming task, Jungand Avolio (2000) reported that leader contingentreward behavior directly increased subordinates’ qualityof performance, and indirectly increased both subordi-nate quality and satisfaction through its eVect on thesubordinates’ trust in their leader.
In another interesting experimental study designed toexamine the eVects of modeling on leadership behaviorand employee attitudes, Manz and Sims (1986) reportedthat participants exposed to a leader who modeled con-tingent reward behavior provided more contingent posi-tive feedback to subordinates, who subsequentlyexpressed more satisfaction; whereas participantsexposed to a leader who modeled contingent punishmentbehavior provided more negative feedback to subordi-nates and less positive feedback and goal setting behav-ior. These results are interesting, because they suggestthat leaders can learn how to use rewards and punish-ments more eVectively by observing models of thebehavior. However, it is fair to say that additionalresearch needs to be conducted to in laboratory settingsto establish the causal eVects of leader reward and pun-ishment behaviors on many of the criterion variablesincluded in our meta-analysis.
Limitations
There are, of course, some limitations of our researchthat should be recognized. First, as noted by severalresearchers (e.g., Guzzo, Jackson, & Katzell, 1987;Wanous et al., 2000), every meta-analytic study is subjectto a variety of judgment calls that may inXuence theresults. Thus, even though we took every precaution(e.g., by having multiple raters code the data and resolvetheir diVerences with a third rater) to minimize the
138 P.M. PodsakoV et al. / Organizational Behavior and Human Decision Processes 99 (2006) 113–142
impact of these judgments, our decisions may have nev-ertheless had some inXuence on the Wndings. Second,many of the variables included in our review wereobtained with self-report measures that are subject tosame-source biases (cf. PodsakoV et al., 2003; PodsakoV
& Organ, 1986). Indeed, although the number of com-parisons that could be made were small in number, ourown moderator analyses suggested that the relationshipsbetween the leader behaviors and employee criterionvariables that were obtained from the same sourcetended to be stronger than these same relationshipswhen they were obtained from diVerent sources. Despitethis, it is important to recognize that the relationshipsbetween leader contingent reward behavior and leadernon-contingent punishment behavior and employee taskperformance and organizational citizenship behaviors(e.g., altruism, courtesy, conscientiousness, sportsman-ship, and civic virtue), which were obtained from diVer-ent sources, were also fairly substantial. Third, althoughthe data reported in Table 3 indicate that the leaderreward and punishment behaviors included in our meta-analysis are relatively independent from each other,leader contingent reward behavior and leader non-con-tingent punishment behavior were somewhat morehighly correlated than the rest (corrected r D ¡.55). Thissuggests that the correlations shown in Table 4 captureboth unique and shared variance between the leaderbehaviors and the criterion measures. However, it isimportant to note that this potential limitation of thecorrelational data in Table 4 is addressed directly by theregression results reported in Table 5, which show thatthese two leader behaviors had signiWcant independenteVects on most of the criterion variables, even after con-trolling for all of the other leader behaviors included inour analysis. A Wnal limitation that may restrict the gen-eralizability of the Wndings is that manufacturing organi-zations may be over-represented in the meta-analysis,because virtually all of the samples obtained for Study 1were from diVerent manufacturing organizations. How-ever, the fact that the moderator analysis indicated thatorganizational type (service versus manufacturing) didnot have much of an impact on the relationshipsreported in our study would suggest that this may not bea substantial concern.
Conclusion
In spite of these limitations, the Wndings of our meta-analysis suggest that leader reward and punishmentbehaviors have signiWcant unique eVects on a variety ofimportant employee attitudes, perceptions and behav-iors, and that the manner in which leaders administerrewards and punishments is a critical determinant of theeVectiveness of these leader behaviors. In addition, per-ceptions of justice and role ambiguity were identiWed as
potentially important mediators of the eVects of theseleader behaviors on employee criterion variables. Gener-ally speaking, the results conWrm the importance ofleader reward and punishment behaviors and the centralrole they have been given in theories of leadership, andsuggest several new avenues for future research.
References
Asterisks (*) indicate those papers included in the meta-analysis
Adams, J. S. (1965). Inequity in social exchange. In L. Berkowitz (Ed.),Advances in experimental social psychology (Vol. 2, pp. 267–299).New York: Academic Press.
Andersson, L. M. (1996). Employee cynicism: An examination using acontract violation framework. Human Relations, 49, 1395–1418.
Aquino, K., Lewis, M. U., & BradWeld, M. (1999). Justice constructs,negative aVectivity, and employee deviance: A proposed model andempirical test. Journal of Organizational Behavior, 20, 1073–1091.
Arvey, R., & Jones, A. (1985). The use of discipline in organizationalsettings: A framework for future research. In B. Staw & L. Cum-mings (Eds.), Research in Organizational Behavior (7, pp. 367–408).Greenwich, CT: JAI Press.
*Atwater, L. E., Cambobreco, J. F., Dionne, S. D., Avolio, B. J., & Lau,A. N. (1997). EVects of rewards and punishments on leaders cha-risma, leaders eVectiveness and follower reactions. LeadershipQuarterly, 8, 133–152.
*Atwater, L. E., Dionne, S. D., Cambobreco, J. F., Avolio, B. J., & Lau,A. N. (1998). Individual attributes and leadership style: Predictingthe use punishments and its eVects. Journal of OrganizationalBehavior, 19, 559–576.
Avolio, B. J. (1999). Full leadership development. Thousand Oaks, CA:Sage.
*Avolio, B. J., Bass, B. M., & Jung, D. I. (1999). Re-examining the com-ponents of transformational and transactional leadership using theMultifactor leadership questionnaire. Journal of Occupational andOrganizational Psychology, 72, 442–461.
*Avolio, B. J., Howell, J. M., & Sosik, J. J. (1999). A funny thing hap-pened on the way to the bottom line: Humor as a moderator of lead-ership style eVects. Academy of Management Journal, 42, 219–227.
*Avolio, B. J., Yammarino, F. J., & Bass, B. M. (1991). Identifying com-mon methods variance with data collected from a single source: Anunresolved sticky issue. Journal of Management, 17, 571–587.
Ball, G., Trevino, L., & Sims, H. (1992). Understanding subordinatereactions to punishment incidents: Perspectives from justice andsocial aVect. Leadership Quarterly, 3, 307–334.
Ball, G., Trevino, L., & Sims, H. (1994). Just and unjust punishment:InXuences on subordinate performance and citizenship. Academy ofManagement Journal, 37, 299–322.
*Bare, A. C. (1978). StaYng and training: Neglected supervisory func-tions related to group performance. Personnel Psychology, 31, 107–117.
Barge, J. K., & Schlueter, D. W. (1991). Leadership as organizing: Acritique of leadership instruments. Management CommunicationQuarterly, 4, 541–570.
*Bass, B. (1985). Leadership and performance beyond expectations. NewYork: Free Press.
Bass, B. M. (1998). Transformational leadership: Industrial, military,and educational impact. Mahwah, NJ: Lawrence Erlbaum.
*Bass, B. M., & Avolio, B. J. (1989). Potential biases in leadership mea-sures: How prototypes, leniency, and general satisfaction relate toratings and rankings of transformational and transactional leader-ship constructs. Educational and Psychological Measurement, 49,509–527.
P.M. PodsakoV et al. / Organizational Behavior and Human Decision Processes 99 (2006) 113–142 139
*Bass, B. M., & Yammarino, F. J. (1991). Congruence of self and oth-ers’ leadership ratings of naval oYcers for understanding successfulperformance. Applied Psychology: An International Review, 40(4),437–454.
*Bateman, T. S., & Strasser, S. (1984). A longitudinal analysis of theantecedents of organizational commitment. Academy of Manage-ment Journal, 27, 95–112.
*Bateman, T. S., Strasser, S., & Dailey, R. C. (1983). Toward properspeciWcation of the eVects of leader punitive behavior: A researchnote. Journal of Management, 8, 83–93.
*Brass, D. J., & Oldham, G. R. (1976). Validating an in-basket testusing an alternative set of leadership scoring dimensions. Journal ofApplied Psychology, 61, 652–657.
Burns, J. M. (1978). Leadership. New York: Harper Row.ButterWeld, K. D., Trevino, L. K., & Ball, G. A. (1996). Punishment for
the manager’s perspective: A grounded investigation and inductivemodel. Academy of Management Journal, 39, 1479–1512.
*Bycio, P., Hackett, R. D., & Allen, J. S. (1995). Further assessments ofBass’s (1985) conceptualization of transactional and transforma-tional leadership. Journal of Applied Psychology, 80, 468–478.
Cammann, C., Fichman, M., Jenkins, G. D., Jr., & Klesh, J. R. (1983).Assessing the attitudes and perceptions of organizational members.In S. E. Seashore, E. E. Lawler III, P. H. Mirvis, & C. Cammann(Eds.), Assessing organizational change: A guide to methods, mea-sures, and practices (pp. 71–138). New York: Wiley.
Cavanaugh, M. A., Boswell, W. R., Roehling, M. V., & Boudreau, J. W.(2000). An empirical examination of self-reported work stressamong U.S. managers. Journal of Applied Psychology, 85, 65–74.
Cohen, A. (1996). On the discriminant validity of the Meyer and Allenmeasure of organizational commitment: How does it Wt with thework commitment construct? Educational and Psychological Mea-surement, 56, 494–503.
Cohen-Charash, Y., & Spector, P. E. (2001). The role of justice in orga-nizations: A meta-analysis. Organizational Behavior and HumanDecision Processes, 86, 278–321.
Colquitt, J. A., Conlon, D. E., Wesson, M. J., Porter, C. O. L. H., & Ng,K. Y. (2001). Justice at the millennium: A meta-analytic review of25 years of organizational research. Journal of Applied Psychology,86, 425–445.
*Deluga, R. J. (1991). The relationship of leader and subordinate inXu-encing activity in naval environments. Military Psychology, 3, 25–39.
*Dionne, S. D., Yammarino, F. J., Atwater, L. E., & James, L. R. (2002).Neutralizing substitutes for leadership theory: Leadership eVectsand common-source bias. Journal of Applied Psychology, 87, 454–464.
Dirks, K. T., & Ferrin, D. L. (2002). Trust in leadership: Meta-analyticWndings and implications for research and practice. Journal ofApplied Psychology, 87, 611–628.
*Dorfman, P. W., Howell, J. P., Hibino, S., Lee, J. K., Tate, U., & Bau-tista, A. (1997). Leadership in Western and Asian countries: Com-munalities and diVerences in eVective leadership processes acrosscultures. Leadership Quarterly, 8, 233–274.
*Druskat, V. U. (1994). Gender and leadership style: Transformationaland transactional leadership in the roman catholic church. Leader-ship Quarterly, 5, 99–119.
*Dubinsky, A. J., Yammarino, F. J., & Jolson, M. A. (1994). Closenessof supervision and salesperson work outcomes: An alternative per-spective. Journal of Business Research, 29, 225–237.
*Dubinsky, A. J., Yammarino, F. J., Jolson, M. A., & Spangler, W. D.(1995). Transformational leadership: An initial investigation insales management. Journal of Personal Selling & Sales Manage-ment, 15, 17–32.
Eagley, A. H., Johannesen-Schmidt, M. C., & vanEngen, M. L. (2003).Transformational, transactional, and laissez-faire leadership styles:A meta-analysis comparing women and men. Psychological Bulle-tin, 129, 569–591.
*Ehrlich, S. B., Meindl, J. R., & Viellieu, B. (1990). The charismaticappeal of a transformational leader: An empirical case study of asmall, high technology contractor. Leadership Quarterly, 1, 229–247.
Eisenberger, R., Huntington, R., Hutchison, S., & Sowa, D. (1986). Per-ceived organizational support. Journal of Applied Psychology, 71,500–507.
Evans, M. (1970). The eVects of supervisory behavior on the path-goalrelationship. Organizational Behavior and Human Performance, 5,277–298.
*Farh, J. L., PodsakoV, P. M., & Cheng, B. S. (1987). Culture-free lead-ership eVectiveness versus moderators of leadership behavior: Anextension and test of Kerr and Jermier’s “substitutes for leader-ship” model in Taiwan. Journal of International Business Studies,18, 43–60.
*Farh, J. L., PodsakoV, P. M, & Organ, D. W. (1990). Accounting fororganizational citizenship behavior: Leader fairness and task scopeversus satisfaction. Journal of Management, 16, 705–721.
Folger, R., & Konovosky, M. (1989). EVects of procedural and distrib-utive justice on reactions to pay raise decisions. Academy of Man-agement Journal, 32, 115–130.
*Fulk, J., & Wendler, E. R. (1982). Dimensionality of leader-subordi-nate interactions: A path-goal investigation. Organizational Behav-ior and Human Performance, 30, 241–264.
Fuller, J. B., Patterson, C. E. P., Hester, K., & Stringer, S. Y. (1996). Aquantitative review of research on charismatic leadership. Psycho-logical Reports, 78, 271–287.
Funderburg, S. A., & Levy, P. E. (1997). The inXuence of individual andcontextual variables on 360-degree feedback systame attitudes.Group & Organization Management, 22, 210–235.
*George, J. M. (1995a). Leader positive mood and group performance:The case of customer service. Journal of Applied Social Psychology,25, 778–794.
*George, J. M. (1995b). Asymmetrical eVects of rewards and punish-ments: The case of social loaWng. Journal of Occupational and Orga-nizational Psychology, 68, 327–338.
Gerstner, C. R., & Day, D. V. (1997). Meta-analytic review of leader-member exchange theory: Correlates and construct issues. Journalof Applied Psychology, 82, 827–844.
*Geyer, A. L. J, & Streyer, J. M. (1998). Transformational leadershipand objective performance in banks. Applied Psychology: An inter-national review, 47, 397–420.
*Goodwin, V. L., WoVord, J. C., & Whittington, J. L. (2001). A theoret-ical and empirical extension to the transformational leadershipconstruct. Journal of Organizational Behavior, 22, 759–774.
Greenberg, J. (1990). Organizational justice: Yesterday, today andtomorrow. Journal of Management, 16, 399–432.
Greenberger, D. B., Strasser, S., & Lee, S. (1988). Personal control as amediator between perceptions of supervisory behaviors andemployee reactions. Academy of Management Journal, 31, 405–417.
Guzzo, R. A., Jackson, S. E., & Katzell, R. A. (1987). Meta-analysisanalysis. In L. L. Cummings & B. M. Staw (Eds.), Research in orga-nizational behavior (Vol. 9, pp. 407–442). Greenwich, CT: JAI Press.
*Hackman, M. Z., Furniss, A. H., Hillas, M. J., & Paterson, T. J. (1992).Perceptions of gender-role characteristics and transformationaland transactional leadership behaviors. Perceptual & Motor Skills,75, 311–319.
Hardin, G. (1968). The tragedy of the commons. Science, 162, 1243–1248.
*Hater, J. J., & Bass, B. M. (1988). Superiors evaluations and subordi-nates perceptions of transformational and transactional leadership.Journal of Applied Psychology, 73(4), 695–702.
*Hinkin, T. R., & Schrieshiem, C. A. (1994). An examination of subor-dinate-perceived relationships between leader reward and punish-ment behavior and bases of power. Human Relations, 7, 779–800.
House, R. J. (1971). A path-goal theory of leader eVectiveness. Adminis-trative Science Quarterly, 16, 321–339.
140 P.M. PodsakoV et al. / Organizational Behavior and Human Decision Processes 99 (2006) 113–142
House, R. J., & Mitchell, T. R. (1974). Path-goal theory of leadership.Journal of Contemporary Business, 3, 81–97.
*Howell, J. M., & Avolio, B. (1993). Transformational leadership,transactional leadership, locus of control, and support for innova-tion: Key predictors of consolidated business-unit performance.Journal of Applied Psychology, 78, 891–902.
*Howell, J. M., & Hall-Merenda, K. E. (1999). The ties that bind: Theimpact of leader-member exchange, transformational and transac-tional leadership, and distance on predicting follower performance.Journal of Applied Psychology, 84, 680–694.
HuVcutt, A. I., & Arthur, W. (1995). Development of a new outlier sta-tistic for meta-analytic data. Journal of Applied Psychology, 80,327–334.
*Hunt, J. G., Osborn, R. N., & Schuler, R. S. (1978). Relations of dis-cretionary leadership to performance and satisfaction in a complexorganization. Human Relations, 31, 507–523.
Hunter, J. E., & Schmidt, F. L. (1990). Methods of meta-analysis: Cor-recting error and bias in research Wndings. Newbury Park, CA: Sage.
Huselid, M. A., & Day, N. E. (1991). Organizational commitment, jobinvolvement, and turnover: A substantive and methodologicalanalysis. Journal of Applied Psychology, 76, 380–391.
*Jackofsky, E. F., & Slocum, J. W., Jr. (1988). A longitudinal study ofclimates. Journal of Organizational Behavior, 9, 319–334.
Jackson, S. E., & Schuler, R. S. (1985). A meta-analysis and conceptualcritique of research on role ambiguity and role conXict in worksettings. Organizational Behavior & Human Decision Processes, 36,16–78.
*Jackson, S. E., Schwab, R. L., & Schuler, R. S. (1986). Toward anunderstanding of the burnout phenomenon. Journal of Applied Psy-chology, 71, 630–640.
*Judge, T. A., & Bono, J. E. (2000). Five-factor model of personalityand transformational leadership. Journal of Applied Psychology, 85,751–765.
Judge, T. A., & Piccolo, R. F. (2004). Transformational and transac-tional leadership: A meta-analytic test of their relative weights.Journal of Applied Psychology, 89, 75–768.
Jung, D. J., & Avolio, B. J. (2000). Opening the black box: An experi-mental investigation of the mediating eVects of trust and value con-gruence on transformational and transactional leadership. Journalof Organizational Behavior, 21, 949–964.
*Kane, T. D., & Tremble, T. R., Jr. (2000). Transformational leadershipeVects at diVerent levels of the army. Military Psychology, 12, 137–160.
*Keller, R. T., & Szilagyi, A. D. (1976). Employee reactions to leaderreward behavior. Academy of Management Journal, 19, 619–627.
*Keller, R. T., & Szilagyi, A. D. (1978). A longitudinal study of leaderreward behavior, subordinate expectancies, and satisfaction. Per-sonnel Psychology, 31, 119–129.
*Kirby, P. C., Paradise, L. V., & King, M. I. (1992). Extraordinary lead-ers in education: Understanding transformational leadership. Jour-nal of Educational Research, 85, 303–311.
*Koh, W. L., Steers, R. M., & Terborg, J. R. (1995). The eVects of trans-formational leadership on teacher attitudes and student perfor-mance in Singapore. Journal of Organizational Behavior, 16, 319–333.
*Kohli, A. K. (1985). Some unexplored supervisory behaviors and theirinXuence on salesperson’s role clarity, speciWc self-esteem, job satis-faction, and motivation. Journal of Marketing Research, 22, 424–433.
Komives, S. R. (1991). The relationship of same- and cross- genderwork pairs to staV performance and supervisor leadership in resi-dence hall units. Sex Roles, 24(5/6), 355–363.
Konovsky, M. A., & Pugh, S. D. (1994). Citizenship behavior andsocial-exchange. Academy of Management Journal, 37(3), 656–669.
Kossek, E. E., & Ozekio, C. (1998). Work-family conXict, policies, andjob-life satisfaction relationship: A review and directions for orga-
nizational behavior and human resources research. Journal ofApplied Psychology, 83, 139–149.
Lawler, E. E., III (1971). Pay and organizational eVectiveness: A psycho-logical view. New York: McGraw-Hill.
LePine, J. A., LePine, M. A., & Jackson, C. L. (2004). Challenge andhindrance stress: Relationship with exhaustion, motivation tolearn, and learning performance. Journal of Applied Psychology, 89,883–891.
Lowe, K. B., Kroeck, K. G., & Sivasubramaniam, N. (1996). EVective-ness correlates of transformational and transactional leadership: Ameta-analytic review of the MLQ literature. Leadership Quarterly,7, 385–425.
Luthans, F., & Kreitner, R. (1975). Organizational behavior modiWca-tion. Glenview, ILL: Scott, Foresman.
MacKenzie, S. B., PodsakoV, P. M., & Ahearne, M. A. (1998). Somepossible antecedents and consequences of in-role and extra-rolesalesperson performance. Journal of marketing, 62, 87–98.
MacKenzie, S. B., PodsakoV, P. M., & Fetter, R. (1991). Organizationalcitizenship behavior and objective productivity as determinants ofmanagerial evaluations of salespersons’ performance. Organiza-tional Behavior and Human Decision Processes, 50, 123–150.
MacKenzie, S. B., PodsakoV, P. M., & Fetter, R. (1993). The impact oforganizational citizenship behavior on evaluations of salespersonperformance. Journal of Marketing, 57, 70–80.
*MacKenzie, S. B., PodsakoV, P. M., & Rich, G. A. (2001). Transforma-tional and transactional leadership and salesperson performance.Journal of the Academy of Marketing Science, 29, 115–134.
Manz, C. C., & Sims, H. P., Jr. (1986). Beyond imitation: Complexbehavioral and aVective linkages resulting from exposure to leader-ship training models. Journal of Applied Psychology, 71, 571–578.
McFarlin, D. B., & Rice, R. W. (1992). The role of facet importance asa moderator in the job satisfaction process. Journal of Organiza-tional Behavior, 13, 41–54.
McFarlin, D. B., & Sweeney, P. D. (1992). Distributive and proce-dural justice as predictors of satisfaction with personal andorganizational outcomes. Academy of Management Journal, 35,626–637.
McLain, D. L. (1995). Responses to health and safety risk in the workenvironment. Academy of Management Journal, 38, 1726–1746.
Meyer, J. P., & Allen, N. (1997). Commitment to the workplace. Thou-sand Oaks, CA: Sage.
Meyer, J. P., Allen, N., & Smith, C. A. (1993). Commitment to organi-zations and occupations: Extension and test of a three-componentconceptualization. Journal of Applied Psychology, 78, 538–551.
Moorman, R. H. (1991). Relationship between organizational justiceand organizational citizenship behaviors: Do fairness perceptionsinXuence employee citizenship? Journal of Applied Psychology, 76,845–855.
Morrison, E. W., & Phelps, C. C. (1999). Taking charge at work: Extra-role eVorts to initiate workplace change. Academy of ManagementJournal, 42, 403–419.
Mowday, R. T., Steers, R. M., & Porter, L. W. (1979). The measurementof organizational commitment. Journal of Vocational Behavior, 14,234–247.
NiehoV, B. P., & Moorman, R. H. (1993). Justice as a mediator of therelationship between methods of monitoring and organizationalbehavior. Academy of Management Journal, 36, 527–556.
NiehoV, B. P., Paul, R. J., & Bunch, J. F. S. (1998). The social eVects ofpunishment events: The inXuence of violater past performancerecord and severity of the punishment on observers’ justice percep-tions and attitudes. Journal of Organizational Behavior, 19, 589–602.
Nunnally, J. C., & Bernstein, I. H. (1994). Psychometric theory (3rd ed.).New York: McGraw-Hill.
*Oldham, G. R. (1976). The motivational strategies used by supervi-sors: Relationships to eVectiveness indicators. OrganizationalBehavior and Human Performance, 15, 66–86.
P.M. PodsakoV et al. / Organizational Behavior and Human Decision Processes 99 (2006) 113–142 141
Oliver, P. (1980). Rewards and punishments as selective incentives forcollective action: Theoretical investigations. American Journal ofSociology, 85, 1356–1375.
Organ, D. W. (1988). Organizational citizenship behavior: The good sol-dier syndrome. Lexington, MA: Lexington books.
O’Reilly, C. A., III, & PuVer, S. M. (1989). The impact of rewards andpunishments in a social context: A laboratory and Weld experiment.Journal of Occupational Psychology, 62, 41–53.
OstroV, C., & Harrison, D. A. (1999). Meta-analysis, level of analysis,and best estimates of population correlations: Cautions for inter-preting meta-analytic results in organization Behavior. Journal ofApplied Psychology, 84, 260–270.
*Pearce, C. L., & Sims, H. P., Jr. (2002). Vertical versus shared leader-ship as predictors of the eVectiveness of change management teams:An examination of aversive, directive, transactional, transforma-tional, and empowering leader behaviors. Group Dynamics: Theory,Research, and Practice, 6, 172–197.
Pearson, C. A. L. (1991). An assessment of extrinsic feedback on partic-ipation, role perceptions, motivation, and job satisfaction in a self-managed system for monitoring group achievement. Human Rela-tions, 44, 517–537.
*Pillai, R., Schriesheim, C. A., & Williams, E. S. (1999). Fairness per-ceptions and trust as mediators for transformational and transac-tional leadership: A two-sample study. Journal of Management, 25,897–933.
PodsakoV, P. M. (1982). Determinants of a supervisor’s use of rewardsand punishments: A literature review and suggestions for furtherresearch. Organizational Behavior and Human Performance, 29, 58–83.
*PodsakoV, P. M., Dorfman, P., Howell, J. M., & Todor, W. D. (1986).On the nature of the moderators of leader reward and punishmentbehaviors: A cross cultural analysis. In R. N. Farmer (Ed.),Advances in international comparative management (pp. 95–138).Greenwich, CT: JAI Press.
*PodsakoV, P. M., & MacKenzie, S. B. (1995). An examination of sub-stitutes for leadership within a levels of analysis framework. Lead-ership Quarterly, 6, 289–328.
PodsakoV, P. M., MacKenzie, S. B., & Bommer, W. (1996). A meta-analysis of the relationships between Kerr and Jermier’s substitutesfor leadership and employee job attitudes, role perceptions, andperformance. Journal of Applied Psychology, 81, 380–399.
*PodsakoV, P. M., MacKenzie, S. B., & Fetter, R. (1993). Substitutesfor leadership and the management of professionals. LeadershipQuarterly, 4, 1–44.
*PodsakoV, P. M., MacKenzie, S. B., Moorman, R., & Fetter, R. (1990).The impact of transformational leader behaviors on employeetrust, satisfaction, and organizational citizenship behaviors. Lead-ership Quarterly, 1, 107–142.
PodsakoV, P. M., MacKenzie, S. B., Lee, J. Y., & PodsakoV, N. P.(2003). Common method biases in behavioral research: A criticalreview of the literature and recommended remedies. Journal ofApplied Psychology, 88, 879–903.
*PodsakoV, P. M., NiehoV, B. P., MacKenzie, S. B., & Williams, M. L.(1993). Do substitutes for leadership really substitute for leader-ship. An empirical examination of Kerr and Jermier’s situationalleadership model. Organizational Behavior and Human DecisionProcesses, 54, 1–44.
PodsakoV, P. M., & Organ, D. W. (1986). Self-reports in organizationalresearch: Problems and prospects. Journal of Management, 12, 69–82.
*PodsakoV, P. M., & Todor, W. D. (1985). Relationships betweenleader reward and punishment behavior and group processes andproductivity. Journal of Management, 11, 55–73.
*PodsakoV, P. M., Todor, W. D., Grover, R. A., & Huber, V. L. (1984). Sit-uational moderators of leader reward and punishment behavior: Factor Wction? Organizational Behavior and Human Performance, 34, 21–63.
*PodsakoV, P. M., Todor, W. D., & Skov, R. (1982). EVects of leaderperformance contingent and non-contingent reward and punish-
ment behaviors on subordinate performance and satisfaction.Academy of Management Journal, 25, 812–821.
Porter, L. W., Steers, R. M., Mowday, R. T., & Boulian, P. V. (1974).Organizational commitment, job satisfaction, and turnover amongpsychiatric technicians. Journal of Applied Psychoogy, 59, 603–609.
Price, J. L., & Mueller, C. W. (1986). Handbook of organizational mea-surement. Cambridge, MA: Ballinger.
Rhoades, L., & Eisenberger, R. (2002). Perceived organizational sup-port: A review of the literature. Journal of Applied Psychology, 87,698–714.
Rietz, H. J. (1971). Managerial attitudes and perceived contingenciesbetween performance and organizational response. In Proceedingsof the 31st annual meetings of the Academy of Management.(pp.227–238).
*Roush, P. E., & Atwater, L. (1992). Using the MBTI to understandtransformational leadership and self-perception accuracy. MilitaryPsychology, 4, 17–34.
Russ, F. A., McNeilly, K. M., & Comer, J. M. (1996). Leadership, deci-sion making and performance of sales managers: A multi-levelapproach. Journal of Personal Selling & Sales Management, 16, 1–15.
*Salam, S., Cox, J. F., & Sims, H. P., Jr. (1997). In the eye of thebeholder: How leadership relates to 360-degree performance rat-ings. Group & Organization Management, 22, 185–209.
Sanchez, J. I., Kraus, E., White, S., & Williams, M. (1999). Adoptinghigh-involvement human resource practices. Group & OrganizationManagement, 24, 461–478.
Schelling, T. (1971). The ecology of micromotives. Public Interest, 25, 61–98.Schriesheim, C. A., Hinkin, T. R., & Tetrault, L. A. (1991). The discrimi-
nant validity of the leader reward and punishment questionnaire(LRPQ) and satisfaction with supervision: A two-sample, factor ana-lytic investigation. Journal of Occupational Psychology, 64, 159–166.
Scott, W. E., Jr. (1977). A functional analysis of leadership. In J. G.Hunt & L. L. Larson (Eds.), Leadership: The cutting edge. Carbon-dale, IL: Southern Illinois University Press.
*Scully, J. A., Sims, H. P., Jr., Olian, J. D., Schnell, E. R., & Smith, K. A.(1994). Tough times make tough bosses: A meso analysis of CEOleader behavior. Leadership Quarterly, 5, 59–83.
Shore, L. M., & Shore, T. H. (1995). Perceived organizational supportand organizational justice. In R. S. Cropanzano & M. M. Kacmar(Eds.), Organizational politics, justice and support: Managing thesocial climate of the workplace (pp. 149–164). Westport, CT:Quorum.
*Silins, H. C. (1992). EVective leadership for school reform. TheAlberta Journal of Educational Research, 38, 317–334.
*Sims, H. P., Jr. (1977). The leader as a manager of reinforcement con-tingencies: An empirical example and a model. In J. G. Hunt & L.L. Larson (Eds.), Leadership: The cutting edge. Carbondale, IL:Southern Illinois University Press.
*Sims, H. P., Jr., & Szilagyi, A. D. (1975). Leader reward behavior andsubordinate satisfaction and performance. Organizational Behaviorand Human Performance, 14, 426–438.
*Singer, M. S. (1985). Transformational versus transactional leader-ship: A study of New Zealand company managers. PsychologicalReports, 57, 143–146.
*Singer, M. S., & Singer, A. E. (1989). Situational constraints on trans-formational versus transactional leadership behavior, subordinates’leadership preference, and satisfaction. Journal of Social Psychol-ogy, 130, 385–396.
*Sosik, J. J., Potosky, D., & Jung, D. I. (2002). Adaptive self-regulation:Meeting others’ expectations of leadership and performance. Jour-nal of Social Psychology, 142, 211–232.
*Spangler, W. D., & Braiotta, L., Jr. (1990). Leadership and corporateaudit committee eVectiveness. Group and Organization Studies,15(2), 134–157.
Stajkovic, A. D., & Luthans, F. (1997). A meta-analysis of the eVects oforganizational behavior modiWcation on task performance, 1975-95. Academy of Management Journal, 40, 122–1149.
142 P.M. PodsakoV et al. / Organizational Behavior and Human Decision Processes 99 (2006) 113–142
Stogdill, R. M. (1972). Group productivity, drive and cohesiveness.Organizational Behavior and Human Performance, 8, 26–43.
*Strasser, S., Dailey, R. C., & Bateman, T. S. (1981). Attitudinal moder-ators and eVects of leader punitive behavior. Psychological Reports,49, 695–698.
Sweeney, P. D., & McFarlin, D. B. (1993). Workers’ evaluations of the“ends” and the “means”: An examination of four models of distrib-utive and procedural justice. Organizational Behavior and HumanDecision Processes, 55, 23–40.
*Szilagyi, A. (1980a). Causal inferences between leader reward behav-ior and subordinate performance, absenteeism, and work satisfac-tion. Journal of Occupational Psychology, 53, 195–203.
*Szilagyi, A. D. (1980b). Reward behavior by male and female leaders:A causal inference analysis. Journal of Vocational Behavior, 16, 59–72.
Thompson, H. B., & Werner, J. M. (1997). The impact of role conXict/facilitation on core and discretionary behaviors: Testing a mediatedmodel. Journal of management, 23, 583–602.
Trevino, L. K. (1992). The social eVects of punishment in organiza-tions: A justice perspective. Academy of Management Review, 17,647–676.
Tubre, T. C., & Collins, J. M. (2000). Jackson and Schuler (1985) revis-ited: A meta-analysis of the relationship between role ambiguity,role conXict, and job performance. Journal of Management, 26,155–169.
*Turner, N., Barling, J., Epitropaki, O., Butcher, V., & Milner, C.(2002). Transformational leadership and moral reasoning. Journalof Applied Psychology, 87, 304.
*Vandenberghe, C., Stordeur, S., & D’hoore, W. (2002). Transactionaland transformational leadership in nursing: Structural validity andsubstantive relationships. European Journal of PsychologicalAssessment, 18, 16–29.
Vinchur, A. J., Schippmann, J. S., Switzer, F. S., & Roth, P. L. (1998). Ameta-analytic review of predictiors of job performance for sales-people. Journal of Applied Psychology, 83, 586–597.
*Waldman, D. A., Bass, B. M., & Einstein, W. O. (1987). Leadershipand outcomes of performance appraisal processes. Journal of Occu-pational Psychology, 60, 177–186.
Waldman, D., Bass, B., & Yammarino, F. (1990). Adding to contingentreward behavior: The augmenting eVect of charismatic leadership.Group & Organization Studies, 15, 382–395.
Wanous, J. P., Reichers, A. E., & Austin, J. T. (2000). Cynicism aboutorganizational change: Measurement, antecedents and correlates.Group & Organization Management, 25, 132–153.
*Wayne, S. J., Shore, L. M., Bommer, W. H., & Tetrick, L. E. (2002).The role of fair treatment and rewards in perceptions of organiza-tional support and leader-member exchange. Journal of AppliedPsychology, 87, 590–598.
Williams, L. J., & Anderson, S. E. (1991). Job satisfaction and organiza-tional commitment as predictors of organizational citizenship andtask behaviors. Journal of Management, 17, 601–617.
*Williams, M. L., PodsakoV, P. M., & Huber, V. L. (1992). EVects ofwithin-group and between-groups variation in leader behaviors onsubordinate attitudes and performance. Journal of Occupationaland Organizational Psychology, 65, 115–129.
*WoVord, J. C., Goodwin, V. L., & Whittington, J. L. (1998). A Weldstudy of a cognitive approach to understanding transformationaland transactional leadership. Leadership Quarterly, 9, 55–84.
Yammarino, F. J., & Bass, B. M. (1990a). Transformational leadershipand multiple levels of analysis. Human Relations, 43, 975–995.
*Yammarino, F. J., & Bass, B. M. (1990b). Long term forecasting oftransformational leadership and its eVects among naval oYcers:Some preliminary Wndings. In K. E. Clark & M. B. Clark (Eds.),Measures of leadership (pp. 151–170). West Orange, NJ: LeadershipLibrary of America.
*Yammarino, F. J., & Dubinsky, A. J. (1994). Transformational leader-ship theory: Using levels of analysis to determine boundary condi-tions. Personnel Psychology, 47, 787–811.
*Yammarino, F. J., Dubinsky, A. J., Comer, L. B., & Jolson, M. A.(1997). Women and transformational and contingent reward lead-ership: A multiple-levels-of-analysis perspective. Academy of Man-agement Journal, 40, 205–222.
*Yammarino, F. J., Spangler, W. D., & Dubinsky, A. J. (1998). Trans-formational and contingent reward leadership: Individual, dyad,and group levels of analysis. Leadership Quarterly, 9, 27–54.
*Yukl, G. A., & Kanuk, L. (1979). Leadership behavior and eVective-ness of beauty salon managers. Personnel Psychology, 32, 663–675.
Zander, A. (1971). Motives and goals in groups. New York: Wiley.*Zohar, D. (2002). The eVects of leadership dimensions, safety climate,
and assigned priorities on minor injuries in work groups. Journal ofOrganizational Behavior, 23, 75–92.