The Impact of Trade Liberalization on Revenue Mobilization and Stability in Sudan_Suliman
RELATIONSHIP BETWEEN REVENUE MOBILIZATION AND
PERFORMANCE OF LOCAL AUTHORITIES IN KENYA
BY
TOROME P.K.
D61/78970/2009
A RESEARCH PROJECT PRESENTED IN PARTIAL
FULFILLMENT OF THE REQUIREMENTS OF THE DEGREE OF
MASTER OF BUSINESS ADMINISTRATION UNIVERSITY OF
NAIROBI
OCTOBER, 2013

i
DECLARATION
This research project is my original work and has not been submitted for award of any
degree in any University.
Signature ___________________ Date: ________________
Torome P.K.
D61/78970/2009
This project has been submitted for examination with my approval as University of
Nairobi supervisor.
Signature ___________________ Date: ________________
Supervisor
C. Iraya
Department of Accounting and Finance
School of Business
University of Nairobi

ii
ACKNOWLEDGEMENT
The completion of this project was not easy. It was not created by the author alone, but
relied on the cooperative assistance of many unseen hands. First and foremost I owe
special thanks to God Almighty for seeing me through. I sincerely acknowledge my
supervisor C. Iraya, Lecturer University of Nairobi, School of Business for his enabling
support and guidance, his never ending patience, good eye and sharp mind.I would also
like to acknowledge the encouragement from all my colleagues and my MBA
classmates, friends and relatives whose remarkable devotion and dedication throughout
the project work was incredible. May God bless the work of their hands!

iii
DEDICATION
This research study is dedicated to my wife Ruth daughter Catherine and sons,Roman and
Kelvin for their overwhelming support and understanding during this period of study.
Special mention needs to go to my late father Kapaya and mother Grace for instilling in
me the passion and zest for an education, my brothers and sisters for their moral support
throughout the entire Education.
iv
ABSTRACT
Local revenues are defined as subtotal of all categories collected from a number of
sources like market dues, fines and penalties and parking fees.Revenue receipts are
divided into tax revenue and non-tax revenue which include among others taxes on
properties. Business revenue is income from activities that are ordinary for a particular
corporation, company, partnership, or sole-proprietorship.The public sector entities,
including the counties Government appraise their legal status as the providers of the
public services and account for the public funds entrusted to them, but also to raise
sizeable amount from their own sources to support in the delivery of the public services.
The research objective of the study was to determine the relationship between
revenuemobilization and service delivery in local authorities in Kenya.
This research adopted a descriptive research design.The target population of this study
was175 local authorities.The sample size of the study was 35local authorities selected
using purposive sampling.The study was based on secondary data on revenue collection
and service delivery of the local authorities. The study considered performance ranking
for 10 years since the inception of performance contracting ranking in Kenya.The
inferential statistic multiple regression and correlation was carried out to determine the
relationship between revenue mobilization and performance.The study established that
there had been increase in revenue mobilization in the local authorities.
The higher the level of mobilized Revenue the better the performance of local authorities,
It was also established that the Local authorities with low levels of mobilized Revenue
performed dismally/poorly.The study concludes that local authorities budgeting greatly
influence revenue mobilization.The use of the budget to control local authorities‘ funds
and guard against over or under expenditure would be a critical element in
management.The study concluded that increased in central government transfer fund such
as LATF from the central government led to increase in efficiency service delivery.In
light of the findings and the need for local revenue mobilization to provide services in
local authorities since transfers from the central government were only to support the
budget of the local government to enable efficiency delivery of public services. Therefore
a lot of effort should be put in to ensure that local revenue collection and administration
is improved in local government to fully provide quality service efficiently to the
people.The study recommend that revenue collection in local government should be
privatized by giving out tenders to individuals or companies to collect revenues on behalf
of local government to reduce the increasing rate of tax defaulters and constituting
enforcement teams to check businesses that have failed to pay taxes and penalize them
accordingly to increased revenue mobilization.
v
TABLE OF CONTENT
DECLARATION................................................................................................................ i
ACKNOWLEDGEMENT ................................................................................................ ii
DEDICATION.................................................................................................................. iii
ABSTRACT ...................................................................................................................... iv
ABBREVIATIONS ........................................................................................................ viii
CHAPTER ONE: INTRODUCTION ............................................................................. 9
1.1 Background of the Study .......................................................................................... 9
1.1.1 Revenue Mobilization ...................................................................................... 11
1.1.2 The Concept of Performance ........................................................................... 12
1.1.3 Relationship between Revenue Mobilization and Service delivery ................ 15
1.1.4 Local Authorities in Kenya .............................................................................. 16
1.2 Research Problem ................................................................................................... 20
1.3 Research Objective ................................................................................................. 22
CHAPTER TWO: LITERATURE REVIEW .............................................................. 24
2.1 Introduction ............................................................................................................. 24
2.2 Theoretical Review ................................................................................................. 24
2.2.1 Efficiency and long-run growth ....................................................................... 24
2.2.2 Optimal theory of taxation ............................................................................... 26
2.2.4 The agency theory ............................................................................................ 27
2.3 Revenue Mobilization Practices ............................................................................. 29
2.3.1 Transfer from Central Government ................................................................. 29
2.3.2 Local authority revenue collection................................................................... 35
2.3.3 Budgeting Controls .......................................................................................... 39
2.4 Empirical Review.................................................................................................... 42
CHAPTER THREE: RESEARCH METHODOLOGY.............................................. 49
vi
3.1 Introduction ............................................................................................................. 49
3.2Reserach Design....................................................................................................... 49
3.3 Target Population .................................................................................................... 50
3.4 Sampling Methods .................................................................................................. 50
3.5 Data collection ........................................................................................................ 51
3.6 Data processing and analysis ................................................................................. 51
CHAPTER FOUR: DATA ANALYSIS, RESULTS AND DISCUSSION ................ 53
4.1 Introductions ........................................................................................................... 53
4.2 Revenue Mobilization ............................................................................................. 53
4.3 Relationship between Revenue Mobilization and Performance in Local Authorities
....................................................................................................................................... 55
CHAPTER FIVE: CONCLUSIONS, RECOMMENDATIONS AND
LIMITATIONS ............................................................................................................... 61
5.1 Introduction ........................................................................................................... 61
5.2 Summary of the findings ......................................................................................... 61
5.3 Conclusions ............................................................................................................. 63
5.4 Limitations of the Study.......................................................................................... 65
5.5 Recommendation of the Study ................................................................................ 65
5.6 Recommendation for Further Study........................................................................ 66
REFERENCES ................................................................................................................ 68
APPENDICE ................................................................................................................... 72
LIST OF TABLES

vii
Table 4. 1: Revenue mobilization Mean differences for 2002 to 2012 ............................ 53
Table 4. 2: Model Summary ............................................................................................. 55
Table 4. 3: ANOVA (b) .................................................................................................... 56
Table 4. 4: Coefficients (a) ............................................................................................... 57
viii
ABBREVIATIONS
CILOR - Contribution in lieu of Rates
GDP - Gross Domestic Product
LAIFOMS -Local Authority integrated financial Operations Management System
LATF -Local Authority Transfer Fund
LASDAP -Local Authority Service Delivery Action Plan
MOLG -Ministry of Local Government
RMLF -Road Maintenance Levy Fund
9
CHAPTER ONE
INTRODUCTION
1.1 Background of the Study
There is a global financial crisis and dwindling levels of aid(Norton,
2003). This underpins the importance of why the local authorities need
to put in place mechanisms to ensure that they are competitive enough
to attract the little donor funds. Holloway (2003) states that local
authorities have limited number range of resources. The greatest
dependence is very likely to be on foreign grants, and it is likely that
these funds which make up these grants come from central government.
Finally, building a constituency and creating viable and sustainable
organizations is important for local authorities, since resource
mobilization is not simply generating resources for survival from one
year to the next.
Building a constituency of supporters who can be persuaded to give
again and more generously therefore builds a viable, independent and
sustainable organization (Norton, 2003).In fact, the U.S. municipal
finance system recognizes this difference with two different types of
long term bonds: General Obligation Bonds that pledge all revenue
sources of the local government to repayment and Revenue Bonds that
pledge the revenues derived from a specific source (such as the water
tariff) to repay the bond. In Latin America, there are strong political ties
10
between central and local governments. Due to such extreme
politicization of local authorities, they are accountable more to the
ruling party than to the local masses affecting effective local
government resources mobilization (Horngen, Foster, and Datar, 2007).
For Local Authorities in Africa to provide the services required
adequately and efficiently, they will need to find new methods and ways
of mobilizing more revenues (Tibaijuka, 2005). Studies from South
Africa have shown that Kenyan Local Authorities have not been
vigorous in generating and collecting their own revenues (Tibaijuka,
2005). Some of the reasons given for not realizing adequate revenue
include lack of adequate human resources, non-compliance by the
residents to pay council dues and lack of goodwill by the government to
support. Local Authorities in realizing the uncollected revenues. Weak
by-laws and lack of appropriate financial strategies have also been cited
as contributing to the low revenue generation and collection (Republic
of Kenya, 2008)
In previous year when Local authorities existed in Kenya have been
operating without pressure of improving service delivery to their
customers which has led to Kenyan public to have poor perception of
the authorities. This situation necessitated reforms in county
government. Government of Kenya through Sessional paper No.2of
2005 on Development of micro and small Enterprises for Wealth
Creation for poverty reduction addresses licensing and regulation and
11
states that favorable and regulatory environment will be achieved
through consolidation of trade licensing requirements. This reduces cost
of acquiring licence and time entrepreneurs take to have licence.
Licensing structure will speed up licensing and cut down on
unnecessary red tape. Single Business Permit is also operationalized in
local authorities (GOK, 2010). It is on this background that KLGRP
have initiated the use of Local Authority integrated financial Operations
Management System (LAIFOMS) which require technical knowledge to
enable the council achieve maximum benefit from its implementation
because the system is capable of controlling all revenue in the Local
authority. Lack of knowledge in operations of LAIFOMS is impeding
factors in revenue collection in most local authorities in Kenya.
1.1.1 Revenue Mobilization
Local revenues is defined as subtotal of all categories collected from a
number of sources like market dues, fines and penalties and parking fees
(Republic of Kenya, 2008)
Strengthening revenue mobilization in developing countries has long
been a central concern of the Fund, and its advice has been highly
influential. In its program, surveillance and technical assistance (TA)
work, the Fund has for many years supported developing countries‘
efforts to build more effective and fairer tax systems (Houghton, 2005).
Though far from the only provider, the Fund has come to occupy a
12
leading role in advising on tax matters in these countries. Its advice has
been keenly felt by Fund members, closely watched by academics and
CSOs, and sometimes controversial (Sprinkel, 2005).
Interest in enhancing revenue mobilization in developing countries is
increasing. Most developing countries are emerging from the crisis with
their fiscal prospects broadly intact (IMF, 2010), but with many still
facing a fundamental need to raise more revenue from their own tax
bases (Westman, 2004). Achieving the Millennium Development Goals,
for instance, has been suggested to require increasing domestic revenues
in low-income countries (LICs) by around 4 percent of GDP (United
Nations, 2005). Infrastructure needs are also extensive (IMF, 2010a),
and there are climate challenges to address. Advanced economies are
increasingly focused on improving their support of these revenue
mobilization efforts. In this context the G-20 leaders called in
November 2010 for the Fund, with others, to report on key issues in
strengthening revenue mobilization (Westein, 2003)
1.1.2 The Concept of Performance
Service delivery is defined as the process of extending basic services
like education, healthcare, water, transport and communication where
the end users are the public or local people within the country (Ray,
2007). Tax administration refers to the process of administering taxes
like identifying the tax payers, assessing them and levying reasonable
13
taxes they are capable of paying.Service delivery is tied with
performance at the organizational level. It means fulfilling
organizational goals and objectives, especially in satisfying customer
needs, employee needs and the investor needs. This is only possible if
there is clear mutual (management and employee) understanding of the
purpose: At the heart of this concern was whether they are intended
primarily to benefit the organization or the individual (Heskett,
2006).Government ministries services delivery standards and
performance which are central to their mission have long been the
concern of customers and this has affected quality of service delivery.
Consequently delivery performance standards for Mail, Courier,
Financial and Agency services must be specific, measureable,
achievable,realistic and time bound of paramount importance is that the
meet the expectations of the customer on service delivery (Westman,
2004).
Service Delivery is a set of components that provide service delivery
architecture (such as service creation, session control and protocols) for
a type of service. Service delivery often requires integration of telecom
and IT capabilities and the provision of services that are unmatched in
the industry. Ross and Segal (2003) Service delivery available today in
the healthcare sector tend to be optimized for the delivery of a service in
modern technological innovations and expertise. Service delivery
programs are applicable to both the consumer and business applications.
14
The business objective of implementing the service delivery programs is
to enable rapid development and deployment of new converged
services, from basic services to complex services (Coyne, 2004).
Amir, Carolyn and Aman (1993) listed five determinants of service
quality by order of importance. They include reliability, responsiveness
(willingness to help customers and prompt service assurance), and the
ability to convey trust, empathy and individualized attention to
customers. Other service quality measurement tools studies have found
that well managed service companies have the following practices:
strategic concept and top management support, high standards of service
delivery, service monitoring systems, satisfying customer complaints
and emphasis on employee satisfaction (Anthonyand Young, 2004).
According to SERVEQUAL model based on gap theory, there are two
alternative ways of measuring service quality: internal and external
measures (Fjeldstad, Katera, Msami, and Ngalewa, 2010). Internal
measures of service quality are designed to provide objective measures
of the firm‘s performance where external is concerned with measuring
attitudes and opinions of customers. Provision of quality should exceed
customer‘s expectation. Customers compare perceived service. If the
perceived service is below expectation they loose interest with the
provider while the opposite creates loyalty (Blazek, 2005).
15
1.1.3 Relationship between Revenue Mobilization and Service
delivery
The spirit of decentralization is that local government should generally
be in a better position than the central government to identify local
needs, and to deliver public services accordingly (Brewer, Chandler and
Ferrell, 2006). Given this background, the county government is
enjoined to identify and raise revenue from local sources in form of
rates, tolls, property tax, fees and fines among others to boost their
financial base for development of the locality. In addition to the
Internally Generated Funds (IGFs), the county governments are
expected to fashion outprojects andprogrammes that allure to poverty
reduction in their local areas (Bray, 2008).
According to Bhatia (2006) revenue receipts are divided into tax
revenue and non-tax revenue which include among others taxes on
properties. Business revenue is income from activities that are ordinary
for a particular corporation, company, partnership, or sole-
proprietorship. Revenue is important part of financial analysis as it
contributes as part of measure to which assets inflow (income) compares
with asset outflows. In Government revenue refers to receivables by the
government for the purpose of financing its services, and the
implementation of development programmes and they are collectable
under the items of estimates specified by treasury as revenue items
16
including all amount of money received from sources outside the
government entity (Brooksons, 2002).
A strong local revenues base is essential for the sustainability of
decentralization programmes. Local revenue forms a core means of
building an independent and accountable local governance system
(Republic of Uganda, 2010). County Governments with strong local
revenue collection have greater scope for autonomy, and are more
responsive to the needs and priorities of their citizens. The Constitution
provides for various sources of local revenue to local governments
which vary from area to area-based on economic practices, natural
endowments, among other things (Waema, 2005).
1.1.4 Local Authorities in Kenya
Local authorities have two main sources of revenues namely, central
government transfers and local sources or ‗own revenues‘. Central
government grants include, Local AuthorityTransfer Fund (LATF),
Road Maintenance Levy Fund (RMLF) and Contribution in lieu of
Rates (CILOR). Local Authorities derive local revenues from property
rates, plot rent, single business permit, quarry, market, Bus Park and
change of user fees. The Kenyan local governance system is composed
of four tiers of Local Authorities (LAs), namely: Cities, Municipalities,
Towns and County Councils. These councils are corporate entities that
are established under the Local Government Act Chapter 265, which is

17
currently under review. In addition to the Act, the LAs draw their legal
powers from the Constitution of Kenya, other Acts of Parliament,
Ministerial Orders and By-Laws. Currently there are 175 LAs in Kenya
(appendix 1), which include City Councils, Municipal Councils, Town
Councils and County Councils with Ministry of Local Government as
the overall overseer of their operations (Waema, 2005).
Kenya has no decentralization policy that rationalizes power sharing,
responsibilities, and resources between the central government
ministries, district development committees, LAs and the private sector.
This has been a problem at the operational level, with most of the
institutions and organizations lacking synergy. Although the position of
LAs remains uncertain with the counties being formed after the adoption
of the New Constitution, LAs have an advantage since they already have
a participatory framework and are in touch with the locals in their
jurisdiction (Waema, 2005).
Kenya local government reform programme began with financial
reforms aimed at enhancing inter-governmental fiscal transfers,
improving financial management, debt resolution, streamlining
budgeting system and service provision capacity building for LAs. A
key instrument in this process was the enactment of the Local Authority
Transfer Fund (LATF) Act in 1998. The act provides five percent of
national income tax to LAs in line with population, resource base and
financial performance. In order for a council to access LATF, LAs are
18
administratively required to develop a Local Authority Service Delivery
Action Plan (LASDAP) using a participatory approach in identifying of
projects by council managements and the local and incorporating the
projects in the budgets (Odhiambo, 2005). All local authority budgets
usually went through a formal approval process through the full
council‘s adoption. Furthermore, budget in local authorities is public
document and is read to the public in a budget day each year set by the
minister of local government.
Other sources include sand, cattle and agricultural produce CESS among
others. Local government capacity in resource mobilization can be
strengthened throughthe establishment yet effective administrative
procedures, training technical assistance and dissemination Programs
with central government support. An appropriate information and
communication technology system is an essential precondition for the
success of any revenue mobilization strategy. A complicated and
nontransparent local government revenue system is costly to administer
and facilitates corruption and mismanagement (Odhiambo,2005).
Among the technologies that have proven to be effective are various
computerized system, satellite photography and Geographical Position
System (GPS) mapping systems for property registration, valuation and
electronic banking system for payment and accounting.
In accordance with the constitution of Kenya 2010, the country was sub
divided into 47 counties replacing the 8 provinces and the 175 local

19
authorities. The constitution requires that the former provincial
administration be structured through an act of parliament. The structure
for the county government is divided into two arms, that of the
executive headed by the Governor, Deputy Governor and 10 executive
members. The other arm is headed by the county Assembly Speaker,
clerk members of the county representatives (MCA) elected and
nominated member. The function of the executive is to provide services
to constituents of county. The county assembly provide supervisory
function for effective and efficiency provision of services. (Republic of
Kenya, 2010).
County Governments are responsible for various fuctions as outlined in
the constitution, one article 185, legislation of county laws, article 183
fouth schedule transfer function from national government. Other
functions can be agreed upon by the counties and national government
under article 189 (2) of the Constitution of Kenya. The establishment
and staffing of a public service under article 235 of the Constitution of
Kenya(Republic of Kenya, 2010) .
The sources of revenue for the county governments is divided into two
.One , the transfer from the National government as stipulated in the
constitution that not less than 15% of total revenue of the National
government must be transferred to the county governments. The other
way is the locally generated revenue as previously done by local
authorities. To understand the likely challenges that the county
20
government may undergo it is important to understand challenges that
affected the former Local authorities in revenue mobilization hence
service delivery. The county government has adapted structures and
financial systems that were previously used by local
authorities.(Republic of Kenya, 2010). Revenue allocation commission
was established by the constitution to advice on revenue sharing formula
between the National Government and also among the 47 counties
1.2 Research Problem
There are several important policy implications for donor and
governments. First, the prospects of taxing the informal sector require a
change in approach in how the informal sector and small firms are
viewed (Westein, 2005). Instead of viewing the sector as a ‗social safety
net‘, it is important to identify how the productive capacity of some
sectors can be enhanced. Second, the prospect of expanding the tax base
to the informal sector requires an explicit production strategy so that
firm owners have an incentive to register formally with the tax
authorities. Such incentives might include infrastructure investment,
marketing and distribution support and quality control regulations.
Third, micro credit schemes need to be part of a wider sectoral strategy
that involves technological upgrading. Micro credit for its own sake
generally creates low productivity firms (Rick, 2002).
21
Nowadays, majority ofthe public sector organizations have been highly
involved in the mobilization of their own revenue. This trend has been
largely attributed to the emergence of the various management reforms
introduced into the public sector organizations New Public Management
(NPM) and New Public Financial Management (NPFM) practices
(Hood and Lodge, 2004). The reforms, which in most cases advocate the
application of the business management practices into the public sector
organizations, have substantially changed the domain of the public
sector entities and put more emphasis on the delivery of public services.
As a result, the delivery of public services has been consistently
regarded by the policy makers to be important function of the public
sector entities in the context of the overall economic and social
development (Brooksons,2002).The public sector entities, including the
counties Government appraise their legal status as the providers of the
public services and account for the public funds entrusted to them, but
also to raise sizeable amount from their own sources to support in the
delivery of the public services.
Previous study focused on challenges facing revenue mobilization in the
public sector. For instance, Wanjohi, (2003)undertook a study
onModern Local Government in Kenya. Odhiambo, (2005) undertook a
study on management of Resources by Local Authorities. Past studies
have not determined relationship between revenue mobilizations and
22
service delivery in local authorities in Kenya. This study seeks to fill the
existing knowledge gap by establishing the relationship between
revenue mobilizations and service delivery in local authorities in Kenya.
The research seeks to answer the question, what is the relationship
between revenue mobilization and performance inlocal authorities in
Kenya?
1.3 Research Objective
The research objective of the study is todetermine the relationship
between revenuemobilization and service delivery in local authorities in
Kenya.
1.4 Value of the Study
The study is important to the Kenyan government and county
governments in formulating sound financial management strategies in
revenue mobilization. It may also be important to the government in
order to adopt policies to enforce financial discipline among county
governments. Therefore, this study is important to the devolved units of
governance for the following reasons. First, as a caution to the
newlyconstituted county units that they should never over rely on
unreliable sources of revenue from either donors or national
government. Second, to bring to the attention of the county
governments, the need to invest on their core competencies which varies
across the land of Kenya. Third, to improve the level of accountability

23
and democratic governance. It is expected that through the spirit of
corporate responsibility, the revenue earned is ploughed back to the
community to assist in service delivery such as the provision of
infrastructure, award of bursaries to the needy and meeting the cost of
capital projects.
Fourth, the study enlightencountygovernment todevelop techniques to
ensure a pool of resources is available to provide their services more
effectively and efficiently. It is also be significant to researchers and
other scholars as a background for reference in future studies and
contribute to the existing knowledge of literature.
24
CHAPTER TWO
LITERATURE REVIEW
2.1 Introduction
This chapter discusses issues that address each subsection derived
directly from research questions of the study. Recent research studies
and findings relating to the issues this study addresses will also be
highlighted.
2.2 Theoretical Review
2.2.1 Efficiency and long-run growth
The effects which theory suggests the level and composition of taxes
can have on efficiency and long-run growth—via investment, human
capital acquisition, and innovation have proved hard to identify
robustly. For OECD countries, Arnold (2008) concludes that property
taxes are least damaging for growth, followed by consumption taxes, the
personal income tax (PIT), and the corporate income tax (CIT): this is as
theory suggests, with taxation of capital income having a potentially
strong impact on investment. But there has been much less work for
developing countries, and what there is tends to find no significant
effect from either the overall level of taxation or the direct-indirect tax
mix (Adams and Bevan, 2005).
25
Evidence that trade liberalization fosters growth suggests a potential
impact from reduced reliance on trade tax revenue (Juul, 2006). Other
effects likely operate through the considerable volatility of tax revenue
in many developing countries (there being some evidence that this
depresses public investment. Ebeke and Ehrhart,(2010), stressing the
value of diversifying revenue sources. Distributional effectsare
important in themselves (poverty relief is a major motivation for raising
revenue in the first place) and for their impact on compliance .Two
points are critical in assessing these effects. First, what ultimately
matters is not the impact of any tax instrument in isolation, but the
combined impact of all such measures and of the spending they finance
(Chelogoy,Anyangoand Odembo, 2004). A regressive tax may be the
only way to finance strongly progressive public expenditure;
conversely, where the ability to target spending is relatively weak,
progressivity on the tax side is a greater concern. Second, those who
bear the real burden of any tax may not be those responsible for
remitting it to the government. To the extent that capital is
internationally mobile, for instance, a small country cannot affect the
after-tax return required by foreign investors: trying to do so will simply
reduce the income of immobile factors (Heady, 2002)
The study examined the applicability of several theories among them,
the overlapping Authority model propounded by Anthony, and Young,
(2004) on intergovernmental relationship. This theory states that public
26
revenues decentralization occurs when lower tiers of government have
statutory power to raise taxes and carry out spending activities within
specified legal criteria.
2.2.2 Optimal theory of taxation
The theory of optimal taxation can be seen as a recipe for minimizing
the costs of taxation. The costs on which this literature focuses are, as
already noted, the efficiency costs of a distorted tax system. But the
more direct costs of administration and compliance play little or no role
in the analyses, and the theories of tax evasion that will be discussed
below alert us to some of the important aspects of these costs (Fowler
James, 2002). So far, the potential gains from using the insights of the
tax evasion literature in the study of optimal taxation have not been fully
exploited, although for some aspects of taxation the evasion perspective
is obviously highly relevant. This is true, at least to some extent, with
respect to the degree of progressivity of the personal income tax, and
even more so with respect to the interface between personal and
company taxation and the degree of differentiation of the indirect tax
system. The literature on tax evasion should be seen as a way to bring
issues of tax administration into the focus of the theoretical literature on
tax design (Ghura, 2006).
The standard theory of optimal taxation posits that a tax system should
be chosen to maximize a social welfare function subject to a set of
27
constraints. The social welfare function is based on the utilities of
individuals in the societies REF, in its most general analyses; this
literature uses a social welfare function that is a nonlinear function of
individual utilities. Nonlinearity allows for a social planner who prefers,
for example, more equal distributions of utility (Graham, 2000). To
reduce the problem facing the revenue collection, it is often assumed
that everyone in society has the same preferences over, say,
consumption and leisure. Sometimes this homogeneity assumption is
taken one step further by assuming the economy is populated by
completely identical individuals. It is important to choose the tax system
that maximizes the representative consumer‘s welfare, knowing that the
consumer will respond to whatever incentives the tax system provides
(Hazel 2005).
2.2.4 The agency theory
In the Agency Theory a contractual relationship is entered by two
persons that is the principal and the agent so as to perform some service.
This involves delegating some decision making authority to the agent by
the principal (Jensen and Meckling, 1976). At the same time an agent is
a person employed for the purpose of bringing his principal into a
contractual relationship with a third party. He does not make a contract
on his own behalf. The legal doctrine which applies is ‗qui facit per
aliumfacit per se (he who does something through another does it
himself) (Kanbur, 2009).
28
Agency Theory is directed at the person presenting the agency
relationship. This is where one party delegates work to another party
who performs the duty on behalf of the principal: (Eisenhardt, 1989).
This person is authorized to perform legal acts within his competence
and not on his own behalf but for the principal. A growing view in the
modern literature recognized however that the two are strange bed
fellows. An Insurance Brokers is agent employed to buy and sell on
behalf of another. However, in performing his role, he owes a duty to
his principal. The level of care expected will vary; a higher level of care
will be expected from a professional broker than from a part-time
insurance agent (Wright and Oakes, 2002).
According to the English and American law the liability of a principle
for his agent torts in the ordinary course of his employment depends
upon the existence of a master servant relationship. The master is
vicariously liable for his servant tortuous conduct committed within the
course of employment. (Yin, 1989). There are cases where an agency
relationship arises when an individual group called principal hires
someone called an agent to perform some service, where the principal
delegates decision- making power to the agent. This kind of relation
includes those between stock holders and managers and between
stockholders and debt holder. According to Amir,(1993) Agency Theory

29
is a theory concerning the relationship between a principal (shareholder)
and an agent of the principal (company's managers). It further says that
Agency Theory is a very academic term which essentially involves the
costs of resolving conflicts between the principals and agents and
aligning interests of the two groups. The agency theory also adds up to
the list of theories examined. Jensen and Mechling,(2006) define the
agency relationship as a contractual relationship between `one or more
persons called the principal engaging another known as the agent to
perform some service on their behalf, which involve delegating decision
making authority on the agent. Citizens vote in councilors in local
authorities so that they further their agenda of policy making during
their term of office, after which they are retained or voted out.Other
agency relationship that exists include employee-employer where the
latter delegate responsibilities to the former for a certain fee (Venables,
2010).
2.3 Revenue Mobilization Practices
2.3.1 Transfer from Central Government
Local governments in developing countries derive their revenues from
two principal sources funds transferred to them from a higher level of
government, and funds collected and retained in the locality itself.
Funds coming from higher levels of government (national, regional,
and/or state/provincial) are referred to as transfer payments (Jeremy and
30
Fraser, 2003). The rules governing the flow of transfer payments are
part of the laws on intergovernmental fiscal relations. Transfer payments
are typically allocated from a specific revenue source that is controlled
by the higher level government (e.g. a national value added tax, income
tax, or oil revenues) (Blazek, 2005). Transfer payments may be
allocated downward on an established formula basis, or an ad hoc basis.
Transfer payments may be stable and predictable over time, or they may
vary substantially from year to year. Regardless of their characteristics,
transfer payments are not ―own source revenue‖ because they are not
under the direct control of the local government (Abonyo, 2003).
Funds collected and retained in the locality itself are the local
government‘s own source revenues. In developing countries, it is typical
to find that own source revenues are a small (or very small) portion of a
local government‘s total revenue. This can be due to a variety of factors
including: restrictions imposed from higher levels of government on the
types of revenue sources available to the local government and the rates
that can be charged; a history or culture of dependency in the
relationship of local government to higher levels; local politics that
oppose local revenue collection; poor revenue collection technology or
effort at the local level; and corruption. Whatever the combination of
causes, the result is that local government is usually over dependent on
transfer payments and less able to exercise decentralized leadership for
development (Venables, 2010)
31
The system of transfers plays a pivotal role in drawing together the other
elements of the intergovernmental fiscal system making up for the
vertical and horizontal gaps that own source revenues and revenue
sharing cannot meet, not undermining local tax effort, creating
incentives for externality generating spending that local
governmentswould not fund out of their own sources, not undermining
incentives for creditworthy municipalities to borrow, and so on. This all
requires a carefully executed structure of transfers, using different
instruments to pursue different objectives and making sure these
instruments do not work against each other (Khadingalaand Mitulla,
2004).
With the exception of a few countries, the current system of transfers to
local governments in Latin America lacks a clear orientation. Most
countries still have to introduce unconditional equalization grants that
incorporate in some formula-based measures of expenditure needs and
fiscal capacity. When some equalization elements are introduced into
the revenue sharing formulas, actual revenue collections are often used
instead of measures of tax capacity, thereby creating problems of
negative incentives for tax effort. The current approaches used to
incorporate differences in expenditure needs in the revenue sharing
formulas are also problematic (Thuronyi, 2001).
32
Historically the Latin American region has suffered some of the worst
incidences of fiscally irresponsible sub-national borrowing in the world.
The negative experiences of Brazil and Argentina, with uncontrolled
sub-national borrowing and hyperinflation during the 1980s and 1990s,
are still used as examples of what can go wrong in this area of sub-
national finance. One consequence of those experiences is that the
policy of some countries in the region towards local government
borrowing has become excessively conservative and restrictive. For
example, in Chile, local governments are in principle not allowed to
borrow or take out loans of any kind. But outright prohibitions are not
necessary or effective either. In the same country, indirect borrowing
through leasing contracts or by delaying the payment of current
expenditure makes that norm difficult to enforce. In Uruguay, any
domestic or foreign debt issue by local government needs to be
approved by the national congress. Peru also provides an example of
legislative conservatism in the matter of local borrowing: The central
government has established indebtedness rules to maintain fiscal
prudence by two laws (the Law on Fiscal Prudence and Transparency -
LPTF- and the Law on Fiscal Responsibility and Transparency – LRTF-
) Besides limits on debt service ratios and total debt the laws also limit
the rate of growth of municipal expenditures to a maximum of 3 percent
per year. However, this framework has not been fully enforced because
33
of insufficient monitoring and the lack of effective sanctions andmany
local governments in Peru carry large budgetary arrears.
A broaden tax base through tax policy reforms and mobilizing a
domestic resources is absolutely essential for sustaining poverty
reduction over the long run. The informal sector being effectively
immune from taxation, governments of developing countries have fewer
tax instruments than rich countries (Wallace, 1994). By imposing taxes
on some branches of the economy and not on others they create high
economic distortions. Economic growth is not a guarantee of poverty
reduction, unless we have a well-designed pro-poor tax policy in place
which helps to generate more income-earning opportunities so that poor
people can engage in productive and well-paid work (Bray, 2008). The
average taxation ratio of developed countries as a proportion of GDP lay
between 29 and 32%, whereas the corresponding range for developing
countries in the medium-income category was from 17 to 22%. The
average taxation ratio in the poorest countries lies between 13 and 16%.
The problem is a vast gap exists between the tax payments required by
law and those actually surrendered to the state. The taxation authorities
often inadequately staffed, institutionally weak and lacking in political
support - are not in a position to collect the amounts outstanding
(Robbins, 2005).
Taxes are a broad source of revenue that is not linked to any particular
service provided by local government. Local taxes vary from country to
34
country but typically include a Property Tax and sometimes one or more
Business Taxes and Consumption Taxes (Fowler, 2000). These taxes
may or may not vary with the value of the property, business or
economic activity. Fees are a revenue source directly associated with a
particular local government service such as registrations, permits, or
approvals. They are usually imposed on a per transaction basis, e.g. a
fee of a fixed amount to register a property/marriage/birth. They can
also be things like school fees or clinic fees, (if these services are run by
local government) where the fee is based on a transaction such as
provision of a semester of schooling, or a visit to a clinic (Graham,
2000). User charges are another revenue source linked to specific
services, but unlike most fees, user charges typically vary with the
amount of service consumed, e.g. a consumer‘s water bill will vary with
the volume of water used. In some cases, user charges will vary
according to the type of consumer, e.g. charges for garbage collection
may be different for residential, commercial, and industrial
establishments (Heady, 2002).
A survey by Thuronyi (2000),reveals that uneven tax administration in
Africa is a major contribution to revenue shortfalls that augment
inflationary pressure while depriving governments‘ resources with
which to provide public goods. Uneven tax administration also
stimulates resort to more easily collected taxes on foreign trade with
associated efficiency loss.Wadhawan and Gray, (2001) noted that
35
theoretical and empirical research on why persons subject to tax comply
or fail to comply with their legal liabilities has been pursued by social
scientists from various disciplines. The direct benefit of successful tax
evasion is obvious, it is the value of the payments evaded, comprising
their resources thereby saved. Drowning from reference group theory
(Greene, 2008) attribute tax evasion to a norm neutralization process
that is tax evaders justifying their cheating by the belief that everyone
else does the same thing and or the benefit they receive from
government fall below their share of the tax burden (Holloway, 2003).
The first step toward increasing revenue from any source is to analyze
current collections and identify the reasons why the local government
may be receiving less revenue than they should from the source (Norton,
2003). Improving property registration and updating tax rolls (cadasters)
is a time consuming, but high revenue impact activity. To increase
revenues from local fees/user charges, there are several possibilities
increase the billable use of the service, assure that users are billed fully,
and all billings are collected and Increase the level of fees or user
charges for the service (Harrison, 2008).
2.3.2Local authority revenue collection
If increasing own source revenues does not seem to be a particularly
easy thing to do, reducing expenditures is also difficult. Local
government budgets are always tight. Local leaders have more ideas
36
about things they would like to do than resources to do them. At the
same time, it may be easier to undertake politically difficult measures to
increase own source revenues if local leaders can simultaneously
demonstrate that they are bringing their expenditures under control by
seriously seeking ways to economize (Abonyo, 2003). Certainly,
investors that are considering lending money to a local government will
want to see evidence of fiscal responsibility, and successfully reducing
expenditures is the gold standard for fiscal responsibility (Abonyo,
2003).
Local government spending can be classified into two basic types of
expenditures. Discretionary and Non-discretionary. As the names imply,
discretionary expenditures are those that are not absolutely required to
be made during a budget year, while non-discretionary expenditures are
those that must be made. Starting with the latter, non-discretionary
expenditures normally involve some kind of legally binding
commitment upon the local government. Such commitments include
loan or bond repayment schedules. Employment contracts with existing
local government staff, either through individual contracts or general
rules of employment and compensation (Hazel, 2005)
User charges for utilities such as power, water, and telecommunications
(normally based on the same utilization rate as in the previous
year).Rental or lease agreements for facilities or equipment if it is not
possible to terminate the agreements within the budget year; and
37
contracts with outside service providers such as consultants and
construction contractors if it is not possible to terminate them within the
budget year. There could be others depending on the specific situation
of the local government, but these are the major non-discretionary
expenditure headings (Wallace, 1994).
Discretionary expenditures can be much more diverse. In essence, they
are expenditures for anything that is not absolutely essential to the
operations of the local government. Obviously, the line between
discretionary and non-discretionary is blurry since it can change as local
policy changes (Klein, 2004). For simplicity, discretionary expenditures
are essentially any expenditure not covered by the five bullets in the
paragraph above. Of course changing circumstances may make it
essential to hire additional staff, or use more electricity, or rent another
dump truck, but the best estimate of discretionary expenditures in any
given year is to subtract the non-discretionary items listed above from
total expenditures (Khadingalaand Mitulla, 2004).
Controlling discretionary spending is the obvious first target for
reducing overall expenditures. In any given year, it is likely that a local
government is doing some amount of discretionary spending, i.e. more
than is required by binding legal commitments. Nevertheless, it is not
easy to cut back on expenditures that have a history and a constituency
that presumes continuation. In cases where there has been an increase in
revenues (either own source or transfers), it is somewhat easier to avoid
38
increasing discretionary expenditures, or at least increasing them less
than the increase in revenue. Whether restraining increases or actually
reducing expenditures, it is essential that local political leaders consult
widely with key stakeholders and constituents to explain the reasons for
their fiscal restraint, understand concerns, and reach broad consensus on
these measures (Gordon, 2010). This is much easier to do if the budget
preparation and approval process is participatory by design. Through
technical assistance USAID can play a role by helping local
governments develop and apply participatory budgeting processes
which are common in U.S. local governments (Odhiambo, 2005).
Participatory budgeting is also important in order to create support for
reductions in non-discretionary expenditures over time. While these
expenditures are based on legally binding commitments, there are areas
where economies may be achieved. Among the easiest are savings on
utilities. It may be possible to reduce the local government‘s electricity
bill by installing more energy efficient street lighting and water pumps.
It may be possible to reduce water bills through water use awareness
campaigns and repair of municipal taps, toilets, and standpipes to reduce
wastage. Debt service expenditures should also be scrutinized. It may be
possible to reduce debt service costs if they can be refinanced at lower
interest rates. In the longer term, it may be possible to restrain the
growth of local government staff levels (or even reduce them through
attrition) and avoid growing lease expenses by using equipment more
39
efficiently (Njambi, 2003). By creating incentives for cost conscious
management of personnel and equipment, local government leaders can,
over time, reduce the level of nondiscretionary expenditure below the
level that would have otherwise prevailed. However, it is often
necessary to make investments debt refinancing charges, energy
efficient measures, or water awareness campaigns) in order to achieve
savings. USAID can help local governments with analytic support to
examine the tradeoffs between businesses as usual and making strategic,
cost saving investments (Kiddand William, 2006).
2.3.3 BudgetingControls
Budgets provide managers and trustees with the tools to achieve their
monetary objectives(Fowler, 2004). The planning process culminates in
budgets, which is the commencement of a good management system
(Kubasu, 2003). Many local governments in Kenya lack sound
budgeting processes, both at the organizational level and within
programs. The use of the budget to control funds and guard against over
or under expenditure is a critical element in management. Jeremy and
Fraser (2003) state that a good budget must be realistic taking into
account, past experience prevailing circumstances and forecasts of the
future. Accounting information is an important tool in decision-making
and resource allocation. It follows that proper management of the
organization cannot take place in a situation where financial transactions
are not kept track and reported accurately.
40
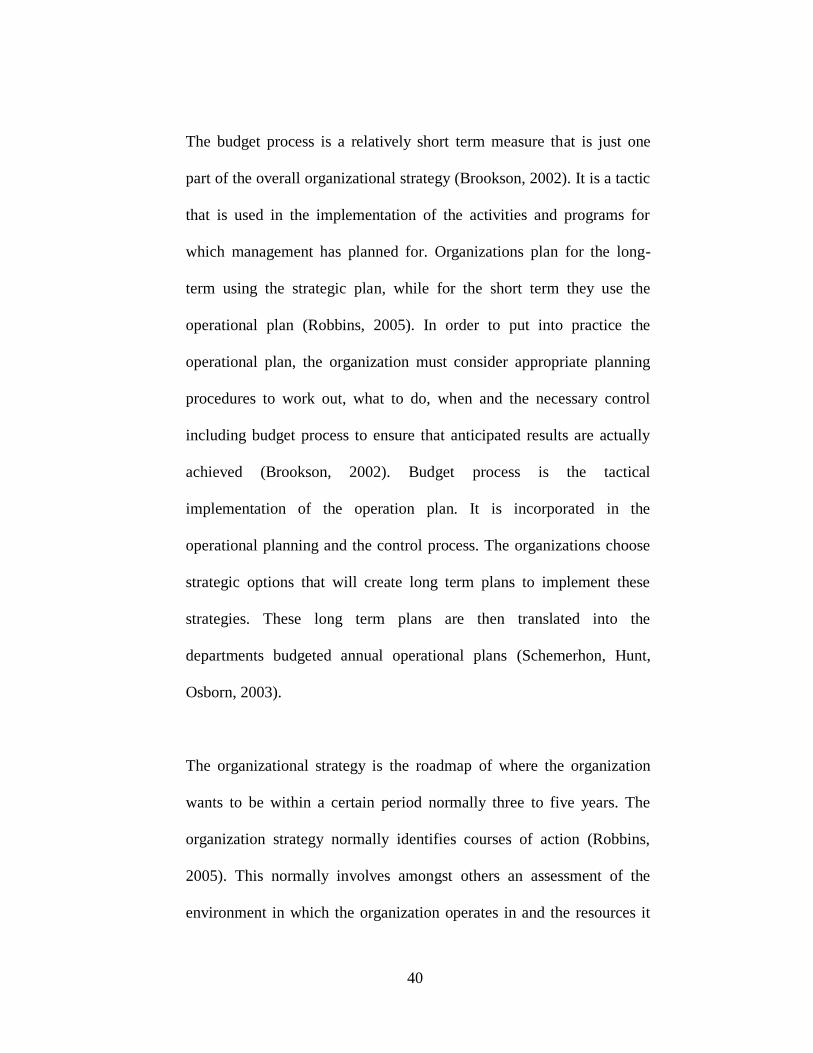
The budget process is a relatively short term measure that is just one
part of the overall organizational strategy (Brookson, 2002). It is a tactic
that is used in the implementation of the activities and programs for
which management has planned for. Organizations plan for the long-
term using the strategic plan, while for the short term they use the
operational plan (Robbins, 2005). In order to put into practice the
operational plan, the organization must consider appropriate planning
procedures to work out, what to do, when and the necessary control
including budget process to ensure that anticipated results are actually
achieved (Brookson, 2002). Budget process is the tactical
implementation of the operation plan. It is incorporated in the
operational planning and the control process. The organizations choose
strategic options that will create long term plans to implement these
strategies. These long term plans are then translated into the
departments budgeted annual operational plans (Schemerhon, Hunt,
Osborn, 2003).
The organizational strategy is the roadmap of where the organization
wants to be within a certain period normally three to five years. The
organization strategy normally identifies courses of action (Robbins,
2005). This normally involves amongst others an assessment of the
environment in which the organization operates in and the resources it
41
provides. An organization has the responsibility to review its mission
statement, its specific goals and activities for achieving the mission.
Antony et al (2004), states that given this specific plan of action, the
organization must then evaluate the market for the coming year. Staff
and board members must participate in each phase of the budgeting
process that affects the line items for which they will later be
responsible. For too many Local authority‘s, planning and financial
management are activities that divide rather than unite the organization
(Bowman, 2003).
Monitoring of the budgets through variance analysis would help in
translating abstract goals into controllable parts. It will also facilitate
coordination and cooperation between the various programs and
financial departments. The budget, once adopted, is used by the staff as
a management tool to gauge operational performance. Updating of
budgets when situations change enhances its value as a monitoring
system. Periodic budget comparison to actual financial performance can
help reveal problems and should allow the board and staff to respond
quickly to changing financial conditions. This provides a measurement
of financial performance in relation to the NGO‘s expectations
(Bowman, 2003).
42
In addition, the budget should provide indicators for gauging staff
performance and give staff goals to reach and steps to achieve them.
Methodical tracking and classification of program expenditures enhance
management‘s ability to report on service efforts and accomplishments
(Bowman, 2003). Both operating decisions and financing decisions
must be monitored closely. Operating decisions focus on the acquisition
and use of scarce resources. Financing decisions focus on how to get the
funds to acquire resources. On the other hand, there is a natural
tendency to emphasize cost control because of uncertainty; the presence
of such controls can at times stifle creative responses to a change in
demand for an organization‘s services Antony et al, 2004). The board
and senior staff should provide leadership as to the usefulness and
flexibility of the budget. The budgeting process and the subsequent use
of the budget as a touch point for financial performance should not
overshadow the ability of an organization to respond to the pace of rapid
societal change (Blazek, 2006).
2.4 Empirical Review
Alam, Noore, Nastiti, and Nur(2012), carried out a study on
relationship betweenRegional Autonomy and Local Resource
Mobilization in Eastern Indonesia. This paper addresses this question by
focusing on Indonesia's most recent decentralization policy and
assessing and analysing the role of local government‘s resource
43
mobilization on service delivery. Fiscal decentralization empowers sub-
national governments to raise sufficient revenue from local sources
thereby reducing their dependence on the national government? Based
on data collected from two different locations in Eastern Indonesia the
study shows that the dependency of local authorities on central
government is excessive and that the share of local revenue in regional
budget has remained rather small. It also shows that while the fiscal
power granted to local governments is limited, a combination of
politico-economic and contextual factors has further undermined the
prospect of revenue mobilisation at the local level.
Previous studies carried out, for instance by Juul, (2006)on
decentralization, local taxation and citizenship in Senegal, focused on
the politics of revenue collection in a framework of decentralization,
democratization and multiparty politics as experienced in the small
village of Barkedji in the pastoral region of Senegal. In Senegal,
revenue collection has recently been transferred from state
administrators to locally elected councilors. Contrary to the assumption
of the good governance doctrine, this transfer of responsibility has not
resulted in a strengthening of democratic structures where taxpayers
demand (and gain) public services and more political representation in
exchange for increasing taxes. In Barkedji, as elsewhere in Senegal, tax-
compliance hit rock-bottom after tax collection became the
responsibility of local councilors. Meanwhile other types of local
44
institutions, with less clear state relations, are able to mobilize large
amounts of revenue outside the normal tax channels for the delivery
service.
A Study carried out by Brooksons, (2002)on the impact of Local
Government Finances and Financial Management in Tanzania.
Thisstudy examined the capacity of local government authorities in
Tanzania with respect to financial management and revenue
enhancement, and analyses trends in financial accountability and
efficiency for the period 2000-2006/7. The study covered six councils in
Tanzania: Bagamoyo District Council, Illala Municipal Council, Iringa
DC, Kilosa DC, Moshi DC, and Mwanza City Council. Data was
collected using a combination of quantitative and qualitative methods,
including two rounds of a survey of citizens‘ perceptions in the case
councils in 2003 and 2006. Theysought to determine the degree of fiscal
autonomy; methods of revenue collection, financial management,
including budgeting, accounting and auditing, transparency in fiscal and
financial affairsand tax compliance and fiscal corruption. Based on
evidence collected, the study concludes that the process of
decentralization by devolution under the Local Government Reform
Programme has contributed to improving local government capacity for
financial management. The study found that the reforms had reduced the
fiscal autonomy of local government authorities. The central
governments currently contribute the bulk of local government revenues
45
through transfers and still largely determine local budget priorities and
enhance provision of service in local areas (Blazek, 2005)
Official registration is simply beyond the reach of poor entrepreneurs.
This research summarizes the various approaches used in developing
countries in their public sector reform proposals and will explore to
what extent similar institutional controls and incentives could be
established in emerging economy. It focuses on restructuring tax
policies and resources mobilization frameworks and decision-making
which takes place within these frameworks. The Government of
developing countries should take significant steps to strengthen the
framework for sound fiscal policies particularly, on tax reforms which
constitute the major policy instrument needed to accelerate growth and
eliminate poverty and promoting a better tax system to mobilize more
revenue(Davis, Rolando and Annalisa, 2003).
It is possible to achieve considerable improvement in tax administration,
policies have to go beyond the purely economic to focus on the needs of
the poor-to ensure minimum social standards and universal access to
basic social services with less complicity but effective. Reducing the
number of income tax deductions, for instance, permitted in some of
these countries to eliminate filing requirements for most wage earners,
thus greatly reducing the administrative burden, since withholding alone
then will be sufficient to enable most income taxpayers to fulfill their
obligations(Juul, 2006). There is no single set of direction that, once
46
introduced, will ensure improved tax administration in any country.
Developing countries exhibit a wide variety of tax compliance levels,
reflecting not only the effectiveness of their tax administrations but also
taxpayer attitudes toward taxation and government in general and the
value attached to government activities. Government policies affecting
any of these factors may thus influence taxpayer attitudes and hence the
observed level of taxpayer compliance (Kloeden, 2000).
The key to successful public finance management is a matter of
governance to balance the economic, managerial and political roles of
public finances. When fiscal governance is poor has a little chance of
succeeding the fiscal policy objectives. The Government will also
pursue comprehensive civil service reforms aimed at improving the
efficiency of delivery and quality of public services, improving taxation
through payroll management and enhancing a regular auditing to create
a further fiscal space. It is viewed that in most emerging economies
fiscal governance is reflected only in how deep a country can cut into its
fiscal deficit, rather promoting a better tax system to mobilize more
revenue to prevent it (IMF, 2008).
The first level concern is to design the general legal framework - not
only how the tax laws to be administered but also a wide range of
important procedural features. Once this general structural tax reform is
designed, the administrators take over and set up the specific
organizational structure and operating rules for the tax administration.
47
Finally, once the critical institutional infrastructure has been upgraded,
the tax managers actually can do their jobs efficiently and let alone
suggest how to improve it within which it has been equipped. The only
way to secure that taxpayers receive real value for their money is when
the government established a long term goal through investment and tax
reform. Strong and dependable public services are vital to extend the
economic growth, tackle social exclusion and improve people‘s quality
of life (Alam,Noore, Dian and Nur, 2012). Investment and tax reforms
will encourage the foundations for a stronger and more productive
economy. As emphasized above, an important element in any successful
administrative reform is simplicity and enforceable laws to administer.
In addition, it is equally important to simplify procedures for taxpayers,
for example, by eliminating demands for unnecessary information in tax
returns and payment invoices. Once procedures are simplified, the tax
administration can then concentrate on its main tasks: facilitating
compliance, monitoring compliance and dealing with non-compliance.
The job is particularly difficult in developing countries with large
informal sector, low levels (Davis, Rolando and Annalisa, 2003).
2.5Summary of the Literature
The allocation issue relates to whether a grant system alters the level
and uses of local government fiscal resources relating to what they -
would have been in the absence of the grant. Three specific questions
generally arise does the grant make local government less accountable
48
thereby encouraging less efficient operation, are local budgetary choices
altered due to the grant; and does the grant discourage localities from
mobilizing resources of their own (Sprinkel, 2005). When local
governments are not penalized for inefficient operations nor rewarded
for improvements, there is no incentive for efficient local administration
(Harrison, 2008). Full cost reimbursement grants for example, are
especially likely to thwart efficient operation since all local spending
will be borne by the central government Treasury. Local governments
are not responsible to either the central government or to their own tax
payers (Rick, 2002).
Therefore there is need to carry out the study with an attention of tracing
the loopholes in revenue collections in relation to service delivery in the
counties. So the local people should be satisfied on the importance of
paying taxes so that it becomes easy to collect the revenues from them
without resistance. It has also helped the researcher to define terms like
local revenue, service delivery, revenue collection which all surface in
literature review.
49
CHAPTER THREE
RESEARCH METHODOLOGY
3.1 Introduction
This chapter presented the research design and methodology that was
used to carry out the research. It presented the research design, the
population, sampling, data collection and data analysis
3.2Reserach Design
This research adopted a descriptive research design. The design is
deemed appropriate because the main interest is to explore the viable
relationship and describe how the factors support matters under
investigation. Descriptive design method provided quantitative data
from cross section of the chosen population. According to Mugenda
and Mugenda (2003) the descriptive research collects data in order to
answer questions concerning the current status of the subject under
study.
Descriptive Research is the investigation in which quantity data was
collected and analyzed in order to describe the specific phenomenon in
its current trends, current events and linkages between different factors
at the current time. Causal research design was chosen because it
enabled the researcher to generalize the findings to a larger population.
50
3.3 Target Population
According to Ngechu, (2004) a population is a well-defined or set of
people, services, elements, and events, group of things or households
that are being investigated. This definition ensures that population of
interest is homogeneous. The term population, the researcher means
complete census of the sampling frames. Population studies also called
census are more representative because everyone has equal chance to be
included in the final sample that is drawn according to Mugenda and
Mugenda (1999).The target population of this studywas175 local
authorities (Appendix 1) in Kenya.
3.4 Sampling Methods
The sample size of the study was 35local authorities. The sampling
method chosen for this study waspurposive sampling which is a form of
non-probability sampling to select 35 local authorities in Rift Valley.
Purposive sampling involves a deliberate selection of particular units of
population to constitute a sample representing the population (Kothari,
2004). In terms of this study, purposive sampling waschosen for
convenience purposes.
51
3.5 Data collection
The study used secondary data on revenue collection and service
delivery of the local authorities. The study considered performance
ranking for 10 years since the inception of performance contracting
ranking in Kenya. Secondary data refers to the information obtained
from articles, books, newspapers, internet and magazines.
Secondarydatawas collected from the county financial reporting books.
3.6 Data processing and analysis
This included analysis of data to summarize the essential features and
relationships of the data in order to generalize from the analysis to
determine patterns of behaviour and particular outcomes. Data
wasgrouped into frequency distribution to indicate variable values and
number of occurrences in terms of ranking in performance.
The inferential statistic multiple regression and correlation was carried
out to determine the relationship between revenue mobilization and
performance. Correlation analysis was used to establish the strength of
the relationship between variable. The regression modeltreats revenue
mobilization as independent variables while service delivery in the
county as dependent variable.
Y = α + β1X1 + β2X2+ β3X3+ β4X4+ ẹ
Where
52
Y=Local authority Performance (Measured in terms of efficiency
service delivery)
α = Constant Term
β1= Beta coefficients
X1= Budget Controls
X2=Borrowing Funds
X3=Local authority revenue collection
X4= Transfer from central government
ẹ = Error Term
The performance in service delivery was measured interms of efficiency
which is a ratio of revenue collected versus the ranking
performance.Taxation was measured by use of estimates elasticity( tax-
to-base and base-to-income) for each tax and forthe overall tax system.
Budgeting was measured by use of budget estimates of the discretionary
change (s) in the t year. The local government borrowing was measured
by ration of local government debt and total capital expenditure.
53
CHAPTER FOUR:
4.0 DATA ANALYSIS, RESULTS AND DISCUSSION
4.1 Introductions
This chapter presents the data analysis, presentation and interpretation
of the study, the study analyzed the relationship between revenue
mobilization and performance in local authorities.
4.2 Revenue Mobilization
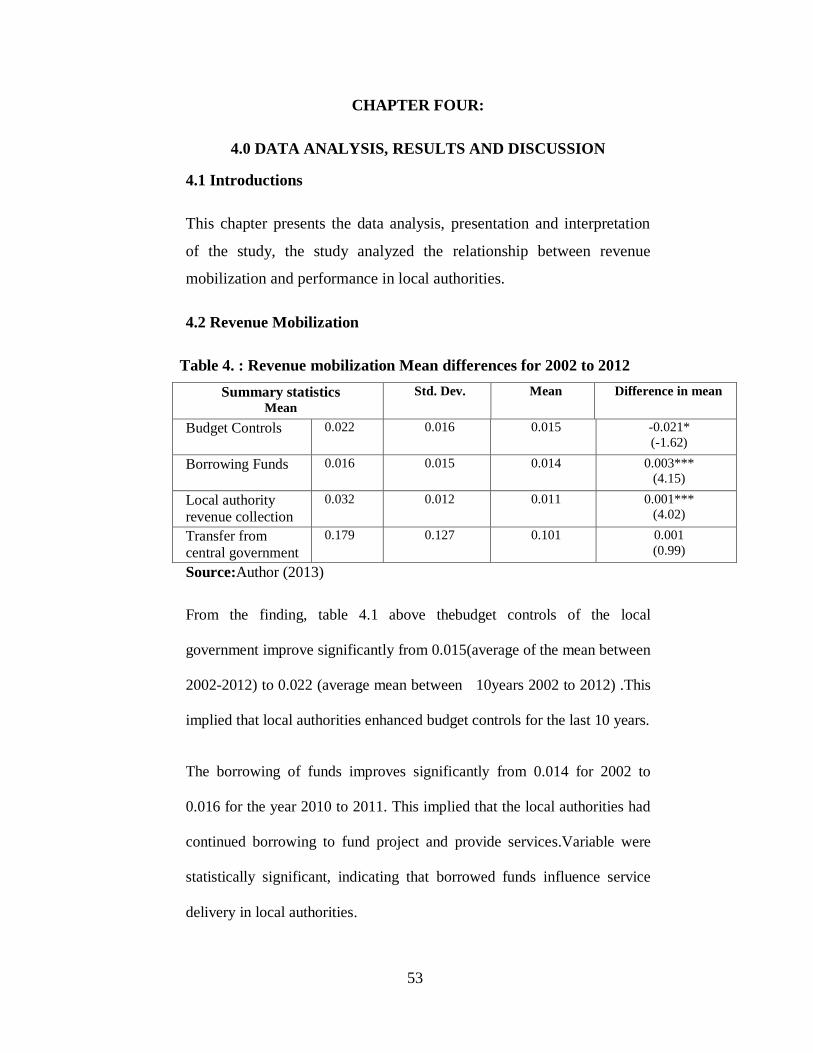
Table 4. : Revenue mobilization Mean differences for 2002 to 2012
Summary statistics Mean
Std. Dev. Mean
Difference in mean
Budget Controls 0.022 0.016 0.015 -0.021*
(-1.62)
Borrowing Funds 0.016 0.015 0.014 0.003***
(4.15)
Local authority
revenue collection
0.032 0.012 0.011 0.001***
(4.02)
Transfer from
central government
0.179 0.127 0.101 0.001
(0.99)
Source:Author (2013)
From the finding, table 4.1 above thebudget controls of the local
government improve significantly from 0.015(average of the mean between
2002-2012) to 0.022 (average mean between 10years 2002 to 2012) .This
implied that local authorities enhanced budget controls for the last 10 years.
The borrowing of funds improves significantly from 0.014 for 2002 to
0.016 for the year 2010 to 2011. This implied that the local authorities had
continued borrowing to fund project and provide services.Variable were
statistically significant, indicating that borrowed funds influence service
delivery in local authorities.
54
The study found that there was significant improvement on local authority
revenue collectionfor the local authorities was at 0.011 for the period of
2002and 2012 to 0.032.The study found that there was significant
improvement of local authority revenue collection0.001<p< 0.005.This
clearly indicated that there had been significant increase in Local authority
revenue collection for the period of 2002 to 2012. This implied that the
local government had devised strategies to collect revenue such as
service charges, business fee, and payment of salaries and effectively
fund collection practices. The findings concur with Chikati, (1999) who
indicated local revenue collection included, business registration fees,
waivers, interest rate, land rates, water services charge and other bills.
The study found that transfer from the central government had improves
significantly from 0.0101 for 2002 to 0.179for the year 2012. This implied
that the local authorities had continued receiving fund from the central
government to enhance service delivery. The findings were statistically
significant, indicating that transfers from central government had increased
over the years from 2002 to 2012.The findings concurred with Blazek,
(2005) who indicated thatlocal governments in developing countries
derive their revenues from two principal sources 1) funds transferred to
them from a higher level of government referred to as transfer payments
2) funds generated locally such as vehicle parking fees.
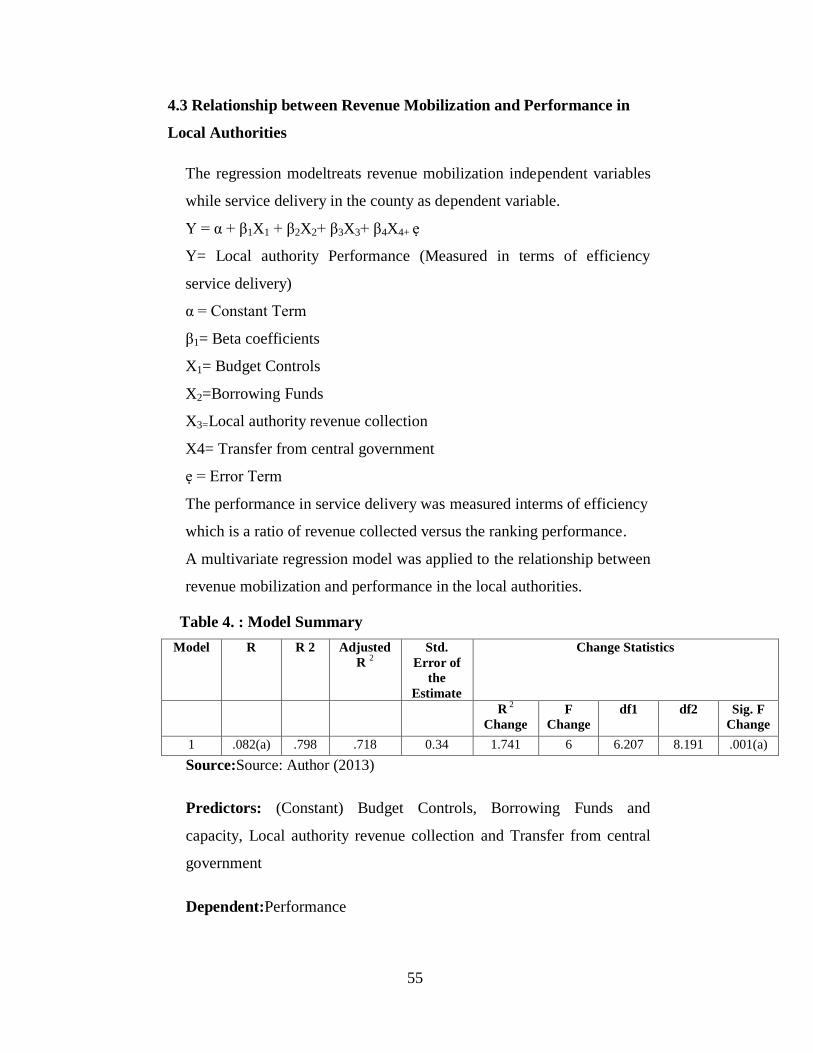
55
4.3 Relationship between Revenue Mobilization and Performance in
Local Authorities
The regression modeltreats revenue mobilization independent variables
while service delivery in the county as dependent variable.
Y = α + β1X1 + β2X2+ β3X3+ β4X4+ ẹ
Y= Local authority Performance (Measured in terms of efficiency
service delivery)
α = Constant Term
β1= Beta coefficients
X1= Budget Controls
X2=Borrowing Funds
X3=Local authority revenue collection
X4= Transfer from central government
ẹ = Error Term
The performance in service delivery was measured interms of efficiency
which is a ratio of revenue collected versus the ranking performance.
A multivariate regression model was applied to the relationship between
revenue mobilization and performance in the local authorities.
Table 4. : Model Summary
Model R R 2 Adjusted
R 2
Std.
Error of
the
Estimate
Change Statistics
R 2
Change
F
Change
df1 df2 Sig. F
Change
1 .082(a) .798 .718 0.34 1.741 6 6.207 8.191 .001(a)
Source:Source: Author (2013)
Predictors: (Constant) Budget Controls, Borrowing Funds and
capacity, Local authority revenue collection and Transfer from central
government
Dependent:Performance
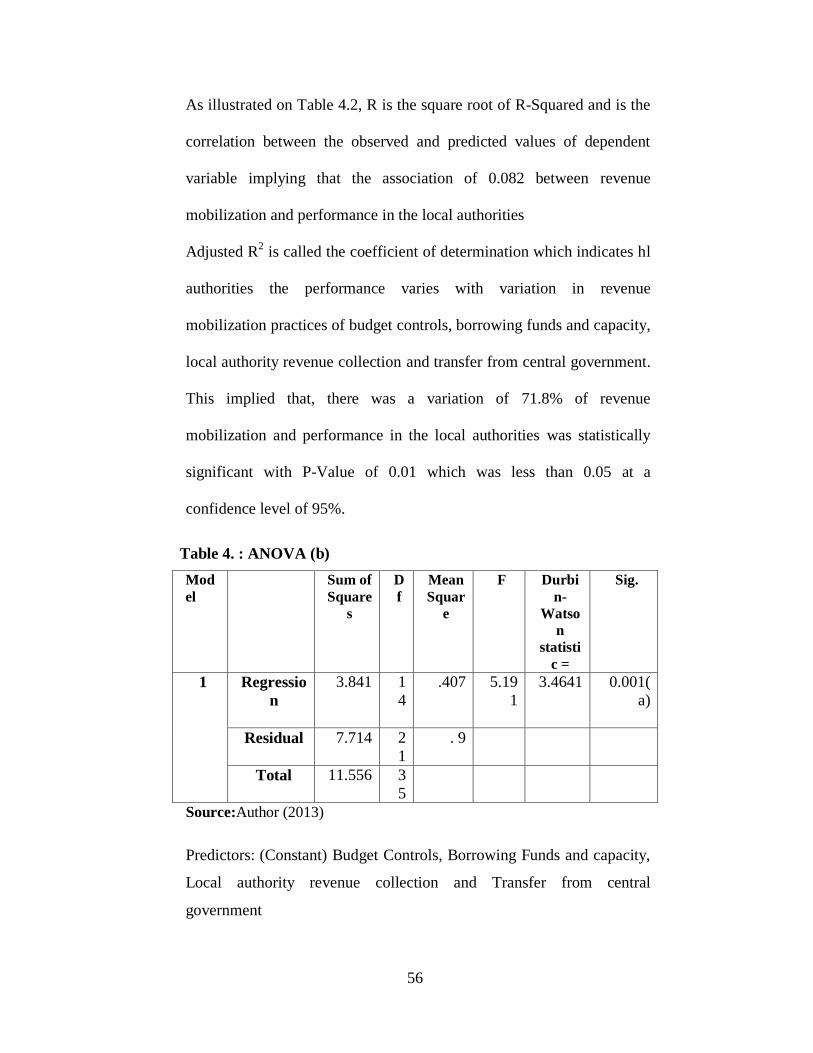
56
As illustrated on Table 4.2, R is the square root of R-Squared and is the
correlation between the observed and predicted values of dependent
variable implying that the association of 0.082 between revenue
mobilization and performance in the local authorities
Adjusted R2 is called the coefficient of determination which indicates hl
authorities the performance varies with variation in revenue
mobilization practices of budget controls, borrowing funds and capacity,
local authority revenue collection and transfer from central government.
This implied that, there was a variation of 71.8% of revenue
mobilization and performance in the local authorities was statistically
significant with P-Value of 0.01 which was less than 0.05 at a
confidence level of 95%.
Table 4. : ANOVA (b)
Mod
el
Sum of
Square
s
D
f
Mean
Squar
e
F Durbi
n-
Watso
n
statisti
c =
Sig.
1 Regressio
n
3.841 1
4
.407 5.19
1
3.4641 0.001(
a)
Residual 7.714 2
1
. 9
Total 11.556 3
5
Source:Author (2013)
Predictors: (Constant) Budget Controls, Borrowing Funds and capacity,
Local authority revenue collection and Transfer from central
government
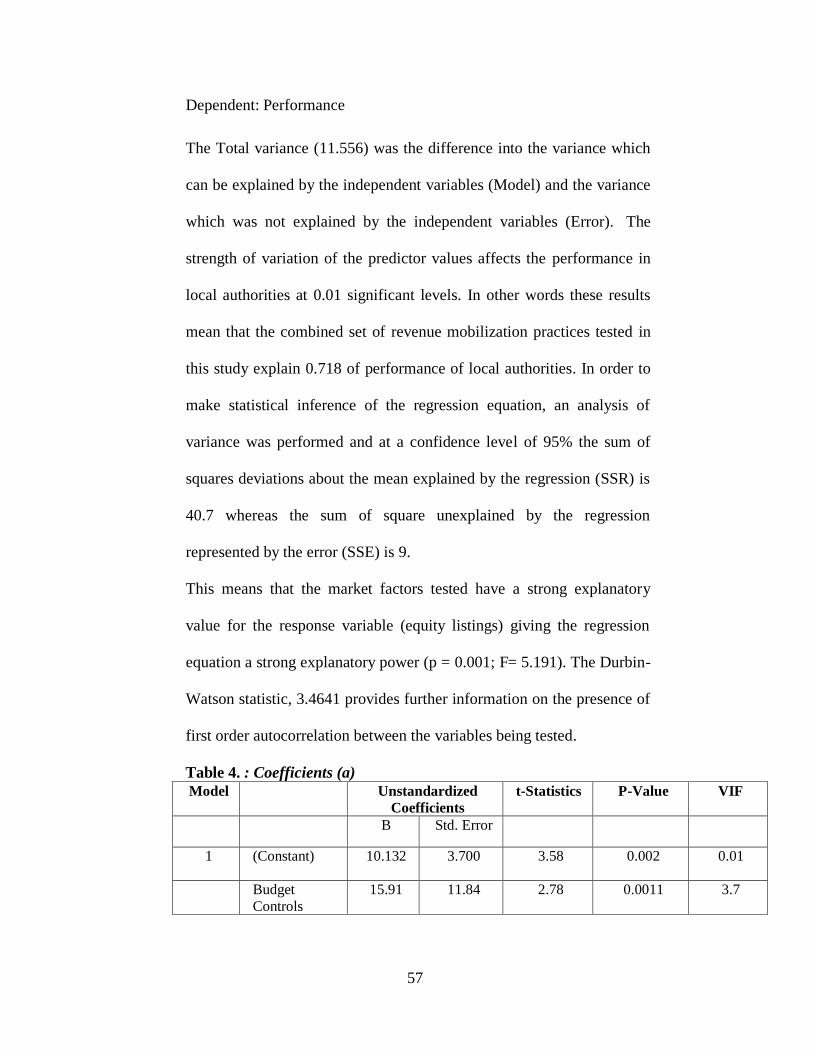
57
Dependent: Performance
The Total variance (11.556) was the difference into the variance which
can be explained by the independent variables (Model) and the variance
which was not explained by the independent variables (Error). The
strength of variation of the predictor values affects the performance in
local authorities at 0.01 significant levels. In other words these results
mean that the combined set of revenue mobilization practices tested in
this study explain 0.718 of performance of local authorities. In order to
make statistical inference of the regression equation, an analysis of
variance was performed and at a confidence level of 95% the sum of
squares deviations about the mean explained by the regression (SSR) is
40.7 whereas the sum of square unexplained by the regression
represented by the error (SSE) is 9.
This means that the market factors tested have a strong explanatory
value for the response variable (equity listings) giving the regression
equation a strong explanatory power (p = 0.001; F= 5.191). The Durbin-
Watson statistic, 3.4641 provides further information on the presence of
first order autocorrelation between the variables being tested.
Table 4. : Coefficients (a) Model Unstandardized
Coefficients
t-Statistics P-Value VIF
B Std. Error
1 (Constant) 10.132 3.700 3.58 0.002 0.01
Budget
Controls
15.91 11.84 2.78 0.0011 3.7
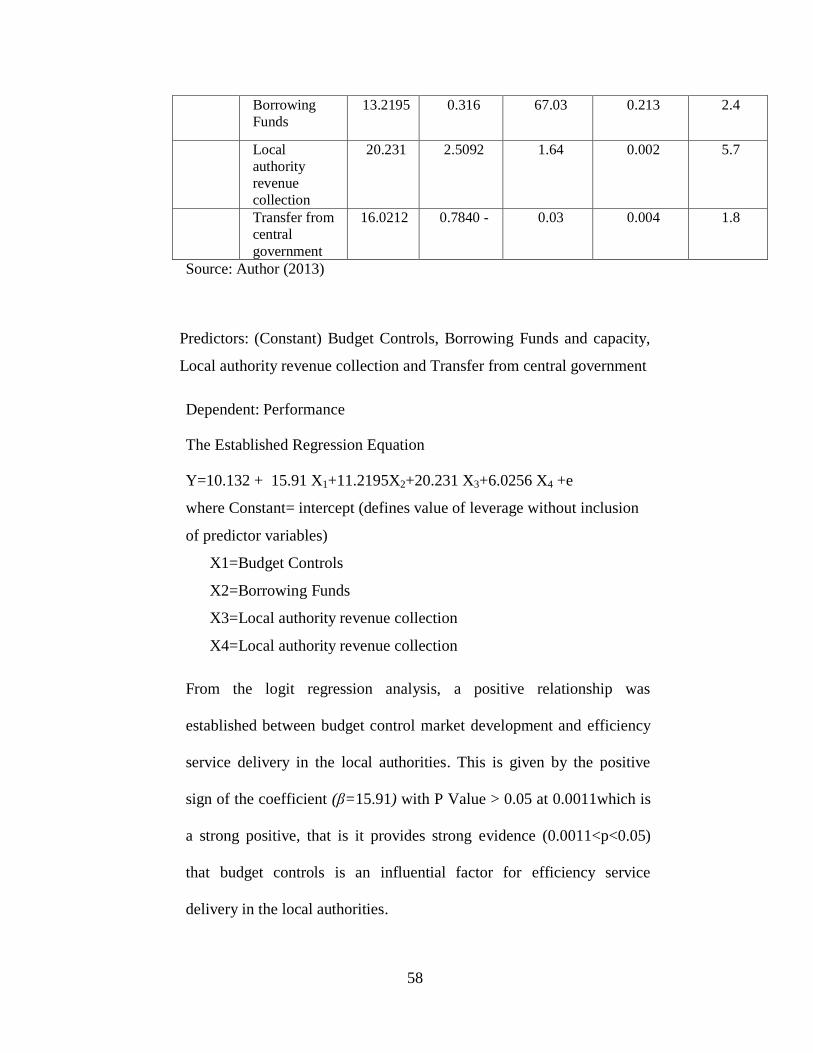
58
Borrowing
Funds
13.2195 0.316 67.03 0.213 2.4
Local
authority
revenue
collection
20.231 2.5092 1.64 0.002 5.7
Transfer from
central
government
16.0212 0.7840 - 0.03 0.004 1.8
Source: Author (2013)
Predictors: (Constant) Budget Controls, Borrowing Funds and capacity,
Local authority revenue collection and Transfer from central government
Dependent: Performance
The Established Regression Equation
Y=10.132 + 15.91 X1+11.2195X2+20.231 X3+6.0256 X4 +e
where Constant= intercept (defines value of leverage without inclusion
of predictor variables)
X1=Budget Controls
X2=Borrowing Funds
X3=Local authority revenue collection
X4=Local authority revenue collection
From the logit regression analysis, a positive relationship was
established between budget control market development and efficiency
service delivery in the local authorities. This is given by the positive
sign of the coefficient (β=15.91) with P Value > 0.05 at 0.0011which is
a strong positive, that is it provides strong evidence (0.0011<p<0.05)
that budget controls is an influential factor for efficiency service
delivery in the local authorities.
59
From the regression analysis, a positive relationship was established
between borrowed fund andefficiency. However, the coefficient value is
(β =13.2195) meaning that a unit change in borrowing would be
influenced by a change in efficiency service delivery. The test of
significance p-value result, p = 0.213, provides weak evidence
(0.013<p>0.05) that borrowed fund by the local government is a factor
that has no change in efficiency service delivery. Therefore borrowing
of funds by local government does not statistically significantly
influence efficiency delivery of services in local authorities
From the regression analysis, a positive relationship was established
between Local authority revenue collectionand the performance in term
of efficiency in service delivery in the local government by a (β
=3.231). The test of significance provides overwhelming evidence (p <
0.05) that the local authority revenue collection influences quality and
efficiency service delivery at p = 0.002. This is the strongest value
obtained from the regression meaning that the local authority revenue
collection was the most significant factor influencing delivery of
services in local authorities efficiently. The findings concurred with
Chikati, (1999) who found that efficient revenue collection improve
significantly the serve in terms of roads, schools, and this was so
because of the improved revenue collection process that meant more
funds improvecouncil‘s ability to contract out this service to people who
were experts in road renovation yielding to efficiency service delivery.
60
The study also found that a unit increase in transfer from the central
governmentled to increase in efficiency service delivery as (β
=16.0212). The test of significance provides significant evidence (p<
0.05) that the at p = 0.004.This implied that transfers from the central
government had a great impact on efficiency service delivery in local
government.The test of significance p-value result, p = 0.004, provides
strong evidence (0.001<p<0.05) that funds from the central government
either in LATTIF influence efficiency in service delivery. According to
Blazek, (2005), the central governments contributed the bulk of local
government revenues through transfers and still largely determine local
budget priorities and enhance provision of service in local areas.
61
CHAPTER FIVE
CONCLUSIONS, RECOMMENDATIONS AND LIMITATIONS
5.1Introduction
This chapter presents a summary of the study giving the implications of
the findings based on the research objectives, conclusions and
recommendations. The objective of the study was to establish the
relationship between revenue mobilization and performance of local
authorities in Kenya.
5.2 Summary of the findings
The study established that there had been increase in revenue mobilization
in the local authorities. The local government management was found to
control budgets of the local authorities which was found to improve
significantly from 2002 to 2012. The study revealed that borrowing of
funds improves significantly for the period of the 10 years, clearly
indicating thatlocal authorities had continued borrowing to fund project and
provide and deliver services.Variable were statistically significant,
indicating that borrowed funds influence service delivery in local
authorities.
The study established that there was significant improvement on local
authority revenue collectiont from 0.0110in 2002 to0.022 in the year
2012which indicated that local government had devised strategies to
collect revenue such as service charges, business fee, and effectively
62
fund collection practices. The study further revealed that transfer from the
central government had improves significantly from 0.0101 for 2002 to
0.179for the year 2012.
The study established that there existed a positive relationship between
revenue mobilization and performance in local government. From the
logit regression analysis, a positive relationship was established between
budget control market development and efficiency service delivery in
the local authorities. The relationship was strong positive, that is it
provides strong evidence (0.0011<p<0.05) that budget controls was an
influential factor for efficiency service delivery in the local authorities.
The findings concurred with Bowman(2003) who indicated that
budgeting influence effective control of expenditure and enhance
financial management and planning through variance analysis. This
facilitated coordination and cooperation between the various programs
and financial departments, henceincreasing revenue collection which
significantly influence performance in local authorities in developing
countries.
The study also established borrowing of funds by local government does
not statistically significantly influence efficiency delivery of services in
local authorities e (P>0.05) that borrowed fund by the local government
is a factor that has no change in efficiency service delivery.
63
The study established that there existeda positive relationship between
local authority revenue collection and the performance in term of
efficiency in service delivery in the local government. The increase in
local authority revenue collection led to statistically significant increase
in efficient service delivery. The efficient revenue collection improve
significantly the services in terms of roads, schools, and hospitals.This
wasbecause of the improved revenue collection process that meant more
funds improve council‘s ability to contract out this service to people
who were experts in road renovation yielding to efficiency service
delivery.
The study revealed increased in central government transfer fund such
as LATF from the central government led to increase in efficiency
service delivery by factor 16.0212.and that change were statistically
significance with 0.004<p< 0.05) This clearly indicated that transfers
from the central government had a great impact on efficiency service
delivery in local government.The test of significance p-value result, p =
0.004, provides strong evidence (0.001<p<0.05) that funds from the
central government either in LATF influence efficiency in service
delivery. According to Blazek, (2005), the central governments
contributed the bulk of local government revenues through transfers and
still largely determine local budget priorities and enhance provision of
service in local areas.
5.3 Conclusions
64
The study concludes that local authorities budgeting greatly influence
revenue mobilization. The study from the regression analysis revealed
that there was a statistically significant relationship between budgeting
and efficiency service delivery. Local governments in Kenya need to
institute sound budgeting processes, both at the organizational level and
within programs. The use of the budget to control local authorities‘ funds
and guard against over or under expenditure would be a critical element
in management. The local authorities should also encouraged to draw up
annual budgets and have them approved by the board and ensure that
variance analysis is carried out at determined interval and passed on to
the management for action. The local authorities should also consider
self-generated income as a source of funding their activities in order to
supplement the revenue from donors and central government. Hence
local authorities in Kenya need to improve their budgeting if they want to
improve efficient service delivery.
The study concluded that increased in central government transfer fund
such as LATF from the central government led to increase in efficiency
service delivery. This was because transfers from the central
government had a great impact on efficiency service delivery in local
government.The local government management should enhance
collection of revenue by effectively collecting user charges for utilities
such as power, water, telecommunications, rental or lease agreements
for facilities or equipment.
65
5.4 Limitations of the Study
The study faced several limitations. Obtaining of data from the local
government was a great challenge and the management in the local
government was uncooperative, however the researcher explained that
the data that was to be obtained was for academic purpose only. The
study was also limited to the degree of precision of the data obtained
from the local government financial records.
The study also faced challenges of time resources limiting the study
from collecting information for the study particularly where the local
government management delayed giving the local authorities financial
reports. To mitigate this, the researcher made often follow up and
enhance collection of sufficient data from the local authorities
5.5Recommendation of the Study
In light of the findings and the need for local government to provide
quality services ,the local authorities need to put more effort in ensuring
that local revenue collection and administration is improved to provide
quality service to the people. Transfer from national government is only
meant to supplement the budget.
66
The study recommend that revenue collection in local government
should be privatized by giving out tenders to individuals or companies
to collect revenues on behalf of local government to reduce the
increasing rate of tax defaulters and constituting enforcement teams to
check businesses that have failed to pay taxes and penalize them
accordingly to increased revenue mobilization.
The local government should increase sensitization, mobilization and
publicity to the community about the importance of revenue collection.
This can be done through rallies, village meetings, newspapers, radio
programmes, commissioning of projects and use of local revenues
collected for activities that have immediate and visible impact.
The study finally recommend that local authorities should explore
other sources of local revenue collection for example fines and fees
imposed by local council courts, annual bicycle license user charges,
fees and property rates to improve revenue mobilization to effectively
improve efficient service delivery.
5.6Recommendation for Further Study
67
This study examined therelationship between revenuemobilization and
performance in local authorities. A further study should be carried out to
examine,Local Government expenditure and efficiency levels of
administrators.
The study also recommends that a further study should be carried out to
determine the challenges facing revenue mobilization in local
government. The study finally recommends that study should be
conducted to establish the factors that influence effective resources
management in local government to enhance service delivery.
68
REFERENCES
Abonyo,K.O. (2003). Strategic Business Challenges for Non-
governmental Organizations in Managing Profitable Business
Enterprise: A Case Study of Undugu Society of Kenya.
Unpublished Master of Business Administration dissertation,
USIU Africa.
Alam, S.,Noore, D., Dian., N., &Nur, A. S. (2012). Regional Autonomy
and Local Resource Mobilization in Eastern Indonesia: Problems
and Pitfalls of Fisca Decentralization. Asian Affairs: An
American Review. 39 (1): 44-68
Amir, J., Carolyn, R. D., &Aman S. (1993) Agency Theory: Implications
for Financial Management, Managerial Finance, 14 Issue 4, 1
-5
Anthony, R, & Young, D. (2004).Management Control in Not for Profit
Organizations, Boston, Richard D Irwin.
Blazek, J. (2005). Financial Planning for Not for Profit Organizations,
New York: John Wiley & Sons Inc.
Bird, R. (2008). Tax Challenges Facing Developing Countries, New
Delhi: National Institute of Public Finance and Policy.
Blazek, J. (2005). Financial Planning for Not for Profit Organizations,
New York: John Wiley & Sons Inc.
Bray, J. (2008). Effective Fundraising for Non Profits, Berkley,
Consolidated Printers Inc.
Brewer, L., Chandler, R.C., &Ferrell, O.C. (2006), Managing Risks for
Corporate Integrity: How to Survive an Ethical Misconduct
Disaster, South-Western, Belmont, CA.
Brooksons, S. (2002).Managing Budgets, New York: Darling Kindersley
Books
Chelogoy, M, Anyango, H.&Odembo, E. (2004).An Introduction to Non
Profit Sector in Kenya, London: Allavida
Chikati, J. (1999). Complete East African Fundraising Hand book,
Nairobi, Institute of Fundraising & Direct Marketing.
Covey, J. (2003).NGO’s. Partners or contractors, Oxford: INTRAC
Development.
69
Davis, J., Rolando, O. &Annalisa, F. (2003). Fiscal Policy Formulation
and Implementation in Oil-Producing Countries (Washington:
International Monetary Fund).Development).
Dixit, A. (1991). The Optimal Mix of Inflationary Finance and
Commodity Taxation with Collection Lags, IMF Staff Papers, 38,
643–54.
Djankov, H., D., James, R.& Hines, J. (2009). Which Countries Become
Tax Havens?Journal of Public Economics, 93, 1058–068.
Ebeke, E. &Ehrhart, H. (2010). Tax Revenue Instability in sub-Saharan
Africa: Consequences and Remedie, mimeo, CERDI,
Auvergne University.
Fjeldstad, O.H., Katera, L., Msami, J. &Ngalewa, E. (2010).Local
Government Finances and Financial Management in Tanzania:
Empirical evidence of trends 2000-2007.
REPOA Special Paper No. 10-2010. Dar es Salaam: Research on Poverty
Alleviation.
Fowler, A., & James, R. (2002). The role of Oxford Southern NGO’s in
Development cooperation, London UK, INTRAC
Gauthier, B. &Mark, G. (1997). Revenue Erosion and Evasion in
Cameroon, 1993, Journal of Public Economics, 64, 407–24
Ghura, D. (2006). Tax Revenue in sub-Saharan Africa: Effects of
Economic Policies and Corruption, IMF Working Paper 98/135
Washington: International Monetary Fund.
Gordon, R. (2010).Taxation in Developing Countries: Six Case Studies
and Policy Implications (New York: Columbia University Press.
Graham, P. (2000).International Society for Third Sector Research
(ISTR) e-discussion list.
Greene, W. (2008). The Econometric Approach to Efficiency Analysis in
the local Quarterly Journal of Economics, 102, 129
Harrison, G. (2008). VAT Refunds, in VAT in Africa, ed. by Richard
Krever (Pretoria) ,Journal of Public Economics, 93, 1058–068.
Hazel, C. (2005). Tax Policy in Developing Countries: What can be
Learned from OECD Experience? Journal of Public Economics,
Vol. 93, pp. 855–66.
70
Holloway, R. (2003). Towards Financial Self Reliance, London: Earth
Scan Publications Ltd. Journal of Public Economics, 92, 1892–
906.
Horngen, C., Foster, G.&Datar, M, (2007). Cost Accounting, A
Managerial Emphasis, Upper Saddle River: Prentice Hall
Houghton, C. (2005). Philanthropy in East Africa, London, Allavida
IFC, (2007). Designing a Tax System for Micro and Small Businesses:
Guide for Practitioners. International Monetary Fund, 2000,
Recent Experience with the Value-Added Tax—An Overview
International Monetary Fund.
International Tax and Public Finance, 17, 340–56.
Jeremy, H & Fraser, R. (2003). Beyond Budgeting, Boston, Harvard
Business School Publishing Corporation
Juul, R. (2006). ―The Digital Provide: Information (Technology), Market
Performance and Welfare in the South Indian Fisheries Sector,‖
Quarterly Journal of Economics, 122, 879–924.
Kanbur, R. (2009). Conceptualizing Informality: Regulation and
Enforcement,‖ Department of Applied Economics and
Management, Cornell University, WP 2009–11.
Khadingala, G. &Mitulla, W. (2004). Kenya centralization through the
devolution of Power, Washington DC, Woodrow Wilson Centre
Press.
Kidd, M., & William, C. (2006). Revenue Authorities: Issues and
Problems in Evaluating their Success, IMF Working Paper
06/240.Washington: International Monetary Fund.
Klein, K. (2004). Fundraising in Times of Crisis, New York, Chardon
Press Series
Kloeden,D. (2000). Revenue Administration Reforms in Anglophone
Africa Since the Early-1990s, IMF Working Paper
(Washington: International Monetary Fund).
Measurement of Productive Efficiency and Productivity Growth,
ed. by Harold Fried,
Mugenda A.&Mugenda, O. (2003).Research methods Quantitative and
qualitative approaches by Mugenda, Nairobi, Kenya
Ngechu, M. (2006).Understanding the Research Process and Method,
University of Nairobi. Starbright Services Ltd.
71
Njambi, R. (2003). Local Resource mobilization by non governmental
organizations in East Africa, Nairobi: Ford foundation
Norton, M. (2003).The Worldwide Fundraisers Handbook, London:
Directory of Social Change
Odhiambo, M.A. (2005). Management of Resources by Local
Authorities: The case of Local Authority Transfer Fund,
Nairobi, Claripress.
Republic of Kenya (2010). The 2010 Constitution of Kenya Article
Vol.97, (1) (b) Membership of the National Assembly
Rick, R. (2002). Strengthening the Capacity of Southern NGO’s, Oxford,
INTRAC
Robbins, S. (2005). Organizational Behaviour, New Jersey: Prentice
Hall.
Ross, B.& Segal. C. (2003).Break Through Thinking for NGO’s, San
Francisco: Jossey –Bass Books
Schermerhorn, J., Hunt, G.& Osborn, R. (2003). Organizational
Behaviour, John Wiley & Sons Inc
Sprinkel, K. (2005). Beyond Fundraising, New Jersey, John Wiley &
sons Inc
Thuronyi, V. (2001). International Tax Cooperation and a Multilateral
Treaty,‖ BrooklynJournal of International Law, 26, 1641–681.
Tibaijuka, A. K. (2005).Key Competencies for Improving Local
Governance; Local Elected
United Nations (2005).Investing in Development (New York: United
Nations).
Venables, A. J., (2010). Resource Rents; When to Spend and How to
Save,‖ inDecentralization, local taxation and citizenship in
Senegal. Development and Change.Vol.37 (4):
pp.821–46
Waema, E. (2003). Building Credibility: The Foundation for
Fundraising, Ontario , ITDG Publishing
Wallace, E. G. (1994). Federalism and government finance in modern
public finance Quigley, Journal of Enterprise Resources.
Smolenkey, edition, Harvard University Press
72
Wanjohi, N. G., (2003). Modern Local Government in Kenya, (KAS) and
(ADEC), Nairobi
Westein, S. (2005). The Complete Guide to Fundraising Management,
New York: John Wiley & Sons
Westman, E. (2004). Building Structures and Skills for Fundraising,
Ontario: ITDG Publishing
APPENDICE
Appendix I: Introduction Letter

73
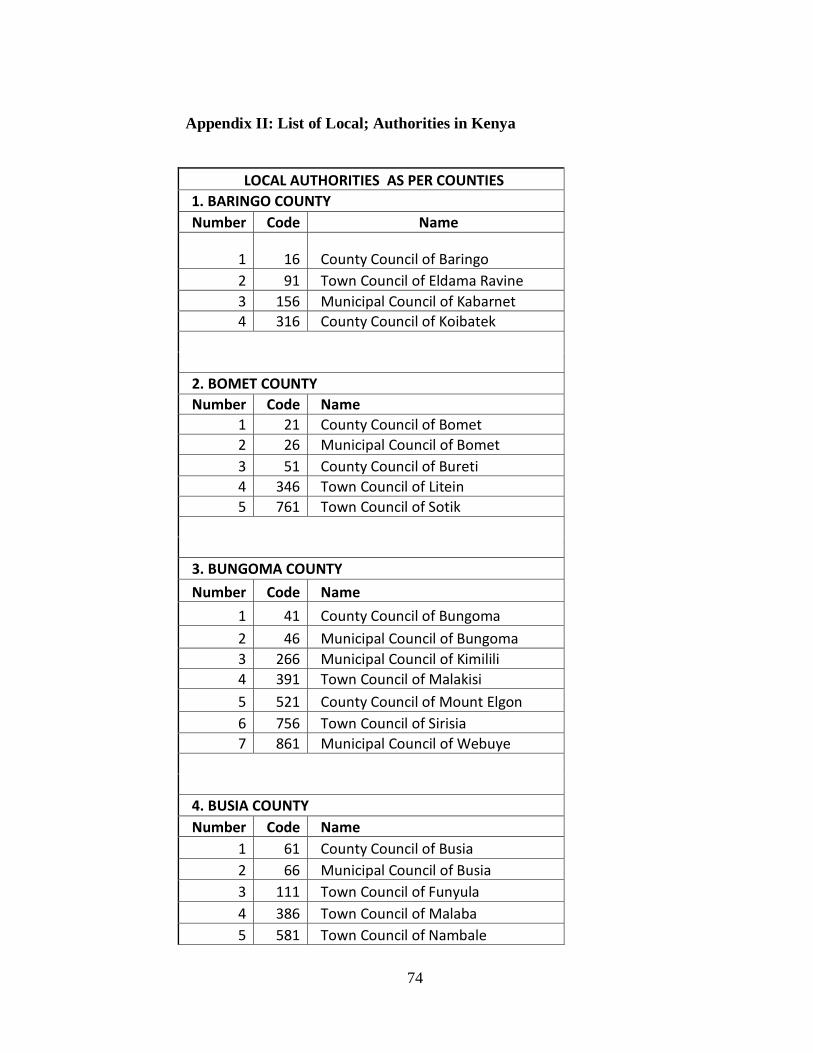
74
Appendix II: List of Local; Authorities in Kenya
LOCAL AUTHORITIES AS PER COUNTIES
1. BARINGO COUNTY
Number Code Name
1 16 County Council of Baringo
2 91 Town Council of Eldama Ravine
3 156 Municipal Council of Kabarnet 4 316 County Council of Koibatek
2. BOMET COUNTY
Number Code Name
1 21 County Council of Bomet
2 26 Municipal Council of Bomet
3 51 County Council of Bureti
4 346 Town Council of Litein
5 761 Town Council of Sotik
3. BUNGOMA COUNTY
Number Code Name
1 41 County Council of Bungoma
2 46 Municipal Council of Bungoma
3 266 Municipal Council of Kimilili
4 391 Town Council of Malakisi
5 521 County Council of Mount Elgon
6 756 Town Council of Sirisia
7 861 Municipal Council of Webuye
4. BUSIA COUNTY
Number Code Name
1 61 County Council of Busia
2 66 Municipal Council of Busia
3 111 Town Council of Funyula
4 386 Town Council of Malaba
5 581 Town Council of Nambale

75
6 706 Town Council of Port Victoria
7 796 County Council of Teso
5. ELGEYO MARAKWET
Number Code Name
1 151 Town Council of Iten-Tambach
2 216 County Council of Keiyo
3 431 County Council of Marakwet
6. EMBU COUNTY
Number Code Name
1 101 County Council of Embu
2 106 Municipal Council of Embu
3 476 County Council of Mbeere
4 731 Municipal Council of Runyenjes
7. GARISSA COUNTY
Number Code Name
1 116 County Council of Garissa
2 121 Municipal Council of Garissa
3 143 County Council of Ijara
8. HOMA BAY COUNTY
Number Code Name
1 136 County Council of Homa Bay
2 141 Municipal Council of Homa Bay
3 221 Town Council of Kendu Bay
4 481 Town Council of Mbita Point
5 696 Town Council of Oyugis
6 711 County Council of Rachuonyo
7 766 County Council of Suba
9. ISIOLO COUNTY
Number Code Name
1 146 County Council of Isiolo

76
10. KAJIADO COUNTY
Number Code Name
1 161 Town Council of Kajiado
2 686 County Council of Olkejuado
11. KAKAMEGA COUNTY
Number Code Name
1 71 County Council of Butere-Mumias
2 166 County Council of Kakamega
3 171 Municipal Council of Kakamega
4 366 County Council of Lugari
5 396 Town Council of Malava
6 541 Municipal Council of Mumias
12. KERICHO COUNTY
Number Code Name
1 226 Municipal Council of Kericho
2 271 Town Council of Kipkelion
3 276 County Council of Kipsigis
4 356 Town Council of Londiani
13. KIAMBU COUNTY
Number Code Name
1 206 Town Council of Karuri
2 241 County Council of Kiambu
3 246 Municipal Council of Kiambu
4 251 Town Council of Kikuyu
5 341 Municipal Council of Limuru
6 721 Municipal Council of Ruiru
7 806 County Council of Thika
8 811 Municipal Council of Thika

77
14. KILIFI COUNTY
Number Code Name
1 256 County Council of Kilifi
2 261 Town Council of Kilifi
3 401 County Council of Malindi
4 406 Municipal Council of Malindi
5 441 Town Council of Mariakani
15. KIRINYAGA COUNTY
Number Code Name
1 236 Municipal Council of KerugoyaKutus
2 281 County Council of Kirinyaga
3 736 Town Council of Sagana
16. KISII COUNTY
Number Code Name
1 126 County Council of Gucha
2 131 County Council of Gusii
3 231 Town Council of Keroka
4 286 Municipal Council of Kisii
5 456 Town Council of Masimba
6 621 Town Council of Nyamache
7 626 Town Council of Nyamarambe
8 676 Town Council of Ogembo
9 771 Town Council of Suneka
10 776 Town Council of Tabaka
17. KISUMU COUNTY
Number Code Name
1 6 Town Council of Ahero
2 291 County Council of Kisumu
3 296 Municipal Council of Kisumu
4 536 Town Council of Muhoroni
5 651 County Council of Nyando
18. KITUI COUNTY
Number Code Name
1 306 County Council of Kitui

78
2 311 Municipal Council of Kitui
3 556 County Council of Mwingi
4 561 Town Council of Mwingi
19. KWALE COUNTY
Number Code Name
1 321 County Council of Kwale
2 326 Town Council of Kwale
20. LAIKIPIA COUNTY
Number Code Name
1 331 County Council of Laikipia
2 596 Municipal Council of Nanyuki
1 616 Municipal Council of Nyahururu
3 726 Town Council of Rumuruti
21. LAMU COUNTY
Number Code Name
1 336 County Council of Lamu
22. MACHAKOS COUNTY
Number Code Name
1 186 Town Council of Kangundo
2 371 Municipal Council of Machakos
3 451 County Council of Masaku
4 461 Town Council of Matuu
5 471 Municipal Council of Mavoko
23. MAKUENI COUNTY
Number Code Name
1 376 County Council of Makueni
2 531 Town Council of MtitoAndei
3 866 Town Council of Wote
24. MANDERA COUNTY
Number Code Name
1 411 County Council of Mandera
2 416 Town Council of Mandera

79
25. MARSABIT COUNTY
Number Code Name
1 446 County Council of Marsabit
2 526 County Council of Moyale
26. MERU COUNTY
Number Code Name
1 466 Municipal Council of Maua
2 486 County Council of Meru
3 491 Municipal Council of Meru
4 631 County Council of Nyambene
27. MIGORI COUNTY
Number Code Name
1 11 Town Council of Awendo
2 211 Municipal Council of Kehancha
3 501 County Council of Migori
4 506 Municipal Council of Migori
5 716 Town Council of Rongo
28. MOMBASA COUNTY
Number Code Name
1 516 Municipal Council of Mombasa
29. MURANG'A COUNTY
Number Code Name
1 176 Town Council of Kandara
2 181 Town Council of Kangema
3 381 Town Council of Makuyu
4 421 County Council of Maragwa
5 426 Town Council of Maragwa
6 546 County Council of Murang'a
7 551 Municipal Council of Murang'a
30. NAIROBI COUNTY
Number Code Name
1 1 City Council of Nairobi

80
31. NAKURU COUNTY
Number Code Name
1 511 Town Council of Molo
2 566 Municipal Council of Naivasha
3 571 County Council of Nakuru
4 576 Municipal Council of Nakuru
32. NANDI COUNTY
Number Code Name
1 196 Municipal Council of Kapsabet
2 586 County Council of Nandi
3 591 Town Council of Nandi-Hills
33. NAROK COUNTY
Number Code Name
1 601 County Council of Narok
2 606 Town Council of Narok
3 816 County Council of Trans Mara
34. NYAMIRA COUNTY
Number Code Name
1 636 County Council of Nyamira
2 641 Town Council of Nyamira
3 656 Town Council of Nyansiongo
35. NYANDARUA COUNTY
Number Code Name
2 646 County Council of Nyandarua
3 681 Town Council of Ol'Kalou
36. NYERI COUNTY
Number Code Name
1 201 Municipal Council of Karatina

81
2 661 County Council of Nyeri
3 667 Municipal Council of Nyeri
4 691 Town Council of Othaya
37. SAMBURU COUNTY
Number Code Name
1 436 Town Council of Maralal
2 741 County Council of Samburu
38. SIAYA COUNTY
Number Code Name
1 31 County Council of Bondo
2 36 Town Council of Bondo
3 746 County Council of Siaya
4 751 Municipal Council of Siaya
5 826 Town Council of Ugunja
6 831 Town Council of Ukwala
7 871 Town Council of Yala
39. TAITA/TAVETA COUNTY
Number Code Name
1 781 County Council of TaitaTaveta
2 791 Town Council of Taveta
3 846 Municipal Council of Voi
40. TANA RIVER COUNTY
Number Code Name
1 786 County Council of Tana River
41. THARAKA-NITHI COUNTY
Number Code Name
1 81 Town Council of Chogoria
2 86 Municipal Council of Chuka
3 496 County Council of Meru South
4 801 County Council of Tharaka
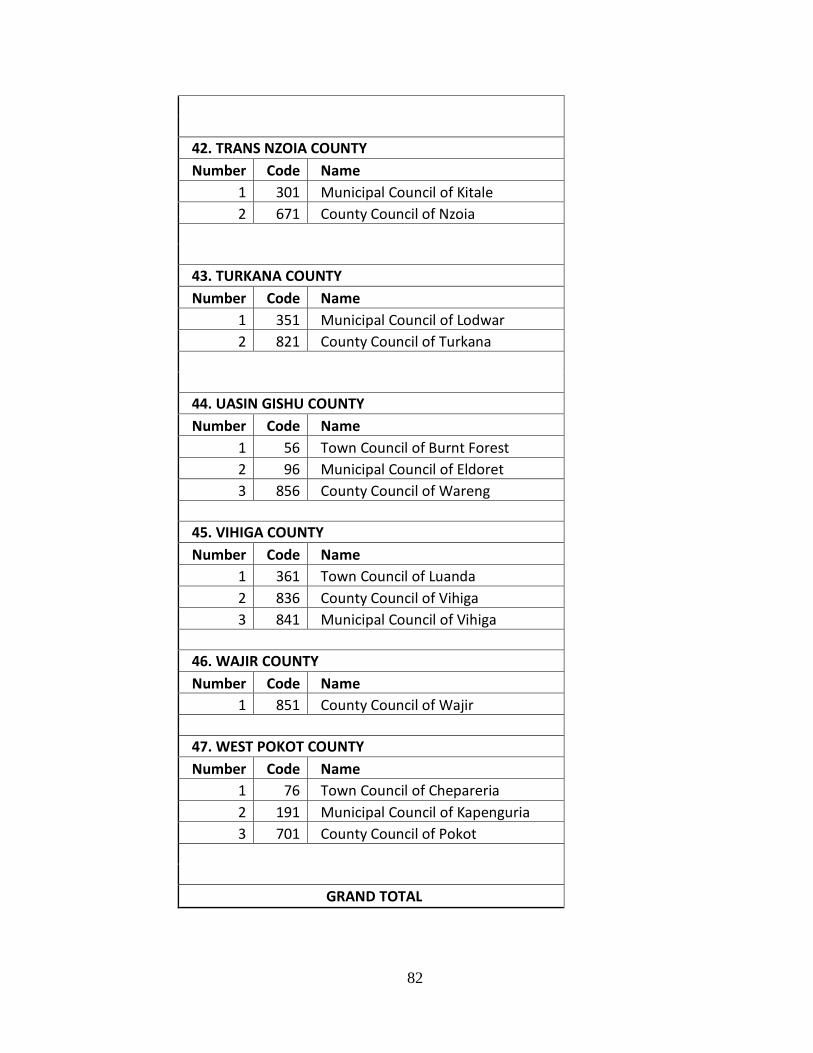
82
42. TRANS NZOIA COUNTY
Number Code Name
1 301 Municipal Council of Kitale
2 671 County Council of Nzoia
43. TURKANA COUNTY
Number Code Name
1 351 Municipal Council of Lodwar
2 821 County Council of Turkana
44. UASIN GISHU COUNTY
Number Code Name
1 56 Town Council of Burnt Forest
2 96 Municipal Council of Eldoret
3 856 County Council of Wareng
45. VIHIGA COUNTY
Number Code Name
1 361 Town Council of Luanda
2 836 County Council of Vihiga
3 841 Municipal Council of Vihiga
46. WAJIR COUNTY
Number Code Name
1 851 County Council of Wajir
47. WEST POKOT COUNTY
Number Code Name
1 76 Town Council of Chepareria
2 191 Municipal Council of Kapenguria
3 701 County Council of Pokot
GRAND TOTAL
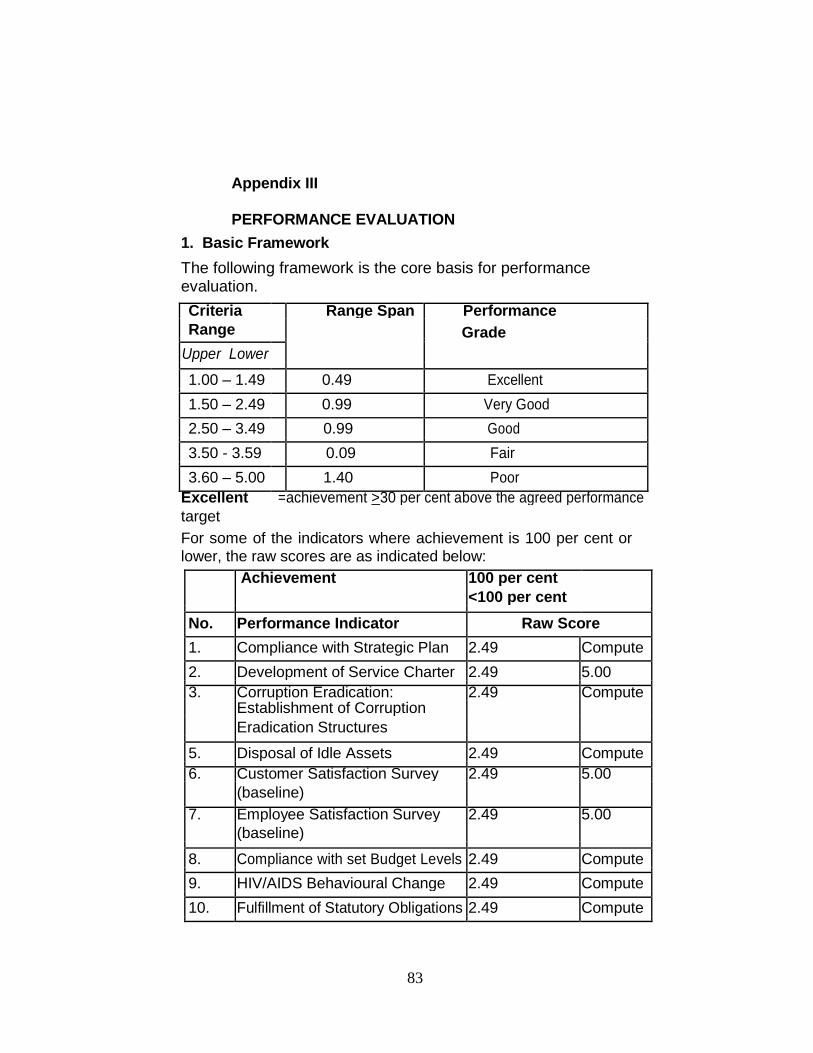
83
Appendix III
PERFORMANCE EVALUATION
1. Basic Framework The following framework is the core basis for performance evaluation.
Criteria Range Span Performance
Range Grade
Upper Lower
1.00 – 1.49 0.49 Excellent
1.50 – 2.49 0.99 Very Good
2.50 – 3.49 0.99 Good
3.50 - 3.59 0.09 Fair
3.60 – 5.00 1.40 Poor
Excellent = achievement >30 per cent above the agreed performance
target
For some of the indicators where achievement is 100 per cent or lower, the raw scores are as indicated below: Achievement 100 per cent
<100 per cent
No. Performance Indicator Raw Score
1. Compliance with Strategic Plan 2.49 Compute
2. Development of Service Charter 2.49 5.00
3. Corruption Eradication: 2.49 Compute Establishment of Corruption
Eradication Structures
5. Disposal of Idle Assets 2.49 Compute
6. Customer Satisfaction Survey 2.49 5.00
(baseline)
7. Employee Satisfaction Survey 2.49 5.00 (baseline)
8. Compliance with set Budget Levels 2.49 Compute
9. HIV/AIDS Behavioural Change 2.49 Compute
10. Fulfillment of Statutory Obligations 2.49 Compute
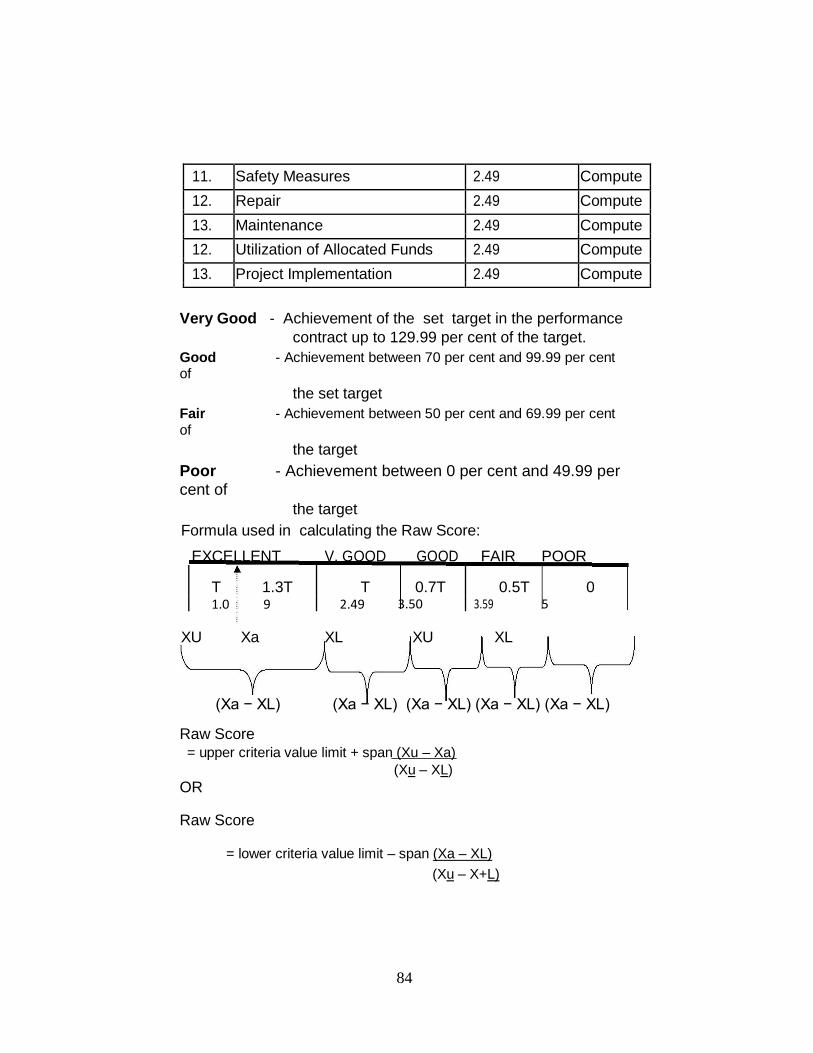
84
11. Safety Measures 2.49 Compute
12. Repair 2.49 Compute
13. Maintenance 2.49 Compute
12. Utilization of Allocated Funds 2.49 Compute
13. Project Implementation 2.49 Compute
Very Good - Achievement of the set target in the performance
contract up to 129.99 per cent of the target. Good - Achievement between 70 per cent and 99.99 per cent of
the set target Fair - Achievement between 50 per cent and 69.99 per cent of
the target Poor - Achievement between 0 per cent and 49.99 per cent of
the target Formula used in calculating the Raw Score: EXCELLENT V. GOOD GOOD FAIR POOR
T 1.3T T 0.7T 0.5T 0 1.0 9 2.49 3.50 3.59 5
XU Xa XL XU XL
(Xa − XL) (Xa − XL) (Xa − XL) (Xa − XL) (Xa − XL) Raw Score = upper criteria value limit + span (Xu – Xa)
(Xu – XL) OR Raw Score
= lower criteria value limit – span (Xa – XL)
(Xu – X+L)
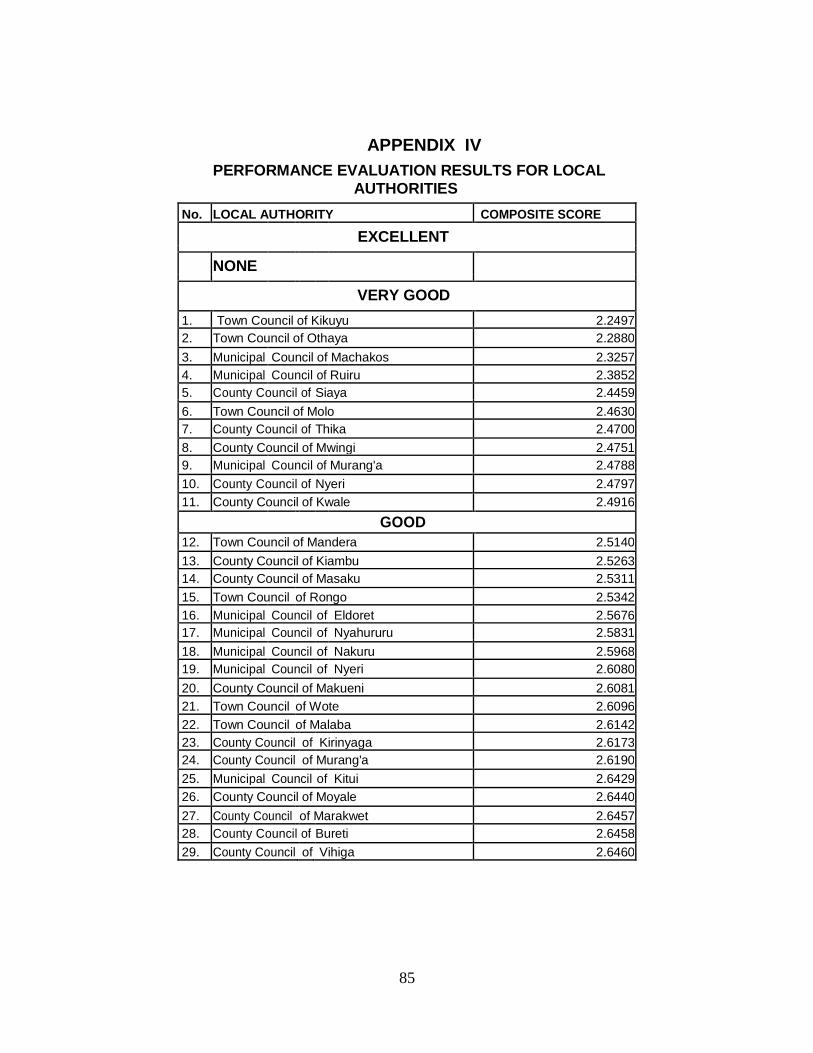
85
APPENDIX IV
PERFORMANCE EVALUATION RESULTS FOR LOCAL AUTHORITIES
No. LOCAL AUTHORITY COMPOSITE SCORE
EXCELLENT
NONE
VERY GOOD
1. Town Council of Kikuyu 2.2497 2. Town Council of Othaya 2.2880
3. Municipal Council of Machakos 2.3257 4. Municipal Council of Ruiru 2.3852 5. County Council of Siaya 2.4459
6. Town Council of Molo 2.4630 7. County Council of Thika 2.4700
8. County Council of Mwingi 2.4751 9. Municipal Council of Murang'a 2.4788
10. County Council of Nyeri 2.4797
11. County Council of Kwale 2.4916
GOOD
12. Town Council of Mandera 2.5140
13. County Council of Kiambu 2.5263 14. County Council of Masaku 2.5311
15. Town Council of Rongo 2.5342 16. Municipal Council of Eldoret 2.5676 17. Municipal Council of Nyahururu 2.5831
18. Municipal Council of Nakuru 2.5968 19. Municipal Council of Nyeri 2.6080
20. County Council of Makueni 2.6081 21. Town Council of Wote 2.6096
22. Town Council of Malaba 2.6142 23. County Council of Kirinyaga 2.6173 24. County Council of Murang'a 2.6190
25. Municipal Council of Kitui 2.6429
26. County Council of Moyale 2.6440
27. County Council of Marakwet 2.6457 28. County Council of Bureti 2.6458
29. County Council of Vihiga 2.6460
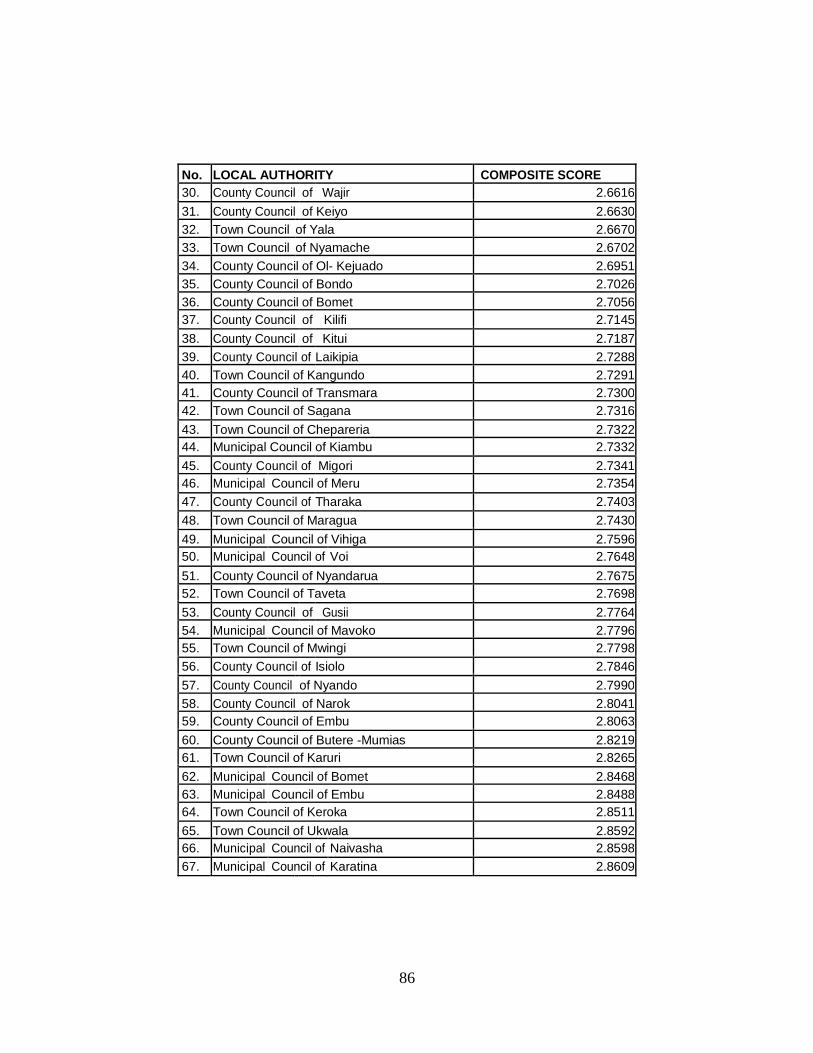
86
No. LOCAL AUTHORITY COMPOSITE SCORE 30. County Council of Wajir 2.6616
31. County Council of Keiyo 2.6630 32. Town Council of Yala 2.6670 33. Town Council of Nyamache 2.6702
34. County Council of Ol- Kejuado 2.6951 35. County Council of Bondo 2.7026 36. County Council of Bomet 2.7056 37. County Council of Kilifi 2.7145
38. County Council of Kitui 2.7187
39. County Council of Laikipia 2.7288 40. Town Council of Kangundo 2.7291 41. County Council of Transmara 2.7300 42. Town Council of Sagana 2.7316
43. Town Council of Chepareria 2.7322 44. Municipal Council of Kiambu 2.7332
45. County Council of Migori 2.7341 46. Municipal Council of Meru 2.7354
47. County Council of Tharaka 2.7403
48. Town Council of Maragua 2.7430
49. Municipal Council of Vihiga 2.7596 50. Municipal Council of Voi 2.7648
51. County Council of Nyandarua 2.7675 52. Town Council of Taveta 2.7698
53. County Council of Gusii 2.7764 54. Municipal Council of Mavoko 2.7796 55. Town Council of Mwingi 2.7798
56. County Council of Isiolo 2.7846
57. County Council of Nyando 2.7990
58. County Council of Narok 2.8041 59. County Council of Embu 2.8063
60. County Council of Butere -Mumias 2.8219 61. Town Council of Karuri 2.8265
62. Municipal Council of Bomet 2.8468 63. Municipal Council of Embu 2.8488 64. Town Council of Keroka 2.8511
65. Town Council of Ukwala 2.8592 66. Municipal Council of Naivasha 2.8598
67. Municipal Council of Karatina 2.8609
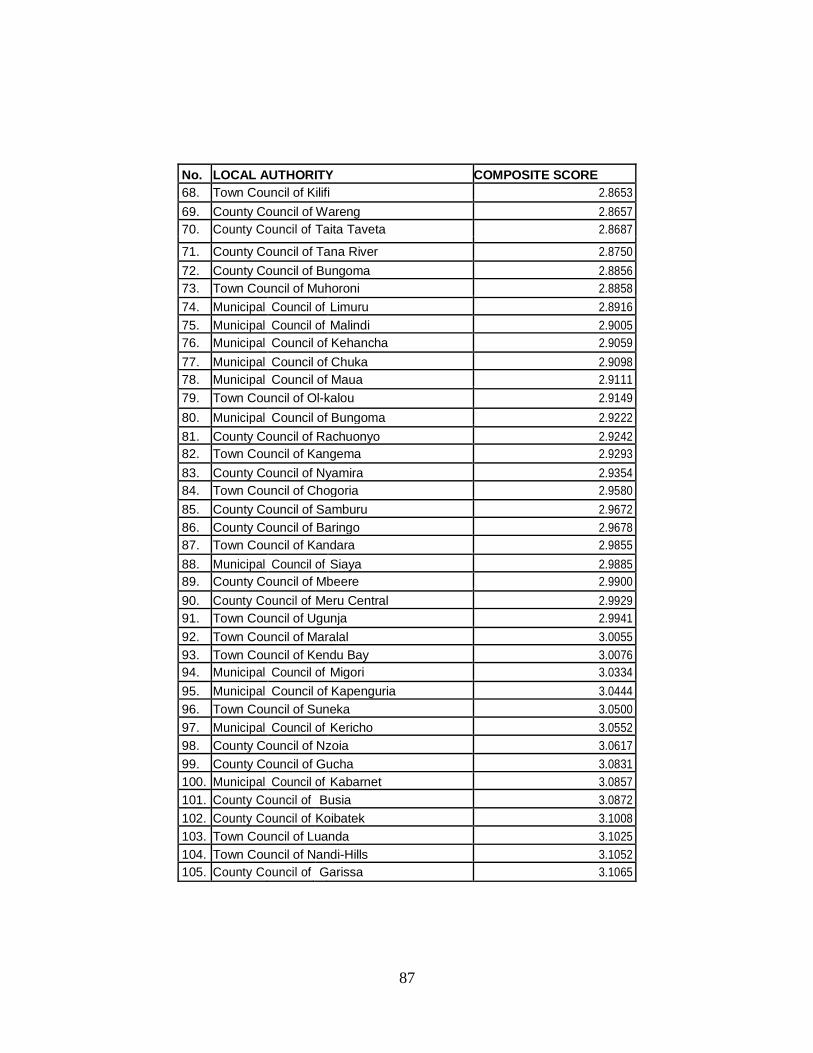
87
No. LOCAL AUTHORITY COMPOSITE SCORE 68. Town Council of Kilifi 2.8653
69. County Council of Wareng 2.8657 70. County Council of Taita Taveta 2.8687
71. County Council of Tana River 2.8750
72. County Council of Bungoma 2.8856 73. Town Council of Muhoroni 2.8858
74. Municipal Council of Limuru 2.8916
75. Municipal Council of Malindi 2.9005 76. Municipal Council of Kehancha 2.9059
77. Municipal Council of Chuka 2.9098 78. Municipal Council of Maua 2.9111
79. Town Council of Ol-kalou 2.9149
80. Municipal Council of Bungoma 2.9222
81. County Council of Rachuonyo 2.9242 82. Town Council of Kangema 2.9293
83. County Council of Nyamira 2.9354 84. Town Council of Chogoria 2.9580
85. County Council of Samburu 2.9672 86. County Council of Baringo 2.9678 87. Town Council of Kandara 2.9855
88. Municipal Council of Siaya 2.9885 89. County Council of Mbeere 2.9900
90. County Council of Meru Central 2.9929 91. Town Council of Ugunja 2.9941
92. Town Council of Maralal 3.0055 93. Town Council of Kendu Bay 3.0076 94. Municipal Council of Migori 3.0334
95. Municipal Council of Kapenguria 3.0444 96. Town Council of Suneka 3.0500
97. Municipal Council of Kericho 3.0552 98. County Council of Nzoia 3.0617
99. County Council of Gucha 3.0831 100. Municipal Council of Kabarnet 3.0857 101. County Council of Busia 3.0872
102. County Council of Koibatek 3.1008 103. Town Council of Luanda 3.1025 104. Town Council of Nandi-Hills 3.1052 105. County Council of Garissa 3.1065

88
No. LOCAL AUTHORITY COMPOSITE SCORE 106. County Council of Homa Bay 3.1068
107. County Council of Malindi 3.1109 108. Town Council of Narok 3.1138
109. County Council of Kakamega 3.1141 110. Town Council of Kipkelion 3.1319
111. Town Council of Awendo 3.1336 112. County Council of Teso 3.1421 113. Town Council of Sirisia 3.1631
114. Town Council of Litein 3.1794 115. Town Council of Mariakani 3.2067
116. Municipal Council of Thika 3.2310 117. Municipal Council of Mumias 3.2311
118. Municipal Council of Kapsabet 3.2328 119. Town Council of Sotik 3.2364 120. Town Council of Iten-Tambach 3.2386
121. County Council of Turkana 3.2468 122. Municipal Council of Kitale 3.2544
123. County Council of Nandi 3.2580 124. County Council of Nakuru 3.2715 125. Town Council of Nyamira 3.2718
126. Town Council of Malava 3.2948 127. City Council of Nairobi 3.3089 128. County Council of Mandera 3.3094
129. County Council of Ijara 3.3225 130. Municipal Council of Kimilili 3.3434 131. Town Council of Mbita Point 3.3460 132. Town Council of Ogembo 3.3546
133. Municipal Council of Busia 3.3785 134. Municipal Council of Kakamega 3.4030 135. Municipal Council of Webuye 3.4112 136. Town Council of Kajiado 3.4192 137. County Council of Lugari 3.4287 138. County Council of Nyambene 3.4290
139. County Council of Pokot 3.4366
140. Town Council of Bondo 3.4431 141. Municipal Council of Kerugoya-Kutus 3.4489
142. County Council of Meru South 3.4540
143. Municipal Council of Kisii 3.4807
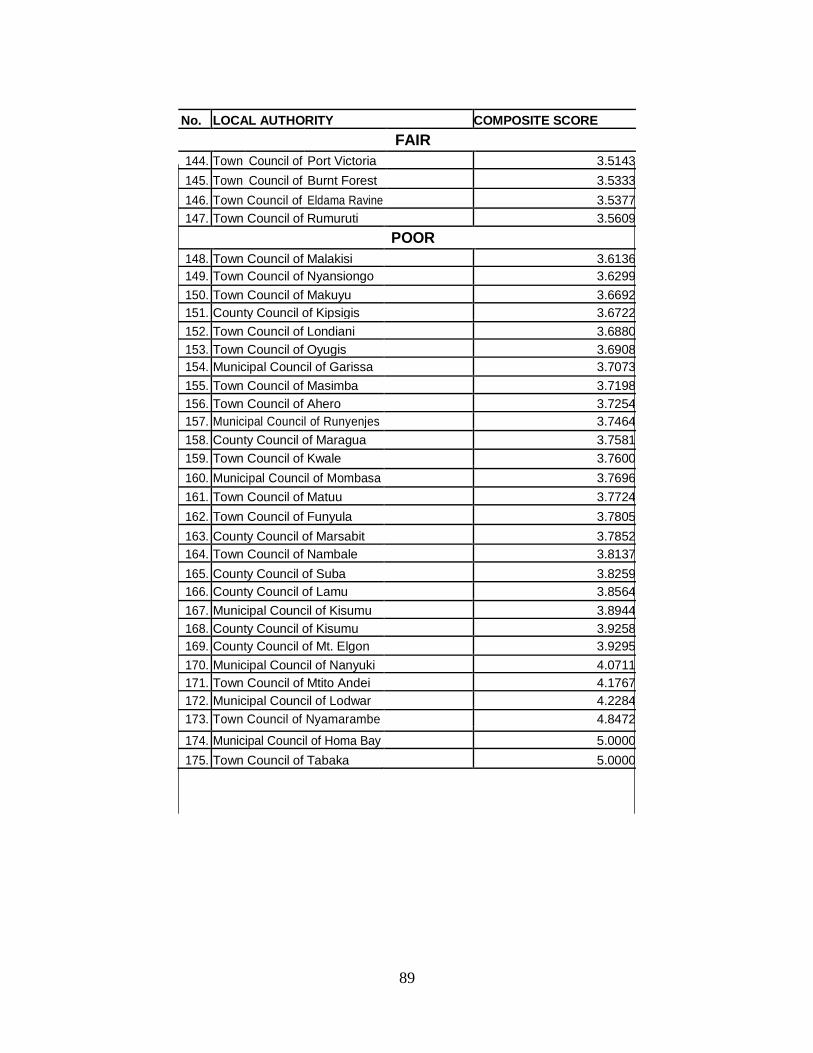
89
No. LOCAL AUTHORITY COMPOSITE SCORE
FAIR
144. Town Council of Port Victoria 3.5143
145. Town Council of Burnt Forest 3.5333
146. Town Council of Eldama Ravine 3.5377 147. Town Council of Rumuruti 3.5609
POOR
148. Town Council of Malakisi 3.6136 149. Town Council of Nyansiongo 3.6299
150. Town Council of Makuyu 3.6692 151. County Council of Kipsigis 3.6722
152. Town Council of Londiani 3.6880 153. Town Council of Oyugis 3.6908 154. Municipal Council of Garissa 3.7073
155. Town Council of Masimba 3.7198 156. Town Council of Ahero 3.7254 157. Municipal Council of Runyenjes 3.7464
158. County Council of Maragua 3.7581
159. Town Council of Kwale 3.7600
160. Municipal Council of Mombasa 3.7696
161. Town Council of Matuu 3.7724
162. Town Council of Funyula 3.7805
163. County Council of Marsabit 3.7852 164. Town Council of Nambale 3.8137
165. County Council of Suba 3.8259 166. County Council of Lamu 3.8564
167. Municipal Council of Kisumu 3.8944 168. County Council of Kisumu 3.9258 169. County Council of Mt. Elgon 3.9295
170. Municipal Council of Nanyuki 4.0711 171. Town Council of Mtito Andei 4.1767 172. Municipal Council of Lodwar 4.2284
173. Town Council of Nyamarambe 4.8472
174. Municipal Council of Homa Bay 5.0000
175. Town Council of Tabaka 5.0000

1