Relations Between Rainfall and Postfire Debris-Flow and ...Gabriel Mountains of southern California...
31
Relations Between Rainfall and Postfire Debris-Flow and Flood Magnitudes for Emergency-Response Planning, San Gabriel Mountains, Southern California By Susan H. Cannon, 1 Eric M. Boldt, 2 Jason W. Kean, 1 Jayme L. Laber, 2 and Dennis M. Staley 1 1 U.S. Geological Survey 2 National Oceanic and Atmospheric Administration, National Weather Service Open-File Report 2010–1039 U.S. Department of the Interior U.S. Geological Survey
Transcript of Relations Between Rainfall and Postfire Debris-Flow and ...Gabriel Mountains of southern California...

Relations Between Rainfall and Postfire Debris-Flow and Flood Magnitudes for Emergency-Response Planning, San Gabriel Mountains, Southern California By Susan H. Cannon,1 Eric M. Boldt,2 Jason W. Kean,1 Jayme L. Laber,2 and Dennis M. Staley1
1U.S. Geological Survey2National Oceanic and Atmospheric Administration, National Weather Service
Open-File Report 2010–1039
U.S. Department of the InteriorU.S. Geological Survey

U.S. Department of the InteriorKEN SALAZAR, Secretary
U.S. Geological SurveyMarcia K. McNutt, Director
U.S. Geological Survey, Reston, Virginia: 2010
For product and ordering information:World Wide Web: http://www.usgs.gov/pubprodTelephone: 1-888-ASK-USGS
For more information on the USGS—the Federal source for science about the Earth,its natural and living resources, natural hazards, and the environment:World Wide Web: http://www.usgs.govTelephone: 1-888-ASK-USGS
Suggested citation:Cannon, S.H., Boldt, E.M., Kean, J.W., Laber, J.L., and Staley, D.M., 2010, Relations between rainfall and postfire debris-flow and flood magnitudes for emergency-response planning, San Gabriel Mountains,southern California: U.S. Geological Survey Open–File Report 2010-1039, 31 p.
Cover photograph: Emergency response vehicle in rain storm. Photograph courtesy of L.A. County Fire Department.
Any use of trade, product, or firm names is for descriptive purposes only and does not imply endorsement by the U.S. Government.
Although this report is in the public domain, permission must be secured from the individual copyright owners to reproduce any copyrighted material contained within this report.

3
Contents
Abstract ......................................................................................................................................................................... 5 Introduction .................................................................................................................................................................... 6 Previous Work ............................................................................................................................................................... 7
Postfire Debris Flows ................................................................................................................................................. 7 Rainfall Conditions that Result in Postfire Debris Flows and Floods .......................................................................... 8
Approach ....................................................................................................................................................................... 9 Results ..........................................................................................................................................................................11
National Weather Service (NWS) Rainfall Forecasts for the San Gabriel Mountains ................................................11 Debris-Flow and Flood Magnitudes ..........................................................................................................................12 Storm Rainfall Data ...................................................................................................................................................13 Relations Between Rainfall and Debris Flow and Flood Magnitudes .......................................................................13 Emergency Response Decision Chart ......................................................................................................................15
Limitations of Approach ................................................................................................................................................18 Summary and Conclusions ...........................................................................................................................................18 References Cited ..........................................................................................................................................................20
Figures
1. (A) Burned areas and year of fire in southern California for which triggering storm rainfall and response magnitude are compiled in this report. (B) Detailed view of northern part of figure 1A. .........................................6, 7
2. Example of Quantitative Precipitation Forecast (QPF) issued by National Weather Service (NWS) for burned areas within Los Angeles County, including the San Gabriel Mountains .....................................................11
3. Within-storm rainfall accumulations for different durations measured from storms that triggered magnitude 0, I, II, and III debris flows and floods ....................................................................................................14
4. Emergency response decision chart .........................................................................................................................16
Tables 1. Storm date, fire name and date, hydrologic response, information sources and assigned debris flow and
flood magnitude ................................................................................................................................................. 22-25 2. Magnitude classification of debris-flow and flood events ..........................................................................................13 3. Storm data including (A) total rainfall, storm duration, rainfall up to known time of response, storm
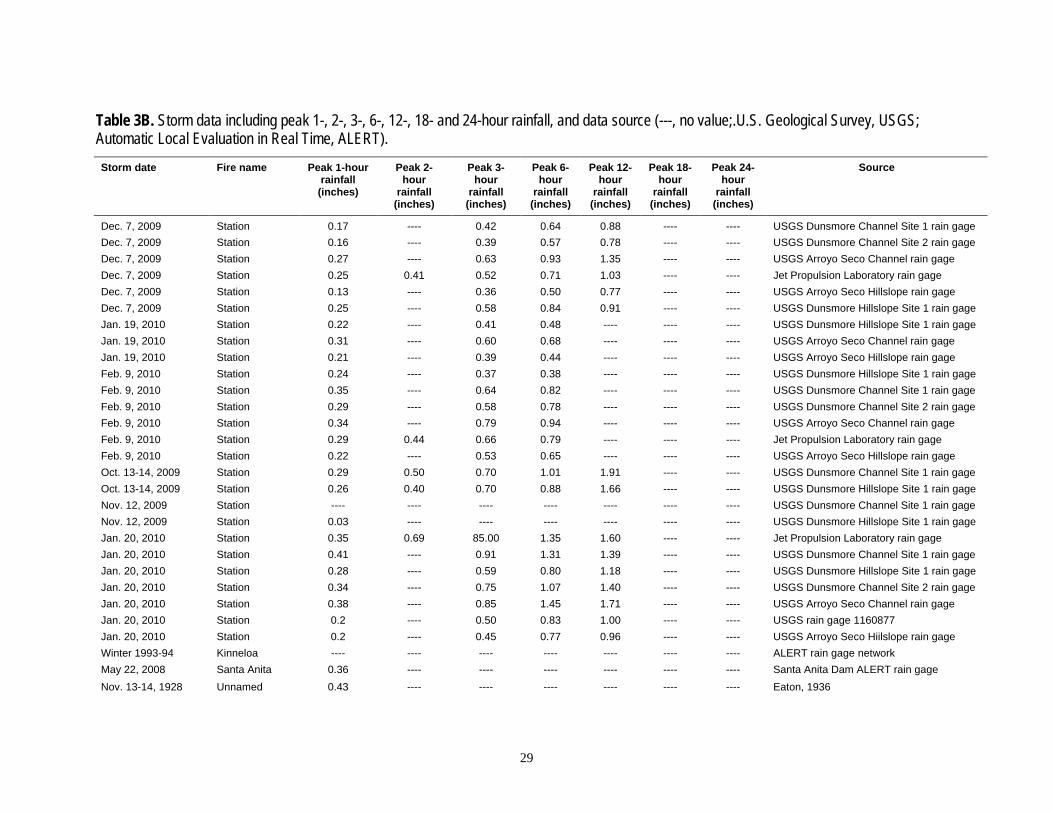
duration up to known time of response, and peak 5-, 10-, 15-, and 30-minute rainfall; (B) peak 1-, 2-, 3-, 6-, 12-, 18- and 24-hour rainfall, and data source.............................................................................................. 26-31
4. Values for storm rainfall accumulation-duration and intensity-duration thresholds above which different magnitude events can be expected .........................................................................................................................15

4
Conversion Factors Inch/Pound to SI
Multiply By To obtain
Length
inch (in.) 2.54 centimeter (cm)
inch (in.) 25.4 millimeter (mm)
mile (mi) 1.609 kilometer (km)
yard (yd) 0.9144 meter (m)
Area acre 4,047 square meter (m2)
acre 0.4047 hectare (ha)
acre 0.4047 square hectometer (hm2)
acre 0.004047 square kilometer (km2)
square mile (mi2) 259.0 hectare (ha)
square mile (mi2) 2.590 square kilometer (km2)
Volume cubic yard (yd3) 0.7646 cubic meter (m3)
acre-foot (acre-ft) 1,233 cubic meter (m3)
Relations Between Rainfall and Postfire Debris-Flowand Flood Magnitudes for Emergency-Response Planning, San Gabriel Mountains, Southern CaliforniaBy Susan H. Cannon,1 Eric M. Boldt,2 Jason W. Kean,1 Jayme L. Laber,2 and Dennis M. Staley1
1U.S. Geological Survey, Landslide Hazards Program2National Oceanic and Atmospheric Administration, National Weather Service
AbstractFollowing wildfires, emergency-response and public-safety agencies are faced often with
making evacuation decisions and deploying resources both well in advance of each coming winter storm and during storms themselves. Information critical to this process is provided for recently burned areas in the San Gabriel Mountains of southern California. The National Weather Service (NWS) issues Quantitative Precipitation Forecasts (QPFs) for the San Gabriel Mountains twice a day, at approximately 4 a.m. and 4 p.m., along with unscheduled updates when conditions change. QPFs provide estimates of rainfall totals in 3-hour increments for the first 12-hour period and in 6-hour increments for the second 12-hour period. Estimates of one-hour rainfall intensities can be provided in the forecast narrative, along with probable peak intensities and timing, although with less confidence than rainfall totals. A compilation of information on the hydrologic response to winter storms from recently burned areas in southern California steeplands was used to develop a system for classifying the magnitude of the postfire hydrologic response. The four-class system is based on a combination of the reported volume of individual debris flows, the consequences of these events in an urban setting, and the spatial extent of the response to the triggering storm. Threshold rainfall conditions associated withdebris flow and floods of different magnitude classes are defined by integrating local rainfall data with debris-flow and flood magnitude information. The within-storm rainfall accumulations (A) and durations (D) above which magnitude I events are expected are defined by A=0.3D0.6.The function A=0.5D0.6 defines the within-storm rainfall accumulations and durations above which a magnitude III event will occur in response to a regional-scale storm, and a magnitude II event will occur if the storm affects only a few drainage basins. The function A=1.0D0.5defines the rainfall conditions above which magnitude III events can be expected. Rainfall trigger-magnitude relations are linked with potential emergency-response actions in the form of anemergency-response decision chart. The chart leads a user through steps to determine potential event magnitudes, and identify possible evacuation and resource-deployment levels as a function of either individual storm forecasts or measured precipitation during storms. The ability to use this information in the planning and response decision-making process may result in significant financial savings and increased safety for both the public and emergency responders.
5

6
Introduction
As consequence of the Station fire (fig. 1), which burned 160,557 acres of the San Gabriel Mountains of southern California in August and September, 2009 (National Interagency Fire Center, 2009), postfire floods and debris flows now pose significant hazards to life and property (Cannon and others, 2009). Emergency-response and public-safety agencies are faced with making evacuation decisions and deploying staff and emergency-response equipment both well in advance of each coming winter storm and during actual storms themselves. In this report, we provide information that is critical to this process. We first describe the information that is included in precipitation forecasts provided by the National Weather Service (NWS) for the San Gabriel Mountains, and the timeframes under which this information is available. Compilations of the hydrologic response to winter storms and measures of the associated triggering rainfall from recently burned areas in southern California are used to develop a system for classifying postfire hydrologic event magnitudes, and to identify the storm rainfall conditions that have resulted in debris flows and floods in this setting. We then define relations between triggering rainfall conditions and flood and debris-flow magnitudes that are specific to the San Gabriel Mountain setting. By linking this information to emergency-response actions routinely implemented by fire department and incident command centers, we develop an emergency response decision chart. This chart can be used to: (1) determine potential event magnitudes and (2) identify possible evacuation and resource-deployment levels based on either individual storm forecasts or measured precipitation during storms. The ability to base planning and response decisions on specific storm forecasts and precipitation measurements may result in significant financial savings and increased safety for both the public and emergency responders.
Figure 1A. Burned areas (yellow fill) and year of fire in southern California for which triggering storm rainfall and response magnitude are compiled in this report.

7
Figure 1B. Detailed view of northern part of figure 1A. Previous Work Postfire Debris Flows
Debris flows can pose significant hazards to life and property. Fast-moving debris flows generated from recently burned areas are particularly dangerous because they can occur in places where flooding or debris flows have not been observed in the past and can be generated in response to little rainfall (Cannon and others, 2008). In recently burned areas, rainfall that normally is captured and stored by vegetation can run off almost instantly, causing creeks and drainage areas to flood much sooner during a storm and with more water than is expected under unburned conditions. Soils in a burned area can be highly erodible, so runoff will contain significant amounts of ash, mud, boulders, and vegetation. Within the burned area and downstream, the powerful force of rushing water, soil, and rock can destroy buildings, roadways, culverts, and bridges and can cause injury or death.
The association between debris flows and floods and wildfires is well established in the San Gabriel Mountains. When the fires that consume the vegetation from the extremely steep, rugged canyons are followed by the high-intensity rain storms that characterize the area, destructive floods and debris flows are a frequent result (for example, Eaton, 1936; Scott, 1971; Scott and Williams, 1978; McPhee, 1989; Slosson and Shuriman, 1992).
Field observations from recently burned basins throughout Southern California indicate that the majority of debris flows that occur within the first two years following wildfires are

8
generated through the process of progressive entrainment of material eroded from hillslopes and channels by surface runoff, rather than by infiltration-triggered landsliding, as is common in unburned settings (Cannon and Gartner, 2005). Exceptions, however, can occur when storm rainfall is sufficient to generate landslides from unburned hillslopes; when this occurs, it is not uncommon to also see landslides generated from burned hillslopes (for example, Scott and Williams, 1978).
Rainfall Conditions that Lead to Postfire Debris Flows
Empirically derived rainfall intensity-duration or rainfall accumulation-duration
thresholds have been widely used to identify rainfall conditions that will lead to the generation of debris flows (see a world-wide compilation of rainfall thresholds at http://rainfallthresholds.irpi.cnr.it). This work is based on the widely-held principle that debris-flow triggering conditions cannot be defined by a total depth of rainfall, or by instantaneous rainfall intensity, but are more accurately characterized as a function of either of these two measures and the time period over which they occur (Caine, 1980). In addition, triggering rainfall conditions are best represented by a range of either intensities and durations or rainfall accumulations and durations that are specific to a given setting (for example, Caine, 1980; Larsen and Simon, 1993; Godt and others, 2006; Cannon and others, 2008; Guzzetti and others, 2008). Thus, for a given setting, debris flows can be triggered by a set of rainfall conditions that may range from high rainfall intensities that occur over short durations to lower rainfall intensities maintained over longer durations. Because rainfall intensity is calculated as the amount of rain divided by a given time period, debris flows also can be considered to be triggered by rainfall conditions that range between low rainfall accumulations over short durations and higher rainfall accumulations maintained for longer durations.
Destructive debris flows from recently burned areas in southern California have been found to occur in response to short-duration thunderstorms and to longer duration frontal storms, as well as a combination of these storm types (Cannon and others, 2008). Rain-gage and response information from recently burned basins throughout southern California shows that debris flows have occurred after as little as 30 minutes, and as much as 38 hours, of rainfall with intensities between 0.03 and 1.0 inches per hour. Short periods of high-intensity rainfall within lower-intensity storms also have been described as the triggers of postfire debris flows (for example, Eaton, 1936; Scott and Williams, 1978). Unusual or long recurrence-interval storms are not necessary to generate debris flows from recently burned areas; storms with recurrence intervals of less than 2 years (storms with a greater than 50 percent probability of occurring during any given year) have triggered destructive debris flows from burned areas in southern California (Cannon and others, 2008).
Cannon and others (2008) defined threshold rainfall intensity-duration conditions for the generation of postfire floods and debris flows for three southern California regions, one of which includes the San Gabriel, San Bernardino, and San Jacinto Mountains. These regional thresholds are thought to generally reflect the rainfall conditions associated with debris-flow and flood occurrences, but do not address the conditions that will produce events with varying magnitudes. In addition, debris-flow triggering rainfall will vary with burn severity, basin sizes and gradients, and material properties (Cannon and others, 2010), as well as with local rainfall regimes (Moody and Martin, 2009); these fire-specific and local effects are not accounted for in the regional rainfall intensity-duration thresholds.

9
In this report we advance from the existing regional definition of storm rainfall conditions that may lead to floods and debris flows from recently burned southern California steeplands as defined in Cannon and others (2008) to develop information that is specifically relevant to conditions in the San Gabriel Mountains. By linking local rainfall information with debris-flow- and flood-magnitude documentation, we are able to define the rainfall conditions that may lead to debris flow and floods of different magnitudes from recently burned areas, thus providing critical information for emergency-response planning. This work is of particular relevance for agencies tasked with postfire-emergency planning and response in the San Gabriel Mountains. Approach
For the present effort, discussions were held with local and state public-safety and emergency-response agencies charged with protecting people and property that might be affected by debris flows and floods from the 2009 Station fire to identify how they used information included in precipitation forecasts. Existing emergency-response plans were evaluated to identify the types of information routinely included, and to determine how to best integrate available science-based information on postfire debris-flow processes and triggers.
Rainfall and hydrologic response information from storms that triggered floods and debris flows from areas recently burned by wildfires in steep, rugged terrain throughout southern California were compiled from published reports and books, written communications, and USGS and NWS monitoring efforts (figs. 1A and B). Although information from other fires and storms is available, this effort focused on those events for which storm rainfall is reported either in terms of within-storm accumulations for different durations, or as rainfall intensities maintained for given durations, and where either the possibility or the actual occurrence of a basin-scale flood or debris-flow response has been documented.
Available information on the magnitude of the debris-flow or flood response to each storm also was compiled. We documented the number of drainage basins, channels, or locations known to be affected, and when available, reported flow velocities and volumes of deposited material. Information on the impact to the built environment, as it existed at the time of the event, also was compiled.
Storm-rainfall characteristics were reported in a number of different ways, ranging from total storm rainfall and durations, to total accumulations for different time periods within a storm, to peak rainfall intensities for different time periods, to six-minute accumulations for the entire storm period. Because the rainfall conditions that lead to postfire debris flows can be described in terms of either rainfall intensities or within-storm accumulations, data reported as rainfall intensities were converted to within-storm totals, and data reported as within-storm totals were converted to intensities, allowing for the option to evaluate the data set in either form. In addition, because we do not know exactly what characteristics of a storm control the hydrologic response, we tried to characterize the storm rainfall for each event as completely as possible, given the available data. When possible, we calculated measures of peak within-storm rainfall accumulations for time periods ranging from 5 minutes up to 24 hours within a given storm. With this approach, a single storm is characterized by several different measures of storm rainfall. For the cases when the time of the onset of debris-flow or flood activity within a storm was available, we compiled measurements of storm rainfall conditions up to those times, rather

10
than for the entire storm record. This allowed for a more accurate characterization of triggering storm conditions.
The data included in the compilation represent varying degrees of relevance to recently burned areas within the San Gabriel Mountains. The most relevant information is that collected from past events in the San Gabriel Mountains themselves, and includes data collected at monitoring sites within basins burned by the 2009 Station fire during the winter of 2009-2010. The relevance of additional information from throughout southern California is considered to decrease with distance from the San Gabriel Mountains (figs. 1A and B).
Relations between rainfall conditions and the magnitude of the hydrologic response were defined by first graphing the measures of storm rainfall as a function of the time period over which it was measured at a log-log scale. The log-scale plot was necessary to discern the closely-spaced data associated with short durations. Boundaries between rainfall conditions and the magnitude of the hydrologic response then were established based on visual examination of the data and assumptions of the strength of specific data points based on the proximity of the rain gage to the reported response and to the San Gabriel Mountains.
The considerable spatial and temporal variability in rainfall conditions that occurs during storms can result in significant overlap between measured rainfall conditions relative to response magnitudes. For example, some rainfall measurements from storms that trigger large and spatially extensive events can be expected to be in the range of rainfall measurements from storms that produced smaller and less extensive events. It is not known exactly which of the measures of rainfall compiled for each storm most strongly correspond to the occurrence of debris flows. However, we assume that those conditions that occurred during storms that did not result in a substantial hydrologic response are not likely to have produced a response during other storms.
In unburned settings, characterization of the rainfall conditions that lead to the occurrence of debris flows requires identification of antecedent rainfall accumulations during the preceding season (for example, Wieczorek and Glade, 2005). In burned settings, however, a quantitative understanding of the role that antecedent rainfall and soil moisture play in the generation of debris flows is largely absent. What we do know is that large debris flows have been generated over extensive areas in response to the first significant storm to impact burned areas (Cannon and others, 2008). This suggests that either drier soils are more susceptible to postfire debris flow generation, or that the antecedent soil moisture conditions sufficient to affect debris-flow susceptibility in burned settings may be attained within individual storms themselves, and at this time, we don’t know what these conditions might be. However, evaluation of soil-moisture data collected during and after rainstorms in recently burned areas in southern California by Staley and others (2008) indicated that hillslope soil moisture returns to prestorm conditions after approximately eight hours without rainfall. We also have learned that soil-moisture conditions in materials over which a debris flow travels will strongly influence the volume of material that is incorporated into the flow itself (Reid and others, 2009). This finding is important for recently burned areas in that most of the materials in postfire debris flows are entrained from the channel itself (Santi and others, 2008), and thus, larger debris flows may be produced when the channel materials are wetter. Given the quantitative uncertainties with antecedent rainfall or soil-moisture conditions in recently burned areas, we have taken the approach of considering each storm that occurs after approximately eight hours with no rainfall as a single entity, and continuous, or back-to-back, storms without intervening dry periods of at least eight hours are considered to indicate an increased potential for the occurrence of large debris flows.

11
Results National Weather Service Precipitation Forecasts for the San Gabriel Mountains
NWS issues quantitative precipitation forecasts (QPFs) for the San Gabriel Mountains twice a day, at approximately 4 a.m. and at 4 p.m., along with unscheduled updates when conditions change such that the existing forecast no longer is representative. Forecasts are provided for each county for the following 24-hour period, and include estimates of the expected rainfall totals in 3-hour increments for the first 12-hour period and in 6-hour increments for the second12-hour period for specific locations (fig. 2). In addition, the anticipated 1-hour rainfall intensities, and the time period during which these can be expected, are provided for coastal and valley areas and foothills and mountains for each county. The forecasts also indicate if thunderstorms are expected within the 24-hour rainfall forecast period in order to highlight the potential for localized heavy rainfall and associated high rainfall intensities. The final discussion covers the following 7-day period and includes information about specific burned areas and if watches or warnings have been issued. Precipitation forecasts are available at http://www.wrh.noaa.gov/lox/scripts/getprodplus.php?wfo=lox&prod=laxqpslox, with additional forecast discussions at http://www.wrh.noaa.gov/lox/scripts/getprodplus.php?sid=lox&pil=afd&back=yes.
Figure 2. Example of Quantitative Precipitation Forecast (QPF) issued by National Weather Service (NWS) for burned areas within Los Angeles County, including the San Gabriel Mountains.
12
Although estimates of rainfall intensities can be included in precipitation forecasts, there is considerable uncertainty with these values. Forecast rainfall totals usually arrive as a series of waves of high-intensity rainfall separated by periods of less intense rain. Methods for forecasting the rainfall intensity variability associated with these waves are not well developed. During a storm itself, however, the NWS can report rainfall intensities either measured at rain gages located within and upstream of the burned area, or indicated as by radar data.
Because debris flows and floods from recently burned areas are frequently triggered by periods of high-intensity rainfall associated with thunderstorms, NWS forecasters pay particular attention to conditions that can lead to their generation, as well as the presence of thunderstorms embedded in larger-scale storm systems. NWS forecasters look for cold fronts that can provide additional lift, upslope-wind flow that may enhance rain intensities, and any instability along or behind a front that can lead to convective cells. In these cases, the entire projected rainfall amount could affect an area in a short time period and at high intensities. In addition, convective cells can move rapidly, hitting one area and not another, and varying considerably in intensity.
NWS issues flash flood watches between 12 and 24 hours in advance of heavy rain to provide notification about the threat of predicted rainfall accumulations that could lead to floods and debris flows from recently burned areas. Flash flood warnings are issued for recently burned areas when debris-flow and flood-triggering rainfall conditions are imminent or occurring based on information from real-time rain gages located both upstream and in the burn perimeter, nearby storm spotter reports, and interrogation of the Doppler Radar Flash Flood Monitoring and Prediction (FFMP) system and one-hour precipitation estimates. Given the immediacy of runoff and debris flow activity, warning lead times vary from just a few minutes to 45 minutes or more. Debris-Flow and Flood Magnitudes
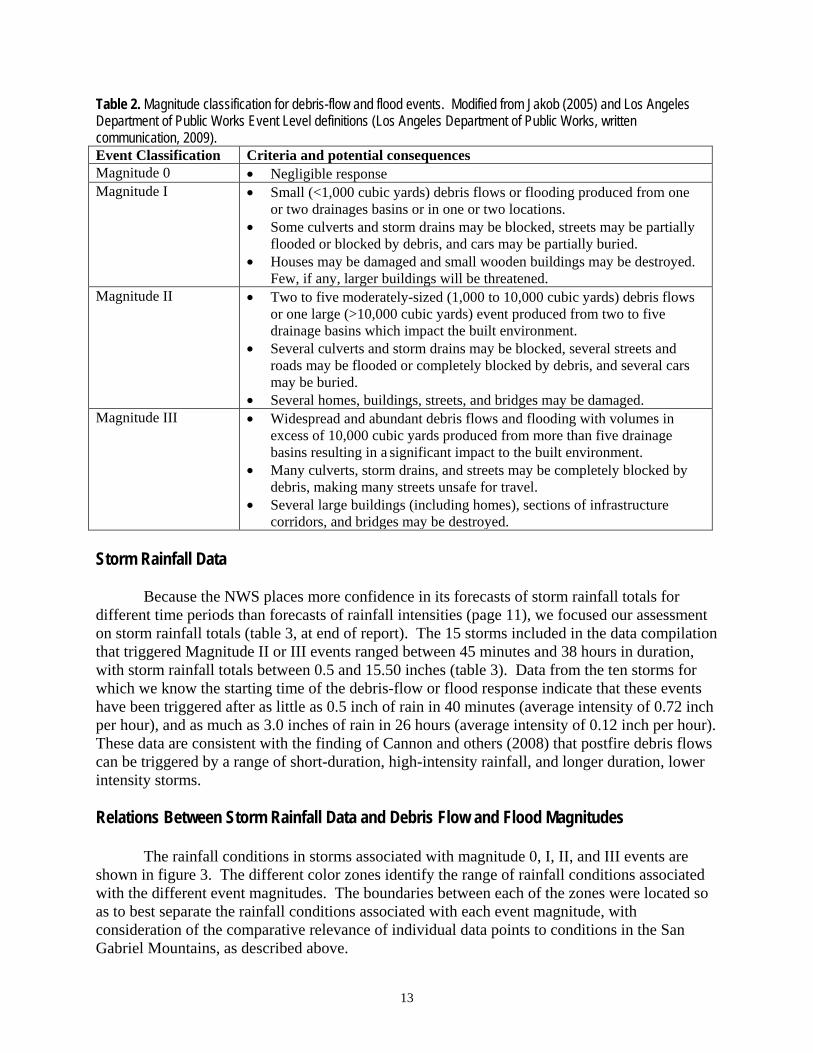
Our data search resulted in information on the hydrologic response to 23 storms and two full winter seasons from 16 different burned areas in southern California (table 1, at end of report). Based on the range of information available on the spatial extent and size of postfire debris-flows and floods in southern California, reviews of existing size classifications for debris flows (for example, Jakob, 2005), and Los Angeles Department of Public Works Event Level definitions (Los Angeles Department of Public Works, written communication, 2009), we defined criteria for classifying each known hydrologic response as one of three possible magnitudes (table 2). This system for classifying the magnitude of the hydrologic response incorporates the volumes of individual debris flows, consequences of these events in an urban setting (such as that along the San Gabriel Mountain Front), and the spatial extent of the response to the triggering storm.
Each debris flow and flood for which data were available was classified as one of four possible magnitudes (table 2). Ten of the storms triggered magnitude II debris flow or floods, and seven triggered magnitude III events (table 1). Note that storms may trigger a magnitude I event in some areas and a magnitude II event in others, and that both the Mill Creek and Middle fires were affected by the February 8-10, 1978 storm.
13
Table 2. Magnitude classification for debris-flow and flood events. Modified from Jakob (2005) and Los Angeles Department of Public Works Event Level definitions (Los Angeles Department of Public Works, written communication, 2009). Event Classification Criteria and potential consequences Magnitude 0 • Negligible response Magnitude I • Small (<1,000 cubic yards) debris flows or flooding produced from one
or two drainages basins or in one or two locations. • Some culverts and storm drains may be blocked, streets may be partially
flooded or blocked by debris, and cars may be partially buried. • Houses may be damaged and small wooden buildings may be destroyed.
Few, if any, larger buildings will be threatened. Magnitude II • Two to five moderately-sized (1,000 to 10,000 cubic yards) debris flows
or one large (>10,000 cubic yards) event produced from two to five drainage basins which impact the built environment.
• Several culverts and storm drains may be blocked, several streets and roads may be flooded or completely blocked by debris, and several cars may be buried.
• Several homes, buildings, streets, and bridges may be damaged. Magnitude III • Widespread and abundant debris flows and flooding with volumes in
excess of 10,000 cubic yards produced from more than five drainage basins resulting in a significant impact to the built environment.
• Many culverts, storm drains, and streets may be completely blocked by debris, making many streets unsafe for travel.
• Several large buildings (including homes), sections of infrastructure corridors, and bridges may be destroyed.
Storm Rainfall Data
Because the NWS places more confidence in its forecasts of storm rainfall totals for
different time periods than forecasts of rainfall intensities (page 11), we focused our assessment on storm rainfall totals (table 3, at end of report). The 15 storms included in the data compilation that triggered Magnitude II or III events ranged between 45 minutes and 38 hours in duration, with storm rainfall totals between 0.5 and 15.50 inches (table 3). Data from the ten storms for which we know the starting time of the debris-flow or flood response indicate that these events have been triggered after as little as 0.5 inch of rain in 40 minutes (average intensity of 0.72 inch per hour), and as much as 3.0 inches of rain in 26 hours (average intensity of 0.12 inch per hour). These data are consistent with the finding of Cannon and others (2008) that postfire debris flows can be triggered by a range of short-duration, high-intensity rainfall, and longer duration, lower intensity storms. Relations Between Storm Rainfall Data and Debris Flow and Flood Magnitudes
The rainfall conditions in storms associated with magnitude 0, I, II, and III events are shown in figure 3. The different color zones identify the range of rainfall conditions associated with the different event magnitudes. The boundaries between each of the zones were located so as to best separate the rainfall conditions associated with each event magnitude, with consideration of the comparative relevance of individual data points to conditions in the San Gabriel Mountains, as described above.

Figure 3. Within-storm rainfall accumulations for different durations measured from storms that triggered magnitude 0, I, II, and III debris flows and floods. Open squares, measures of rainfall conditions within storms associated with a negligible response, blue squares, measures of rainfall conditions within storms associated with magnitude I events;orange triangles, measures of rainfall conditions within storms that triggered magnitude II events; and red circles, measures of rainfall conditions within storms associated with magnitude III events. Lines dividing rainfall conditions specific to each magnitude are dashed for time periods less than 30 minutes, indicating that debris flows and floods have been triggered from recently burned areas in southern California steeplands after approximately 30 minutes of rainfall, but have not been reported in response to any shorter durations.
The boundaries between the event magnitude zones each define threshold rainfall accumulation-duration conditions above and below which postfire debris flows and floods of a given magnitude may be generated. As is typical of many thresholds that define rainfall conditions associated with the occurrence of landslides, these thresholds can each be represented by a power law relation between rainfall accumulation and duration, as shown in figure 3.
Our data and observations of the response to storms affecting the Station fire indicate that storms that impact only two to five drainage basins and thus result in a magnitude II event mayalso be capable of triggering a magnitude III event if they occur over a larger area. In figure 3, the rainfall conditions associated with magnitude II events are intermixed with those from magnitude III events. Many of the magnitude II data are from storms on November 12 and December 10-13, 2009, which dropped significant amounts of rain over just a few drainage
14
15
basins within the area burned by the Station fire, and triggered damaging debris flows and floods within those drainage basins that received the highest rainfall (tables 1 and 2). Because debris flows and floods were produced from only a few drainage basins, the responses to these storms were classified as magnitude II events. The overlap of these data with those from magnitude III events indicates that had the storms impacted a larger area, the rainfall conditions associated with these storms may have triggered a magnitude III event. We thus identified the portion of figure 3 occupied by storm rainfall conditions measured from both magnitude II and III storms as those storm rainfall conditions that will result in a magnitude III event if associated with a broad, regional storm, and will result in a magnitude II event if associated with a localized storm.
Note that the potential for postfire debris flows and floods will decrease with time as revegetation stabilizes hillslopes and material is removed from canyons. As a result, the rainfall accumulation-duration relations shown in figure 3 will indicate an increasingly conservative estimate of the rainfall conditions that may lead to the generation of debris flows and floods with time.
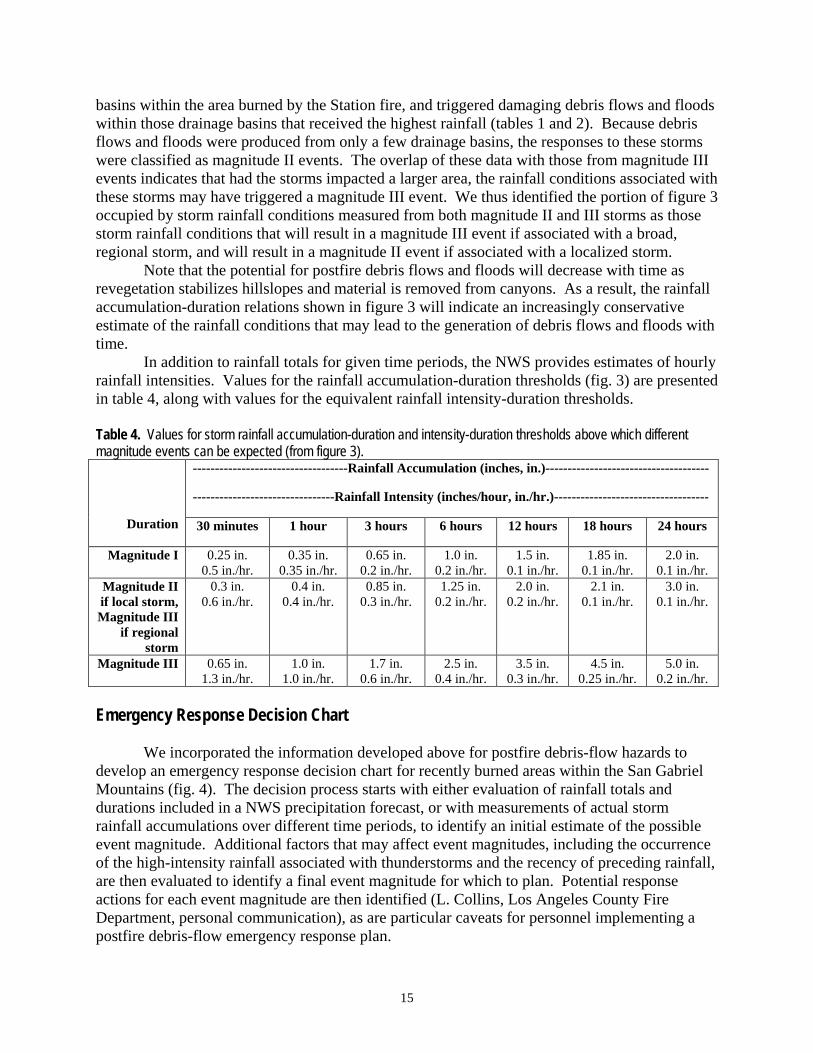
In addition to rainfall totals for given time periods, the NWS provides estimates of hourly rainfall intensities. Values for the rainfall accumulation-duration thresholds (fig. 3) are presented in table 4, along with values for the equivalent rainfall intensity-duration thresholds.
Table 4. Values for storm rainfall accumulation-duration and intensity-duration thresholds above which different magnitude events can be expected (from figure 3).
Duration
-----------------------------------Rainfall Accumulation (inches, in.)-------------------------------------
--------------------------------Rainfall Intensity (inches/hour, in./hr.)-----------------------------------
30 minutes 1 hour 3 hours 6 hours 12 hours 18 hours 24 hours
Magnitude I 0.25 in. 0.5 in./hr.
0.35 in. 0.35 in./hr.
0.65 in. 0.2 in./hr.
1.0 in. 0.2 in./hr.
1.5 in. 0.1 in./hr.
1.85 in. 0.1 in./hr.
2.0 in. 0.1 in./hr.
Magnitude II if local storm, Magnitude III
if regional storm
0.3 in. 0.6 in./hr.
0.4 in. 0.4 in./hr.
0.85 in. 0.3 in./hr.
1.25 in. 0.2 in./hr.
2.0 in. 0.2 in./hr.
2.1 in. 0.1 in./hr.
3.0 in. 0.1 in./hr.
Magnitude III 0.65 in. 1.3 in./hr.
1.0 in. 1.0 in./hr.
1.7 in. 0.6 in./hr.
2.5 in. 0.4 in./hr.
3.5 in. 0.3 in./hr.
4.5 in. 0.25 in./hr.
5.0 in. 0.2 in./hr.
Emergency Response Decision Chart
We incorporated the information developed above for postfire debris-flow hazards to develop an emergency response decision chart for recently burned areas within the San Gabriel Mountains (fig. 4). The decision process starts with either evaluation of rainfall totals and durations included in a NWS precipitation forecast, or with measurements of actual storm rainfall accumulations over different time periods, to identify an initial estimate of the possible event magnitude. Additional factors that may affect event magnitudes, including the occurrence of the high-intensity rainfall associated with thunderstorms and the recency of preceding rainfall, are then evaluated to identify a final event magnitude for which to plan. Potential response actions for each event magnitude are then identified (L. Collins, Los Angeles County Fire Department, personal communication), as are particular caveats for personnel implementing a postfire debris-flow emergency response plan.

16
Figure 4. Emergency response decision chart.

17
To illustrate the use for the decision chart (fig. 4) and figure 3, we first consider a storm forecast for up to 4.0 inches of rain falling in the next 12-hour period. These rainfall conditions fall clearly within the range of conditions that have triggered magnitude III events in the past (fig. 3), and decision makers should plan their response accordingly (fig. 4). Should the forecast be for 4 inches of rain over a 24 hour period, and thunderstorms are included in the forecast, a magnitude III event again is clearly indicated, and a potential response is suggested in figure 4. A forecast of 4 inches of rain between approximately 12 and 20 hours falls on the boundary between magnitude II and III events (fig. 3). Should thunderstorms be included in the forecast, or if there was appreciable rainfall in the preceding eight hours, a magnitude III event would again appear to be in the making. Should neither thunderstorms nor previous rainfall be issues, the possibility of a magnitude II event can be considered. In the absence of thunderstorms or previous rainfall, 4 inches of rain forecast for a 20-hour or greater time period indicates the potential for a magnitude II event.
A forecast of one inch of rain for any period less than approximately one hour indicates the possibility of a magnitude III event, and should be planned for accordingly (fig. 4). A forecast of one inch of rainfall in 2 hours and the absence of thunderstorms or preceding rainfall indicates the possibility of a magnitude III response if a regional scale storm is forecast, or a magnitude II event should the forecast be for a more localized impact. A forecast of one inch of rain in 3 to 6 hours, and the absence of thunderstorms and preceding rainfall, indicates that planning should be appropriate for a magnitude I event, and a forecast of one inch of rain during any time period greater than about 6 hours indicates a negligible effect (fig. 4).
As a practical illustration of the utility and function of the decision chart (fig. 4) and figure 3, please consider the information provided in the example forecast shown in figure 2. The forecast calls for between 1.5 and 3.0 inches of rain to fall over a 24-hour period. If we locate the rainfall accumulation of 1.5 inches over the 24-hour duration on figure 3, we will see that these values fall within the area characterized as a magnitude 0, or that the expected response would be negligible. However, given the range in the forecast of 1.5 to 3.0 inches in a 24-hour period, a magnitude I, II or III events may also be in the making. Such ambiguity should not be surprising in any effort to predict natural hazards, and points to the need for examining additional information, as follows.
The example forecast (fig. 2) also provides estimates of rainfall expected for specific locations within Los Angeles County for the next 12-hour period in 3-hour increments, for the subsequent 12 hours in 6 hour increments, as well as potential peak one-hour rainfall rates. The forecast indicates that approximately 2.0 inches of rain will fall during the first 12 hours, followed by 1.0 inch in the subsequent 12 hours. Again, 2.0 inches of rain in a 12-hour period suggests the possibility of either a Magnitude II or III response, while the 1.0 inch of rain in the subsequent period shouldn’t generate much of a hydrological response. Potential peak one-hour rainfall rates between 0.25 and 0.50 inches per hour indicate the same response. However, an important piece of information provided in the forecast is that thunderstorms, and their associated high-intensity rainfall, are expected with this storm. This indicates that in response to the rainfall forecast, a magnitude II or III event is certainly in the making, and decision makers should plan their response accordingly.
Figures 3 and 4 also can be used during a storm to identify a potential event magnitude in an area with rain gage coverage and to aid in determining an appropriate emergency response (fig. 4). Should a rainfall accumulation of 2 inches in a one hour period be reported from within a recently burned area, a magnitude III response can certainly be expected (fig. 3), and an

18
appropriate emergency response will be necessary (fig. 4). Similarly, measured rainfall accumulations of 0.5 inch over any time period less than about one hour indicate that a magnitude III event may be underway if the rain is falling across the entire region, and a magnitude II event may be occurring if the storm is localized (fig. 3). Similarly, measured rainfall accumulations of less than 1.0 inch over any time period between about 3 and 6 hours would indicate that a magnitude I event was occurring in the area of the gage. Limitation of Approach
Actual storm conditions may differ from weather forecasts and more severe conditions than those forecast may occur at any time during a storm. In addition, the boundaries between the event magnitudes were located based on interpretation of the available data and should be considered both wide and flexible to allow for the personal judgment and experience of decision makers. In addition, the potential for postfire debris flows and floods will decrease with time as revegetation stabilizes hillslopes and material is removed from canyons. As a result, the estimates of the rainfall conditions that may lead to the generation of debris flows and floods will become increasingly conservative with time, and would thus benefit from continued assessment and adjustment based on site-specific analyses. And last, considerable uncertainty is associated with relying exclusively on rainfall conditions as the basis of emergency-response decisions for recently burned areas; debris-flow magnitude and timing also will depend on factors such as burn severity, material properties and hillslope gradients, in addition to rainfall. Summary and Conclusions
As a consequence of the Station fire, which burned 160,557 acres of the San Gabriel Mountains of southern California in August and September, 2009 (National Interagency Fire Center, 2009), postfire floods and debris flows now pose significant hazards to life and property (Cannon and others, 2009). Emergency-response and public-safety agencies are faced with making evacuation decisions and deploying staff and emergency-response equipment both well in advance of each coming winter storm and during actual storms. In this paper, we provide information critical to this process. The NWS issues Quantitative Precipitation Forecasts (QPFs) for the San Gabriel Mountains twice a day, at approximately 4 a.m. and at 4 p.m., along with unscheduled updates when conditions change. QPFs are for the following 24-hour period and include estimates of the expected rainfall totals in 3-hour increments for the first 12-hour period and in 6-hour increments for the last 12-hour period. Estimates of one-hour rainfall intensities can be provided in the forecast narrative, along with probable peak intensities and timing, although with less confidence than values provided for rainfall totals.
A compilation of the hydrologic response to winter storms from recently burned areas in southern California was used to develop a system for classifying the postfire hydrologic response by magnitude. The three-magnitude classification system incorporates information on the volumes of individual debris flows, the consequences of these events in an urban setting (such as that along the San Gabriel Mountain Front), and the spatial extent of the response to the triggering storm. Each hydrological event was assigned one of three event magnitudes.
Measures of triggering storm rainfall associated with each hydrologic response indicate that significant debris flows and floods (Magnitude II or III events) have been produced from recently burned, southern California steeplands in response to storms that lasted between 45

19
minutes and 38 hours, with storm rainfall totals between 0.5 and 15.50 inches. These events were triggered after as little as 0.5 inch of rain in 40 minutes (average intensity of 0.72 inch per hour), and as much as 3.0 inches of rain in 26 hours (average intensity of 0.12 inch per hour).
Relations between triggering rainfall conditions and flood and debris-flow magnitudes specific to the San Gabriel Mountain setting were defined by three rainfall accumulation-duration thresholds above and below which postfire debris flows and floods of a given magnitude may be generated. The function A=0.3D0.6 defines the within-storm rainfall accumulations (A) and durations (D) above which magnitude I events can be expected. The function A=0.5D0.6 defines the within-storm rainfall accumulations and durations above which a magnitude III event can be produced if the area is affected by a regional storm and a magnitude II event if the storm affects a smaller, local area. And last, the function A=1.0D0.5 defines the rainfall conditions above which magnitude III events can be expected.
By linking rainfall and event-magnitude information with emergency-response actions routinely implemented by fire departments and incident command centers, we developed an emergency response decision chart that can be used to: (1) determine potential event magnitudes as a function of precipitation forecasts or measurements, the occurrence of high-intensity rainfall associated with thunderstorms, and the recency of preceding rainfall, and (2) identify possible evacuation and resource-deployment levels based on individual storm forecasts and measured precipitation during storms. The ability to base planning and response decisions on specific storm forecasts and precipitation measurements may result in significant financial savings and increased safety for both the public and emergency responders.
20
References
Bruington, A.E., 1982, Fire-loosened sediment menaces the city: in Proceedings of the Symposium on Dynamics and Management of Mediterranean-Type Ecosystems, U.S> Department of Agriculture Forest Service, Pacific Southwest Forest and Range Experiment Station, General Technical Report PSW-58, p. 420–422.
Caine, Nel, 1980, The rainfall intensity-duration control of shallow landslides and debris flows: Geografiska Annaler, 62A, p. 23-27.
Cannon, S.H., and Gartner, J.E., 2005, Wildfire-related debris flow from a hazards perspective, chapter 15, in Hungr, O., and Jacob, M., eds., Debris-flow hazards and related phenomena: Springer-Praxis Books in Geophysical Sciences, p. 321–344.
Cannon, S.H., Gartner, J.E., Parrett, Charles, and Parise, Mario, 2003, Wildfire-related debris flow generation through episodic progressive sediment bulking processes, western U.S.A., in Rickenmann, D. and Chen, C.L., eds., Debris-flow hazards mitigation - mechanics, prediction, and assessment, Proceedings of the Third International Conference on Debris-Flow Hazards Mitigation, Davos, Switzerland, 10-12 September 2003: A.A. Balkema, Rotterdam, p. 71-82.
Cannon, S.H., Gartner, J.E., Wilson, R.C., and Laber, J.L., 2008, Storm rainfall conditions for floods and debris flows from recently burned areas in southwestern Colorado and southern California: Geomorphology, v. 96, p. 250-269.
Cannon, S.H., Gartner, J.E., Rupert, M.G., Michael, J.A., Staley, D.B., and Worstell, B.B., 2009, Emergency assessment of postfire debris-flow Hazards for the 2009 Station fFire, San Gabriel Mountains, southern California: U.S. Geological Survey Open-File Report 2009-1227, 24 p.
Cannon, S.H., Gartner, J.E., Rupert, M.G., Michael, J.A., Rea, A.H., and Parrett, Charles, 2010, Predicting the probability and volume of post-wildfire debris flows in the intermountain west, USA: Geological Society of America Bulletin, v. 122, no. 1/2; p. 127–144; doi: 10.1130/B26459.1.
Chawner, W.D., 1934, The Montrose-La Crescenta (California) flood of January 1, 1934, and its sedimentary aspects. California Institute of Technology, Master’s thesis. (Also available at http://resolver.caltech.edu/CaltechETD:etd-07242007-092251).
Chawner, W.D., 1935, Alluvial fan flooding: the Montrose, California flood of 1934: Geographical Review, v. 25, no. 2, p. 235-263.
Collins, Larry, 2008, Mud & debris flow rescue concepts: Technical Rescue, Issue 53. (Also available at http://t-rescue.com/index.htm).
Eaton, E.C., 1936, Flood and erosion control problems and their solution: Proceedings of the American Society of Civil Engineers, v. 62, no. 8, p. 1302–1362.
Godt, J.W., Baum, R.L., and Chleborad, A.F., 2006, Rainfall characteristics for shallow landsliding in Seattle, Washington, USA: Earth Surface Processes and Landforms, v. 31, p. 97-110.
Guzzetti, F., Peruccacci, S., Rossi, M., and Stark, C.P., 2008, The rainfall intensity-duration control of shallow landslides and debris flows—an update: Landslides, v.5, no. 1, p. 3-7.
Jakob, M., 2005, A size classification for debris flows: Engineering Geology, v. 79, p. 151-161. Larsen, M.C., and Simon, A., 1993, Rainfall intensity-duration threshold for landslides in a
humid-tropical environment, Puerto Rico: Geografiska Annaler, v. 75A, no. 1-2, p. 13-23.

21
McPhee, J.A., 1989, The control of nature: Farrar, Strauss, and Giroux, 272 p. Meyer, G.A., and Wells, S.G., 1997, Fire-related sedimentation events on alluvial fans,
Yellowstone National Park, U.S.A.: Journal of Sedimentary Research, v. 67, no. 5, p. 776-791.
Moody, J.A., and Martin, D.A., 2009, Synthesis of sediment yields after wildland fire in different rainfall regimes in the western United States: International Journal of Wildland Fire, v. 18, p. 94-115.
National Interagency Fire Center, 2009, Station Fire Situation Report, http://www.nifc.gov/nicc/index.htm
Reid, M.E., Iverson, R.M., LaHusen, R.G., Logan, Matthew, Godt, J.W., Griswold, J.P., Swinford, K.J., and Denlinger, R.P., 2009, Entrainment of bed sediment by debris flows – large-scale experiments: Geological Society of America, Abstracts with Programs, v. 41, no. 7, p. 610.
Santi, P.M., deWolfe, V.G., Higgins, J.D., Cannon, S.H., and Gartner, J.E., 2008, Source of debris flow material in burned areas: Geomorphology, v. 96, p. 310-321.
Scott, K.M., 1971, Origin and sedimentology of 1969 debris flows near Glendora, California: U.S. Geological Survey Professional Paper 750–C, p. C242–C247.
Scott, K.M., and Williams, R.P., 1978, Erosion and sediment yields in the Transverse Ranges, southern California: U.S. Geological Survey Professional Paper 1030, 38 p.
Slosson, J.E., and Shuriman, G., 1992, Forensic engineering — Environmental case histories for civil engineers and geologists, chap. 8, p. 168-209.
Staley, D.M., Schmidt, K.M., Hanshaw, M.N., Kean, J.W., and Stock, J.D., 2008, Assessing the influence of multiple rainfall pulses on soil moisture dynamics during long duration frontal storms: Eos Transactions, American Geophysical Union, v. 89, no. 53, Fall Meeting Supplement Abstract H51D-0849.
U.S. Army Corps of Engineers, 2005, Analyses of the debris and sedimentation impacts at selected debris basins associated with the wildfires of 2003 and the December 25, 2003 storm: After action report, hydrology and hydraulics Section, U.S. Army Corps of Engineers, Los Angeles District, 45 p.
Van de Water, Roberta, 2000, Burned area emergency rehabilitation lesson plan, U.S. Department of Agriculture Forest Service, Klamath National Forest, Yreka, Calif., 21 p.
Wieczorek, G.F., and Glade, T., 2005, Climatic factors influencing the occurrence of debris flows, in: Hungr, O. and Jacob, M. (eds.), Debris flow hazards and related phenomena: Praxis, Springer, Berlin, Heidelberg, p. 325–362.

22
Table 1. Storm date, fire name and date, hydrologic response, information sources and assigned debris flow and flood magnitude. (U.S. Geological survey, USGS; cubic yards, yd3; square miles, mi2; feet, ft).
Storm date Fire name and date
Hydrologic response Information sources Event Magnitude
Dec. 7, 2009 Station fire; Aug.-Sept., 2009
Ash-laden flow in Arroyo Seco and some minor hillslope erosion. No impact to built environment.
USGS and citizen field observations; http://watershednews.blogspot.com/2009/12/arroyo-negro.html
0
Jan. 19, 2010 Station fire; Aug.-Sept., 2009
Minor erosion and sediment movement on hillslopes and in channels.
USGS and citizen field observations 0
Feb. 9, 2010 Station fire; Aug.-Sept., 2009
Minor erosion and sediment movement on hillslopes and in channels.
USGS field observations 0
Oct. 13-14, 2009 Station fire; Aug-Sept., 2009
Small debris flows and sediment-laden floods in several tributary channels to Big Tujunga River and Arroyo Seco. No impact to built environment.
USGS and citizen field observations I
Nov. 12, 2009 Station fire; Aug.-Sept., 2009
Localized storm produced minor hillslope and channel erosion in some areas and sediment-laden flood in Arroyo Seco.
USGS field observations I
Jan. 20, 2010 Station fire; Aug.-Sept., 2009
Minor hillslope and channel erosion and some sediment movement throughout burned area
USGS field observations I
Winter 1993-94 Kinneloa fire; 1993
2000 yds3 of material collected in Kinneloa debris retention basin over winter. No rainfall reported from any gages in Sierra Madre on the Sunday in March when debris flow occurred in Bailey Canyon.
Van de Water, 2000; Collins, 2008 I
May 22, 2008 Santa Anita fire; 2008
Small debris flow and sediment-laden flood from one watershed.
NWS observations and web reports I
Nov. 13-14, 1928
Unnamed; Dec. 3-5, 1927
Debris flows from Sunset and Brand Canyons above Burbank and Glendale; 27,000 yds3 of material produced from Brand Canyon.
Eaton, 1936 II
Jan. 7, 1931 Unnamed: Oct. 29 – Nov. 6, 1930
Debris flows from Arroyo Sequis traveled to Pacific Ocean at velocities between 5 and 9 ft per second.
Eaton, 1936 II
Oct. 17, 2005 Harvard fire; 2005
Debris flows produced from four burned watersheds. 39,000 yds3 of material collected in Verdugo debris retention basin and 12,000 yds3 in Wildwood basin.
USGS and NWS field observations II

23
Table 1, continued. Storm date, fire name and date, hydrologic response, information sources and assigned debris flow and flood magnitude. (cubic yards, yd3; square miles, mi2; feet, ft).
Storm date Fire name and date
Hydrologic response Information sources Event Magnitude
Winter of 1993-94
Old Topanga fire; 1993
Large debris flow produced from Big Rock Creek.
Collins, 2008 II
Sept. 22, 2007 Barham fire; 2007
Debris flow from one burned watershed overtopped debris retention basin and damaged cars parked along road.
USGS and NWS field observations II
Nov. 30, 2007 Poomacha fire; Fall 2007
Debris flows and sediment-laden floods produced from four watersheds.
USGS field observations II
Jan. 27, 2008 Poomacha fire; Fall 2007
Debris flows and sediment-laden floods produced from five watersheds.
USGS field observations II
May 22, 2008 Santiago fire; Fall 2007
Debris flows from two watersheds, damaging houses and inundating yards; volumes estimated to be <10,000 yds3.
USGS field observations II
Nov. 12, 2009 Station fire; Aug.-Sept., 2009
Localized storm produced debris flows and sediment-laden floods from several watersheds; 9500 yds3 of material filled Mullally debris retention basin; Halls and Snover Canyon basins near capacities of 93,800 yds3 and 24,800 yds3, respectively; debris flows and sediment-laden floods in neighborhoods damaged houses and closed Highway 2.
USGS field observations II
Dec. 11-13, 2009
Station fire; Aug -Sept, 2009
Localized storm produced debris flows and sediment-laden floods from several watersheds; 70 cars trapped in mud and debris on Highway 2, debris flow and sediment-laden floods closed several streets in La Canada Flintridge and damaged homes. Reaches of Arroyo Seco scoured to bedrock, others aggraded with up to 6 ft of material.
USGS field observations, citizen reports II

24
Table 1, continued. Storm date, fire name and date, hydrologic response, information sources and assigned debris flow and flood magnitude. (cubic yards, yd3; square miles, mi2; feet, ft).
Storm date Fire name and date
Hydrologic response Information sources Event Magnitude
Dec. 31, 1933- Jan. 1, 1934
Pickens Canyon fire; Nov. 21-24, 1933
Debris flows and floods produced from watersheds between, and including, Blanchard and Snover Canyons; total material volume of 660,000 yds3 reported by Eaton, 1936; Chawner, 1934, measured 700,000 yds3 from Halls and Pickens Canyons alone; 50,000 yds3 of material collected in Haines debris retention basin; debris-flow and flood deposits mapped from mountain front to Verdugo Wash. 30 deaths reported by Eaton, 1936.
Eaton, 1936; Chawner, 1934; 1935 III
Feb. 8-10, 1978 Mill Creek fire; July 24, 1977
Community of Hidden Springs destroyed by debris flow resulting in 13 deaths.
Graham, Shuirman, Slosson, Yoakum, written commun., 2009; Slosson and Shuirman, 1992
III
Feb. 8-10, 1978 Middle fire; Nov. 2, 1975
Debris flows and floods produced from watersheds between and including Zachau and Shields Canyons; 3,000 yds3 collected in Zachau debris retention basin, which overtopped. Material deposited over 0.5 mi2, blocking streets, and damaging houses and other facilities.
Bruington, 1982 III
Jan. 18-27, 1969 Unnamed; July and Aug., 1968
Debris flows produced from seven watersheds above Glendora; 25,000 yds3 of material into East Hook Canyon debris retention basin, 45,000 yds3 into Englewild Canyon basin, 52,000 yds3 into Harrow Canyon basin, and 18,000 yds3 of material produced from Rainbow Drive watershed and 24,000 yds3 from Glencoe Heights watershed.
Scott, 1971; Scott and Williams, 1978; Bruington, 1982
III
Dec. 25, 2003 Grand Prix and Old fires; Nov. 2003
Debris flows and floods produced from nearly every burned watershed (>100). Between 8900 yds3 and 800,000 yds3 of material collected in debris retention basins at mouths of larger watersheds. 16 people killed by debris flows at two locations.
USGS field observations; U.S. Army Corps of Engineers, 2005.
III
25
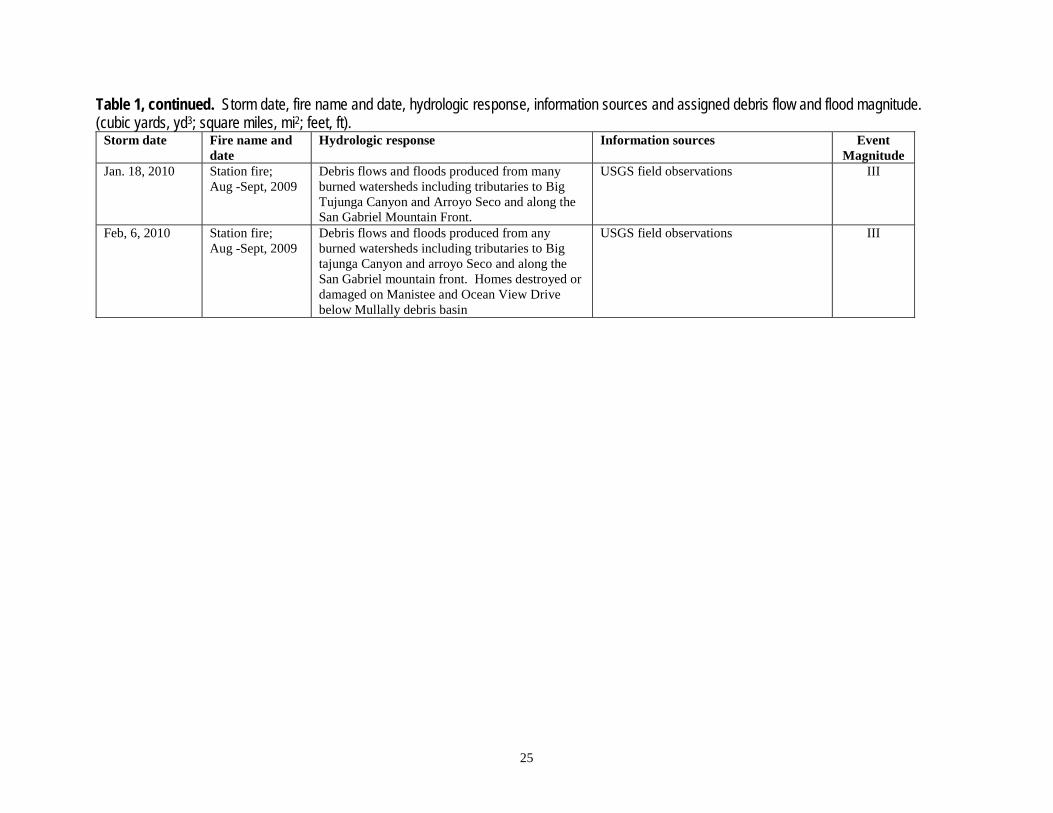
Table 1, continued. Storm date, fire name and date, hydrologic response, information sources and assigned debris flow and flood magnitude. (cubic yards, yd3; square miles, mi2; feet, ft).
Storm date Fire name and date
Hydrologic response Information sources Event Magnitude
Jan. 18, 2010 Station fire; Aug -Sept, 2009
Debris flows and floods produced from many burned watersheds including tributaries to Big Tujunga Canyon and Arroyo Seco and along the San Gabriel Mountain Front.
USGS field observations III
Feb, 6, 2010 Station fire; Aug -Sept, 2009
Debris flows and floods produced from any burned watersheds including tributaries to Big tajunga Canyon and arroyo Seco and along the San Gabriel mountain front. Homes destroyed or damaged on Manistee and Ocean View Drive below Mullally debris basin
USGS field observations III

26
Table 3A. Storm data including rainfall total, storm duration, total rainfall up to known time of response, storm duration up to known time of response, and peak 5-, 10-, 15-, and 30-minute rainfall. (---, no value) Storm date Fire name Storm total
(inches) Storm duration
(hours) Storm total up to first
known time of response
(inches)
Storm duration up to first
known time of response (hours)
Peak 5-minute rainfall
(inches)
Peak 10-minute rainfall
(inches)
Peak 15-minute rainfall
(inches)
Peak 30-minute rainfall
(inches)
Dec. 7, 2009 Station 0.92 16.00 ---- ---- ---- ---- 0.09 0.11 Dec. 7, 2009 Station 0.80 16.00 ---- ---- ---- ---- 0.06 0.09 Dec. 7, 2009 Station 1.39 16.00 ---- ---- ---- ---- 0.11 0.16 Dec. 7, 2009 Station 1.04 14.00 ---- ---- ---- ---- ---- ---- Dec. 7, 2009 Station 0.79 16.00 ---- ---- ---- ---- ---- 0.10 Dec. 7, 2009 Station 0.97 16.00 ---- ---- ---- ---- 0.08 0.13 Jan. 19, 2010 Station 0.48 7.00 ---- ---- ---- ---- 0.09 0.12 Jan. 19, 2010 Station 0.68 7.00 ---- ---- ---- ---- 0.13 0.17 Jan. 19, 2010 Station 0.44 7.00 ---- ---- ---- ---- 0.09 0.13 Feb. 9, 2010 Station 0.38 6.00 ---- ---- ---- ---- 0.07 0.14 Feb. 9, 2010 Station 0.82 6.00 ---- ---- ---- ---- 0.13 0.22 Feb. 9, 2010 Station 0.78 6.00 ---- ---- ---- ---- 0.13 0.20 Feb. 9, 2010 Station 0.94 6.00 ---- ---- ---- ---- 0.24 0.30 Feb. 9, 2010 Station 0.80 7.00 ---- ---- ---- ---- ---- ---- Feb. 9, 2010 Station 0.65 6.00 ---- ---- ---- ---- 0.17 0.20 Oct. 13-14, 2009 Station 2.27 29.00 ---- ---- ---- ---- 0.11 0.18 Oct. 13-14, 2009 Station 2.50 29.00 ---- ---- ---- ---- 0.09 0.15 Nov. 12, 2009 Station 0.07 0.67 ---- ---- ---- ---- 0.07 0.07 Nov. 12, 2009 Station 0.03 1.67 ---- ---- ---- ---- 0.02 0.02 Jan. 20, 2010 Station 1.75 16.00 ---- ---- ---- ---- ---- ---- Jan. 20, 2010 Station 1.67 15.00 ---- ---- ---- ---- 0.11 0.22 Jan. 20, 2010 Station 1.26 15.00 ---- ---- ---- ---- 0.08 0.15 Jan. 20, 2010 Station 1.51 15.00 ---- ---- ---- ---- 0.10 0.18 Jan. 20, 2010 Station 1.81 15.00 ---- ---- ---- ---- 0.15 0.20 Jan. 20, 2010 Station 1.11 15.00 ---- ---- ---- ---- 0.09 0.11 Jan. 20, 2010 Station 0.97 15.00 ---- ---- ---- ---- 0.09 0.12 Winter 1993-94 Kinneloa ---- ---- ---- ---- ---- ---- ---- ---- May 22, 2008 Santa Anita 0.39 1.07 ---- ---- 0.08 ---- 0.15 0.08 Nov. 13-14, 1928 Unnamed 2.00 12.00 ---- ---- ---- 0.06 ---- ----
27
Table 3A, continued. Storm data including rainfall total, storm duration, total rainfall up to known time of response, storm duration up to known time of response, and peak 5-, 10-, 15-, and 30-minute rainfall. (---, no value) Storm date Fire name Storm total
(inches) Storm
duration (hours)
Storm total up to first
known time of response
(inches)
Storm duration up to first
known time of response (hours)
Peak 5-minute rainfall
(inches)
Peak 10-minute rainfall
(inches)
Peak 15-minute rainfall
(inches)
Peak 30-minute rainfall
(inches)
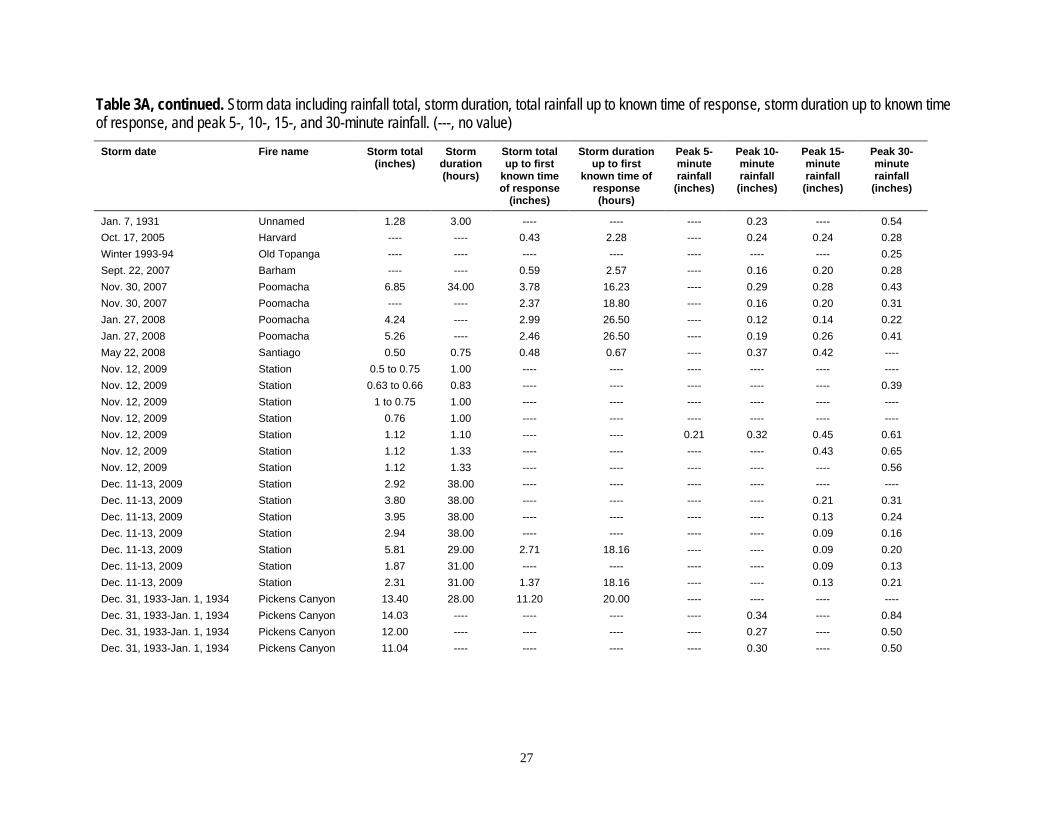
Jan. 7, 1931 Unnamed 1.28 3.00 ---- ---- ---- 0.23 ---- 0.54 Oct. 17, 2005 Harvard ---- ---- 0.43 2.28 ---- 0.24 0.24 0.28 Winter 1993-94 Old Topanga ---- ---- ---- ---- ---- ---- ---- 0.25 Sept. 22, 2007 Barham ---- ---- 0.59 2.57 ---- 0.16 0.20 0.28 Nov. 30, 2007 Poomacha 6.85 34.00 3.78 16.23 ---- 0.29 0.28 0.43 Nov. 30, 2007 Poomacha ---- ---- 2.37 18.80 ---- 0.16 0.20 0.31 Jan. 27, 2008 Poomacha 4.24 ---- 2.99 26.50 ---- 0.12 0.14 0.22 Jan. 27, 2008 Poomacha 5.26 ---- 2.46 26.50 ---- 0.19 0.26 0.41 May 22, 2008 Santiago 0.50 0.75 0.48 0.67 ---- 0.37 0.42 ---- Nov. 12, 2009 Station 0.5 to 0.75 1.00 ---- ---- ---- ---- ---- ---- Nov. 12, 2009 Station 0.63 to 0.66 0.83 ---- ---- ---- ---- ---- 0.39 Nov. 12, 2009 Station 1 to 0.75 1.00 ---- ---- ---- ---- ---- ---- Nov. 12, 2009 Station 0.76 1.00 ---- ---- ---- ---- ---- ---- Nov. 12, 2009 Station 1.12 1.10 ---- ---- 0.21 0.32 0.45 0.61 Nov. 12, 2009 Station 1.12 1.33 ---- ---- ---- ---- 0.43 0.65 Nov. 12, 2009 Station 1.12 1.33 ---- ---- ---- ---- ---- 0.56 Dec. 11-13, 2009 Station 2.92 38.00 ---- ---- ---- ---- ---- ---- Dec. 11-13, 2009 Station 3.80 38.00 ---- ---- ---- ---- 0.21 0.31 Dec. 11-13, 2009 Station 3.95 38.00 ---- ---- ---- ---- 0.13 0.24 Dec. 11-13, 2009 Station 2.94 38.00 ---- ---- ---- ---- 0.09 0.16 Dec. 11-13, 2009 Station 5.81 29.00 2.71 18.16 ---- ---- 0.09 0.20 Dec. 11-13, 2009 Station 1.87 31.00 ---- ---- ---- ---- 0.09 0.13 Dec. 11-13, 2009 Station 2.31 31.00 1.37 18.16 ---- ---- 0.13 0.21 Dec. 31, 1933-Jan. 1, 1934 Pickens Canyon 13.40 28.00 11.20 20.00 ---- ---- ---- ---- Dec. 31, 1933-Jan. 1, 1934 Pickens Canyon 14.03 ---- ---- ---- ---- 0.34 ---- 0.84 Dec. 31, 1933-Jan. 1, 1934 Pickens Canyon 12.00 ---- ---- ---- ---- 0.27 ---- 0.50 Dec. 31, 1933-Jan. 1, 1934 Pickens Canyon 11.04 ---- ---- ---- ---- 0.30 ---- 0.50

28
Table 3A, continued. Storm data including rainfall total, storm duration, total rainfall up to known time of response, storm duration up to known time of response, and peak 5-, 10-, 15-, and 30-minute rainfall. (---, no value) Storm date Fire name Storm
total (inches)
Storm duration (hours)
Storm total up to first known
time of response (inches)
Storm duration up to first
known time of response (hours)
Peak 5-minute rainfall
(inches)
Peak 10-minute rainfall
(inches)
Peak 15-minute rainfall
(inches)
Peak 30-minute rainfall
(inches)
Feb. 8-10, 1978 Mill Creek 11.60 ---- ---- ---- ---- ---- ---- ---- Feb. 8-10, 1978 Mill Creek 14.50 ---- ---- ---- ---- ---- ---- ---- Feb. 8-10, 1978 Mill Creek 15.50 ---- ---- ---- ---- ---- ---- ---- Feb. 8-10, 1978 Mill Creek 12.30 ---- ---- ---- ---- ---- ---- ---- Feb. 8-10, 1978 Middle 10.90 32.50 ---- ---- 0.40 ---- ---- 1.40 Feb. 8-10, 1978 Middle ---- ---- ---- ---- 1.50 ---- ---- ---- Jan. 18-27, 1969 Unnamed ---- ---- ---- ---- ---- ---- ---- ---- Dec. 25, 2003 Grand Prix and Old ---- ---- 1.90 12.22 ---- 0.89 0.87 0.95 Dec. 25, 2003 Grand Prix and Old ---- ---- 2.75 11.98 ---- 0.20 0.28 0.36 Dec. 25, 2003 Grand Prix and Old 5.64 ---- ---- ---- 0.14 0.25 0.33 0.56 Jan. 18, 2010 Station 1.71 8.00 ---- ---- ---- ---- ---- ---- Jan. 18, 2010 Station 3.90 23.00 1.77 12.00 ---- ---- 0.35 0.65 Jan. 18, 2010 Station 2.74 23.00 ---- ---- ---- ---- 0.18 0.35 Jan. 18, 2010 Station 2.94 23.00 ---- ---- ---- ---- 0.27 0.49 Jan. 18, 2010 Station 4.25 23.00 ---- ---- ---- ---- 0.35 0.61 Jan. 18, 2010 Station 2.13 23.00 ---- ---- ---- ---- 0.17 0.29 Jan. 18, 2010 Station 3.94 21.90 2.28 19.63 ---- ---- 0.20 0.37 Feb. 6, 2010 Station 3.70 25.00 ---- ---- ---- ---- 0.45 0.66 Feb. 6, 2010 Station 3.08 25.00 ---- ---- ---- ---- 0.37 0.53 Feb. 6, 2010 Station 3.47 25.00 ---- ---- ---- ---- 0.46 0.67 Feb. 6, 2010 Station 4.42 25.00 1.44 17.28 ---- ---- 0.31 0.41 Feb. 6, 2010 Station 3.27 25.00 0.98 17.28 ---- ---- 0.22 0.3 Feb. 6, 2010 Station 3.02 25.00 0.81 17.28 ---- ---- 0.22 0.29
29
Table 3B. Storm data including peak 1-, 2-, 3-, 6-, 12-, 18- and 24-hour rainfall, and data source (---, no value;.U.S. Geological Survey, USGS; Automatic Local Evaluation in Real Time, ALERT). Storm date Fire name Peak 1-hour
rainfall (inches)
Peak 2-hour
rainfall (inches)
Peak 3-hour
rainfall (inches)
Peak 6-hour
rainfall (inches)
Peak 12-hour
rainfall (inches)
Peak 18-hour
rainfall (inches)
Peak 24-hour
rainfall (inches)
Source
Dec. 7, 2009 Station 0.17 ---- 0.42 0.64 0.88 ---- ---- USGS Dunsmore Channel Site 1 rain gage Dec. 7, 2009 Station 0.16 ---- 0.39 0.57 0.78 ---- ---- USGS Dunsmore Channel Site 2 rain gage Dec. 7, 2009 Station 0.27 ---- 0.63 0.93 1.35 ---- ---- USGS Arroyo Seco Channel rain gage Dec. 7, 2009 Station 0.25 0.41 0.52 0.71 1.03 ---- ---- Jet Propulsion Laboratory rain gage Dec. 7, 2009 Station 0.13 ---- 0.36 0.50 0.77 ---- ---- USGS Arroyo Seco Hillslope rain gage Dec. 7, 2009 Station 0.25 ---- 0.58 0.84 0.91 ---- ---- USGS Dunsmore Hillslope Site 1 rain gage Jan. 19, 2010 Station 0.22 ---- 0.41 0.48 ---- ---- ---- USGS Dunsmore Hillslope Site 1 rain gage Jan. 19, 2010 Station 0.31 ---- 0.60 0.68 ---- ---- ---- USGS Arroyo Seco Channel rain gage Jan. 19, 2010 Station 0.21 ---- 0.39 0.44 ---- ---- ---- USGS Arroyo Seco Hillslope rain gage Feb. 9, 2010 Station 0.24 ---- 0.37 0.38 ---- ---- ---- USGS Dunsmore Hillslope Site 1 rain gage Feb. 9, 2010 Station 0.35 ---- 0.64 0.82 ---- ---- ---- USGS Dunsmore Channel Site 1 rain gage Feb. 9, 2010 Station 0.29 ---- 0.58 0.78 ---- ---- ---- USGS Dunsmore Channel Site 2 rain gage Feb. 9, 2010 Station 0.34 ---- 0.79 0.94 ---- ---- ---- USGS Arroyo Seco Channel rain gage Feb. 9, 2010 Station 0.29 0.44 0.66 0.79 ---- ---- ---- Jet Propulsion Laboratory rain gage Feb. 9, 2010 Station 0.22 ---- 0.53 0.65 ---- ---- ---- USGS Arroyo Seco Hillslope rain gage Oct. 13-14, 2009 Station 0.29 0.50 0.70 1.01 1.91 ---- ---- USGS Dunsmore Channel Site 1 rain gage Oct. 13-14, 2009 Station 0.26 0.40 0.70 0.88 1.66 ---- ---- USGS Dunsmore Hillslope Site 1 rain gage Nov. 12, 2009 Station ---- ---- ---- ---- ---- ---- ---- USGS Dunsmore Channel Site 1 rain gage Nov. 12, 2009 Station 0.03 ---- ---- ---- ---- ---- ---- USGS Dunsmore Hillslope Site 1 rain gage Jan. 20, 2010 Station 0.35 0.69 85.00 1.35 1.60 ---- ---- Jet Propulsion Laboratory rain gage Jan. 20, 2010 Station 0.41 ---- 0.91 1.31 1.39 ---- ---- USGS Dunsmore Channel Site 1 rain gage Jan. 20, 2010 Station 0.28 ---- 0.59 0.80 1.18 ---- ---- USGS Dunsmore Hillslope Site 1 rain gage Jan. 20, 2010 Station 0.34 ---- 0.75 1.07 1.40 ---- ---- USGS Dunsmore Channel Site 2 rain gage Jan. 20, 2010 Station 0.38 ---- 0.85 1.45 1.71 ---- ---- USGS Arroyo Seco Channel rain gage Jan. 20, 2010 Station 0.2 ---- 0.50 0.83 1.00 ---- ---- USGS rain gage 1160877 Jan. 20, 2010 Station 0.2 ---- 0.45 0.77 0.96 ---- ---- USGS Arroyo Seco Hiilslope rain gage Winter 1993-94 Kinneloa ---- ---- ---- ---- ---- ---- ---- ALERT rain gage network May 22, 2008 Santa Anita 0.36 ---- ---- ---- ---- ---- ---- Santa Anita Dam ALERT rain gage Nov. 13-14, 1928 Unnamed 0.43 ---- ---- ---- ---- ---- ---- Eaton, 1936

30
Table 3B, continued. Storm data including peak 1-, 2-, 3-, 6-, 12-, 18- and 24-hour rainfall, and data source (---, no value;.U.S. Geological Survey, USGS; Automatic Local Evaluation in Real Time, ALERT). Storm date Fire name Peak 1-
hour rainfall
(inches)
Peak 2-hour
rainfall (inches)
Peak 3-hour
rainfall (inches)
Peak 6-hour
rainfall (inches)
Peak 12-hour
rainfall (inches)
Peak 18-hour
rainfall (inches)
Peak 24-hour
rainfall (inches)
Source
Jan. 7, 1931 Unnamed 0.75 ---- 1.28 ---- ---- ---- ---- Eaton, 1936 Oct. 17, 2005 Harvard 0.39 0.44 ---- ---- ---- ---- ---- USGS rain rain gage Winter 1993-94 Old Topanga ---- ---- ---- ---- ---- ---- ---- Collins, 2008 Sept. 22, 2007 Barham 0.39 0.56 ---- ---- ---- ---- ---- Brand Park ALERT rain gage Nov. 30, 2007 Poomacha 0.71 0.98 1.29 2.10 3.48 ---- ---- La Jolla Amago ALERT rain gage Nov. 30, 2007 Poomacha 0.47 0.78 1.02 1.44 2.16 2.34 ---- Rincon Springs ALERT rain gage Jan. 27, 2008 Poomacha 0.34 0.62 0.93 1.38 0.84 1.80 ---- USGS rain gage 1160877 Jan. 27, 2008 Poomacha 0.50 0.82 0.84 1.02 1.32 1.80 ---- USGS rain gage 1160878 May 22, 2008 Santiago ---- ---- ---- ---- ---- ---- ---- USGS rain gage 1175619 Nov. 12, 2009 Station ---- ---- ---- ---- ---- ---- ---- Citizen rain gage in Halls Canyon Nov. 12, 2009 Station ---- ---- ---- ---- ---- ---- ---- Opids Camp and Camp Hi Hill ALERT rain
gages Nov. 12, 2009 Station ---- ---- ---- ---- ---- ---- ---- KVTX weather radar Nov. 12, 2009 Station ---- ---- ---- ---- ---- ---- ---- Citizen rain gage in La Cresenta Nov. 12, 2009 Station ---- ---- ---- ---- ---- ---- ---- USGS rain gage 1184896 Nov. 12, 2009 Station 1.11 ---- ---- ---- ---- ---- ---- USGS Arroyo Seco Hillslope rain gage Nov. 12, 2009 Station 1.06 ---- ---- ---- ---- ---- ---- USGS Arroyo Seco Channel rain gage Dec. 11-13, 2009 Station 0.51 0.79 0.92 1.27 1.78 2.16 2.52 Jet Propulsion Laboratory rain gage Dec. 11-13, 2009 Station 0.45 ---- 0.92 1.43 2.52 ---- ---- USGS Dunsmore Channel Site 1 rain gage Dec. 11-13, 2009 Station 0.38 ---- 0.70 1.21 1.88 ---- ---- USGS Dunsmore Hillslope Site 1 rain gage Dec. 11-13, 2009 Station 0.26 ---- 0.54 0.89 1.41 ---- ---- USGS Dunsmore Channel Site 2 rain gage Dec. 11-13, 2009 Station 0.54 ---- 0.88 1.31 2.42 ---- ---- USGS Arroyo Seco Channel rain gage Dec. 11-13, 2009 Station 0.24 ---- 0.48 0.71 1.31 ---- ---- USGS rain gage 1184896 Dec. 11-13, 2009 Station 0.28 ---- 0.62 0.92 1.40 ---- ---- USGS Arroyo Seco Hillslope rain gage Dec. 31, 1933-Jan. 1, 1934 Pickens Canyon 1.28 ---- 3.21 5.22 9.24 11.88 ---- Eaton, 1936 - Flintridge Fire Station rain gage Dec. 31, 1933-Jan. 1, 1934 Pickens Canyon 1.33 2.14 ---- ---- 9.21 ---- 13.19 Chawner, 1935 - Flintridge Fire Station rain gage Dec. 31, 1933-Jan. 1, 1934 Pickens Canyon 0.94 1.64 ---- ---- 6.69 ---- 8.17 Chawner, 1935 - Haines Canyon rain gage Dec. 31, 1933-Jan. 1, 1934 Pickens Canyon 0.88 1.34 ---- ---- 5.30 ---- 8.07 Chawner, 1935 - Sister Elsie Peak rain gage

31
Table 3B, continued. Storm data including peak 1-, 2-, 3-, 6-, 12-, 18- and 24-hour rainfall, and data source (---, no value;.U.S. Geological Survey, USGS; Automatic Local Evaluation in Real Time, ALERT). Storm date Fire name Peak 1-
hour rainfall
(inches)
Peak 2-hour
rainfall (inches)
Peak 3-hour
rainfall (inches)
Peak 6-hour
rainfall (inches)
Peak 12-hour
rainfall (inches)
Peak 18-hour
rainfall (inches)
Peak 24-hour
rainfall (inches)
Source
Feb. 8-10, 1978 Mill Creek 1.60 ---- ---- ---- ---- ---- 9.90 Slosson and Shuirman, 1992 - Big Tujunga Dam rain gage Feb. 8-10, 1978 Mill Creek 1.50 ---- ---- ---- ---- ---- 12.30 Slosson and Shuirman, 1992 - Clear Creek School rain gage Feb. 8-10, 1978 Mill Creek 1.10 ---- ---- ---- ---- ---- 11.50 Slosson and Shuirman, 1992 - Colbys rain gage Feb. 8-10, 1978 Mill Creek 0.60 ---- ---- ---- ---- ---- 11.00 Slosson and Shuirman, 1992 - Camp Hi Hill rain gage Feb. 8-10, 1978 Middle ---- ---- 2.00 2.20 ---- ---- ---- Bruington, 1982 Feb. 8-10, 1978 Middle 1.60 ---- ---- 3.90 ---- ---- 9.00 Graham, written commun, 2009 - Haines Canyon rain gage Jan. 18-27, 1969 Unnamed 1.30 ---- ---- ---- ---- ---- 4.5 to 13.0 Scott, 1971; 1978 Dec. 25, 2003 Grand Prix and Old 0.95 0.96 0.96 1.32 1.92 ---- ---- USGS rain gage 2840 Dec. 25, 2003 Grand Prix and Old 0.60 1.00 1.44 2.22 ---- ---- ---- USGS rain gage 2842 Dec. 25, 2003 Grand Prix and Old 1.09 1.94 2.72 4.71 5.52 ---- 5.59 Lytle Creek Fire Station ALERT rain gage Jan. 18, 2010 Station 0.69 1.08 1.28 1.56 ---- ---- ---- Jet Propulsion Laboratory rain gage Jan. 18, 2010 Station 1.02 ---- ---- ---- 1.77 ---- ---- USGS Dunsmore Channel Site 1 rain gage Jan. 18, 2010 Station 0.62 ---- 1.46 1.74 2.05 ---- ---- USGS Dunsmore Hillslope Site 1 rain gage Jan. 18, 2010 Station 0.75 ---- 1.76 1.96 2.23 ---- ---- USGS Dunsmore Channel Site 2 rain gage Jan. 18, 2010 Station 1.02 ---- 2.46 3.08 3.59 ---- ---- USGS Arroyo Seco Channel rain gage Jan. 18, 2010 Station 0.51 ---- 1.13 1.42 1.61 ---- ---- USGS rain gage 1184896 Jan. 18, 2010 Station 0.61 ---- ---- ---- ---- ---- ---- USGS Big Tujunga rain gage Feb. 6, 2010 Station 0.90 ---- 1.76 2.69 3.20 ---- ---- USGS Dunsmore Channel Site 1 rain gage Feb. 6, 2010 Station 0.73 ---- 1.46 2.26 2.73 ---- ---- USGS Dunsmore Hillslope Site 1 rain gage Feb. 6, 2010 Station 0.9 ---- 1.71 2.65 3.08 ---- ---- USGS Dunsmore Channel Site 2 rain gage Feb. 6, 2010 Station 0.49 ---- 0.92 1.09 1.53 ---- ---- USGS Arroyo Seco Channel rain gage Feb. 6, 2010 Station 0.35 ---- 0.67 0.76 1.04 ---- ---- USGS rain gage 1184896 Feb. 6, 2010 Station 0.33 ---- 0.61 0.69 0.94 ---- ---- USGS Arroyo Seco Hillslope rain gage