Villas on rent in Jaipur, Bungalows on rent in Jaipur, Property on rent in Jaipur

Relational Rent and Underperformance of Hub Firms in the Aeronautics Value Chain
Mathieu Bécue � Jean Belin � Damien Talbot
Abstract. The present paper shows that in response to deep-seated changes in the aeronautics sector, tier-one hub firms now feature in the supply chain in the role of architect-integrators for key components. According to the Relational-Based approach, this pivotal position should enable them to achieve supernormal performance. Our statistical analysis, performed between the years 2000 and 2007 with sub-contracting firms in the aeronautics sector in the Aquitaine and Midi-Pyrenees regions, allowed us to identify the impact of this status on their main organisational features. Our conclusions suggest that, on the contrary, hub firms are under-performing. Our econometric analysis confirms the argument that hub firms are experiencing a financial performance which is both less robust and less persistent than the other firms in our sample population. In order to explain these findings which contradict the hypothesis of the development of a relational rent in the aeronautics industry, we investigated the most recent contingent factors. The architect-integrators’ ability to harness this relational rent, the duration of the investment cycle and family-based capitalism all help to explain the under-performance of hub firms attached to this industry..
! In the field of strategic management and from a relational-based perspective, additional profit generated through partnerships underpinned by exchange (Mentzer, Foggin & Golicic, 2000; Gunasekaran, Patelb & McGaughey, 2004; Sheu, Yen & Chae, 2006; Cao & Zhang, 2011; Wagner, Grosse-Ruyken & Erhun, 2012) is sometimes referred to as relational rent (Dyer, 1996; Dyer & Singh,1998; Beamon, 1998; Tan, et al., 1999; Gulati, Nohria & Zaheer, 2000; Krause, Scannel & Calantone, 2000; Shin, Collier & Wilson 2000; Giannoccaro & Pontrandolfo, 2004; Xu & Beamon, 2006). The relational approach follows the competitive-positioning approach or the so-called Harvard school of thought (Porter, 1980), which suggests that the industry to which the enterprise belongs is the main factor in determining its performance in that it presents favourable (or unfavourable) attributes to develop a competitive edge. It also builds on the resource and knowledge-based approach (Wernerfelt, 1984; Prahalad & Hamel, 1990; Barney, 1991) according to which performance is the product of the companies’ ability to coherently assemble strategic resources and competencies.The formation of relational rent has previously been identified in the automotive industry between manufacturers and tier 1 component suppliers (Dyer, 1996; Kotabe, Martin & Domoto, 2003; Jayaram, Vickery & Droge, 2008; Corsten, Gruen & Peyinghaus, 2011). In this paper, we examine relational rent in the aeronautics industry between aircraft manufacturers and strategic tier-one suppliers. The two industries differ on certain points, such as the number of players, the degree of globalisation, the duration of R&D investment and manufacturing cycles, etc. However, in both instances, strategic suppliers have emerged that are able to create an exchange-based relationship with their main clients, resulting in financial outperformance. ! To test the hypothesis that this type of rent exists in the aeronautics industry, we compared the financial performance of largely tier 1 hub firms,
M@n@gement2014, 17(2): 110-135
110
GREThA (UMR CNRS 5113), Bordeaux University [email protected]
GREThA (UMR CNRS 5113), Bordeaux University [email protected]
CRCGM,University of Auvergne [email protected]
www.management-aims.com© The Author(s)

responsible for major aircraft components, with other firms in the supply chain. The comparison was based on descriptive statistical analysis. We empirically selected a sample of firms featured in the INSEE [French National Institute of Statistical and Economic Information] annual survey on aeronautics outsourcing, using the Diane database to obtain the relevant financial data. To further support the validity of our findings, an econometric analysis was also performed; each time, our results contradicted the notion of relational rents in the aeronautics industry. ! Our paper is divided into four sections: first, we describe how the supply chain has developed in the field of aeronautics over the last two decades, and the key, strategically positioned players responsible for major components in the value chain, whose position should enable them to secure additional profit due to their privileged exchange relations. We then define our sample of hub firms and conduct a statistical analysis of their financial performance, which appears less than robust than the rest of the sample. Thirdly, we present an econometric analysis which confirms the profitability gap and indicates that architect-integrators capture a share of the profits (above all, Airbus). Finally, we discuss our findings, namely, the key positioning which, according to the relational-based approach, should lead to an outperformance and yet, when subjected to a set of contingent factors, appears to lead, at least temporarily, to a situation of underperformance.
CONDITIONS FOR THE DEVELOPMENT OF RELATIONAL RENT IN THE AERONAUTICS VALUE CHAIN
! Sector-specific changes with respect to technology and production have led aircraft manufacturers to introduce refocusing and outsourcing strategies geared towards strategic suppliers. The former are referred to as architect-integrators, while the latter are hub firms for major components.
FROM AIRCRAFT MANUFACTURERS TO ARCHITECT-INTEGRATORS
! Our interviews1 highlighted the huge technological changes currently affecting the aircraft industry, with aircraft becoming far more complex than ever before. The quantitative and qualitative importance of the aircraft’s aerostructural component (the airframe) has lost ground to embedded systems. The new generation of planes has accelerated the introduction of electro-hydraulic technologies, which have replaced centralised hydraulic systems, significantly reducing mass, as well as production and maintenance costs, with embedded systems that require evermore electrical power. Another technological milestone is the widespread use of composite and carbon fibre structural materials to replace aluminium and lithium2. Overall, the knowledge and expertise required to design and build today’s aircraft has become increasingly complex. Aircraft manufacturers such as Airbus, Boeing, Bombardier or Embraer are consequently unable to oversee all the activities involved, and tend to focus on their core skills, adopting the role of architect. They continue to manufacture the most important structural elements (e.g., Airbus designs and manufactures the centre wing box, the structural heart of the aircraft to which the wings and the fuselage are attached, which also serves as a fuel tank) and other key systems. Moreover, at manufacturing level, aircraft manufacturers’ design and engineering departments have to cope with an ever-growing number of programmes, while the production
M@n@gement, 17(2): 110-135! Mathieu Bécue � Jean Belin � Damien Talbot
111
1 Within the framework of a research contract co-financed by the Aquitaine and Midi-Pyrénées regions, a qualitative analysis was conducted, predominantly based on data collected from Airbus, hub firms and institutional decision-makers. The questionnaires were administered during semi-directive interviews between March and June, 2009. The 40 participants interviewed were in senior management positions or occupied positions directly linked to the supply chain (quality, purchasing, production, strategy, etc.)
2. Composite materials already make up 53% of the total structure of the future A350 XWB and comprise 50% of the B787’s structure (Air & Cosmos, 30 April 2010).
3. For instance, deliveries of Airbus aircraft have increased as follows: 42 in 1985, 95 in 1990, 124 in 1995, 311 in 2000, 378 in 2005, 510 in 2010 and 58.

rate is stepped up to ensure delivery3. The entire spectrum of design and production resources available is required to meet these challenges.To produce such complex aircraft to tighter and tighter deadlines, aircraft manufacturers have had to develop strategies that refocus on their core design and manufacturing activities, in other words, the upstream activities of design and R&D, and the downstream value chain activities of assembly, marketing, and associated services like training and technical support (Belussi & Arcangeli, 1998; Frenken, 2000; Mouchnino & Sautel, 2007)4. Aircraft manufacturers thus act as both architect and activities integrator (Brusoni & Prencipe, 2001; Brusoni, Prencipe & Pavitt, 2001). This refocusing strategy has led to a higher level of outsourcing of activities with less strategic importance, entrusted to one and two tier outsourcers that have to deal with considerable challenges in terms of performance, mass, reliability, and financial and price-related risks (Kechidi & Talbot, 2010).
FROM SIMPLE SUPPLIERS TO HUB FIRMS RESPONSIBLE FOR MAJOR COMPONENTS
! Architect-integrators are described in the literature as hub firms at the top of a pyramidal supply chain. Prior studies have largely focused on the interactions between order givers and order takers in order to understand their dynamics (Takeishi, 2001; Terwiesch, Loch & De Meyer A., 2002; O’Sullivan, 2005, 2006). Other studies have examined the network structure, suggesting that its core plays a vital role in these new architectures. Many terms have been coined to refer to this core, including ‘hub firm’ (Jarillo, 1988), ‘pivot-firm’ (Guilhon & Gianfaldoni, 1990), ‘broker’ (Miles & Snow, 1992), ‘local firm’ (Lorenzi & Baden-Fuller, 1995), ‘flagship firm’ (Rugman & D’Cruz, 2000) and ‘network orchestrator’ (Hacki & Lighton, 2001, Dhanasai & Parkhe, 2006), which is in a position to coordinate the network of order-takers. The coordinating company must ‘manage a value chain’ (Fulconis & Paché, 2005) and provide ‘local leadership’ over part of the supply chain, notably through the overall management of the programmes (Fabbe-Costes, 2005), by managing information flows through various communication tools (Lorenzi & Baden-Fuller, 1995), organising the network members’ specialisation in view of the asymmetry of power and roles (De Propis, 2001), dealing with conflict, and coordinating the different players in the chain (Fréry, 1998).! In recent years, the notion of hub firm, previously associated with architect-integrators, has been extended to strategically-positioned and generally tier-one suppliers (Mazaud, 2006; Cagli, Kechidi & Levy, 2009; Gilly, Talbot & Zuliani, 2011). These hub firms develop an upstream strategy in the value chain through the design and manufacture of the major technical components they are entrusted with (Amesse, et al., 2001). In concrete terms, this may involve an entire module (fuselage, doors, nacelles, engines, landing gear, flight control systems), module-specific equipment (cockpit equipment, air conditioning systems) or relatively standard equipment (video systems, interior furnishings). Thus, they act as architects for a homogeneous knowledge base (avionics, airframes, nacelles, landing gear, etc.), and strategically position themselves within the supply chain.! The closer relationship with the chief order giver is coupled with new supply chain coordination responsibilities. Hub firms help to integrate the units they are in charge of during the final aircraft assembly process. They also adopt an outsourcing strategy for less strategically important sub-components. Most aeronautical hub firms work with three categories of suppliers (Zuliani, 2008): ‘co-contractors’ with whom they share a joint approach to the programme design; ‘technological partners’ who provide off-the-shelf equipment in a traditional trade
Relational Rent and Underperformance! M@n@gement, 17(2): 110-135
112
4. Boeing and Airbus transferred part of their airframe component manufacturing facilities (cf. the American case of the Wichita site acquired by Spirit AeroSystems, or the European Filton site sold to GKN Aerospace, and the Laupheim site purchased by Diehl Aerospace), illustrating the refocusing strategy. For other refocusing examples, see L’Usine Nouvelle, 14 June 2001; Air & Cosmos, 27 January 2006 and 18 December 2009.

relationship; and specialised, expert outsourcers that make up the third group of hub firm suppliers. Hub firms thus play a role that was once entirely assumed by the aircraft manufacturers, in other words, they act as intermediaries between the architect-integrators and the second or first-tier outsourcers (Talbot, 2013).
HUB FIRMS TAKE ON MORE RISK
! The rise in the value chain is contingent upon the hub firms’ capacity to assume the risks linked to the component’s supply. There is an inherent risk in the way the supply chain is organised since it involves players who are unable or unwilling to individually fulfil the functions required by their activity (Tapiero, 2005, 2008; Tang, 2006). There is a de facto dependency between members in this type of network as the risk undertaken inevitably means strings are attached to the relational rent resulting from the supply chains (Agrawal & Shesadri, 2000). From the hub firms’ perspective, the risk is heightened across several fronts. In the typology proposed by Manuj and Mentzer (2008), these include operational, security, demand and macro-economic risks. ! Operational risk generally stems from the fact that outsourcers must produce the component they have been entrusted with while meeting their commitments in terms of technical specifications, deadlines and cost. At present, difficulties within the aeronautics industry are mainly of a technical nature, especially with regard to component integration. The recent technical setbacks encountered by Airbus and Boeing when they began production on the A380 and B787 demonstrate that there is always a risk in the systems integration process. Moreover, operational risk also extends to planes already sold. Should the component be technically defective before the contractual deadline, the supplier is responsible for repairing or replacing it.Hub firms also assume responsibility in terms of security when the system is ready for final certification. No new aircraft can fly without first being certified by the public authorities. Additionally, in the event of a problem during the certification process, the supplier may be subject to a penalty depending on the how far the flaw puts the programme behind schedule.! Demand-related risk is linked to the fact that while a selected supplier is almost sure to remain in place for the duration of the programme, the equipment will only be paid for once the aircraft has been sold, even though the supplier has covered part or all of the investment required for the manufacturing costs (Kechidi, 2006). Consequently, they must bear the non-recurring costs (design and development) which will be depreciated over the number of airplanes sold. This is known as risk sharing. The pre-financing of product design and development costs, as well as the manufacturing process carried out by the outsourcer, results in the financial risk being shared with the constructor, a risk that is tied to the project’s success. Pre-financing also means that the architect-integrators can transfer part of the heavy investment required to their outsourcers5, especially as, even if the project is a success, no return on investment can be expected before at least twelve years6.! Finally, from a macro-economic perspective, with the production process becoming more and more disaggregated and international, the problem of foreign exchange rate risk is increasingly frequent. If a European aircraft manufacturer, as in the case of Airbus, is approached by an airline offering to pay in dollars, they still have to settle part of their purchases in euros, leaving them open to a potential exchange rate risk. In addition to the widely used exchange rate hedging, they may seek to transfer this risk to their suppliers by paying for their own orders in dollars.! In short, hub firms have emerged in response to the new strategies developed by architect-integrators (Table 1), with a rise in the value chain, management of a network of outsourcers, and greater risk-taking that, combined,
M@n@gement, 17(2): 110-135! Mathieu Bécue � Jean Belin � Damien Talbot
113
5. The investment required for the production of the A350 XWB family of airliners alone (excluding R&D costs, making the financial cost considerably higher) amounted to approximately €4bn for Airbus, in addition to the investments agreed to by the partners responsible for the airframes, such as Aerolia (€220m), Premium Aerotec (€360m), Spirit AeroSystems (€400m) and GKN Aerospace (€140m). However, in return, Airbus received repayable public loans worth €3.23bn for the programme (Air & Cosmos, 30 April 2010).
6. The break-even point for a programme such as the A380 is reached when about 460 aircrafts are delivered and paid for (Air & Cosmos, 4 June 2011). In June 2012, 253 orders were placed for A380 airliners, 75 of which have now been delivered with the rest scheduled for delivery over several years (cf. www.airbus.com).

turn a manufacturer into a hub firm, in other words, an architect-integrator of entire sub-assemblies.
Dedicated assets. Lavie (2006) argues that relational rents can only be generated from a pool of shared assets, while Amit and Shoemaker (1993) believe that asset specificity is a key condition to producing this type of rent. Williamson (1994), on the other hand, demonstrated that benefits can be generated through exchange as long as companies are willing to commit specific investments to the relationship. He identified three categories of asset specificity: (i) site specificity, in that creating a specific organisational structure for inter-organisational relations allows partners to work together in the same place (Dumoulin & François, 2002). This geographic proximity helps to cut down on coordination costs (Dyer, 1996) by facilitating exchange of knowledge, especially tacit knowledge (Polanyi, 1983); (ii) physical and intangible asset specificity promotes product differentiation and can act as a source of performance enhancement (Nishiguchi, 1994); (iii) the same applies to individuals who have gained specific skills and know-how over the course of their relationships (Asanuma, 1989). ! Collocated contracting teams illustrate how specific assets can be allocated to the architect-integrators and hub firm relationship. During the aircraft design stage, teams of engineers from both the architect-integrators and the hub firms are brought together on one site for a number of months. Their purpose is to decide on the aircraft’s overall architecture, to jointly establish the interfaces between the different modules and to hone the technical solutions. These goals imply considerable knowledge exchange, facilitated by the face-to-face interaction made possible by this temporary geographic proximity, in particular with regard to tacit knowledge (Torre, 2008). Moreover, with each new programme, engineers share R&D tools that are often brand new, in addition to pooling the know-how accumulated by previous collocated contracting teams. Airbus created its first mixed contracting team in Toulouse for the development of the A340-500/600 line back in 1997 (Zuliani, 2008; Jalabert & Zuliani, 2009). Likewise, the A380 and the A350 XWB lines were also assigned a dedicated team in Toulouse, comprising a thousand or so engineers and technicians in both instances. The contracting team
Relational Rent and Underperformance! M@n@gement, 17(2): 110-135
114
Table 1. Sector-specific dynamics and strategic responses in the aeronautics industry (2000-2010)
Sector-specific dynamics Architect-integrator strategies Hub firm strategiesGreater product complexityGreater range of expertise Programme accelerationIncreased production volume
Refocusing both upstream and downstream the value chainOutsourcing to tier-1 firms
Rise the value chainIntermediation between architect-integrators and lower-tier outsourcers Risk-taking
Table 2. Empirical conditions for relationnal rents in the aeronautics industry
Prerequisites for relational rents Design and industrial rents in the aeronautics industry
Benefits
Specifically dedicated assets Collocated contracted teams, digital models, production tools, strategic human capital
Enhanced engineering productivity
Knowledge exchange Systematic exchange of expertise (platforms, models) and selection (e.g. Bombardier), PMR (e.g. Airbus), scheduling and planning software, interface tools
Fewer challenges linked to location and acquisition costs
Combined resources and competencies
Joint specialization Decrease in mass, production and maintenance costs
Governance mechanisms Selection process, PMR (Portable Mobile Radio), scheduling and planning software, interface tools
Reduced coordination costs, opportunism, self-regulation

is then dissolved as the transition is made to a ‘virtual platform’ via simultaneous engineering technology. Other specific assets then come into play, in our case intangible assets such as digital models designed by the architect-integrator and updated in real time by the hub firms via a secure network. Thanks to these assets and a context of growing R&D spending due to greater product complexity and the capping of resources, in the last ten years Airbus has shortened the aircraft development phase from 7.5 to 6 years and improved overall engineering productivity by 15% (reduced spending on senior engineers’ travel expenses, fewer items to handle, shorter development cycles, etc.) (Igalens & Vicens, 2006).During the program's industrial production phase, which could span decades in the event of commercial success (the A320 made its maiden flight in 1984), incremental innovations are integrated into the product, which justifies preserving specific assets such as digital models. Moreover, the acceleration of programs and the highly technological entry barriers which remain prevalent in the aeronautics industry result in architect-integrators repeatedly working with the same hub firms from one program to the next. Thales Avionics thus furnishes the avionic components for the entire Airbus line. In reality, the same engineers are assigned to different collocated contracting teams, enabling them to develop the expertise required for this type of organisation. Should the contracting team be dissolved between two programmes, the precious human capital is strategically retained within the company. Naturally, many production tools are designed and produced specifically for each programme7, and can be found in the different partner facilities (final assembly lines, production lines for dedicated components). In effect, each programme’s unique features mean hub firms generally develop and manufacture components that meet the demands of specific architect-integrators (Airbus, Boeing, Embraer, Bombardier, Comac, Dassault, etc.).
Considerable routine exchange of knowledge. Routine knowledge sharing has a positive impact on both innovation and performance as the pooling of intelligence through the recombination and passing on of expertise (Dhanaraj & Parkhe, 2006) fosters the emergence of new ideas and know-how. Such interaction models facilitate the transfer, recombination and generation of highly specific knowledge (Grant, 1996). Collocated contracting teams and digital models form specific assets whose use has given rise to the development of this type of routine knowledge-sharing between geographically and organisationally dispersed engineers. All the more so given that the latter often maintain long-term relationships that further encourage such exchanges. Thus, the challenges of geographic proximity can be at least partly alleviated during the design phase.! During the manufacturing stage that follows, knowledge exchange is further enhanced by a routine interaction model. Airbus launched a ‘Program Meeting Review’ (PMR) in the 1990s, whose purpose was set out in the outsourcing contract: it involves frequent, monthly or bi-monthly meetings to allow the architect-integrator and the hub firm to assess the work in progress and to oversee the technical aspects of the activities. A large number of information systems8 and interface tools are used alongside the interaction model in place so that architect-integrators can communicate with both the hub firms and further afield9,leading to huge savings on procurement costs for the architect-integrators. Each new programme gives aircraft manufacturers the opportunity to purchase components at lower cost, with savings of around10 20%.
A combination of complementary resources and competencies. The complementarity between architect-integrators’ and hub firms’ resources and skills fosters new forms of innovation in aircraft design and subsequently impacts on the potential to generate relational rents (Shan & Hamilton, 1991; Prahalad & Hamel, 1994; Dyer & Singh, 1998). This complementarity can be observed in so-
M@n@gement, 17(2): 110-135! Mathieu Bécue � Jean Belin � Damien Talbot
115
7. For example, Spirit AeroSystems opened a manufacturing facility in North Carolina to produce airframe components exclusively for the A350 XWB. Daher and GKN Aerospace have also made investments specifically for that programme (Air et Cosmos, 30 April 2010).
8. Airbus uses ERP production programmes as well as Advanced planning & scheduling software with its hub firms (Air & Cosmos, 12 October 2007).
9. Airbus uses Sup@irworld while Boeing favours Exostar (Air & Cosmos, 12 October 2007).
10. The Airbus ‘Route 06’ programme is the most striking example to date. Among other things, it envisaged reducing supply costs by 15% between 2003 and 2006, amounting to around €500 million savings, totalling €1.5 billion in cumulative cost savings for miscellaneous expenses (development, production, structure). The Power 8 and Power 8+ programmes, launched in 2007, are expected to improve Airbus’ earnings before interest and tax (Ebit) by €2.1 billion, and to secure additional cash flow worth €5 billion over three years (Air & Cosmos, 23 November 2007 and 18 December 2009; La Tribune, 19 December 2007).

called ‘co-specification relationships’. Co-specification refers to the joint effort to generate the specific and vital technical knowledge needed to drive a project forward (O’Sullivan, 2006). It also gives rise to shared architectural knowledge about the way components are integrated and interconnected as a coherent whole (Henderson & Clark, 1990). Hub firms are in a position to offer new technical solutions to the architect-integrator, promoting their rise in the value chain, while the latter can reap the benefits of the hub firm’s innovation skills.In the case of the A380 airliner, two major technological breakthroughs resulted from the co-specification process between Airbus and hub firms, giving the product a competitive edge. Certain components had to be decentralised as the aircraft’s size effectively required decentralised hydraulic and electric systems to be developed in order to minimize the components’ mass. Airbus, Messier-Bugatti and Sofrance (Safran) replaced the old centralised systems, which were entirely hydraulic and connected by a complex set of circuits, by electro-hydraulic systems dedicated to each piece of equipment. Other manufacturers preferred to shift from a decentralised to a centralised strategy. Before the A340 programme was developed, computers for the avionics systems were designed to fulfil one single function. In this configuration, adding new on-board functions to the aircraft required new computers and new connections, implying evermore equipment and a subsequent increase in the aircraft’s mass as well as in maintenance costs. The integrated modular architecture developed by Airbus and Thales Avionics for the A380 (as well as by Boeing and Smiths Aerospace for the B787 aircraft, referred to as the ‘Common Core System’) consists of abandoning the principle of a dedicated resource, so that one computer can serve different purposes, leading to a gain in mass and lower production and maintenance costs (Cagli, Kechidi & Levy, 2009).
Robust governance mechanisms. According to Boeing, 70% of the 787 model is outsourced, while Airbus relies on outsourcers for about 80% of its aircraft value11. Given the high level of outsourcing, governance mechanisms need to be set up to manage the interchange as efficiently as possible (Dyer & Singh, 1998). Such mechanisms need to guard against opportunism by the partners (Dhanasai & Parkhe, 2006) and, from the architect-integrators’ perspective, to guarantee the hub firms’ competencies and continued financial viability12. Studies on how inter-organisational relationships are handled have identified two complementary forms of control: formal and informal. Formal control is based on the partners’ contractual commitments and is underpinned by target-related and explicit mechanisms. Penalties applicable in the event of non-conformity are essentially of a judicial nature. The system is designed to manage outcomes using different, highly codified mechanisms (Dekker, 2004), and to guide behaviour through standardized procedures (Ouchi, 1979). Informal control, on the other hand, is essentially founded on tacit self-regulatory mechanisms that are influenced by the psychological and social characteristics of those who implement them. In the event of non-conformity, sanctions are of a more or less moral nature. Trust has proved a particularly effective control tool with regard to inter-organisational relationships (Dekker, 2004). Ex-ante, informal control mechanisms mean that partners can be chosen both for their competencies and according to their assumed ability to meet common goals. Ex-post, trust is generated through successful repeat interactions (achieving goals, problem resolution, loyalty, etc.) and the fact that each partner is better acquainted with the other party’s expectations. ! Formal and informal control processes are introduced once the architect-integrator has selected the hub firms. Cagli, Kechidi and Levy (2009) describe the selection mechanisms used by Airbus for the A380 and A350 XWB programmes. The teams from each partner form part of a three-stage organisational
Relational Rent and Underperformance! M@n@gement, 17(2): 110-135
116
11. Air & Cosmos, 12 October 2007.
12. In 2006, Boeing provided financial and human resources for two struggling hub firms: Mitsubishi was in charge of manufacturing the wings for the 787 and the mid-fuselage section was entrusted to Alenia Aeronautica.

framework. The preliminary pre-collocated team stage consists of defining market needs and the techniques available to satisfy them. This occurs at a very early stage of the plane manufacturing process, free from any contractual obligations, and allows Airbus to monitor the competencies of each party and to ensure that confidentiality is respected. Any form of opportunistic behaviour by the hub firm will be sanctioned by Airbus and result in the partnership being terminated. Otherwise, a relationship of trust gradually develops, reducing coordination costs through the self-regulatory mechanisms that such relations engender. During the second stage, Airbus formally selects one or more competing hub firms. At this point, technical features, price and deadlines are discussed. The hub firm’s capacity to shoulder the risks and to finance the development phase of the components is also closely scrutinized. The third phase secures the mutual agreement between the partners and the technical characteristics, price and deadlines are then agreed upon 13.! The routines introduced to exchange expertise during the industrial production phase also give architect-integrators an opportunity to monitor the hub firm. The ‘PRM’ meeting system, for instance, offers a means to resolve situations that are not explicitly included in the initial contract, to fill gaps in contract provisions and to ensure that commitments undertaken during the selection phase are being met (formal control). Respect nurtures the trust accumulated over the course of the different programs jointly undertaken by the partners (informal control). More generally, the information systems and interface tools are designed to formally monitor adherence to schedules, quality standards and procedure implementation.
FINANCIAL PERFORMANCE OF SUBCONTRACTORSIN THE AERONAUTICS INDUSTRY
! In this section we identify the hub firms from among the other subcontractors in the aeronautics industry, analyse their accounts to highlight their specific characteristics, and conduct a statistical analysis of their financial performance.
DEFINING SAMPLES AND IDENTIFYING HUB FIRMS
! A comparative analysis of hub firms’ financial situation was performed on outsourcers in the aeronautics industry based in the Aquitaine and Midi-Pyrénées regions. We used two sources of information: financial data came from the Diane database, while subcontracting firms, and more particularly hub firms, were identified from the annual INSEE survey on subcontracting organisations, suppliers and service providers in the aeronautics and aerospace sector. The survey includes all organisations from Aquitaine and Midi-Pyrénées that have been commissioned for outsourcing work by one of the architect-integrators in the aeronautics and aerospace industry, totalling almost 1100 organisations. We decided to restrict the analysis to businesses with a sufficiently high turnover (> 20 %), giving us 578 organisations. We then selected the 273 companies whose financial data was available in the Diane database for the period 14 2000-2007. The use of a constant sample enabled us to conduct trend analyses (Stolowy, Lebas & Langlois, 2006).! The criteria selected to distinguish hub firms from other industry players,
M@n@gement, 17(2): 110-135! Mathieu Bécue � Jean Belin � Damien Talbot
117
13. When the Canadian architect-integrator Bombardier launched a new programme, a similar, five-stage formal and informal system was adopted.
14. The financial data was retrieved in the framework of the research contract for ‘regional hub firms in the aeronautics industry: the power 8 plan and the restructuring of the subcontractor network in Aquitaine and Midi Pyrénées, financed by the Conseils Régionaux [regional authorities] in these regions between 2007-2010. Data retrieval was performed in 2009. In view of the delay in publishing company accounts and the period required for registration in the Diane database, 2007 was selected as it was the year when information was available for the largest number of firms. Selecting the year 2008 would have considerably reduced our final sample size.

particularly from tier-one suppliers, reflects the definition presented in the first section, in other words, hub firm are distinguished by their rise in the value chain, responsibility for a major component, management of a network of outsourcers and greater risk-taking. We can comprehend the technological and relational aspects from certain criteria in the annual INSEE survey. The following five conditions need to be met for a company to be considered a tier-1 hub firm: it must be a specialized tier-1 outsourcer working in the context of a global offer or a global manufacturing offer. A hub firm’s activity is not limited to subcontracting activities exclusively. Hub firms propose a specialized offer, offering specific expertise that the order-givers lack (i); in turn, it uses other outsourcers for aeronautics-related activities (ii); as a key partner, it must hold the accreditation required (iii) ; it employs staff in a design department or a design and engineering department, as hub firms work with the architect-integrator to co-design the units or sub-assemblies they are entrusted with (iv); as an extension of the previous criterion, the firm offers R&D/design and/or production services(v).In total, we identified 42 hub firms and found the financial data for the selected period (2000-2007) for all of them. The complementary sample comprises 231 companies representing all levels of subcontractors.
HUB FIRMS WITH DISTINCTIVE CHARACTERISTICS
! We first examine how hub firms’ balance sheets (Table 3) and profit and loss accounts (Table 4) compare to those of other subcontractors in the aeronautics industry and then consider the possible implications in terms of financial performance and risk 15 (Table 5). To examine the specific characteristics of hub firms, a static analysis was performed for the year 2007, in addition to a cross-sectional analysis of changes for the period 2000-2007. The balance sheet and profit and loss account items are presented respectively in percentage of total asset/liability and net turnover (Stolowy, Lebas & Langlois, 2006). Average ratios for the different categories of companies are calculated from inflation-adjusted data. This neutralises the relative importance of the company insofar as we analyse ratios per individual company so the results reflect the behaviour of companies as a group rather than that of a company with significant presence. Given the already limited sample size of our different groups, aberrant values have been removed from the analysis while extreme values have been preserved. The median analysis thus confirms the conclusions drawn from the analysis of averages. Using medians helps us understand the behaviour of the majority of firms without the extreme behaviours that would skew our conclusions.! The analysis of the specific characteristics of hub firms consequently suggests that their position as intermediaries involves larger intermediary stocks and consumption, while risk-taking is also comparatively higher, resulting in weaker financial performance overall.
POSITION AS INTERMEDIARY
Large stocks. The balance sheet structure of hub firms is highly specific, particularly with regard to their level of current assets. These companies appear to hold substantial levels of stocks (27.3% of their total balance, twice the rate of non-hub firms in our sample at 12.8%). Stock levels were particularly high between 2000 and 2007, rising by 7.6% against 2.2% for the sample overall. This can be explained by the hub firms’ role as intermediary, which led them to act as a logistics platform in that they provide storage for the unit they are in charge of for the architect-integrator. Moreover, the hub firms’ stock turnover rate is
Relational Rent and Underperformance! M@n@gement, 17(2): 110-135
118
15. We describe the method that underpinned our analysis in Appendices 1 and 2, along with the main indicators used and their definition.

extremely low. With around 100 business days and a fairly steep growth period between 2000 and 2007, stock turnover was almost treble that of the daily rate of the other firms.
High levels of consumption. The intermediary position occupied by hub firms also accounts for their elevated levels of consumption, which represented 55.6% of their turnover in 2007 against 40.2% for non-hub firms. A large proportion of consumption is due to ‘miscellaneous purchases and external expenditure’ (39.9% of the turnover), which includes ‘general outsourcing services’. Consumption levels rose by more than 7.0 points between 2000 and 2007, compared to relative stability for the other firms in our sample. This indicates a higher level of outsourcing by hub firms. Thus, the rate of added value only accounts for 45.6% of hub firms’ turnover, against 56.4% for the rest of the sample.
Table 3. Balance sheet structure for hub firms, non hub firms and the overall sample
200720072007 2000-2007 evolution2000-2007 evolution2000-2007 evolution
Hub Non-hub Total Hub Non-hub Total
Net fixed assets 20.8% 20.3% 20.4% 0.4% -1.4% -1.1%
Net intangible assets 3.9% 4.5% 4.4% 2.1% 1.3% 1.4%
Net tangible assets 14.0% 13.1% 13.3% -1.9% -1.6% -1.6%
net financial assets 2.9% 2.7% 2.7% 0.2% -1.1% -0.9%
Net current assets 78.2% 78.6% 78.6% 0.3% 1.7% 1.5%
Net stocks 27.3% 12.8% 15.1% 7.6%** 2.2% 3,00 %
Net accounts receivable 33.3% 42.4% 41.1% -8.3%** -2.2% -3.1%
Net marketable securities 2.3% 5,00 % 4.6% -0.2% 0.4% 0.3%
Net cash assets 4.8% 10.1% 9.3% 0.4% -0.3% -0.2%
Net current assets 10.4% 8.1% 8.4% 0.8% 1.6% 1.5%
Accruals 1,00 % 1,00 % 1,00 % -0.7% -0.3% -0.3%
Total assets 100,00 % 100,00 % 100,00 %
Equity 35.4% 38.6% 38.1% 1.5% 4.4% 4,00 %
Corporate share capital 10.4% 9.9% 10,00 % -0.2% -1.1% -1,00 %
Opening result 3.5% 6.8% 6.3% -1.8% 0.3% 0,00 %
Reserves and adjustments 19.6% 20.9% 20.7% 3.2% 5,00 % 4.7%
Investment subsidies 0.4% 0.7% 0.6% -0.1%† 0.1% 0,00 %
Regulated provisions 1.4% 0.4% 0.5% 0.4%* 0.2% 0.2%
Misc. capital and provisions 0.7% 0.2% 0.3% 0.2% 0.1% 0.1%
Risk and contingency provisions 2.6% 1.3% 1.5% -0.4%† -0.2% -0.2%
Liabilities 59.8% 58.8% 58.9% -0.8% -4.6% -4,00 %
Financial liabilities 12.6% 11.9% 12,00 % -0.2% -2,00 % -1.7%
Bank loans, overdrafts & credit bal. 1.9% 1.5% 1.5% -2.3% -0.7% -0.9%
Accounts payable 23,00 % 18.5% 19.2% -0.9% -1.5% -1.4%
Tax and social liabilities 16.1% 21.2% 20.4% -0.3% 0.2% 0.1%
Miscellaneuous liabilities 6.2% 5.7% 5.8% 2.9%** -0.7% -0.1%
Accruals 1.4% 1.1% 1.2% -0.5% 0.2% 0.1%
Total liabilities 100,00 % 100,00 % 100,00 %N = 273 (42 hubs firms and 231 non-hub firms). Source : calculation made by authors from the Greffe des tribunaux de commerce (Diane).Significant difference between hub and non hub firms : † p < 0,1 ; * p < 0,05 ; ** p < 0,01.
M@n@gement, 17(2): 110-135! Mathieu Bécue � Jean Belin � Damien Talbot
119
ACCEPTING GREATER RISK
High level of provisions. The level of provisions, whether regulated provisions (which include provisions against price increases and exchange rate fluctuation) or contingency provisions, is significantly higher than our sample average: respectively 1.4% and 2.6% of the total balance in 2007 for hub firms against 0.4% and 1.3% for the other companies surveyed. This might be due to the way the integrator-architects transfer risks (operational, security, demand and macro-economic) to hub firms. The accounting data is organised so that all the provisions against inherent risks related to the entity’s activities, such as guarantees given to clients or transactions in foreign currencies, are recorded in the accounts.
A fragile financial structure. We observed a situation of contained risk with respect to the structure of hub firms’ asset liquidity and loan repayments. At the same time, the level of risk rose over the period 16 2000-2007. From the general and reduced liquidity ratios, we can see that hub firms are able to repay their debts in the short term, but their ability to do so is more limited than that of the other firms in our sample. ! The amount of stock significantly impacts on the need for finance linked to the hub firms’ operating cycle, which we measured through working capital requirements. It was estimated at over 86 business days for the year 2007, compared to 48 days for the other outsourcers in our sample. However, it is far lower than the working capital requirements in 2007, which registered over 106 business days. Hub firms pay for most of their working capital requirements through financial liabilities (the median of financial liabilities for hub firms is nearly double that of other outsourcers). This level of debt has a significant impact on their independence and financial autonomy, with these ratios below the average of other firms at 36.2% (against 38.8%) and 42.9% (against 47.7%), respectively. While this situation enables them to partially offset their total stocks, it also puts them in a more vulnerable position.! Consequently, while the overall debt and debt load ratio of hub firms remains acceptable, it is nonetheless well above average. The indebtedness of hub firms can be observed in the interest/turnover ratio, which is more than double than that of the other firms surveyed. Likewise, the self-financing capacity of hub firms is below that of other firms in the sector (averaging 5.7% against 7.1%). This suggests that a higher percentage of its capacity is earmarked to pay off its financial liabilities (the repayment capacity indicator and total interest on added value is almost 3% against an average 1.4% for the rest of the sample).
Potentially higher risk of bankruptcy. The Conan and Holder score (1979) analysis gives us an indication of the bankruptcy risk for different types of companies. It provides an overall score using ratios deemed by the authors to be most indicative of risk of bankruptcy. The level of scores obtained (15.5 and 20.9 respectively for hub and non-hub firms) again helps us to put the two categories into perspective. In effect, the ratio level suggests a bankruptcy risk below 10%. However, the score of the hub firms in the sector nonetheless showed them to be at a disadvantage.
Weaker financial performance. The significantly lower payroll costs (35% of turnover vs. 44.2% on average for non-hub firms) cannot offset the high level of consumption. The overall result indicates lower earnings before interest and net result compared to those recorded by the other firms in our sample. If we compare the results for the fiscal years 2000 and 2007, the same indicators showed a stronger decline for hub firms than for other stakeholders in the subcontracting chain.
Relational Rent and Underperformance! M@n@gement, 17(2): 110-135
120
16. Table 5 includes all the structure and asset liquidity indicators used in our analysis for the year 2007 as well as the transverse evolution observed between 2000 and 2007..

Similarly, the substantial degree of intermediate consumption observed among hub firms has a strong bearing on productivity ratios. The productivity of the production potential attained by hub firms was 1.8 against 3.2 on average for the other firms, even though the former record higher productive investment rates (11.7% against 8.6%). On a larger scale, the invested capital productivity rate is also lower at 0.46 against an average of 0.67. The amount of investment combined with the level of total stocks has a strong impact on the level of productivity. If we consider the return on equity and fixed assets, we reach the same conclusion, namely, lower profitability and sluggish development during the period of analysis.
Table 4. Profit and loss account of hub firms, non-hub firms and the overall sample200720072007 2000-20072000-20072000-2007
Hub Non hub Total Hub Non hub Total
Net turnover sales (net of tax) !- 100.0% !- 100.0% !- 100.0%Exports !- 16.7% !- 6.6% !- 8.1% !--4.8% !- 0.7% !- 0.2%
Purchase of goods and other supplies !- 20.9% !- 15.3% !- 16.2% !- 2.5%† !--0.5% !- 0.1%Merchandise !- 0.3% !- 4.6% !- 4.0% !--1.6% !--0.4% !--0.6%Pr. and other supplies !- 20.6% !- 10.7% !- 12.2% !- 4.1%* !--0.1% !- 0.5%
Year-end production !- 98.2% !- 94.0% !- 94.6% !- 0.1% !- 0.1% !- 0.1%+ Sales margin !- 2.9% !- 2.6% !- 2.6% !- 2.1% !- 0.5% !- 0.8%- Year-end expenses !- 55.6% !- 40.2% !- 42.6% !- 7.3%** !--0.4% !- 0.8% Incl. other exp. and ext. costs !- 35.9% !- 29.7% !- 30.7% !- 3.3%† !--0.4% !- 0.2%
Added value !- 45.6% !- 56.4% !- 54.7% !--5.0%** !- 0.9% !- 0.0%- Labour costs !- 35.0% !- 44.2% !- 42.7% !--2.2% !--1.0% !- 1.2%- Taxes and contributions !- 3.0% !- 2.9% !- 2.9% !- 0.1% !- 0.0% !- 0.0%+ Operating subsidies !- 0.4% !- 0.4% !- 0.3% !--0.5% !--0.4% !- 0.4%
Gross operating income before depreciation and amortisation !- 7.9% !- 9.7% !- 9.4% !--3.4%† !- 1.5% !- 0.7%+ Misc. provisions, expenses and write-backs !- 2.5% !- 1.1% !- 1.4% !--0.7% !--2.8% !- 2.5%- Operating expenses, depreciation allowances and provisions !- 4.4% !- 3.4% !- 3.6% !--2.3% !--1.5% !- 1.6%
Operating income !- 6.0% !- 7.4% !- 7.2% !--0.8% !- 0.1% !- 0.2%+ Joint ventures !- 0.0% !- 0.0% !- 0.0% !- 0.0% !- 0.0% !- 0.0%+ Revenue !- 1.8% !- 0.7% !- 0.8% !- 0.1% !--0.3% !- 0.2%- Expenses !- 1.9% !- 0.9% !- 1.0% !--0.9% !--0.4% !--0.5%Interest payable and similar !- 1.1% !- 0.7% !- 0.8% !- 0.1% !--0.2% !--0.1%
Earnings before tax !- 6.0% !- 7.2% !- 7.0% !--0.8% !- 0.2% !- 0.1%+ Extraordinary income !- 2.1% !- 1.2% !- 1.4% !--1.3% !--0.2% !--0.3%- Extraordinary charges !- 2.4% !- 0.9% !- 1.1% !- 0.2% !--0.3% !- 0.3%- Employee profit sharing !- 0.7% !- 0.2% !- 0.3% !- 0.2% !- 0.1% !- 0.1%- Income taxes - deferred taxes !- 1.5% !- 2.0% !- 1.9% !--1.3% !--0.5% !- 0.6%
Profit and loss !- 3.5% !- 5.4% !- 5.1% !--1.2% !- 0.8% !- 0.5%Outsourcing !- 2.8% !- 2.1% !- 2.2% !--1.9% !--0.7% !- 1.0%External contract staff !- 0.5% !- 0.4% !- 0.4% !--0.3% !--0.1% !--0.1%Total misc. purchases and other external costs !- 6.3% !- 5.9% !- 6.0% !- 6.3% !- 6.1% !- 6.0%N = 273 (42 hub firms and 231 non hub firms). Source : calculation by authors from the greffe des tribunaux de commerce (Diane).Statisctical signifiance between hub and non hub firms : † p < 0,1 ; * p < 0,05 ; ** p < 0,01.
M@n@gement, 17(2): 110-135! Mathieu Bécue � Jean Belin � Damien Talbot
121

Relational Rent and Underperformance! M@n@gement, 17(2): 110-135
122
Tabl
e 5.
Pro
fitab
ility
and
risk
indi
cato
rs fo
r hub
firm
s, n
on h
ub fi
rms
and
the
over
all s
ampl
e
2007
2007
2007
2000
-200
720
00-2
007
2000
-200
720
0720
0720
0720
00-2
007
2000
-200
720
00-2
007
Hub
Non
hub
Tota
lH
ubN
on H
ubTo
tal
Hub
Non
hub
Tota
lH
ubN
on h
ubTo
tal
Stru
ctur
e an
d liq
uidi
tyM
argi
n an
d ad
ded
valu
eFi
nanc
ial e
quilib
rium
1.9
2.3
2.3
0.0
0.4
0.4
Sale
s m
argi
n (%
)84
37.4
43.8
**34
.0-1
91.5
-72.
6
Fina
ncia
l ind
epen
denc
e (%
)42
.847
.747
.70.
88.
68.
3Ad
ded
valu
e ra
te (%
)45
.656
.354
.7*
-5.0
0.9
0.0
Deb
t (%
)17
.113
.713
.7-0
.4-9
.5-8
.6Em
ploy
ee p
rofit
sha
ring
(%)
78.4
78.7
78.7
2.7
-0.2
0.2
Fina
ncia
l aut
onom
y (%
)36
.238
.838
.81.
84.
54.
1G
over
nmen
t sha
re (%
)10
9.2
9.4
-1.4
-0.3
-0.5
Degr
ee of
dep.
tang.
fixed
asse
ts (%
)64
.869
.769
.71.
69.
47.
3Le
nder
s' sh
are
(%)
2.7
1.4
1.6
0.6
-1.8
-1.4
Fina
ncin
g of
net
cur
rent
ass
ets
0.4
0.4
0.4
0.0
0.0
0.1
Self-
finan
cing
sha
re (%
)12
.512
.912
.90.
60.
50.
6
Gen
eral
liqu
idity
1.9
2.1
2.1
0.0
0.1
0.1
Red
uced
liqu
idity
1.2
1.8
1.8
-0.2
0.1
0.0
Man
agem
ent
Prod
uctiv
ity a
nd p
rofit
abilit
ySt
ock
rota
tion
(D)
96.2
33.4
43.2
29.9
9.0
9.9
Econ
omic
eff.
(tho
usan
d/em
pl)
59.6
88.7
84.1
4.8
57.1
34.9
Trad
e re
ceiv
able
s (D
)83
.490
.689
.6*
-19.
5-4
.1-7
.9Pr
od. o
f pro
duct
ion
pote
ntia
l1.
83.
23.
0-0
.5-0
.2-0
.2
Trad
e ac
coun
ts p
ayab
le (D
)94
.677
.880
.4-1
2.3
-6.5
-7.5
Prod
uctiv
ity o
f fina
ncia
l cap
ital
0.8
1.2
1.1
-0.1
0.0
-0.1
Turn
over
p. w
orkf
orce
(thd
/em
pl.)
137.
616
0.1
156.
619
.172
.944
.3Pr
oduc
tivity
inve
sted
cap
ital
0.5
0.7
0.6
-0.1
0.0
0.0
Fina
ncia
l int
eres
t rat
e (%
)1.
10.
70.
80.
1-0
.2-0
.1Pr
oduc
tive
inve
stm
ent r
ate
(%)
11.7
8.6
9.1
-4.7
-13.
0-9
.5
Inte
rest
s / t
urno
ver (
%)
1.9
0.8
1.0
-0.9
-0.5
-0.4
Econ
omic
rate
of r
etur
n (%
)7.
99.
79.
4†-3
.41.
30.
7
Tota
l deb
t (D
)17
914
7.1
152
4.5
-9.7
-7.5
Perfo
rman
ce (%
)5.
97.
27.
0-0
.80.
10.
0
Deb
t rat
io (%
)63
.661
.461
.8-4
3.3
-34.
2-3
5.6
Gro
ss re
turn
of n
et e
quity
(%)
23.3
-23.
428
.7†
-3-9
5.8
-1.4
Cap
acity
to re
pay
-0.5
1.4
1.1
-1.2
0.2
0.1
Net
pro
fitab
ility
(%)
3.5
5.4
5.1
-1.2
0.8
0.5
Self-
finan
cing
cap
acity
(%)
5.6
7.1
6.9
-1.1
0.8
0.6
Net
retu
rn o
n eq
uity
(%)
18.6
-43.
9-3
4.2
-3-9
0.9
Wor
king
cap
ital t
urno
ver
cove
r10
6.6
92.2
94.5
15.8
7.3
9.0
Net
retu
rn o
n su
st. r
esou
rces
(%)
18.8
28.7
27.2
-0.6
4.5
15.0
Wor
king
capi
t req
ui. t
urno
ver c
over
86
48.6
54.4
8.5
8.5
8.6
Burd
en o
f WC
R (%
)61
.645
.247
.83.
41.
72.
0So
lven
cy ra
tion
(%)
0.1
-0.2
0.1
0-0
.40.
0
Expo
rts (%
)16
.76.
68.
1-4
.80.
7-0
.2C
onan
-Hol
der S
core
NPC
15.5
20.9
20-2
.91.
40.
8
SoSo
urce
: cal
cula
ted
by th
e au
thor
s fro
m th
e gr
effe
des
trib
unau
x de
com
mer
ce d
atab
ase
(Dia
ne) (
a) D
ata
expr
esse
d in
med
ians
. S
tatis
tical
sig
nific
ance
bet
wee
n hu
b an
d no
n-hu
b fir
ms:
(*) 1
0%, (
**) 5
%, (
***)
1%

! Overall, the hub firms’ balance sheet and profit and loss account for the year 2007 revealed the relative weakness of their financial performance indicators. The way these indicators evolved over the period 2000-2007 suggests a clear decline.
ECONOMETRIC ANALYSIS OF SUBCONTRACTING FIRM DETERMINANTS IN THE FIELD OF AERONAUTICS
! The apparently weaker financial performance 17 of hub firms observed at statistic level could be imputable to factors other than the specific position these companies occupy. Hub firms may simply be part of a less profitable sub-sector. Their distinctive features would thus be due to their sector of origin rather than their role as a hub. Size, region, and other control variables could also be at the root of their unique situation. In order to verify our previous conclusions and to isolate the impact of the hub firm situation, we performed an econometric study that takes the ‘hub’ dimension into consideration, along with a set of control variables.! This analysis of the profitability drivers of subcontracting firms led us to test two hypotheses: first, tier-1 hub firms record lower profitability (profitability effect); second, the profitability of these same hub firms is much less consistent than other companies (redistributional effect). Should there be any annual profits, they are subsequently captured by the other players in the value chain (e.g. by the order-givers).
ECONOMETRIC MODEL
! The estimated econometric model establishes a linear relationship between the profitability, or ROA, of a firm for the period 2000-2007, the lagged effect, its role as a hub firm (I), an interaction term and a set of explanatory control variables (X):
(1) where u is the specific individual effect, v is the temporary specific effect and e is the error term.
! This specification is similar to that of Gedajlovic and Shapiro (2002) and Estrin, Poukliakova and Shapiro (2009). ! The profitability ratio (ROA) is defined as the ratio between a company’s total earnings or losses divided by its total assets. This variable is correlated with a hub firm’s position and prior profitability to express the redistributional effect (Lincoln & Gerlach, 2004; Estrin, Poukliakova & Shapiro, 2009). We then took several control variables (X) into consideration: i.e., size, turnover growth rate, debt, the region where the firm is based and temporary sector-specific indicators. Size was measured as the logarithm of total assets. This took into account returns to scale and large firms’ market power. Turnover growth rate was used to factor in the volume of demand for the company’s products. Two contradictory effects can be observed: first, turnover growth might be synonymous with increased market power and thereby increase profitability. Secondly, overly rapid growth might entail costly adjustments and thus reduce profitability. The company’s financial structure, which can be expressed by the ratio of debt over total assets, is also included in the equation since it is likely to considerably boost profitability. Regional and sector-related indicators are used to
M@n@gement, 17(2): 110-135! Mathieu Bécue � Jean Belin � Damien Talbot
123
17. Our econometric analysis focuses on financial performance for several reasons: firstly, the present paper seeks to examine the financial performance of subcontractors in the field of aeronautics following the profound changes identified. Secondly, performing an econometric analysis of storage and risk-related activities was extremely challenging since there are several types of stock (raw materials, work-in-process, finished goods) in a company and many reasons why they might be in storage (smooth work flow, acceleration, cycle stock…). This made the econometric analysis of storage strategies difficult. The same applies to supplies, as the motives and reasons also vary significantly. Likewise, given that risk is essentially evaluated by a score, the econometric analysis of risk is difficult insofar as the score is a linear combination of several ratios that may serve as explanatory variables. Finally, profitability is closely linked to the level of inventory while strongly influencing the company’s risk level.

assess these respective aspects. Temporary indicators serve to control the effects of disturbances induced by the economic situation and experienced by all firms (technological constraints, tighter debt financing conditions, etc.). Due to a lagged variable in our estimates, the corporate accounts needed to remain available for at least two consecutive years. Because of this, our sample comprises 2317 observations. ! As dynamic models are characterised by the presence of one or several lagged endogenous variables among the explanatory variables, a model estimate (1) using traditional methods (MCO and/or a fixed effect model) yields biased and non-converging estimators due to the correlation between the lagged endogenous variable and the individual heterogeneity. Introducing a lagged variable raises the specific issue of simultaneity between this variable and the residual error term. ! To take all the possible partial sources of bias into consideration 18, we applied the econometric specification developed by Blundell and Bond (1998) which relies on the so-called GMM system (Generalized Method of Moments), while estimates were obtained using Stata 10 software with the Xtabond2 command. This approach exploits independent variables along with their lagged differences. More specifically, the GMM system involves combining the system of equations at both first difference and levels for each period. It was specifically designed to provide estimates of data equations for a dynamic panel with persistent dependent variables and potentially endogenous independent variables. Blundell and Bond (1998) tested the method using Monte Carlo simulations and found that the GMM system estimator is more efficient than the GMM in first differences (Arellano & Bond, 1991) since the latter produces biased results for finite samples when the instruments are ‘weak’.! Finally, two tests are associated with the dynamic panel GMM estimator. First, we have the Sargan/Hansen overidentification test, which is used to evaluate the validity of lagged variables as instruments. The second is Arellano and Bond’s (1991) autocorrelation test where the null hypothesis corresponds to the absence of second-order autocorrelation of errors.
RESULTS
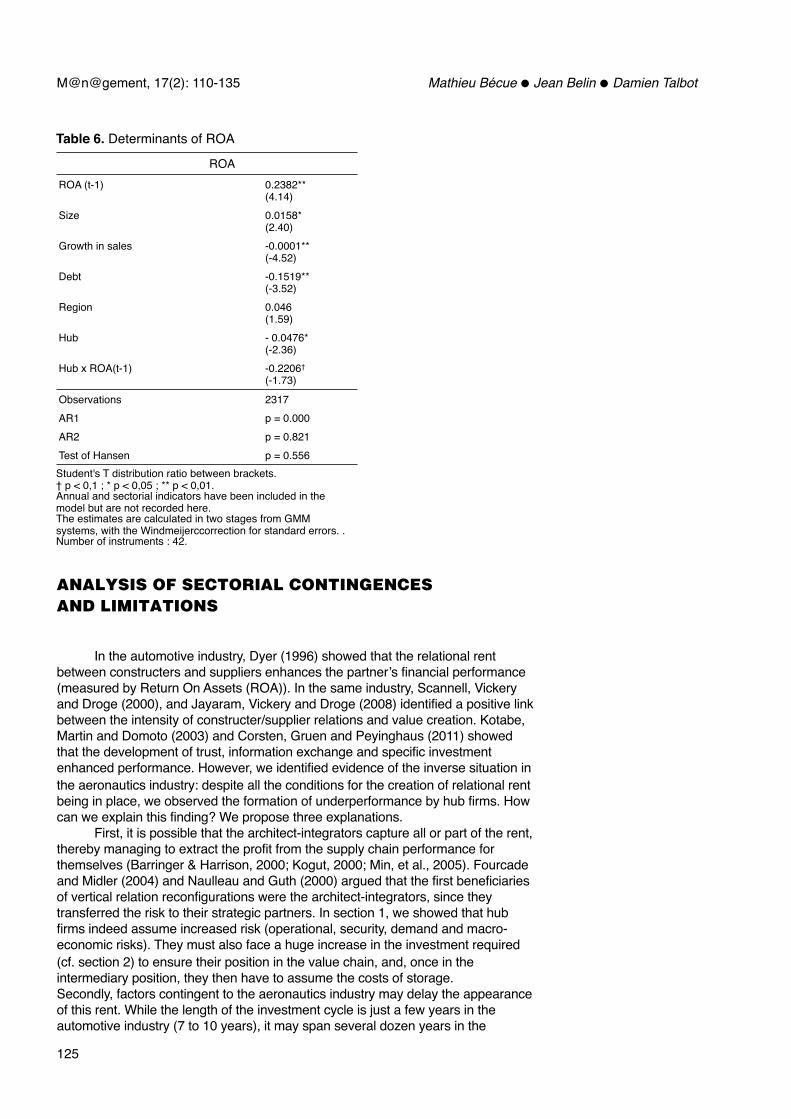
! In Table 6, the lagged profitability coefficient value and its significance show the importance of taking the dynamics into account. Size has a positive and significant impact, confirming that larger companies are more profitable due to diminishing returns and market power. ! Conversely, the sales growth rate has a negative and significant impact on profitability. Companies experiencing high growth rates are slow to adapt their productive structure, thereby reducing their profitability. Debt financing also has a negative and significant impact because of the elevated cost of this type of financing compared to internal financing or equity financing.! With regard to hub firm profitability, they do indeed appear to be less profitable than other companies as suggested by the significance of the hub indicator coefficient. Moreover, a redistributional effect can be confirmed at a 10% threshold. Hub firms are thus less profitable than other companies and their profitability is not persistent. If they are able to generate profit in the course of a year, it is likely to be captured by other companies in the value chain.
Relational Rent and Underperformance! M@n@gement, 17(2): 110-135
124
18. Bias due to simultaneity, reserve causality (potentially endogenous independent variables), temporary correlation of errors and omitted variables, or certain measurement errors in explanatory variables.
ANALYSIS OF SECTORIAL CONTINGENCES AND LIMITATIONS
! In the automotive industry, Dyer (1996) showed that the relational rent between constructers and suppliers enhances the partner’s financial performance (measured by Return On Assets (ROA)). In the same industry, Scannell, Vickery and Droge (2000), and Jayaram, Vickery and Droge (2008) identified a positive link between the intensity of constructer/supplier relations and value creation. Kotabe, Martin and Domoto (2003) and Corsten, Gruen and Peyinghaus (2011) showed that the development of trust, information exchange and specific investment enhanced performance. However, we identified evidence of the inverse situation in the aeronautics industry: despite all the conditions for the creation of relational rent being in place, we observed the formation of underperformance by hub firms. How can we explain this finding? We propose three explanations. ! First, it is possible that the architect-integrators capture all or part of the rent, thereby managing to extract the profit from the supply chain performance for themselves (Barringer & Harrison, 2000; Kogut, 2000; Min, et al., 2005). Fourcade and Midler (2004) and Naulleau and Guth (2000) argued that the first beneficiaries of vertical relation reconfigurations were the architect-integrators, since they transferred the risk to their strategic partners. In section 1, we showed that hub firms indeed assume increased risk (operational, security, demand and macro-economic risks). They must also face a huge increase in the investment required (cf. section 2) to ensure their position in the value chain, and, once in the intermediary position, they then have to assume the costs of storage. Secondly, factors contingent to the aeronautics industry may delay the appearance of this rent. While the length of the investment cycle is just a few years in the automotive industry (7 to 10 years), it may span several dozen years in the
Table 6. Determinants of ROA
ROAROA (t-1) 0.2382**
(4.14)Size 0.0158*
(2.40)Growth in sales -0.0001**
(-4.52)Debt -0.1519**
(-3.52)Region 0.046
(1.59)Hub - 0.0476*
(-2.36)Hub x ROA(t-1) -0.2206†
(-1.73)
Observations 2317AR1 p = 0.000AR2 p = 0.821Test of Hansen p = 0.556Student's T distribution ratio between brackets.† p < 0,1 ; * p < 0,05 ; ** p < 0,01.Annual and sectorial indicators have been included in the model but are not recorded here. The estimates are calculated in two stages from GMM systems, with the Windmeijerccorrection for standard errors. .Number of instruments : 42.
M@n@gement, 17(2): 110-135! Mathieu Bécue � Jean Belin � Damien Talbot
125

aeronautics sector. Both of the Airbus programs involving the emergence of hub firms, particularly the A380 and the A350 XWB programs, were only at the beginning of their commercial life in 2007; the A350 was not yet being developed, while the A380 made its maiden commercial flight that same year. Thus, it is still too early to calculate the positive impact of return on investment for these programs. However, in return for sharing the risk, hub firms win contracts as the official supplier for a large number of planes (above break-even point), while capturing a bigger value ratio as they supply a component with higher value added. As long as the plane’s commercial success takes it beyond break-even point (around 400 planes for the A380, with 100 delivered in 2013), the ROI could be considerable (as with the A320 today). At the time we observed the hub firms’ performance, the break-even thresholds were still far from being attained and will not be for several years to come. The temporal gap is very wide between the initial investment and the first potential returns, at around twenty years for the A320.! Third, the characteristics of hub firms themselves play a role. Their shareholder structure often remains family-based (especially in the case of medium-sized firms) and closed-ended. Hub firms often have specific legal forms, in particular that of ‘Société en Action Simple’, a form of partnership (over 65% of hub firms have this status: cf. Table 7).
! Large SMEs in particular, prefer this status rather than the more restrictive ‘Société Anonyme’, or limited company, especially when the owner-managers are majority shareholders in the firm’s capital. This is one of the main features of our hub firms which, while larger than the other players in our analysis sample, are nonetheless generally medium-sized companies with family-based capital. In effect, almost 70% of these firms are managed by sole owners or families 19. In more than 80% of cases, the majority shareholder holds over 50% of the capital (cf. Table 8). In other words, the latter hold a very high concentration of capital, which enables them to adopt other strategies than simply satisfying the interests of a floating shareholder structure (short-term financial performance). Finally, a hub firm’s strategy develops on the basis of family or historically-based capital that is well acquainted with the challenges in the sector.! Our study also has a number of limitations. The first limitation concerns the period of observation (2000-2007) which ideally should be extended to take into account an investment cycle duration of at least three decades. This gives rise to two difficulties. First, the conditions for the development of relational rent were only really in place around the end of the 1990s, which explains the choice of our observation period. Second, INSEE data for the Aquitaine and Midi-Pyrenees
Relational Rent and Underperformance! M@n@gement, 17(2): 110-135
126
19. To obtain this data, we used the Diane database, which provides the identity of all the shareholders in the firms in our sample.
Table 7. Legal forms of 42 hub firms in 2007!
Legal forms Percentage of firms
EURL (sole trader) !2.2%
Société en nom collectif (general partnership) !2.2%
SA à directoire et conseil de surveillance (Ltd. company with supervisory board)
!4.3%
SARL (Société à Responsabilité Limitée) !10.9%
SA (Société Anonyme) ! 15.2%
SAS (Société par Actions Simplifiée) !65.2%
Total !100.0%
Source : calculated by the authors from the greffe des tribunaux de commerce database (Diane)

regions have only been available for the last twenty years. However, although we can conclude that hub firms are currently underperforming, we need to test the notion of the development of relational rent again in a future study. ! The econometric analysis presented is also problematic. In effect, it highlights a redistributional effect as the hub firms’ profitability is not persistent. One possible explanation, which we only touched upon, would be that the annual profits made by the hub firms are later captured by other firms in the value chain, in particular by the upstream architect-integrators. A comparison of their financial performance over the long term could provide some answers to this question. ! The third limitation concerns the hub firms themselves. It would be useful to differentiate between medium-sized family-based firms and larger equipment manufacturing firms. Would we see a difference in performance between these two sub-categories of hub firms?
CONCLUSION
! This paper demonstrates that in response to changes in the aeronautics sector, hub firms have taken on the role of architect-integrators of major components within the supply chain. We also showed that the conditions required for the development of relational rent between architect-integrators and hub firms exist within the aeronautics industry. According to the Relational-Based approach, this pivotal position should enable such firms to achieve an outperformance. The statistical analysis, performed between 2000 and 2007 with sub-contracting firms in the local aeronautics sector in the Aquitaine and Midi-Pyrenees regions, enabled us to identify the impact of their status on the main organisational features of hub firms, such as the very high level of provisions and stock in view of the high level of risk-taking and their intermediary position in the value chain. The econometric analysis confirmed that hub firms report a financial performance that is both less robust and less persistent than that of the other firms in our sample. To explain these results that contradict the hypothesis of the development of a relational rent in the aeronautics industry, we identified a number of contingent factors: appropriation of the rent by the architect-integrators, the duration of the investment cycle and family-based capital all help to explain the underperformance of hub firms linked to this industry. In addition to
Table 8. Shareholder concentration for 42 hub firms in 2007
Shareholder Percentage of firms
Any company where none of the listed shareholders (excluding collec8vely named shareholders) has a direct or indirect stake of over 25 %
4.3 %
Any company where none of the listed shareholders (excluding collectively named shareholders as above) has a direct or indirect or "total calculated" stake of over 50%, but which has one or several shareholders with a direct or total participation of over 25%
4.3 %
Any company that has a listed shareholder (excluding collec8vely named shareholders) with a direct or indirect stake of over 50%
2,2 %
Any company that has a listed shareholder (excluding collectively named shareholders) with a direct stake of over 50%
82,6 %
Any company that does not fit into categories A, B, C or D, indicating a degree of ‘unknown’ independence
6,6 %
Total 100 %
Source : calculated by the authors from the Greffe des tribunaux de commerce (Diane).
M@n@gement, 17(2): 110-135! Mathieu Bécue � Jean Belin � Damien Talbot
127
these explanations, we also reached a theoretical conclusion: the arguments advanced by Dyer and Singh (1998) concerning the development of relational rent must be combined with conditions of validity if they are to be applied to the aeronautics sector. This again confirms the major impact that sector characteristics can have on the performance of a firm operating within it.
REFERENCESAgrawal, V., & Seshadri, S. (2000). Risk intermediation in
supply chains. IIE Transactions, 32(9), 819-831.Amesse, F., Dragoste, L., Nollet, J., & Ponce, S. (2001).
Issues on partnering: evidences from subcontracting in aeronautics. Technovation, 21(9), 559-569.
Amit, R. H., & Shoemaker, P. H. (1993). Strategic assets and organizational rent. Strategic Management Journal, 14(1), 33-46.
Arellano, M., & Bond, S. (1991). Some tests of specification for panel data: Monte Carlo evidence and an application to employment equations. Review of Economic Studies, 58(2), 277-297.
Asanuma, B. (1989). Manufacturer-Supplier relationships in Japan and the concept of relations-specific skill. Journal of the Japanese and International Economics, 3(1), 1-30.
Barney, J. (1991). Firm resources and sustained competitive advantage. Journal of Management, 17(1), 99-120.
Barringer, B. R., & Harrison, J. S. (2000). Walking a tightrope: creating value through interorganizational relationships. Journal of Management, 26(3), 367–403.
Beamon, B. (1998). Supply chain design and analysis: Models and methods. International Journal of Production Economics, 55(3), 281-294.
Belussi, F., & Arcangeli, F. (1998). A typology of networks: flexible and evolutionary firms, Research Policy, 27(4), 415-428.
Blundell, R., & Bond, S. (1998). Initial conditions and moments restrictions in dynamic panel data models. Journal of Econometrics, 87(1), 115-143.
Brusoni, S., & Prencipe, A. (2001). Unpacking the Black Box of Modularity: Technologies, Products and Organizations. Industrial and Corporate Change, 10(1), 179-204.
Brusoni, S., Prencipe, A., & Pavitt, K. (2001). Knowledge Specialisation, Organizational Coupling, and the Boundaries of the Firm: Why Do Firms Know More Than They Make? Administrative Science Quarterly, 46(4), 597-621.
Cagli, A., Kechidi, M., & Levy, R. (2009). Gestion stratégique de la supply chain et firme pivot dans le secteur aéronautique. Revue Française de Gestion Industrielle, 28(2), 124-139.
Cao, M., & Zhang, Q. (2011). Supply chain collaboration: Impact on collaborative advantage and firm performance. Journal of Operations Management, 29(1/2), 163–180.
Charreaux, G. (2000). Finance d’entreprise. Paris : Management et Société.
Conan, J., & Holder, M. (1979). Variables explicatives de performances et contrôle de gestion dans les PMI. Thèse d’Etat, Paris : Université Paris-Dauphine, CEREG.
Corsten, D., Gruen, T., & Peyinghaus, M. (2011). The effects of supplier-to-buyer identification on operational performance. An empirical investigation of inter-organizational identification in automotive relationships. Journal of Operations Management, 29(6), 549–560.
Dehning, B., Richardson, V., & Zmud, R. (2007). The financial performance effects of IT-based supply chain management systems in manufacturing firms. Journal of Operations Management, 25(4), 806–824.
Dekker, H.C. (2004). Control of inter-organizational relationships: evidence on appropriation concerns and coordination requirements. Accounting, Organizations and Society, 29(1), 27-49.
Dhanasai, C., & Parkhe, A. (2006). Orchestrating Innovation Networks. Academy of Management Review, 31(3), 659-669.
De Propis, L. (2001). Systemic Flexibility, Production Fragmentation and Cluster Governance. European Planning Studies, 9(6), 678-694.
Dimitras, A.I., Zanakis, S.H., & Zopounidis, C. (1996). A survey of business failures with an emphasis on prediction methods and industrial applications. European Journal of Operational Research, 90(3), 487–513.
Dumoulin, R., & François, V. (2002). Développement et performance d’une structure relationnelle: l’exemple de la logistique d’un groupe de distribution. Finance Contrôle Stratégie, 5(2), 33-60.
Dyer, J. H. (1996). Specialized supplier networks as a source of competitive advantage: evidence from auto industry. Strategic Management Journal, 17(4), 271-292.
Dyer, J. H., & Singh, H. (1998). The relational view: cooperative strategy and sources of interorganizational competitive advantage. Academy of Management Review, 23(4), 660–679.
Estrin, S., Poukliakova, S., & Shapiro, D. (2009). The Performance Effects of Business Groups in Russia. Journal of Management Studies, 46(3), 393–420.
Fabbe-Costes, N. (2005). La gestion dynamique des supply chains des entreprises virtuelles. Revue Française de Gestion, 31(156), 151-166.
Fourcade, F., & Midler, C. (2004). Modularisation in the auto industry: can manufacturer’s architectural strategies meet supplier’s sustainable profit trajectories? International Journal Automotive Technology and Management, 4(2/3), 240-260.
Frenken, K. (2000). A complexity approach to innovation networks. The case of the aircraft industry (1909-1997). Research Policy, 29(2), 257-272.
Fréry, F. (1998). Les réseaux d’entreprises : une approche transactionnell e. In H. Laroche & J. P. Nioche (Eds.), Repenser la stratégie. Fondements et perspectives. Paris : Vuibert, XXX-XXX.
Relational Rent and Underperformance! M@n@gement, 17(2): 110-135
128

Fulconis, F., & Paché, G. (2005). Piloter des entreprises virtuelles : un rôle nouveau pour les prestataires de services logistiques. Revue Française de Gestion, 3(156), 167-186.
Gedajlovic, E., & Shapiro, D. (2002). Ownership and Firm Profitability in Japan. Academy of Management Journal, 45(3), 575-585.
Giannoccaro, I., & Pontrandolfo, P. (2004). Supply chain coordination by revenue sharing contracts. International Journal of Production Economics, 89(2), 131-139.
Gilly, J. P., Talbot, D., & Zuliani, J. M. (2011). Hub firms and the dynamics of regional innovation: case studies of Thales and Liebherr in Toulouse. European Planning Studies, 19(12), 2009-2024.
Grant, R. M. (1996). Toward a knowledge-based theory of the firm. Strategic Management Journal, 17(7), 109-122.
Guilhon, B., & Gianfaldoni, P. (1990). Chaînes de compétences et réseaux. Revue d’Economie Industrielle, 51(1), 97-112.
Gulati, R., Nohria, N., & Zaheer, A. (2000). Strategic networks. Strategic Management Journal, 21(3), 203-215.
Gunasekarana, A., Patelb, C., & McGaughey, R. E. (2004). A framework for supply chain performance measurement. International Journal of Production Economics, 87(3), 333-347.
Hacki, R., & Lighton, J. (2001). The future of the networked company. McKinsey Quarterly, 3, 26-39.
Henderson, R., & Clark, K. (1990). Architectural innovation: the reconfiguration of existing product technologies and the failure of established firms. Administrative Science Quarterly, 35(1), 9-30.
Hoarau, C. (2008). Maîtriser le diagnostic financier, 3e édition. Paris : Groupe Revue Fiduciaire.
Igalens, J., & Vicens, C. (2006). Les mutations dans le secteur aéronautique. Le cas d'Airbus en Midi-Pyrénées. MIRE, Lirhe, Toulouse.
Iwata, H., & Okada, K. (2011). How does environmental performance affect financial performance? Evidence from Japanese manufacturing firms. Ecological Economics, 70(4), 1691-1700.
Jalabert, G., & Zuliani, J.M. (2009). Toulouse, l’avion et la ville. Toulouse : Privat.
Jarillo, J.C. (1988). On strategic networks. Strategic Management Journal, 9(1), 31-41.
Jayaram, J., Vickery, S., & Droge, C. (2008). Relationship building, lean strategy and firm performance: an exploratory study in the automotive supplier industry. International Journal of Production Research, 46(20), 5633-5649.
Kechidi, M. (2006). La dynamique des relations inter-entreprises dans l’industrie aéronautique : une analyse de la sous-traitance d’Airbus France. Revue Française de Gestion Industrielle, 25(2), 133-150.
Kechdi, M., & Talbot, D. (2010). Institutions and coordination: what is the contribution of a proximity-based analysis? The case of Airbus and its relations with the subcontracting network. International Journal of Technology Management, 50(3/4), 285-299.
Kogut, B. (2000). The network as knowledge: Generative rules and the emergence of structure. Strategic Management Journal, 21(3), 405-425.
Kotabe, M., Martin, X., & Domoto, H. (2003). Gaining from vertical partnerships: knowledge transfer, relationship duration, and supplier performance improvement in the U.S. and Japanese automotive industries. Strategic Management Journal, 24(4), 293-316.
Krause, D.R., Scannel, T.V., & Calantone, R.J. (2000). A structural analysis of the effectiveness of buying firms’ strategies to improve supplier performance. Decision Sciences, 31(1), 33–55.
Lavie, D. (2006). The competitive advantage of interconnected firms: an extension of the resource-based view. Academy of Management Review, 31(3), 638–658.
Lincoln, R., & Gerlach, M. (2004). Japan’s Network Economy: Structure, Persistence, and Change. New York : Cambridge University Press.
Lorenzi, G., & Baden-Fuller, C. (1995). Creating a strategic center to manage web of partners. Californian Management Review, 37(3), 147-163.
Mandru, L., Khashman, A., Carstea, C., David, N., & Patrascu L. (2010). The diagnostic of bankruptcy risk using score function, Recent Advances in Artificial Intelligence. Proceedings of the 9th WSEAS International conference Artificial Intelligence, Knowledge Engineering & Data Bases, 83-87.
Manuj, I., & Mentzer, J.T. (2008). Global supply chain risk management. Journal of Business Logistics, 29(1), 133-155.
Mazaud, F. (2006). De la firme sous-traitante de premier rang à la firme-pivot. Une mutation de l’organisation du système productif. Revue d’Economie Industrielle, 113(1), 45-60.
Mentzer, J.T., Foggin, J.H., & Golicic, S.L., (2000). Collaboration: the enablers, impediments, and benefits. Supply Chain Management Review, 5(6), 52–58.
Miles, R., & Snow, C., (1992). Causes of failure in network organizations. Californian Management Review, 34(4), 53-72.
Min, S., Roath, A., Daugherty, P.J., Genchev, S.E., Chen, H., & Arndt, A.D., (2005). Supply chain collaboration: what’s happening? International Journal of Logistics Management, 16(2), 237–256.
Mouchnino, N., & Sautel, O. (2007). Coordination productive et enjeux concurrentiels au sein d’une industrie modulaire : l’exemple d’Airbus. Innovations, 1(25), 135-153.
Naulleau, G., & Guth, J.P. (2000). Du partenariat à l’entreprise étendue. Vers une reconfiguration de la relation client/fournisseurs dans le secteur automobile. Gérer et Comprendre, 61(3), 31-41.
Nishiguchi, T. (1994). Strategic Industrial Sourcing: The Japanese Advantage. New York : Oxford University Press.
O’Sullivan, A. (2005). Network-Based Organizing for Product Innovation: How Power Imbalances Matter. M@n@gement, 8(4), 123-143.
O’Sullivan, A. (2006). Why tense, unstable, and diverse relations are inherent in co-designing with suppliers: an aerospace case study. Industrial and Corporate Change, 15(2), 221-250.
Ouchi, W.G. (1979). A conceptual framework for the design of organizational control mechanisms. Management Science, 25(9), 833-848.
M@n@gement, 17(2): 110-135! Mathieu Bécue � Jean Belin � Damien Talbot
129

Polanyi, K. (1983). The tacit dimension. Chicago : University of Chicago Press.
Porter, M. (1980). Competitve Strategy: Creating and Sustaining Superior performance. New York : Free Press.
Prahalad, C.K., & Hamel, G. (1990). The core competence of the corporation. Harvard Business Review, 68(3), 79–91.
Prahalad, C.K., & Hamel, G. (1994). Strategy as Field of Study: Why Search for a New Paradigm? Strategic Management Journal, 15(3), 5-16.
Refait-Alexandre, C. (2004). La prévision de faillite fondée sur l’analyse financière de l’entreprise : un état des lieux. Economie & prévision, 1(162), 129-147.
Rugman, A.M., & D’Cruz, J.R. (2000). Multinationals as flagship firms: Regional Business Networks. New York : Oxford University Press.
Scannell, T., Vickery, S., & Droge, C. (2000). Upstream supply chain management and competitive performance in the automotive supply industry. Journal of Business Logistics, 21(1), 23-48.
Shan, W., & Hamilton, W. (1991). Country-specific advantage and international cooperation. Strategic Management Journal, 12(6), 419-432.
Sheu, C., Yen, H.R., & Chae, D. (2006). Determinants of supplier-retailer collaboration: evidence from an international study. International Journal of Operations and Production Management, 26(1), 24–49.
Shin, H., Collier, D.A., & Wilson, D.D. (2000). Supply management orientation and supplier–buyer performance. Journal of Operations Management, 18(3), 317–333.
Stolowy, H., Lebas, M.J., & Langlois, G. (2006). Comptabilité et Analyse Financière : une perspective Globale. London : De Boeck.
Takeishi, A. (2001). Bridging inter- and intra-firm boundaries: management of supplier involvement in automobile product development. Strategic Management Journal, 22(5), 403-433.
Talbot, D. (2013). Clustérisation et délocalisation : les proximités construites par de Thales Avionics. Revue française de gestion, 39(234), 15-26.
Tan, K.C., Kannan, V.R., Handfield, R.B., & Ghosh, S., (1999). Supply chain management: an empirical study of its impact on performance. International Journal of Operations and Production Management, 19(10), 1034–1052.
Tang, C. (2006). Perspectives in supply. International Journal of Production Economics, 106(2), 451-488.
Tapiero, C. (2005). Value at risk and inventory control. European Journal of Operational Research, 163(3), 769–775.
Tapiero, C. (2008). Analyse des risques et prise de décisions dans la chaîne d’approvisionnement. Revue Française de Gestion, 6(186), 163-182.
Terwiesch, C., Loch, C., & De Meyer, A. (2002). Exchanging preliminary information in concurrent engineering: alternative coordination strategies. Organization Science, 13(4), 402-419.
Torre, A. (2008). On the Role Played by Temporary Geographical Proximity in Knowledge Transmission. Regional Studies, 42(6), 869-889.
Wagner, S., Grosse-Ruyken, P.T., & Erhun, F. (2012). The link between supply chain fit and financial performance of the firm. Journal of Operations Management, 30(6), 340–353.
Wernerfelt, B. (1984). A resource based view of the firm. Strategic Management Journal, 5(2), 171-180.
Xu, L., & Beamon, B.M. (2006). Supply Chain Coordination and Cooperation Mechanisms: An Attribute-Based Approach. Journal of Supply Chain Management, 42(1), 4-12.
Williamson, O.E. (1994). Les institutions de l'économie. Paris : Inter Editions.
Zuliani, J.M. (2008). The Toulouse Cluster of On-board Systems: A Process of Collective Innovation and Learning. European Planning Studies, 16(5), 711-726.
APPENDIX 1. PROFITABILITY AND RISK ANALYSIS: METHOD
! The way the financial characteristics of hub firms impacts on their profitability and risk of bankruptcy was studied for the year 2007. The evolution of these impacts is set out for the years 2000 to 2007. More specifically, profitability and risk was analysed by a transverse observation of the evolution of ratios/variables between the years 2000 and 2007. The econometric analysis included a longitudinal analysis. ! Some traditional indicators from interim operating accounts, like gross operating surplus (profitability), current result (performance) and net result help us to address the issue of profitability, understood as the firm’s efficiency with respect to its business operations. We also included a set of ratios designed to reflect the efficiency/profitability of the use of resources. To this end, we compared elements from the profit and loss account with asset and liability items on the balance sheet (cf. Table 7, Appendix A.2). In this way, we go beyond the economic performance measures generally taken into consideration of ROE (Return On Equity) and ROA (Return On Assets) (Dehning, Richardson & Zmud,
Relational Rent and Underperformance! M@n@gement, 17(2): 110-135
130
20. This involves a static analysis method of risk of bankruptcy. Two other static analysis methods of financial structure are also well-known: the functional concept and the ‘pool of funds’ concept (Hoarau, 2008). Given the data at our disposal, it was difficult for us to use these other methods, even though they present certain advantages compared to the wealth management concept.
.22.The Conan Holder credit score ranks businesses from the most risky (below 6.8) to the most robust (above 16.4). Conan and Holder (1979) applied the following calculation: Z = 24R1 + 22R2 + 16R3 - 87R4 -15R5, with R1 = (gross outcome of exploitation/debts), R2 = (permanent capital/total assets), R3 = (inventory+current liabilities+current assets)/(total liabilities); R4 = (financial expenses/turnover) and R5 = (payroll/sales volume).
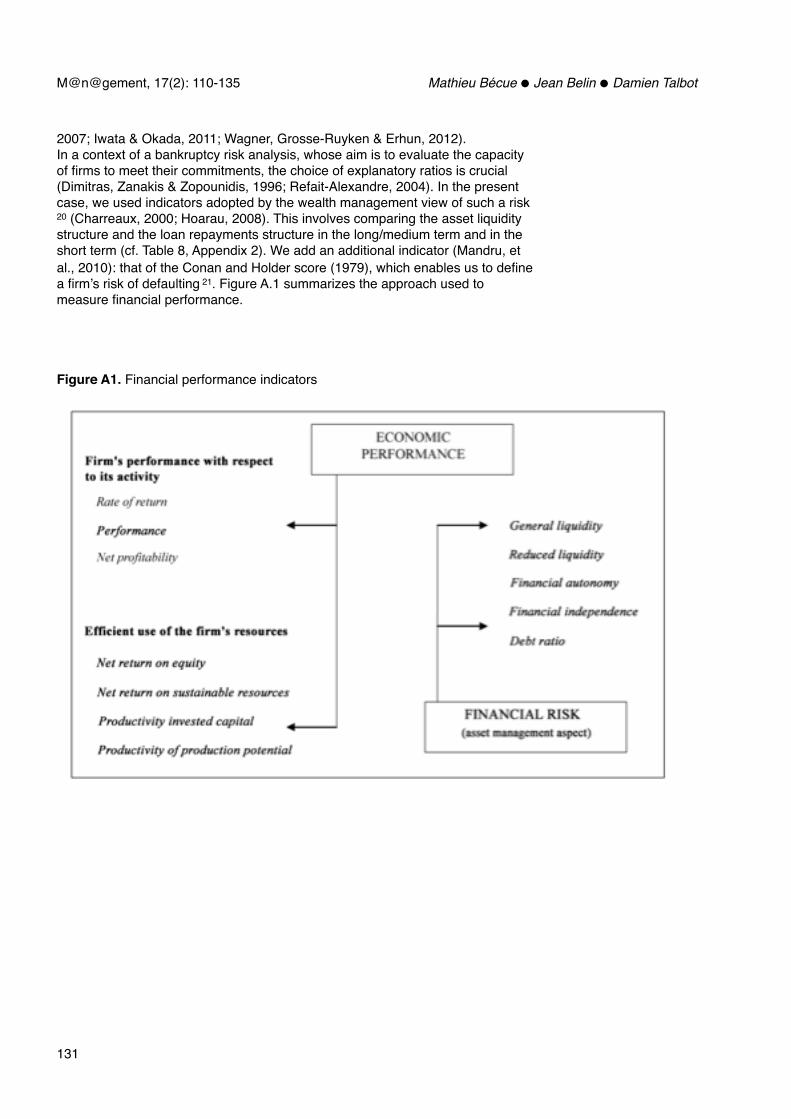
2007; Iwata & Okada, 2011; Wagner, Grosse-Ruyken & Erhun, 2012).In a context of a bankruptcy risk analysis, whose aim is to evaluate the capacity of firms to meet their commitments, the choice of explanatory ratios is crucial (Dimitras, Zanakis & Zopounidis, 1996; Refait-Alexandre, 2004). In the present case, we used indicators adopted by the wealth management view of such a risk
20 (Charreaux, 2000; Hoarau, 2008). This involves comparing the asset liquidity structure and the loan repayments structure in the long/medium term and in the short term (cf. Table 8, Appendix 2). We add an additional indicator (Mandru, et al., 2010): that of the Conan and Holder score (1979), which enables us to define a firm’s risk of defaulting 21. Figure A.1 summarizes the approach used to measure financial performance.
Figure A1. Financial performance indicators
M@n@gement, 17(2): 110-135! Mathieu Bécue � Jean Belin � Damien Talbot
131

APPENDIX B.RISK AND PROFITABILITY ANALYSIS: INDICATORS
Tableau B1. Indicators to operating profitability analysis
Ratio Calculation methods/InterpretationAnalysisof a firm's performance with respectto its activity
Economic rate of return (%)
Equal to the ratio between (EBE / (net turnover + sub exploitation))*100. This ratio determines the manufacturing cost margin. It refers to the firm's performance with respect to its industrial and sales activity, independent of its financial/fiscal policy and its choice in terms of amortization.
Analysisof a firm's performance with respectto its activity Performance (%) (Earnings before tax/ (net turnover + sub exploitation))*100. Measures the firm's capacity to
generate recurrent earnings from its sales, taking the choice of financing adopted into account.
Analysisof a firm's performance with respectto its activity
Net profitability (Profit/loss) / ((net turnover + sub exploitation))*100
Analysis of implementation resource effectiveness
Net returnon equity (%)
(Profit/net equity)*100. Measures the firm's efficient use of the resources provided by the shareholders.
Analysis of implementation resource effectiveness Net return
on sustainable resources (%)
((Earnings before tax + interest and assimilated costs) / (net sustainable resources)) * 100. This ratio provides an assessment of the return on sustainable resources invested in the firm.
Analysis of implementation resource effectiveness
Productivityinvested capital
(Sales volume/(total assets + and collateral on borrowings))
Analysis of implementation resource effectiveness
Productivity of productionpotential
(Sales volume /gross tangible and intangible assets). This ratio provides an appreciation of the success of investments, in other words, their capacity to generate profit.
Source : based on Stolowy, Lebas and Langlois (2006).
Relational Rent and Underperformance! M@n@gement, 17(2): 110-135
132

Tableau B2. Key indicators for bankruptcy risk analysis
Ratio InterpretationGeneral liquidity Equal to the ratio of liquid assets (available in under a year) that can be used for short-term liabilities. This
measures whether the assets available in less than a year are sufficient to cover the liabilities due within the year.
Reduced liquidity Equal to the ratio of liquid assets (less than a year) excluding stock that can be used for short-term liabilities, this measures the firm's liquidity, excluding stock. It thus refers to a firm's capacity to pay its short-term debts from its current assets.
Financial autonomy Refers to the ratio between the firm's equity and balance sheet total. Measures the firm's self-financing capacity compared to all other forms of financing. A ratio of around 20 to 25% is considered satisfactory (OSEO).
Financial independence Refers to equity capital in sustainable resources, it measures the firm's capacity for self-financing (social capital, reserves). Financial organisations generally consider that the ratio should be above 50% to be acceptable.
Debt ratio (financial autonomy for Charreaux, 2000)
Refers to the ratio between financial liabilities (long and medium-term)/own capital. Provides a measure of the long and medium-term debt burden on the firm's equity. This debt burden must be lower than the firm's equity. The (long-term) debt burden is considered by Hoarau (2008) as an indicator of financial independence. It provides an assessment of a firm's capacity to resist economic downturns and the degree of dependence on lenders.
Total debt (D) (Debts + unearned revenue)/net turnover) * 360. Provides an assessment of the number of days of turnover required to cover the firm's debt obligations. It is particularly useful from a dynamic and comparative point of view.
Solvency ratio Used to measure a firm's capacity to meet its short and long-term liabilities. This ratio indicates the likelihood of a firm to default on its debt obligations.
Working capital turnover cover (D)
Equal to the ratio of overall net working capital to net turnover* 360. Working capital represents a financial margin that provides cover against asset and debt risk asymmetry. In effect, while it is certain that debts must be repaid in the short term, asset liquidity is not at all certain. In this context, creditors prefer it to be positive as it guarantees the short-term repayment of loans banks may grant in the event of loss of current assets.
Requirements in working capital turnover cover (D)
Equal to the ratio between working capital requirements and net turnover * 360. Working capital requirements represents the need for finance linked to the operating cycle. It is obtained by adding together the inventory accounts (raw materials, merchandise, products and work in progress, finished products) and receivables (client receivables, advances paid to suppliers and other creditors) less the operating liabilities (accounts payable, social and tax liabilities, advances received from clients and other accounts receivable).
Financial Interest rate Equal to the ratio between the financial interests* 100 and turnover. Provides a measure of the percentage of financial charges in the firm's total level of activity. Growth In this rate may correspond to an increase in debt often induced by recurrent cash flow problems.
Self-financing capacity (SFC)
Equal to the ratio between SFC before distribution and net turnover + operating subsidy In percentage.
Capacity to repay Equal to the ratio of financial debts/ SFC before distribution. The debt repayment annuity/self-financing capacity ratio measures the burden of annual debt due dates on the firm's internal resources. A ratio above 50% generally indicates an excess of debt compared to the firm's self-financing capacity, insofar as the latter must divert too much of its SFC to repaying its loans.
Source : based on Stolowy, Lebas and Langlois (2006).
! The terminology for the ratios presented is from the Diane database. Some of the methods used for computing the ratios presented in our paper may differ. For instance, according to Charreaux (2000), the financial autonomy ratio is understood as the ratio between financial debts payable at over one year and the firm’s equity. This definition corresponds to our debt ratio data.
Mathieu Bécue is a design engineer at the GREThA, where he manages the Via Inno Technological Intelligence Platform, and is joint scientific coordinator of the ‘Competitive Intelligence’ Open Lab managed by the GREThA and the PSA Group. His research focuses mainly on the development and valorisation of methods designed to improve understanding of innovation trajectories in high-tech sectors..
M@n@gement, 17(2): 110-135! Mathieu Bécue � Jean Belin � Damien Talbot
133

Jean Belin is an associate Professor of Economics at Bordeaux University (GREThA, UMR CNRS 5113) and holds the Economics Defence Chair, created by the Cercle des Partenaires endowment fund at the IHEDN. His work focuses on corporate funding, the economics of innovation and the economics of defence. He has conducted a number of empirical studies to explore the impact of financial constraints on corporate behaviour, among other things.
Damien Talbot is a Professor of Management Science at the University of Auvergne, a member of the CRCGM and an affiliated member of GREThA (UMR CNRS 5113). His research focuses on the organisational dynamics that span the supply chain, notably aeronautic supply chain proximity strategies. Among other articles, he recently published two papers on the cases of Thales Avionics and of “Aerospace Valley” Competitiveness Cluster.».
Relational Rent and Underperformance! M@n@gement, 17(2): 110-135
134

M@n@gement, 17(2): 110-135! Mathieu Bécue � Jean Belin � Damien Talbot
135