REINVENTING GOVERNMENT - Congressman Mike Quigley · Reinventing Government: The Federal Budget...
117
REINVENTING GOVERNMENT The Federal Budget PART II 60 Recommendations to Reduce the Deficit by $2 Trillion over 10 Years CONGRESSMAN MIKE QUIGLEY May 2011
Transcript of REINVENTING GOVERNMENT - Congressman Mike Quigley · Reinventing Government: The Federal Budget...
REINVENTING GOVERNMENT The Federal Budget
PART II
60 Recommendations to Reduce the Deficit
by $2 Trillion over 10 Years
CONGRESSMAN MIKE QUIGLEY
May 2011
Executive Summary overnment’s mission matters. Our Constitution is unambiguous on this
point—in 1787, we endowed our government with the power to “establish
Justice, insure domestic Tranquility, provide for the common defence, promote the
general Welfare, and secure the Blessings of Liberty.”
Unfortunately, this vision is increasingly threatened by our government’s
unsustainable fiscal path. The Congressional Budget Office projects that by 2030,
the federal government will be spending 30 percent of GDP but collecting only 20
percent in tax revenue. By 2050, the government will be collecting that same 20
percent, but spending 45 percent.
Deficit spending will also generate its own costs. Eventually, the accumulated
costs of past deficits will be the drivers of new ones. The CBO projects that just
10 years from now, in 2021, the interest we will pay on previous borrowing will
cost taxpayers $792 billion—accounting for all of 2021’s projected $763 billion
deficit and then some. These numbers speak for themselves.
The practical effect of these persistent deficits is that interest payments will
eventually crowd out the essential work of government. When we fail to help the
thousands of homeowners who have been wrongfully foreclosed on, there is no
Justice. When we spend almost twice as much servicing our debt as we do
educating our children, there is no general Welfare. When we have burdened
future generations with a bill they did not choose and cannot pay, there is no
Liberty.
Restoring our budget to a sustainable path will not be easy. We will have to make
tough choices, sacrificing programs we care about to preserve programs that are
essential. But there can be no sacred cows in this process—all options must be on
the table and, while there can and must be genuine disagreement, all parties must
negotiate in good faith.
In this report, we have tried to make some of these tough choices. On health care,
rather than simply shifting costs to the private sector or ending entitlement
programs altogether, we propose fundamentally reforming the way we deliver and
pay for health care, emphasizing value over volume.
G

On defense, we suggest cutting outdated programs and consolidating duplicative
ones, to keep our military as the strongest, most flexible fighting force in the
world. We recommend cutting hundreds of billions of dollars in tax expenditures
that hurt the environment and subsidize unproductive behavior, and also propose
moving to an agricultural policy that uses market-based risk management tools.
On Social Security, we keep the basic benefit structure in place while putting the
program on sounder financial footing. We also recommend that deficit reduction
include reasonable cuts to non-defense discretionary spending. All told, our
recommendations would save at least two trillion dollars over the next 10 years.
These are not arbitrary recommendations—our goal is not to cut spending simply
for the sake of cutting it. On the contrary, we believe that deficit reduction must
serve the greater purpose of government as envisioned by our founders. Fiscal
sustainability is a means to an end, not an end in itself, and we have to be mindful
of government’s mission when we set about reforming it.
This is why the title of the report is “Reinventing Government”. As we consider
reforms to make our federal budget more fiscally sustainable, the seriousness of
our problem demands that we do more than just nibble around the edges. Yet
neither should we go overboard, eviscerating social safety nets and offloading all
of the costs onto low-income individuals without the ability to pay.
Instead, we need to think about how we would design government if we were
designing it from scratch. How can the federal government most effectively
discharge its constitutional duties? How can it do so sustainably? These are the
questions we are trying to answer.
We believe that the 60 recommendations detailed in this report can help answer
these questions. We have tried to be attentive to our long-term fiscal challenges,
but not dismissive of government’s indispensable role in society. A more
sustainable budget will enable us to responsibly invest in public goods like
infrastructure, education, and health care.
Of course, this report is only one set of recommendations and will not solve our
deficit and long-term debt problems on its own. We will have to continue making
tough choices so that our children and children’s children are able to enjoy the
same freedoms and liberties that we have enjoyed.

Reinventing Government:
The Federal Budget (Part II)
60 Recommendations to Reduce the Deficit
May 2011
Mike Quigley Member of Congress, Fifth District of Illinois
Washington Office
1124 Longworth House Office Building
Washington, DC 20515
Ph: (202) 225-4061
Fax: (202) 225-5603
Chicago Office
3742 West Irving Park Road
Chicago, IL 60618
Ph: (773) 267-5926
Fax: (773) 267-6583
Congressional Website
http://quigley.house.gov
Staff Sean O’Brien, Chief of Staff
Lindsey Matese, Legislative Director
Aviva Gibbs, District Director
Report Authors Mike Quigley, Member of Congress
Jesse Feinberg, Legislative Assistant
Robyn Russell, Legislative Assistant
Lindsey Matese, Legislative Director
Bob Becker, Research Director
Acknowledgements The Center for American Progress
Citizens for Tax Justice
The Committee for a Responsible Federal Budget
The Congressional Research Service
The Congressional Budget Office
The Government Accountability Office
The National Commission on Fiscal
Responsibility and Reform
The Social Security Administration
The Architect of the Capitol (cover photo)
Brendan Woodbury, Pat Van Grinsven, Ben
Strauss, Khama Sharp, Tim Nazanin, and
many others
Table of Contents
Introduction .................................................................................................................................................. 1
Our Previous Report .................................................................................................................................. 1
The Goal of this Report .............................................................................................................................. 1
How this Report is Organized .................................................................................................................... 2
Our Methodology ...................................................................................................................................... 3
What is Fiscal Sustainability? ..................................................................................................................... 4
Why is Deficit Reduction Important? ........................................................................................................ 6
The First 10 Savings .................................................................................................................................. 7
Reinventing Health Care ............................................................................................................................. 8
1►Follow through on cost-containment reforms in the ACA. .......................................................... 12
2►Strengthen the Independent Payment Advisory Board. .............................................................. 14
3►Adopt delivery system reforms: pay for quality. ......................................................................... 15
4►Fully fund the CMS Innovation Center. ........................................................................................ 18
5►Expand investment in comparative effectiveness research and use findings to set rates. ......... 19
6►Help CMS to combat Medicare waste, fraud, and abuse. ........................................................... 21
7►Recoup Incorrect Payments to Medicare Advantage Insurers .................................................... 23
8►Shorten exclusivity period for brand name biologic drugs. ......................................................... 24
9► Prohibit pay-for-delay agreements. ........................................................................................... 25
10►Allow Medicare to require minimum rebates from drug companies. ....................................... 26
11►Eliminate double payments to states for Medicaid administrative costs. ................................ 27
12►Allow enrollment of dual eligibles in Medicaid managed care. ................................................ 28
Consider Other Options ........................................................................................................................... 29
Conclusion ............................................................................................................................................... 32
Reinventing Defense Spending ................................................................................................................. 34
1►Reduce U.S. nuclear arsenal and infrastructure. ......................................................................... 39
2►Alter force structure: reduce U.S. troops in Europe and Asia. ..................................................... 41
3►Alter force structure: reduce U.S. troops in Afghanistan and Iraq. ............................................. 42
4►Alter force structure: reduce U.S. Navy fleet. .............................................................................. 43
5►Reduce military overhead. ........................................................................................................... 44

6►Double Secretary Gates’s cuts to defense contractors. ............................................................... 46
7►Eliminate 10 percent of commercial activities positions. ............................................................ 47
8►Reduce F-35 planned buys. .......................................................................................................... 48
9►Cut the Expeditionary Fighting Vehicle. ...................................................................................... 49
10►Delay procurement of the KC-X Aerial Refueling Tanker for five years. .................................... 50
11►End procurement of the M V-22 Osprey. ................................................................................... 50
12►Curb research and development costs. ..................................................................................... 51
Consider Other Options ........................................................................................................................... 52
Conclusion ............................................................................................................................................... 53
Reinventing Tax Expenditures .................................................................................................................. 55
1►Cut oil and gas subsidies. ............................................................................................................ 60
2►Cut coal subsidies. ....................................................................................................................... 62
3►Cut timber subsidies. ................................................................................................................... 62
4►Cut subsidies for employee parking expenses. ............................................................................ 63
5►Cut ethanol subsidies................................................................................................................... 64
6►Reform the international tax system. .......................................................................................... 65
7►Cut subsidies for private-activity bonds. ..................................................................................... 66
8►Cut subsidies for Blue Cross/Blue Shield. ..................................................................................... 67
9►Cut subsidies for employment-based life insurance. ................................................................... 68
10►Cut subsidies for agribusinesses. ............................................................................................... 69
11►Cut subsidies for income earned abroad. .................................................................................. 69
12►Cut the mortgage interest deduction for vacation homes. ....................................................... 70
13►Limit deductions for high-income taxpayers. ............................................................................ 70
14►Reduce individual and corporate tax rates. .............................................................................. 71
Consider Other Options ........................................................................................................................... 72
Conclusion ............................................................................................................................................... 74
Reinventing Social Security ....................................................................................................................... 75
1►Extend the Social Security payroll tax to capture 90 percent of covered wages. ........................ 80
2►Include non-covered state and local government workers. ........................................................ 80
3►Improve the collection of existing payroll taxes. ........................................................................ 81
4►Adopt a chained consumer price index. ...................................................................................... 81
5►Gradually increase full retirement age to 68 for those born after 1976. .................................... 82

6►Modify the benefits formula to add a third bend point. ............................................................. 82
7►Restructure the minimum payment for low-income individuals. ................................................ 83
Conclusion ............................................................................................................................................... 84
Reinventing Farm Subsidies ...................................................................................................................... 85
1►Reduce and eventually eliminate direct payments to farmers. ................................................... 89
2►Reduce and eventually eliminate counter-cyclical payments to farmers. ................................... 90
3►Set a cap on payments to ranchers and farmers......................................................................... 90
4►Lower the cap on adjusted gross income (AGI). .......................................................................... 91
5►Scale back ineffective programs like ACRE and SURE. ................................................................ 92
Conclusion ............................................................................................................................................... 93
Reinventing Non-Defense Discretionary .................................................................................................. 94
1►Implement a cap on the debt to GDP ratio. ................................................................................ 98
Conclusion ............................................................................................................................................... 98
Part Two Conclusion and Next Steps ...................................................................................................... 99
Works Cited ............................................................................................................................................. 100
Introduction 1
Introduction
This report reviews our recommendations for reducing the deficit and returning our budget to a
sustainable fiscal path. In this introduction, we review our previous report, Part One, discuss
the goals of this report, and explain why deficit reduction is important.
Our Previous Report
In November 2010, we released Part One of our report series on reinventing the federal
budget. That report reviewed our fiscal situation and offered 15 recommendations to reform
our budget by making it more transparent and accountable to taxpayers. Part One can be
found on our website at the following address:
http://quigley.house.gov/reinventing
Aside from its 15 recommendations, Part One made two broader arguments. First, even if we
disagree on how to put our budget back on a sustainable path, we all need to acknowledge that
a problem exists. Consider the Congressional Budget Office projection that by 2030, the federal
government will be spending 30 percent of GDP but collecting only 20 percent in tax revenue.
By 2050, the government will be collecting that same 20 percent, but spending 45 percent. Our
deficits will only get worse from there.
Second, getting back on track is not just about pointing ourselves in the right direction, but is
fundamentally about fixing the underlying problems that led us in the wrong direction in the
first place. Budget reform should address the broken institutions that facilitated poor decision-
making. It is difficult to find budgetary savings when our budget itself is so opaque. Effectively,
we are flying blind. That has got to change.
The Goal of this Report
This report, “Part Two”, takes the next step. It discusses specific reforms to our federal budget
that would directly result deficit reduction. This report, however, is not strictly comparable
with the other deficit reduction reports that have come out in the last year.1 While our
ultimate goal is to put the budget on a sustainable path, we believe that the best way to go
about this is through the lens of reinventing government. This does not mean that we have
limited the scope of our recommendations to only efficiency reforms that would generate small
1 These include reports from the National Commission on Fiscal Responsibility and Reform, the Committee for a
Responsible Federal Budget & the Brookings Institute (Galston-MacGuineas), the Bipartisan Policy Center (Rivlin-
Domenici), Esquire Magazine, Rep. Jan Schakowsky, Rep. Paul Ryan, EPI/Demos/Century Foundation, and others. 2 Of course, our debt to GDP ratio needs to come down. In the short-term, then, that means we will probably need to

Introduction 2
savings at the margin of bigger picture items. On the contrary, our vision for reducing the
deficit is about reinventing the fundamental structure of government. Government’s mission
matters, and we believe that we can achieve that mission at a lower cost and with better
overall results.
Consider the Department of Defense (DOD). When assessing the DOD budget, we find that
many of our biggest defense costs are due to institutional inertia rather than necessity. Over
the years, defense programs have appropriately been designed to combat the enemies of the
time. Today, however, many of those enemies of years past no longer exist. During the Cold
War, for example, when our adversary was the Soviet Union, it made sense to have thousands
of nuclear weapons in our military arsenal. But today, when our primary enemy is a diffuse
network of terrorists against whom nuclear deterrence is ineffective, expansion of our nuclear
weapons program no longer makes sense. The point is that if we can realign our defense policy
to match today’s threats, potentially spending fewer dollars but spending them more wisely,
we can make our country safer and our fiscal path more sustainable.
This report looks at six different areas of our budget—defense, health care, Social Security, tax
expenditures, farm subsidies, and discretionary spending—and makes specific
recommendations that would improve government’s performance in those areas while at the
same time reducing the federal budget deficit. Beyond these recommendations, we also
present a “menu of options”—essentially, a list of other potential reforms that could save us
billions of dollars. The distinction between “recommendations” and “options” is not just
superficial, but is primarily meant to highlight those reforms that we are specifically
recommending. Taken together, these 60 recommendations could save us hundreds of billions
of dollars per year and go a long way toward putting our budget back on a sustainable path.
How this Report is Organized
This report is organized into six sections, one each for the different parts of the budget that we
are seeking to reform. Within these six sections, there is a list of reform recommendations, a
cost savings estimate for each recommendation, and list of other reform options. Each of these
items is discussed at greater length in the body of that section.
We also include an aggregate savings total for the each section. This “grand total” is expressed
as a range rather than a specific number—this is to underscore the large margin for error in
preparing this type of report. It also should not be interpreted as an “ideal” savings amount for
each type of spending. In several cases, we believe that much more money could be saved.
And in some cases, we believe that our recommendations would generate considerably more
savings than they are given credit for.

Introduction 3
However, we have always erred on the side of caution and only counted those savings which
could be cited from respected sources.
Health Care: $300-500 billion over 10 years
Defense: $600-700 billion over 10 years
Tax Expenditures: $700-800 over 10 years
Social Security: 100 percent solvent
Farm Subsidies: $50-60 billion over 10 years
Non-Defense Discretionary: Depends on savings achieved in other budget areas
Our Methodology
This report contains specific policy recommendations and options that, combined, add up to
over two trillion dollars in savings over the next 10 years. Before moving on to the
recommendations, we would like to make a few brief points about our methodology.
1. Writing this report, we have tried to maintain strict standards for what qualifies as a
reliable savings estimate. Whenever possible, we have used savings estimates from
official government organizations like the Congressional Budget Office, the Office of
Management and Budget, the Congressional Research Service, the Joint Committee on
Taxation, and the Social Security Administration. In some cases, we have also cited
highly respected independent organizations like the Committee for a Responsible
Federal Budget, the Center for American Progress, the Sustainable Defense Task Force,
the National Commission on Fiscal Responsibility and Reform, and others. We have also
used academic sources and, in some cases, news reports. However, some of our
recommendations and associated cost savings figures depend on less authoritative
sources. While we cannot entirely guarantee the accuracy of every savings estimate
cited in this report, we have made every effort to properly cite these sources so that our
readers may judge them for themselves. We have also left out some recommendations
that we had hoped to include. Most often, this was because no reliable cost savings
estimate could be found.
2. This report is the work of Congressman Quigley and his legislative staff, not professional
economists. However, in order to effectively present cost savings estimates that were
produced by a wide and diverse range of organizations, we have tried to normalize cost
savings across a 10 year budget window (the standard for long-term budgeting in the
federal government). What this means is that several five year savings estimates had to
be converted to the 10 year window. In some cases this was not possible (for example,
when the projected savings were from one-off cuts that would not have a multi-year
budgetary effect). In those cases, we indicate the shorter time frame next to the savings
estimate. On the other hand, some five year savings estimates could be properly

Introduction 4
stretched over the full 10 years. When doing so, we have always erred on the side of
caution, even when cost inflation suggests that the potential savings over the second
five years would be greater than the savings projected over the first five years.
3. We have also used 10 year cost estimates across several different 10 year windows,
most originating in the last five years. These 10 year windows are not strictly
comparable and so we have indicated wherever appropriate any 10 year estimate that is
not across 2011-2020 or 2012-2021.
4. Adding up each of the cost savings does not produce a meaningful grand total. This is
because many of the recommendations, if implemented, would interact with each other
and produce unexpected results. The “true” grand total might be larger or smaller than
the precise sum of each of the recommendations contained in this report. This is why
we have displayed each section’s total as a range rather than as a specific dollar
amount, and the grand total as around $2 trillion with significant margin for error.
5. Our savings numbers do not all make reference to the same baseline. In some cases, we
use the current law baseline. In others, however, we estimate savings based on
historical precedent (for example, when Congress has repeatedly renewed a deficit-
increasing provision).
What is Fiscal Sustainability?
Fiscal sustainability is the ability of the federal government to meet its fiscal obligations, now
and in the future. This definition is in keeping with what we believe is an appropriate
perspective on our government’s role in society. We should reject the dogmatism of either
extreme, one that would cut spending just for the sake of it and one that would raise revenues
without considering the broader economic impact. Cutting spending and raising revenues may
each be part of the solution, but they are not solutions on their own.
On the contrary, we believe achieving fiscal sustainability is about reinventing government.
Government needs to be less wasteful, less intrusive, and more transparent—while at the same
time delivering the vital services that society demands. But these goals are closely related. The
long-term success of government services requires a well-managed government. The more tax
dollars we squander on needless waste, the fewer we have to spend on health care or national
defense or other priorities.
Fiscal sustainability should be measured by looking at both deficits and debt. Deficits can tell us
about the annual performance of government while debt can tell us about the accumulated
burden of past deficits. Neither of these measures makes sense as absolute numbers. After all,
a $50 billion dollar deficit would be much more troubling for Luxembourg than it would be for
the United States. Instead, they should be presented as percentages of GDP.
Introduction 5
What deficit level is sustainable? Any deficit that does not increase our debt as a percent of
GDP is probably acceptable.2 What this means is that we should target reducing deficits to a
share of GDP that is lower than the annual growth rate of our economy. This way we can avoid
an out of proportion increase in outstanding debt.
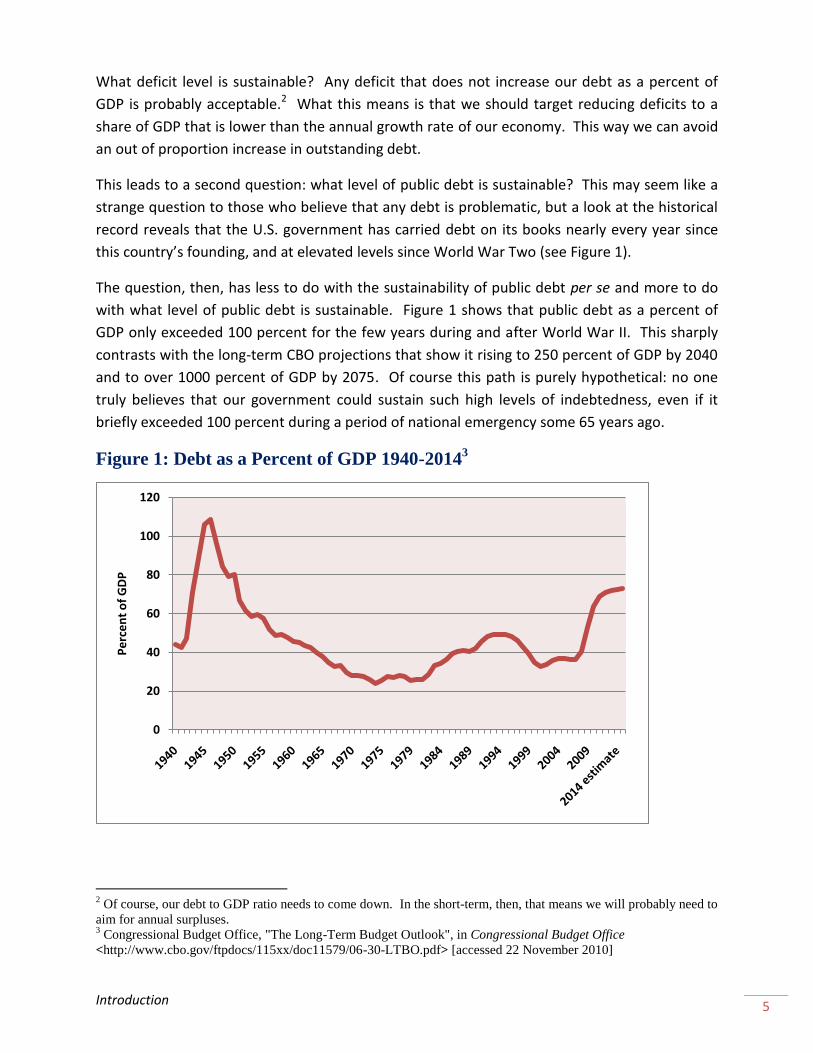
This leads to a second question: what level of public debt is sustainable? This may seem like a
strange question to those who believe that any debt is problematic, but a look at the historical
record reveals that the U.S. government has carried debt on its books nearly every year since
this country’s founding, and at elevated levels since World War Two (see Figure 1).
The question, then, has less to do with the sustainability of public debt per se and more to do
with what level of public debt is sustainable. Figure 1 shows that public debt as a percent of
GDP only exceeded 100 percent for the few years during and after World War II. This sharply
contrasts with the long-term CBO projections that show it rising to 250 percent of GDP by 2040
and to over 1000 percent of GDP by 2075. Of course this path is purely hypothetical: no one
truly believes that our government could sustain such high levels of indebtedness, even if it
briefly exceeded 100 percent during a period of national emergency some 65 years ago.
Figure 1: Debt as a Percent of GDP 1940-20143
2 Of course, our debt to GDP ratio needs to come down. In the short-term, then, that means we will probably need to
aim for annual surpluses. 3 Congressional Budget Office, "The Long-Term Budget Outlook", in Congressional Budget Office
<http://www.cbo.gov/ftpdocs/115xx/doc11579/06-30-LTBO.pdf> [accessed 22 November 2010]
0
20
40
60
80
100
120
Pe
rce
nt
of
GD
P
Introduction 6
Different groups have different ideas about what level of public debt is sustainable. One of the
most prominent standards out there, put forward in the 2009 Pew-Peterson report Red Ink
Rising, sets the sustainable debt to GDP level at 60 percent: “We believe that the 60 percent
goal is the most ambitious yet realistic goal that can be achieved in [an eight year timeframe].
The 60 percent debt threshold is now an international standard—regularly identified by the
European Union (EU) and the International Monetary Fund (IMF) as a reasonable debt target”.4
We believe that 60 percent should be the maximum debt to GDP level of a sustainable budget.
While lower levels may be preferred, getting below 60 percent should be our target.
Why is Deficit Reduction Important?
Deficit reduction is important because our current fiscal path is unsustainable. The Department
of Treasury projects that our tax revenues, under current law, will remain relatively constant as
a share of GDP at approximately 20 percent. Our spending outlays, however, are projected to
jump from 25 percent of GDP in 2010 to 45 percent of GDP by 2050 and will surpass 70 percent
of GDP by 2080. The main drivers of these deficits will be health care costs and net interest
payments.
Our last report, Part One, examined these issues at greater detail. Nevertheless, it is worth
reviewing some of the negative consequences of unsustainable deficits and the accumulating
debt that results:
1. Large persistent deficits can increase interest payments for debt service.
2. Large persistent deficits can redirect American wealth overseas.
3. Large persistent deficits can crowd out private sector investment.
4. Large persistent deficits can cause a debt crisis.
The fundamental motivation behind making the recommendations contained in this report,
Part Two, is to avoid the negative consequences of runaway deficits.
“The First 10 Savings”
The next section, “The First 10 Savings”, includes a diverse set of first step recommendations to
reduce the deficit. While these recommendations could have been included in other sections
of the report, we group them together here because we believe that they are helpful in
illustrating the broader direction of this report. We also believe, as the section header
suggests, that these recommendations are “low-hanging fruit” and ought to be among the first
steps in achieving deficit reduction.
4 Peterson-Pew Commission on Budget Reform, "Red Ink Rising", in Peterson-Pew Commission on Budget Reform
<http://budgetreform.org/sites/default/files/Red_Ink_Rising.pdf> [accessed 22 April 2011]

The First 10 Savings 7
THE FIRST 10 SAVINGS
Reduce the federal travel and vehicle budget.
Sell excess federal property.
Cut the unnecessary Joint Strike Fighter second engine.
Increase paperless transactions.
Consolidate information technology infrastructure.
Improve IRS tax enforcement.
Cut farm subsidies for high-income individuals.
Consolidate export-promotion agencies.
Align premiums with risk on pension guarantees.
Cut the tax subsidy for purchasing yachts.
Potential Savings: $75 billion over 10 years5, 6
5 This calculation assumes annually consistent savings for several of the 10 recommendations in this section.
6 Sources: 1-2 ( National Commission on Fiscal Responsibility and Reform, in The Moment of Truth
<http://www.fiscalcommission.gov/sites/fiscalcommission.gov/files/documents/TheMomentofTruth12_1_2010.pdf>
[accessed 22 April 2011]), 3-7 ( Office of Management and Budget, "Fiscal Year 2012 Terminations, Reductions,
and Savings: Budget of the U.S. Government"
<http://www.whitehouse.gov/sites/default/files/omb/budget/fy2012/assets/trs.pdf> [accessed 22 April 2011]), 8 (
John Podesta, Sarah Rosen Wartell and Jitinder Ko, "A Focus on Competitiveness", in Center for American
Progress), 9 ( Congressional Budget Office, "Budget Options Volume 2", in Congressional Budget Office
<http://www.cbo.gov/ftpdocs/102xx/doc10294/08-06-BudgetOptions.pdf> [accessed 22 April 2011]), 10 ( Seth
Hanlon and Michael Ettlinger, "Cut Spending in the Tax Code", in American Progress
<http://www.americanprogress.org/issues/2011/03/pdf/tax_expenditures.pdf> [accessed 22 April 2011])

Reinventing Health Care 8
REINVENTING HEALTH CARE
OUR TWELVE KEY RECOMMENDATIONS
Implement and Improve the Health Care Reform Law
►RECOMMENDATION 1: Follow through on cost-containment reforms.
Potential Savings: $210 billion over 10 years
►RECOMMENDATION 2: Strengthen the Independent Payment Advisory Board.
Potential Savings: $50 billion over 10 years
►RECOMMENDATION 3: Adopt delivery system reforms: pay for quality.
Potential Savings: $23.3 billion over 10 years
►RECOMMENDATION 4: Fully fund the CMS Innovation Center.
Potential Savings: Variable
Expand Cost-Cutting Mechanisms
►RECOMMENDATION 5: Use comparative effectiveness research to set payment rates.
Potential Savings: $0.9 billion over 10 years
►RECOMMENDATION 6: Help CMS to combat Medicare waste, fraud, and abuse.
Potential Savings: $9 billion over 10 years
►RECOMMENDATION 7: Recoup incorrect payments to Medicare Advantage insurers.
Potential Savings: $6.2 billion over 10 years
Reduce Drug Costs
►RECOMMENDATION 8: Shorten exclusivity period for brand name biologic drugs.
Potential Savings: $2.3 billion over 10 years
►RECOMMENDATION 9: Prohibit pay-for-delay agreements.
Potential Savings: $8.8 billion over 10 years
►RECOMMENDATION 10: Have Medicare require minimum rebates from drug companies.
Potential Savings: $100 billion over 10 years
Improve Medicaid Efficiency.
►RECOMMENDATION 11: Eliminate double payment for Medicaid administrative costs.
Potential Savings: $2.6 billion over 10 years
►RECOMMENDATION 12: Allow enrollment of dual eligibles in Medicaid managed care.
Potential Savings: $12 billion over 10 years
Reinventing Health Care 9
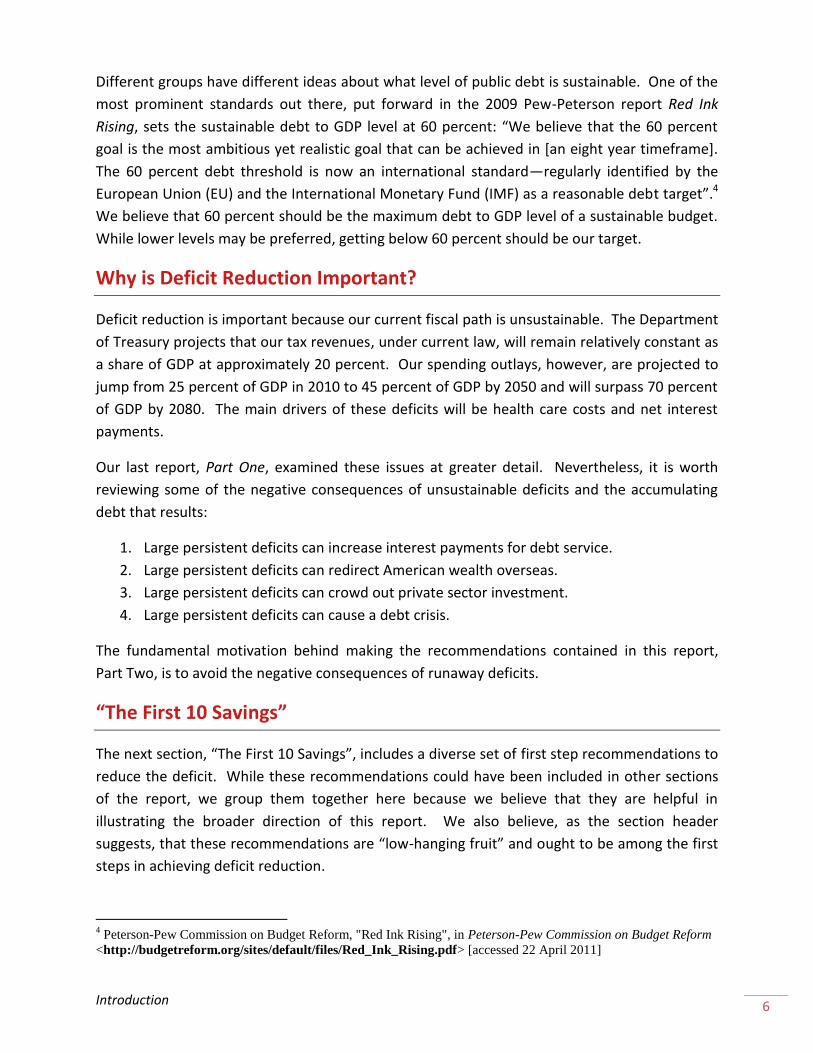
Recommended Minimum Potential Savings
$300-500 billion over 10 years
Consider Other Options
► OPTION 1: Gradually raise the Medicare eligibility age to 67.
Potential Savings: $124.8 billion over 10 years
► OPTION 2: Gradually increase all Medicare Part B premiums from 25 to 35 percent.
Potential Savings: $241.2 billion over 10 years
► OPTION 3: Modernize Medicare cost-sharing.
Potential Savings: $26.4 billion over 10 years
► OPTION 4: Require Medicare carriers to inform physicians about peer profiling.
Potential Savings: $1.7 billion over 10 years
Reinventing Health Care 10
Our Approach to Health Care Reform
Rising health care costs represent the single most significant threat to America’s fiscal health.
According to CBO projections, “projected growth in entitlement spending explains almost all of
the projected growth in total non-interest spending—and the two big government health-care
programs largely drive that increase.”7 While experts may disagree about how to reduce
government spending, as Robert Greenstein of the Center on Budget and Policy Priorities points
out, there is a striking consensus among budget experts,
including the CBO, the Brookings Institute, the GAO, the
Pew-Peterson Commission, and others, that the “continued
rapid growth of per-person health care costs is the single
biggest reason for the projected long-term increases in
deficits and debt.”8 Medicare and Medicaid are
responsible for “80 percent of the growth in spending on
the three largest entitlements over the next 25 years and
for 90 percent of that growth by 2080," according to the
CBO.9
Not only are these health care programs growing in cost,
but they are also growing relative to federal spending.
Each year they consume a bigger and bigger share of our
resources. Under current policy, according to CBO budget projections, federal spending on
Medicare and Medicaid will grow from 5.5 percent of GDP today to about 10 percent of GDP in
2035, and to more than 17 percent by 2080.10
Medicare and Medicaid costs that continue to outpace GDP growth cannot be sustained in the
long-term. Cost cutting in these two entitlement programs must be part of any budget reform
package. As Marc Labonte, a macroeconomic specialist for the Congressional Research Service,
explains, “any policy changes to place the budget on a sustainable path must include reductions
in the growth rate of government health spending.”11
7 Congressional Budget Office, "The Long-Term Budget Outlook", in Congressional Budget Office
<http://www.cbo.gov/ftpdocs/102xx/doc10297/06-25-LTBO.pdf> [accessed 22 April 2011] 8 Robert Greenstein, "Perspectives on Long-Term Deficits", in Center on Budget and Policy Priorities
<http://www.cbpp.org/files/1-21-10bud-test.pdf> [accessed 22 April 2011] 9 Congressional Budget Office, "The Long-Term Budget Outlook", in Congressional Budget Office
<http://www.cbo.gov/ftpdocs/102xx/doc10297/06-25-LTBO.pdf> [accessed 22 April 2011] 10
Congressional Budget Office, "The Long-Term Budget Outlook", in Congressional Budget Office
<http://www.cbo.gov/ftpdocs/115xx/doc11579/06-30-LTBO.pdf> [accessed 22 November 2010] 11
Marc Labonte, "The Economic Implications of the Long-Term Federal Budget Outlook", in Congressional
Research Service <http://aging.senate.gov/crs/medicare8.pdf> [accessed 22 April 2011]
“Continued rapid
growth of per-person
health care costs is
the single biggest
reason for the
projected long-term
increases in deficits
and debt”
- Robert Greenstein,
Center on Budget and
Policy Priorities

Reinventing Health Care 11
There is also very little evidence that all this health care spending is actually improving health.
In some cases, it may actually be making health care worse.12 Additionally, research has shown
that differences in health care spending show no corresponding differences in health outcome.
Dartmouth University researchers have found, for example, that per-capita health-care
spending—after adjusting for price, demographic, and illness level—varies by a factor of three
across the U.S.13 However, more is not always better, and Dartmouth research has shown that
low-cost regions of the U.S. achieve equal or better health outcomes than high-cost regions.14
These findings suggest that, by adopting the more efficient practices of the low-cost regions on
a national scale, significant health care savings could be achieved without harming quality of
care.
Health care cost trends are unsustainable but health quality is not keeping pace. However, by
implementing the twelve reforms outlined below, we can curb cost growth and improve care at
the same time.
12
Dr. Elliott Fisher et al., "Health Care Spending, Quality, and Outcomes", in The Darthmouth Institute for Health
Policy & Clinical Practice <http://www.dartmouthatlas.org/downloads/reports/Spending_Brief_022709.pdf>
[accessed 22 April 2011] 13
Dr. Elliott Fisher, "The Road to Reform", in Dartmouth Medicine
<http://dartmed.dartmouth.edu/summer09/pdf/road_to_reform.pdf> [accessed 22 April 2011] 14
Dr. Elliott Fisher, "The Road to Reform", in Dartmouth Medicine
<http://dartmed.dartmouth.edu/summer09/pdf/road_to_reform.pdf> [accessed 22 April 2011]

Reinventing Health Care 12
Our Twelve Key Recommendations
Implement and Improve the Health Care Reform Law
The new health care reform law, also known as the Affordable Care Act (ACA), has laid a solid
foundation for curbing skyrocketing health care costs. The CBO estimates that between 2012
and 2021, the ACA and health care provisions of the reconciliation act will reduce the deficit by
$210 billion,15 and by $1.3 trillion over the following decade.16 The law also extends the
solvency of the Medicare trust fund by twelve years, to 2029.17
Still, this important piece of legislation is merely the beginning. We still have to implement a
number of ACA’s more difficult reforms. Many of the cost-curbing mechanisms included in the
bill will only bear fruit if Congress stands firm on unpopular reforms such as allowing Medicare
payments to be reduced. Other reform provisions, such as the Independent Payment Advisory
Board (IPAB) (which was designed to recommend Medicare payment reforms) must be
strengthened. Further, other reform elements, such as the Centers for Medicare and Medicaid
(CMS) Innovation Center, tasked with testing new payment systems to improve quality and
lower costs, should be supported and expanded as soon as possible. Finally, several promising
reform ideas were left out of the bill. They should now be considered by Congress.
Difficult as the passage of health care reform was, the full development, implementation, and
execution of its provisions will be just as trying. Health care cost reduction and quality
improvement are not guaranteed, but outlined below are twelve recommendations aimed at
curbing costs, improving care, and strengthening our long-term fiscal outlook.
RECOMMENDATION 1 $210 BILLION IN SAVINGS OVER 10 YEARS18, 19
►Follow through on cost-containment reforms.
The recently-enacted health care reform law has the potential to reduce the deficit by $210
billion20 over the next decade, and by $1.3 trillion in the second decade, but only if Congress
follows through on several key cost-containment provisions included in the law.
15
Douglas W Elmendorf, "CBO’s Analysis of the Major Health Care Legislation", in Congressional Budget Office
<http://www.cbo.gov/ftpdocs/121xx/doc12119/03-30-HealthCareLegislation.pdf> [accessed 22 April 2011] 16
Douglas W Elmendorf, "Letter to Speaker Nancy Pelosi", in Congressional Budget Office
<http://www.cbo.gov/ftpdocs/113xx/doc11379/AmendReconProp.pdf> [accessed 22 April 2011] 17
Patricia A. Davis, "Medicare Primer", in Congressional Research Service
<http://aging.senate.gov/crs/medicare1.pdf> [accessed 22 April 2011] 18
Douglas W Elmendorf, "CBO’s Analysis of the Major Health Care Legislation", in Congressional Budget Office
<http://www.cbo.gov/ftpdocs/121xx/doc12119/03-30-HealthCareLegislation.pdf> [accessed 22 April 2011] 19
Provided reforms included in the Affordable Care Act (ACA) are executed, these saving will already be achieved.
We include these savings estimates here to illustrate the importance of following through on the cost-containment
provisions included in the ACA rather than repealing them, as has been proposed.

Reinventing Health Care 13
While the ACA includes dozens of cost-curbing mechanisms, certain provisions are estimated to
be the most effective at cutting costs. Not surprisingly, the most effective cost-cutters are also
the most controversial and may prove the most challenging to maintain. These key cost-curbing
provisions include: (1) reductions in Medicare spending, (2) an excise tax on high-cost insurance
plans tacked to inflation, and (3) a lower rate for subsidy growth.
The ACA calls for reductions in Medicare spending of approximately $500 billion over the next
10 years. Many of these savings will come from increasing efficiencies in Medicare and
modifying the formulas used to determine payment rates to providers. Savings will also come
from reducing overpayments to Medicare Advantage,
which on average costs 14 percent more than
traditional Medicare for the same services.
Some critics have argued these savings are unrealistic
because Congress has historically failed to authorize
Medicare payment reductions (for example, by
continually deferring reductions in Medicare payments
to physicians, also known as the “doc fix”). While
across-the-board payment reductions are not a solution to reducing long-term health care
costs, providers must be fairly reimbursed for their services or they will be forced to reduce
access to care, harming patients and shifting costs, the Medicare spending reductions in the
ACA are reasonable and Congress must follow through on them if Medicare cost growth is to be
contained.
The ACA includes two other important cost-curbing mechanisms. One is a new excise tax on
high-cost insurance plans (those costing more than $27,500 annually for a family). The idea
behind this provision is not that people will pay the tax, but that employers will choose
insurance plans that more aggressively hold down costs in order to avoid the tax, thereby
reducing costs. Importantly, the ACA also tacks the excise tax to inflation, rather than inflation
plus one percentage point, which will apply downward pressure on the costs of more insurance
plans more quickly. While this policy may need to be adjusted over time to ensure consumers
are not adversely affected, Congress must resist the urge to significantly alter or repeal this
important cost curbing mechanism.
The final bill also allows subsidies for low-income individuals to grow at a slower rate than
originally proposed, ultimately reducing costs to the government. While we must ensure health
care coverage is affordable for all, our focus should be on reducing the cost of health care for
individuals rather than simply increasing subsidies to pay for it. Congress should allow health
subsidies for low-income individuals to grow at the rate designated in ACA.
20
Douglas W Elmendorf, "CBO’s Analysis of the Major Health Care Legislation", in Congressional Budget Office
<http://www.cbo.gov/ftpdocs/121xx/doc12119/03-30-HealthCareLegislation.pdf> [accessed 22 April 2011]
―The most effective cost-
cutters are also the most
controversial and may
prove the most
challenging to maintain.‖
Reinventing Health Care 14
RECOMMENDATION 2 $50 BILLION IN SAVINGS OVER 10 YEARS21, 22
►Strengthen the Independent Payment Advisory Board.
Some experts, including Peter Orszag, former director of the OMB, argue that one of the most
powerful cost containment mechanisms included in the ACA is the Independent Payment
Advisory Board (IPAB). The CBO estimates that the IPAB will reduce Medicare spending by $28
billion between 2010 and 2019, with significant savings continuing beyond 2019.23
IPAB is a 15 person board of independent health experts appointed by the President, confirmed
by the Senate, and tasked with developing reforms to reduce Medicare per capita spending if it
exceeds GDP growth per capita plus one percent. The board will submit a package of reform
proposals to Congress, which must hold an up or down vote on each. The package cannot be
filibustered, and if Congress rejects the proposed package, it must find another way to save the
same amount. Some have argued against such a board, claiming that it takes too much power
away from Congress. However, this board has great potential to recommend innovative
measures to curb costs while still allowing Congress to make the final decision on whether the
reforms are actually enacted into law. Further, one might argue that Congress’s record on cost
containment suggests an independent board is necessary.
While the creation of this independent board is a huge step forward, the advisory board could
be strengthened in several ways. IPAB doesn’t go into effect until 2014, but this is too long to
wait when health care costs are rising so quickly. The board should be convened immediately
and should send Congress recommendations as soon as possible. Additionally, the Board is
forbidden from making any recommendations regarding payments to hospitals, skilled nursing
facilities, and other exempted providers until 2020. Hospital payments, which account for 28
percent of Medicare’s budget, and other exempted providers should be included in IPAB’s
purview immediately.
The Committee for a Responsible Federal Budget (CRFB) agrees that hospitals and other
providers should be included in IPAB’s purview and further recommends broadening its scope
to allow it to expand the current payment reform demonstration projects if they appear to be
working before their test periods have finished. CRFB also recommends allowing IPAB to make
changes to cost-sharing and benefits design. However, any such changes to benefits would
need to be carefully considered to ensure that they are promoting value and quality rather than
21
Committee for a Responsible Federal Budget, "Let’s Get Specific: Health Care", in Committee for a Responsible
Federal Budget <http://crfb.org/sites/default/files/Lets_Get_Specific_Health_Care.pdf> [accessed 25 April 2011] 22
The original cost savings estimate was $10 billion per year beginning in 2017, which through the FY2012-2021
10 year budget window would add include five years of savings. We also err on the side of caution and ignore
inflation. 23
Douglas W Elmendorf, "Letter to Majority Leader Harry Reid", in Congressional Budget Office
<http://www.cbo.gov/ftpdocs/108xx/doc10868/12-19-Reid_Letter_Managers_Correction_Noted.pdf> [accessed 25
April 2011]

Reinventing Health Care 15
simply shifting costs or harming beneficiaries. CRFB estimates that increasing IPAB’s authority
could allow the board’s cost-savings targets to be increased by $10 billion per year beginning in
2017.24
IPAB has the ability to significantly improve the fiscal health of the Medicare program and the
federal budget as whole. However, fiscal health should not be achieved at the cost of access to
quality care. History has shown us that across the board cuts to Medicare are not a long-term
solution. This is why it is imperative that IPAB incorporate
into its recommendations not simply cuts, but also reforms
that improve quality and pay for value. To that end, the
ACA calls for two Institute of Medicine studies to examine
value-based purchasing that rewards quality over quantity.
It also recommends how to incorporate “quality and value”
metrics into Medicare payment systems. Such studies and
the payment reforms that result should be fully supported by Congress, as such reforms offer
the best opportunity to curb costs and improve care. The Mayo Clinic also recommends that
IPAB serve as an unbiased national data aggregator, making performance and cost information
publically available in order to identify best practices and high performers.25
Several other critics of IPAB have also argued that the make-up of the board should be altered
to ensure providers are properly represented and quality of care is emphasized along with cost-
containment. To ensure providers are properly represented on the board, some have
suggested requiring that health care providers comprise at least 50 percent of the board, and
further that those providers be allowed to continue to practice, ensuring they are up-to-speed
on the most current treatments and practices.
RECOMMENDATION 3 $23.3 BILLION IN SAVINGS OVER 10 YEARS26
►Adopt delivery system reforms: pay for quality.
A variety of measures have been designed to curb health care costs, but virtually all experts
agree that the only way to truly “bend the cost curve” is to change the way we deliver and pay
for health care. We must shift our current system from one that rewards quantity of care to
one that rewards quality of care.
Researchers at Dartmouth College estimate that up to 30 percent of medical care—costing over
$600 billion annually—goes to tests and procedures that do not actually improve health
24
Committee for a Responsible Federal Budget, "Let’s Get Specific: Health Care", in Committee for a Responsible
Federal Budget <http://crfb.org/sites/default/files/Lets_Get_Specific_Health_Care.pdf> [accessed 25 April 2011] 25
Mayo Clinic, "A Foundation for Health Care Reform Legislation", in Mayo Clinic
<http://www.mayoclinic.org/healthpolicycenter/pdfs/viewpoint4.pdf> [accessed 25 April 2011] 26
Congressional Budget Office, "Budget Options Volume 1: Health Care", in Congressional Budget Office
<http://www.cbo.gov/ftpdocs/99xx/doc9925/12-18-HealthOptions.pdf> [accessed 25 April 2011]
―Fiscal health should
not be achieved at
the cost of access to
quality care.‖

Reinventing Health Care 16
outcomes.27 This unnecessary care, a primary driver of cost growth, is the result of our fee-for-
service system which pays for each individual test and procedure, thereby creating an incentive
to deliver more services rather than better services.
Atul Gawande, a surgeon, Harvard University professor, and author of the now-famous New
Yorker article, “The Cost Conundrum”, uses two Texas towns of similar size, location, and make-
up—McAllen and El Paso—to highlight the true drivers of health
care costs. The cost per Medicare enrollee in McAllen is
$14,946, almost twice as much as the $7,504 cost per enrollee
in El Paso.28 Yet despite these increased costs, the quality of
care in McAllen is not “appreciably better, and by some
measures, it is worse.”29 The primary reason for this
incongruence is the “marked difference in the amount of care
ordered for patients—patients in McAllen receive vastly more diagnostic tests, hospital
admissions, operations, specialist visits, and nursing care than [patients] in El Paso.”30
Gawande draws one very important conclusion from his research: the “the primary cause” of
the U.S.’s high cost of health care is “very simply, the across-the-board overuse of medicine.”31
In other words, doctors prescribe too many expensive tests and surgeries that don’t make
patients appreciably healthier. In order to truly curb health care costs, for both private payers
and the government, we have to change the way we pay providers and start paying for value
and health outcomes rather than volume of care.
The great news is that health care providers across the country are already moving away from
the broken fee-for-service system and are paying providers for quality. The renowned Mayo
Clinic in Rochester, Minnesota delivers some of the highest quality care in the world and costs
the government 17 percent less than the national average for treatment of Medicare patients
with major chronic diseases, according to a Dartmouth study.32 Intermountain Healthcare in
Utah is another good example, offering high quality care for chronically ill Medicare patients at
a cost of nearly one-third less than the national average. And the Geisinger Medical Home in
27
Fisher S Eliot et al., "The Implications of Regional Variations in Medicare Spending. Part 1:The Content, Quality,
and Accessibility of Care", in Annals of Internal Medicine
<http://www.annals.org/content/138/4/273.full.pdf+html> [accessed 25 April 2011] 28
Atul Gawande, "The Cost Conundrum"
<http://www.newyorker.com/reporting/2009/06/01/090601fa_fact_gawande> [accessed 25 April 2011] 29
Atul Gawande, "The Cost Conundrum Redux" <http://www.newyorker.com/online/blogs/newsdesk/2009/06/atul-
gawande-the-cost-conundrum-redux.html> [accessed 25 April 2011] 30
Atul Gawande, "The Cost Conundrum Redux" <http://www.newyorker.com/online/blogs/newsdesk/2009/06/atul-
gawande-the-cost-conundrum-redux.html> [accessed 25 April 2011] 31
Atul Gawande, "The Cost Conundrum Redux" <http://www.newyorker.com/online/blogs/newsdesk/2009/06/atul-
gawande-the-cost-conundrum-redux.html> [accessed 25 April 2011] 32
Dartmouth Institute for Health Policy and Clinical Practice, "Tracking the Care of Patients with Severe Chronic
Illness", in The Dartmouth Atlas of Healthcare
<http://www.dartmouthatlas.org/downloads/atlases/2008_Chronic_Care_Atlas.pdf> [accessed 26 April 2011]
―We have to start
paying for value
rather than
volume.‖
Reinventing Health Care 17
Pennsylvania treats 2.5 million patients who are typically sicker, older, and poorer than patients
nationally, but has been able to reduce medical costs by seven percent, largely due to a 29
percent reduction in emergency room visits and a 20 percent reduction in hospital
admissions.33 Finally, the Cleveland Clinic provided the most cost-efficient care during the last
two years of life at a cost of $31,252, almost 50 percent less than the most expensive.34
What do all of these outstanding health providers have in common? They have all
implemented what health experts refer to as “delivery system reforms.” They have changed
their incentive structures and have begun to reward quality over quantity.
While the private sector has lead the way on many of these reforms, the federal government
has also begun a number of delivery system reforms. The ACA establishes pilot programs to
evaluate (1) accountable care organizations (which integrate a group of physicians, hospitals,
and other providers and hold them accountable for the whole of a patient’s care), and (2)
bundled payments (where providers are paid a set fee for certain services, rather than paying
for each individual test and procedure, thereby incentivizing providers to avoid complications
and readmissions). Additionally, the ACA puts in place a new policy which calls for reduced
payments to hospitals for preventable readmissions and certain hospital-acquired conditions.
These programs are an excellent start, but we must ensure that the successful ones are
adopted and implemented on a wide scale as soon as possible, and that no amount of pressure
from physicians, hospitals, or other providers prevents their full implementation. These
reforms have often been overlooked in the debate on health care reform because their benefits
are not easily quantifiable and usually do not score as savings. But these reforms target the
root of our health care cost growth problem. While we do not have cost-savings estimates for
all delivery system reforms, the CBO has estimated that just two of these reforms—accountable
care organizations and bundling payments for hospital and post-acute care—could save $23.3
billion over 10 years.35
Further, converting our broken fee-for-service system to one that pays for quality will
ultimately address the problem of the sustainable growth rate (SGR), or “doc fix.” The SGR is a
poorly designed formula that was originally created to slow the growth of physician payments,
but ended up as a blunt instrument that required harsh, unrealistic payment cuts. As
highlighted by the Fiscal Commission, there is no quick fix to the SGR. Rather, a new formula
33
Ellen-Marie Whelan and Lesley Russell, "Better Health Care at Lower Costs", in Center for American Progress
<http://www.americanprogress.org/issues/2010/03/pdf/health_delivery.pdf> [accessed 28 April 2011] 34
John E Wennberg, "Tracking the Care of Patients with Severe Chronic Illness Executive Summary", in The
Darmouth Institute for Health Policy and Clinical Practice
<http://www.dartmouthatlas.org/downloads/atlases/2008_Atlas_Exec_Summ.pdf> [accessed 26 April 2011] 35
Congressional Budget Office, "Budget Options Volume 1: Health Care", in Congressional Budget Office
<http://www.cbo.gov/ftpdocs/99xx/doc9925/12-18-HealthOptions.pdf> [accessed 25 April 2011]
Reinventing Health Care 18
needs to be created that “pays doctors based on quality instead of quantity of services.”36 The
only way to pay doctors for quality rather than quantity is to pursue and adopt delivery system
and payment reforms.
RECOMMENDATION 4 VARIABLE SAVINGS37
►Fully fund the CMS Innovation Center.
The federal government needs to support, study, and adopt delivery system and payment
reforms in order to achieve cost savings and quality improvements. The health care law
includes a vital but overlooked provision designed to do just that.
The ACA creates an innovation center which will test, evaluate, and expand different delivery
systems designed to pay health care providers for quality rather than quantity.38 The center,
dubbed the Center for Medicare and Medicaid Innovation (CMMI), or the “Innovation Center”,
is tasked with developing and testing innovative payment models that will slow the rate of cost
growth and improve the quality of care. Health care providers from around the country, many
of whom (like Mayo and Geisinger) are already running successful reform models, will apply to
participate in the Innovation Center’s pilot programs. These programs found to be most
successful will be expanded nationwide. The Innovation Center will allow government
programs like Medicare and Medicaid to learn from private providers and vice versa.
The ACA includes $5 million in 2010 for the design, implementation, and evaluation of models,
and $10 billion for pilot programs between 2011 and 2019. However, a number of Members of
Congress have already voiced opposition to the Innovation Center and have pledged to
completely eliminate its funding. Cutting funding to the Innovation Center or hampering its
operations would be shortsighted for both health and budgetary reasons. Of all the provisions
in the ACA, health experts agree that the CMS Innovation Center, if properly implemented,
holds the most promise for reducing runaway health care costs and improving care. The CMS
Innovation Center must be fully funded and supported by Congress in order to realize its
considerable cost-saving and care-improvement potential.
36
National Commission on Fiscal Responsibility and Reform, in The Moment of Truth
<http://www.fiscalcommission.gov/sites/fiscalcommission.gov/files/documents/TheMomentofTruth12_1_2010.pdf>
[accessed 22 April 2011] 37
Kathleen Sebelius, "Speech at Atlanta Press Club", in U.S. Department of Health & Human Services
<http://www.hhs.gov/secretary/about/speeches/sp20110419.html> [accessed 26 April 2011] 38
Center for Medicare & Medicaid Innovation, "Our Charge", in Center for Medicare & Medicaid Innovation
<http://innovations.cms.gov/about-us/our-charge/> [accessed 28 April 2011]

Reinventing Health Care 19
Expand Cost-Cutting Mechanisms
A number of cost-cutting mechanisms are already being pursued by the federal government.
Yet many of these programs have fallen short of their cost-saving potential because of a variety
of hurdles. These range from an aversion to upfront costs (as with investment in oversight
measures in Medicare) to a fear of changing benefits (as with comparative effectiveness
research). Many of these cost-curbing mechanisms are worth pursuing not only to save dollars,
but also to improve quality. Now is the time to overcome these hurdles and expand and
accelerate existing cost-cutting programs in order to achieve bigger savings and higher quality
care.
RECOMMENDATION 5 $0.9 BILLION IN SAVINGS OVER 10 YEARS39, 40
►Expand investment in comparative effectiveness research and allow findings
to be used in setting payment rates.
Comparative effectiveness research (CER) has the potential to significantly lower health care
costs and improve care. Unfortunately, CER has been mischaracterized as “rationing” and has
not received the attention it deserves.
First off, CER is not rationing. It is common-sense
research of medical treatments to determine which
ones achieve the best results. In other words, it
provides physicians with the most up-to-date
information about which treatments work best. Most
patients believe physicians are already making
decisions based on the best, most current
information. However, studies show that only about
half of patients receive the recommended care, and
approximately one third of all treatments and
procedures performed have no proven benefits.41 This unnecessary care, including the overuse
of antibiotics and diagnostic tests, is driving up costs, and by some estimates accounts for $250
to $325 billion in annual health care spending.42 Comparative effectiveness research could
39
Congressional Budget Office, "Budget Options Volume 1: Health Care", in Congressional Budget Office
<http://www.cbo.gov/ftpdocs/99xx/doc9925/12-18-HealthOptions.pdf> [accessed 25 April 2011] 40
This savings estimate, from the CBO’s 2008 Budget Options: Health Care, is for 2010-2019. Assuming inflation,
the savings figure should increase for later 10 year periods including 2011-2020 and 2012-2021. 41
Elizabeth A McGlynn et al., "The Quality of Health Care Delivered to Adults in the United States", in The New
England Journal of Medicine <http://www.nejm.org/doi/full/10.1056/NEJMsa022615#t=article> [accessed 26 April
2011] 42
Robert Kelley, "Where Can $700 Billion in Waste Be Cut Annually from the U.S. Health Care System?", in
Thomson Reuters <http://img.en25.com/Web/ThomsonReuters/WASTEWHITEPAPER_FINAL11_3_09.pdf>
[accessed 3 May 2011]
―Studies show that only
half of patients receive
the recommended care,
and approximately one
third of all treatments
and procedures
performed have no
proven benefit.‖

Reinventing Health Care 20
reduce this unnecessary care, improve outcomes, and reduce total health care spending in the
U.S. by $8 billion over 10 years, according to CBO estimates.43
The federal government has acknowledged the benefits of CER and has recently increased
investment in such research. The American Recovery and Reinvestment Act (ARRA) included
funds for CER, and the ACA created the new Patient-Centered Outcomes Research Institute and
allocated $2.9 billion for CER. Further, the ACA created the Patient Centered Outcomes
Research Institute (PCORI), an independent organization designed to indentify priorities and
pursue research that compares the effectiveness of different therapies and treatments for the
same disease. These funds and programs should be maintained and expanded in order to reap
the full benefits of CER.
But investment in CER is not enough. We need to start linking reimbursement decisions with
evidence of effectiveness. Unfortunately, the new health care law expressly prohibits the
results of effectiveness research from being used to set payment rates for Medicare. Under
current law, Medicare pays for any treatment it deems “reasonable and necessary”, regardless
of whether it is proven to be as effective as or more effective than another treatment. These
prohibitions need to relaxed, and Medicare needs to be allowed to preferentially pay for
treatments proven to achieve better results.
The idea of basing coverage and reimbursement determinations on comparative effectiveness
is scary to some critics who fear it may reduce access and stymie innovation. However, some
creative proposals designed to find balance between paying for effectiveness and ensuring
access and innovation are being developed.
Researchers Steven Pearson of the Institute for Clinical and Economic Research and Peter Bach
of the Sloan-Kettering Cancer Center recently put forward a proposal that would “encourage
Medicare to pay equally for services that provide comparable patient outcomes.”44 Their plan
would allow Medicare to reimburse at high levels for services proven to provide “superior
benefits compared to alternative options.”45 New treatments, which have not been proven to
be effective, would also be fully reimbursed, but only for three years. After three years,
treatments proven to be more effective than the standard treatment would continue to be
reimbursed in full, but those found to be as effective would only be reimbursed at the same
level as the standard treatment.
43
Congressional Budget Office, "Budget Options Volume 1: Health Care", in Congressional Budget Office
<http://www.cbo.gov/ftpdocs/99xx/doc9925/12-18-HealthOptions.pdf> [accessed 25 April 2011] 44
Steven D Pearson and Peter B Bach, "How Medicare Could Use Comparative Effectiveness Research In Deciding
On New Coverage And Reimbursement", in Health Affairs
<http://content.healthaffairs.org/content/29/10/1796.abstract> [accessed 28 April 2011] 45
Steven D Pearson and Peter B Bach, "How Medicare Could Use Comparative Effectiveness Research In Deciding
On New Coverage And Reimbursement", in Health Affairs
<http://content.healthaffairs.org/content/29/10/1796.abstract> [accessed 28 April 2011]
Reinventing Health Care 21
The CBO also outlined a proposal that would allow the Secretary of Health and Human Services
(HHS) to modify Medicare’s coverage of preventive services based on evidence of effectiveness.
The United States Preventive Services Task Force (USPSTF), which is sponsored by HHS,
currently conducts independent, impartial research on the effectiveness of preventive services.
The task force grades the effectiveness of various preventive services. For example, a service
with significant benefits that causes no harm would receive a grade of A, while a service that is
found to be ineffective or whose harm outweighs its benefits would receive a grade of D. Only
seven of the 18 preventive services covered by Medicare received grades of A or B.46 This
option would allow the Secretary to adjust Medicare’s coverage of preventive services that
experts have determined are ineffective or harmful. Assuming the Secretary decided not to
cover preventive services with a grade of D, the CBO estimates $850 million could be saved
over 10 years.47
Our tax dollars should only pay for procedures that are proven to work. If two treatments or
drugs are equally effective from a clinical standpoint, then all payers—from private health plans
to Medicare and Medicaid—should refuse to pay for the most expensive one. CER is about
researching the best, most cost-effective treatments in order to improve care and reduce costs,
and the federal government should prioritize this research and allow its findings to guide
reimbursement decisions.
RECOMMENDATION 6 $9 BILLION IN SAVINGS OVER 10 YEARS48
►Help CMS to combat Medicare waste, fraud, and abuse.
Conservatively, an estimated $60 billion—approximately three percent of total annual health
care spending—is lost to fraud every year.49 Further, half of the government’s “improper
payments”, which totaled $72 billion in 2008, came from improper payments to Medicare and
Medicaid providers, suppliers, and vendors.50 Medicaid has an estimated improper-payment
46
Congressional Budget Office, "Budget Options Volume 1: Health Care", in Congressional Budget Office
<http://www.cbo.gov/ftpdocs/99xx/doc9925/12-18-HealthOptions.pdf> [accessed 25 April 2011] 47
Congressional Budget Office, "Budget Options Volume 1: Health Care", in Congressional Budget Office
<http://www.cbo.gov/ftpdocs/99xx/doc9925/12-18-HealthOptions.pdf> [accessed 25 April 2011] 48
National Commission on Fiscal Responsibility and Reform, in The Moment of Truth
<http://www.fiscalcommission.gov/sites/fiscalcommission.gov/files/documents/TheMomentofTruth12_1_2010.pdf>
[accessed 22 April 2011] 49
Kay L Daly, "Improper Payments: Progress Made but Challenges Remain in Estimating and Reducing Improper
Payments", in Subcommittee on Federal Financial Management, Government Information, Federal Services, and
International Security, Committee on Homeland Security and Governmental Affairs, U.S. Senate
<http://hsgac.senate.gov/public/index.cfm?FuseAction=Files.View&FileStore_id=8a30c529-84d8-4453-8929-
9d99fc3e6b94> [accessed 28 April 2011] 50
Kay L Daly, "Improper Payments: Progress Made but Challenges Remain in Estimating and Reducing Improper
Payments", in Subcommittee on Federal Financial Management, Government Information, Federal Services, and
International Security, Committee on Homeland Security and Governmental Affairs, U.S. Senate
<http://hsgac.senate.gov/public/index.cfm?FuseAction=Files.View&FileStore_id=8a30c529-84d8-4453-8929-
9d99fc3e6b94> [accessed 28 April 2011]

Reinventing Health Care 22
rate of $18.6 billion, or 10.5 percent—the highest of any federal program.51 And according to a
former administrator of CMS, “the total amount of Medicare fraud is unknown.”52 One of the
key reasons this waste continues is because Congress refuses to appropriate adequate funds to
combat health care fraud. Medicare spends less than one fifth of one percent of its budget on
anti-fraud measures, which is a fraction of what private insurers spend.53
In an effort to combat the fraud and waste plaguing the federal health care programs, the
administration has initiated a number of anti-fraud measures that include the Health Care
Fraud and Prevention Enforcement Action Team (HEAT), which in its first year found more than
$50 million in false Medicare claims in Detroit and charged eight individuals in Miami for
creating fake clinics and submitting phony bills for
more than $100 million.
The new health care law also calls for a number of
reforms including expanded provider screening,
enhanced oversight of new providers and suppliers,
an enrollment freeze in areas identified as “high risk”
for fraud, and the creation of a database to collect
and share vital data between federal and state
programs. While these anti-fraud activities require
some up-front investment, that investment can pay dividends. According to the HHS Office of
the Inspector General, for every $1 they invest in health care fraud investigations, they get $17
back.54 Further, the National Commission on Fiscal Responsibility and Reform argues that
increasing the ability of CMS to combat waste, fraud, and abuse by giving the agency new
statutory authority and increasing its resources could save $1 billion in 2015 and $9 billion
through 2020.55
51
Kathleen M King and Kay L Daly, "Medicare and Medicaid Fraud, Waste and Abuse: Effective Implementation
of Recent Laws and Agency Actions Could Help Reduce Improper Payments", in United States Government
Accountability Office <http://www.gao.gov/new.items/d11409t.pdf> [accessed 26 April 2011] 52
Kerry N Weems and Benjamin E Sasse, "Is Government Health Insurance Cheap?", in The Wall Street Journal
<http://online.wsj.com/article/SB123966918025015509.html> [accessed 28 April 2011] 53
Elizabeth A McGlynn et al., "The Quality of Health Care Delivered to Adults in the United States", in The New
England Journal of Medicine <http://www.nejm.org/doi/full/10.1056/NEJMsa022615#t=article> [accessed 26 April
2011] 54
Thomson Reuters, "Fighting Fraud and Abuse, Funding Reform"
<http://info.thomsonhealthcare.com/?elqPURLPage=475> [accessed 27 April 2011] 55
National Commission on Fiscal Responsibility and Reform, in The Moment of Truth
<http://www.fiscalcommission.gov/sites/fiscalcommission.gov/files/documents/TheMomentofTruth12_1_2010.pdf>
[accessed 22 April 2011]
―Medicare spends less
than one fifth of one
percent of its budget on
anti-fraud measures,
which is a fraction of what
private insurers spend.‖

Reinventing Health Care 23
RECOMMENDATION 7 $6.2 BILLION IN SAVINGS OVER 10 YEARS56
►Recoup Incorrect Payments to Medicare Advantage Insurers
Under current law, Medicare Advantage (MA) plans receive payments from the government
based on which high-cost health conditions a beneficiary has. In 2008, the Centers for
Medicare and Medicaid (CMS) announced a plan to audit a sample of MA plan records, also
known as a validation audit, in order to verify the accuracy of the health conditions
documented by the plans and the adjusted payments received by the plans. Under the pilot,
CMS only required plans to pay back overpayments for the sample audit. But the President
Obama’s Fiscal Year 2012 budget puts forward a proposal that would require CMS to
extrapolate the error rate found in the validation audits to the entire Medicare Advantage plan
payment for a given year. According to the President’s proposed budget, recouping these
erroneous payments will generate $6.2 billion over ten years.57
Reduce Drug Costs
Prescription drugs are the third most costly sector of our health care system, accounting for 10
percent of spending, which ranks behind only hospital care (31 percent) and physician and
clinical services (21 percent).58
Spending on prescriptions has been a key contributor to the growth in health care spending. It
has grown from just 5.6 percent of health care spending in 1990 to over 10 percent today.59 In
1990, spending on prescription drugs in the U.S. totaled $40.3 billion, but by 2008 that number
had reached $234 billion, a 584 percent increase.60
This cost growth is driven by three key factors: (1) an increase in the use of expensive specialty
drugs, (2) an increase in the number of prescriptions being written as the population ages, and
(3) price inflation. Although the rate of growth in pharmaceutical spending has dropped
56
Office of Management and Budget, "Fiscal Year 2012 Terminations, Reductions, and Savings: Budget of the U.S.
Government" <http://www.whitehouse.gov/sites/default/files/omb/budget/fy2012/assets/trs.pdf> [accessed 22 April
2011] 57
Office of Management and Budget, "Fiscal Year 2012 Terminations, Reductions, and Savings: Budget of the U.S.
Government" <http://www.whitehouse.gov/sites/default/files/omb/budget/fy2012/assets/trs.pdf> [accessed 22 April
2011] 58
The Henry J. Kaiser Family Foundation, "U.S. Health Care Costs" <http://www.kaiseredu.org/Issue-Modules/US-
Health-Care-Costs/Background-Brief.aspx> [accessed 27 April 2011] 59
Centers for Medicare & Medicaid Services, "National Health Expenditure Data: Historical"
<https://www.cms.gov/NationalHealthExpendData/02_NationalHealthAccountsHistorical.asp#TopOfPage>
[accessed 27 April 2011] 60
The Henry J. Kaiser Family Foundation, "U.S. Health Care Costs" <http://www.kaiseredu.org/Issue-Modules/US-
Health-Care-Costs/Background-Brief.aspx> [accessed 27 April 2011]

Reinventing Health Care 24
somewhat in recent years, the growth rate is still projected to exceed the growth rates for
hospital services and other professional services from 2010 through 2019.61
This rise in the cost of prescription medicines not only harms government’s budget, but it also
hurts the pocketbooks of thousands of Americans trying to afford their life-saving medications.
Steps must be taken to reverse or slow the growth prescription drug costs and ensure the
availability of much-needed drugs. Outlined below are three reform options aimed at reining in
growing drug costs.
RECOMMENDATION 8 $2.3 BILLION IN SAVINGS OVER 10 YEARS62
►Shorten exclusivity period for brand name biologic drugs.
The 1984 Hatch-Waxman Act created a regulatory approval system for conventional generic
drugs. It has been extremely successful in lowering the cost of prescription drugs by allowing
generics to compete. The Generic Pharmaceutical Association estimates that the use of generic
drugs has saved the American health system more than $734 billion over the past decade.63
Unfortunately, biologic drugs, which are grown from living cells (rather than made chemically
like conventional drugs), have for many years lacked a regulatory pathway for generics, thereby
avoiding generic competition and increasing their prices. Biologic drugs on average cost 22
times more than ordinary drugs, which places them out of reach for many people. The cost of
biologics is rising each year, consuming an increasingly larger portion of health care costs. In
2008, 28 percent of sales from the pharmaceutical industry’s top 100 products came from
biologics, but by 2014 that share is expected to rise to 50 percent.64 And according to the
Medicare Payment Advisory Commission, the top six biologics already consume 43 percent of
the drug budget for Medicare Part B.65
The ACA created a pathway for biologics to become generics, setting the exclusivity period at
12 years and giving drug manufacturers broad “evergreening” authority (the ability to make
minor changes, such as slightly altering the dosage, in order to receive an additional 12 years of
exclusivity). Some advocates, such as Representative Waxman and President Obama, have
61
Congressional Budget Office, "Technological Change and the Growth of Health Care Spending", in
Congressional Budget Office <http://www.cbo.gov/ftpdocs/89xx/doc8947/01-31-TechHealth.pdf> [accessed 28
April 2011] 62
Office of Management and Budget, "Fiscal Year 2012 Terminations, Reductions, and Savings: Budget of the U.S.
Government" <http://www.whitehouse.gov/sites/default/files/omb/budget/fy2012/assets/trs.pdf> [accessed 22 April
2011] 63
The Generic Pharmaceutical Association, "Generic Pharmaceuticals Saved $734 Billion over Last Decade"
<http://www2.prnewswire.com/mnr/GPhA/38110/> [accessed 27 April 2011] 64
Anthony D So and Samuel L Katz, "Biologics Boondoggle"
<http://sanford.duke.edu/news/features/so_com030810.php> [accessed 27 April 2011] 65
The Medicare Payment Advisory Commission, "Improving Incentives in the Medicare Program", in The Medicare
Payment Advisory Commission <http://www.medpac.gov/documents/Jun09_EntireReport.pdf> [accessed 27 April
2011]
Reinventing Health Care 25
pushed for a shorter exclusivity period of five or seven years in order to make cheaper generic
biologics available more quickly. Included in the President’s proposed Fiscal Year 2012 budget
is a proposal to change the brand name biologic exclusivity period to seven years and prohibit
drug manufacturers from receiving additional exclusivity for minor adjustments beginning in
2012.66
According to a study by the Federal Trade Commission, 12 years of exclusivity is not necessary
to promote innovative new biologics and could even harm patients by directing the limited drug
development funding toward proven drugs rather than new products (that could provide relief
for unmet medical needs).67 Many health experts, including Anthony D. So and Samuel L. Katz
of Duke University, also argue that 12 years is too long and that a five year exclusivity period
should be adopted in order to save billions of dollars and give patients access to much-needed
generic biologic drugs.68
According to cost estimates in the Fiscal Year 2012 budget proposal, implementing seven years
of exclusivity for name brand biologics and prohibiting the ”evergreening” of products to gain
additional years of exclusivity could save $2.34 billion between 2012 and 2021.69 This option
would create competition, reduce costs for both the government and private payers, and
ensure greater access to needed medications.
RECOMMENDATION 9 $8.8 BILLION IN SAVINGS OVER 10 YEARS70
► Prohibit pay-for-delay agreements.
Under current law, name brand drug manufacturers can settle patent lawsuits by paying
generic drug manufacturers to delay introduction of generic drugs into the market. This
practice not only increases costs to consumers, but it also can prevent low-income individuals
from accessing life-saving drugs. Included in the President’s Fiscal Year 2012 budget proposal is
a provision that would give the Federal Trade Commission the authority to prohibit pay-for-
66
Office of Management and Budget, "Fiscal Year 2012 Terminations, Reductions, and Savings: Budget of the U.S.
Government" <http://www.whitehouse.gov/sites/default/files/omb/budget/fy2012/assets/trs.pdf> [accessed 22 April
2011] 67
Federal Trade Commission, "Emerging Health Care Issues: Follow-on Biologic Drug Competition", in Federal
Trade Commission <http://www.ftc.gov/os/2009/06/P083901biologicsreport.pdf> [accessed 27 April 2011] 68
Anthony D So and Samuel L Katz, "Biologics Boondoggle"
<http://sanford.duke.edu/news/features/so_com030810.php> [accessed 27 April 2011] 69
Office of Management and Budget, "Fiscal Year 2012 Terminations, Reductions, and Savings: Budget of the U.S.
Government" <http://www.whitehouse.gov/sites/default/files/omb/budget/fy2012/assets/trs.pdf> [accessed 22 April
2011] 70
Office of Management and Budget, "Fiscal Year 2012 Terminations, Reductions, and Savings: Budget of the U.S.
Government" <http://www.whitehouse.gov/sites/default/files/omb/budget/fy2012/assets/trs.pdf> [accessed 22 April
2011]

Reinventing Health Care 26
delay agreements, thereby increasing access to cheaper generic drugs and saving the
government $8.8 billion over 10 years.71
RECOMMENDATION 10 $100 BILLION IN SAVINGS OVER SEVEN YEARS72, 73
►Allow Medicare to require minimum rebates from drug companies.
Medicare Part D, which provides prescription drug coverage, is administered by private insurers
rather than by the government (like the rest of the Medicare program). The thinking behind
this organization was that allowing private insurers to administer the program would increase
competition and bring down costs. However, Medicare Part D pays on average 30 percent
more for drugs than Medicaid, which is administered by the government.74 Further,
administrative costs of Medicare Part D are close to six times higher than the administrative
costs of traditional Medicare.75
In an effort to reduce drug costs, Medicare Part D also allows the private insurers who provide
the coverage to negotiate for drug rebates and find the lowest price. But this system of
negotiation has resulted in drug rebates averaging only 8.1 percent since 2006.76 Rather than
allowing private insurers to negotiate for the drug rebates, Medicaid sets a required minimum
rebate percentage, which drug companies must pay. Medicaid’s required rebate amount was
set at 15.1 percent for all single-source drugs, but was recently increased to 23.1 percent in the
ACA.
In order to reduce drug costs under the Medicare Part D program, two options could be
pursued. One option would be to allow Medicare Part D, like Medicaid, to set a minimum
rebate percentage of 23.1 percent. The Bipartisan Policy Center estimates this option could
71
Office of Management and Budget, "Fiscal Year 2012 Terminations, Reductions, and Savings: Budget of the U.S.
Government" <http://www.whitehouse.gov/sites/default/files/omb/budget/fy2012/assets/trs.pdf> [accessed 22 April
2011] 72
The Debt Reduction Task Force, "Restoring America's Future", in Bipartisan Policy Center
<http://www.bipartisanpolicy.org/sites/default/files/BPC%20FINAL%20REPORT%20FOR%20PRINTER%2002%
2028%2011.pdf> [accessed 27 April 2011] 73
This estimate for the 2012-2018 period. Assuming that savings continue after 2018, this number could increase,
as it would if we were accounting for inflation. 74
Majority Staff of the Committee on Oversight and Government Reform, "Medicare Part D: Drug Pricing and
Manufacturer Windfalls", in Committee on Oversight and Government Reform
<http://www.cmhda.org/breaking_news/documents/0807_Breaking%20News_Medicare%20Part%20D%20report%
20house%20of%20reps%207-08.pdf> [accessed 27 April 2011] 75
Majority Staff of the Committee on Oversight and Government Reform, "Medicare Part D: Drug Pricing and
Manufacturer Windfalls", in Committee on Oversight and Government Reform
<http://www.cmhda.org/breaking_news/documents/0807_Breaking%20News_Medicare%20Part%20D%20report%
20house%20of%20reps%207-08.pdf> [accessed 27 April 2011] 76
The Debt Reduction Task Force, "Restoring America's Future", in Bipartisan Policy Center
<http://www.bipartisanpolicy.org/sites/default/files/BPC%20FINAL%20REPORT%20FOR%20PRINTER%2002%
2028%2011.pdf> [accessed 27 April 2011]

Reinventing Health Care 27
save $100 billion over seven years.77 The other option to reduce drugs costs would be to allow
Medicare, rather than the private insurers, to negotiate for drugs. According to a 2008 report
issued by the Oversight and Government Reform Committee, if Medicare were able to
negotiate directly with the drug manufacturers for prescription drugs and achieved the prices
that Medicaid receives, the savings to the taxpayers could be $156 billion over 10 years.78
However, two bills introduced in 2007 that would have required the Secretary of HHS to
negotiate prescription drug prices were scored by the CBO as having “a negligible effect on
federal spending.”79 At this time, the effectiveness of allowing the Secretary to negotiate for
cheaper drugs is still being debated.
Increase Medicaid Efficiency
RECOMMENDATION 11 $2.6 BILLION IN SAVINGS OVER 10 YEARS80
►Eliminate double payments to states for Medicaid administrative costs.
The three major public aid programs—Temporary Assistance for Needy Families (TANF),
Supplemental Nutrition Assistance Program (SNAP), and Medicaid—share many similar
administrative functions (such as collecting information on a family’s income and assets). Prior
to the passage of welfare reform in 1996, all three of these programs reimbursed states for half
of most administrative costs. States usually charged all of their administrative costs to one
program, the AID to Families with Dependent Children (AFDC), which was replaced by TANF
block grants under 1996 welfare reform. Today, when TANF block grants are calculated, they
are based on past federal spending and often include common administrative costs for all three
programs.
However, even though Medicaid administrative costs are reimbursed through TANF, Medicaid
still reimburses states for Medicaid’s share of common administrative costs, essentially paying
states twice for Medicaid’s administrative costs. According to the CBO, limiting the federal
reimbursement for administrative costs for the Medicaid program to the amount not included
in the state’s TANF block grant would save $2.6 billion over 10 years.81 This adjustment would
simply end the current double payment being made to states for Medicaid administrative fees.
77
Congressional Budget Office, "Budget Options Volume 1: Health Care", in Congressional Budget Office
<http://www.cbo.gov/ftpdocs/99xx/doc9925/12-18-HealthOptions.pdf> [accessed 25 April 2011] 78
Majority Staff of the Committee on Oversight and Government Reform, "Medicare Part D: Drug Pricing and
Manufacturer Windfalls", in Committee on Oversight and Government Reform
<http://www.cmhda.org/breaking_news/documents/0807_Breaking%20News_Medicare%20Part%20D%20report%
20house%20of%20reps%207-08.pdf> [accessed 27 April 2011] 79
Peter R Orszag, "Letter to the Honorable Ron Wyden", in Congressional Budget Office
<http://www.cbo.gov/ftpdocs/79xx/doc7992/DrugPriceNegotiation.pdf> [accessed 27 April 2011] 80
The Sustainable Defense Task Force, "Debt, Deficits, and Defense: A Way Forward", in Commonwealth Institute
<http://www.comw.org/pda/fulltext/1006SDTFreport.pdf> [accessed 27 April 2011] 81
Congressional Budget Office, "Budget Options Volume 1: Health Care", in Congressional Budget Office
<http://www.cbo.gov/ftpdocs/99xx/doc9925/12-18-HealthOptions.pdf> [accessed 25 April 2011]

Reinventing Health Care 28
RECOMMENDATION 12 $12 BILLION IN SAVINGS OVER 10 YEARS82
►Allow enrollment of dual eligibles in Medicaid managed care.
Beginning in the 1990s, state Medicaid programs have done a commendable job of enrolling
low-income individuals in managed care programs, which improve access to care and reduce
health care spending. As of 2008, 71 percent of Medicaid beneficiaries had received some
services through managed care programs, and 65 percent were enrolled in full-risk plans.83
However, states have not been as successful in enrolling dual eligibles, those low-income
seniors and disabled individuals eligible for both Medicare and Medicaid. In 2008, only 12.6
percent of dual eligibles were enrolled in full-risk managed care plans.
Due to the numerous benefits of managed care plans, states support expanding enrollment but
often face administrative barriers to enrolling dual eligibles. The Debt Reduction Task Force
convened by the Bipartisan Policy Center has outlined two proposals to overcome these
barriers. One proposal would require the federal government to clearly outline criteria for
managed care programs, thereby allowing states to design their plans accordingly and receive
faster approval.84
The second proposal would alter the rules governing the upper payment limit—the aggregate
reimbursements made to different classes of providers—to incentivize providers to accept dual
eligibles in risk contract arrangements.85 The Bipartisan Policy Center estimates that
eliminating these barriers to enrollment of dual eligibles in managed care would save $5 billion
between 2012 and 2018.86 Similarly, the National Commission on Fiscal Responsibility and
Reform estimates that placing dual eligibles in Medicaid managed care would save $12 billion
over 10 years.87
82
National Commission on Fiscal Responsibility and Reform, in The Moment of Truth
<http://www.fiscalcommission.gov/sites/fiscalcommission.gov/files/documents/TheMomentofTruth12_1_2010.pdf>
[accessed 22 April 2011] 83
Kaiser Commission on Medicaid and the Uninsured, "Medicaid and Managed Care: Key Data, Trends, and
Issues", in Henry J. Kaiser Family Foundation <http://www.kff.org/medicaid/upload/8046.pdf> [accessed 28 April
2011] 84
The Debt Reduction Task Force, "Restoring America's Future", in Bipartisan Policy Center
<http://www.bipartisanpolicy.org/sites/default/files/BPC%20FINAL%20REPORT%20FOR%20PRINTER%2002%
2028%2011.pdf> [accessed 27 April 2011] 85
The Debt Reduction Task Force, "Restoring America's Future", in Bipartisan Policy Center
<http://www.bipartisanpolicy.org/sites/default/files/BPC%20FINAL%20REPORT%20FOR%20PRINTER%2002%
2028%2011.pdf> [accessed 27 April 2011] 86
The Debt Reduction Task Force, "Restoring America's Future", in Bipartisan Policy Center
<http://www.bipartisanpolicy.org/sites/default/files/BPC%20FINAL%20REPORT%20FOR%20PRINTER%2002%
2028%2011.pdf> [accessed 27 April 2011] 87
National Commission on Fiscal Responsibility and Reform, in The Moment of Truth
<http://www.fiscalcommission.gov/sites/fiscalcommission.gov/files/documents/TheMomentofTruth12_1_2010.pdf>
[accessed 22 April 2011]
Reinventing Health Care 29
Consider Other Options
The Affordable Care Act has laid a solid foundation for further cost-curbing mechanisms.
However, while the bill included many cost-containment provisions, several were not included
and warrant further examination. Outlined below are four reforms that have been proposed by
a number of health and budget experts. While there are pros and cons to each, the purpose of
listing them here is to advance the conversation about creative ways we can reduce the
growing costs of government health care entitlements.
These ideas may be viewed by some as controversial and the implementation of each should be
carefully considered, but difficult choices must be made in order to maintain solvency of our
health entitlements and ensure they continue to provide much needed care long into the
future.
OPTION 1 $124.8 BILLION IN SAVINGS OVER 10 YEARS88
►Gradually raise Medicare eligibility age to 67.
The age at which individuals are eligible to receive Medicare, currently 65, was set when
Medicare was created 46 years ago. Medicare was originally created to provide health care for
older individuals who could not find coverage in the private market. Those who support
gradually increasing the Medicare eligibility age tend to argue that because life expectancy has
risen since 1965 and will continue to rise, the
Medicare eligibility age should reflect this fact.
Longer life spans also mean longer participation in
the workforce, and older individuals who continue
to work may be able to obtain coverage through
their employers.
The CBO outlines an option that would gradually
raise the age of eligibility for Medicare by two
months every year beginning in 2014 until the eligibility age reached 67 in 2025, where it would
stay. Unlike Social Security, Medicare’s eligibility age is not already rising under current law.
This age increase would put Medicare benefits on par with Social Security, and the CBO
estimates the savings would total over $125 billion over 10 years.89
The concern with raising the eligibility age of Medicare is that those seniors without access to
Medicare may fall into a coverage gap and be unable to obtain affordable coverage. This
88
Congressional Budget Office, "Reducing the Deficit: Spending and Revenue Options", in Congressional Budget
Office <http://www.cbo.gov/ftpdocs/120xx/doc12085/03-10-ReducingTheDeficit.pdf> [accessed 27 April 2011] 89
Congressional Budget Office, "Reducing the Deficit: Spending and Revenue Options", in Congressional Budget
Office <http://www.cbo.gov/ftpdocs/120xx/doc12085/03-10-ReducingTheDeficit.pdf> [accessed 27 April 2011]
―Our priority must be
ensuring that older
Americans have access to
the high-quality, affordable
care they need.‖

Reinventing Health Care 30
problem could be solved as the new state-based insurance exchanges are set to provide
coverage for such individuals beginning in 2014. For example, we could make an increase in the
Medicare eligibility age contingent on the success of the exchanges in providing affordable care
to older Americans. If the exchanges do offer viable coverage options, then we should consider
raising the Medicare eligibility age. But our priority must be ensuring that older Americans
have access to the high-quality, affordable care they need. We should keep in mind a recent
report from The Kaiser Family Foundation that found that raising the Medicare eligibility age
would shift some costs to seniors and employers.
Any change in the Medicare eligibility age would have to be carefully constructed so as to not
impact access to affordable health care. Still, Medicare is a program designed to provide care
for the elderly. As our society changes and life expectancy grows, we have to honestly assess
such programs and responsibly alter them to fit a changing society.
OPTION 2 $241.2 BILLION IN SAVINGS OVER 10 YEARS90
►Gradually increase all Medicare Part B premiums from 25 to 35 percent.
Medicare Part B, which covers physicians and other outpatient services, was originally designed
to provide a premium that would cover 50 percent of the each enrollee’s costs. But because
medical spending grew faster than inflation, enrollees’ premium cost-sharing fell to below 25
percent. Eventually, it was locked in at 25 percent as part of the Balanced Budget Act of 1997.
The CBO has outlined a reform option that would gradually raise the basic Part B premium per
enrollee from 25 percent to 35 percent of costs over five years. The current income-related
premium sharing provisions would be maintained and the “hold-harmless” provision, which
protects seniors from a reduction in their net Social Security payment, would also be
maintained. The CBO estimates this option would save $241.2 billion over 10 years.91
While this would increase cost-sharing for most enrollees, 35 percent cost-sharing is still much
lower than the 50 percent envisioned in the original law. Additionally, approximately 18
percent of low-income enrollees eligible for Medicaid would be unaffected. The Bipartisan
Policy Center also supports a gradual increase in Part B premiums over five year.92
90
Congressional Budget Office, "Reducing the Deficit: Spending and Revenue Options", in Congressional Budget
Office <http://www.cbo.gov/ftpdocs/120xx/doc12085/03-10-ReducingTheDeficit.pdf> [accessed 27 April 2011] 91
Congressional Budget Office, "Reducing the Deficit: Spending and Revenue Options", in Congressional Budget
Office <http://www.cbo.gov/ftpdocs/120xx/doc12085/03-10-ReducingTheDeficit.pdf> [accessed 27 April 2011] 92
The Debt Reduction Task Force, "Restoring America's Future", in Bipartisan Policy Center
<http://www.bipartisanpolicy.org/sites/default/files/BPC%20FINAL%20REPORT%20FOR%20PRINTER%2002%
2028%2011.pdf> [accessed 27 April 2011]

Reinventing Health Care 31
OPTION 3 $26.4 BILLION IN SAVINGS OVER 10 YEARS93
►Modernize Medicare cost-sharing.
Medicare’s current benefit structure, which was first implemented in 1966, has failed to keep
pace with trends in the private sector (such as capping catastrophic illness costs and increasing
patient cost-sharing). The current benefit structure is also extremely complex, making it
difficult for Medicare beneficiaries to assess how much they are paying for each service and to
weigh the costs of care against the benefits.
For example, beneficiaries must pay very high deductibles for inpatient services, like hospital
stays, but pay much less for outpatient services, and have no cost-sharing for laboratory
services and home health care. This confusing system conceals the true costs of care from
beneficiaries and can cause overutilization of services and associated costs.
One solution for this overly complex system would be (1) to replace the current cost-sharing
requirements with a unified, annual deductible for all Part A (hospital and acute care) and Part
B (physician and outpatient services) services, (2) to establish a single coinsurance rate of 20
percent for all amounts above that deductible, and (3) to set an annual cap on total cost-
sharing.
According to the CBO, setting the combined deductible at $525 and pegging the catastrophic
limit at $5,250 (set to grow at the rate of Medicare costs per capita) would save $26.4 billion
over 10 years.94 Updating and simplifying the Medicare benefit structure in this way would
provide the following benefits: (1) Beneficiaries would be better protected from serious illness
costs by the catastrophic cap, (2) beneficiaries would have greater incentive to use services
more prudently because they would be more aware of the costs associated with their care, and
(3) the cost reductions in Medicare Part B would result in lower premiums for all enrollees.95
The Bipartisan Policy Center96 and the National Commission on Fiscal Responsibility and
Reform97 have also expressed support for such a redesign of Medicare’s benefit structure.
93
Congressional Budget Office, "Budget Options Volume 1: Health Care", in Congressional Budget Office
<http://www.cbo.gov/ftpdocs/99xx/doc9925/12-18-HealthOptions.pdf> [accessed 25 April 2011] 94
Congressional Budget Office, "Budget Options Volume 1: Health Care", in Congressional Budget Office
<http://www.cbo.gov/ftpdocs/99xx/doc9925/12-18-HealthOptions.pdf> [accessed 25 April 2011] 95
Congressional Budget Office, "Budget Options Volume 1: Health Care", in Congressional Budget Office
<http://www.cbo.gov/ftpdocs/99xx/doc9925/12-18-HealthOptions.pdf> [accessed 25 April 2011] 96
The Debt Reduction Task Force, "Restoring America's Future", in Bipartisan Policy Center
<http://www.bipartisanpolicy.org/sites/default/files/BPC%20FINAL%20REPORT%20FOR%20PRINTER%2002%
2028%2011.pdf> [accessed 27 April 2011] 97
National Commission on Fiscal Responsibility and Reform, in The Moment of Truth
<http://www.fiscalcommission.gov/sites/fiscalcommission.gov/files/documents/TheMomentofTruth12_1_2010.pdf>
[accessed 22 April 2011]

Reinventing Health Care 32
OPTION 4 $1.7 BILLION IN SAVINGS OVER 10 YEARS98
►Require Medicare carriers to inform physicians about peer profiling.
The Medicare Payment Advisory Commission (MedPAC) has found that a relatively small
number of Medicare providers account for a disproportionately high share of costs for the
program compared to their peers in the same specialty areas. These increased costs are
primarily due to their high use of expensive services. In order to identify and target these high
use providers, some health care plans have to create “peer profiles”, which compare the service
use rates of physicians in the same specialties. This information can be used to award bonus
payments to more efficient physicians and provide constructive feedback to physicians with
unusual practice patterns. Such feedback can apply downward pressure on the use of health
care services.
The CBO outlined an option that would require Medicare to develop peer profiles and reduce
payments to physicians whose use of resources was “excessively high relative to that of
peers.”99 Any comparison would be between physicians of the same specialty and market area,
and would adjust for differences in patients’ health status. The implementation of such a
comparison system would save $1.7 billion over 10 years and could greatly improve health
outcomes.100
Conclusion
Rising health care costs are at the root of our unsustainable deficits. The math is simple: In
recent years, federal health spending has grown by approximately two percentage points per
year faster than GDP while federal revenues have only kept pace with GDP. In other words, we
are spending more than we are taking in, and this pattern cannot be sustained in the long-term.
As a percentage of the economy, federal health care spending is expected to grow from 5.5
percent of GDP in 2011 to about 10 percent of GDP in 2035, and to more than 17 percent by
2080.101 Further, as a percentage of the federal budget, health care spending is projected to
rise from 23 percent today to 29 percent by 2020, crowding out other federal priorities.
Despite these ominous numbers, there are reasons to hopeful. Much of this cost growth is
from unnecessary care that does not contribute to health and simply drives up costs. We know
98
Congressional Budget Office, "Budget Options Volume 1: Health Care", in Congressional Budget Office
<http://www.cbo.gov/ftpdocs/99xx/doc9925/12-18-HealthOptions.pdf> [accessed 25 April 2011] 99
Congressional Budget Office, "Budget Options Volume 1: Health Care", in Congressional Budget Office
<http://www.cbo.gov/ftpdocs/99xx/doc9925/12-18-HealthOptions.pdf> [accessed 25 April 2011] 100
Congressional Budget Office, "Budget Options Volume 1: Health Care", in Congressional Budget Office
<http://www.cbo.gov/ftpdocs/99xx/doc9925/12-18-HealthOptions.pdf> [accessed 25 April 2011] 101
Congressional Budget Office, "The Long-Term Budget Outlook", in Congressional Budget Office
<http://www.cbo.gov/ftpdocs/115xx/doc11579/06-30-LTBO.pdf> [accessed 22 November 2010]
Reinventing Health Care 33
close to one third of medical care goes to tests and procedures that do not actually improve
health outcomes,102 and up to 98,000 people die each year from preventable medical errors.103
This unnecessary and sometimes harmful care is largely a byproduct of our payment and health
care delivery system, which rewards volume of care over value of care. Yet, as we have seen in
both the private and public sphere, there are solutions—delivery system reforms, for
example—that would significantly reduce costs and
improve care. For too long we have abided by the
rule that more is better, but empirical evidence
shows us that more is not always better and can in
fact be worse.
The federal government, which runs Medicare, the
largest and most influential health care provider in
the country, is in a unique position to lead the way in
delivery system reform. Medicare could help
transform our health care system from one that pays
for quantity to one that pays for quality. We can do this by adopting delivery system reforms
found to be effective, investing in comparative effectiveness research and using its findings to
determine coverage, and strengthening the Independent Payment Advisory Board to allow it to
make more comprehensive recommendations for all providers.
The Affordable Care Act laid the foundation for many of these reforms, but Congress and the
Administration must ensure that the cost-containment mechanisms in the Act are implemented
on schedule. Lastly, we must reexamine the rules governing Medicare and Medicaid and
update them to reflect today’s conditions. We have come a long way in reforming our health
care system and we have much further to go, but using the reforms outlined above, we can
significantly reduce costs and improve care at the same time.
102
Elliot S Fisher et al., "The Implications of Regional Variations in Medicare Spending, Part 1: The Content,
Quality, and Accessibility of Care", in Annals of Internal Medicine
<http://www.annals.org/content/138/4/273.full.pdf+html> [accessed 28 April 2011] 103
Institute of Medicine, "To Err is Human: Building a Safer Health System", in Institute of Medicine
<http://www.iom.edu/~/media/Files/Report%20Files/1999/To-Err-is-
Human/To%20Err%20is%20Human%201999%20%20report%20brief.pdf> [accessed 27 April 2011]
―For too long we have
abided by the rule that
more is better, but
empirical evidence shows
us that more is not
always better and can in
fact be worse.‖

Reinventing Defense Spending 34
REINVENTING DEFENSE SPENDING
OUR TWELVE KEY RECOMMENDATIONS
Realign Military Forces
►RECOMMENDATION 1: Reduce nuclear arsenal and infrastructure.
Potential Savings: $56 billion over 10 years
►RECOMMENDATION 2: Reduce troops in Europe and Asia.
Potential Savings: $80 billion over 10 years
►RECOMMENDATION 3: Reduce troops in Iraq and Afghanistan.
Potential Savings: $147 billion over 10 years
►RECOMMENDATION 4: Reduce Navy fleet.
Potential Savings: $43.6 billion over 10 years
Improve Department of Defense Efficiency
►RECOMMENDATION 5: Reduce military overhead.
Potential Savings: $100 billion over five years
►RECOMMENDATION 6: Double Secretary Gates’s cuts to contractors.
Potential Savings: $10.8 billion over six years
►RECOMMENDATION 7: Cut 10 percent of commercial activities.
Potential Savings: $54 billion over 10 years
Reform Defense Acquisition
►RECOMMENDATION 8: Reduce F-35 procurement.
Potential Savings: $27.1 billion over five years
►RECOMMENDATION 9: Cut the Expeditionary Fighting Vehicle.
Potential Savings: $8.5 billion over 10 years
►RECOMMENDATION 10: Delay KC-X Aerial Refueling Tanker procurement for five years.
Potential Savings: $9.9 billion over 10 years
►RECOMMENDATION 11: End procurement of the MV-22 Osprey.
Potential Savings: $11 billion over 10 years
►RECOMMENDATION 12: Reduce research and development costs.
Potential Savings: $80 billion over 10 years
Reinventing Defense Spending 35
Recommended Minimum Potential Savings
$600-700 billion over 10 years
Consider Other Options
► OPTION 1: Modernize DOD’s health care system.
Potential Savings: $60 billion over 10 years
Reinventing Defense Spending 36
Our Approach to Defense Spending Reform
We need to match today’s resources to today’s threats. Defense spending has doubled since
2001, growing to $719 billion in Fiscal Year 2010 dollars, its highest since World War II.104
Spending on defense has been the largest contributor to growth in discretionary spending,
accounting for 65 percent of discretionary spending growth since 2001.105 Much of this
increase can be attributed to the direct costs of the wars in Afghanistan and Iraq, which have
now surpassed $1 trillion. Still, nearly 37 percent of defense spending growth falls under the
“base” or “peacetime” military budget.106 As Admiral Mike Mullen has noted, rapidly increasing
defense budgets have meant that parts of the Department of Defense have never had to
practice fiscal responsibility. At close to 20 percent of federal outlays, defense spending cannot
be ignored as we look to put the budget on a sustainable path.107
Defense spending has traditionally been off limits when it comes to budget cuts. This is
evidenced by the President’s past decision to explicitly exclude all security-related programs
from the discretionary spending freeze. However, critics of unchecked defense spending have
begun to argue not only that our defense spending can be cut, but also that cuts must be made
in order to preserve our national security. As Admiral Mullen noted, “the most significant
threat to our national security is our debt.” A new report by the Sustainable Defense Task
Force, which includes security experts from across the political spectrum, finds that we could
save close to $1 trillion over the next 10 years without jeopardizing our national security, and
still maintain the global reach and capabilities.108 The report, Debt, Deficits and Defense: A Way
Forward, outlines a whole menu of reform options ranging from reducing oversized nuclear
stockpiles to cutting the force structure in Europe and Asia.
These reforms are merited, not only because we need to improve our long-term fiscal outlook,
but also because our threat environment has changed and must change how we spend in order
104
Gordon Adams, "Testimony before the House Committee on Oversight and Government Reform Subcommittee
on National Security and Foreign Affairs", in House Committee on Oversight and Government Affairs
<http://oversight.house.gov/images/stories/subcommittees/NS_Subcommittee/7.20.10_DoD_Budget/Adams_Statem
ent.pdf> [accessed 13 December 2010] 105
The Sustainable Defense Task Force, "Debt, Deficits, and Defense: A Way Forward", in Commonwealth Institute
<http://www.comw.org/pda/fulltext/1006SDTFreport.pdf> [accessed 27 April 2011] 106
The Sustainable Defense Task Force, "Debt, Deficits, and Defense: A Way Forward", in Commonwealth Institute
<http://www.comw.org/pda/fulltext/1006SDTFreport.pdf> [accessed 27 April 2011] 107
Gordon Adams, "Testimony before the House Committee on Oversight and Government Reform Subcommittee
on National Security and Foreign Affairs", in House Committee on Oversight and Government Affairs
<http://oversight.house.gov/images/stories/subcommittees/NS_Subcommittee/7.20.10_DoD_Budget/Adams_Statem
ent.pdf> [accessed 13 December 2010] 108
The Sustainable Defense Task Force, "Debt, Deficits, and Defense: A Way Forward", in Commonwealth Institute
<http://www.comw.org/pda/fulltext/1006SDTFreport.pdf> [accessed 27 April 2011] Note: Some savings estimates
in the Debt, Deficit & Defense have been questioned by budget experts. For an analysis of cost-savings estimates
see: Stephen Daggett, "Defense budget cuts proposed by the Sustainable Defense Task Force," Congressional
Research Service, 2010
Reinventing Defense Spending 37
to meet the new threats. 66 years have passed since the end of World War II and 22 since the
end of Cold War and yet the U.S. maintains a military focused on combating a traditional
adversary like the Soviet Union. Today, the U.S. spends more than two and half times as much
on its military as its current and potential adversaries, including Russia and China.109 In other
words, the U.S. could cut its defense spending in half and still be spending more than its current
and potential adversaries.
The U.S. spends billions maintaining its robust nuclear arsenal and stationing thousands of
troops at bases scattered across Europe and Asia. We have to question whether these
investments in traditional defense are contributing to U.S. national security in a world where
our chief enemy is a global network of extremists who find safe haven in ungoverned spaces
and failed states around the world. As Secretary of Defense Robert Gates pointed out in a 2010
speech, “We learned last year, you don’t necessarily
need a billion-dollar guided missile destroyer to chase
down and deal with a bunch of teenage pirates
wielding AK-47s and RPGs.”110 Other critics of defense
spending, such as Benjamin Friedman of the Cato
Institute, point out that fighting terrorists is “primarily
an intelligence and policing task,” rather than a task
that requires a traditional military mobilization.111 Osama bin Laden, for example, was killed in
a targeted Navy SEALs operation that relied on painstaking intelligence gathering. The military
assets most useful for this type of counterterrorism are relatively inexpensive and include
surveillance technologies, special operations forces, and drones.
New adversaries require a new strategy and a budget that reflects this reality. In the face of a
growing deficit and emerging threats, America’s national security plan should be reexamined
and reinvented. We need to start over and ask ourselves: If we created this program, weapon
system, or force structure today, what would it look like? How would we design it to meet
tomorrow’s needs? What do we need to keep America safe in tomorrow’s threat
environment?
Measured against this benchmark, many of our military expenditures seem necessary. As
Secretary Gates recently admitted, “very rarely is the *budget+ ever fundamentally re-
examined—either in terms of quantity, type, or whether it should be conducted at all. That
109
The Sustainable Defense Task Force, "Debt, Deficits, and Defense: A Way Forward", in Commonwealth Institute
<http://www.comw.org/pda/fulltext/1006SDTFreport.pdf> [accessed 27 April 2011] 110
Robert M Gates, "Remarks as Delivered by Secretary of Defense Robert M. Gates, Gaylord Convention Center,
National Harbor, Maryland, Monday, May 03, 2010", in Department of Defense
<http://www.defense.gov/Speeches/Speech.aspx?SpeechID=1460> [accessed 29 April 2011] 111
Benjamin H Friedman, "Testimony of Benjamin Friedman before the Subcommittee on National Security and
Foreign Affairs: Military Restraint and Defense Savings", in Cato Institute <http://www.cato.org/testimony/ct-bf-
07202010.html> [accessed 29 April 2011]
―New adversaries
require a new strategy
and a budget that fits
that reality.‖
Reinventing Defense Spending 38
needs to change.”112 We have lost sight of our core mission—keeping America safe—and have
taken on myriad other responsibilities. These other responsibilities have ultimately driven up
our costs without increasing our security.
With that in mind, we strongly support the nomination of Leon Panetta to succeed Mr. Gates as
Secretary of Defense. Mr. Panetta has an impressive background that includes a tour as
Director of the OMB, and we believe that he is the right choice to continue Mr. Gates’s record
of cost reduction, reform, and bold leadership at DOD. Outlined in this section are twelve
recommendations for reforming our security budget that we hope will be adopted by the
incoming Secretary.
112
Robert M Gates, "Remarks as Delivered by Secretary of Defense Robert M. Gates, Abilene, KS, Saturday, May
08, 2010", in Department of Defense <http://www.defense.gov/speeches/speech.aspx?speechid=1467> [accessed 29
April 2011]

Reinventing Defense Spending 39
OUR TWELVE KEY RECOMMENDATIONS
Realign Military Forces
RECOMMENDATION 1 $56 BILLION IN SAVINGS OVER 10 YEARS113
►Reduce U.S. nuclear arsenal and infrastructure.
The U.S. currently maintains 1,968 operationally-deployed strategic nuclear warheads and
5,000 active warheads in its stockpile.114 This nuclear stockpile was built up during the Cold
War, but in today’s security environment most experts agree that there is no need to maintain
a nuclear force of this magnitude.
Cuts in strategic nuclear offensive forces proposed by the Sustainable Defense Task Force could
save $30 billion over 10 years115 and provide more than enough deterrence.116 Such cuts would
reduce the U.S. nuclear warhead total to 1,050 (with 1000 launchers and 50 in store), cut
minuteman missiles to 160, allow for 7 Ohio-class SSBNs, retire the bomber leg of the triad, and
stop work on the Trident II missile.117 The Task Force on a Unified Security Budget (USB)
concurs that the U.S.’s nuclear arsenal should be reduced and calls for a steeper reduction to
600 warheads (with 400 in reserve), and the elimination of the Trident II nuclear missile.118
The Senate recently ratified the U.S.-Russia START treaty that requires both countries to reduce
each’s nuclear stockpiles to 1,550. However, many experts believe even these reduced
numbers are too high. David Hoffman, author of The Dead Hand: The Untold Story of the Cold
War Arms Race and Its Dangerous Legacy, argues that even under the new agreement we are
“left with excess—thousands of nuclear weapons that do not make us any safer.”119 Hoffman
further points out that even President Obama’s nuclear posture review acknowledged that we
113
The Sustainable Defense Task Force, "Debt, Deficits, and Defense: A Way Forward", in Commonwealth Institute
<http://www.comw.org/pda/fulltext/1006SDTFreport.pdf> [accessed 27 April 2011] 114
Department of Defense, "Fact Sheet: Increasing Transparency in the U.S. Nuclear Weapons Stockpile", in
Department of Defense <http://www.defense.gov/npr/docs/10-05-
03_fact_sheet_us_nuclear_transparency__final_w_date.pdf> [accessed 29 April 2011]. 115
Stephen Daggett, "Defense budget cuts proposed by the Sustainable Defense Task Force," Congressional
Research Service, 2010 116
The Sustainable Defense Task Force, "Debt, Deficits, and Defense: A Way Forward", in Commonwealth Institute
<http://www.comw.org/pda/fulltext/1006SDTFreport.pdf> [accessed 27 April 2011] 117
The Sustainable Defense Task Force, "Debt, Deficits, and Defense: A Way Forward", in Commonwealth Institute
<http://www.comw.org/pda/fulltext/1006SDTFreport.pdf> [accessed 27 April 2011] 118
Institute for Policy Studies, "A Unified Security Budget for the United States, FY 2011", in Institute for Policy
Studies <http://www.ips-dc.org/files/2361/USB_FY2011.pdf> [accessed 29 April 2011] 119
David E Hoffman, "Despite new START, the U.S. and Russia still have too many nuclear weapons"
<http://www.washingtonpost.com/wp-dyn/content/article/2010/04/09/AR2010040903260.html> [accessed 27 April
2011]
Reinventing Defense Spending 40
are only maintaining our current level of nuclear weapons because we don’t want to go any
lower than Russia. 120
Some security experts agree that U.S. nuclear forces could be significantly reduced without
damaging our security. In 2008, George Shultz, William Perry, Henry Kissinger, and Sam Nunn
wrote a joint op-ed in the Wall Street Journal in which they argued the U.S. could vastly reduce
its nuclear stockpile without harming national security.121 Other security experts, such Ivo
Daalder of the Brookings Institute and Jan Lodal, a senior DOD and White House official under
Presidents Nixon, Ford and Clinton, similarly posit America’s nuclear stockpile could be reduced
to no more than 1,000 total weapons.122 Further, in a recent article, the Air Force Strategic
Plans and Policy Division and two Air Force War College professors agreed that 311 warheads
are sufficient to achieve deterrence.123 China, the United Kingdom and France all have
similarly-sized nuclear arsenals ranging from 200-400 warheads. While the ranges vary, the
consensus remains that the U.S. can maintain its security with significantly fewer nuclear
weapons.
A reduction in our nuclear arsenal would also allow for a reduction in our nuclear
infrastructure. Three new nuclear facilities are currently being built. Yet a significant reduction
in our nuclear arsenal would reduce the need for these new facilities. Further, reducing our
stockpile would facilitate a reduction in warhead-related research and development. Finally,
the need for a planned B61 bomb refurbishment study is unclear, especially given discussions
with allies of eliminating this weapon.
Forgoing construction of the three nuclear facilities, increasing efficiency within warhead-
related R&D, and canceling the B61 refurbishment study could save an additional $26 billion
over 10 years.124 The current U.S. nuclear arsenal and infrastructure far exceed what is needed
to deter a nuclear attack on the U.S. or our allies, and could be reduced to achieve significant
savings without imperiling our national security.
120
David E Hoffman, "Despite new START, the U.S. and Russia still have too many nuclear weapons"
<http://www.washingtonpost.com/wp-dyn/content/article/2010/04/09/AR2010040903260.html> [accessed 27 April
2011] 121
George P Schultz et al., "Toward a Nuclear-Free World", in Nuclear Security Project
<http://www.nuclearsecurityproject.org/atf/cf/%7B1FCE2821-C31C-4560-BEC1-
BB4BB58B54D9%7D/TOWARD_A_NUCLEAR_FREE_WORLD_OPED_011508.PDF> [accessed 28 April
2011] 122
Ivo Daalder and Jan Lodal, “The Logic of Zero,” in Foreign Affairs. November/December 2008. 123
James Wood Forsyth Jr., B Chance Saltzman and Gary Schaub Jr., "Remembrance of Things Past: The Enduring
Value of Nuclear Weapons", in Strategic Studies Quarterly
<http://www.au.af.mil/au/ssq/2010/spring/forsythsaltzmanschaub.pdf> [accessed 29 April 2011] 124
The Sustainable Defense Task Force, "Debt, Deficits, and Defense: A Way Forward", in Commonwealth Institute
<http://www.comw.org/pda/fulltext/1006SDTFreport.pdf> [accessed 27 April 2011]

Reinventing Defense Spending 41
RECOMMENDATION 2 $80 BILLION IN SAVINGS OVER 10 YEARS125, 126
►Alter force structure: reduce U.S. troops in Europe and Asia.
As of September 30, 2010, close to 300,000 active duty U.S. military personnel were serving
overseas, with approximately 125,000 personnel in Europe and Asia.127 America’s presence in
Europe and Asia was originally designed to deter opponents, support our allies, and intervene
in the aftermath of World War II and during the Cold War.
However, Benjamin Friedman of the Cato Institute and other critics argue we no longer face the
threats of the Cold War, and that Europe, with a bigger combined economy than the U.S., is
capable of defending itself.128 Other critics of America’s force structure abroad, such as Doug
Bandow, former special assistant to President Reagan, question why the U.S. maintains over
30,000 U.S. troops in Japan 66 years after World War II and 22 after the Cold War ended.129
Japan is no longer a threat and, with its stable economy, should be able to defend itself.130
Further, should a conflict arise, the U.S. has unparalleled capacity and flexibility to rapidly
deploy troops and military assets. The Cato Institute argues that forces can be brought in by
sea to deter and defeat adversaries as an alternative to maintaining permanent land bases.131
This means that we could significantly reduce the number of troops at foreign bases,
particularly in Europe and Asia.
Reducing U.S. troops in Europe and Asia by 50,000 could save $80 billion over the next 10 years,
according to the Sustainable Defense Task Force.132 The National Commission on Fiscal
Responsibility and Reform also supports reducing the numbers of troops in Europe and Asia by
one-third,133 and the Bipartisan Policy Center supports ‘significant’ reductions in U.S. troops in
125
The Sustainable Defense Task Force, "Debt, Deficits, and Defense: A Way Forward", in Commonwealth Institute
<http://www.comw.org/pda/fulltext/1006SDTFreport.pdf> [accessed 27 April 2011] 126
This cost estimate includes reductions in associated costs from operations, procurement and construction. For
more on this cost estimate see: Stephen Daggett, "Defense budget cuts proposed by the Sustainable Defense Task
Force," Congressional Research Service, 2010 127
Department of Defense, "Active Duty Military Personnel Strengths by Regional Area and by Country"
<http://siadapp.dmdc.osd.mil/personnel/MILITARY/history/hst1009.pdf> [accessed 27 April 2011] 128
Benjamin H Friedman, "Testimony of Benjamin Friedman before the Subcommittee on National Security and
Foreign Affairs: Military Restraint and Defense Savings", in Cato Institute <http://www.cato.org/testimony/ct-bf-
07202010.html> [accessed 29 April 2011] 129
Doug Bandow, "Japan Can Defend Itself" <http://nationalinterest.org/print/commentary/japan-can-defend-itself-
3594> [accessed 27 April 2011] 130
Doug Bandow, "Japan Can Defend Itself" <http://nationalinterest.org/print/commentary/japan-can-defend-itself-
3594> [accessed 27 April 2011] 131
Benjamin H Friedman and Christopher Preble, "Budgetary Savings from Military Restraint", in Cato Institute
<http://www.cato.org/pubs/pas/PA667.pdf> [accessed 27 April 2011] 132
The Sustainable Defense Task Force, "Debt, Deficits, and Defense: A Way Forward", in Commonwealth Institute
<http://www.comw.org/pda/fulltext/1006SDTFreport.pdf> [accessed 27 April 2011] 133
National Commission on Fiscal Responsibility and Reform, "$200 Billion in Illustrative Savings", in National
Commission on Fiscal Responsibility and Reform
<http://www.fiscalcommission.gov/sites/fiscalcommission.gov/files/documents/Illustrative_List_11.10.2010.pdf>
[accessed 27 April 2011]

Reinventing Defense Spending 42
Asia and Europe.134 The rationale that once justified the presence of significant American bases
and troops abroad is growing weaker each year.
RECOMMENDATION 3 $147 BILLION IN SAVINGS OVER 10 YEARS135, 136
►Alter force structure: reduce U.S. troops in Afghanistan and Iraq.
A growing number of critics argue that our extended, large-scale counterinsurgency campaigns
in Iraq and Afghanistan are strategically unwise and that there are better, more cost-effective
ways to fight terrorism.137 Foreign policy experts, such as Gilles Dorronsoro at the Carnegie
Endowment for International Peace, believe the U.S. strategy in Afghanistan is “not working,”
and that General Petraeus should scale down the current offensive in favor of a lighter military
presence on the ground.138 These calls for troop reduction in Afghanistan and Iraq have
become more pronounced now that Osama bin Laden has been killed.139
Other critics, such as Benjamin Friedman of the Cato Institute, point out that the U.S.’s historic
attempts to “reorder these nations with military occupations [tend] to fail, despite great cost in
blood and treasure”, and that, in fact, these long-term occupations can cause the very terrorism
the occupiers are attempting to end.140
Research conducted by the RAND Corporation supports the idea that military force is not the
most effective means to combat terrorism. A RAND research brief, “How Terror Groups End,”
found that of 648 terror groups studied, most (40 percent) were eliminated by local police and
intelligence agencies or dissolved through political reconciliation (43 percent), and in fact only
seven percent of terror groups studied were ended because of military force.141 Mounting
134
The Debt Reduction Task Force, "Restoring America's Future", in Bipartisan Policy Center
<http://www.bipartisanpolicy.org/sites/default/files/BPC%20FINAL%20REPORT%20FOR%20PRINTER%2002%
2028%2011.pdf> [accessed 27 April 2011] 135
The Debt Reduction Task Force, "Restoring America's Future", in Bipartisan Policy Center
<http://www.bipartisanpolicy.org/sites/default/files/BPC%20FINAL%20REPORT%20FOR%20PRINTER%2002%
2028%2011.pdf> [accessed 27 April 2011] 136
This cost estimate includes reductions in associated costs from operations, procurement and construction. For
more on this cost estimate see: Stephen Daggett, "Defense budget cuts proposed by the Sustainable Defense Task
Force," Congressional Research Service, 2010 137
Carl J Conetta, "Testimony: Rethinking our Defense Budget: Achieving National Security through Sustainable
Spending", in Commonwealth Institute <http://www.comw.org/pda/fulltext/Conetta_testimony_07-20-10.pdf>
[accessed 29 April 2011] 138
Gilles Dorronsoro, "Change Course Now", in New York Times
<http://www.carnegieendowment.org/publications/index.cfm?fa=view&id=41055> [accessed 27 April 2011] 139
Stephanie Condon, "Calls for getting out of Afghanistan grow after bin Laden's death", in CBS News
<http://www.cbsnews.com/8301-503544_162-20059841-503544.html#> [accessed 5 May 2011] 140
Benjamin H Friedman, "Testimony of Benjamin Friedman before the Subcommittee on National Security and
Foreign Affairs: Military Restraint and Defense Savings", in Cato Institute <http://www.cato.org/testimony/ct-bf-
07202010.html> [accessed 29 April 2011] 141
RAND Corporation, "How Terrorist Groups End: Implications for Countering al Qa'ida", in RAND Corporation
<http://www.rand.org/content/dam/rand/pubs/research_briefs/2008/RAND_RB9351.pdf> [accessed 27 April 2011]
Reinventing Defense Spending 43
evidence indicates that large-scale military operations are not only costly, but also are not the
best tool to combat terrorists.
The U.S. should wind down its ground forces in Iraq and Afghanistan. Cutting Army end strength
from 547,400 to 482,400, reducing Marine Corp end strength by 22,000, and reducing Navy
support personnel by 9,000, would save $147 billion over 10 years while still maintaining a
robust force structure.142 Drawing down troop levels as the wars in Iraq and Afghanistan come
to a close is supported by groups including the Bipartisan Policy Center, and is a logical
response to changing conditions on the ground.143
RECOMMENDATION 4 $43.6 BILLION IN SAVINGS OVER 10 YEARS144
►Alter force structure: reduce U.S. Navy fleet.
In addition to reducing ground forces, the U.S. could also reduce its sea and air power without
harming national security. The U.S. Navy possesses far more firepower than the next 20 largest
navies combined, and many of those navies are our strong allies.145
Some critics of reducing our naval fleet cite China’s military expansion as justification for
maintaining our current naval force structure. However, while we must remain cognizant of
China’s military ambitions, as China expert Drew Thompson points out, “Many experts … agree
that China today simply does not have the military capability to challenge the United States in
the Pacific, though its modernization program has increased its ability to engage the United
States close to Chinese shores.”146 China’s recent blue-water investments merit serious
consideration but do not justify the maintenance of a legacy force structure designed to
confront a peer adversary in open water conflict or nuclear war. Instead, these investments
provide further urgency to adjust our force structure to be more nimble in order to address
challenges China and other powers may present in the future: disruption of shipping lanes,
aggressive overseas basing, and littoral conflict.
According to the Sustainable Defense Task Force, the U.S. Navy battle fleet could shrink from
286 ships to 230 while still remaining superior to all other navies in the world.147 This option
would cut two aircraft carriers and their associated air wings, require the Navy to buy 60 fewer
142
The Sustainable Defense Task Force, "Debt, Deficits, and Defense: A Way Forward", in Commonwealth Institute
<http://www.comw.org/pda/fulltext/1006SDTFreport.pdf> [accessed 27 April 2011] 143
The Debt Reduction Task Force, "Restoring America's Future", in Bipartisan Policy Center
<http://www.bipartisanpolicy.org/sites/default/files/BPC%20FINAL%20REPORT%20FOR%20PRINTER%2002%
2028%2011.pdf> [accessed 27 April 2011] 144
Stephen Daggett, "E-mail to staff," Congressional Research Service, 2011 145
The Sustainable Defense Task Force, "Debt, Deficits, and Defense: A Way Forward", in Commonwealth Institute
<http://www.comw.org/pda/fulltext/1006SDTFreport.pdf> [accessed 27 April 2011] 146
Drew Thompson, "www.foreignpolicy.com"
<http://www.foreignpolicy.com/articles/2010/02/22/think_again_chinas_military> [accessed 10 May 2011] 147
The Sustainable Defense Task Force, "Debt, Deficits, and Defense: A Way Forward", in Commonwealth Institute
<http://www.comw.org/pda/fulltext/1006SDTFreport.pdf> [accessed 27 April 2011].

Reinventing Defense Spending 44
F-35s, and cut seven nuclear missile subs and twelve attack subs. These procurement
reductions would save $102 billion over 10 years, with another $24.6 billion in savings from
associated operations, maintenance, and personnel costs.
The Sustainable Defense Task Force also recommends a more modest approach, which we
support here, that would retire two Navy aircraft carriers and two naval air wings for savings of
$50 billion over 10 years.148 These savings come from cutting two aircraft carriers, 60 F-35’s, 10
E-2D Advanced Hawkeye aircrafts, and reducing 11,000 associated naval personnel.
Recommendation eight addresses reducing F-35s, so if we extract the savings from cutting F-
35s to avoid duplication, the savings would total $43.6 billion instead of $50 billion.149
Reform groups such as the Sustainable Defense Task Force are not alone in their calls for
reductions in the U.S. Navy. Secretary Gates questioned naval spending in a speech last year,
asking, “Do we really need 11 carrier strike groups for another 30 years when no other country
has more than one?”150 According to the Task Force, all naval requirements of our recent wars
could have been met with the 230-ship option. 151 To that end, retiring two Navy aircraft
carriers (along with the associated naval air wings and personnel) would not only reduce
unnecessary costs, but would still enable the U.S. to maintain its superiority at sea.
Improve Department of Defense Efficiency
RECOMMENDATION 5 $100 BILLION IN SAVINGS OVER FIVE YEARS152, 153
►Reduce military overhead.
By some measures, overhead costs comprise approximately 40 percent of the defense
budget.154 Close to 10 years ago, Secretary Rumsfeld complained that there were 17 layers of
148
The Sustainable Defense Task Force, "Debt, Deficits, and Defense: A Way Forward", in Commonwealth Institute
<http://www.comw.org/pda/fulltext/1006SDTFreport.pdf> [accessed 27 April 2011] 149
Daggett, Stephen. Specialist in Defense Policy and Budgets, Congressional Research Service. Cost estimates are
from email to staff dated March 30, 2011. 150
Robert M Gates, "Remarks as Delivered by Secretary of Defense Robert M. Gates, Gaylord Convention Center,
National Harbor, Maryland, Monday, May 03, 2010", in Department of Defense
<http://www.defense.gov/Speeches/Speech.aspx?SpeechID=1460> [accessed 29 April 2011] 151
The Sustainable Defense Task Force, "Debt, Deficits, and Defense: A Way Forward", in Commonwealth Institute
<http://www.comw.org/pda/fulltext/1006SDTFreport.pdf> [accessed 27 April 2011] 152
Robert M Gates, "Statement on Department Budget and Efficiencies", in Department of Defense
<http://www.defense.gov/speeches/speech.aspx?speechid=1527> [accessed 27 April 2011] 153
Although this recommendation is likely to continue producing savings in the second five years, we opted to err
on the side of caution and not increase this to a 10 year estimate. 154
Robert M Gates, "Remarks as Delivered by Secretary of Defense Robert M. Gates, Gaylord Convention Center,
National Harbor, Maryland, Monday, May 03, 2010", in Department of Defense
<http://www.defense.gov/Speeches/Speech.aspx?SpeechID=1460> [accessed 29 April 2011]
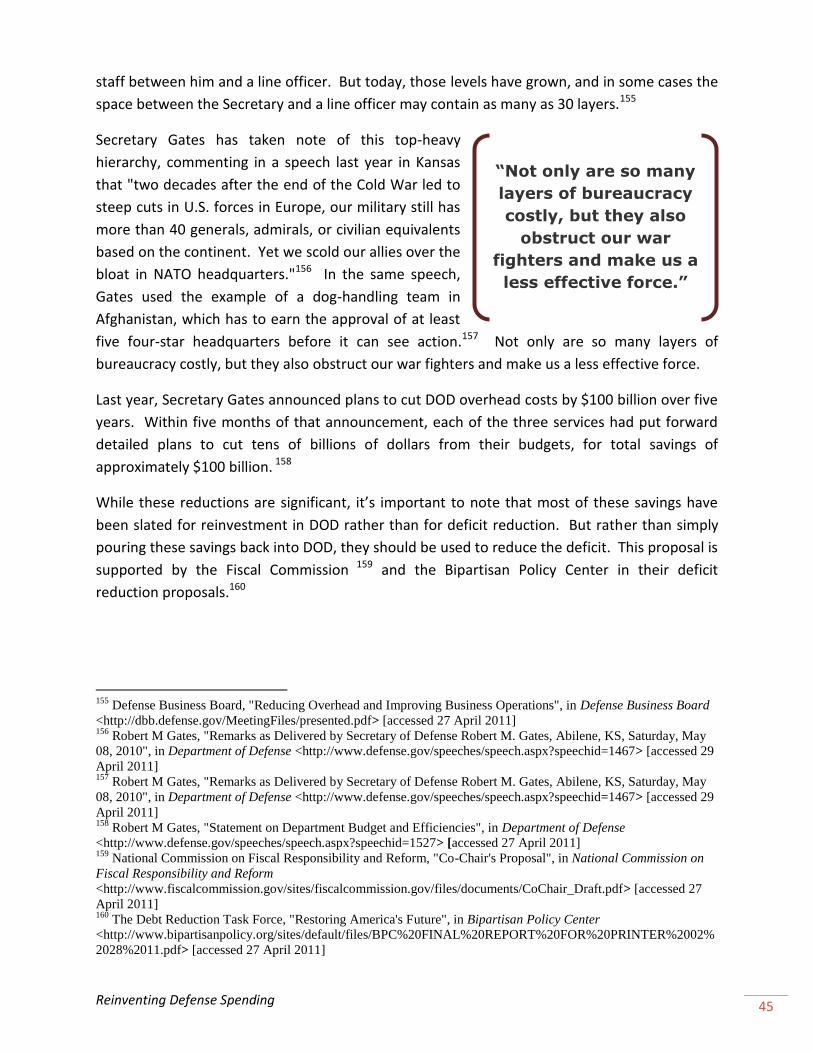
Reinventing Defense Spending 45
staff between him and a line officer. But today, those levels have grown, and in some cases the
space between the Secretary and a line officer may contain as many as 30 layers.155
Secretary Gates has taken note of this top-heavy
hierarchy, commenting in a speech last year in Kansas
that "two decades after the end of the Cold War led to
steep cuts in U.S. forces in Europe, our military still has
more than 40 generals, admirals, or civilian equivalents
based on the continent. Yet we scold our allies over the
bloat in NATO headquarters."156 In the same speech,
Gates used the example of a dog-handling team in
Afghanistan, which has to earn the approval of at least
five four-star headquarters before it can see action.157 Not only are so many layers of
bureaucracy costly, but they also obstruct our war fighters and make us a less effective force.
Last year, Secretary Gates announced plans to cut DOD overhead costs by $100 billion over five
years. Within five months of that announcement, each of the three services had put forward
detailed plans to cut tens of billions of dollars from their budgets, for total savings of
approximately $100 billion. 158
While these reductions are significant, it’s important to note that most of these savings have
been slated for reinvestment in DOD rather than for deficit reduction. But rather than simply
pouring these savings back into DOD, they should be used to reduce the deficit. This proposal is
supported by the Fiscal Commission 159 and the Bipartisan Policy Center in their deficit
reduction proposals.160
155
Defense Business Board, "Reducing Overhead and Improving Business Operations", in Defense Business Board
<http://dbb.defense.gov/MeetingFiles/presented.pdf> [accessed 27 April 2011] 156
Robert M Gates, "Remarks as Delivered by Secretary of Defense Robert M. Gates, Abilene, KS, Saturday, May
08, 2010", in Department of Defense <http://www.defense.gov/speeches/speech.aspx?speechid=1467> [accessed 29
April 2011] 157
Robert M Gates, "Remarks as Delivered by Secretary of Defense Robert M. Gates, Abilene, KS, Saturday, May
08, 2010", in Department of Defense <http://www.defense.gov/speeches/speech.aspx?speechid=1467> [accessed 29
April 2011] 158
Robert M Gates, "Statement on Department Budget and Efficiencies", in Department of Defense
<http://www.defense.gov/speeches/speech.aspx?speechid=1527> [accessed 27 April 2011] 159
National Commission on Fiscal Responsibility and Reform, "Co-Chair's Proposal", in National Commission on
Fiscal Responsibility and Reform
<http://www.fiscalcommission.gov/sites/fiscalcommission.gov/files/documents/CoChair_Draft.pdf> [accessed 27
April 2011] 160
The Debt Reduction Task Force, "Restoring America's Future", in Bipartisan Policy Center
<http://www.bipartisanpolicy.org/sites/default/files/BPC%20FINAL%20REPORT%20FOR%20PRINTER%2002%
2028%2011.pdf> [accessed 27 April 2011]
―Not only are so many
layers of bureaucracy
costly, but they also
obstruct our war
fighters and make us a
less effective force.‖

Reinventing Defense Spending 46
RECOMMENDATION 6 $10.8 BILLION IN SAVINGS OVER FIVE YEARS161, 162
►Double Secretary Gates’s cuts to defense contractors.
In a recent speech at the Pentagon, Secretary Gates announced plans to cut service contracting
by 10 percent over three years, for savings of $6 billion over five years.163 Gates acknowledged
that DOD has “become far too reliant on contractors to perform functions that should either be
done by full-time employees or, in some cases, to staff activities that could—and should—be
discontinued.”164 These service contractors support the work of DOD personnel, performing
services ranging from mowing the grass to repairing weapons systems. The number of service
contractors employed by DOD has tripled over the last decade, and now costs DOD $20 billion
of its $154 billion contractor budget.165
The Fiscal Commission endorses the cuts proposed by Secretary Gates, estimating the savings
at $5.4 billion over five years. They go further, however, and recommend doubling those cuts,
thereby reducing the number of support contractor staff from 67,000 to 30,600, for total
combined savings of $10.8 billion over five years.166
161
National Commission on Fiscal Responsibility and Reform, "$200 Billion in Illustrative Savings", in National
Commission on Fiscal Responsibility and Reform
<http://www.fiscalcommission.gov/sites/fiscalcommission.gov/files/documents/Illustrative_List_11.10.2010.pdf>
[accessed 27 April 2011] 162
Although this recommendation is likely to continue producing savings in the second five years, we opted to err
on the side of caution and not increase this to a 10 year estimate. 163
Robert M Gates, "Statement on Department Budget and Efficiencies", in Department of Defense
<http://www.defense.gov/speeches/speech.aspx?speechid=1527> [accessed 27 April 2011] & Stephen Daggett, "E-
mail to staff," Congressional Research Service, 2011. Annual savings are approximately $1.3 billion when fully
phased in, estimating 8,000 positions at 160,000 per position per year. 164
Robert M Gates, "Statement on Department Budget and Efficiencies", in Department of Defense
<http://www.defense.gov/speeches/speech.aspx?speechid=1527> [accessed 27 April 2011] 165
National Commission on Fiscal Responsibility and Reform, "$200 Billion in Illustrative Savings", in National
Commission on Fiscal Responsibility and Reform
<http://www.fiscalcommission.gov/sites/fiscalcommission.gov/files/documents/Illustrative_List_11.10.2010.pdf>
[accessed 27 April 2011] 166
National Commission on Fiscal Responsibility and Reform, "$200 Billion in Illustrative Savings", in National
Commission on Fiscal Responsibility and Reform
<http://www.fiscalcommission.gov/sites/fiscalcommission.gov/files/documents/Illustrative_List_11.10.2010.pdf>
[accessed 27 April 2011]
Reinventing Defense Spending 47
RECOMMENDATION 7 $54 BILLION IN SAVINGS OVER 10 YEARS167, 168
►Eliminate 10 percent of commercial activities positions.
The Defense Business Board (DBB), a group of Secretary-appointed experts tasked with
recommending reforms to DOD, released a report last year outlining a number of efficiencies
and reforms that should be pursued by DOD. According to the DBB report, “there are
substantial gains yet to be made” within DOD by making them “more cost-effective through:
business processes, consolidation of overhead function, elimination, and privatization.”169
One of the most glaring inefficiencies highlighted by the DBB is the fact that too many of our
most expensive, active duty military personnel are doing inherently governmental, commercial
activities that should be done by DOD civilians.170 Having active duty military personnel
perform commercial tasks drives up costs and prevents active duty personnel from being
deployed or training to be deployed. Approximately 340,000 active duty military are
performing commercial activities, costing approximately $54 billion per year, or eight percent of
the Fiscal Year 2010 base budget.171
Eliminating just 10 percent of commercial activities positions could save $5.4 billion annually,
according to the DBB.172 The Fiscal Commission, in its illustrative savings reports, outlines a
similar option that would standardize the portion of military personnel performing commercial
activities, lower the number of military performing these activities, and shift many commercial
positions to less costly civilian personnel. These steps would save $5.4 billion in 2015,
according to the Fiscal Commission.173
167
National Commission on Fiscal Responsibility and Reform, "$200 Billion in Illustrative Savings", in National
Commission on Fiscal Responsibility and Reform
<http://www.fiscalcommission.gov/sites/fiscalcommission.gov/files/documents/Illustrative_List_11.10.2010.pdf>
[accessed 27 April 2011] 168
We assume consistent annual savings over the next 10 years. However, it’s more likely that the savings would be
smaller in earlier years and then increase with inflation, adding up to a total of approximately $54 billion over 10
years. 169
Defense Business Board, "Reducing Overhead and Improving Business Operations", in Defense Business Board
<http://dbb.defense.gov/MeetingFiles/presented.pdf> [accessed 27 April 2011] 170
Defense Business Board, "Reducing Overhead and Improving Business Operations", in Defense Business Board
<http://dbb.defense.gov/MeetingFiles/presented.pdf> [accessed 27 April 2011] 171
Defense Business Board, "Reducing Overhead and Improving Business Operations", in Defense Business Board
<http://dbb.defense.gov/MeetingFiles/presented.pdf> [accessed 27 April 2011]
172
Defense Business Board, "Reducing Overhead and Improving Business Operations", in Defense
Business Board <http://dbb.defense.gov/MeetingFiles/presented.pdf> [accessed 27 April 2011] 173
National Commission on Fiscal Responsibility and Reform, "$200 Billion in Illustrative Savings", in National
Commission on Fiscal Responsibility and Reform
<http://www.fiscalcommission.gov/sites/fiscalcommission.gov/files/documents/Illustrative_List_11.10.2010.pdf>
[accessed 27 April 2011]

Reinventing Defense Spending 48
Reform Defense Acquisition
The defense acquisition process has long been plagued by delays and cost overruns. In 2008,
the Government Accountability Office released a report revealing the cost of DOD’s Fiscal Year
2007 weapons portfolio was $300 billion over initial estimates.174 In an effort to address the
serious flaws in the acquisition process, Congress recently passed the Weapons Systems
Acquisition Reform Act of 2009, aimed at reducing inefficiencies in the acquisition process.
While procurement reform can yield significant savings, the bigger savings must come from a
reduction in what we purchase. It’s time to reexamine our defense budget and determine what
is needed to keep us safe and what is in there simply because of inertia. Many items in DOD’s
weapons budget could be reduced or cancelled without endangering America’s security or
military superiority.
RECOMMENDATION 8 $27.1 BILLION IN SAVINGS OVER FIVE YEARS175, 176
►Cut Marine Corps F-35 and substitute half of the Air Force and Navy F-35
planned buys with F-16 and F/A-18Es.
The F-35 Joint Strike Fighter is by far DOD’s most
expensive weapons program. While radar-evading
stealth fighters are desirable from a strategic
perspective, the F-35 program is four years behind
schedule and more than 50 percent over budget.177 Its
critics charge that even if it were to perform as
promised, its capabilities would substantially outmatch
those of our rivals.
A number of critics have called for the complete
cancelation of the F-35, but here we outline a proposal put forward by the Fiscal Commission
that would cancel the Marine Corps version of the F-35 and reduce the number of F-35s
174
Michael J Sullivan, "Defense Acquisitions: Fundamental Changes are Needed to Improve Weapon Program
Outcomes", in Government Accountability Office <http://www.gao.gov/new.items/d081159t.pdf> [accessed 29 April
2011] 175
National Commission on Fiscal Responsibility and Reform, "$200 Billion in Illustrative Savings", in National
Commission on Fiscal Responsibility and Reform
<http://www.fiscalcommission.gov/sites/fiscalcommission.gov/files/documents/Illustrative_List_11.10.2010.pdf>
[accessed 27 April 2011] 176
Given uncertainty about the second five years, we opted to keep this as a five year estimate. 177
Michael J Sullivan, "Significant Challenges Remain as DOD Restructures Program", in Committee on Armed
Services,U.S. Senate <http://armed-services.senate.gov/statemnt/2010/03%20March/Sullivan%2003-11-10.pdf>
[accessed 27 April 2011]
―While procurement
reform can yield
significant savings, the
bigger savings must
come from a reduction
in what we purchase.‖
Reinventing Defense Spending 49
planned for the Air Force and Navy.178 The Marine Corps version, the Fiscal Commission argues,
can be cut due to “technical problems, cost overruns, schedule delays, and the adoption of the
services of joint combat support in current wartime operations.”179 Secretary Gates has also
voiced serious concerns about the Marine Corps F-35, stating in a recent speech that the
variant is “experiencing significant testing problems” and that it will be put on a two-year
probation period and cancelled if improvements are not made.180
Cutting the program now, as recommended by the Fiscal Commission in its illustrative savings,
would save $17.6 billion for fiscal years 2012-2015.181 The Fiscal Commission proposal also calls
for half of the planned Air Force and Navy F-35s to be replaced with the significantly less
expensive F-16 and F/A-18E. Each F-35 is estimated to cost $133 million, while the unit price of
an F-16 is $40 million and an F-18E is $80 million. This option would save $9.5 billion for fiscal
years 2011-2015, for a combined savings total of $27.1 billion over five years.182
RECOMMENDATION 9 $8.5 BILLION IN SAVINGS OVER 10 YEARS183, 184
►Cut the Expeditionary Fighting Vehicle.
On January 6, 2011, Secretary Gates announced plans to cut the Expeditionary Fighting Vehicle
(EFV).185 While Gates acknowledged that the EFV has significant advantages, he also explained
that fully executing the EFV would “essentially swallow the entire Marine vehicle budget.”186
The EFV is five years behind schedule and each unit is expected to cost $24 million, a 176
178
National Commission on Fiscal Responsibility and Reform, "$200 Billion in Illustrative Savings", in National
Commission on Fiscal Responsibility and Reform
<http://www.fiscalcommission.gov/sites/fiscalcommission.gov/files/documents/Illustrative_List_11.10.2010.pdf>
[accessed 27 April 2011] 179
National Commission on Fiscal Responsibility and Reform, "$200 Billion in Illustrative Savings", in National
Commission on Fiscal Responsibility and Reform
<http://www.fiscalcommission.gov/sites/fiscalcommission.gov/files/documents/Illustrative_List_11.10.2010.pdf>
[accessed 27 April 2011] 180
Robert M Gates, "Statement on Department Budget and Efficiencies", in Department of Defense
<http://www.defense.gov/speeches/speech.aspx?speechid=1527> [accessed 27 April 2011] 181
National Commission on Fiscal Responsibility and Reform, "$200 Billion in Illustrative Savings", in National
Commission on Fiscal Responsibility and Reform
<http://www.fiscalcommission.gov/sites/fiscalcommission.gov/files/documents/Illustrative_List_11.10.2010.pdf>
[accessed 27 April 2011] 182
National Commission on Fiscal Responsibility and Reform, "$200 Billion in Illustrative Savings", in National
Commission on Fiscal Responsibility and Reform
<http://www.fiscalcommission.gov/sites/fiscalcommission.gov/files/documents/Illustrative_List_11.10.2010.pdf>
[accessed 27 April 2011] 183
The Sustainable Defense Task Force, "Debt, Deficits, and Defense: A Way Forward", in Commonwealth Institute
<http://www.comw.org/pda/fulltext/1006SDTFreport.pdf> [accessed 27 April 2011] 184
The original estimate was $8 to $9 billion over 10 years. We split the difference for our savings estimate. 185
Robert M Gates, "Statement on Department Budget and Efficiencies", in Department of Defense
<http://www.defense.gov/speeches/speech.aspx?speechid=1527> [accessed 27 April 2011] 186
Robert M Gates, "Statement on Department Budget and Efficiencies", in Department of Defense
<http://www.defense.gov/speeches/speech.aspx?speechid=1527> [accessed 27 April 2011]

Reinventing Defense Spending 50
percent increase over the original per-unit price.187 In addition to its unsustainable costs, the
EFV is simply unnecessary. According to Gates, “the most plausible scenarios requiring power
projection from the sea could be handled through a mix of existing air and sea systems.”188 It is
also worth asking if amphibious assault is even possible in an era when shore based precision
guided weapons pose an existential threat to ships supporting such a landing.
Virtually every deficit reduction plan recently put forward, from the Fiscal Commission plan to
the Bipartisan Policy Center plan, support cancelation of the EFV. According to the Sustainable
Defense Task Force, terminating the expeditionary fighting vehicle will save $8 to $9 billion over
10 years.189
RECOMMENDATION 10 $9.9 BILLION IN SAVINGS OVER 10 YEARS190
►Delay procurement of the KC-X Aerial Refueling Tanker for five years.
The CBO has outlined a reform option that would delay the purchase of KC-X tankers for five
years, and instead retain and upgrade 60 of the current refueling tankers, the KC-135E.191 This
option is supported by the Sustainable Defense Task Force and would save $9.9 billion over 10
years. Proponents of this option argue that the current KC-135Es still have “significant
structural life remaining”, and that converting the existing refueling tankers would be a cost-
effective way to improve capabilities and reduce costs.192
RECOMMENDATION 11 $11 BILLION IN SAVINGS OVER 10 YEARS193, 194
►End procurement of the MV-22 Osprey.
The MV-22 Osprey is another example of an over-budget, underperforming military weapons
system. The Osprey was originally created to allow Marines to carry troops and cargo faster,
higher, and further than a traditional helicopter. The Osprey is now 186 percent over budget,
costs $100 million per unit to produce, has killed 30 Marines in accidents, and is not suited to
187
Michael J Sullivan, "Expeditionary Fighting Vehicle (EFV) Program Faces Cost, Schedule, and Performance
Risks", in Government Accountability Office <http://www.gao.gov/new.items/d10758r.pdf> [accessed 28 April
2011] 188
Robert M Gates, "Statement on Department Budget and Efficiencies", in Department of Defense
<http://www.defense.gov/speeches/speech.aspx?speechid=1527> [accessed 27 April 2011] 189
The Sustainable Defense Task Force, "Debt, Deficits, and Defense: A Way Forward", in Commonwealth Institute
<http://www.comw.org/pda/fulltext/1006SDTFreport.pdf> [accessed 27 April 2011] 190
Congressional Budget Office, "Budget Options Volume 2", in Congressional Budget Office
<http://www.cbo.gov/ftpdocs/102xx/doc10294/08-06-BudgetOptions.pdf> [accessed 22 April 2011] 191
Congressional Budget Office, "Budget Options Volume 2", in Congressional Budget Office
<http://www.cbo.gov/ftpdocs/102xx/doc10294/08-06-BudgetOptions.pdf> [accessed 22 April 2011] 192
Congressional Budget Office, "Budget Options Volume 2", in Congressional Budget Office
<http://www.cbo.gov/ftpdocs/102xx/doc10294/08-06-BudgetOptions.pdf> [accessed 22 April 2011] 193
The Sustainable Defense Task Force, "Debt, Deficits, and Defense: A Way Forward", in Commonwealth Institute
<http://www.comw.org/pda/fulltext/1006SDTFreport.pdf> [accessed 27 April 2011] 194
The original estimate was $10 to $11 billion over 10 years. We split the difference for our savings estimate.

Reinventing Defense Spending 51
fly safely in extreme heat, excessive sand, or under enemy fire.195 It frequently breaks down,
achieving only 68 percent readiness in Iraq.196
The Government Accountability Office recommended that DOD reconsider procurement of the
Osprey, and experts argue that an existing helicopter could achieve many of the objectives of
the Osprey at a much lower cost. Yet DOD continues to procure this costly, ineffective
machine. The Cato Institute, as part of its “strategy of restraint”, also calls for the cancellation
of the MV-22, arguing existing systems are perfectly suitable to perform the necessary
missions.197 All in all, cancellation of this underperforming, over-budget weapons system could
save $10 billion over 10 years.198
RECOMMENDATION 12 $80 BILLION IN SAVINGS OVER 10 YEARS199
►Curb research and development costs.
Another area of defense procurement in need of reform is research and development, which
has experienced more spending growth since 2001 than any other major DOD appropriations
category.200 Today, research and development receives
$80 billion annually, or 33 percent more than during the
Cold War peak in real terms, even though today we face
no traditional adversary comparable to the Soviet
Union.201
In order to reduce research and development costs, the
Sustainable Defense Task Force recommends DOD set
priorities and achieve $5 billion in savings per year for a
total of $50 billion over the next decade.202 Both the Cato Institute and the Task Force on a
Unified Security Budget agree research and development could be significantly improved
195
Government Accountability Office, "Defense Acquisitions: Assessments Needed to Address V-22 Aircraft
Operational and Cost Concerns to Define Future Investments", in Government Accountability Office
<http://www.gao.gov/new.items/d09482.pdf> [accessed 29 April 2011] 196
Government Accountability Office, "Defense Acquisitions: Assessments Needed to Address V-22 Aircraft
Operational and Cost Concerns to Define Future Investments", in Government Accountability Office
<http://www.gao.gov/new.items/d09482.pdf> [accessed 29 April 2011] 197
Cato Institute, "Cato Handbook for Policymakers: The Defense Budget", in Cato Institute
<http://www.cato.org/pubs/handbook/hb111/hb111-19.pdf> [accessed 28 April 2011] 198
The Sustainable Defense Task Force, "Debt, Deficits, and Defense: A Way Forward", in Commonwealth Institute
<http://www.comw.org/pda/fulltext/1006SDTFreport.pdf> [accessed 27 April 2011] 199
The Sustainable Defense Task Force, "Debt, Deficits, and Defense: A Way Forward", in Commonwealth Institute
<http://www.comw.org/pda/fulltext/1006SDTFreport.pdf> [accessed 27 April 2011] 200
The Sustainable Defense Task Force, "Debt, Deficits, and Defense: A Way Forward", in Commonwealth Institute
<http://www.comw.org/pda/fulltext/1006SDTFreport.pdf> [accessed 27 April 2011] 201
The Sustainable Defense Task Force, "Debt, Deficits, and Defense: A Way Forward", in Commonwealth Institute
<http://www.comw.org/pda/fulltext/1006SDTFreport.pdf> [accessed 27 April 2011] 202
The Sustainable Defense Task Force, "Debt, Deficits, and Defense: A Way Forward", in Commonwealth Institute
<http://www.comw.org/pda/fulltext/1006SDTFreport.pdf> [accessed 27 April 2011]
―Today, research and
development receives
$80 billion annually, or
33 percent more than
during the Cold War
peak in real terms.‖
Reinventing Defense Spending 52
without harming security. The Fiscal Commission and the Bipartisan Policy Center have also put
forward proposals to reduce research and development costs. The Fiscal Commission, in its
illustrative cuts, proposes reducing DOD’s research, development, test, and evaluation (RDT&E)
budget by 10 percent, for a savings of $7 billion in 2015, pointing out that this reduction would
still leave DOD with “a level above the peak of the Reagan years in real systems”.203 The
Bipartisan Policy Center offers a similar plan, calling for reduced funding for RDT&E
proportional to the reduction in size of forces, or 18.5 percent.204 We endorse a 10 percent cut
in research and development spending, for savings of approximately $80 billion over 10 years.
Consider Other Options
OPTION 1 $60 BILLION IN SAVINGS OVER 10 YEARS205
►Modernize DOD’s health care system.
Over the past decade, military health care costs have risen 100 percent in real terms.206 The
DOD Unified Medical Budget has risen far faster than inflation, growing from $19 billion in
Fiscal Year 2001 to $50.7 billion in Fiscal Year 2010.207 Despite this significant growth,
enrollment fees, deductibles, and copayments for TRICARE have not increased since the mid-
1990s.208 For instance, the current TRICARE Prime enrollment fee was set in 1995 at $450 per
year for a basic family plan and has never been raised.209 The rates paid by military families—
annual deductibles ranging from $150-$300—remain far below the national average of $600 to
$1,000.210 Additionally, the share of TRICARE’s total health care covered by premiums has
fallen from 27 percent in 1995 to just 9 percent today.211
203
National Commission on Fiscal Responsibility and Reform, "$200 Billion in Illustrative Savings", in National
Commission on Fiscal Responsibility and Reform
<http://www.fiscalcommission.gov/sites/fiscalcommission.gov/files/documents/Illustrative_List_11.10.2010.pdf>
[accessed 27 April 2011] 204
The Debt Reduction Task Force, "Restoring America's Future", in Bipartisan Policy Center
<http://www.bipartisanpolicy.org/sites/default/files/BPC%20FINAL%20REPORT%20FOR%20PRINTER%2002%
2028%2011.pdf> [accessed 27 April 2011] 205
Congressional Budget Office, "The Effects of Proposals to Increase Cost Sharing in TRICARE", in
Congressional Budget Office <http://www.cbo.gov/ftpdocs/102xx/doc10261/TRICARE.pdf> [accessed 28 April
2011] 206
The Sustainable Defense Task Force, "Debt, Deficits, and Defense: A Way Forward", in Commonwealth Institute
<http://www.comw.org/pda/fulltext/1006SDTFreport.pdf> [accessed 27 April 2011] 207
Gordon Adams, "Testimony before the House Committee on Oversight and Government Reform Subcommittee
on National Security and Foreign Affairs", in House Committee on Oversight and Government Affairs
<http://oversight.house.gov/images/stories/subcommittees/NS_Subcommittee/7.20.10_DoD_Budget/Adams_Statem
ent.pdf> [accessed 13 December 2010] 208
Congressional Budget Office, "The Effects of Proposals to Increase Cost Sharing in TRICARE", in
Congressional Budget Office <http://www.cbo.gov/ftpdocs/102xx/doc10261/TRICARE.pdf> [accessed 28 April
2011] 209
Todd Harrison, "Evaluating Options for a Sustainable Defense", in Commonwealth Institute
<http://www.comw.org/pda/fulltext/Harrison_Testimony.pdf> [accessed 29 April 2011] 210
National Commission on Fiscal Responsibility and Reform, "$200 Billion in Illustrative Savings", in National
Commission on Fiscal Responsibility and Reform
Reinventing Defense Spending 53
Secretary Gates has recently voiced serious concerns about TRICARE and the need to
implement reforms: “Health-care costs are eating the Department of Defense alive…Many
working age military retirees—who are earning full-time salaries on top of their full military
pensions—are opting for TRICARE even though they could get health coverage through their
employer, with the taxpayer picking up most of the tab as the result.”212
In 2007, 2008, and 2009, DOD proposed that enrollment fees, deductibles, and copayments of
some TRICARE beneficiaries be increased to encourage more efficient use of health services and
to reduce medical costs.213 Each year these proposals were rejected by Congress. According to
a CBO cost estimate of DOD’s Fiscal Year 2009 reform proposal, modestly raising enrollment
fees, co-pays, and deductibles (closer to but still significantly below those paid by civilians)
would save $60 billion over 10 years.214
Deficit reduction proposals put forward by the Sustainable Defense Task Force, the Fiscal
Commission, and the Bipartisan Policy Center all include similar plans to reform and modernize
TRICARE. We can realign our military health care system with today’s standards in order to
make the system more sustainable while still ensuring our military personnel receive the care
they deserve.
Conclusion
In a world of limited resources, we have to make tough choices. Unfortunately, we have passed
the buck too often on defense spending reform. Rather than realigning our military budget to
match emerging threats, we have simply layered new requirements over existing requirements.
Even the most recent Quadrennial Defense Review fails to set reasonable priorities, explaining
that the U.S. must be capable of protecting U.S. interests against “a multiplicity of threats,
including two capable nation-state aggressors *and+…Conducting a wide range of operations”
<http://www.fiscalcommission.gov/sites/fiscalcommission.gov/files/documents/Illustrative_List_11.10.2010.pdf>
[accessed 27 April 2011] 211
Gordon Adams, "Testimony before the House Committee on Oversight and Government Reform Subcommittee
on National Security and Foreign Affairs", in House Committee on Oversight and Government Affairs
<http://oversight.house.gov/images/stories/subcommittees/NS_Subcommittee/7.20.10_DoD_Budget/Adams_Statem
ent.pdf> [accessed 13 December 2010] 212
Robert M Gates, "Remarks as Delivered by Secretary of Defense Robert M. Gates, Abilene, KS, Saturday, May
08, 2010", in Department of Defense <http://www.defense.gov/speeches/speech.aspx?speechid=1467> [accessed 29
April 2011] 213
Congressional Budget Office, "The Effects of Proposals to Increase Cost Sharing in TRICARE", in
Congressional Budget Office <http://www.cbo.gov/ftpdocs/102xx/doc10261/TRICARE.pdf> [accessed 28 April
2011] 214
Congressional Budget Office, "The Effects of Proposals to Increase Cost Sharing in TRICARE", in
Congressional Budget Office <http://www.cbo.gov/ftpdocs/102xx/doc10261/TRICARE.pdf> [accessed 28 April
2011]
Reinventing Defense Spending 54
including conflicts we are currently in and the wars we may someday face.215 This is the sort of
logic that leads Benjamin Friedman of the Cato Institute to say, “We spend too much because
we choose too little.”216
Most of our defense spending reflects yesterday’s threats—threats that have receded in recent
years while newer threats, primarily terrorism, have come to the forefront of our security
agenda. What is certain is that today’s threat environment does not justify current spending
levels. Our security budget needs to be reinvented to meet new threats, including the threat of
fiscal instability, and policy makers need to measure
each security spending program against this benchmark:
Is it essential to keep America safe?
This is even more important because the real
consequence of overspending on defense is not only
that we will have too many unnecessary ships, aircrafts,
and missiles, but also that by diverting so many of our
limited resources to needless defense programs, we are
neglecting other vital, domestic investments in health care, education, and infrastructure that
maintain our superpower status. President Dwight Eisenhower, a staunch critic of military
spending, understood the dangers of overspending on defense and warned in a 1951 speech to
NATO, “We must not destroy from within what we are trying to defend from without.”
As we reassess our security budget and strategy we should heed his warning. Military power is
not simply about spending more than our adversaries, but, as Kori Schake, a research fellow at
the Hoover Institute, points out, it is also “fundamentally premised on the solvency of the
American government and the vibrancy of the U.S. economy.”217 In order to maintain that
vibrancy, we must get our fiscal house in order, and in doing so reexamine and reinvent our
national security budget.
215
Department of Defense, "Quadrennial Defense Review Report", in Department of Defense
<http://www.defense.gov/qdr/qdr%20as%20of%2029jan10%201600.pdf> [accessed 28 April 2011] 216
Cato Institute, "Cato Handbook for Policymakers: The Defense Budget", in Cato Institute
<http://www.cato.org/pubs/handbook/hb111/hb111-19.pdf> [accessed 28 April 2011] 217
Kori Schake, "Stop Spending So Much on Defense", in Foreign Policy Online
<http://shadow.foreignpolicy.com/posts/2010/01/20/stop_spending_so_much_on_Defense> [accessed 28 April
2011]
―We need to measure
each security spending
program against this
benchmark: Is it
essential to keep
American safe?‖

Reinventing Tax Expenditures 55
REINVENTING TAX EXPENDITURES
OUR FOURTEEN KEY RECOMMENDATIONS
End Environmentally Destructive Tax Subsidies
►RECOMMENDATION 1: Cut oil and gas subsidies.
Potential Savings: $43.6 billion over 10 years
►RECOMMENDATION 2: Cut coal subsidies.
Potential Savings: $2.6 billion over 10 years
►RECOMMENDATION 3: Cut timber subsidies.
Potential Savings: $6.8 billion over 10 years
►RECOMMENDATION 4: Cut parking subsidies.
Potential Savings: $34.7 billion over 10 years
►RECOMMENDATION 5: Cut ethanol subsidies.
Potential Savings: $62.1 billion over 10 years
End Wasteful Corporate Tax Subsidies
►RECOMMENDATION 6: Reform the international tax system.
Potential Savings: $129.2 billion over 10 years
►RECOMMENDATION 7: Cut subsidies for private-activity bonds.
Potential Savings: $23.0 billion over 10 years
►RECOMMENDATION 8: Cut subsidies for Blue Cross/Blue Shield.
Potential Savings: $6.2 billion over 10 years
►RECOMMENDATION 9: Cut subsidies for employment-based life insurance.
Potential Savings: $25.2 billion over 10 years
►RECOMMENDATION 10: Cut subsidies for agribusinesses.
Potential Savings: $9.8 billion over 10 years
Limit Tax Subsidies for High Income Individuals
►RECOMMENDATION 11: Cut subsidies for income earned abroad.
Potential Savings: $71.2 billion over 10 years
►RECOMMENDATION 12: Cut the mortgage interest deduction for vacation homes.
Potential Savings: $12.2 billion over 10 years
►RECOMMENDATION 13: Limit deductions for high-income taxpayers.
Potential Savings: $321.3 billion over 10 years

Reinventing Tax Expenditures 56
Split Savings between Tax Cuts and Deficit Reduction.
►RECOMMENDATION 14: Reduce individual and corporate tax rates.
Variable deficit increase over 10 years.
Recommended Minimum Potential Savings
$700-800 billion over 10 years
Consider Other Options
► OPTION 1: Cap tax expenditures as a percent of GDP.
Potential Savings: $3.5 trillion over 10 years
► OPTION 2: Cut most tax expenditures and split the savings.
Potential Savings: Variable
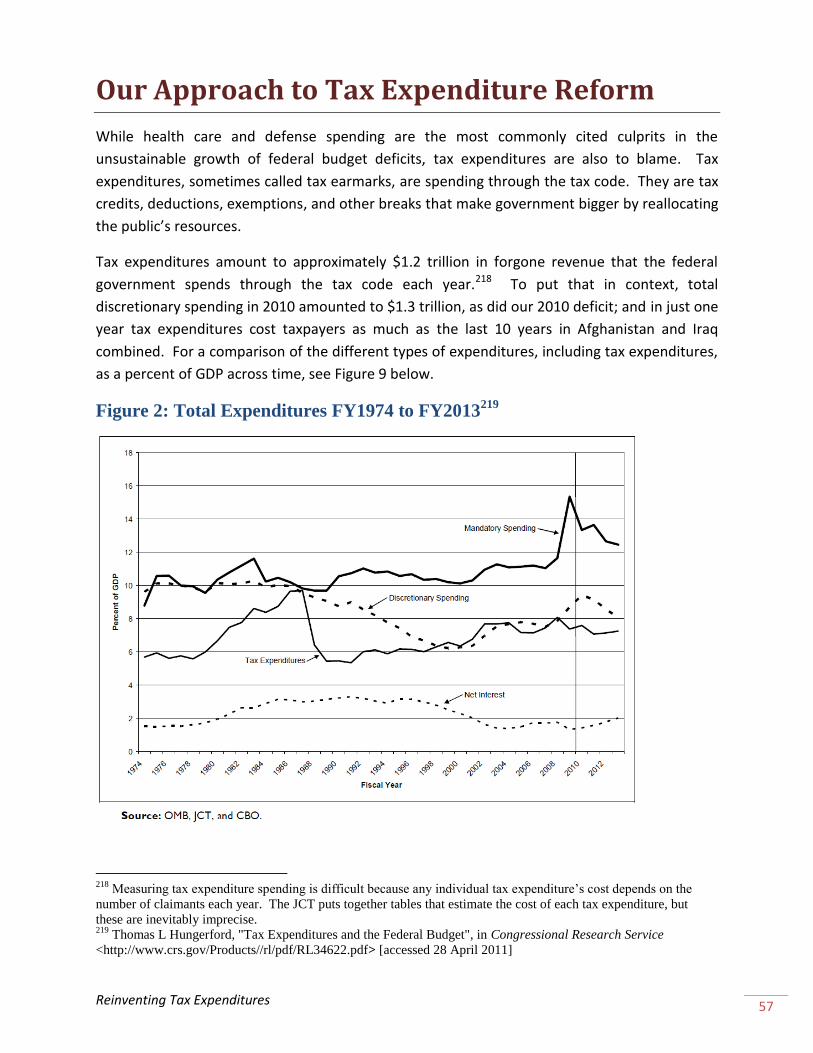
Reinventing Tax Expenditures 57
Our Approach to Tax Expenditure Reform
While health care and defense spending are the most commonly cited culprits in the
unsustainable growth of federal budget deficits, tax expenditures are also to blame. Tax
expenditures, sometimes called tax earmarks, are spending through the tax code. They are tax
credits, deductions, exemptions, and other breaks that make government bigger by reallocating
the public’s resources.
Tax expenditures amount to approximately $1.2 trillion in forgone revenue that the federal
government spends through the tax code each year.218 To put that in context, total
discretionary spending in 2010 amounted to $1.3 trillion, as did our 2010 deficit; and in just one
year tax expenditures cost taxpayers as much as the last 10 years in Afghanistan and Iraq
combined. For a comparison of the different types of expenditures, including tax expenditures,
as a percent of GDP across time, see Figure 9 below.
Figure 2: Total Expenditures FY1974 to FY2013219
218
Measuring tax expenditure spending is difficult because any individual tax expenditure’s cost depends on the
number of claimants each year. The JCT puts together tables that estimate the cost of each tax expenditure, but
these are inevitably imprecise. 219
Thomas L Hungerford, "Tax Expenditures and the Federal Budget", in Congressional Research Service
<http://www.crs.gov/Products//rl/pdf/RL34622.pdf> [accessed 28 April 2011]

Reinventing Tax Expenditures 58
While not counted as spending in the official budget, tax expenditures are ripe with potential
savings. This is not only because of their huge cost (between 1999 and 2004 they even cost
more than all discretionary spending), but also because tax expenditures have been little
scrutinized since the 1986 tax reform that eliminated many tax expenditures and broadened
the tax base.220 Since then, they’ve grown to over 250
in number and impact government revenue to such a
degree that the Committee for a Responsible Federal
Budget now talks about a “Swiss-cheese tax base filled
with rifle-shot tax breaks.” The point is that a few
common sense tax expenditure reforms could go a long
way towards shrinking our deficit.
Tax expenditures are also problematic because they are regressive benefits. “For example,”
asks Len Burman, “would it make sense to design a health insurance voucher worth 35 cents
per dollar for high-income families, but only 10 cents per dollar for those with low income?”221
The answer is obviously no, but that’s the system we’ve got in place. Tax expenditures are
ultimately a regressive way of distributing public resources. They increase income inequality
and create the (often deserved) perception that our tax code is unfair.
Savings generated from tax expenditure reform could be earned in one of three ways. First,
specific tax expenditures could be modified or eliminated altogether. There are several
candidates for modification or elimination that we discuss later in this section. Second, tax
expenditures could be capped, either as a percent of GDP or on a per taxpayer basis. Third,
most tax expenditures could be eliminated and the savings could be split between deficit
reduction and tax cuts.
Our key recommendations, listed at the beginning of this section, include both the elimination
of several specific tax expenditures as well as a cap on deductions taken by upper-income
220
The Tax Reform Act of 1986, a bipartisan act of Congress championed by President Reagan, was able to cut the
top individual income tax rate from 50 percent to 28 percent while remaining revenue neutral, according to Leonard
Burman: Leonard Burman, "Let's freeze more than chump change", in The Washington Post
<http://www.washingtonpost.com/wp-dyn/content/article/2010/02/01/AR2010020103072.html> [accessed 28 April
2011]. Burman also cites a 2008 study by the Tax Policy Center which found “that eliminating all [current] income
tax expenditures would permit a 44 percent across-the-board cut in tax rates without reducing revenue. The top
marginal rate could drop from 35 percent to 20 percent.” Although we’d want to use some of the savings from tax
expenditure cuts to shrink the deficit rather than to lower taxes, these figures are useful for illustrating the magnitude
of the potential savings. See: Leonard Burman, Eric Toder and Christopher Geissler, "How Big are Total Individual
Income Tax Expenditures, and Who Benefits from Them?", in Tax Policy Center
<http://www.taxpolicycenter.org/UploadedPDF/1001234_tax_expenditures.pdf> [accessed 3 May 2011] 221
Leonard Burman, "Let's freeze more than chump change", in The Washington Post
<http://www.washingtonpost.com/wp-dyn/content/article/2010/02/01/AR2010020103072.html> [accessed 28 April
2011]
―Tax expenditures are
ultimately a regressive
way of distributing
public resources.‖

Reinventing Tax Expenditures 59
earners (a combination of the first two approaches listed in the previous paragraph). Together
they add up to over $600-800 billion in savings over 10 years.222
Still, these are only first steps. There are plenty more tax expenditures in the tax code that
should be candidates for elimination. But one potential problem is that once you start cutting
one here and one there, you begin to pick winners and
losers from the myriad groups and sectors of the
economy that benefit from these tax expenditures. Still,
tax expenditures inherently pick winners and losers, often
according to arbitrary and little scrutinized criteria.
And because tax expenditures already pick winners and
losers, we believe that the next step must be
comprehensive tax reform. That doesn’t change the fact
that some tax expenditures clearly deserve to be
eliminated as soon as possible (and we make recommendations to that effect), but we also
believe that a more broad-based approach must remain the end goal.
The term “comprehensive tax reform” has been thrown around to mean many things, including
everything from deficit-financed tax cuts to a progressive tax increase and the closing of tax
loopholes. We mean it to be a simplification of the tax code—by eliminating most tax
expenditures—that divides the savings (over $1 trillion per year) between income and
corporate tax rate reduction on the one hand, and
deficit reduction on the other
Liberal critics will say that this concedes too much to
upper income taxpayers and corporate interests.
Conservative critics will allege that this is a tax rate
increase—even though it is quite the opposite. The fact is that the benefits of comprehensive
tax reform would be large and wide-ranging. Business would prosper under a simplified tax
code. Individuals would get to keep more of what they earn through lower income tax rates.
Incentives that distort economic behavior and encourage overleveraging or environmentally
destructive investment would be eliminated. And our deficit would be substantially reduced,
depending of course on the ultimate balance between tax cuts and deficit reduction.
The next section makes the case for our key recommendations. Following that is a review of
other options that we are not explicitly recommending but that merit a thoughtful discussion.
222
It is important to recognize that at least some of this figure would have to be dedicated to lowering both
individual income and corporate tax rates, as we suggest with our fourteenth recommendation.
―Tax expenditures
inherently pick
winners and losers,
often according to
arbitrary and little
scrutinized criteria.‖
―Businesses would
prosper under a
simplified tax code.‖

Reinventing Tax Expenditures 60
Our Fourteen Key Recommendations
End Environmentally Unfriendly Tax Subsidies
RECOMMENDATION 1 $43.6 BILLION IN SAVINGS OVER 10 YEARS223
►Cut oil and gas subsidies.
Several tax expenditures subsidize the activities of oil and gas companies. Most of these should
be eliminated, especially those that have little or no impact on employment figures or
consumer prices. For the most part, these oil and gas companies already earn huge profits and
don’t need the crutch of taxpayer subsidies. Either way, the government should not be
responsible for subsidizing entire industries on a permanent basis. And worse still, this is a
subsidy that goes directly against the public
interest by contributing to climate change by
increasing the consumption of fossil fuels. Even
Speaker John Boehner has admitted that oil and
gas companies should pay “their fair share.”224
We support the White House proposal to cut eight
tax expenditures that benefit oil and gas companies. These cuts could save taxpayers about
$44 billion over the next 10 years.225 Included among the tax expenditures that the White
House recommends cutting are the following:
Oil and gas subsidies
1. Enhanced oil recovery credit
2. Credit for oil and gas produced from marginal wells
3. Expensing of intangible drilling costs
4. Deduction for tertiary injectants
5. Exemption to passive loss limitation for working interests in oil and natural gas properties
6. Percentage depletion for oil and natural gas wells
7. Domestic manufacturing deduction for oil and gas production
8. Short amortization period for independent producers (increase from two to seven years)
223
Department of Treasury, "General Explanations of the Administration’s Fiscal Year 2012 Revenue Proposals", in
Department of Treasury <http://www.treasury.gov/resource-center/tax-
policy/Documents/Final%20Greenbook%20Feb%202012.pdf> [accessed 28 April 2011] 224
Christi Parsons and Kathleen Hennessey, "Obama urges repeal of tax breaks for oil firms", in Los Angeles Times
<http://articles.latimes.com/2011/apr/26/nation/la-na-obama-oil-subsidies-20110427> [accessed 5 May 2011] 225
Department of Treasury, "General Explanations of the Administration’s Fiscal Year 2012 Revenue Proposals", in
Department of Treasury <http://www.treasury.gov/resource-center/tax-
policy/Documents/Final%20Greenbook%20Feb%202012.pdf> [accessed 28 April 2011]
―This is a subsidy that goes
directly against the public
interest by contributing to
climate change.‖
Reinventing Tax Expenditures 61
Eliminating these eight tax expenditures would have very little effect on consumer prices or on
employment: the Joint Economic Committee has found that eliminating the largest of these
deductions—the one for domestic oil and gas production—would have zero impact on
consumer prices.226 The Treasury Department has found that eliminating all of them would
reduce domestic production by effectively zero (less than one tenth of one percent).227 In
essence, taxpayers continue to subsidize an industry with billions of dollars per year but get
very little return on this investment, either in the form of domestic jobs or lower energy prices.
The oil industry also remains an incredibly profitable enterprise that doesn’t need the crutch of
taxpayer-provided subsidies. In 2008, the big five oil companies combined were averaging
almost $30 billion in annual profits, an astronomical sum that suggests taxpayer subsidies are
entirely unnecessary.228 Also consider the fact that, thanks to taxpayer subsidies, ExxonMobil
paid no federal income tax in 2009, in fact netting a $156 million tax refund.229
The truth is that these oil and gas companies would still be immensely profitable without
taxpayer subsides. And if we cut these subsidies, we could save billions of dollars. To that end,
we helped introduce a bill last June with Representative Earl Blumenauer and thirteen
colleagues that would eliminate $30 billion in tax expenditures230 benefitting oil and gas
companies over the next 10 years. This bill, H.R.5644, the End Big Oil Tax Subsidies Act, is not
only a concrete step towards fiscal sustainability, but also an environmentally responsible one.
The new version of that bill, H.R.601, is now estimated to save approximately $40 billion over
10 years.231 Taxpayers should not be subsidizing profitable oil companies at the cost of tens of
billions of dollars over the succeeding 10 years.232
226
Majority Staff of the Joint Economic Committee, "The Proposed Modification of Internal Revenue Code Section
199 Will Not Increase Consumer Energy Prices", in Joint Economic Committee
<http://jec.senate.gov/public/?a=Files.Serve&File_id=f26dccde-9ea6-4539-a44c-f638240fa055> [accessed 28 April
2011] 227
Alan B Krueger, "Statement of Alan B. Krueger Assistant Secretary for Economic Policy and Chief Economist,
US Department of Treasury Subcommittee on Energy, Natural Resources, and Infrastructure", in Department of
Treasury <http://www.treasury.gov/press-center/press-releases/Pages/tg284.aspx> [accessed 29 April 2011] 228
Rebecca Lefton, "BP Disaster Is Cheney’s Katrina"
<http://www.americanprogress.org/issues/2010/06/oil_timeline.html> [accessed 28 April 2011] 229
Rebecca Lefton, "BP Disaster Is Cheney’s Katrina"
<http://www.americanprogress.org/issues/2010/06/oil_timeline.html> [accessed 28 April 2011] 230
The terms “tax expenditure” and “tax subsidy” can be confused, but refer to roughly the same concept. Tax
subsidies are that category of tax expenditures which could be most easily replaced by a comparable outlay program. 231
Earl Blumenauer, "House Democrats Unveil $40 Billion in Cuts to Wasteful Big Oil Subsidies"
<http://blumenauer.house.gov/index.php?option=com_content&task=view&id=1788&Itemid=73> [accessed 28
April 2011] 232
Congressional Budget Office, "Budget Options", in Congressional Budget Office
<http://www.cbo.gov/ftpdocs/78xx/doc7821/02-23-BudgetOptions.pdf> [accessed 28 April 2011]

Reinventing Tax Expenditures 62
RECOMMENDATION 2 $2.6 BILLION IN SAVINGS OVER 10 YEARS 233
►Cut coal subsidies.
In addition to the oil and gas industry subsidies listed above, we also recommend cutting four
coal industry subsidies that are simply not in the public interest. These four coal subsidies,
listed below, add up to $2.6 billion over 10 years and were targeted for elimination by the
Obama Administration in its Fiscal Year 2012 budget.
Coal subsidies
1. Expensing of exploration and development costs
2. Percentage depletion for hard mineral fossil fuels
3. Capital gains treatment for royalties
4. Domestic manufacturing deduction for coal and other hard mineral fossil fuels
In evaluating these tax expenditures, we have to ask ourselves: should taxpayers be subsidizing
an industry that each year causes 24,000 premature deaths, more than 550,000 asthma attacks,
38,000 heart attacks, and 12,000 hospital admissions?234 The answer, in our view, is no.
RECOMMENDATION 3 $6.8 BILLION IN SAVINGS OVER 10 YEARS 235, 236
►Cut timber subsidies.
Like oil, gas, and coal subsidies, timber subsidies are another example of spending programs
that generally operate in direct contradiction of the public interest. In fact, as Calvin Johnson, a
professor of law at the University of Texas, points out, “Timber is a high-yield, long-term
investment that is subject to a negative tax rate under current law.”237 Two timber subsidies in
particular contribute to this negative tax rate. They are (1) the special tax treatment for timber
gains, and (2) the expensing of timber growing costs. Cutting these subsidies would save $6.8
billion over the next 10 years.
233
Department of Treasury, "General Explanations of the Administration’s Fiscal Year 2012 Revenue Proposals", in
Department of Treasury <http://www.treasury.gov/resource-center/tax-
policy/Documents/Final%20Greenbook%20Feb%202012.pdf> [accessed 28 April 2011] 234
Joseph Romm, "Using Tax Incentives to Drive the Clean Energy Economy"
<http://www.americanprogressaction.org/issues/2010/04/tax_green_economy.html> [accessed 28 April 2011] 235
Autumn Hanna and Benjamin Schreiber, "Green Scissors 2010", in Green Scissors
<http://www.greenscissors.com/GreenScissors2010.pdf> [accessed 28 April 2011] 236
The original cost savings estimate was $3.4 billion over five years. We believe that $6.8 billion over 10 years is
a reasonable assumption because (1) timber subsidies are not one-off expenses and (2) we err on the side of caution
and ignore inflation. 237
Autumn Hanna and Benjamin Schreiber, "Green Scissors 2010", in Green Scissors
<http://www.greenscissors.com/GreenScissors2010.pdf> [accessed 28 April 2011]
Reinventing Tax Expenditures 63
Currently, with these two tax subsidies on the books, we find the seemingly bizarre (but all too
common) example of the Tongass rainforest in Alaska, the world’s largest remaining temperate
rainforest. There, “taxpayers *actually+ pay
more for the construction and maintenance of
roads and other infrastructure needed to
extract the timber than they receive from the
royalties for the timber.”238 The tax code is
clearly broken when a provision originally
intended to raise revenue (royalties owed to
the taxpayer) has been perverted into a net
revenue loser that subsidizes the destruction of
pristine wilderness. These timber subsidies
should be cut and the revenue put towards deficit reduction.
RECOMMENDATION 4 $34.7 BILLION IN SAVINGS OVER 10 YEARS 239, 240
►Cut subsidies for employee parking expenses.
Another federal subsidy for environmentally destructive behavior is the tax exemption for
qualified parking expenses. While fringe benefits are generally taxable as employee
compensation, parking expense benefits have been exempted from taxation. According to a
joint report from the Brookings Institution and the World Resources Institute, this exemption
“encourages commuting by vehicles and contributes more to fossil fuel use, global warming,
and more pollution and congestion.” This begs the question: why should taxpayers continue to
subsidize an activity that is harmful to the environment?
We can’t find a good reason, and so we believe that this federal subsidy for employee parking
expenses should be cut. This would not stop anyone from driving to work, but it would remove
the extra incentive to do so. Not only would this remove a federal subsidy for environmentally
harmful behavior, but it would also “improve fairness in the relative tax treatment of
employees who receive compensation in different forms.”241 And perhaps most importantly, it
238
Autumn Hanna and Benjamin Schreiber, "Green Scissors 2010", in Green Scissors
<http://www.greenscissors.com/GreenScissors2010.pdf> [accessed 28 April 2011] 239
Office of Management and Budget, "Fiscal Year 2012 Budget of the U.S. Government", in Office of Management
and Budget <http://www.whitehouse.gov/sites/default/files/omb/budget/fy2012/assets/teb2012.xls> [accessed 28
April 2011] 240
The original cost savings estimate was $17.35 billion over five years. We believe that $34.7 billion over 10 years
is a reasonable assumption because (1) parking subsidies are not one-off expenses and (2) we err on the side of
caution and ignore inflation. 241
Eric Toder, "Eliminating Tax Expenditures with Adverse Environmental Effects", in Urban
<http://www.urban.org/UploadedPDF/1001080_tax_expenditures.pdf> [accessed 28 April 2011]
―The tax code is clearly
broken when a provision
originally intended to raise
revenue has been perverted
into a net revenue loser that
subsidizes the destruction of
pristine wilderness.‖
Reinventing Tax Expenditures 64
would generate considerable savings: at least $35 billion over 10 years, according to the Office
of Management and Budget.242
RECOMMENDATION 5 $62.1 BILLION IN SAVINGS OVER 10 YEARS 243, 244
►Cut ethanol subsidies.
Created more than 30 years ago, the Volumetric Ethanol Excise Tax Credit245 (VEETC) subsidizes
the production of corn ethanol. The most recent extension of the VEETC, through the end of
2011, was included in the tax cut deal signed by President Obama late last year.246
The VEETC cost U.S. taxpayers over $5 billion in 2010. The Natural Resources Defense Council
estimates that a 2011-2015 extension would cost taxpayers an additional $31.05 billion.247
Permanently ending the VEETC would save us at least $60 billion over the next 10 years.
The case for ending the VEETC is relatively straightforward. It costs too much and does more
harm than good. Last year, I joined many of my colleagues in writing a letter to then-Speaker
Nancy Pelosi and then-Minority Leader John Boehner that opposed an extension of the VEETC:
We want to express our strong opposition to extending the Volumetric Ethanol
Excise Tax Credit (VEETC) and the tariff on imported ethanol.
This year, the U.S. will divert nearly 40 percent of the domestic corn crop from
food and feed to fuel, which will contribute to already increasingly volatile and
high commodity prices. According to the Congressional Budget Office (CBO),
corn ethanol production accounted for 10-15 percent of the increase in food
prices between April 2007-April 2008 and $600-900 million in additional costs to
242
This $35 billion estimate is based on projected savings of $17.35 billion over five years which, adjusted for
inflation, would almost certainly exceed $35 billion over 10 years. 243
National Resource Defense Center, "Let the VEETC Expire: Save Billions in Tax Dollars Better Spent on Non-
Polluting Energy Technologies", in National Resource Defense Center
<http://www.nrdc.org/globalWarming/files/VEETCfs.pdf> [accessed 28 April 2011] 244
The original cost savings estimate was $31.05 billion over five years. We believe that $62.1 over 10 years is a
reasonable assumption because (1) ethanol subsidies are not one-off expenses and (2) we err on the side of caution
and ignore inflation. 245
The Volumetric Ethanol Excise Tax Credit is not technically a tax expenditure since it is a deviation from an
excise tax rather than from the income tax. Nevertheless, we have included it here because this is more of a
technicality than a substantive distinction. 246
Technically, the VEETC terminates at the end of 2011. This means that under current law, it has no budgetary
effect in 2012 or beyond. That said, the VEETC has been continually renewed by Congress and it’s reasonable to
believe that Congress will renew it again. One could frame the projected savings from VEETC termination
projected in this report in the context of policy changes that deviate from the CBO’s alternative baseline, a
projection of likely policy rather than current law. 247
National Resource Defense Center, "Let the VEETC Expire: Save Billions in Tax Dollars Better Spent on Non-
Polluting Energy Technologies", in National Resource Defense Center
<http://www.nrdc.org/globalWarming/files/VEETCfs.pdf> [accessed 28 April 2011]

Reinventing Tax Expenditures 65
the Supplemental Nutrition Assistance Program and other child nutrition
programs in 2009 alone.
Higher food prices hurt Americans, particularly those who can least afford it,
such as those on public assistance and working families.
In addition to escalating food and commodity prices, corn ethanol is not a cost-
efficient way of achieving environmental benefits. A July 2010 study by the CBO
found that every gallon of ethanol used to replace gasoline costs the Federal
government $1.78 – adding up to billions for American taxpayers. Ethanol also
does little to combat climate change, causing more global warming pollution
than the gasoline it replaced.
We believe it is time to end or significantly reduce the subsidy for corn ethanol
and the tariff on imported ethanol. We look forward to working with you to
promote the development of truly sustainable advanced bio-fuels that meet
both our food and environmental needs.
We continue to oppose an extension of the VEETC. If we are serious about fiscal responsibility,
ending the VEETC has to be one our first steps.
End Other Corporate Tax Subsidies
RECOMMENDATION 6 $129.2 BILLION IN SAVINGS OVER 10 YEARS 248
►Reform the international tax system.
In his 2011 State of the Union address, President Obama pointed out that “over the years, a
parade of lobbyists has rigged the tax code to benefit particular companies and industries.
Those with accountants and lawyers to work the system can end up paying no taxes at all. But
all the rest are hit with one of the highest corporate tax rates in the world.”249
This is true for all areas of the corporate tax code, but it is particularly true for the way our
international tax system operates. This is why reforming the international tax system is not just
a way to raise revenue, but also a much needed reform in the name of fairness.
248
Department of Treasury, "General Explanations of the Administration’s Fiscal Year 2012 Revenue Proposals", in
Department of Treasury <http://www.treasury.gov/resource-center/tax-
policy/Documents/Final%20Greenbook%20Feb%202012.pdf> [accessed 28 April 2011] 249
Barack Obama, "State of the Union Address", in The White House <http://www.whitehouse.gov/the-press-
office/2011/01/25/remarks-president-state-union-address> [accessed 28 April 2011]

Reinventing Tax Expenditures 66
The reason our international tax system is unfair is that it has created incentives for “U.S.-based
multinational corporations to invest abroad rather than in the United States.”250 On that point,
Chuck Marr and Brian Highsmith at the Center on Budget and Policy Priorities observe that U.S.
multinationals pay much lower taxes on profits from their overseas investments than on profits
from their domestic investments. That gives corporations a strong incentive to shift economic
activity and income from the United States to other countries.”251
Appropriate reform of the international tax system would eliminate this unhelpful incentive to
invest outside the United States. That is why we are endorsing President Obama’s seven
proposed corporate tax reforms that would raise $129 billion over the next 10 years:
1. Defer deduction of interest expense related to deferred income.
2. Determine foreign tax credit on a pooling basis.
3. Tax currently excess returns associated with transfers of intangibles offshore.
4. Limit shifting of income through intangible property transfers.
5. Disallow the deduction for non-taxed reinsurance premiums paid to affiliates.
6. Limit earnings stripping by expatriated entities.
7. Modify tax rules for dual capacity taxpayers.
RECOMMENDATION 7 $23.0 BILLION IN SAVINGS OVER 10 YEARS 252, 253
►Cut subsidies for private-activity bonds.
Currently, private-activity bonds that serve a public interest are tax exempt. We believe that
this exemption should be eliminated or the volume cap should be curtailed.
There are several reasons for ending this tax subsidy for private-activity bonds. Unlike public-
activity bonds, private-activity bonds are used by the private sector (to finance projects like
professional sports stadiums, hotels, and private golf courses).254 These projects can only
receive a tax exemption if the public can be shown to derive a benefit, but this determination is
250
Office of Management and Budget, "Fiscal Year 2012 Budget of the U.S. Government", in Office of Management
and Budget <http://www.whitehouse.gov/sites/default/files/omb/budget/fy2012/assets/budget.pdf> [accessed 28
April 2011] 251
Chuck Marr and Brian Highsmith, "Six Tests for Corporate Reform: Reform Should Help Shrink Long-Term
Deficits, Reduce Biases and Preferences in the Tax Code, and Discourage Tax Sheltering", in Center on Budget and
Policy Priorities <http://www.cbpp.org/files/2-28-11tax.pdf> [accessed 28 April 2011] 252
Congressional Budget Office, "Budget Options Volume 2", in Congressional Budget Office
<http://www.cbo.gov/ftpdocs/102xx/doc10294/08-06-BudgetOptions.pdf> [accessed 22 April 2011] 253
This savings estimate, from the CBO’s 2009 Budget Options, is for 2010-2019. Assuming inflation, the savings
figure should increase for later 10 year periods including 2011-2020 and 2012-2021. 254
Government Accountability Office, "Tax-Exempt Status of Certain Bonds Merits Reconsideration, and Apparent
Noncompliance with Issuance Cost Limitations Should Be Addressed", in Government Accountability Office
<http://www.gao.gov/highlights/d08364high.pdf> [accessed 28 April 2011]

Reinventing Tax Expenditures 67
highly subjective and relies on vague guidelines, leaving it vulnerable to the influence of
lobbyists and other interested parties.255
Ending this tax expenditure would improve economic efficiency.256 Private sector projects
should stand on their own merits. If market-rate financing is inadequate, then these projects
should probably not be financed. Further, even if we did wish to subsidize these private-sector
projects, a tax exemption for private-activity bonds is a roundabout way to achieve that goal.
There are far more direct methods of subsidizing these projects that do not sacrifice so much in
the way of economic efficiency. If we rolled back subsidies for private-activity bonds, we could
save approximately $23 billion over the next 10 years, according to the CBO.
RECOMMENDATION 8 $6.2 BILLION IN SAVINGS OVER 10 YEARS 257, 258
►Cut subsidies for Blue Cross/Blue Shield.
Blue Cross/Blue Shield providers were originally awarded tax exempt status in the 1930s for
their role in providing health insurance to high-risk individuals. But due to the more profit-
oriented business activities that Blue Cross/Blue Shield providers adopted in subsequent
decades, this tax exemption was partly rolled back in 1986.259 Since then, only those Blue
Cross/Blue Shield providers that meet community-service standards have qualified for this
special tax treatment, which includes:
1. The right to be treated as a stock property insurance company instead of as a health
insurance company.
2. The right to fully deduct unearned premiums, unlike other property and casualty
insurance companies.
3. The right to take a special deduction of 25 percent of the year’s health-related claims
and expenses minus accumulated surplus at the beginning of the year.260
255
Internal Revenue Service, "Tax-Exempt Private Activity Bonds", in Internal Revenue Service
<http://www.irs.gov/pub/irs-pdf/p4078.pdf> [accessed 28 April 2011] 256
Congressional Budget Office, "Budget Options Volume 2", in Congressional Budget Office
<http://www.cbo.gov/ftpdocs/102xx/doc10294/08-06-BudgetOptions.pdf> [accessed 22 April 2011] 257
Office of Management and Budget, "Fiscal Year 2012 Budget of the U.S. Government", in Office of Management
and Budget <http://www.whitehouse.gov/sites/default/files/omb/budget/fy2012/assets/teb2012.xls> [accessed 28
April 2011] 258
The original cost savings estimate was $3.1 billion over five years. We believe that $6.2 billion over 10 years is
a reasonable assumption because (1) the Blue Cross/Blue Shield subsidy is not a one-off expense and (2) we err on
the side of caution and ignore inflation. 259
Subsidy Scope, "Special BlueCross BlueShield Deduction" <http://subsidyscope.org/nonprofits/tax-
expenditures/blue-cross-blue-shield/> [accessed 28 April 2011] 260
Cornell Law School Legal Information Institute, "U.S. Code"
<http://www.law.cornell.edu/uscode/26/usc_sec_26_00000833----000-.html> [accessed 2011 April 28]
Reinventing Tax Expenditures 68
However, the rationale supporting this special tax treatment is no longer substantiated by the
facts. Originally, BlueCross/BlueShield received this special tax treatment because it was the
main, if not the sole, provider of insurance to small group, high risk individuals. However, as
Blue Cross/Blue Shield providers’ business model became “commercial rather than charitable”,
Congress decided it wanted to avoid giving an unfair competitive advantage to
BlueCross/BlueShield providers and limited the availability of the special tax treatment.261
Today, even this more limited special tax treatment no longer makes sense. The new health
care reform law will make it so that BlueCross/BlueShield providers are no longer the main
insurers of high risk individuals and small groups. This means that we can eliminate the special
subsidy to Blue Cross/Blue Shield without adversely impacting these vulnerable individuals, and
at the same time generate $6 billion in savings over the next 10 years.
RECOMMENDATION 9 $25.2 BILLION IN SAVINGS OVER 10 YEARS 262, 263
►Cut subsidies for employment-based life insurance.
Under current law, life insurance provided by an employer is excluded from an employee’s
taxable income. This results in an “incentive for employees to buy more life insurance than
they would if they paid the full cost themselves.” The key questions for policymakers are (1)
whether this subsidy is appropriately designed, and (2) whether it is in the public interest.
The first strike against this subsidy is that its design is extremely unfair. As the CBO puts it, the
result of this incentive for employers to purchase life insurance, “In terms of fairness”, is that
“workers whose employers purchase life insurance for them pay less in taxes than do workers
who have the same total compensation but who buy their own insurance.”264 There’s no
question that this is unfair to workers who have to buy their own taxable life insurance,
especially since their taxes pay for the tax exemption on employer-provided life insurance that
benefits others.
The second strike against this subsidy is that it is not in the public interest. While extra life
insurance will likely not hurt anyone, the artificially low cost of employer-provided life
insurance distorts the marketplace by drawing resources from other more potentially profitable
activities. The CBO estimates that this subsidy will consume $25.2 billion in taxpayer dollars
over the next 10 years. Were extra life insurance a public good, then the scale might be tilted
261
The New York Times, "Blue Cross Tax Status is Challenged", in The New York Times
<http://www.nytimes.com/1986/07/04/us/blue-cross-tax-status-is-challenged.html> [accessed 2011 April 28] 262
Congressional Budget Office, "Budget Options Volume 2", in Congressional Budget Office
<http://www.cbo.gov/ftpdocs/102xx/doc10294/08-06-BudgetOptions.pdf> [accessed 22 April 2011] 263
This savings estimate, from the CBO’s 2009 Budget Options, is for 2010-2019. Assuming inflation, the savings
figure should increase for later 10 year periods including 2011-2020 and 2012-2021. 264
Congressional Budget Office, "Budget Options Volume 2", in Congressional Budget Office
<http://www.cbo.gov/ftpdocs/102xx/doc10294/08-06-BudgetOptions.pdf> [accessed 22 April 2011]

Reinventing Tax Expenditures 69
in the other direction, but there is no good reason to believe that the private marketplace
cannot efficiently allocate resources to the purchase of life insurance.
RECOMMENDATION 10 $9.8 BILLION IN SAVINGS OVER 10 YEARS 265, 266
►Cut subsidies for agribusinesses.
Agribusiness benefits from a number of federal subsidies, many of which are discussed later in
this report. But three of those subsidies are delivered through the tax code. They are:
Agribusiness subsidies
1. Capital gains treatment for agricultural items
2. Expensing of certain multi-period planting costs
3. Expensing of capital outlays for fertilizer and feed
As the Center for American Progress points out, “These are special tax subsidies that other
industries do not get. Certain portions of their income are taxed at a much lower rate, and they
are able to immediately write off many of their costs instead of recouping those costs over a
number of years as companies in most other industries do.”267 We also support cutting these
tax subsidies for agribusinesses, which would save approximately $10 billion over the next 10
years.
Limit Tax Subsidies for High Income Individuals
RECOMMENDATION 11 $71.2 BILLION IN SAVINGS OVER 10 YEARS268
►Cut subsidies for income earned abroad.
Currently, U.S. citizens living abroad can exclude a large part of their foreign-earned income
from taxation. For calendar year 2009, the excludable income was any income up to
$91,400.269 Cutting this subsidy for earning income abroad would still retain a tax credit for
taxes paid to foreign governments.
The best reason for eliminating this tax subsidy is one of fairness. As the CBO explains, “U.S.
citizens with similar income should incur similar tax liabilities, regardless of where they live or
265
Michael Ettlinger and Seth Hanlon, "Cut Spending in the Tax Code", in Center for American Progress
<http://www.americanprogress.org/issues/2011/03/pdf/tax_expenditures.pdf> [accessed 2011 April 28] 266
The original cost savings estimate was $4.9 billion over five years. We believe that $9.8 billion over 10 years is
a reasonable assumption because (1) the agribusiness subsidies are not one-off expenses and (2) we err on the side of
caution and ignore inflation. 267
Michael Ettlinger and Seth Hanlon, "Cut Spending in the Tax Code", in Center for American Progress
<http://www.americanprogress.org/issues/2011/03/pdf/tax_expenditures.pdf> [accessed 2011 April 28] 268
Congressional Budget Office, "Budget Options Volume 2", in Congressional Budget Office
<http://www.cbo.gov/ftpdocs/102xx/doc10294/08-06-BudgetOptions.pdf> [accessed 22 April 2011] 269
Congressional Budget Office, "Budget Options Volume 2", in Congressional Budget Office
<http://www.cbo.gov/ftpdocs/102xx/doc10294/08-06-BudgetOptions.pdf> [accessed 22 April 2011]
Reinventing Tax Expenditures 70
what services they receive from the government. That principle is violated if people can move
to low-tax foreign countries and escape U.S. taxation while retaining their U.S. citizenship.”270
Eliminating this subsidy would save the U.S. government at least $71 billion over the next 10
years.
RECOMMENDATION 12 $12.2 BILLION IN SAVINGS OVER 10 YEARS 271, 272
►Cut the mortgage interest deduction for vacation homes.
Each year, the federal government forgoes $104.5 billion in tax revenue that would otherwise
be collected by the baseline tax code. This huge sum of money subsidizes the purchase of
homes by allowing homeowners to deduct their mortgage interest payments from their tax
liability. But many economists are unconvinced that
the mortgage interest deduction actually encourages
homeownership. Either way, the mortgage interest
deduction should not be subsidizing the purchases of
vacation homes and yachts,273 which by definition do
not increase home ownership rates. But vacation
home and yacht deductions end up costing
approximately $1.2 billion each year, or $12 billion
over 10 years.
We recommend limiting the mortgage interest
deduction to primary residences. There is no reason for American taxpayers to be subsidizing
the purchase of pleasure boats and expensive vacation homes.274
RECOMMENDATION 13 $321.3 BILLION IN SAVINGS OVER 10 YEARS 275
►Limit deductions for high-income taxpayers.
Another way to generate savings from tax expenditures would be to cap them on a per
taxpayer basis. This could be done for all taxpayers, or just for those in the upper income
270
Congressional Budget Office, "Budget Options Volume 2", in Congressional Budget Office
<http://www.cbo.gov/ftpdocs/102xx/doc10294/08-06-BudgetOptions.pdf> [accessed 22 April 2011] 271
Michael Ettlinger and Seth Hanlon, "Cut Spending in the Tax Code", in Center for American Progress
<http://www.americanprogress.org/issues/2011/03/pdf/tax_expenditures.pdf> [accessed 2011 April 28] 272
The original cost savings estimate was $6.1 billion over five years. We believe that $12.2 billion over 10 years is
a reasonable assumption because (1) the continuing mortgage interest deduction for second homes and yachts is not
a one-off expense and (2) we err on the side of caution and ignore inflation. 273
This statement applies only to boats that are classified as second residences. 274
We do not recommend cutting the deduction for boats that are used as primary residences. 275
Office of Management and Budget, "Fiscal Year 2012 Budget of the U.S. Government, Receipts", in Office of
Management and Budget <http://www.whitehouse.gov/sites/default/files/omb/budget/fy2012/assets/receipts.pdf>
[accessed 28 April 2011]
―The mortgage interest
deduction should not be
subsidizing the purchases
of vacation homes and
yachts, which by
definition do not increase
home ownership rates.‖

Reinventing Tax Expenditures 71
brackets. This approach would avoid the tricky logistical issues of other caps while still
generating billions of dollars in savings.
Capping tax expenditures for just the upper income brackets seems like the best approach
given the already regressive nature of tax expenditures. Considering this same issue, Leonard
Burman asks, “For example, would it make sense to design a health insurance voucher worth 35
cents per dollar for high-income families, but only 10 cents per dollar for those with low
income?”276 The answer is obviously no, but that’s the system we’ve got in place. However,
were we to cap tax expenditure benefits for upper income taxpayers, we could compensate for
the regressive nature of tax expenditures.
President Obama has proposed a cap on upper income itemized tax expenditure benefits in
several budgets, including for Fiscal Year 2012.277 His proposal would “limit the tax rate at
which high-income taxpayers can take itemized deductions to 28 percent.” In other words, a
deduction could not be worth more than 28 percent of its full value to upper income earners,
even if they’re in the 35 percent income tax bracket. As the Tax Policy Center explains it, “If
you’re in the 35 percent bracket, a $100 deduction is worth $35. If you are in the 10 percent
bracket, it is only worth $10. The Obama plan would take a step towards turning these
deductions into quasi-credits by limiting their value to no more than 28 percent, no matter how
much you earn.”278 This would generate approximately $321 billion in savings over 10 years.
Split Savings between Tax Cuts and Deficit Reduction
RECOMMENDATION 14 VARIABLE DEFICIT INCREASE OVER 10 YEARS
►Reduce individual and corporate tax rates.
Nearly all of the tax reforms described in this section involve cutting tax subsidies, which are
essentially spending programs in disguise. While our long-term fiscal situation demands that a
large portion of the savings from cutting those spending programs goes towards deficit
reduction, it does not require that some cannot also be used to reduce the tax burden on
corporations and individuals.
The question is not whether individual and corporate taxes should be lowered, but rather by
how much. The cuts to tax subsidies that we have recommended in this section add up to
276
Leonard Burman, "Let's freeze more than chump change", in The Washington Post
<http://www.washingtonpost.com/wp-dyn/content/article/2010/02/01/AR2010020103072.html> [accessed 28 April
2011] 277
Office of Management and Budget, "Fiscal Year 2012 Budget of the U.S. Government", in Office of Management
and Budget <http://www.whitehouse.gov/sites/default/files/omb/budget/fy2012/assets/budget.pdf> [accessed 28
April 2011] 278
Howard Gleckman, "Obama’s Plan to Cap Tax Deductions", in Tax Policy Center
<http://taxvox.taxpolicycenter.org/2009/02/26/obama%e2%80%99s-plan-to-cap-tax-deductions/> [accessed 28
April 2011]
Reinventing Tax Expenditures 72
$600-800 billion in savings over the next 10 years. We believe that some percentage of that
should be used to lower individual and corporate tax rates.
Consider Other Options
In addition to our 14 key recommendations, we have included a few more tax expenditure
reform ideas that merit consideration. The first of these is an alternative to the cap on
deductions for high-income earners and would instead cap the total amount of tax
expenditures as a percent of GDP. The second option is a comprehensive tax reform that would
eliminate most tax expenditures and divide the savings between tax cuts and deficit reduction.
However, we also believe that, short of eliminating all or most tax expenditures, there are still
plenty more that should be cut. Implementing a tax expenditure performance review system
like the one we recommended in our Part One report might help us identify the less justifiable
tax expenditures.
OPTION 1 $3.5 TRILLION IN SAVINGS OVER 10 YEARS 279
►Cap tax expenditures as a percent of GDP.
Another option for tax expenditure reform is to cap tax expenditures as a percent of GDP. This
could complement other approaches, especially insofar as it would force policymakers to
prioritize among existing tax expenditures, modifying or eliminating the less important ones so
that the entire tax expenditure budget could fit within the cap.
Leonard Burman, a professor of economics at Syracuse University and the former director of
the Urban-Brookings Tax Policy Center, supports this top-down cap. His plan would take
President Obama’s proposed freeze on domestic discretionary spending—which would
generate $250 billion in savings over 10 years—and apply it to tax expenditures beginning in
the year 2012. Then, beginning in 2015, Burman would allow the cap to rise, indexing it for
inflation.280 How much does this plan generate in savings? —A whopping $3.5 trillion over 10
years. This is an impressive number, no doubt, but there are reasons to be skeptical.
First, there’s really no mechanism in place to sort out which tax expenditures should be
preserved and which should be discarded. Perhaps this could take place in the two tax-writing
committees, but the idea of imposing limits on tax-writers is fraught with difficulty. Not only
are loopholes likely to proliferate, but there’s no precedent of similar controls working for the
appropriations process.
279
Leonard Burman, "Let's freeze more than chump change", in The Washington Post
<http://www.washingtonpost.com/wp-dyn/content/article/2010/02/01/AR2010020103072.html> [accessed 28 April
2011] 280
Leonard Burman, "Let's freeze more than chump change", in The Washington Post
<http://www.washingtonpost.com/wp-dyn/content/article/2010/02/01/AR2010020103072.html> [accessed 28 April
2011]

Reinventing Tax Expenditures 73
Second, not having a specific price tag attached to any more than a few of these tax
expenditures is problematic. Whereas most spending programs are appropriated to a specific
dollar amount, tax expenditures are usually open-ended in commitment. Capping tax
expenditures would require a complicated claims system that would end up creating an
incentive to claim benefits before the cap was reached. In the end, this could create
marketplace distortions that would do more harm than good.
However, Citizens for Tax Justice has observed that there are ways to overcome these
difficulties. Specifically, Congress could cap tax expenditures at a particular amount each year,
and any increase above that amount, as projected by the Joint Committee on Taxation, would
have to be made up through cuts in tax expenditures. However, should Congress fail to agree
to the necessary amount of cuts, then a automatic trigger would be in place to reduce certain
tax expenditures (say itemized deductions) by the necessary amount. The idea is that these
automatically triggered reductions in tax expenditures would be so politically unpalatable as to
impel Congress to pass its own agreed-upon cuts to the necessary amount.
This plan may work, but given the complex steps necessary in its implementation, it is probably
not an ideal option. Still, the potential savings from this plan—$3.5 trillion over 10 years!—
necessitate its inclusion in our list of options worth considering.
OPTION 2 VARIABLE SAVINGS OVER 10 YEARS 281
►Eliminate most tax expenditures and split the savings.
Recommendation 12 in this section suggests dividing any tax expenditure savings between
deficit reduction and broad-based tax cuts. However, that would only apply to the tax
expenditures that we have identified for elimination in our earlier recommendations. One
could go several steps further and make the case for comprehensive tax reform that would
eliminate most, if not all, tax expenditures and other similar loopholes while (1) dramatically
reducing the deficit and (2) lowering broad-based rates.
The National Commission on Fiscal Responsibility and Reform did exactly that. In its tax reform
plan, the Commission lists three options: (1) Eliminate all tax expenditures, (2) Eliminate all
except keep the Child Tax Credit and the Earned Income Tax Credit (EITC), and (3) Eliminate all
except the Child Tax Credit, the EITC, the mortgage interest deduction for principal residences,
the exemption for employer-provided health insurance, and those tax benefits for charitable
giving, retirement savings, and pensions. Even under this third option, which keeps several big
tax expenditures, the corporate tax rate would drop from 35 percent to 28 percent, and
individual income tax rates would be no higher than 28 percent (for current 33 and 35 percent
281
National Commission on Fiscal Responsibility and Reform, in The Moment of Truth
<http://www.fiscalcommission.gov/sites/fiscalcommission.gov/files/documents/TheMomentofTruth12_1_2010.pdf>
[accessed 22 April 2011]
Reinventing Tax Expenditures 74
brackets), 22 percent (for current 25 and 28 percent brackets), and 12 percent (for current 10
and 15 percent brackets).
This sort of comprehensive tax reform plan, when paired with a deficit reduction plan, makes a
lot of sense and, if executed properly, would go a long way towards making our long-term fiscal
path more sustainable.
Conclusion
Our recommendations in this section will generate savings of $600-800 billion over the next 10
years. These savings should be split between deficit reduction on the one hand and broad-
based tax cuts on the other.
One important reason to go after tax expenditures is that many are low-hanging fruit for reform
or elimination. For years, the tax code has been used to disguise these spending programs as
either tax cuts or as “normal” elements of the tax code. For this reason, tax expenditures have
escaped the scrutiny that budgeted spending programs receive on an annual basis. This cannot
continue any longer. Tax expenditures are spending programs without the intermediate step of
tax collection. Rather than having the IRS collect taxes and the government spend them, tax
expenditures skip that collection step and directly redistribute wealth from all Americans to the
special interests that have lobbied most effectively.
In our last report, Part One, we explored several reforms that could increase oversight of tax
expenditures. We strongly support those reforms, and we also believe that now is the time to
cut those tax expenditures which are no longer justifiable.

Reinventing Social Security 75
REINVENTING SOCIAL SECURITY
OUR SEVEN KEY RECOMMENDATIONS
Revenue Increases
►RECOMMENDATION 1: Extend the payroll tax to capture 90 percent of covered wages.
Potential Savings: $107 billion over 10 years; $1.4 trillion over 30 years
►RECOMMENDATION 2: Include non-covered state and local government workers.
Potential Savings: $4 billion over 10 years; $566 billion over 30 years
►RECOMMENDATION 3: Improve the collection of existing taxes.
Potential Savings: $580 billion over 10 years
Benefit Adjustments
►RECOMMENDATION 4: Adopt a chained consumer price index.
Potential Savings: $92 billion over 10 years; $1.4 trillion over 30 years
►RECOMMENDATION 5: Gradually increase retirement age to 68 for those born after 1976.
Potential Savings: 23-25 percent of the Trust Fund shortfall
►RECOMMENDATION 6: Modify the benefits formula to add a third bend point.
Potential Savings: 25 percent of the Trust Fund shortfall
Increased Support for Low-Income Individuals
►RECOMMENDATION 7: Restructure the minimum payment for low-income individuals.
Increases 75 year Trust Fund shortfall by eight percent
Recommended Shortfall Closed
100 percent282
282
Based on staff calculations and pending review by the actuaries of the Social Security Administration.

Reinventing Social Security 76
Our Approach to Social Security Reform
Of all this country’s fiscal woes, Social Security’s problems should be—in theory, at least—
among the easiest to fix. We agree there is a problem; we know the fiscal magnitude of the
problem; we still have time to fix it. And it’s an issue in which every working American holds a
stake.
It took the threat in 1983 of Trust Fund insolvency to prompt President Reagan and a
Democratic Congress to approve a package of tax increases and benefit cuts to maintain Social
Security’s solvency for the last 28 years. Since then,
however, Social Security has become the epicenter of an
ideological battle over the role of government, thwarting
any attempt at meaningful change.
Some argue the government can fix Social Security by
effectively privatizing it—allowing beneficiaries to divert
a portion of the payroll taxes into personal accounts
invested in stocks and bonds. But we believe that Social
Security—and the defined benefit it guarantees,
regardless of stock market volatility or economic twists
and turns—is an elemental part of the compact this
country has with its workers.
Still, it is an expensive relationship. Social Security has
morphed into a $700-plus billion budgetary gorilla, paying benefits last year to 52.5 million
Americans. In 2011, Social Security covers an estimated 157 million workers, according to the
Social Security Administration.283
Despite $2.6 trillion in assets and total income in 2010 of $781 billion, the program’s trust fund
is projected to be exhausted in 2037, when incoming revenues will pay for about 78 percent of
scheduled annual benefits. It is estimated that between 2010 and 2084, the Social Security
system’s unfunded obligation nears $5.4 trillion—or about 0.6 percent of the GDP.284
In the near term, Social Security officials project that the system will spend more than it
receives in tax revenues in 2010 and 2011 before operating at a surplus for a few years.
Beginning in 2015, however, cash flow deficits will remain permanent—barring changes to the
system—and will deplete the Trust Fund in 2037. 283
Social Security Administration, "Social Security Administration" <http://www.ssa.gov/> [accessed 9 May 2011] 284
The Board of Trustees, Federal Old-Age and Survivors Insurance and Federal Disability Insurance Trust Funds,
"The 2010 Annual Report of the Board of Trustees of the Federal Old-Age and Survivors Insurance and Federal
Disability Insurance Trust Funds", in Social Security Administration
<http://www.ssa.gov/OACT/TR/2010/tr2010.pdf> [accessed 3 May 2011]
“Social Security...is not
a dole or a device for
giving everybody
something for nothing.
True Social Security
must consist of rights
which are earned
rights—guaranteed by
the law of the land.”
– Harry Truman,
August 13, 1945

Reinventing Social Security 77
Figure 3: Projected Social Security Trust Fund Balances 2010-2036285
An aging populace and a shrinking number of workers largely account for the bleak fiscal
forecast. Between 2010 and 2030, the number of beneficiaries will increase by 68 percent.
Meanwhile, the number of workers supporting the system will increase by only 19 percent.
That means the number of workers supporting each Social Security recipient will decline from
2.9 today to 2.1 in 2035, according to the Social Security Board of Trustees.
Meanwhile, the cost of benefits continues to rise. Social Security benefits are tied to wages
rather than prices. Since wages typically rise faster than prices, initial monthly benefits have
increased in real terms for each generation. And these benefits are crucial. For more than half
of elderly beneficiaries, Social Security provides the majority of their cash income. For about 25
percent of elderly beneficiaries, the program provides more than 90 percent of their income.
For 15 percent of elderly beneficiaries, Social Security is the sole source of retirement income.
The average retired worker benefit is about $14,000 a year. In 2010, the maximum benefit paid
was $28,000.
285
The Board of Trustees, Federal Old-Age and Survivors Insurance and Federal Disability Insurance Trust Funds,
"The 2010 Annual Report of the Board of Trustees of the Federal Old-Age and Survivors Insurance and Federal
Disability Insurance Trust Funds", in Social Security Administration
<http://www.ssa.gov/OACT/TR/2010/tr2010.pdf> [accessed 3 May 2011]

Reinventing Social Security 78
The increase in life expectancy has contributed to the program’s fiscal woes. Since 1940, men
and women reaching age 65 are likely to live about six years longer than previously expected—
to about 83 for men and 85 for women.
The statutory Social Security payroll tax rate is 12.4 percent and the current taxable maximum
for 2011 is $106,800. Prior to 1975, this maximum was periodically revised by Congress, but
the annual adjustments became mostly automatic thereafter, based on average wage growth.
Although the maximum taxable is indexed to average wage growth, the actual proportion of
covered wages subject to the tax has decreased since the early 1980s, as wages have
fragmented. Wages are now less equally distributed, with a larger share of high-wage earners
above the taxable maximum.
Against this demographic backdrop, program costs have
continued to escalate rapidly. Spending for Social
Security will approach 4.8 percent of the GDP in 2010 and
climb to 6.1 percent of the GDP by 2035. If there is one
lesson to be learned from all of these statistics, it is this:
The longer we delay, the worse the problem becomes—
and the more expensive to fix.
For example, the Congressional Budget Office looked at
two proposed changes to Social Security—changes that
we do not necessarily endorse—and examined the
potential costs of delaying their implementation. What is
instructive are not the specifics of the proposals, but the
fact that decisive action saved billions.
In the first case, the CBO examined a two percent boost to the payroll tax over the next 20
years. The agency found that if the plan were implemented in 2012, the boost in revenue would
have a more significant impact on the Trust Fund balance, prolonging a positive balance until
2083. Delaying the increase by 10 years, however, would knock nearly 30 years off the Trust
Fund’s life, leading to a negative balance in 2056.
Similarly, when the CBO looked at the impact of a 15 percent cut in benefits for new
beneficiaries, delaying the changes from 2017 to 2027 required that the cuts be increased by
one-third to achieve the same effect. These two examples illustrate the fiscal pitfalls of delay.
Irrespective of the package of adjustments we ultimately choose, it will be more cost effective
to implement changes now rather than later.
In the recommendations that follow, we take key steps in restoring Social Security to firm
financial footing, greatly closing—if not eliminating—the Trust Fund shortfall that threatens this
vital program. We believe these recommendations, which would not apply to those 55 years of
“To every American
out there on Social
Security, to every
American supporting
that system today, and
to everyone counting
on it when they retire,
we made a promise to
you, and we are going
to keep it.”
– George H.W. Bush,
January 31, 1990

Reinventing Social Security 79
age or older, reflect the fiscal, social, and demographic realities that now define our society.
And most importantly, we believe these changes will allow America to keeps its promise to
older Americans—a promise of dignity and a measure of security in retirement.

Reinventing Social Security 80
Our Seven Key Recommendations
Revenue Increases
RECOMMENDATION 1 $107 BILLION OVER 10 YEARS; $1.4 TRILLION OVER 30286
►Extend the Social Security payroll tax to capture 90 percent of covered
wages.
When the Roosevelt Administration first advanced the idea of Social Security, it did not include
a maximum taxable wage—nor did the draft bill that went to Congress include a limit.
Roosevelt was concerned about the number of elderly living in poverty at the time and
intended the program to provide the indigent with a safety net.
But the lack of a cap changed as the Social Security legislation winded its way through Congress,
ultimately emerging with a $3,000 ceiling on taxable earnings. In the 1970s, as a means of
financing Social Security cost of living adjustments, Congress implemented a process to
automatically adjust the maximum taxable wage.
Currently workers pay Social Security tax on salaries up to $106,800, with the cap indexed to
mirror the increase in average earnings. Congress envisioned about 90 percent of covered
wages being subject to the tax. But there has been faster wage growth at the upper end of the
wage spectrum, and the cap now covers only about 83 percent of wages in covered
employment. This growing disparity helps make the argument that the 90 percent tax level
should be restored—and maintained with periodic adjustments.
Experts say gradually raising the cap would mean that earnings up to around $180,000 would
be initially subject to the Social Security tax. Increasing the cap will not only restore equity, but
it will also close about 30 percent of the 75-year Trust Fund deficit—with a relatively small
percentage of workers affected. This proposal has received wide support from many experts,
ranging from the Bipartisan Policy Center to the President’s Fiscal Commission.
RECOMMENDATION 2 $4 BILLION OVER 10 YEARS; $566 BILLION OVER 30 YEARS287
►Include non-covered state and local government workers.
Currently, 93 percent of all workers are covered by Social Security, but an estimated four
million state and local government employees have their own pension plans and have opted 286
The Debt Reduction Task Force, "Restoring America's Future", in Bipartisan Policy Center
<http://www.bipartisanpolicy.org/sites/default/files/BPC%20FINAL%20REPORT%20FOR%20PRINTER%2002%
2028%2011.pdf> [accessed 27 April 2011] 287
The Debt Reduction Task Force, "Restoring America's Future", in Bipartisan Policy Center
<http://www.bipartisanpolicy.org/sites/default/files/BPC%20FINAL%20REPORT%20FOR%20PRINTER%2002%
2028%2011.pdf> [accessed 27 April 2011]

Reinventing Social Security 81
out of Social Security. That makes for complicated retirement planning and, given the dire fiscal
health of some state and local pension plans, creates unnecessary risk for workers.
By requiring new state and local government hires to participate in Social Security, another nine
percent of the 75-year Trust Fund shortfall would be closed. This is an idea advanced by others,
including President Obama’s Fiscal Commission—and it makes fiscal sense.
RECOMMENDATION 3 $580 BILLION IN SAVINGS OVER 10 YEARS288
►Improve the collection of existing payroll taxes.
According to a 2010 hearing held by the Senate Special Committee on Aging, the IRS reports
that approximately $58 billion in Social Security tax goes uncollected annually. The gap is largely
due to under-reported self-employment taxes. The Committee concluded that “increasing the
collection of unpaid Social Security payroll taxes could significantly reduce the funds needed to
make Social Security solvent over the next 75 years.” We agree.
Benefit Adjustments
RECOMMENDATION 4 $92 BILLION OVER 10 YEARS; $1.4 TRILLION OVER 30 YEARS289
►Adopt a chained consumer price index.
Social Security benefits are currently adjusted using one cost-of-living measure known as the
CPI-W. But government economists have developed a new measure that more accurately
reflects changes in prices because it tracks changes in purchasing across a range of consumer
categories.
But this “chained” CPI grows at an annual rate 0.3 percent slower than the traditional measure.
Critics say that this will result in lower benefits for seniors, but the current formula overstates
inflation. Adopting this provision will help close the funding gap in the Trust Fund by about 25
percent, thereby contributing to the fiscal health of the entire program.
288
United States Senate Special Committee on Aging, "Social Security Modernization: Options to Address Solvency
and Benefit Adequacy", in United States Senate Special Committee on Aging
<http://aging.senate.gov/ss/ssreport2010.pdf> [accessed 3 May 2011] 289
The Debt Reduction Task Force, "Restoring America's Future", in Bipartisan Policy Center
<http://www.bipartisanpolicy.org/sites/default/files/BPC%20FINAL%20REPORT%20FOR%20PRINTER%2002%
2028%2011.pdf> [accessed 27 April 2011]

Reinventing Social Security 82
RECOMMENDATION 5 23-25 PERCENT OF THE TRUST FUND SHORTFALL290
►Gradually increase full retirement age to 68 for those born after 1976.
Americans are living longer. When Social Security became law, the average life expectancy was
64 and the retirement age was 65. On average, Americans now spend 20 years in retirement,
and Social Security needs to reflect the new reality.
Gradually increasing the full retirement age to 68 for people born in 1977 or later—and
speeding up the increase in retirement age to 67 for those born in 1953 or later—would
eliminate nearly one-quarter of the long-term Trust Fund deficit. The increase provides
adequate time for those future beneficiaries, who are still in their 30s, to plan their
retirements. This increase also maintains the current ratio of retirement years to work years.
Some will argue the increase favors higher wage employees, who have longer life expectancies
than their blue-collar contemporaries. Accordingly, a hardship provision should be
implemented to protect disabled workers from an increase in the FRA.
RECOMMENDATION 6 25 PERCENT OF THE TRUST FUND SHORTFALL291
►Modify the benefits formula to add a third bend point.
Modifying the benefit formula by adding an additional “bend point” would achieve two
important aims of Social Security: it would increase the progressivity of benefits to the
advantage of lower- and middle-wage earners and
help close the projected 75-year Trust
Fund shortfall.
As has been suggested by the President’s Fiscal
Commission and others, we favor a benefit formula
that adds a third bend point, creating a four-bracket
formula, and modifies the replacement factors. The
goal is to change the formula in such a way that
achieves a 25 percent reduction in the projected
Trust Fund solvency gap and protects benefits for lower- and middle-wage earners.
We believe that one way to attain that goal would be to change the current replacement factor
structure from 90 percent, 32 percent, and 15 percent to a more progressive structure of 90
290
United States Senate Special Committee on Aging, "Social Security Modernization: Options to Address Solvency
and Benefit Adequacy", in United States Senate Special Committee on Aging
<http://aging.senate.gov/ss/ssreport2010.pdf> [accessed 3 May 2011] 291
American Association of Retired Persons, "Reform Options for Social Security", in American Association of
Retired Persons <http://assets.aarp.org/rgcenter/econ/i3_reform.pdf> [accessed 3 May 2011]
―The goal is to increase
the progressivity of
benefits to the advantage
of lower- and middle-wage
earners and help close the
projected 75-year Trust
Fund shortfall.‖

Reinventing Social Security 83
percent, 55 percent, 25 percent, and 12 percent. The exact changes to the formula—such as
the dollar amounts for each bend point —would be determined at the time of implementation.
Whatever the final numbers, the goals of the changes remain the same: a 25 percent reduction
in the projected Trust Fund shortfall and the enhancement of benefit adequacy — a pillar of the
Social Security program.
Increased Support for Low-Income Individuals
RECOMMENDATION 7 INCREASES 75 YEAR SHORTFALL BY EIGHT PERCENT292
►Restructure the minimum payment for low-income individuals.
The very soul of Social Security centers on protecting the most vulnerable of society. According
to the CBO, eight percent of all Social Security beneficiaries over age 65 are considered poor.
That percentage nearly doubles for single senior citizens.
Current law includes a special minimum benefit for workers who have toiled for years in low-
paying jobs. Currently, that special benefit tops out at $763 a month—or about 85 percent of
federal poverty guidelines—for workers with 30
years of Social Security-covered wages.
But this benefit is reaching fewer beneficiaries each
year—from 142,000 in 2000 to about 82,000 in 2009.
That’s because the special minimum benefit is tied
to prices, while Social Security benefits are indexed
to wages (which have traditionally risen faster than
prices). Since a worker is awarded the special minimum only if it exceeds the regular benefit,
the Social Security Administration predicts that by 2012, the special minimum will cease to raise
benefits for workers reaching age 62. In order to provide a higher initial benefit for a larger
number of low-wage workers in a job covered by Social Security, we advocate providing a new
minimum benefit that equals 125 percent of the poverty line and is indexed to wages.
This restructuring would be based on the number of years of qualifying work, increasing the
benefit in accordance with the length of employment up to 30 years. The CBO estimates in
2012 that the monthly benefit for a person age 65 who has worked 30 years would be about
$1,170 a month—or 125 percent of the poverty level. For workers with less than 30 years, the
special minimum would be decreased to zero for employees with less than 10 years of work.
Benefits would increase about 30 percent for low wage earners born in 2000.
292
Congressional Budget Office, "Social Security Policy Options", in Congressional Budget Office
<http://www.cbo.gov/ftpdocs/115xx/doc11580/07-01-SSOptions_forWeb.pdf> [accessed 3 May 2011]
―The very soul of Social
Security centers on
protecting the most
vulnerable of society.‖
Reinventing Social Security 84
A number of groups, including President Obama’s Fiscal Commission, have advocated
increasing the special minimum benefit—and we agree.293 Expansion of this benefit serves an
important societal role despite its impact on the Trust Fund.
Expanding the new minimum benefit to 125 percent of the poverty level would add about eight
percent to the 75-year Trust Fund shortfall. But when implemented in concert with the other
recommended measures, it would not upend the Trust Fund’s financial stability, and it would
move the Social Security system more in line with its original mission.
Conclusion
Social Security represents one of the pillars of social justice in this country: the right of workers
to retire in dignity instead of poverty. The 1983 reforms to Social Security—accomplished
through the collaboration of a Republican President and Democratic Speaker of the House—
restored the fiscal health of the program for the next 25 years.
We have the chance to accomplish something even more dramatic. Changes to income subject
to taxable income limits, modest adjustments to retirement age, and expanding coverage to
some state and local employees could assure retirees of a defined benefit for decades to come.
These adjustments will not have any impact on people over the age of 55.
Private accounts—while politically attractive in this anti-government era—are fraught with
unknowns: How much will these accounts costs? Who will manage them? Where in the federal
budget will the money come from to cover the transition costs? Ironically, those advocating
private accounts in the name of smaller government will actually be creating another layer of
government in order to manage the accounts.
To minimize the impact on future beneficiaries—and to restrain costs—we must act now to
ensure the solvency of Social Security. Our children depend on it.
293
National Commission on Fiscal Responsibility and Reform, in The Moment of Truth
<http://www.fiscalcommission.gov/sites/fiscalcommission.gov/files/documents/TheMomentofTruth12_1_2010.pdf>
[accessed 22 April 2011]
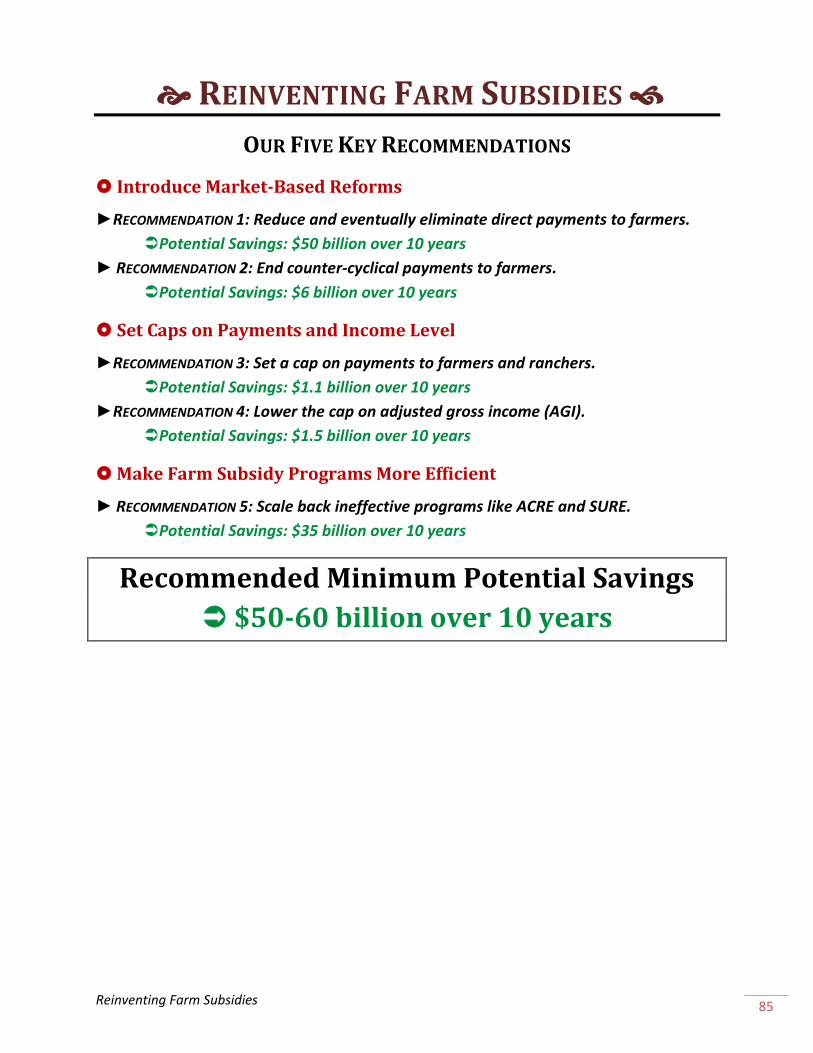
Reinventing Farm Subsidies 85
REINVENTING FARM SUBSIDIES
OUR FIVE KEY RECOMMENDATIONS
Introduce Market-Based Reforms
►RECOMMENDATION 1: Reduce and eventually eliminate direct payments to farmers.
Potential Savings: $50 billion over 10 years
► RECOMMENDATION 2: End counter-cyclical payments to farmers.
Potential Savings: $6 billion over 10 years
Set Caps on Payments and Income Level
►RECOMMENDATION 3: Set a cap on payments to farmers and ranchers.
Potential Savings: $1.1 billion over 10 years
►RECOMMENDATION 4: Lower the cap on adjusted gross income (AGI).
Potential Savings: $1.5 billion over 10 years
Make Farm Subsidy Programs More Efficient
► RECOMMENDATION 5: Scale back ineffective programs like ACRE and SURE.
Potential Savings: $35 billion over 10 years
Recommended Minimum Potential Savings
$50-60 billion over 10 years
Reinventing Farm Subsidies 86
Our Approach to Farm Subsidy Reform
Agricultural (or farm) subsidies, which are paid to landowners by the U.S. Department of
Agriculture (USDA), are a favorite topic within the budgetary reform community for several
reasons. First, it’s clear that larger farms are shifting production towards the eight crops that
bring in the most federal dollars: wheat, corn, barley, oats, sorghum, rice, cotton, and
oilseeds.294 This directly contributes to the decline of smaller farms. Second, the artificial
incentive to produce cash crops—which go to foreign markets, not American kitchen tables—
distorts international trade, thereby violating current trade agreements and WTO policy.
The Environmental Working Group estimates that payments to farmers295 under federal farm
programs totaled one quarter of a trillion dollars between 1995 and 2009.296 Farm safety net
programs can be divided into three main categories:
1. Commodity programs: These programs average $6 billion in payments annually and
include direct payments, counter-cyclical payments, ACRE (Average Crop Revenue
Election) Program, and marking assistance (for example, Farm Service Agency Loan
Deficiency Payments/marking assistance loans).
2. Risk management tools: These programs average $8.4 billion in payments annually, and
include crop insurance and NAP (Noninsured Crop Disaster Assistance Program), which
is essentially catastrophic coverage for non-insurable crops.
3. Disaster assistance: These programs, totaling $2 billion in payments and brand new in
the 2008 farm bill, include Supplemental Revenue Assistance Payments (SURE), the
Landowner Incentive Program (LIP), Livestock Forage Program (LFP), Livestock, Honey
Bees, and Farm-Raised Fish Program (ELAP), and the Tree Assistance Program (TAP).
294
Government Accountability Office, "Farm Programs: Information on Recipients of Federal Payments", in
Government Accountability Office <http://www.gao.gov/new.items/d01606.pdf> [accessed 2 May 2011] 295
This includes disaster assistance and conservation payments. 296
Ken Cook, "Government's Continued Bailout of Agribusiness" <http://farm.ewg.org/summary.php> [accessed 29
April 2011]

Reinventing Farm Subsidies 87
Figure 4: Farm Safety Net Programs under the 2008 Farm Bill and Other Legislation297
Within these three categories of farm safety net programs, there are three basic ways that
farmers get paid: (1) direct payments, (2) counter-cyclical payments, and (3) market-loss
payments.
1. Direct payments: Farmers and landowners receive payments regardless of crop prices
and farm profits, and even if the recipient does not plant a crop that year. Payments are
based on historic rather than actual yield, as well as on historical (“base”) acres. Direct
payments have averaged around $5 billion per year since 2005.298
2. Counter-cyclical payments: These payments are made available when crop prices fall
below a level set in law by Congress in the Farm Bill (reauthorized roughly every five
years). Counter-cyclical payments totaled $1.2 billion in 2009. It’s important to note
that, as with direct payments, countercyclical payments are tied to a farm’s base acres.
In other words, even though the countercyclical payment rate formula depends on
297 Dennis A Shields, Jim Monke and Randy Schnepf, "Farm Safety Net Programs: Issues for the Next Farm Bill",
in Congressional Research Service <http://www.crs.gov/Products/R/PDF/R41317.pdf> [accessed 29 April 2011] 298
Ken Cook, "Government's Continued Bailout of Agribusiness" <http://farm.ewg.org/summary.php> [accessed 29
April 2011]

Reinventing Farm Subsidies 88
market prices, it does not require that the farmer produce any of the crop or
commodity.
3. Market-loss payments: These payments are made available to specific producers (MILC,
the Milk Income Loss Contract, is one such program for dairy) when prices fall below a
specified level, as set by Congress in the Farm Bill.
Payments to farmers under federal farm programs are estimated to have totaled one quarter of
a trillion dollars between 1995 and 2009. During that time, “the largest and wealthiest top 10
percent of farm program recipients received 74 percent of all farm subsidies with an average
total payment over 15 years of $445,127 per recipient. The bottom 80 percent of farmers
received an average total payment of just $8,682 per recipient.”299
These discrepancies paint a very clear picture of the ineffective and inefficient nature of current
farm subsidy programs. This is not to say that farm subsidies should be cut entirely, but rather
that as we face record federal deficits and an economy struggling to return to sustainable
economic growth and job creation, it is in our best interest to modernize and reform these farm
subsidy programs.
299
Ken Cook, "Government's Continued Bailout of Agribusiness" <http://farm.ewg.org/summary.php> [accessed 29
April 2011]

Reinventing Farm Subsidies 89
Our Five Key Recommendations
Introduce Market-Based Reforms
In this section, we discuss several long-term reforms that could be implemented over the next
few years, beginning with the passage of the next Farm Bill. While we present full 10 year
savings estimates for these reforms, it’s unlikely that those savings would be realized in the
next 10 years. For that we reason, we have adjusted our grand total projection ($50-60 billion
over 10 years) downward from a substantially bigger number.
RECOMMENDATION 1 $50 BILLION IN SAVINGS OVER 10 YEARS300, 301
►Reduce and eventually eliminate direct payments to farmers.
Historically, farm bills have responded to the needs of farmers and ranchers at the times they
were enacted. Needs change with the environment (reacting to the Dust Bowl in the 1930s,
Congress passed the Soil Conservation and Domestic Allotment Act in 1936). So what we
should be asking ourselves today, in the wake of the greatest recession we’ve seen in decades,
is this: What are the current needs of our farmers and
ranchers and how can the farm bill help fill those
needs while being mindful of our fiscal challenges?
Ultimately, direct payments can and should be
eliminated—this would save us approximately $50
billion over 10 years. However, in the short-term,
capping direct payments is more achievable and was
discussed during the last Farm Bill debate in 2007-
2008. We could cap payments at $10,000 or $20,000,
or simply qualify payments on adjusted gross income
(AGI), say at $150,000. In this example, once a farmer hits an AGI of $150,000, support would
stop. These caps could be an effective transition to ultimate elimination of direct payments.
The most important idea to highlight here is that the Farm Bill is the place for agricultural
subsidy reform. We should reform our agricultural policy to support producers through
market-oriented risk management tools that adjust with market prices and pay farmers only
when they need it (when they suffer a real loss in revenue due to weather or some other
300
Environmental Working Group, "Farm Subsidy Database"
<http://farm.ewg.org/progdetail.php?fips=00000&progcode=total_dp®ionname=theUnitedStates> [accessed 29
April 2011] 301
To calculate this figure, we averaged direct payment outlays between 2003 and 2009. This average, $5 billion,
was then assumed to be the approximate payments level for each of the next 10 years. We erred on the side of
caution and did not assume any cost inflation.
―We should reform our
farm policy to support
producers through
market-oriented risk
management tools that
adjust with market
prices and pay farmers
only when they need it.‖

Reinventing Farm Subsidies 90
catastrophic event) and move away from payments based on base acres or historic yields. In
other words, we should pay them based on what a farmer actually does produce rather than
what we think a farmer will produce.
RECOMMENDATION 2 $6 BILLION IN SAVINGS OVER 10 YEARS302, 303
►Reduce and eventually eliminate counter-cyclical payments to farmers.
Today, counter-cyclical payments are not actually paying that much to farmers because
commodity prices, which determine the payments, are strong across the board. This indicates a
couple of things: (1) that this type of payment is not working, but also (2) that some of the
target prices (as established by Congress in the Farm Bill) are inappropriate. Consider the
target price for corn at $2.63. Today, corn is trading at over $7 a bushel. A farmer would be
completely out of business before corn dropped to $2.63 a bushel, negating the entire formula
and program.
One solution might be eliminating the counter-cyclical program but keeping strong crop
insurance for producers, thus giving them a share of the risk but providing some insurance in
case of natural disasters. We endorse this option, which would save $6 billion over ten years.
Set Caps on Payments and Income Level
In this section, in contrast to the last section, we recommend several intermediate reforms that
could be implemented immediately. While we present full 10 year savings estimates for these
reforms, it’s likely we’d want to phase them out as more permanent solutions (such as the
previous two recommendations) were implemented. For that reason, we have adjusted our
grand total projection downward.
RECOMMENDATION 3 $1.1 BILLION IN SAVINGS OVER 10 YEARS304
►Set a cap on payments to ranchers and farmers.
Senator Chuck Grassley of Iowa introduced a bill in August 2010 that would cap payments to
farmers. As we move towards eventual elimination of direct and counter-cyclical payments,
per the above recommendations, this cap on payments could provide a safety net for current
producers while the markets adjust to a world without direct and counter-cyclical payments.
302
Dennis A Shields, Jim Monke and Randy Schnepf, "Farm Safety Net Programs: Issues for the Next Farm Bill", in
Congressional Research Service <http://www.crs.gov/Products/R/PDF/R41317.pdf> [accessed 29 April 2011] 303
The original cost savings estimate was $0.6 billion per year. We believe that $6 billion over 10 years is a
reasonable assumption because (1) counter-cyclical payments are not one-off expenses and (2) we err on the side of
caution and ignore inflation. 304
Chuck Grassley, "Grassley, Feingold Introduce Legislation to Focus Farm Payments on Small and Medium-Sized
Farmers" <http://grassley.senate.gov/news/Article.cfm?customel_dataPageID_1502=28041> [accessed 29 April
2011]
Reinventing Farm Subsidies 91
In his release, Senator Grassley wrote, “Rural America can’t continue to withstand the pressure
that unlimited payments create. The farm program was never intended to help big farmers get
bigger; instead it was created to help those who couldn’t withstand the political whims of
Washington or the fierce reckonings of Mother Nature. When 10 percent of the nation’s
farmers receive more than 70 percent of the payments, it erodes public confidence in federal
farm programs, and this legislation is a way to stop that trend from growing.”
Senator Grassley’s bill caps all payments at $250,000. More specifically, it caps direct payments
at $40,000, counter-cyclical payments at $60,000, and marketing loan gains, loan deficiency
payments, and commodity certificates at $150,000. The bill also focuses on closing loopholes
that farmers and ranchers often use to maximize payments. For the sake of this report, we
recommend lower numbers that come out to a $100,000 total cap on payments.
RECOMMENDATION 4 $1.5 BILLION IN SAVINGS OVER 10 YEARS305
►Lower the cap on adjusted gross income (AGI).
Capping AGI was discussed during the last Farm Bill negotiations. The Bush Administration
recommended a cap at $200,000 AGI, which makes it all the more surprising that the current
cap is $750,000 for farm income and $500,000 for non-farm. That means a producer could
make $745,000 on-farm and $495,000 off-farm for a total income of $1.24 million, and still
receive a check from the government! We propose a cap in line with former President Bush’s
proposal: $200,000, or perhaps even lower.
An alternative might be a hybrid cap on both payments and a lower AGI. For example,
President Obama’s Fiscal Year 2012 budget recommends lowering the direct payment cap from
$40,000 to $30,000, and reducing the AGI limitation by $250,000 for farm and non-farm
income. This would work out to $500,000 adjusted gross on-farm income and $250,000
adjusted gross non-farm income. This is similar to President Bush’s proposal, which would also
have redistributed the $360,000 limit across the payment types, eliminated the three-entity
rule306, and applied a single limit to all commodities. This plan, which we endorse, would save
$596 million over five years and $1.5 billion over 10 years, according to the CBO.307
305
Jim Monke, "Payment Limits for Farm Commodity Programs: Issues and Proposals", in National Council for
Science and the Environment <http://ncseonline.org/NLE/CRSreports/06Oct/RS21493.pdf> [accessed 2 May 2011] 306
Under the three-entity rule, an individual could receive a full payment directly and up to a half payment from
each of two additional entities. 307
This savings estimate dates to 2006.
Reinventing Farm Subsidies 92
Make Farm Subsidy Programs More Efficient
RECOMMENDATION 5 $35 BILLION IN SAVINGS OVER 10 YEARS308, 309
►Scale back ineffective programs like ACRE and SURE.
Pulling the rug out from under American agriculture could have disastrous effects on our
domestic food production. Still, the support programs that producers and ranchers rely on are
too often inefficiently designed and duplicative. Responsible reform could save taxpayers
billions of dollars annually.
In February 2011, Carl Zulauf, an agricultural economist at Ohio State University, recommended
a set of reforms that would base agricultural subsidy support on actual risk and loss.310 Zulauf
asks important questions about our current subsidy structure: “Is it fair to receive farm program
payments even if a loss does not exist?” he asks. “For example, even though many crops had
record revenue, direct payments were made in 2007 and 2008. To many, especially non-
farmers, this seems unfair,” Zulauf continues.
Zulauf proposes implementing a loss condition for receipt of all farm program payments similar
to the one that’s used in the ACRE program (Average Crop Revenue Election): “…imposing an
ACRE farm crop loss condition for the receipt of direct payments will result in an average
eligibility share of around 50 percent, translating into average annual savings of around $2.5
billion per year”, or $25 billion over 10 years.311 Ultimately, these direct payments should be
eliminated. But until that is feasible, we endorse an alternative, like the implementation of a
loss condition for payments.
Another duplicative program is the SURE (Supplemental Revenue Assistance) Program, which
provides assistance for whole-farm production disaster. Since its inception in the 2008 Farm
Bill, SURE has had a mixed track record. According to the USDA, it is the most complex program
the USDA Farm Service Agency has ever undertaken. Many farmers also question its fairness.
The Congressional Research Service has echoed these concerns. Dennis Shields, in a December
2010 CRS report, writes that SURE “has faced a number of implementation challenges in terms
of program administration, such as collecting and tabulating a significant amount of data for
308
Dennis A Shields, "A Whole-Farm Crop Disaster Program: Supplemental Revenue Assistance Payments
(SURE)", in Congressional Research Service <http://www.nationalaglawcenter.org/assets/crs/R40452.pdf>
[accessed 29 April 2011] & Carl Zulauf, "Suggestions for Current Farm Safety Net Programs While Cutting Cost",
in The Ohio State University <Suggestions for Current Farm Safety Net Programs While Cutting Cost> [accessed 29
April 2011] 309
This estimate is a rough calculation by the authors. Actual savings will vary widely year to year. 310
Carl Zulauf, "Suggestions for Current Farm Safety Net Programs While Cutting Cost", in The Ohio State
University <Suggestions for Current Farm Safety Net Programs While Cutting Cost> [accessed 29 April 2011] 311
Carl Zulauf, "Suggestions for Current Farm Safety Net Programs While Cutting Cost", in The Ohio State
University <Suggestions for Current Farm Safety Net Programs While Cutting Cost> [accessed 29 April 2011]

Reinventing Farm Subsidies 93
individual farmers, as well as crop price data that are not readily available. Another issue has
been accounting for various insurance products when determining the farmer’s guarantee
level.”312
SURE is one of 37 farm programs that does not have a baseline in the 2012 Farm Bill. This
means the program could simply sunset on its own. Absent major reforms to the program, we
support a sunset of the SURE program in the upcoming Farm Bill. This would save about $10
billion over the next 10 years.313 The two reforms discussed in the section combined add up to
$35 billion in savings over 10 years.
Conclusion
Agricultural subsidy reform will be painful—there are no two ways about it. But at the heart of
this issue should be the idea that programmatic support for farmers and ranchers is something
that should be there when they need it and not when they don’t. There is clearly a place for
disaster assistance and for market- and risk-based support. These programs help ensure that
we can continue to produce food here at home. But if farmers aren’t producing, they shouldn’t
be receiving a check, plain and simple.
There are agriculture experts across the country, some of whom we’ve cited here (Professor
Zulauf and Senator Grassley, for example), offering thoughtful and pragmatic ways to reform
our farm subsidy programs. We encourage this dialogue and look forward to debating the next
Farm Bill, which should not only address the needs of farmers, but must also help put our
budget back on sustainable path.
312
Dennis A Shields, "A Whole-Farm Crop Disaster Program: Supplemental Revenue Assistance Payments
(SURE)", in Congressional Research Service <http://www.nationalaglawcenter.org/assets/crs/R40452.pdf>
[accessed 29 April 2011] 313
In 2010, the U.S. Department of Agriculture (USDA) issued more than $2.0 billion for 2008 crop losses under
the SURE program, with the level of payments by state generally proportional to indemnities. Over 10 years, we
estimate that eliminating SURE could save $10 billion. But the numbers will vary greatly year to year given the
unpredictability of disasters.

Reinventing Non-Defense Discretionary Spending 94
REINVENTING NON-DEFENSE DISCRETIONARY
Discretionary Spending (Appropriations) in the Budget
Discretionary spending is spending Congress must appropriate each year. This is in contrast to
mandatory spending programs like Social Security or Medicare which spend federal dollars
without appropriation from Congress. Discretionary spending made up approximately 35.2
percent of the total
budget in 2010,314 or
$1.25 trillion total.315
Discretionary spending
can be split into two main
categories: defense and
non-defense, with well
over half going to
defense. This is to say
that of the total federal
budget, approximately 15
percent is allocated to
non-defense discretionary
spending.316
Non-Defense (Domestic) Discretionary Spending
Given that non-defense discretionary spending adds up to only 15 percent of the government’s
overall budget (see the graph on the next page),317 cuts to non-defense discretionary spending
314
Michael Linden and Michael Ettlinger, "Interactive: What Is Non-Defense Discretionary Spending?", in Center
for American Progress <http://www.americanprogress.org/issues/2010/03/discretionary_spending_interactive.html>
[accessed 29 April 2011] 315
Office of Management and Budget, "Fiscal Year 2012 Budget of the U.S. Government", in Office of Management
and Budget <http://www.whitehouse.gov/sites/default/files/omb/budget/fy2012/assets/budget.pdf> [accessed 28
April 2011] 316 Michael Linden and Michael Ettlinger, "Interactive: What Is Non-Defense Discretionary Spending?", in Center
for American Progress <http://www.americanprogress.org/issues/2010/03/discretionary_spending_interactive.html>
[accessed 29 April 2011] 317
Michael Linden and Michael Ettlinger, "Interactive: What Is Non-Defense Discretionary Spending?", in Center
for American Progress <http://www.americanprogress.org/issues/2010/03/discretionary_spending_interactive.html>
[accessed 29 April 2011]
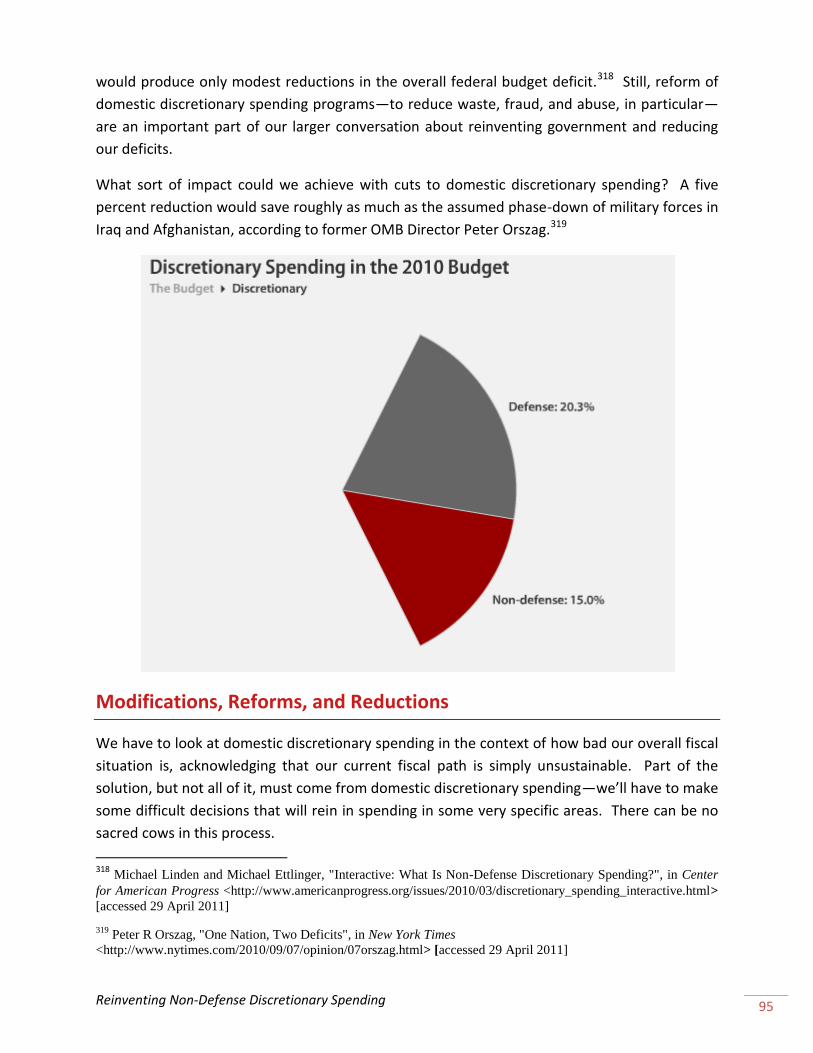
Reinventing Non-Defense Discretionary Spending 95
would produce only modest reductions in the overall federal budget deficit.318 Still, reform of
domestic discretionary spending programs—to reduce waste, fraud, and abuse, in particular—
are an important part of our larger conversation about reinventing government and reducing
our deficits.
What sort of impact could we achieve with cuts to domestic discretionary spending? A five
percent reduction would save roughly as much as the assumed phase-down of military forces in
Iraq and Afghanistan, according to former OMB Director Peter Orszag.319
Modifications, Reforms, and Reductions
We have to look at domestic discretionary spending in the context of how bad our overall fiscal
situation is, acknowledging that our current fiscal path is simply unsustainable. Part of the
solution, but not all of it, must come from domestic discretionary spending—we’ll have to make
some difficult decisions that will rein in spending in some very specific areas. There can be no
sacred cows in this process.
318 Michael Linden and Michael Ettlinger, "Interactive: What Is Non-Defense Discretionary Spending?", in Center
for American Progress <http://www.americanprogress.org/issues/2010/03/discretionary_spending_interactive.html>
[accessed 29 April 2011]
319 Peter R Orszag, "One Nation, Two Deficits", in New York Times
<http://www.nytimes.com/2010/09/07/opinion/07orszag.html> [accessed 29 April 2011]

Reinventing Non-Defense Discretionary Spending 96
In the past, some have supported a freeze in non-defense discretionary spending. That may
improve our long-term fiscal outlook, but it ignores the fact that many, if not most, domestic
spending programs serve an important purpose. To put it simply, government’s mission
matters, and it matters a lot right now when millions of Americans are unemployed or
underemployed and depend on temporary support from the government. We can’t set
arbitrary numbers across the board and cut for the sake of cutting. We must strengthen
programs that work and cut those that don’t while still bearing in mind the overall level of cuts
that are necessary. The chart below320 highlights the different areas of non-defense
discretionary spending.
How to Limit Non-Defense Discretionary Spending
Many budget experts believe that the five-year discretionary spending caps that were first
passed in the Budget Enforcement Act of 1990 were a major reason the federal government
achieved four balanced budgets in the 1990s. Susan J. Irving, the GAO Director of Federal
Budget Analysis, testified before the House Budget Committee in 2001 that the 1990s-era
spending caps were effective in restraining spending:
320
Michael Linden and Michael Ettlinger, "Interactive: What Is Non-Defense Discretionary Spending?", in Center
for American Progress <http://www.americanprogress.org/issues/2010/03/discretionary_spending_interactive.html>
[accessed 29 April 2011]

Reinventing Non-Defense Discretionary Spending 97
Enforcement is more successful when it is tied to actions controlled by the
Congress and the President. Both the BEA (Budget Enforcement Act) spending
caps and the PAYGO enforcement rules were designed to hold the Congress and
the President accountable for the costs of the laws enacted each session—not
for costs that could be attributed to economic changes or other factors.321
But despite their success, the caps were allowed to expire in 2002, leading to what many saw as
a series of fiscally irresponsible budgets.
Spending caps for domestic discretionary spending have been proposed in several different
budget plans. One vision of spending caps can be found in the “Blue Dog Blueprint for Fiscal
Reform” released last year. The Blue Dogs, a group of conservative and moderate Democrats
who emphasize fiscal responsibility, recommend the following: “Cut non-security discretionary
spending by two percent for each of the next three
years, and freeze spending levels for the subsequent
two years”. According to the Blue Dogs, this would save
American taxpayers over $400 billion over the next 10
years.322
Another version of discretionary spending caps was
included in President Obama’s Fiscal Year 2011 budget.
The President proposed freezing non-security
discretionary spending for the next three fiscal years, 2011 through 2013. However, this cap
would exempt the entire Department of Defense, as well as the Department of Homeland
Security and the Department of Veterans Affairs. The President’s proposed freeze, if enacted,
would save approximately $250 billion over the next 10 years.323 We support cuts to non-
defense discretionary spending, but we also believe that these cuts must not exclude security
and defense spending.
In March of 2010, U.S. Senators Jeff Sessions (R-AL), Claire McCaskill (D-MO), and Jon Kyl (R-AZ)
proposed imposing binding caps on total defense and non-defense discretionary spending for
fiscal years 2010-2014, locking in the modest increases approved in the Fiscal Year 2010
Congressional Budget Resolution, which averaged less than two percent annually. We believe
that this Senate-proposed cap would be more successful in limiting deficits than a cap that only
targets domestic discretionary spending.
321
Susan J Irving, "Considerations for Updating the Budget Enforcement Act", in General Accounting Office
<http://www.gao.gov/new.items/d01991t.pdf> [accessed 29 April 2011] 322
Heath Shuler, "Blue Dog Blueprint for Fiscal Reform" <http://shuler.house.gov/legis/fiscal-reform-
blueprint.shtml> [accessed 29 April 2011] 323
Mindy R Levit, "Impact on the Federal Budget of Freezing Non-Security Discretionary Spending", in
Congressional Research Service <http://www.crs.gov/Products/R/PDF/R41174.pdf> [accessed 2 May 2011]
―Discretionary spending
cuts must not exclude
security and defense
spending—there can be
no sacred cows in
deficit reduction.‖

Reinventing Non-Defense Discretionary Spending 98
KEY RECOMMENDATION 1 VARIABLE SAVINGS OVER TEN YEARS324
►Implement a cap on the debt to GDP ratio.
We find a spending cap to be an incomplete solution. There’s still a danger that Congress could
skirt this cap by shifting spending into the tax code with tax expenditures. Spending caps would
also unreasonably limit Congress’s flexibility in responding to an emergency situation. This is
why Third Way has called spending caps “the next Smoot-Hawley”.325
Ultimately, we support a slightly different approach: a debt cap (similar to what has been
proposed by President Obama and the Peterson Pew Commission on Budget Reform). 326 This
debt cap would target a sustainable level of debt which, “if we failed to hit it, *would+ make
automatic cuts to both spending and to tax expenditures.”327
This is probably the best proposal we’ve seen for limiting non-defense discretionary spending.
It forces spending cuts if our debt increases to an unsustainable level, and does so without
incentivizing further proliferation of tax expenditures in the tax code.
Conclusion
Any credible deficit reduction plan will have to include savings from all areas of the budget,
including non-defense discretionary spending. While this report has mostly focused on
mandatory spending, we thought it was important to include some discussion of our
discretionary spending deficit reduction priorities.
At the same time, we reject the idea that the deficit should be reduced by cutting only non-
defense discretionary spending. Domestic discretionary spending only amounts to 15 percent
of the budget and clearly can’t yield enough savings to reduce our entire budget shortfall, as
some would contend. Regardless, Congress will have to be extra judicious going forward about
how and for what it appropriates non-defense discretionary spending.
324
Peterson-Pew Commission on Budget Reform, "Getting Back in Black", in Peterson-Pew Commission on Budget
Reform <http://budgetreform.org/document/getting-back-black> [accessed 2 May 2011] 325
David Kendall and Jim Kessler, "Global Spending Caps—Not the Solution for Our Deficit", in Third Way
<http://content.thirdway.org/publications/389/Third_Way_Memo_-_Global_Spending_Caps-
Not_the_Solution_for_Our_Deficit.pdf> [accessed 9 May 2011] 326
Peterson-Pew Commission on Budget Reform, "Getting Back in Black", in Peterson-Pew Commission on Budget
Reform <http://budgetreform.org/document/getting-back-black> [accessed 2 May 2011] 327
Ezra Klein, "Will the White House lose control of Democrats on the debt ceiling?", in The Washington Post
<http://www.washingtonpost.com/blogs/ezra-
klein/post/will_the_white_house_lose_control_of_democrats_on_the_debt_ceiling/2011/04/13/AFFdBSEF_blog.ht
ml?wprss=ezra-klein> [accessed 2 May 2011]

Part Two Conclusion and Next Steps 99
Part Two Conclusion and Next Steps
This report has made 60 recommendations to put our federal budget back on a sustainable
path. These recommendations would save approximately $2 trillion over the next 10 years
without getting rid of important social safety nets and other vital spending programs. Our
belief that government’s mission matters has vitally underpinned our thinking as we prepared
these recommendations.
Moving forward, Congress and President Obama need to work together to pass a long-term
budget reform package. This effort must address all areas of the budget. It also must consider
both the spending and revenue sides of the equation. There can be no sacred cows when it
comes to deficit reduction. We must reinvent the way government does business, and we must
be prepared to make the tough choices that reinvention requires. We have tried to make some
of those tough choices in this report, and we hope that our work will make it easier to reach a
bipartisan compromise in the coming weeks and months.
For more information, please go to:
http://quigley.house.gov/reinventing
100
Works Cited Adams, Gordon. "Testimony before the House Committee on Oversight and Government Reform
Subcommittee on National Security and Foreign Affairs." House Committee on Oversight and
Government Affairs. July 20, 2010.
http://oversight.house.gov/images/stories/subcommittees/NS_Subcommittee/7.20.10_DoD_Budget/Ad
ams_Statement.pdf (accessed December 13, 2010).
American Association of Retired Persons. "Reform Options for Social Security." American Association of
Retired Persons. April 2008. http://assets.aarp.org/rgcenter/econ/i3_reform.pdf (accessed May 3,
2011).
Bandow, Doug. Japan Can Defend Itself. May 12, 2010.
http://nationalinterest.org/print/commentary/japan-can-defend-itself-3594 (accessed April 27, 2011).
Blumenauer, Earl. House Democrats Unveil $40 Billion in Cuts to Wasteful Big Oil Subsidies. February 10,
2011. http://blumenauer.house.gov/index.php?option=com_content&task=view&id=1788&Itemid=73
(accessed April 28, 2011).
Burman, Leonard. "Let's freeze more than chump change." The Washington Post. February 2, 2010.
http://www.washingtonpost.com/wp-dyn/content/article/2010/02/01/AR2010020103072.html
(accessed April 28, 2011).
Burman, Leonard, Eric Toder, and Christopher Geissler. "How Big are Total Individual Income Tax
Expenditures, and Who Benefits from Them?" Tax Policy Center. December 2008.
http://www.taxpolicycenter.org/UploadedPDF/1001234_tax_expenditures.pdf (accessed May 3, 2011).
Cato Institute. "Cato Handbook for Policymakers: The Defense Budget." Cato Institute.
http://www.cato.org/pubs/handbook/hb111/hb111-19.pdf (accessed April 28, 2011).
Center for Medicare & Medicaid Innovation. "Our Charge." Center for Medicare & Medicaid Innovation.
http://innovations.cms.gov/about-us/our-charge/ (accessed April 28, 2011).
Centers for Medicare & Medicaid Services. National Health Expenditure Data: Historical. January 20,
2011.
https://www.cms.gov/NationalHealthExpendData/02_NationalHealthAccountsHistorical.asp#TopOfPage
(accessed April 27, 2011).
Committee for a Responsible Federal Budget. "Let’s Get Specific: Health Care." Committee for a
Responsible Federal Budget. September 2010.
http://crfb.org/sites/default/files/Lets_Get_Specific_Health_Care.pdf (accessed April 25, 2011).
Condon, Stephanie. "Calls for getting out of Afghanistan grow after bin Laden's death." CBS News. May
4, 2011. http://www.cbsnews.com/8301-503544_162-20059841-503544.html# (accessed May 5, 2011).

101
Conetta, Carl J. "Testimony: Rethinking our Defense Budget: Achieving National Security through
Sustainable Spending." Commonwealth Institute. July 20, 2010.
http://www.comw.org/pda/fulltext/Conetta_testimony_07-20-10.pdf (accessed April 29, 2011).
Congressional Budget Office. "Budget Options." Congressional Budget Office. February 2007.
http://www.cbo.gov/ftpdocs/78xx/doc7821/02-23-BudgetOptions.pdf (accessed April 28, 2011).
—. "Budget Options Volume 1: Health Care." Congressional Budget Office. December 2008.
http://www.cbo.gov/ftpdocs/99xx/doc9925/12-18-HealthOptions.pdf (accessed April 25, 2011).
—. "Budget Options Volume 2." Congressional Budget Office. August 2009.
http://www.cbo.gov/ftpdocs/102xx/doc10294/08-06-BudgetOptions.pdf (accessed April 22, 2011).
—. "Reducing the Deficit: Spending and Revenue Options." Congressional Budget Office. March 2011.
http://www.cbo.gov/ftpdocs/120xx/doc12085/03-10-ReducingTheDeficit.pdf (accessed April 27, 2011).
—. "Social Security Policy Options." Congressional Budget Office. July 2010.
http://www.cbo.gov/ftpdocs/115xx/doc11580/07-01-SSOptions_forWeb.pdf (accessed May 3, 2011).
—. "Technological Change and the Growth of Health Care Spending." Congressional Budget Office.
January 2008. http://www.cbo.gov/ftpdocs/89xx/doc8947/01-31-TechHealth.pdf (accessed April 28,
2011).
—. "The Effects of Proposals to Increase Cost Sharing in TRICARE." Congressional Budget Office. June
2009. http://www.cbo.gov/ftpdocs/102xx/doc10261/TRICARE.pdf (accessed April 28, 2011).
—. "The Long-Term Budget Outlook." Congressional Budget Office. August 3, 2010.
http://www.cbo.gov/ftpdocs/115xx/doc11579/06-30-LTBO.pdf (accessed November 22, 2010).
—. "The Long-Term Budget Outlook." Congressional Budget Office. June 2009.
http://www.cbo.gov/ftpdocs/102xx/doc10297/06-25-LTBO.pdf (accessed April 22, 2011).
Cook, Ken. Government's Continued Bailout of Agribusiness. http://farm.ewg.org/summary.php
(accessed April 29, 2011).
Cornell Law School Legal Information Institute. U.S. Code.
http://www.law.cornell.edu/uscode/26/usc_sec_26_00000833----000-.html (accessed April 2011, 28).
Daggett, Stephen. "Defense budget cuts proposed by the Sustainable Defense Task Force."
Congressional Research Service. October 8, 2010.
Daggett, Stephen. "E-mail to staff." Congressional Research Service. March 30, 2011.
Daly, Kay L. "Improper Payments: Progress Made but Challenges Remain in Estimating and Reducing
Improper Payments." Subcommittee on Federal Financial Management, Government Information,
Federal Services, and International Security, Committee on Homeland Security and Governmental Affairs,
U.S. Senate. April 22, 2009.

102
http://hsgac.senate.gov/public/index.cfm?FuseAction=Files.View&FileStore_id=8a30c529-84d8-4453-
8929-9d99fc3e6b94 (accessed April 28, 2011).
Dartmouth Institute for Health Policy and Clinical Practice. "Tracking the Care of Patients with Severe
Chronic Illness." The Dartmouth Atlas of Healthcare. 2008.
http://www.dartmouthatlas.org/downloads/atlases/2008_Chronic_Care_Atlas.pdf (accessed April 26,
2011).
Davis, Patricia A. "Medicare Primer." Congressional Research Service. July 1, 2010.
http://aging.senate.gov/crs/medicare1.pdf (accessed April 22, 2011).
Defense Business Board. "Reducing Overhead and Improving Business Operations." Defense Business
Board. July 22, 2010. http://dbb.defense.gov/MeetingFiles/presented.pdf (accessed April 27, 2011).
Department of Defense. Active Duty Military Personnel Strengths by Regional Area and by Country.
September 30, 2010. http://siadapp.dmdc.osd.mil/personnel/MILITARY/history/hst1009.pdf (accessed
April 27, 2011).
—. "Fact Sheet: Increasing Transparency in the U.S. Nuclear Weapons Stockpile." Department of
Defense. May 3, 2010. http://www.defense.gov/npr/docs/10-05-
03_fact_sheet_us_nuclear_transparency__final_w_date.pdf (accessed April 29, 2011).
—. "Quadrennial Defense Review Report." Department of Defense. February 2010.
http://www.defense.gov/qdr/qdr%20as%20of%2029jan10%201600.pdf (accessed April 28, 2011).
Department of Treasury. "General Explanations of the Administration’s Fiscal Year 2012 Revenue
Proposals." Department of Treasury. February 2011. http://www.treasury.gov/resource-center/tax-
policy/Documents/Final%20Greenbook%20Feb%202012.pdf (accessed April 28, 2011).
Dorronsoro, Gilles. "Change Course Now." New York Times. June 24, 2010.
http://www.carnegieendowment.org/publications/index.cfm?fa=view&id=41055 (accessed April 27,
2011).
Eliot, Fisher S, David E Wennberg, Therese A Stubel, Daniel J Gottlieb, F L Lucas, and Etoile L Pinder. "The
Implications of Regional Variations in Medicare Spending. Part 1:The Content, Quality, and Accessibility
of Care." Annals of Internal Medicine. February 18, 2003.
http://www.annals.org/content/138/4/273.full.pdf+html (accessed April 25, 2011).
Elmendorf, Douglas W. "CBO’s Analysis of the Major Health Care Legislation." Congressional Budget
Office. March 30, 2011. http://www.cbo.gov/ftpdocs/121xx/doc12119/03-30-HealthCareLegislation.pdf
(accessed April 22, 2011).
—. "Letter to Majority Leader Harry Reid." Congressional Budget Office. December 19, 2009.
http://www.cbo.gov/ftpdocs/108xx/doc10868/12-19-Reid_Letter_Managers_Correction_Noted.pdf
(accessed April 25, 2011).

103
—. "Letter to Speaker Nancy Pelosi." Congressional Budget Office. March 20, 2010.
http://www.cbo.gov/ftpdocs/113xx/doc11379/AmendReconProp.pdf (accessed April 22, 2011).
Environmental Working Group. Farm Subsidy Database.
http://farm.ewg.org/progdetail.php?fips=00000&progcode=total_dp®ionname=theUnitedStates
(accessed April 29, 2011).
Ettlinger, Michael, and Seth Hanlon. "Cut Spending in the Tax Code." Center for American Progress.
March 2011. http://www.americanprogress.org/issues/2011/03/pdf/tax_expenditures.pdf (accessed
April 2011, 28).
Federal Trade Commission. "Emerging Health Care Issues: Follow-on Biologic Drug Competition." Federal
Trade Commission. June 2009. http://www.ftc.gov/os/2009/06/P083901biologicsreport.pdf (accessed
April 27, 2011).
Fisher, Dr. Elliott. "The Road to Reform." Dartmouth Medicine. Summer 2009.
http://dartmed.dartmouth.edu/summer09/pdf/road_to_reform.pdf (accessed April 22, 2011).
Fisher, Dr. Elliott, Dr. David Goodman, Dr. Jonathan Skinner, and Kristen Bronner. "Health Care
Spending, Quality, and Outcomes." The Darthmouth Institute for Health Policy & Clinical Practice.
January 27, 2009. http://www.dartmouthatlas.org/downloads/reports/Spending_Brief_022709.pdf
(accessed April 22, 2011).
Fisher, Elliot S, David E Wennberg, Therese A Stukel, Daniel J Gottlieb, FL Lucas, and Etoile L Pinder. "The
Implications of Regional Variations in Medicare Spending, Part 1: The Content, Quality, and Accessibility
of Care." Annals of Internal Medicine. February 18, 2003.
http://www.annals.org/content/138/4/273.full.pdf+html (accessed April 28, 2011).
Forsyth Jr., James Wood, B Chance Saltzman, and Gary Schaub Jr. "Remembrance of Things Past: The
Enduring Value of Nuclear Weapons." Strategic Studies Quarterly. Spring 2010.
http://www.au.af.mil/au/ssq/2010/spring/forsythsaltzmanschaub.pdf (accessed April 29, 2011).
Friedman, Benjamin H. "Testimony of Benjamin Friedman before the Subcommittee on National Security
and Foreign Affairs: Military Restraint and Defense Savings." Cato Institute. July 20, 2010.
http://www.cato.org/testimony/ct-bf-07202010.html (accessed April 29, 2011).
Friedman, Benjamin H, and Christopher Preble. "Budgetary Savings from Military Restraint." Cato
Institute. September 23, 2010. http://www.cato.org/pubs/pas/PA667.pdf (accessed April 27, 2011).
Gates, Robert M. "Remarks as Delivered by Secretary of Defense Robert M. Gates, Abilene, KS, Saturday,
May 08, 2010." Department of Defense. May 8, 2010.
http://www.defense.gov/speeches/speech.aspx?speechid=1467 (accessed April 29, 2011).
—. "Remarks as Delivered by Secretary of Defense Robert M. Gates, Gaylord Convention Center,
National Harbor, Maryland, Monday, May 03, 2010." Department of Defense. May 3, 2010.
http://www.defense.gov/Speeches/Speech.aspx?SpeechID=1460 (accessed April 29, 2011).

104
—. "Statement on Department Budget and Efficiencies." Department of Defense. January 6, 2011.
http://www.defense.gov/speeches/speech.aspx?speechid=1527 (accessed April 27, 2011).
Gawande, Atul. The Cost Conundrum. June 1, 2009.
http://www.newyorker.com/reporting/2009/06/01/090601fa_fact_gawande (accessed April 25, 2011).
—. The Cost Conundrum Redux. June 23, 2009.
http://www.newyorker.com/online/blogs/newsdesk/2009/06/atul-gawande-the-cost-conundrum-
redux.html (accessed April 25, 2011).
Gleckman, Howard. "Obama’s Plan to Cap Tax Deductions." Tax Policy Center. February 26, 2009.
http://taxvox.taxpolicycenter.org/2009/02/26/obama%e2%80%99s-plan-to-cap-tax-deductions/
(accessed April 28, 2011).
Government Accountability Office. "Defense Acquisitions: Assessments Needed to Address V-22 Aircraft
Operational and Cost Concerns to Define Future Investments." Government Accountability Office. May
2009. http://www.gao.gov/new.items/d09482.pdf (accessed April 29, 2011).
—. "Farm Programs: Information on Recipients of Federal Payments." Government Accountability Office.
June 2001. http://www.gao.gov/new.items/d01606.pdf (accessed May 2, 2011).
—. "Tax-Exempt Status of Certain Bonds Merits Reconsideration, and Apparent Noncompliance with
Issuance Cost Limitations Should Be Addressed." Government Accountability Office. February 2008.
http://www.gao.gov/highlights/d08364high.pdf (accessed April 28, 2011).
Grassley, Chuck. Grassley, Feingold Introduce Legislation to Focus Farm Payments on Small and Medium-
Sized Farmers. August 4, 2010.
http://grassley.senate.gov/news/Article.cfm?customel_dataPageID_1502=28041 (accessed April 29,
2011).
Greenstein, Robert. "Perspectives on Long-Term Deficits." Center on Budget and Policy Priorities.
January 21, 2010. http://www.cbpp.org/files/1-21-10bud-test.pdf (accessed April 22, 2011).
Hanlon, Seth, and Michael Ettlinger. "Cut Spending in the Tax Code." American Progress. March 2011.
http://www.americanprogress.org/issues/2011/03/pdf/tax_expenditures.pdf (accessed April 22, 2011).
Hanna, Autumn, and Benjamin Schreiber. "Green Scissors 2010." Green Scissors. 2010.
http://www.greenscissors.com/GreenScissors2010.pdf (accessed April 28, 2011).
Harrison, Todd. "Evaluating Options for a Sustainable Defense." Commonwealth Institute. July 20, 2010.
http://www.comw.org/pda/fulltext/Harrison_Testimony.pdf (accessed April 29, 2011).
Hoffman, David E. Despite new START, the U.S. and Russia still have too many nuclear weapons. April 11,
2010. http://www.washingtonpost.com/wp-dyn/content/article/2010/04/09/AR2010040903260.html
(accessed April 27, 2011).

105
Hungerford, Thomas L. "Tax Expenditures and the Federal Budget." Congressional Research Service. May
26, 2010. http://www.crs.gov/Products//rl/pdf/RL34622.pdf (accessed April 28, 2011).
Institute for Policy Studies. "A Unified Security Budget for the United States, FY 2011." Institute for Policy
Studies. August 12, 2010. http://www.ips-dc.org/files/2361/USB_FY2011.pdf (accessed April 29, 2011).
Institute of Medicine. "To Err is Human: Building a Safer Health System." Institute of Medicine.
November 1999. http://www.iom.edu/~/media/Files/Report%20Files/1999/To-Err-is-
Human/To%20Err%20is%20Human%201999%20%20report%20brief.pdf (accessed April 27, 2011).
Internal Revenue Service. "Tax-Exempt Private Activity Bonds." Internal Revenue Service. 2005.
http://www.irs.gov/pub/irs-pdf/p4078.pdf (accessed April 28, 2011).
Irving, Susan J. "Considerations for Updating the Budget Enforcement Act." General Accounting Office.
July 19, 2001. http://www.gao.gov/new.items/d01991t.pdf (accessed April 29, 2011).
Kaiser Commission on Medicaid and the Uninsured. "Medicaid and Managed Care: Key Data, Trends,
and Issues." Henry J. Kaiser Family Foundation. February 2010.
http://www.kff.org/medicaid/upload/8046.pdf (accessed April 28, 2011).
Kelley, Robert. "Where Can $700 Billion in Waste Be Cut Annually from the U.S. Health Care System?"
Thomson Reuters. October 2009.
http://img.en25.com/Web/ThomsonReuters/WASTEWHITEPAPER_FINAL11_3_09.pdf (accessed May 3,
2011).
Kendall, David, and Jim Kessler. "Global Spending Caps—Not the Solution for Our Deficit." Third Way.
May 2011. http://content.thirdway.org/publications/389/Third_Way_Memo_-_Global_Spending_Caps-
Not_the_Solution_for_Our_Deficit.pdf (accessed May 9, 2011).
King, Kathleen M, and Kay L Daly. "Medicare and Medicaid Fraud, Waste and Abuse: Effective
Implementation of Recent Laws and Agency Actions Could Help Reduce Improper Payments." United
States Government Accountability Office. March 9, 2011. http://www.gao.gov/new.items/d11409t.pdf
(accessed April 26, 2011).
Klein, Ezra. "Will the White House lose control of Democrats on the debt ceiling?" The Washington Post.
April 29, 2011. http://www.washingtonpost.com/blogs/ezra-
klein/post/will_the_white_house_lose_control_of_democrats_on_the_debt_ceiling/2011/04/13/AFFdB
SEF_blog.html?wprss=ezra-klein (accessed May 2, 2011).
Krueger, Alan B. "Statement of Alan B. Krueger Assistant Secretary for Economic Policy and Chief
Economist, US Department of Treasury Subcommittee on Energy, Natural Resources, and
Infrastructure." Department of Treasury. September 9, 2009. http://www.treasury.gov/press-
center/press-releases/Pages/tg284.aspx (accessed April 29, 2011).
Labonte, Marc. "The Economic Implications of the Long-Term Federal Budget Outlook." Congressional
Research Service. January 4, 2010. http://aging.senate.gov/crs/medicare8.pdf (accessed April 22, 2011).
106
Lefton, Rebecca. BP Disaster Is Cheney’s Katrina. June 2, 2010.
http://www.americanprogress.org/issues/2010/06/oil_timeline.html (accessed April 28, 2011).
Levit, Mindy R. "Impact on the Federal Budget of Freezing Non-Security Discretionary Spending."
Congressional Research Service. March 22, 2011. http://www.crs.gov/Products/R/PDF/R41174.pdf
(accessed May 2, 2011).
Linden, Michael, and Michael Ettlinger. "Interactive: What Is Non-Defense Discretionary Spending?"
Center for American Progress. March 24, 2010.
http://www.americanprogress.org/issues/2010/03/discretionary_spending_interactive.html (accessed
April 29, 2011).
Majority Staff of the Committee on Oversight and Government Reform. "Medicare Part D: Drug Pricing
and Manufacturer Windfalls." Committee on Oversight and Government Reform. July 2008.
http://www.cmhda.org/breaking_news/documents/0807_Breaking%20News_Medicare%20Part%20D%
20report%20house%20of%20reps%207-08.pdf (accessed April 27, 2011).
Majority Staff of the Joint Economic Committee. "The Proposed Modification of Internal Revenue Code
Section 199 Will Not Increase Consumer Energy Prices." Joint Economic Committee.
http://jec.senate.gov/public/?a=Files.Serve&File_id=f26dccde-9ea6-4539-a44c-f638240fa055 (accessed
April 28, 2011).
Marr, Chuck, and Brian Highsmith. "Six Tests for Corporate Reform: Reform Should Help Shrink Long-
Term Deficits, Reduce Biases and Preferences in the Tax Code, and Discourage Tax Sheltering." Center on
Budget and Policy Priorities. February 28, 2011. http://www.cbpp.org/files/2-28-11tax.pdf (accessed
April 28, 2011).
Mayo Clinic. "A Foundation for Health Care Reform Legislation." Mayo Clinic. 2008.
http://www.mayoclinic.org/healthpolicycenter/pdfs/viewpoint4.pdf (accessed April 25, 2011).
McGlynn, Elizabeth A, et al. "The Quality of Health Care Delivered to Adults in the United States." The
New England Journal of Medicine. June 26, 2003.
http://www.nejm.org/doi/full/10.1056/NEJMsa022615#t=article (accessed April 26, 2011).
Monke, Jim. "Payment Limits for Farm Commodity Programs: Issues and Proposals." National Council for
Science and the Environment. September 1, 2006.
http://ncseonline.org/NLE/CRSreports/06Oct/RS21493.pdf (accessed May 2, 2011).
National Commission on Fiscal Responsibility and Reform. "$200 Billion in Illustrative Savings." National
Commission on Fiscal Responsibility and Reform. November 12, 2010.
http://www.fiscalcommission.gov/sites/fiscalcommission.gov/files/documents/Illustrative_List_11.10.2
010.pdf (accessed April 27, 2011).
—. The Moment of Truth. December 2010.
http://www.fiscalcommission.gov/sites/fiscalcommission.gov/files/documents/TheMomentofTruth12_1
_2010.pdf (accessed April 22, 2011).
107
—. "Co-Chair's Proposal." National Commission on Fiscal Responsibility and Reform. November 10, 2010.
http://www.fiscalcommission.gov/sites/fiscalcommission.gov/files/documents/CoChair_Draft.pdf
(accessed April 27, 2011).
National Resource Defense Center. "Let the VEETC Expire: Save Billions in Tax Dollars Better Spent on
Non-Polluting Energy Technologies." National Resource Defense Center. June 2010.
http://www.nrdc.org/globalWarming/files/VEETCfs.pdf (accessed April 28, 2011).
Obama, Barack. "State of the Union Address." The White House. January 25, 2011.
http://www.whitehouse.gov/the-press-office/2011/01/25/remarks-president-state-union-address
(accessed April 28, 2011).
Office of Management and Budget. "Fiscal Year 2012 Budget of the U.S. Government." Office of
Management and Budget. March 2011.
http://www.whitehouse.gov/sites/default/files/omb/budget/fy2012/assets/budget.pdf (accessed April
28, 2011).
—. "Fiscal Year 2012 Budget of the U.S. Government." Office of Management and Budget. March 2011.
http://www.whitehouse.gov/sites/default/files/omb/budget/fy2012/assets/teb2012.xls (accessed April
28, 2011).
—. "Fiscal Year 2012 Budget of the U.S. Government, Receipts." Office of Management and Budget.
March 2011. http://www.whitehouse.gov/sites/default/files/omb/budget/fy2012/assets/receipts.pdf
(accessed April 28, 2011).
—. "Fiscal Year 2012 Terminations, Reductions, and Savings: Budget of the U.S. Government." March 18,
2011. http://www.whitehouse.gov/sites/default/files/omb/budget/fy2012/assets/trs.pdf (accessed
April 22, 2011).
Orszag, Peter R. "Letter to the Honorable Ron Wyden." Congressional Budget Office. April 10, 2007.
http://www.cbo.gov/ftpdocs/79xx/doc7992/DrugPriceNegotiation.pdf (accessed April 27, 2011).
—. "One Nation, Two Deficits." New York Times. September 6, 2010.
http://www.nytimes.com/2010/09/07/opinion/07orszag.html (accessed April 29, 2011).
Parsons, Christi, and Kathleen Hennessey. "Obama urges repeal of tax breaks for oil firms." Los Angeles
Times. April 26, 2011. http://articles.latimes.com/2011/apr/26/nation/la-na-obama-oil-subsidies-
20110427 (accessed May 5, 2011).
Pearson, Steven D, and Peter B Bach. "How Medicare Could Use Comparative Effectiveness Research In
Deciding On New Coverage And Reimbursement." Health Affairs. October 2010.
http://content.healthaffairs.org/content/29/10/1796.abstract (accessed April 28, 2011).
Peterson-Pew Commission on Budget Reform. "Getting Back in Black." Peterson-Pew Commission on
Budget Reform. November 10, 2010. http://budgetreform.org/document/getting-back-black (accessed
May 2, 2011).

108
—. "Red Ink Rising." Peterson-Pew Commission on Budget Reform. December 2009.
http://budgetreform.org/sites/default/files/Red_Ink_Rising.pdf (accessed April 22, 2011).
Podesta, John, Sarah Rosen Wartell, and Jitinder Ko. "A Focus on Competitiveness." Center for American
Progress. December 2010. (accessed April 22, 2011).
RAND Corporation. "How Terrorist Groups End: Implications for Countering al Qa'ida." RAND
Corporation. July 28, 2008.
http://www.rand.org/content/dam/rand/pubs/research_briefs/2008/RAND_RB9351.pdf (accessed April
27, 2011).
Romm, Joseph. Using Tax Incentives to Drive the Clean Energy Economy. April 5, 2010.
http://www.americanprogressaction.org/issues/2010/04/tax_green_economy.html (accessed April 28,
2011).
Schake, Kori. "Stop Spending So Much on Defense." Foreign Policy Online. January 20, 2010.
http://shadow.foreignpolicy.com/posts/2010/01/20/stop_spending_so_much_on_Defense (accessed
April 28, 2011).
Schultz, George P, William J Perry, Henry A Kissinger, and Sam Nunn. "Toward a Nuclear-Free World."
Nuclear Security Project. January 15, 2008. http://www.nuclearsecurityproject.org/atf/cf/%7B1FCE2821-
C31C-4560-BEC1-BB4BB58B54D9%7D/TOWARD_A_NUCLEAR_FREE_WORLD_OPED_011508.PDF
(accessed April 28, 2011).
Sebelius, Kathleen. "Speech at Atlanta Press Club." U.S. Department of Health & Human Services. April
19, 2011. http://www.hhs.gov/secretary/about/speeches/sp20110419.html (accessed April 26, 2011).
Shields, Dennis A. "A Whole-Farm Crop Disaster Program: Supplemental Revenue Assistance Payments
(SURE)." Congressional Research Service. December 3, 2010.
http://www.nationalaglawcenter.org/assets/crs/R40452.pdf (accessed April 29, 2011).
Shields, Dennis A, Jim Monke, and Randy Schnepf. "Farm Safety Net Programs: Issues for the Next Farm
Bill." Congressional Research Service. December 7, 2010.
http://www.crs.gov/Products/R/PDF/R41317.pdf (accessed April 29, 2011).
Shuler, Heath. Blue Dog Blueprint for Fiscal Reform. http://shuler.house.gov/legis/fiscal-reform-
blueprint.shtml (accessed April 29, 2011).
So, Anthony D, and Samuel L Katz. Biologics Boondoggle. March 8, 2010.
http://sanford.duke.edu/news/features/so_com030810.php (accessed April 27, 2011).
Social Security Administration. Social Security Administration. 2011. http://www.ssa.gov/ (accessed May
9, 2011).
Subsidy Scope. Special BlueCross BlueShield Deduction. December 2008.
http://subsidyscope.org/nonprofits/tax-expenditures/blue-cross-blue-shield/ (accessed April 28, 2011).
109
Sullivan, Michael J. "Defense Acquisitions: Fundamental Changes are Needed to Improve Weapon
Program Outcomes." Government Accountability Office. September 25, 2008.
http://www.gao.gov/new.items/d081159t.pdf (accessed April 29, 2011).
—. "Expeditionary Fighting Vehicle (EFV) Program Faces Cost, Schedule, and Performance Risks."
Government Accountability Office. July 2, 2010. http://www.gao.gov/new.items/d10758r.pdf (accessed
April 28, 2011).
—. "Significant Challenges Remain as DOD Restructures Program." Committee on Armed Services,U.S.
Senate. March 11, 2010. http://armed-
services.senate.gov/statemnt/2010/03%20March/Sullivan%2003-11-10.pdf (accessed April 27, 2011).
The Board of Trustees, Federal Old-Age and Survivors Insurance and Federal Disability Insurance Trust
Funds. "The 2010 Annual Report of the Board of Trustees of the Federal Old-Age and Survivors Insurance
and Federal Disability Insurance Trust Funds." Social Security Administration. August 9, 2010.
http://www.ssa.gov/OACT/TR/2010/tr2010.pdf (accessed May 3, 2011).
The Debt Reduction Task Force. "Restoring America's Future." Bipartisan Policy Center. November 2010.
http://www.bipartisanpolicy.org/sites/default/files/BPC%20FINAL%20REPORT%20FOR%20PRINTER%20
02%2028%2011.pdf (accessed April 27, 2011).
The Generic Pharmaceutical Association. Generic Pharmaceuticals Saved $734 Billion over Last Decade.
May 7, 2009. http://www2.prnewswire.com/mnr/GPhA/38110/ (accessed April 27, 2011).
The Henry J. Kaiser Family Foundation. U.S. Health Care Costs. March 2010.
http://www.kaiseredu.org/Issue-Modules/US-Health-Care-Costs/Background-Brief.aspx (accessed April
27, 2011).
The Medicare Payment Advisory Commission. "Improving Incentives in the Medicare Program." The
Medicare Payment Advisory Commission. June 2009.
http://www.medpac.gov/documents/Jun09_EntireReport.pdf (accessed April 27, 2011).
The New York Times. "Blue Cross Tax Status is Challenged." The New York Times. July 4, 1986.
http://www.nytimes.com/1986/07/04/us/blue-cross-tax-status-is-challenged.html (accessed April 2011,
28).
The Sustainable Defense Task Force. "Debt, Deficits, and Defense: A Way Forward." Commonwealth
Institute. June 11, 2010. http://www.comw.org/pda/fulltext/1006SDTFreport.pdf (accessed April 27,
2011).
Thompson, Drew. "www.foreignpolicy.com." March/April 2010.
http://www.foreignpolicy.com/articles/2010/02/22/think_again_chinas_military (accessed May 10,
2011).
Thomson Reuters. Fighting Fraud and Abuse, Funding Reform.
http://info.thomsonhealthcare.com/?elqPURLPage=475 (accessed April 27, 2011).
110
Toder, Eric. "Eliminating Tax Expenditures with Adverse Environmental Effects." Urban. June 2007.
http://www.urban.org/UploadedPDF/1001080_tax_expenditures.pdf (accessed April 28, 2011).
United States Senate Special Committee on Aging. "Social Security Modernization: Options to Address
Solvency and Benefit Adequacy." United States Senate Special Committee on Aging. May 13, 2010.
http://aging.senate.gov/ss/ssreport2010.pdf (accessed May 3, 2011).
Weems, Kerry N, and Benjamin E Sasse. "Is Government Health Insurance Cheap?" The Wall Street
Journal. April 14, 2009. http://online.wsj.com/article/SB123966918025015509.html (accessed April 28,
2011).
Wennberg, John E. "Tracking the Care of Patients with Severe Chronic Illness Executive Summary." The
Darmouth Institute for Health Policy and Clinical Practice. April 2008.
http://www.dartmouthatlas.org/downloads/atlases/2008_Atlas_Exec_Summ.pdf (accessed April 26,
2011).
Whelan, Ellen-Marie, and Lesley Russell. "Better Health Care at Lower Costs." Center for American
Progress. March 2010. http://www.americanprogress.org/issues/2010/03/pdf/health_delivery.pdf
(accessed April 28, 2011).
Zulauf, Carl. "Suggestions for Current Farm Safety Net Programs While Cutting Cost." The Ohio State
University. February 2011. Suggestions for Current Farm Safety Net Programs While Cutting Cost
(accessed April 29, 2011).