Regulatory Remedies for Banking Crises: Lessons from Japan* ANNUAL MEETINGS/2010-… · Regulatory...
68
Regulatory Remedies for Banking Crises: Lessons from Japan* Linda Allen Stern, NYU and Baruch College, CUNY Suparna Chakraborty Graduate Center and Baruch College, CUNY Wako Watanabe Keio University *Corresponding Author: [email protected]. We are especially grateful to Joe Peek, Thomas Philippon, Hirofumi Uchida, Takeo Hoshi and to the seminar participants at the NBER Japan Project Meeting Tokyo, "Systemic risk and nancial regulation" Workshop organized by Basel Committee on Banking Supervision, the Centre for Economic Policy Research (CEPR), and the Journal of Financial Intermediation, Interdisciplinary Center, Herzeliya, European Financial Management Annual Conference 2010, American Law and Economic Association Annual Conference 2010, Midwest Macroeconomics Meetings 2010 and Graduate Center, CUNY for their thoughtful comments. Suparna Chakraborty gratefully acknowledges nancial support from the PSC- CUNY Research Foundation of the CUNY. Wako Watanabe gratefully acknowledges the nancial support from the Japan Society for the Promotion of Science, Grants- Preprint submitted to Elsevier 28 May 2010
Transcript of Regulatory Remedies for Banking Crises: Lessons from Japan* ANNUAL MEETINGS/2010-… · Regulatory...

Regulatory Remedies for Banking Crises:
Lessons from Japan*
Linda Allen
Stern, NYU and Baruch College, CUNY
Suparna Chakraborty
Graduate Center and Baruch College, CUNY
Wako Watanabe
Keio University
*Corresponding Author: [email protected]. We are
especially grateful to Joe Peek, Thomas Philippon, Hirofumi Uchida, Takeo
Hoshi and to the seminar participants at the NBER Japan Project Meeting
Tokyo, "Systemic risk and financial regulation" Workshop organized by Basel
Committee on Banking Supervision, the Centre for Economic Policy Research
(CEPR), and the Journal of Financial Intermediation, Interdisciplinary Center,
Herzeliya, European Financial Management Annual Conference 2010, American
Law and Economic Association Annual Conference 2010, Midwest Macroeconomics
Meetings 2010 and Graduate Center, CUNY for their thoughtful comments.
Suparna Chakraborty gratefully acknowledges financial support from the PSC-
CUNY Research Foundation of the CUNY. WakoWatanabe gratefully acknowledges
the financial support from the Japan Society for the Promotion of Science, Grants-
Preprint submitted to Elsevier 28 May 2010

Abstract
Are regulatory intervention measures successful in alleviating a financial crisis?
What works? Using the Japanese banking crisis as our laboratory, we utilize a novel,
hand-gathered, bank-specific database to provide an empirical answer to the above
questions. Our results indicate that while substantial risk-based capital infusions
(similar to the 2009 stress tests in the US) are successful in stimulating aggregate
lending, blanket infusions (similar to the TARP infusions of October 2008) are not
effective. Regulatory forbearance, manifest in changes in accounting valuation pro-
cedures (similar to the relaxation of mark-to-market requirements for banks in the
US) did not stimulate aggregate bank lending activity, but rather reallocated the
distribution of credit. Drawing parallels between the Japanese and the US public
policy programs implemented to alleviate the banking crises, our empirical results
suggest that policies must be substantial in size and risk-targeted to be effective.
Moreover, we apply Dunning’s internalization theory to Japanese banking and find a
shift away from multinational activity during financial crises, thereby demonstrating
a shift toward de-internalization to reduce regulatory capital costs.
Key words: banking crisis, capital interventions, internalization paradigm, public
injections, accounting changes, bank lending
JEL Codes: G15, G21, G28
in-aid for Young Scientists (B 18730207) and the Keio/Kyoto Global Center of
Excellence Program. We would also like to thank Akio Ino and Taisuke Ogawa for
their excellent research assistance.
2

Introduction
Periodically, banking panics lead to financial crises as witnessed by the
global financial meltdown of 2007−2009, which was triggered by the bursting
of the US housing price bubble and the resulting increase in mortgage delin-
quencies. Inevitably, a crisis leads to calls for regulatory policy changes that
are designed to return the financial system to health. The 2007− 2009 global
financial crisis has witnessed a quick succession of regulatory experiments de-
signed to restart global financial markets and recapitalize a banking system
that had been depleted by loan losses and deteriorating asset values.
Many economists and financial pundits have drawn the parallel between
the 2007 − 2009 crisis and Japan’s lost decade of the 1990s, which was also
triggered by the bursting of a real estate bubble and loan losses that depleted
bank capital positions 1 . There are public policy parallels in each government’s
reaction to each crisis 2 . For example, in July 1999, Japan’s Financial Super-
1 Hoshi and Kashyap (2009) provide an in-depth analysis of the nature of the crises
showing that the parallel between the two crises extends beyond their initial roots in
the real estate sector. See also Baldwin and Eichengreen (2008), Diamond, Kashyap
and Rajan (2008) and Diamond and Rajan (2009) for a detailed analysis of the
2007-2009 US crisis. Additional literature in this area includes Reinhart and Rogoff
(2008) who surveys financial crises throughout the world, and Yorulmazer (2009)
who compares the US and the Swedish banking crises. Udell (2008) states that in
the United States, banks had increased their real estate portfolio from 44% in 2003
to 53% in 2007 during the real estate boom period.2 A comprehensive summary of the 2007 − 2009 US crisis and the policy re-
sponses are provided by the Federal Reserve Bank of New York at: http :
//www.ny.frb.org/research/global_economy/Crisis_Timeline.pdf
3

visory Agency (currently known as the Financial Services Agency or FSA)
required Japanese banks to conduct rigorous self-assessments of their assets
for comparison across depository institutions. Similarly, in February 2009, the
19 largest US financial institutions were subjected to stringent stress test ex-
aminations in order to compare each bank’s credit losses and capital positions
under several economic scenarios 3 . Furthermore, both Japanese banks and
US banks were offered governmental programs to replenish their capital po-
sitions. For example, in the US, the Troubled Asset Relief Program (TARP )
was introduced in October 2008 to provide capital infusions to systemically
important US banks 4 . In Japan, public capital injections were designed to
recapitalize the 19 systemically important Japanese banks, comprising the
city banks, trust and long-term credit banks and 3 large regional banks 5 .
The objective of all of these public policy programs was to increase aggregate
3 Although originally designed to be worst-case scenario, during the months it took
to implement the stress test, the economy deteriorated further so that the baseline
scenario had already been breached by the date of publication of the results (March
7, 2009). For example, the consensus expected unemployment rate was 9.3% as of
March 2009, rather than the 8.9% in the baseline scenario.4 Bayazitova and Shivdasani (2009) show that TARP infusions had a positive im-
pact on the equity valuations of recipient banks, particularly for those systemically
important, troubled banks that were the first to receive capital infusions.5 The Japanese capital injections in 1998 were mostly in the form of subordinated
debt, and amounted to 1, 816 billion yen, of which 321 billion was in the form of
preferred stock. See Hoshi and Kashyap (2009). Later injections disbursed funds
mostly in the form of preferred stock. For example, for the 1999 capital injection,
7, 459 billion yen were disbursed to 15 major banks, out of which 6, 159 billion
yen were in the form of preferred stock. The TARP injections were in the form of
preferred stock.
4

macroeconomic activity by stimulating bank-lending activity.
In this paper, we concentrate on three major public policy interventions
undertaken in Japan during the acute phase of the Japanese banking crisis
during 1997−1999 and draw parallels to public policy interventions in the US
during 2008 − 2009 6 . In particular, we utilize a unique hand gathered, bank
specific database to empirically examine the lending activity of individual
Japanese banks in reaction to each public policy stimulus program.
We first consider the government’s provision of capital infusions to systemi-
cally important banks. In Japan, these public injections of capital took place in
1998, similar to the TARP capital infusions that were initiated in 2008 in the
US 7 . The similarity between these two policy programs was that in both cases
the amount of each bank’s capital infusion was unrelated to the bank’s risk
exposure or level of undercapitalization. Indeed, many adequately capitalized
US banks were forced to take TARP funds in October 2008 8 in order to avoid
transmitting a negative signal about those undercapitalized banks that had no
6 Although Japan’s real estate bubble burst in the early 1990s, Japanese public pol-
icy interventions only began in earnest in 1997. Similarly, although the US banking
crisis began in 2007, we consider policies undertaken in 2008 and 2009. Only after
some time had passed, and it had become obvious that forbearance and other poli-
cies were not working, did either Japanese or US government address the banking
crisis directly. See Section 2 of this paper.7 On 3rd October, 2008 TARP of $700 billion was announced.8 On 14th October, 2008, US Treasury announced the injection of $125 billion to
9 large financial institutions. This was followed by the creation of TALF on 25th
November, 2008 by the Federal Reserve that was designed to support the issuance
of asset-backed securities (ABS) collateralized by student loans, auto loans and
loans guaranteed by Small Business Administration.
5

choice but to participate in the program. Our results suggest that these across
the board capital infusions were ineffective in stimulating aggregate lending
activity during the Japanese crisis. One possible explanation is that the size
of the blanket public injection program was insuffi cient to materially impact
the recipient bank’s insolvency risk. Philippon and Schnabl (2009) show that,
in general, public capital injections are successful in stimulating bank lending
only if they decrease the bank’s risk of insolvency.
The second public policy intervention arose out of the failure of the first
and specifically targeted each bank’s insolvency risk. In contrast to the 1998
program of blanket capital infusions, Japanese government public injections
of bank capital starting in 1999 were directed to undercapitalized banks at
risk of becoming insolvent. This ongoing program was more substantial in size
and set the level of capital infusions equal to each bank’s nonperforming loan
losses. Total risk-based public capital infusions in 1999 totaled 74.593 trillion
yen as compared to only 18.156 trillion yen in 1998. The risk-based capital
infusion program in Japan can be compared to the US Supervisory Capital
Assessment Program in 2009, which tested the adequacy of each bank’s capital
in order to determine the level of required capital infusions 9 .
Our empirical results suggest that risk-based capital infusions were effec-
tive in inducing Japanese banks to increase their lending activity 10 . Thus,
9 In the US, these capital infusions took two forms: public (the conversion of
government-owned preferred stock into common stock to meet Tier 1 capital re-
quirements) and private (the issuance of equity).10Our results offer empirical support for systemic risk assessment as an important
step in any policy to alleviate financial crises, as recommended by Acharya, Ped-
ersen, Philippon and Richardson (2009). Gianetti and Simonov (2009) study the
6
the blanket public injection policy of 1998 failed to stimulate bank lending,
whereas a stimulative effect was delivered by the larger risk-based capital in-
fusions starting in 1999 that mandated a rigorous examination of each bank’s
non-performing loans problems. Our results are consistent with those of Hoshi
and Kashyap (2009) showing that risk in the Japanese banking system (mea-
sured using the “Japan premium”—the Eurodollar Tokyo Interbank Borrow-
ing Rate (TIBOR) minus 3-month LIBOR) increased in the wake of the 1998
public injection, but declined after the 1999 injections 11 .
The third public policy intervention in Japan was the provision of regulatory
capital forbearance through the introduction of a land revaluation windfall.
OnMarch 31, 1998, the Diet (the Japanese parliament) passed the “Law Con-
cerning the Revaluation of Land,”which allowed Japanese banks to count 45%
of the unrealized capital gains on their real estate holdings as Tier2 capital
for the purposes of meeting their bank capital requirements 12 . This revalu-
ation essentially enabled Japanese banks to mark to market their real estate
impact of bank bailouts on clients of the banks reach a similar conclusion. However,
it should be noted that Gianetti and Simonov (2009) utilize an event study method-
ology that does not take into account the size and source of each public injection of
capital.11 Peek and Rosengren (2001) also utilize the “Japan premium” as a measure of
the effi cacy of government policy to end the Japanese banking crisis. In addition,
Montgomery and Shimizutani (2009) find that the risk-based public injections were
effective, whereas the blanket infusions were not over the 1990− 1999 period.12 The Basel Capital Accords specify that banks must hold both Tier1 capital,
comprised mostly of bank equity, and Tier2 capital, comprised of long-term sub-
ordinated debt, up to 1.25% in the form of general loan loss provisions, and the
revaluations permitted to Japanese banks.
7

portfolio, which was previously held at book values that were decades old and
lower than the prevailing land prices in Japan (even after the declines of the
early 1990s). Thus, all Japanese banks were allowed to increase the value of
their regulatory capital by including an allowance for the revaluation of the
land in their portfolios. The land revaluation allowance followed the format
of an earlier equity revaluation allowance (introduced in 1986), which allowed
Japanese banks to include 45% of the unrealized gains on securities as Tier2
capital. However, the equity revaluation allowance was granted only to those
Japanese banks that had international operations. In contrast, because the
land revaluation allowance was more broadly applicable (to all banks rather
than just international banks for the equity revaluation allowance), our empir-
ical analysis suggests that it had more of an impact on Japanese bank lending
activity as compared to the equity revaluation allowance.
The 1998 land revaluation allowance (which was either positive or zero if
there were no gains) 13 essentially provided both domestic and international
Japanese banks with an infusion of Tier2 capital for regulatory capital pur-
poses. That is, there was no change in the bank’s economic capital position,
but regulators allowed banks to include previously ineligible asset values (land
appreciation allowances 14 ) as Tier2 capital for regulatory purposes. This pol-
icy was similar in nature to the infusion of capital in the form of supervisory
13 Banks had the discretion to choose whether or not to declare an allowance for
land revaluation. Therefore, there were no instances of negative land revaluation
allowances as of the regulatory date of revaluation.14According to "Practice of Bank Accounting", which is a de-facto offi cial handbook
for bank accounting in Japan, land revaluation applies to land owned for business
purposes. Lands on a bank’s book are lands owned for business purposes such as
branches, employee housing and employee welfare.
8

goodwill that contributed to the thrift crisis in the US (see White (1991)).
Land revaluation allowances thus represented an ongoing, permanent infusion
of regulatory capital, since subsequent declines in land values did not have
to be deducted from the bank’s regulatory capital position. Parallel to the
land revaluation allowance policy’s accounting rule changes, on April 9, 2009,
the US Financial Accounting Standards Board passed a rule change (FAS
157 − 4 15 ) that allowed banks to avoid market value accounting “when the
volume or level of activity for the asset or liability have significantly decreased
and identifying transactions are not orderly.” This permitted US banks to
avoid capital charges that would have resulted from valuing their financial
assets and liabilities at the low prices prevalent during the crisis period. Our
empirical results suggest that this form of forbearance, propping up regulatory
(but not economic) capital levels, was ineffective in stimulating Japanese bank
lending during the crisis. Instead of increasing total lending, this policy only
had allocative effects. That is, Japanese bank lending shifted from residential
real estate to non-residential real estate lending without an aggregate increase
in total lending.
An issue hitherto not addressed in the Japanese banking literature is the op-
erational response of Japanese banks in the wake of the crisis that intensified
during the period of regulatory interventions. In Japan, some banks responded
to their capital constraints by switching their charter designations from inter-
national to domestic only so as to ease regulatory capital requirements 16 .
15 For details, see FAS 157-4: Determining Fair Value When the Volume and Level
of Activity for the Asset or Liability Have Significantly Decreased and Identifying
Transactions That Are Not Orderly.16As will be discussed in Section 2, Japanese banks with only domestic operations
had a 4% capital requirement in contrast to the 8% requirement for international
9
This is consistent with Dunning’s eclectic paradigm of internalization theory,
since the value-added of Japanese bank international operations was decreas-
ing during the crisis, and therefore, a shift away from multinational activity
would have economized on the bank’s regulatory capital costs 17 .
During the Japanese banking crisis, 62 banks switched their charters from
international to domestic only, thereby cutting their capital requirements in
half, as well as retaining access to the land revaluation allowance 18 . As the
costs of bank capital increased and the returns to banking decreased during
the crisis, Japanese banks de-internalized their operations and eliminated their
multinational presence 19 . In this paper, we address this endogenous shift in
Japanese bank operations by analyzing the de-internalization decision, thereby
establishing that regulatory capital requirements can be a binding constraint
on bank behavior. In particular, we analyze the charter switching decision
and show that banks with marginal shortfalls in regulatory capital switched
charters so as to take advantage of the reduction in their capital requirements.
banks.17 Section 2 of this paper describes the differential capital regulations for interna-
tional and domestic Japanese banks. For a survey describing internalization theory,
see Dunning (2003).18 There was only one bank, Yasuda Trust, that switched (in March 2003) in the
opposite direction, from domestic to international, but we could not obtain suffi cient
data about the bank’s portfolio to include it in our sample.19Dunning (1998) considers three other factors that could lead multinational firms
to retrench and eliminate their international operations: (1) the growing importance
of firm-specific, knowledge-intensive inputs into the production process, (2) reduc-
tions in international impediments to trade, and (3) the ability of firms to form
cross-border alliances.
10

We establish that the empirical results pertaining to the impact on bank
lending behavior of regulatory intervention measures are robust to a two-
stage analysis that controls for the endogeneity of the switching decision. To
account for the possible endogeneity in the charter switching decision, we first
employ a probit regression to estimate the probability that a bank would de-
internalize operations and switch its charter. We find that it was the bigger,
better-capitalized banks that had an increased probability to switch their char-
ter from international to domestic operations, whereas direct public injections
dissuaded a bank from switching its charter 20 . We also control for the ability of
the bank to take advantage of the mark-to-market accounting changes through
both the equity and land revaluation allowances. Since the allowances effec-
tively increased the bank’s Tier2 capital, there were limitations on the ability
of the bank to benefit from the Tier2 regulatory capital forbearance. Bank
capital requirements limit the amount of eligible Tier2 capital to be less than
Tier1 capital. Thus, Tier2 capital must comprise less than half of a bank’s
total capital requirements. Our probit regression analysis shows that banks
with more unused Tier 2 capacity were more likely to switch their charter so
as to increase their regulatory capital position. Further, our two-stage analysis
is consistent with our results that risk-based capital infusions were effective in
stimulating bank-lending activity during the Japanese banking crisis, whereas
across the board capital infusions had no impact on aggregate bank lending.
Regulatory forbearance, through suspension of mark-to-market accounting re-
20Kroszner and Strahan (1996) find that thinly capitalized thrifts were most likely
to switch from a mutual to a stock charter in order to obtain access to private
capital. This counterintuitive result obtains from their finding that thrift regula-
tors allowed mutual-to-stock conversions of weak thrifts (and subsequently large
dividend payouts) because they did not have funds to bail them out.
11

quirements via the land revaluation allowance, had only an allocative, not an
aggregate impact on bank lending activity.
The paper proceeds as follows. Section 1 provides a brief review of the
literature and a description of Japanese bank capital regulations and policies
during the 1980s − 2000s. Section 2 describes our hand-collected database
and provides descriptive statistics. In Section 3, we present the results of our
baseline model as well as endogenize the process of Japanese bank switching
of charter and examine the two-stage regression results. We next discuss some
robustness checks. The paper concludes in Section 4.
1 Japanese Regulatory Policies Over the 1980-2000 Period
Prior to the adoption of the Basel Accords, the regulatory capital require-
ment in Japan was set at 4%, as calculated by capital divided by total as-
sets less specific bad debt reserves. However, Japan had a two-tiered system
that continues to this day 21 . That is, Japanese banks that operate overseas
branches were allowed to include 70% of unrealized gains on securities in their
21 Japan’s economy is largely bank-based. Kang and Stulz (2000) find that strong
reliance on bank financing and the lack of alternative sources of funds in Japan
contributed to the decline in firm value displayed by the loss of more than half of
equity value for the typical firm on the Tokyo Stock Exchange during 1990 to 1993.
12

capital calculation, but were required to meet a 6% capital ratio 22 23 . In con-
trast, domestic banks with no international branches could not include their
unrealized gains on securities as capital, but were required to meet only a 4%
ratio.
Upon the agreement to adopt the Basel Accords in 1988, a four-year tran-
sitional period was initiated 24 . Basel I was fully implemented in Japan as of
March 1993, with the exception that the Japan’s Ministry of Finance per-
mitted only Japanese banks with international operations to include 45% of
the unrealized gains on securities as Tier2capital (in a line item known as the
equity revaluation allowance). Unrealized losses on securities and cross hold-
ings of stocks of other financial institutions were deducted from Tier1 capital
for all Japanese banks (both with and without international branches). Cap-
ital requirements were calculated on a consolidated basis only. Most impor-
tantly, however, the 8% Basel capital requirement was not levied on domestic
Japanese banks without international operations. These banks retained the
22 Specific loan loss reserves, which write off specific individual loans, were excluded
from both the numerator and the denominator of the capital ratio (though general
provisions for loan losses and reserves were included in the numerator) for Japanese
banks with international branches. Moreover, cross holdings of stocks were not de-
ducted from the numerator.23According to Himino (2005), Japan’s international (city) banks would have been
unable to meet the 6% capital requirement if they could not utilize reserves from
their unrealized gains on securities (also known as hidden reserves).24During 1988 to 1990, Japanese banks were required to keep their risk-based capital
levels at levels no lower than those as of the end of fiscal year 1987. During 1990−
1992, the requirement was increased to 7.25%, and to 8% when Basel I took full
effect in March 1993.
13

4% non-risk based requirement.
In December of 1992, the first asset management company was created
in Japan called the Cooperative Credit Purchasing Company. In 1993, the
Japanese financial system was reformed so as to allow banks to underwrite
corporate bonds through bank-owned subsidiaries 25 . The Financial System
Reform Act of 1992 (which took effect in April 1993) was designed to promote
competition in Japanese financial markets. Takaoka and McKenzie (2006) find
that the law achieved this result since underwriting commissions and yield
spreads on corporate bonds fell dramatically with bank entry into the under-
writing business. The two major reforms were: (1) permitting the consolidation
of banking and securities firms through subsidiaries, and (2) allowing securities
firms to participate in the market for securitizations 26 .
25Hoshi and Kashyap (1999) find that bank deregulation allowed large corpora-
tions to switch their funding sources from more costly bank loans to less expensive
capital market financing. However, since deregulation did not offer new investment
opportunities for consumer savings, households continued depositing their savings
in banks. Thus, Japanese banks retained deposit sources of funds while losing much
of their traditional large business-lending base. Japanese banks, in their search for
new borrowers, therefore, increased their lending to small businesses and real estate
lending. This increased real estate lending fueled the real estate bubble that built
up in Japan during the 1980s. Uchida and Nakagawa (2007) and Hoshi, Kashyap
and Scharfstein (1991) find evidence of irrational herding behavior among Japanese
banks in the domestic loan market during the buildup of the credit bubble in Japan
during 1987− 1989.26 For a complete list of deregulations packaged in Japan’s financial liberalization
programs, see Hoshi and Kashyap (2001).
14
Hoshi and Kashyap (2009) date the start of Japan’s financial crisis to the
loan loss problems at the housing loan institutions (jusen) that were created
in the 1970s. In 1991, non-performing loans at the jusen totaled 38% of their
total loans 27 . The Ministry of Finance and the large Japanese banks made
several rescue attempts to prop up the insolvent jusen, all of which were un-
successful, and by 1995, the jusen were liquidated. At around the same time, in
response to the continuing banking crisis, the 10 million yen deposit insurance
cap was eliminated and full deposit insurance was extended to all deposits for
six years, untilMarch 2002. Between April 2002 toMarch 2005, only payable
deposits received full deposit insurance protection. Time deposits were insured
up to a 10 million yen cap. As of April 2005, all deposits (with the exception
of payable deposits that are zero-interest earning, payable on demand and
providing settlement services) in Japanese banks are insured only up to 10
million yen, reverting back to the pre − 1995 situation. Fueda and Konishi
(2007) find that Japanese depositors discipline the banks when deposit insur-
ance protection is incomplete by withdrawing their funds from risky banks
and forcing these banks to restructure 28 .
InMarch 1998, the Land Revaluation law was passed, allowing all Japanese
banks (not just those with international branches as was the case for the eq-
uity securities revaluation allowance) to add 45% of their unrealized gains
on land values to Tier2 capital. In addition, risk-based capital requirements
were extended to domestic Japanese banks without international branches,
although the standard was 4%, not 8%. Because of the lower regulatory cap-
27Hoshi and Kashyap (2009), page 11.28 Imai (2006) finds that the end of full insurance in March 2002 invoked depositors’
discipline.
15
ital standard for domestic Japanese banks, general provisions and loan loss
reserves could constitute only 0.625% of Tier2 capital, as compared to the
1.25% level permitted for Japanese banks with international operations 29 .
Table 1 summarizes the capital requirements for Japanese banks with and
without international branches during this time period.
INSERT TABLES 1 AND 2 AROUND HERE
As the banking crisis in Japan continued, in February 1998, the Japanese
government initiated a program of public infusions of capital, allocating 13 tril-
lion yen for recapitalizing banks and 17 trillion yen for protecting the deposi-
tors of failed banks. Most of the injections of subordinated debt were directed
toward the systemically important city and trust banks 30 . Moreover, the
amount of capital was spread relatively evenly across the large banks. Despite
this program, in 1998 two long-term credit banks, Long-term Credit Bank of
Japan and Nippon Credit Bank failed and were nationalized. Thus, a second
round of public capital infusions was undertaken during 1999, mostly in the
form of preferred stock. As can be seen from Table 2, the 1999 program was
far more substantial in size. Moreover, the level of each bank’s capital injec-
tion was determined by the bank’s non-performing loan levels 31 . During 1998
29 Prior to 1999, capital adequacy requirements for Japanese banks with interna-
tional branches were calculated on a consolidated basis while that of domestic banks
was calculated on an unconsolidated basis. This changed since March 1999 when
capital adequacy requirements for all banks came to be reported both on an uncon-
solidated as well as a consolidated basis.30 To save space, the details of the public injections, including the identities of the
recipients and the details of the amount received by each recipient are outlined in
Appendix A. Table 2 provides a comprehensive summary of the injections.31 Prior to 1993, Japanese banks were not required to report their non-performing
16

and 1999, Japanese Government made public injections of about 10 trillion
yen amounting to 2% of Japan’s GDP in an attempt to boost Japanese bank
capital adequacy ratios and stimulate bank lending activity. Given the slow
recovery of the Japanese economy, public capital infusions continued through
the 2000s (see Table 2). The Japanese government would periodically infuse
capital to systemically important banks that faced a capital crunch due to
non-performing loan losses.
In April 1999, mark-to-market requirements were extended to all securities
held by Japanese banks. Moreover, tax deferred accounting became effective in
Japan as of March 1999 permitting banks to increase their regulatory capital
levels by including deferred tax assets (DTAs) in Tier2 capital; see Skinner
(2008). This was not a sign of financial health because the DTAs represented
past loan losses that the banks would be able to deduct on their taxes if ever
they became profitable 32 .
In April 1998 (and revised in October 1998), Japanese banks were formally
subjected to penalties from violations of capital regulations in the form of
Prompt Corrective Action (PCA) 33 . Prior to the adoption of PCA, capital
loans in their financial statements. This requirement was gradually phased in until
all banks began reporting non-performing loans from March 1998.32However, Skinner (2008) finds a statistically significant negative effect on
Japanese bank capital adequacy in the first year of adoption of the provision al-
lowing the use of deferred tax assets (DTAs). That is, the lower the bank’s capital
adequacy level, the higher the DTAs, thereby suggesting that DTAs were used to
bolster the bank’s capital position. In 2003, stricter audit procedures stated that if
the bank’s capital position fell below 4% then it was not allowed to use five years
of DTAs as capital.33Domestic banks got a one-year extension for the start of PCA that began from
17

requirements were used as managerial guidance for Japanese banks, but there
were no formal penalties for noncompliance with capital standards. However,
after the adoption of PCA, if a bank fell short of the minimum capital stan-
dard, it faced formal regulatory action. Bank capital ratios were divided into
four classes, which mandated progressively stricter intervention as the capi-
tal ratio fell. For example, the first action class (requiring the deficient bank
to submit and implement a management improvement plan with measures
to enhance capital) was triggered if an international bank’s capital fell be-
tween 4% to 8% or if a domestic bank’s capital fell between 2% to 4%. If the
international (domestic) bank’s capital was between 2% to 4% (1% to 2%),
dividend payouts and executive bonuses would be restricted. If the interna-
tional (domestic) bank’s capital was between 0% to 2% (0% to 1%), the bank
was required to present plans to substantially increase capital enrichment or
decrease business activity, or merge with another bank. Finally, if capital was
entirely depleted, regulators would require the bank to discontinue operations.
In December 2002, an early warning system was introduced in Japan so that
bank regulators could monitor bank profitability and asset liquidity even if
capital standards were met in order to detect unhealthy banks before they
deteriorate into capital deficiency 34 .
September 2002 saw a change in the political atmosphere of Japan with the
April 1999.34A somewhat similar approach undertaken by the Obama Administration is the
establishment of the Financial Fraud Enforcement Taskforce that replaces the Cor-
porate Fraud Task Force established in 2002. The aim of the taskforce is to “build
upon efforts already underway to combat mortgage, securities and corporate fraud
by increasing coordination and fully utilizing the resources and expertise of the
government’s law enforcement and regulatory apparatus”.
18

replacement of Hakuo Yanagisawa by Heizo Takenaka as the head the gov-
ernment’s financial reform efforts. In October 2002, a program for financial
revival (Kin′yu Saisei Program) was announced (also popularly referred to
as the “Takenaka Plan”) that required major banks to reduce their ratio of
non-performing loans to total loans by half as of March, 2005. This program
also codified the Bank of Japan’s responsibilities to assist financial institu-
tions in distress. In the event of a capital shortage or liquidity problem, the
Bank of Japan would immediately offer the troubled bank “Special Support,”
which consisted of providing liquidity through special loans, public injections
of funds, the placement of resident bank inspectors, and possible changes in
the bank’s management. Despite these policies, the Japanese banking system
was weak and undercapitalized throughout the decade.
2 Data and Descriptive Statistics
2.1 Data Description
We hand collect a sample consisting of the financial statements of Japanese
banks grouped into city, trust, long-term and regional banks. The regional
banks are further grouped into two sub-groups: regional banks and regional
banks of the second tier popularly referred to as “regional 2 banks 35 .”Our
35 In Japan, the second tier (regional 2) banks were originally established as mutual
banks (or Sogo banks) and were regulated separately from regional 1 banks. On
February 1, 1989, 52 of 68 mutual banks were transformed to Banking Act regional
banks and designated regional 2. By April 1, 1992, all remaining mutual banks
completed their transformations to regional banks under the Banking Act.
19
original sample consisted of 17 city banks, 7 trust banks, 2 long-term banks,
and 134 regional banks (69 regional banks, and 65 regional 2 banks). We only
consider those banks that continue to exist throughout our sample period,
which extends from the fiscal year for 1992 (beginning on April 1, 1992 and
ending on March 31, 1993), through the fiscal year for 2006 (April 1, 2006
through March 31, 2007). If a bank merged during the sample period, fol-
lowing the methodology of Hancock and Wilcox (1993), Bernanke and Lown
(1991) 36 , we construct a hypothetical consolidated bank whose pre-merger
value for any given variable is the sum of pre-merger values for the banks
involved in the merger deal. For example, Mitsubishi Tokyo UFJ Bank was
established as a result of a merger between Tokyo Mitsubishi Bank and the
UFJ Bank on January 1, 2006. In our sample, the constructed Mitsubishi
UFJ Bank represents the merged entity throughout our sample period. We
then delete from our sample any banks that failed before 31st March 2007.
Note that survivorship bias is not a concern here because our focus is on
whether healthy Japanese banks responded to public stimulus policies. Cor-
recting for mergers and failures, we obtain a clean sample comprising 4 city
banks, 4 trust banks, 2 long-term credit banks and 107 regional banks (62
regional banks and 45 regional 2 banks).
Our data sources are twofold: one based on the Nikkei NEEDS Japanese
database and another that is hand collected. We obtain financial variables
(e.g., loans outstanding by industry or sector) from the unconsolidated bank
financial data recorded in the Nikkei NEEDS database. In our analysis, we
focus on three loan categories classified in the literature as bank-dependent
36 Force-merging of banks to account for mergers was also adopted by Watanabe
(2008).
20
loans: commercial and industrial loans, non-residential real estate loans, and
residential real estate loans (see Peek and Rosengren (2001), Peek, Rosengren
and Tootell (2003)).
Another major component of our analysis utilizes the variables measuring
each bank’s capital level. Japanese banks are required to report their Tier1
and Tier2 capital levels in their annual reports. Individual bank capital levels
and their sub items including equity and land revaluation allowances are only
available on NEEDS after 1999. Therefore, values of these variables before
1999 had to be hand collected from Japanese bank financial statements. More-
over, we hand collected data on each bank’s loan losses for our sample period.
To this end, we obtained approximately one thousand annual reports of indi-
vidual banks for each bank-year observation archived in the Bank Library run
by the Japanese Bankers’Association. To fill in missing values, we obtained
the banks’securities reports archived at Keio University library. Both types
of reports are archived only in a hard copy format requiring us to manually
generate the current database that we utilize in this study. For data in the
period after 1999, we checked the data reported in the financial reports against
the Nikkei NEEDS database. In the case of any discrepancy, we consulted
with bank managers. In all such instances, the data reported in the individual
bank annual reports matched the estimates provided by the bank managers,
and thus we adopted the data from the annual reports, thus ensuring consis-
tency of our data. From our cleaned sample, we had to drop Yasuda Trust
bank due to lack of data on residential real estate loans. Therefore, our fi-
nal sample reduced to 116 banks (4 city banks, 3 trust banks, 2 long-term
credit banks and 107 regional banks) and 1, 740 annual data points over the
1993 through 2007 period. The list of banks in our final sample is provided in
21

Appendix B.
2.2 Model Description
We follow Peek and Rosengren (2005) and specify the model of bank lend-
ing activity as a function of macroeconomic conditions, bank characteristics,
public policy interventions and capital regulations as follows:
Li,j,t−Li,j,t−1Ai,t−1
= a0 + a1BANKi,t−1 + a2DEMANDt−1+
a3Y EARt + a4LOANLAGi,j,t−1 + a5CAPREQi,t−1 + ui,t
(1)
We summarize the list of dependent and explanatory variables in Table 3
and the summary statistics of the variables in Table 4.
INSERT TABLES 3 AND 4 AROUND HERE
The dependent variable is the change in outstanding loans of a bank i to
sector j between the periods t and t − 1 normalized by the total assets of
bank i as of period t − 1 37 . In our analysis, we consider four categories of
dependent variables: aggregate loans (TOTLOAN), commercial and indus-
37 Because of the absence of data on new lending flows, we utilize the net change
in outstanding loans in our analysis. Note that the relationship between change
in outstanding loans and new loans can be expressed as New Loans = Change in
outstanding loans + Charge offs + Transfer of real estate loans to other real estate
owned due to foreclosures + Loan sales (refer to Peek and Rosengren 2000 for
details). Examination of the change in bank portfolio holdings is appropriate since
our focus is on regulatory capital constraints.
22

trial loans (CILOAN), non-residential real estate loans (NONRESLOAN)
and residential real estate loans (RESLOAN). On average, commercial and
industrial loans, non-residential real estate loans and residential real estate
loans jointly comprise 40% of total loans of the banks in our sample. De-
scriptive statistics of the sectoral allocation of loans is outlined in Table 4,
Panel B. The largest loan segment for Japanese banks is residential real estate
loans, although there is considerable commercial and industrial lending and
non-residential real estate lending.
To capture a bank’s lending behavior in the previous year, we include
lagged values of the loans, denoted as (TOTLOAN(−1), CILOAN(−1),
NONRESLOAN(−1), RESLOAN(−1)), summarized in the vector LOANLAG.
To conserve degrees of freedom, we used a single lag in our past loan values
similar to Hoshi and Kashyap (2009).
One of the critical components of any analysis involving a bank’s lending
behavior is to control for the macroeconomic factors affecting loan demand to
disentangle the impact of loan demand shocks from loan supply shocks. We
specify the vectorDEMAND that includes time varying macroeconomic vari-
ables that we collect from the Japan Statistical Yearbooks 38 . First, we use the
annual growth rates of Japan’s Gross Domestic Product (GDP ); for city, trust
and long term banks, we use national GDP , whereas for regional banks, we use
prefecture level GDP where the prefecture is selected based on the location of
the regional bank’s headquarters. Appendix D provides us with a map of Japan
38 Peek and Rosengren (2000) address the endogeneity problem by utilizing the
decline in Japanese commercial real estate prices as a natural experiment to test
the extent to which a loan supply shock can affect real economic activity in the US.
23

with the prefecture details. Further, we additionally control for macroeconomic
variations using the Index of Business Conditions (BUSINDEX) collected
from the Annual Survey of Corporate Behavior. BUSINDEX is a survey of
Japanese businesses’forecasts of the future growth rate in consumer demand
over the next year and next five years. Another variable used to control for
macroeconomic factors is the Consumer Confidence Index (CONSINDEX)
collected from the Monthly Consumer Confidence Survey in which urban con-
sumers throughout Japan are asked to forecast their confidence about the
economic conditions, particularly regarding their income growth and willing-
ness to buy durable goods in future months and years. Both BUSINDEX
and CONSINDEX are provided by the Economic and Social Research In-
stitute of Japan. Finally, we include a set of annual dummy variables (TIME
DUMMIES) summarized by the vector Y EAR to control for the year-to-year
variations in macroeconomic conditions and general economic environment.
CAPREQ is a vector summarizing each bank’s capital position. While the
reported Basel capital ratio provides a measure of a bank’s capital position, to
capture a bank’s overall capital constraint, we include the difference between
the reported Basel capital ratio and the target Basel capital ratio (BISDIF ).
A negative value indicates that a bank’s reported capital ratio falls short of
the target ratio mandated by the Basel Accord (8% for international banks)
or the FSA (4% for domestic banks), and therefore the bank is considered to
be capital constrained. A value of zero or a positive value of the BISDIF
variable indicates a bank meets or exceeds the target capital requirement.
In addition to the overall capital requirement, CAPREQ also includes vari-
ables consisting of Tier2 regulatory capital forbearance policies, LANDREV AL
and EQREV AL, which are measured as the allowances for land and equity
24

securities revaluation divided by total assets 39 .
In addition we include two public injections variables:BLANKETPUBINJ
and RISKBASEDPUBINJ . The former is calculated as the amount of pub-
lic injections in 1998 as a share of total assets. The latter includes the amount
of public injections in year 1999 and thereafter as a share of total assets. In
Japan, the two major phases of public injections were initiated in 1998 and in
1999. However, we find that the 1998 program was poorly conceived in com-
parison to the 1999 injection. In the blanket program initiated in 1998, all city
banks applied for and received almost an equal amount of capital that was
fixed at a maximum of 100 billion yen. This amount was set in consultation
with the then healthiest bank, Bank of Tokyo Mitsubishi. Hence as Hoshi and
Kashyap (2009) argue, the maximum amount disbursed (1.8 trillion yen) was
far less than the amount needed to restore bank capital.
In comparison, the 1999 injection was much larger (7.5 trillion yen) and it
was given after the Financial Reconstruction Commission (FRC) evaluated
each bank’s application to ascertain whether the amount requested would
be enough to cover each bank’s non-performing loan problem 40 . Since 1999,
the government has periodically propped up troubled, systemically important
banks 41 with varying amounts of public injections although the aggregate
39We utilize total assets as the denominator to normalize each bank’s capital po-
sition as a basis of comparison, because risk-adjusted assets are not available for
domestic banks until 1997.40Hoshi and Kashyap (2009) state that the increase in size of public injections in
1999 was the result of the Japanese government’s rigorous assessment of the banks’
non-performing loans, thereby allowing them to better assess each bank’s needs.41 The Act of Strengthening Financial Functions passed in 2004 allowed the Japanese
government to inject funds into the banking system in 2007 (fiscal year 2006) without
25
amount is far less than the 1999 program (see Table 2).
INSERT FIGURE 1 AROUND HERE
Descriptive statistics for the explanatory variables in our analysis are pre-
sented in Table 4, Panel A. Figure 1 provides a pictorial depiction of the rel-
ative size of each stimulus program. Public injections were, on average, lower
than the indirect infusions provided by equity revaluations or land revalua-
tions. The public injections of 1998 averaged 0.003% of assets across all banks
in our sample. The public injections in 1999 and thereafter were substantially
bigger in size, averaging 0.025% across all the banks. In contrast, equity (land)
revaluations averaged 0.29% (0.18%) of bank assets. This is partly due to the
fact that public injections were limited to the major banks (city, trust and
long-term) with only a handful of regional banks receiving capital infusions.
Thus, public injections covered a limited number of banks in our sample, al-
though for those banks, the amount of capital infusions was quite substantial
—with a maximum capital injection of 4.8% of the bank’s assets as compared
to the maximum equity and land revaluation of 2.5% and 0.95% of assets,
respectively. In terms of coverage, land revaluations were broadest in scope
being applicable to all Japanese banks, whereas only banks with international
operations could take equity revaluations 42 .
having to justify their systemic importance. However, since our sample ends in 2007
we do not utilize the 2007 public injections in our analysis. Thus, for our sample,
all RISKBASEDPUBINJ in 1999 and thereafter are based on each bank’s risk
exposure and loan losses.42Another difference between direct public injections and the revaluation allowances
is that the latter represented permanent, on-going infusions, whereas the public
capital infusions were one-time episodes.
26

In our model, we utilize the following bank characteristic control variables.
BANK is a vector of bank specific variables that summarize the health of
a particular bank under consideration. We include log of assets (ASSET )
as a measure of bank size, and dummy (0, 1) variables that specify the type
of a bank: city bank (CITY ), trust bank (TRUST ) long-term credit bank
(LONG − TERM), regional bank (REGIONAL). The binary variable for
the fifth category, regional 2 banks, is omitted. Moreover, we include a bi-
nary variable (DOMESTIC) to capture a bank’s operational jurisdiction,
such that DOMESTIC takes a value of 1 if a bank only has domestic oper-
ations and 0 if the bank has international operations in any given year. We
also include a measure of loans made to failed enterprises as a share of the
bank’s beginning of the period asset (LOANLOSS). The annual reports for
the banks provide three possible measures of loan losses: loans to failed enter-
prises, loans whose interest payments have been suspended and loans whose
interest payments have been suspended 3 months or more. While the data on
the first category is available for the entire sample period, the data on the last
two categories are only available since 1995 for all the banks in our sample.
Given this restriction, we use loans to failed enterprises as a measure of loan
losses incurred by a bank. We estimate the model over the 1993− 2007 period
and present the results of our analysis in the next section.
3 Empirical Results
3.1 The Effi cacy of Japanese Public Policy Interventions
INSERT TABLE 5 AROUND HERE
27

We test the impact of the three regulatory capital policy interventions (di-
rect public injections of 1998, 1999 and the changes in accounting valuation
procedures) using the variablesRISKBASEDPUBINJ ,BLANKETPUBINJ ,
LANDREV AL and EQREV AL. Table 5 presents the fixed effect regres-
sion results of the model specified in equation (1). Each column of Table 5
represents the estimation using each of the four dependent variables —total
loans, commercial and industrial loans, non-residential mortgages and resi-
dential mortgages lending. The heteroskedasticity-robust standard errors are
reported in the parentheses and are calculated using the Panel Corrected Stan-
dard Errors (PCSE) methodology suggested by Beck and Katz (1995). The
results indicate that RISKBASEDPUBINJ had a significantly positive im-
pact on aggregate bank lending across all loan types. The coeffi cients indicate
that a 1 percentage point increase in the risk-based public injections received
stimulate net outstanding loans (as a share of assets) by approximately 0.01
percentage point (coeffi cient significant at 1%). In contrast, the results from
the across the board public injections BLANKETPUBINJ variable actually
suggest that total bank lending declined.
In terms of sector-specific effects, risk-based public injections were most
successful in stimulating commercial and industrial lending (coeffi cient posi-
tive and significant at 1%). The impact on loans made to non-residential real
estate and the real estate sector is also positive though the coeffi cient is not
significant at the 5% level 43 . In contrast, blanket public injections had no
statistically significant impact on lending in any of the three sectors. Thus,
the poorly designed public policy program of blanket injections applied to a
small number of banks in 1998 was unsuccessful in accomplishing its goal of
43 The coeffi cient on non-residential real estate loans is significant at 10%.
28
stimulating bank lending, although the program of risk-based capital infusions
stimulated bank lending activity 44 . Thus, the results of our analysis presented
in Table 5 show that risk-based direct infusions of capital had a stimulative
effect on aggregate lending, as well as on each sector of lending 45 .
In contrast, the size of both the equity and land revaluation allowances had
no overall impact on aggregate lending —see column (1) of Table 5. However,
the land revaluation allowance had an allocative effect, as shown in columns
(3) and (4) of Table 5. Japanese banks increased their non-residential real
estate lending and decreased their residential real estate lending (statistically
significant at the 5% level or better) in response to the regulatory forbearance
offered by Tier2 capital infusions through land revaluation allowances. There
is also a slight increase in commercial and industrial lending, although it is
not statistically significant at the 10% level. Thus, Japanese banks did not
expand their overall lending activity, but shifted from the residential mortgage
sector to the non-residential real estate sector in response to regulatory capital
arbitrage incentives 46 .
44 The effectiveness of the 1999 capital infusion policy is due to both the methodol-
ogy (risk-based) and the size (over 7.4 trillion yen). When the post − 1999 capital
infusions are analyzed separately from the 1999 program, we find increases in ag-
gregate and sectoral lending activity although the statistical significance is lower.45Our results on aggregate lending are consistent with Giannetti and Simonov
(2009) who find that the risk-based public injections had a statistically significant
positive impact on aggregate lending whereas the effect of the blanket injection is
not significant.46 This sectoral reallocation of loans is consistent with the debt concentration effect
postulated by Gande et. al. (2008). However, our micro evidence finds this effect
in case of implicit bailouts engineered by the Land Revaluation Law rather than a
29
Our regression results presented in Table 5 also indicate that the coeffi cient
on BISDIF , each bank’s excess over its capital requirement is statistically
significant (at the 5% level or better) and positive for aggregate lending, and
commercial and industrial loans, but was significantly negative (at the 5%
level) for residential real estate loans. This demonstrates the reallocation of
lending activity that is driven by bank capital constraints. Residential real
estate lending is subject to lower capital requirements (50% risk weight) as
compared to commercial and industrial lending (100% risk weight). Thus,
Japanese banks that were more capital constrained (i.e., BISDIF is lower)
reduced their business lending and shifted toward residential mortgage lending.
In contrast, banks with excess capital (i.e., BISDIF is higher) reallocated
their lending activity away from residential mortgages toward business lending.
Moreover, the coeffi cient on LOANLOSS was statistically significant (at the
1% level) and negative for all loan types except residential real estate (for
which the coeffi cient is positive, albeit not significant), consistent with the
inability of banks with high loan losses to increase their aggregate lending and
lending to high risk-weighted sectors and instead focus their lending on the low
risk-weighted residential real estate sector. The significant (at the 1% level)
and positive coeffi cient on lagged total lending (e.g., the TOTLOAN(−1)
variable) is consistent with Japanese banks’ rolling over of past due loans
into future loans in order to avoid loan write-downs (see Peek and Rosengren
(2005) and Caballero, Hoshi and Kashyap (2008)).
direct bailout in the form of direct public injections.
30

3.2 Controlling for Endogeneity: De-Internalization
The results, presented in Table 5 obtained by estimating our basic model,
equation (1), suggest that Japanese bank lending activity was capital con-
strained. That is, Japanese bank capital levels impacted the banks’ lending
behavior either in terms of the aggregate lending activity or in terms of their
allocation across lending sectors. However, this result may be impacted by
endogeneity. As discussed in Section 2, Japanese bank capital regulations are
bifurcated depending upon whether the bank has international operations or
not. More lenient capital standards are required of domestic banks as com-
pared to Japanese banks with international operations. This dichotomy was
retained even as Japan adopted the Basel capital standard, since some ele-
ments of the capital requirements were applied to banks with international
branches and not to banks with only domestic operations. Banks with only
domestic operations must comply with only the 4%, rather than the 8% min-
imum capital requirement for international banks.
INSERT TABLE 6 AROUND HERE
Table 6 shows that on average domestic banks with lower capital require-
ments had larger excess capital positions than international banks. Thus, in
order to reduce their regulatory capital requirements, many Japanese banks
switched from an international charter to a domestic only charter by relin-
quishing their foreign activities, thereby de-internalizing their multinational
operations. In Appendix C, we provide a list of the switching activity of
Japanese banks during the banking crisis. This switching was endogenous to
Japanese banks’attempts to deal with the financial crisis by reducing their
31
regulatory capital constraints. To examine bank reactions to the regulatory
intervention policies of the Japanese government, we model the endogenous
decision to switch bank charter as a mechanism to relax regulatory capital
constraints.
We hypothesize that banks with capital deficiencies were more likely to
switch their charter. However, some of the public policy programs for interna-
tional and domestic Japanese banks involved Tier 2 capital rather than Tier
1 capital. For example, the equity revaluation allowance represented an infu-
sion of Tier 2 capital only into Japanese banks with international operations.
Moreover, the land revaluation allowance represented a Tier 2 capital infu-
sion for any Japanese bank that had positive land revaluations. However, this
capital infusion would relax capital constraints only if the bank had no un-
used Tier 2 capital available —i.e., if the bank was Tier 2 capital-constrained.
Under the Basel Accords, Tier 2 capital must be less than or equal to Tier 1
capital.
We calculate the amount of unused Tier 2 capital (UNUSEDTIER2) by
subtracting the amount of Tier 2 capital designated as meeting the bank’s
Basel capital requirement from the total amount of a bank’s Tier2 capital,
i.e., all securities eligible for classification as Tier 2 capital minus Tier 2 cap-
ital actually used. The UNUSEDTIER2 variable is normalized using the
beginning of the period assets for each bank. The minimum value that this
ratio can take is zero. A value of zero indicates that a bank has used all of its
available capital that qualifies as Tier 2 in satisfying its capital requirements.
A positive value for UNUSEDTIER2 implies that the bank had excess Tier
2 capital that did not qualify for compliance with the Basel Capital Accord.
The higher the value, the more constrained the bank is with regard to having
32

suffi cient Tier 1 capital to absorb all available Tier 2 capital. For example,
if an international bank has Tier 2 capital of 5% of assets, but Tier 1 cap-
ital of only 3% of assets, then the bank’s regulatory capital is deficient even
though it technically has 8% capital-asset ratio (the minimum capital asset
ratio requirement under Basel). The reason for this is that since Basel capital
regulations require that Tier 1 capital be greater than or equal to Tier 2
capital, the bank’s total capital position, for Basel capital adequacy purposes,
would be only 6% (3% of Tier 1 and 3% of Tier 2) and 2% of its Tier 2
capital would be unused. For such a bank, land revaluations would not be of
much help in meeting the capital constraint as land revaluations would only
be applied to Tier 2 capital and the bank is constrained in how much Tier
2 capital it can apply towards meeting the Basel requirement by its Tier 1
capital holding. The amount of unused Tier 2 capital is thus a measure of
whether a bank does indeed benefit from land revaluation allowance. Positive
instances of unused Tier 2 capital thus indicate a bank’s inability to exploit
the Land Revaluation Law to boost its regulatory capital. Such a bank may
find it advantageous to switch its charter to a domestic only bank so as to
reduce its capital requirement to 4% and therefore be in compliance with
regulatory capital standards.
For example, if the bank in our example switches charter to a domestic bank,
its capital position of 6% (3% of Tier 1 and 3% of Tier 2) is more than ade-
quate to meet the domestic bank capital compliance requirement of 4% and the
bank is no longer deficient in its regulatory capital. Thus, UNUSEDTIER2
is an important variable determining whether the bank would have changed its
charter to circumvent stricter capital requirements. Table 7 shows the break-
down of UNUSEDTIER2 for international and domestic Japanese banks.
33
INSERT TABLE 7 AROUND HERE
Table 7 shows that the unused Tier 2 capital cushion (to be able to absorb
capital infusion due to revaluations) was positive on average, and therefore a
potentially binding constraint on exploiting the land and equity revaluation
allowances. Moreover, this constraint was most binding for the international
banks, which had a comparatively higher unused Tier 2 capital position as
compared to the domestic banks. As expected, this disparity is most apparent
until 1998, precipitating the first wave of switching.
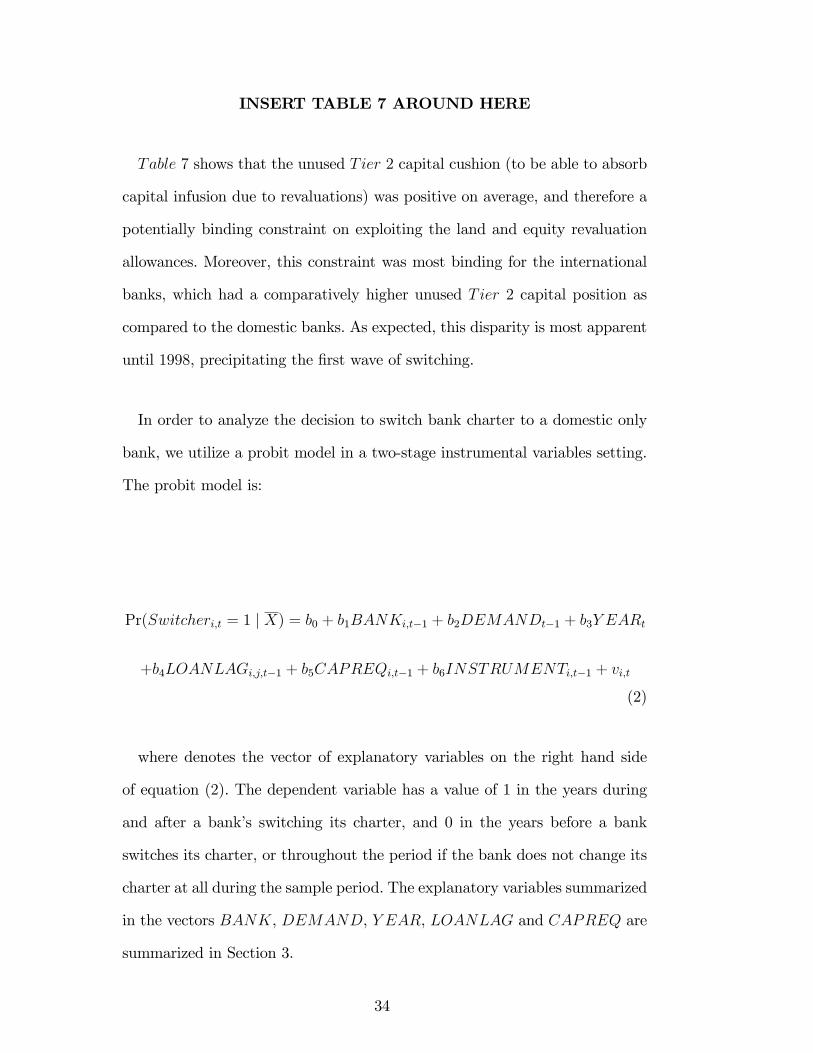
In order to analyze the decision to switch bank charter to a domestic only
bank, we utilize a probit model in a two-stage instrumental variables setting.
The probit model is:
Pr(Switcheri,t = 1 | X) = b0 + b1BANKi,t−1 + b2DEMANDt−1 + b3Y EARt
+b4LOANLAGi,j,t−1 + b5CAPREQi,t−1 + b6INSTRUMENTi,t−1 + vi,t
(2)
where denotes the vector of explanatory variables on the right hand side
of equation (2). The dependent variable has a value of 1 in the years during
and after a bank’s switching its charter, and 0 in the years before a bank
switches its charter, or throughout the period if the bank does not change its
charter at all during the sample period. The explanatory variables summarized
in the vectors BANK, DEMAND, Y EAR, LOANLAG and CAPREQ are
summarized in Section 3.
34

In addition, we include the vector INSTRUMENT that summarizes the
set of instrumental variables used. We utilize three instrumental variables:
UNUSEDTIER2, UNUSEDTIER2∗EQREV AL, and UNUSEDTIER2∗
LANDREV AL. These variables are chosen because the Tier 2 capital con-
straint is most relevant in determining whether the bank switched its charter
to take advantage of the Japanese government’s regulatory forbearance poli-
cies of the land and equity revaluations. These policies did not impact Tier 1
capital, although the total capital constraint is incorporated into the model us-
ing the BISDIF variable. To further justify our choice of instruments, Table
8 presents the correlation matrix.
INSERT TABLE 8 AROUND HERE
UNUSEDTIER2 is positively correlated with the switching decision (sig-
nificant at the 1% level), but is uncorrelated with all of the loan sector vari-
ables.
Thus, we utilize the UNUSEDTIER2 along with UNUSEDTIER2 ∗
EQREV AL and UNUSEDTIER2 ∗LANDREV AL (the two cross-product
variables) as instruments 47 .
INSERT TABLE 9 AROUND HERE
Table 9 presents the first stage results of the probit analysis. The dependant
variable is a binary variable, SWITCHER, which takes on a value of one if
47BISDIF measures the overall capital effect in terms of the bank’s deviation from
Basel capital requirements. However, because the BISDIF variable is positively
correlated with the amount of commercial and industrial loans directly (see Table
8), we cannot use it as an instrumental variable.
35

the bank switches from an international to domestic only charter, zero oth-
erwise. The results of the probit analysis of the bank charter switch decision
are consistent with switching by large, relatively well-capitalized banks. That
is, only if the bank’s capital was within reach of meeting the capital require-
ments would the charter switch be effective, as indicated by the positive and
significant (at the 1% level) coeffi cient on the BISDIF variable measuring
the Basel capital ratio. Consistent with this decreased switching propensity
for banks with greater deficiencies in bank capital requirements, banks with
higher amounts of loan losses are less likely to switch (negative and signifi-
cant (at the 1% level) coeffi cient on LOANLOSS). Switching was expected
to benefit only those banks that were either marginally deficient or had excess
regulatory capital.
Most importantly, the first stage probit results shown in Table 9 suggest
that only those banks that potentially could not benefit from the land and eq-
uity revaluations (i.e., they have UNUSEDTIER2 capital) were most likely
to switch charters. First, the positive and significant (at the 1% level) coef-
ficient on UNUSEDTIER2 variable shows that the greater the Tier2 ca-
pacity, the greater the probability of a switch in charter. In addition, the
positive and significant (at 5% level or greater) coeffi cient on LANDREV AL
and UNUSEDTIER2 ∗ LANDREV AL highlights the fact that banks with
larger land revaluations were more likely to switch charters if they had unused
Tier2 capital. In contrast, the negative and significant (at the 1% level) coef-
ficient on the UNUSEDTIER2 ∗ EQREV AL variable suggests that banks
with large equity revaluation allowances were less likely to switch to a do-
mestic charter since they could only use this regulatory capital forbearance if
they have Tier2 capacity available and if they have international operations.
36

Thus, the probit analysis suggests that Japanese banks’decisions to switch
their operations from international to domestic only involved analysis of the
costs of meeting regulatory capital requirements, consistent with Dunning’s
internalization theory.
In order to measure the impact of public policy interventions during the
Japanese banking crisis, while controlling for the endogenous decision to switch
charters, we estimate a two-stage system that incorporates the endogenous
charter switch model equation (2), into a second stage regression as follows:
Li,j,t−Li,j,t−1Ai,t−1
= c0 + c1BANKi,t−1 + c2DEMANDt−1+
c3Y EARt + c4LOANLAGi,j,t−1 + c5CAPREQi,t−1 + c6SWITCHERi,t−1 + εi,t
(3)
The dependent variable is regressed on the control variables as outlined in
(1) and the variables outlined in the vector SWITCHER. FollowingWooldridge
(2002), the two-stage least square methodology regresses the dependent vari-
able on the controls and the predicted value of the SWITCHER 48 as esti-
mated in equation (2).
INSERT TABLE 10 AROUND HERE
The two-stage model results are presented in Table 10. Similar to the earlier
fixed effect regression results (Table 5), the blanket public injections in 1998
have a negative effect on aggregate lending. In contrast, risk-based public
48We would like to thank William Greene for suggesting this step in our method-
ology.
37

injections had a strong positive impact on aggregate lending, as well as across
the sectors (i.e., significant at the 10% level or better for all loan types).
Moreover, the accounting rule changes (equity and land revaluations) have no
impact on aggregate bank lending activity. Instead, only the land revaluation
allowances have an allocative effect on bank lending, inducing a shift from
residential to non-residential lending activity. These results are consistent with
the OLS results presented in Table 5.
Endogenizing the switching decision demonstrates how Japanese banks ex-
ploited capital requirements. Both the OLS (Table 5) and two-stage (Table
10) results show that well-capitalized banks shifted from residential loans to
commercial loans, and were able to increase their aggregate lending activ-
ity. In contrast, Japanese banks with large loan losses were forced to reduce
their lending activity. Thus, our results are robust across model specifications,
and suggest that Japanese bank capital levels, as indicators of bank solvency,
impacted bank lending activity.
3.3 Robustness Test
One major challenge associated with measuring public policy effects is to
disaggregate the policy effect from responses to changes in general macro-
economic conditions. To accomplish this, we used a vector DEMAND that
incorporated a list of variables to control for shocks to lending behavior due
to variations in the macroeconomy. In addition to the variables included in
DEMAND, we add a variable that measures lending attitudes of banks as
perceived by their clients —the TANKAN survey. Conducted quarterly by
the Bank of Japan, the TANKAN survey (denoted LENDATTITUDE) is
38

calculated as a “diffusion index” that provides the percentage gap between
the number of clients that experience an easy access to credit and those that
find it harder to get credit. A shrinking or a negative value is indicative of
a general perception of tightening of credit access, whereas an increasing or
positive value is an indicator of a general perception of relative ease in access-
ing bank loans 49 . In this robustness check, we extend the vector DEMAND
to include LENDATTITUDE as an additional macroeconomic control and
report the results of both our OLS and 2SLS analysis incorporating the new
variable in Tables 11 through 13.
INSERT TABLE 11 AROUND HERE
The results of Table 11 are consistent with our previous OLS result (Table
5), consistent with the ability of risk-based, but not blanket public injections
to stimulate aggregate lending. Table 11 shows that revaluation allowances
are consistent with an allocative shift in lending from residential real estate
to non-residential real estate sector. The coeffi cient on LENDATTITUDE
is positive and significant at 1%, indicating that a perceived ease in lending
attitudes by banks is associated with an expansion of aggregate and residential
real estate lending.
INSERT TABLE 12 AND 13 AROUND HERE
We next conduct our 2SLS analysis including LENDATTITUDE as an
explanatory variable. The results, outlined in Tables 12 and 13 are consis-
tent with the ones presented earlier in Tables 9 and 10. UNUSEDTIER2
49 For further discussion on lending attitudes as a measure of macroeconomic vari-
ance, check Campello, Graham and Harvey (2009).
39
and its cross product with equity (UNUSEDTIER2∗EQREV AL) and land
revaluation (UNUSEDTIER2 ∗ LANDREV AL) once again emerges as an
important determinant of the decision by the banks to switch charter from
international to domestic, whereas LENDATTITUDE does not have any
significant direct impact on the switching decision. As far as the effi cacy of
the regulatory intervention measures are concerned, our findings are consis-
tent with our previous results that only risk-based public injections stimulated
aggregate bank lending in Japan, whereas changes in accounting valuation pro-
cedures such as the land revaluation allowance had an allocative effect only.
Consistent with earlier results, blanket public injections and equity revalua-
tions were ineffective in stimulating Japanese bank lending.
4 Conclusion
We utilize a unique, hand-gathered database of individual Japanese bank
financial statements in order to assess whether three major regulatory capital
interventions stimulated bank-lending activity during Japan’s banking crisis.
We find that public injections of capital into systemically important Japanese
banks had a stimulative impact on bank lending, provided that the injections
were based on each bank’s loan losses and insolvency risk exposure.
Indirect intervention policies via accounting adjustments, such as land and
equity revaluation allowances, did not have an impact on aggregate lending
activity. However, the land revaluation allowance, which was substantial in size
and applied to all Japanese banks, had an allocative effect on bank lending
activity. That is, allowing the banks to declare past increases in land prices
as a permanent component of Tier 2 capital enabled Japanese banks to shift
40
their lending from residential mortgage lending to nonresidential real estate
lending. Since these allowances were applied to all banks, they had a significant
redistributive effect, whereas the restricted equity allowances (applied only to
banks with international operations) did not.
Next, we apply Dunning’s eclectic paradigm to study the behavioral re-
sponse of a large fraction of Japanese banks to de-internalize their operations
in the wake of the financial crisis. We find regulatory capital costs to be an
important determinant of Japanese banks’shift away from international to a
domestic operation in the midst of the financial crisis. Our fundamental re-
sults about the effi cacy of policy interventions are robust to incorporating the
endogenous charter switching decision by the Japanese banks that relaxed the
capital requirements.
We draw parallels with regulatory capital policies in the US, as well as
provide a detailed survey of regulatory policies in Japan. Our results suggest
that regulatory capital policies can be successfully used to stimulate overall
economic activity if they are targeted to each individual bank’s risk exposure.
In a crisis, half measures are ineffective and can actually be detrimental. Public
policy programs must be substantial in size and carefully applied.
References
[1] Acharya, V.V., L. Pedersen, T. Phillipon and M. Richardson, 2009, “Regulating
Systemic Risk”, forthcoming in Restoring Financial Stability: How to Repair a
Failed System, edited by V.V. Acharya and M. Richardson, Wiley Publishers
[2] Bayazitova, D. and A. Shivdasani, 2009, “Assessing TARP”, Mimeo, Kennan-
41

Flagler Business School, University of North Carolina, Chapel Hill
[3] Beck, N. and J.N. Katz, 1995. “What To Do (and Not To Do) with Time-Series
Cross Section Data,”American Political Science Review 89, pp. 634—47.
[4] Bernanke, B.S. and C.S. Lown, 1991,“The Credit Crunch,”Brookings Papers
on Economic Activity, 2, pp. 205—48.
[5] Caballero, R.J., T. Hoshi and A.K. Kashyap, 2008, “Zombie Lending and
Depressed Restructuring in Japan,” American Economic Review, 98(5), pp
1943—77.
[6] Campello, M., J.R. Graham, C.R. Harvey, 2009, “The Real Effects of Financial
Constraints: Evidence from a Financial Crisis”, Journal of Financial Economics,
Forthcoming
[7] Diamond, D. W., and R.G. Rajan, 2009, “The Credit Crisis: Conjectures
about Causes and Remedies”, presented at the American Economic Association
Meetings, 2009
[8] Diamond, D.W., A.K. Kashyap and R.G. Rajan, 2008, “What Next?”October
8, 2008, in "Rescuing our Jobs and Savings: What G7/8 Leaders Can Do To
Solve the Global Credit Crisis", a VoxEU.org publication
[9] Dunning, J., 1998, “Location and the Multinational Enterprise: A Neglected
Factor?”Journal of International Business Studies, vol. 29, no. 1, pp. 45-66.
[10] Dunning, J., 2003, “Antecedents of Internalization Theory,” Journal of
International Business Studies, vol. 34, no. 2, pp. 108-115.
[11] Eichengreen, B. and R. Baldwin., (2008), “Rescuing our jobs and savings: What
G7/8 leaders can do to solve the global credit crisis”, a VoxEU.org publication
[12] Fueda, I. and M. Konishi, 2007, “Depositors’Response to Deposit Insurance
Reforms: Evidence from Japan, 1990-2005,” Journal of Financial Services
42

Research, vol. 31, pp. 101-122.
[13] Gande, A., K. John and L. Senbet, 2008, “Bank Incentives, Economic
Specialization, and Financial Crisis in Emerging Economies,” Journal of
International Money and Finance, vol. 27, Issue 5.
[14] Giannetti, M. and A. Simonov, 2009, “On the Real Effects of Bank Bailouts:
Micro-Evidence from Japan”, Working Paper No. 260/2009, ECGI Working
Paper Series in Finance.
[15] Hancock, D. and J.A. Wilcox, 1993, “Was There a ‘Capital Crunch’in Banking?
The Effects on Real Estate Lending of Business Conditions and Capital
Shortfalls”, Journal of Housing Economics, vol 3, 1, December, pp. 75—105.
[16] Himino, R., 2005, “BIS Kisei to Nippon (The Basel Regulations and Japan),”
Kinyuzaiseijijo Kenkyukai (in Japanese).
[17] Hoshi, T. and A.K. Kashyap, 2009, “Will the U.S. Bank Recapitalization
Succeed? - Eight Lessons from Japan”, NBER Working Paper No. 14401,
Journal of Financial Economics, forthcoming
[18] Hoshi, T. and A.K. Kashyap, 2001, Corporate Finance and Governance in
Japan: The Road to the Future, Massachusetts Institute of Technology Press
[19] Hoshi, T. and A.K. Kashyap, 1999, “The Japanese Banking Crisis: Where Did
It Come From and How Will It End?, NBER Macroeconomics Annual
[20] Hoshi, T., A.K. Kashyap and D. Scharfstein, 1991, “Corporate Structure,
Liquidity and Investment: Evidence from Japanese Industrial Groups,”
Quarterly Journal of Economics, vol. 106, p.p. 33-60
[21] Imai, M., 2006, “Market Discipline and Deposit Insurance Reform in Japan,”
Journal of Banking and Finance, 30(12) December
43

[22] Kang, J.K. and R.M. Stulz, 2000, “Do Banking Shocks Affect Borrowing Firm
Performance? An Analysis of the Japanese Experience,” Journal of Business,
vol. 73, no. 1, January, 1-23.
[23] Kroszner, R.S. and P. Strahan, 1996, “Regulatory Incentives and the Thrift
Crisis: Dividends, Mutual-to-Stock Conversions, and the Financial Distress”,
Journal of Finance 51(4), 1285-1319
[24] Montgomery, H. and S. Shimizutani, 2009, “The Effectiveness of Bank
Recapitalization Policies in Japan,” Japan and the World Economy, vol. 21,
1, pp 1-25.
[25] Peek, J. and E.S. Rosengren, 2005, “Unnatural Selection: Perverse Incentives
and the Misallocation of Credit in Japan”, The American Economic Review,
95(4), September, pp 1144-66.
[26] Peek, J., E.S. Rosengren and G. Tootell, 2003, “Identifying the Macroeconomic
Effect of Loan Supply Shocks”, Journal of Money, Credit, and Banking, 35(6),
December, Part 1, 931-946.
[27] Peek, J. and E.S. Rosengren, 2001, “Determinants of the Japan Premium:
Actions Speak Louder Than Words,”Journal of International Economics, vol.
53(2), pages 283-305, April
[28] Peek, J. and E.S. Rosengren, 2000, “Collateral Damage: Effects of the Japanese
Bank Crisis on Real Activity in the United States,”American Economic Review,
vol. 90(1), pages 30-45, March.
[29] Philippon, T. and P. Schnabl, 2009, “Effi cient Recapitalization,” NYU Stern
School of Business Working Paper, June
[30] Reinhart, C.M. and K.S. Rogoff, 2008, “This Time is Different: A Panoramic
View of Eight Centuries of Financial Crises”, NBER Working Paper 13882.
44

[31] Skinner, D. J., 2008, “The rise of deferred tax assets in Japan: The case of
the major Japanese banks,” forthcoming in the Journal of Accounting and
Economics.
[32] Takaoka, S. and C.R. McKenzie, 2006, “The Impact of Bank Entry in the
Japanese Corporate Bond Underwriting Market,” Journal of Banking and
Finance, vol. 30, pp. 59-83.
[33] Uchida, H. and R. Nakagawa, 2007, “Herd Behavior in the Japanese Loan
Market: Evidence from Bank Panel Data,”Journal of Financial Intermediation,
vol. 16, 4, pp. 555-583.
[34] Udell, G.F., 2008, “Wall Street, Main Street and a Credit Crunch: Some
Thoughts on the Current Financial Crisis,”Business Horizons, forthcoming
[35] Watanabe, W, 2008, “Prudential Regulation and the “Credit Crunch”: Evidence
from Japan,”Journal of Money, Credit and Banking, vol. 39, no. 2-3 (March-
April), pp. 639-665.
[36] White, L., 1991, “The S & L Debacle: Public Policy Lessons for Bank and Thrift
Regulation,”Oxford University Press.
[37] Wooldridge, J.M., 2002, Econometric Analysis of Cross Section and Panel Data,
Cambridge, MA, Massachusetts Institute of Technology Press
[38] Yorulmazer, T., 2009, “Lessons from the Resolution of the Swedish Financial
Crisis,”Mimeo, Federal Reserve Bank of New York
45

46
Table 1: Summary of Japanese Bank Capital Requirements
Until March 1997 From March 1998
International · Banks are subject to the minimum
standard of 8% with respect to the risk
weighted Basel capital adequacy.
· Unrealized gains on securities are included
in Tier 2.
· Net deferred tax assets are not included in
regulatory capital.
· Banks are subject to the minimum standard of
8% with respect to the risk weighted Basel capital
adequacy.
· Unrealized gains on securities are included in
Tier 2.
· Land revaluation is included in Tier 2.
· Net deferred tax assets are included in Tier 1.
Domestic · Banks are subject to the minimum
standard of 4% with respect to the simple
leverage ratio (not risk adjusted).
· Unrealized gains on securities are not
included in regulatory capital.
· Net deferred tax assets are not included in
regulatory capital.
· Banks are subject to the minimum standard of
4% with respect to risk-weighted Basel I.
·Unrealized gains on securities are not included in
Tier 2.
· Land revaluation is included in Tier 2.
· Net deferred tax assets are included in Tier 1.
Table 2: Direct Public Capital infusions in Japan1 (Data is in 100 million yen)
Year of Injection Preferred
stocks
Subordinated
debts Total
1998 3, 210 14, 946 18, 156
1999 61,593 13,000 74,593
2000 5,550 200 5,750
2001 3,830 40 3,870
2002 1,840 0 1,840
2004 19,600 60 19,660
2007 405 0 405
1 The details of public injections, including the identity of the recipients and the amount given to each
recipient are outlined in Appendix A.

47
TABLE 3: Summary of the dependent and explanatory variables We provide a summary of the
dependent and explanatory variables that are included in our regressions summarized in the three equations
outlined below. Note that the explanatory variables have been grouped into vectors according to their role
in affecting bank-lending behavior.
(1) ((L i, j, t -L i, j, t-1)/A i, t-1) = a0 + a1BANKi, t-1 + a2 DEMANDt-1 + a3YEARt + a4LOANLAGi, t-1+ a4
CAPREQ i, t-1 + u i, t
(2) ,Pr( 1| )i tSwitcher X= = a0 + a1BANKi, t-1 + a2 DEMAND t-1 + a3YEAR t + a4 CAPREQ i, t-1 + a5
INSTRUMENT i, t-1 + u i, t
(3) ((L i, j, t -L i, j, t-1)/A i, t-1) = a0 + a1BANKi, t-1 + a2 DEMAND t-1 + a3YEAR t + a4 CAPREQ i, t-1 + a5
SWITCHER i, t-1 + u i, t.
This table extends to the next page.
DEPENDENT VARIABLES
VARIABLE NAME DESCRIPTION
TOTLOAN Net change in outstanding total loans as a share of beginning of the period assets.
CILOAN Net change in outstanding commercial and industrial loans as a share of beginning
of the period assets.
NONRESLOAN Net change in non-residential real estate loans as a share of beginning of the
period assets.
RESLOAN Net change in residential real estate loans as a share of beginning of the period
assets.
EXPLANATORY VARIABLES
VECTOR VARIABLES INCLUDED IN
THE VECTOR
DESCRIPTION
BANK ASSET Log of beginning of the period assets
CITY A binary variable that takes the value “1” for
city banks, and “0” otherwise
TRUST A binary variable that takes the value “1” for
trust banks, and “0” otherwise
LONG-TERM A binary variable that takes the value “1” for
long-term credit banks, and “0” otherwise
REGIONAL A binary variable that takes the value “1” for
regional banks, and “0” otherwise
DOMESTIC A binary variable that takes the value “1” for
banks with a domestic charter, “0” otherwise
LOANLOSS Loans to failed enterprises as a share of
beginning of the period assets
DEMAND GDP Percentage changes in the annual Gross
Domestic Product. For city, trust and long-
term banks, we look at national GDP, for
regional banks we look at the prefecture
level GDP where the bank is headquartered.
BUSINDEX Index of Business Conditions,
LENDATTITUDE Diffusion Index of lending attitudes of banks
as perceived by their clients.
CONSINDEX Consumer Confidence Index
YEAR ANNUAL TIME DUMMIES Binary variables for each of the years in the
sample
LOANLAG TOTLOAN(-1) Change in total outstanding loans as a share
of beginning of the period assets, lagged one
period.
CILOAN(-1) Change in outstanding commercial and
industrial loans as a share of beginning of
the period assets, lagged one period.

48
NONRESLOAN(-1) Change in outstanding non-residential real
estate loans as a share of beginning of the
period assets, lagged one period
RESLOAN(-1) Change in outstanding residential real estate
loans as a share of beginning of the period
assets, lagged one period.
CAPREQ BISDIF Difference between the reported Basel
capital ratio and the target Basel capital ratio
BLANKETPUBINJ Public injections in 1998 as a share of
beginning of the period assets
RISKBASEDPUBINJ Public injections in 1999 and thereafter as a
share of beginning of the period assets
EQREVAL Unrealized gains on equity as a share of
beginning of the period assets
LANDREVAL Unrealized gains on land holdings as a share
of beginning of the period assets
SWITCHER SWITCHER Binary variable that takes a value “1” in the
years during and after a bank’s switching its
charter, and “0” in the years before a bank
switches its charter, or throughout the period
if the bank does not change its charter at all
during the sample period
INSTRUMENTS UNUSEDTIER2 Unused tier 2 capital calculated as the
difference between the capital that qualifies
as tier 2 and the amount of capital actually
included as tier 2 in calculating the capital
adequacy ratio. The variable is expressed as
a share of beginning of the period assets.
UNUSEDTIER2*EQREVAL Cross product of UNSEDTIER2 and
EQUITY REVALUATION
UNUSEDTIER2*LANDREVAL Cross product of UNSEDTIER2 and LAND
REVALUATION

49
Table 4: Descriptive Statistics - The sample of comprises of 4 city banks, 3 trust banks and 2 long-term banks, 62 regional banks
and 45 regional banks that belong to the second tier. Mean, Median, Standard deviation, Maximum and Minimum are calculated
over the sample period 1993 to 2007. The data on public injections begin in 1998 when the first round of public injections took
place. The public injections were targeted at the major banks (city, trust and long-term) and only a few regional banks were the
beneficiaries. The data on land revaluation is available from 1999 when most banks that availed of the Law Concerning the
Revaluation of Land updated their balance sheets to reflect land revaluation. From a balance sheet perspective, public injections
and land revaluations are taken as zero for the preceding years. Equity revaluations, on the other hand, have been allowed in
Japan to be calculated as a part of bank capital since the adoption of the Basel Accord in 1988. However, while both international
and domestic banks are allowed to count land revaluations as a part of tier II capital, only international banks have the option of
including equity revaluation in their calculation of tier II capital. Hence for the domestic banks and the banks that switched
charter to domestic any time during our sample period, equity revaluation is counted as zero.
Mean Median Standard
Deviation
Max Min Number of
Observations
PANEL A: The descriptive statistics of explanatory variables used in our regressions
ASSET
(in log)
14.57 14.53 1.21 19.06 12.3 1740
GDP
(percentage change from previous
year
1.35% 1.37% 1.99% 8.46% -5.03% 1740
CONSINDEX 92.7 91.1 5.76 102 81.3 1740
BUSINDEX 0.87 1 0.81 1.8 -1.1 1740
LENDATTITUDE 4.78 3.75 10.02 19.25 -18.75 1740
LOANLOSS
(as a share of beginning of the period
asset)
0.6% 0.45% 0.68% 12.4% 0% 1632
BISDIF
(in percentage)
3.26% 3.26% 2.66% 17.13% -7.23% 1657
BLANKETPUBINJ
(as a share of beginning of the period
asset
0.003% 0.000% 0.038% 1% 0.000% 1740
RISKBASEDPUBINJ
(as a share of beginning of the period
asset
0.025% 0.000% 0.24% 4.78% 0.000% 1740
EQREVAL
(as a share of beginning of the period
asset)
0.29% 0.00% 0.53% 2.49% 0.00% 1740
LANDREVAL
(as a share of beginning of the period
asset)
0.18% 0.00% 0.17% 0.95% 0.00% 1740
DOMESTIC
(binary variable)
0.69 1 0.47 1 0 1740
SWITCHER
(binary variable)
0.33 0 0.47 1 0 1740
UNUSEDTIER2
(as a share of beginning of the period
asset)
0.27% 0.00% 2.77% 6.25% 0.00% 1738
UNSEDTIER2*EQREVAL 0.046% 0.00% 0.69% 1.58% 0.00% 1738
UNUSEDTIER2*LANDREVAL 0.014% 0.00% 2.46% 0.00% 0.08% 1738
PANEL B: Distribution of Loans (as a percentage of total loans)
CILOAN 13.38% 13.06% 5.35% 31.66% 1.28% 1740
NONRESLOAN 10.08% 9.09% 5.05% 56.79% 2.03% 1740
RESLOAN 16.2% 15.22% 8.48% 69.97% 3.06% 1718
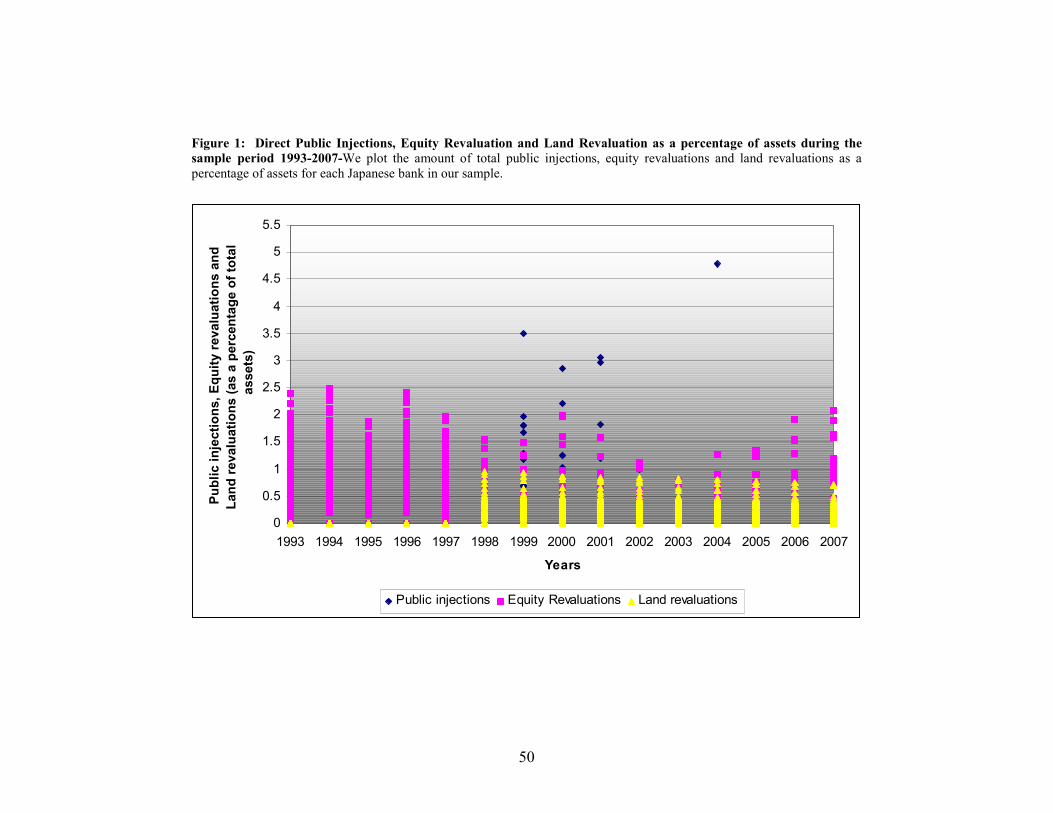
50
Figure 1: Direct Public Injections, Equity Revaluation and Land Revaluation as a percentage of assets during the
sample period 1993-2007-We plot the amount of total public injections, equity revaluations and land revaluations as a
percentage of assets for each Japanese bank in our sample.
0
0.5
1
1.5
2
2.5
3
3.5
4
4.5
5
5.5
1993 1994 1995 1996 1997 1998 1999 2000 2001 2002 2003 2004 2005 2006 2007
Years
Public injections, Equity revaluations and
Land revaluations (as a percentage of total
assets)
Public injections Equity Revaluations Land revaluations
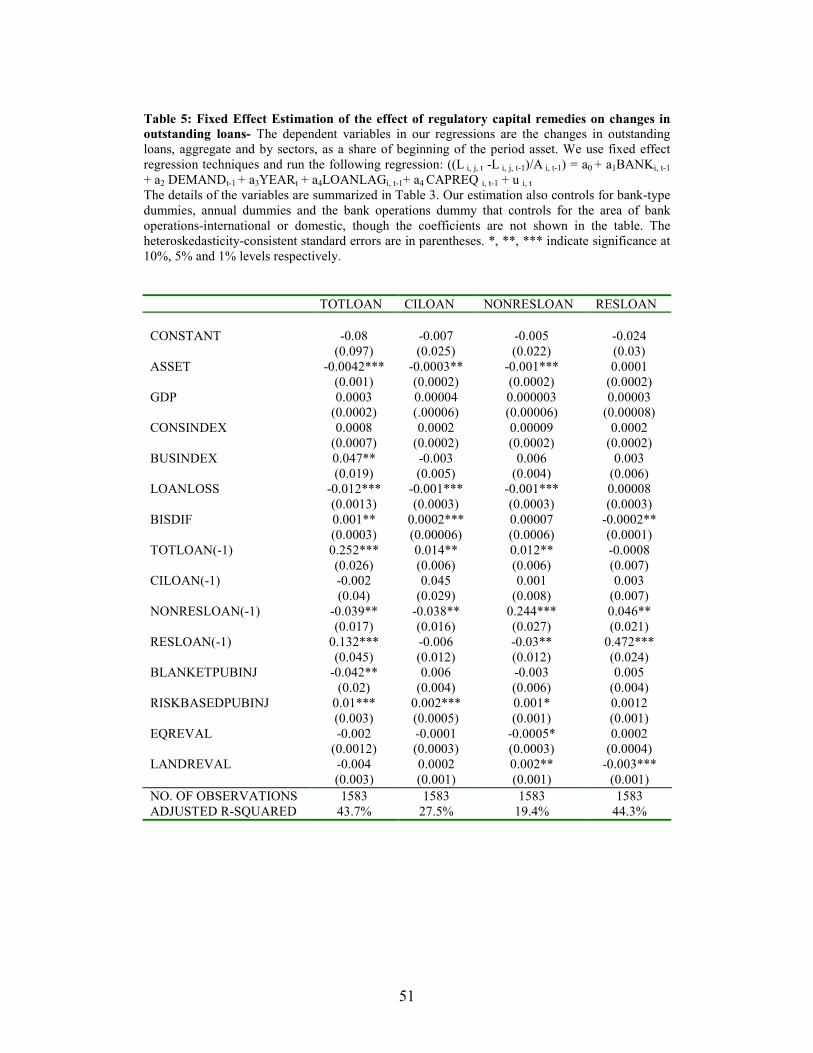
51
Table 5: Fixed Effect Estimation of the effect of regulatory capital remedies on changes in
outstanding loans- The dependent variables in our regressions are the changes in outstanding
loans, aggregate and by sectors, as a share of beginning of the period asset. We use fixed effect
regression techniques and run the following regression: ((L i, j, t -L i, j, t-1)/A i, t-1) = a0 + a1BANKi, t-1
+ a2 DEMANDt-1 + a3YEARt + a4LOANLAGi, t-1+ a4 CAPREQ i, t-1 + u i, t
The details of the variables are summarized in Table 3. Our estimation also controls for bank-type
dummies, annual dummies and the bank operations dummy that controls for the area of bank
operations-international or domestic, though the coefficients are not shown in the table. The
heteroskedasticity-consistent standard errors are in parentheses. *, **, *** indicate significance at
10%, 5% and 1% levels respectively.
TOTLOAN CILOAN NONRESLOAN RESLOAN
CONSTANT -0.08 -0.007 -0.005 -0.024
(0.097) (0.025) (0.022) (0.03)
ASSET -0.0042*** -0.0003** -0.001*** 0.0001
(0.001) (0.0002) (0.0002) (0.0002)
GDP 0.0003 0.00004 0.000003 0.00003
(0.0002) (.00006) (0.00006) (0.00008)
CONSINDEX 0.0008 0.0002 0.00009 0.0002
(0.0007) (0.0002) (0.0002) (0.0002)
BUSINDEX 0.047** -0.003 0.006 0.003
(0.019) (0.005) (0.004) (0.006)
LOANLOSS -0.012*** -0.001*** -0.001*** 0.00008
(0.0013) (0.0003) (0.0003) (0.0003)
BISDIF 0.001** 0.0002*** 0.00007 -0.0002**
(0.0003) (0.00006) (0.0006) (0.0001)
TOTLOAN(-1) 0.252*** 0.014** 0.012** -0.0008
(0.026) (0.006) (0.006) (0.007)
CILOAN(-1) -0.002 0.045 0.001 0.003
(0.04) (0.029) (0.008) (0.007)
NONRESLOAN(-1) -0.039** -0.038** 0.244*** 0.046**
(0.017) (0.016) (0.027) (0.021)
RESLOAN(-1) 0.132*** -0.006 -0.03** 0.472***
(0.045) (0.012) (0.012) (0.024)
BLANKETPUBINJ -0.042** 0.006 -0.003 0.005
(0.02) (0.004) (0.006) (0.004)
RISKBASEDPUBINJ 0.01*** 0.002*** 0.001* 0.0012
(0.003) (0.0005) (0.001) (0.001)
EQREVAL -0.002 -0.0001 -0.0005* 0.0002
(0.0012) (0.0003) (0.0003) (0.0004)
LANDREVAL -0.004 0.0002 0.002** -0.003***
(0.003) (0.001) (0.001) (0.001)
NO. OF OBSERVATIONS 1583 1583 1583 1583
ADJUSTED R-SQUARED 43.7% 27.5% 19.4% 44.3%

52
Table 6: Cross-section averages of the difference between the reported BIS ratio and the minimum required BIS ratio (BISDIF) as mandated
by the Basel Accord and the Financial Services Agency (Ministry of Finance) over time: The greater BISDIF, the lower the bank’s capital
constraint, i.e., the less constrained a bank is with respect to its regulatory capital asset.
INTERNATIONAL BANKS DOMESTIC BANKS
Mean Median Standard
Deviation
Maximum Minimum Number
of banks
Mean Median Standard
Deviation
Maximum Minimum Number
of banks
1993 0.61 0.54 0.57 2.72 -0.72 732 0.57 0.08 1.58 5.22 -0.44 43
1994 0.68 1.14 0.54 3.41 0.46 73 0.71 0.32 1.06 4.65 -0.54 43
1995 0.61 1.53 2.09 4.56 -3.92 73 0.62 0.28 1.05 4.86 -0.717 43
1996 0.54 1.12 1.94 4.29 -3.86 71 0.75 0.34 1.21 4.84 -0.75 45
1997 0.78 1.34 2.06 3.95 -3.78 69 0.89 0.39 1.34 5.08 -0.81 47
1998 1.72 1.45 1.91 6.7 -3.29 353 1.86 0.71 2.29 7.84 -1.15 81
1999 2.65 2.11 1.78 6.65 0.88 26 3.85 4.03 1.92 7.87 -0.53 90
2000 3.31 3.05 1.4 6.85 1.24 194 3.45 3.71 2.72 8.19 -7.23 97
2001 3.97 3.76 1.31 7.39 1.71 19 4.61 4.72 2.1 8.4 -5.45 97
2002 3.68 3.37 1.47 8.41 2.15 16 5.09 4.82 1.82 12.99 -0.03 100
2003 2.9 2.56 0.82 4.57 2.02 15 4.92 4.80 1.86 13.05 -1.22 101
2004 2.81 2.5 0.79 4.47 1.85 14 4.86 4.99 2.15 16.11 -1.45 102
2005 3.81 3.59 1.07 6.26 2.22 14 5.17 5.17 2.13 17.13 -0.50 102
2006 3.85 3.97 0.86 5.54 2.54 14 5.47 5.41 1.88 14.7 0.49 102
2007 3.89 3.59 0.94 5.65 2.77 14 5.9 5.76 1.95 15.98 -1.7 102
2 Minato bank switched in 1993 so for purposes of our sample, is considered a domestic bank for the entire sample period.
3 Ashikaga bank also changed status to domestic in 1998 but it is not included in our sample as it failed during our sample period.
4 Yasuda trust changed status in 2000 but is not included in our sample as residential real estate loan data is missing.

53
Table 7: Unused Tier II capital as a share of asset- According to the Basel capital regulations, Tier 2 capital cannot exceed 50% of Tier 1 capital. The
UNUSEDTIER2 variable is defined as the amount of Tier 2 capital designated as meeting the bank’s Basel capital requirement minus the total amount of a bank’s
Tier 2 capital, i.e., all securities eligible for classification as Tier 2 capital minus Tier 2 capital actually used. The UNUSEDTIER2 variable is normalized using the
beginning of the period assets for each bank. The minimum value that this ratio can take is zero. A value of zero indicates that a bank has used all of its available
capital that qualifies as Tier 2 in satisfying its capital requirements. A positive value for UNUSEDTIER2 implies that the bank had excess Tier 2 capital that did not
qualify for compliance with the Basel Capital Accord. The higher the value, the more constrained the bank is with regard to having sufficient Tier 1 capital to absorb
all available Tier 2 capital.
Unused tier 2 capital as a share of assets – international and domestic banks
INTERNATIONAL BANKS DOMESTIC BANKS
Mean Median Standard
Deviation
Maximum Minimum Number
of banks
Mean Median Standard
Deviation
Maximum Minimum Number
of banks
1993 0.00 0 0.0059 0.0045 0 735 0 0 0 0 0 43
1994 0.0024 0 0.0147 0.1118 0 73 0 0 0 0 0 43
1995 0.0012 0 0.0072 0.0574 0 73 0 0 0 0 0 43
1996 0.00 0 0.0004 0.0003 0 71 0 0 0 0 0 45
1997 0.004 0 0.0184 0.1335 0 69 0 0 0 0 0 47
1998 0.0095 0 0.0037 0.0191 0 356 0.0045 0 .0374 0.334 0 81
1999 0.002 0 0.0055 0.0227 0 26 0.0004 0 .0037 0.035 0 90
2000 0.0004 0 0.0011 0.0038 0 197 0.0133 0 .0858 0.625 0 97
2001 0.0004 0 0.0009 0.0029 0 19 0.0094 0 .0594 0.438 0 97
2002 0.0005 0 0.0011 0.0036 0 16 0.0026 0 .0139 0.131 0 100
2003 0.0014 0 0.0036 0.0146 0 15 0.0024 0 .0075 0.065 0 101
2004 0.0025 0 0.0037 0.0095 0 14 0.0054 0 .0278 0.233 0 102
2005 0.0017 0 0.0027 0.0074 0 14 0.0012 0 .0021 0.010 0 102
2006 0.001 0 0.0019 0.0063 0 14 0.0009 0 .0018 0.008 0 102
2007 0.0099 0 0.0025 0.0093 0 14 0.0008 0 .0025 0.020 0 102
5 Minato bank switched in 1993 so for purposes of our sample, is considered a domestic bank for the entire sample period.
6 Ashikaga bank also changed status to domestic in 1998 but it is not included in our sample as it failed during our sample period.
7 Yasuda trust changed status in 2000 but is not included in our sample as residential real estate loan data is missing.

54
Table 8: Correlation Matrix-We trace the correlations amongst the variables. ***, **, * indicate significance at 1%, 5% and 10% levels respectively.
Note that to conserve space we are not plotting the correlations with respect to our indices- CONSINDEX, BUSINDEX and LENDATTITUDE. Readers
interested in the complete correlation matrix (inclusive of the indices) can get it from the corresponding author.
(1) (2) (3) (4) (5) (6) (7) (8) (9) (10) (11) (12) (13) (14) (15) (16)
(1) ASSET 1
(2) BISDIF .042* 1
(3) C&I LOAN -.224*** .027 `1
(4) DOMESTIC -.503*** .427*** .05** 1
(5) EQREVAL .372*** -.3*** .044* -.747*** 1
(6) GDP -.032 .017 .021 -.019 .05** 1
(7) LANDREVAL -.126*** .317*** -.011 .253*** -.282*** -.103*** 1
(8) LOANLOSS .098*** -.179*** -.207*** .119*** -.183*** -.12*** .079*** 1
(9) NONRESLOAN -.044* .02 -.068*** .0013 .0085 .013 -.006 -.09*** 1
(10) PUBINJ -.075*** -.029 .0001 .0502** -.042* .014 .018 .058** -.013 1
(11) RESLOAN -.097*** .015 .088*** .075*** -.062** -.011 -.044* -.069** .166*** -.025 1
(12) SWITCHER .194*** .538*** .005 .422*** -.283*** -.018 .171*** -.043* -.035 -.058** .084*** 1
(13) TOTLOAN -.105*** -.017 .246*** -.047* .073*** .045* -.121*** -.268*** .263*** -.04 .6*** -.0501** 1
(14) UNUSEDTIER2 .13*** -.12*** -.05 -.032 -.02 -.021 -.043* .403*** -.109 -.007 -.034 .095*** -.22 1
(15) UNUSEDTIER2
*EQREVAL
.132*** -.077*** .004 -.082*** .115*** -.032 -.049* .051** -.027 -.005 -.033 -.023* -.09 .402*** 1
(16) UNUSEDTIER2
*LANDREVAL
.079*** .001 -.205** .059** -.087*** -.02 .256*** .094*** -.034 -.013 -.001 .116*** -.091 .127*** -.01 1

55
Table 9: 1st stage probit estimation of the probability of switching- The dependent variable takes a
value 1 for the bank-year observations when a bank changes its charter from international to domestic and
is 0 otherwise. We run the following regression:
,Pr( 1| )i tSwitcher X= = a0 + a1BANKi, t-1 + a2 DEMANDt-1 + a3YEARt + a4 LOANLAGi, t-1
+ a5 CAPREQ i, t-1 + a6 INSTRUMENT i, t-1 + u i, t The details of the variables are summarized in Table 3. Our estimation also controls for bank-type
dummies, annual dummies and the bank operations dummy that controls for the area of bank operations-
international or domestic, though the coefficients are not shown in the table. The heteroskedasticity-
consistent standard errors are in parentheses. *, **, *** indicate significance at 10%, 5% and 1% levels
respectively.
,Pr( 1| )i tSwitcher X=
CONSTANT -50.135***
(4.885)
ASSET 1.951***
(0.233)
GDP 0.061
(0.04)
CONSINDEX 0.195***
(0.0314)
BUSINDEX -2.266***
(0.408)
LOANLOSS -0.318**
(0.133)
BISDIF 0.117***
(0.032)
TOTLOAN(-1) -1.202
(1.413)
CILOAN(-1) -1.246
(2.283)
NONRESLOAN(-1) -0.927
(1.129)
RESLOAN(-1) 10.89***
(4.215)
BLANKETPUBINJ -1.73*
(0.916)
RISKBASEDPUBINJ -0.071
(0.172)
EQREVAL 0.45
(0.315)
LANDREVAL 2.23***
(0.848)
UNSEDTIER2 0.658***
(0.21)
UNUSEDTIER2*EQREVAL -0.728***
(0.271)
UNUSEDTIER2*LANDREVAL 3.08**
(1.215)
NO. OF OBSERVATIONS 1583
MCFADDEN R-SQUARED 73.9%
LR STATISTIC 1532.65
PROB (LR STATISTIC) 0.00

56
Table 10: 2SLS Regression of the effect of regulatory capital remedies on changes in
outstanding loans with endogenous charter switching decision- We endogenize the decision by
many Japanese banks to switch charter from international to domestic and evaluate the impact of
regulatory policy changes after controlling for the decision to switch. The dependent variable is the
change in outstanding loans- aggregate and sector-wise- as a share of beginning of the period assets.
We run the following regression:
((L i, j, t -L i, j, t-1)/A i, t-1) = a0 + a1BANKi, t-1 + a2 DEMANDt-1 + a3YEARt + a4 LOANLAGi, t-1
+ a5 CAPREQ i, t-1 + a6 SWITCHER i, t-1 + u i, t
The details of the variables are summarized in Table 3. Our instrument is the predicted value of
switching that we estimate from our first stage probit regression and the predicted value of switching
interacted with LANDREVAL following Wooldridge (2002). Our estimation also controls for bank-
type dummies, annual dummies and the bank operations dummy that controls for the area of bank
operations-international or domestic, though the coefficients are not shown in the table. The
heteroskedasticity-consistent standard errors are in parentheses. *, **, *** indicate significance at
10%, 5% and 1% levels respectively.
TOTLOAN CILOAN NONRESLOAN RESLOAN
CONSTANT -0.066 -0.0083 -0.008 -0.021
(-0.098) (0.0247) (0.022) (0.030)
ASSET -0.005*** -0.0003 -0.001** -0.0001
(-0.001) (0.0002) (0.0002) (0.0003)
GDP 0.00022 0.00004 0.00001 0.00002
(0.00024) (0.0001) (0.0001) (0.0001)
CONSINDEX 0.001 0.0002 0.0001 0.0002
(-0.001) (0.0002) (0.0002) (0.0002)
BUSINDEX 0.046** -0.0032 0.006 0.003
(-0.019) (0.0047) (0.004) (0.006)
LOANLOSS -0.012*** -0.0009*** -0.001*** 0.0001
(-0.001) (0.0003) (0.0003) (0.0003)
BISDIF 0.001** 0.0002*** 0.0001 -0.0002**
(0.000) (0.0001) (0.0001) (0.0001)
TOTLOAN(-1) 0.251*** 0.0145** 0.013** -0.001
(-0.026) (0.0060) (0.006) (0.007)
CILOAN(-1) -0.001 0.0452 0.001 0.003
(-0.040) (0.0285) (0.008) (0.008)
NONRESLOAN(-1) -0.039** -0.0382** 0.240*** 0.048**
(-0.017) (0.0161) (0.027) (0.021)
RESLOAN(-1) 0.131*** -0.0057 -0.030** 0.473***
(-0.045) (0.0119) (0.013) (0.024)
BLANKETPUBINJ -0.041** 0.0060 -0.003 0.005
(-0.020) (0.0040) (0.006) (0.004)
RISKBASEDPUBINJ 0.011*** 0.0021*** 0.001* 0.001*
(-0.003) (0.0005) (0.001) (0.001)
EQREVAL -0.002 -0.0001 -0.0005* 0.0002
(-0.001) (0.0003) (0.0003) (0.0004)
LANDREVAL -0.004 0.0002 0.002*** -0.003***
(-0.003) (0.0007) (0.001) (0.001)
SWITCHER 0.003 -0.0002 -0.001 0.001
(-0.002) (0.0006) (0.001) (0.001)
NO. OF OBSERVATIONS 1583 1583 1583 1583
ADJUSTED R-SQUARED 43.5% 27.5% 19.4% 44.1%
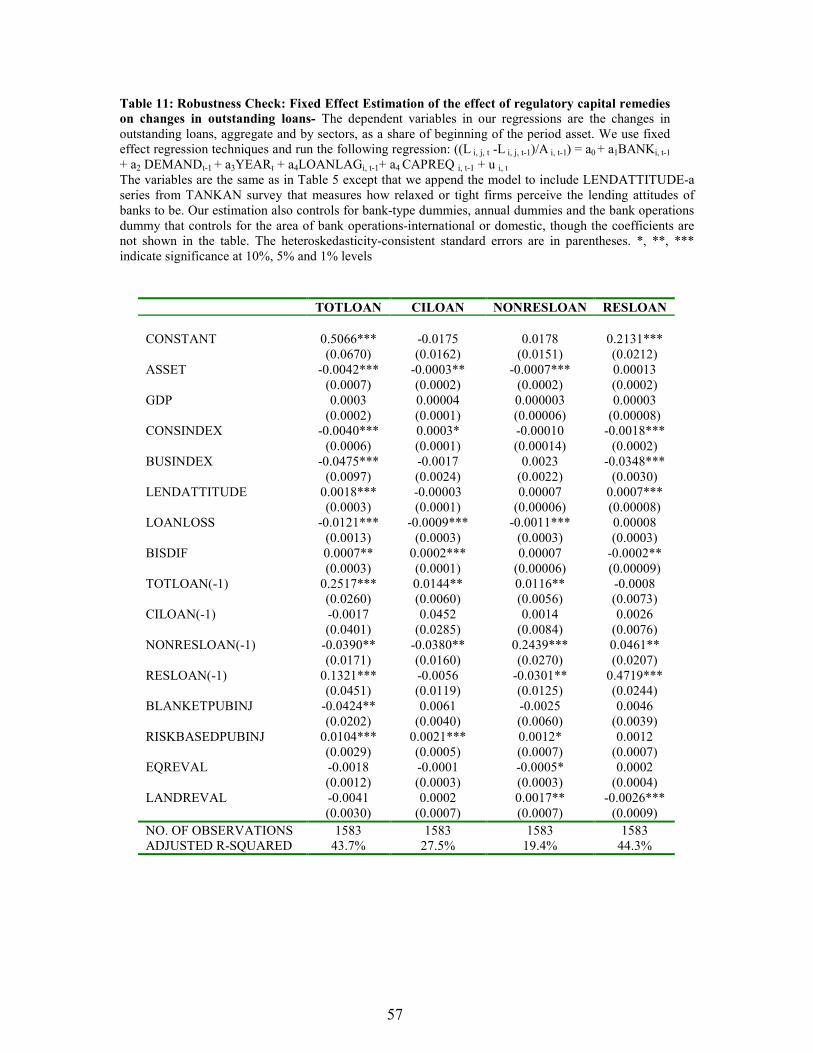
57
Table 11: Robustness Check: Fixed Effect Estimation of the effect of regulatory capital remedies
on changes in outstanding loans- The dependent variables in our regressions are the changes in
outstanding loans, aggregate and by sectors, as a share of beginning of the period asset. We use fixed
effect regression techniques and run the following regression: ((L i, j, t -L i, j, t-1)/A i, t-1) = a0 + a1BANKi, t-1
+ a2 DEMANDt-1 + a3YEARt + a4LOANLAGi, t-1+ a4 CAPREQ i, t-1 + u i, t
The variables are the same as in Table 5 except that we append the model to include LENDATTITUDE-a
series from TANKAN survey that measures how relaxed or tight firms perceive the lending attitudes of
banks to be. Our estimation also controls for bank-type dummies, annual dummies and the bank operations
dummy that controls for the area of bank operations-international or domestic, though the coefficients are
not shown in the table. The heteroskedasticity-consistent standard errors are in parentheses. *, **, ***
indicate significance at 10%, 5% and 1% levels
TOTLOAN CILOAN NONRESLOAN RESLOAN
CONSTANT 0.5066*** -0.0175 0.0178 0.2131***
(0.0670) (0.0162) (0.0151) (0.0212)
ASSET -0.0042*** -0.0003** -0.0007*** 0.00013
(0.0007) (0.0002) (0.0002) (0.0002)
GDP 0.0003 0.00004 0.000003 0.00003
(0.0002) (0.0001) (0.00006) (0.00008)
CONSINDEX -0.0040*** 0.0003* -0.00010 -0.0018***
(0.0006) (0.0001) (0.00014) (0.0002)
BUSINDEX -0.0475*** -0.0017 0.0023 -0.0348***
(0.0097) (0.0024) (0.0022) (0.0030)
LENDATTITUDE 0.0018*** -0.00003 0.00007 0.0007***
(0.0003) (0.0001) (0.00006) (0.00008)
LOANLOSS -0.0121*** -0.0009*** -0.0011*** 0.00008
(0.0013) (0.0003) (0.0003) (0.0003)
BISDIF 0.0007** 0.0002*** 0.00007 -0.0002**
(0.0003) (0.0001) (0.00006) (0.00009)
TOTLOAN(-1) 0.2517*** 0.0144** 0.0116** -0.0008
(0.0260) (0.0060) (0.0056) (0.0073)
CILOAN(-1) -0.0017 0.0452 0.0014 0.0026
(0.0401) (0.0285) (0.0084) (0.0076)
NONRESLOAN(-1) -0.0390** -0.0380** 0.2439*** 0.0461**
(0.0171) (0.0160) (0.0270) (0.0207)
RESLOAN(-1) 0.1321*** -0.0056 -0.0301** 0.4719***
(0.0451) (0.0119) (0.0125) (0.0244)
BLANKETPUBINJ -0.0424** 0.0061 -0.0025 0.0046
(0.0202) (0.0040) (0.0060) (0.0039)
RISKBASEDPUBINJ 0.0104*** 0.0021*** 0.0012* 0.0012
(0.0029) (0.0005) (0.0007) (0.0007)
EQREVAL -0.0018 -0.0001 -0.0005* 0.0002
(0.0012) (0.0003) (0.0003) (0.0004)
LANDREVAL -0.0041 0.0002 0.0017** -0.0026***
(0.0030) (0.0007) (0.0007) (0.0009)
NO. OF OBSERVATIONS 1583 1583 1583 1583
ADJUSTED R-SQUARED 43.7% 27.5% 19.4% 44.3%

58
Table 12: Robustness Check- 1st stage probit estimation of the probability of switching- The
dependent variable takes a value 1 for the bank-year observations when a bank changes its charter from
international to domestic and is 0 otherwise. We run the following regression:
,Pr( 1| )i tSwitcher X= = a0 + a1BANKi, t-1 + a2 DEMANDt-1 + a3YEARt + a4 LOANLAGi, t-1
+ a5 CAPREQ i, t-1 + a6 INSTRUMENT i, t-1 + u i, t The variables are the same as in Table 9 except that we append the model to include LENDATTITUDE.
The heteroskedasticity-consistent standard errors are in parentheses. *, **, *** indicate significance at
10%, 5% and 1% levels respectively.
,Pr( 1| )i tSwitcher X=
CONSTANT -50.7578***
(4.8294)
ASSET 1.9453***
(0.2348)
GDP 0.0641
(0.0393)
CONSINDEX 0.1945***
(0.0273)
BUSINDEX -1.9618***
(0.4448)
LENDATTITUDE 0.0104
(0.0214)
LOANLOSS -0.3455***
(0.1303)
BISDIF 0.1241***
(0.0313)
TOTLOAN(-1) -1.1748
(1.4286)
CILOAN(-1) -1.3161
(2.3012)
NONRESLOAN(-1) -0.8644
(1.1236)
RESLOAN(-1) 10.9843***
(4.1928)
BLANKETPUBINJ -1.8384**
(0.9129)
RISKBASEDPUBINJ -0.0760
(0.1718)
EQREVAL 0.4536
(0.3153)
LANDREVAL 2.2922***
(0.8406)
UNSEDTIER2 0.7018***
(0.2126)
UNUSEDTIER2*EQREVAL -0.7974***
(0.2854)
UNUSEDTIER2*LANDREVAL 2.9843**
(1.2398)
NO. OF OBSERVATIONS 1583
MCFADDEN R-SQUARED 73.82%
LR STATISTIC 1530.91
PROB (LR STATISTIC) 0.000

59
Table 13: Robustness Check: 2SLS Regression of the effect of regulatory capital remedies
on changes in outstanding loans with endogenous charter switching decision- We
endogenize the decision by many Japanese banks to switch charter from international to
domestic and evaluate the impact of regulatory policy changes after controlling for the decision
to switch. The dependent variable is the change in outstanding loans- aggregate and sector-wise-
as a share of beginning of the period assets. We run the following regression:
((L i, j, t -L i, j, t-1)/A i, t-1) = a0 + a1BANKi, t-1 + a2 DEMANDt-1 + a3YEARt + a4 LOANLAGi, t-1
+ a5 CAPREQ i, t-1 + a6 SWITCHER i, t-1 + u i, t
The variables are the same as in Table 10 except that we append our model to include the
variable LENDATTITUDE. Our instrument is the predicted value of switching that we estimate
from our first stage probit regression and the predicted value of switching interacted with
LANDREVAL following Wooldridge (2002). Our estimation also controls for bank-type
dummies, annual dummies and the bank operations dummy that controls for the area of bank
operations-international or domestic, though the coefficients are not shown in the table. The
heteroskedasticity-consistent standard errors are in parentheses. *, **, *** indicate significance
at 10%, 5% and 1% levels respectively.
TOTLOAN CILOAN NONRESLOAN RESLOAN
CONSTANT 0.5123*** -0.0177 0.0153 0.2154***
(0.0673) (0.0163) (0.0153) (0.0212)
ASSET -0.0052*** -0.0003 -0.0006** -0.0001
(0.0010) (0.0002) (0.0002) (0.0003)
GDP 0.00022 0.00004 0.00001 0.00002
(0.00024) (0.00006) (0.00006) (0.0001)
CONSINDEX -0.0039*** 0.0003* -0.00010 -0.0017***
(0.0006) (0.0001) (0.00014) (0.0002)
BUSINDEX -0.0470*** -0.0017 0.0024 -0.0347***
(0.0097) (0.0024) (0.0022) (0.0031)
LENDATTITUDE 0.0018*** -0.00003 0.00007 0.0007***
(0.0003) (0.00006) (0.00006) (0.0001)
LOANLOSS -0.0118*** -0.0009*** -0.0011*** 0.0001
(0.0013) (0.0003) (0.0003) (0.0003)
BISDIF 0.0006** 0.0002*** 0.00009 -0.0002**
(0.0003) (0.0001) (0.00006) (0.0001)
TOTLOAN(-1) 0.2510*** 0.0145** 0.0127** -0.0011
(0.0260) (0.0060) (0.0056) (0.0074)
CILOAN(-1) -0.0014 0.0452 0.0014 0.0027
(0.0401) (0.0285) (0.0084) (0.0076)
NONRESLOAN(-1) -0.0390** -0.0382** 0.2399*** 0.0478**
(0.0170) (0.0161) (0.0271) (0.0208)
RESLOAN(-1) 0.1303*** -0.0057 -0.0302** 0.4726***
(0.0451) (0.0119) (0.0125) (0.0245)
BLANKETPUBINJ -0.0413** 0.0060 -0.0026 0.0046
(0.0203) (0.0040) (0.0060) (0.0039)
RISKBASEDPUBINJ 0.0106*** 0.0021*** 0.0012* 0.0012*
(0.0029) (0.0005) (0.0007) (0.0007)
EQREVAL -0.0016 -0.0001 -0.0005* 0.0002
(0.0012) (0.0003) (0.0003) (0.0004)
LANDREVAL -0.0045 0.0002 0.0021*** -0.0027***
(0.0031) (0.0007) (0.0008) (0.0009)
SWITCHER 0.0028 -0.0002 -0.0007 0.0010
(0.0020) (0.0006) (0.0005) (0.0007)
NO. OF OBSERVATIONS 1583 1583 1583 1583
ADJUSTED R-SQUARED 43.5% 27.5% 19.4% 44.1%

60
Appendix A: Details of Public Injection: Direct Public Capital infusions in Japan
(Data is in 100 million yen)-
Bank type Bank name Preferred
stocks
Subordinated
debts Total
Panel A: Capital infusions during 1998
City Banks Dai-ichi Kangyo 990 0 990
Sakura 0 1,000 1,000
Fuji 0 1,000 1,000
Mitsubishi 0 1,000 1,000
Asahi 0 1,000 1,000
Sanwa 0 1,000 1,000
Sumitomo 0 1,000 1,000
Daiwa 0 1,000 1,000
Tokai 0 1,000 1,000
Trust Banks Mitsui Trust 0 1,000 1,000
Mitsubishi Trust 0 500 500
Yasuda Trust 0 1,500 1,500
Toyo Trust 0 500 500
Chuo Trust 320 280 600
Nippon Trust 0 0 0
Sumitomo Trust 0 1,000 1,000
Long-term Credit Banks Industrial Bank of Japan 0 1,000 1,000
Long-Term Credit Bank of Japan 1,300 466 1,766
Nippon Credit Bank 600 0 600
Regional Banks Ashikaga 0 300 300
Yokohama 0 200 200
Hokuriku 0 200 200
Total 3,210 14,946 18,156
Panel B: Capital infusions during 1999
City Banks Dai-ichi Kangyo 7,000 2,000 9,000
Sakura 8,000 0 8,000
Fuji 8,000 2,000 10,000
Asahi 4,000 1,000 5,000
Sanwa 6,000 1,000 7,000
Sumitomo 5,010 0 5,010
Daiwa 4,080 0 4,080

61
Tokai 6,000 0 6,000
Trust Banks Mitsui Trust 2,503 1,500 4,003
Mitsubishi Trust 2,000 1,000 3,000
Toyo Trust 2,000 0 2,000
Chuo Trust 1,500 0 1,500
Sumitomo Trust 1,000 1,000 2,000
Long-term Credit Banks Industrial Bank of Japan 3,500 2,500 6,000
Regional Yokohama 1,000 1,000 2,000
Total 61,593 13,000 74,593
Panel C: Capital infusions during 2000
Long-Term Credit Bank Long-Term Credit Bank of Japan 2,400 0 2,400
Regional Hokkaido 450 0 450
Ashikaga 1,050 0 1,050
Hokuriku 750 0 750
Ryukyu 400 0 400
Regional 2 Hiroshima Sogo 200 200 400
Kumamoto Family 300 0 300
Total 5,550 200 5,750
Panel D: Capital infusions during 2001
Long-term credit Aozora 2,600 0 2,600
Regional Chiba Kogyo 600 0 600
Regional 2 Higashinippon 200 0 200
Kofuku 80 40 120
Yachiyo 350 0 350
Total 3,830 40 3,870
Panel E: Capital infusions during 2002
Regional Kinki Osaka 600 0 600
Regional 2 Gifu 120 0 120
Wakayama 120 0 120
Fukuoka City 700 0 700
Kyushu 300 0 300
Total 1,840 0 1,840

62
Panel F: Capital infusions during 2004
City Resona 19,600 0 19,600
Regional Kanto Tsukuba 0 60 60
Total 19,600 60 19,660
Panel G: Capital infusions during 2007
Regional Kiyo 315 0 315
Regional 2 Howa 90 0 90
Total 405 0 405

63
Appendix B: Data Appendix: In this appendix, we provide the comprehensive list of banks included in our
sample. In the footnote, we describe the details of the mergers that took place during our sample period. We
also list the banks that failed anytime during our sample period. This table extends to the next two pages.
PANEL A: COMPREHENSIVE LIST OF BANKS INCLUDED IN OUR SAMPLE
CITY BANKS TRUST
BANKS
LONG-TERM
CREDIT
BANKS
REGIONAL
BANKS
REGIONAL2
BANKS
Mizuho8 Mitsubishi UFJ
Trust9
Nippon Credit Hokkaido Hokuyo
Tokyo -
Mitsubishi UFJ10
Sumitomo Trust Shinsei (Long
Term Credit)
Aomori Sapporo
Resona11
Chuo Mitsui
Trust12
Michinoku Yamagata Shiawase
Sumitomo
Mitsui13
Yasuda Trust14
Akita Kirayaka
Shonai Kitanippon
Yamagata Sendai
Iwate Fukushima
Tohoku Daito
77 Towa
Toho Tochigi
Gunma Ibaragi
Joyo Keiyo
Kanto Tsukuba15
Higashinippon
Musashino Tokyo Sowa
Chiba Kogyo Kanagawa
Chiba Daiko
Tokyo Tomin Nagano
Yokohama Toyama Daiichi
Daishi Fukuho
Hokuetsu Shizuoka Chuo
Yamanashi Chuo Gifu
Hachijuni Aichi
Hokuriku Nagoya
Toyama Chukyo
Hokkoku Daisan
Fukui Biwako
8 Mizuho was formed by a merger of Daiichi Kangyo (city bank) with Fuji (city bank) and Industrial Bank
of Japan (Long-term credit bank) in 2003. 9 Mitsubishi UFJ Trust was formed by a merger of Mitsubishi Trust (trust bank), UFJ Trust (trust bank) and
Nippon Trust (trust bank). Mitsubishi Trust acquired Nippon Trust in 2002 and Mitsubishi Trust and UFJ
Trust merged in 2006. 10
Mitsubishi Tokyo UFJ was formed by a merger of Mitsubishi (city bank) with Tokyo (city bank) and
UFJ (city bank). Mitsubishi merged with Tokyo in 1997 and then merged with UFJ in 2006. 11
Resona Financial Group was formed by a merger of Asahi (city bank) with Daiwa (city bank) in 2003.
Resona FG has Resona (city bank) and Saitama Resona (city bank) as its subsidiaries. Resona and Saitama
Resona continue to form the hypothetical Resona after the merger. 12
Chuo Mitsui Trust was formed by a merger of Mitsui Trust (trust bank) and Chuo Trust (trust bank) in
2001. 13
Mitsui Sumitomo was formed by a merger of Sakura (city bank) with Sumitomo (city bank) and
Wakashio (regional 2 bank). Sakura merged with Sumitomo in 2002. Wakashio was acquired in 1999. 14
Yasuda Trust was ultimately dropped from our sample due to lack of residential real estate loan data. 15
Kanto Tsukuba was formed by a merger of Kanto (regional bank) and Tsukuba (regional 2 bank) in 2004.

64
Shizuoka Taisho
Suruga Minato16
Shimizu Shimane
Ogaki Kyoritsu Tomato
Juroku Momiji17
Mie Saikyo
Hyakugo Tokushima
Shiga Kagawa
Kyoto Ehime
Kinki Osaka18
Kochi
Senshu Fukuoka City
Ikeda Saga Kyoei
Nanto Nagasaki
Kiyo19
Kumamoto Family
Tajima Howa
Tottori Miyazaki
Sanin Godo Minami Nippon
Chugoku Okinawa Kaiho
Hiroshima Yachiyo20
Yamaguchi
Awa
Hyakujushi
Iyo
Shikoku
Fukuoka
Chikuho
Saga
Juhachi
Shinwa21
Higo
Oita
Miyazaki
Kagoshima
Okinawa
Ryuku
NishiNippon City22
PANEL B: BANKS THAT FAILED ANYTIME DURING OUR SAMPLE PERIOD HENCE NOT
INCLUDED IN THE FINAL SAMPLE
CITY BANKS TRUST
BANKS
LONG-TERM
CREDIT
BANKS
REGIONAL
BANKS
REGIONAL2
BANKS
Hokkaido
Takushoku23
Tokuyo City 24
16
Minato was formed by the merger of Hanshin (regional 2 bank) and Midori (regional 2 bank) in 2000. 17
Momiji was formed by the merger of Hiroshima Sogo (regional 2 bank) and Setouchi (regional 2 bank)
in 2004. 18
Kinki Osaka was formed by a merger of Osaka (regional bank) and Kinki (regional 2 bank) in 2000. 19
Kiyo was formed by the merger of Kiyo (regional bank) and Wakayama (regional 2 bank) in 2007. 20
Yachiyo was formed by the merger of Yachiyo (regional 2 bank) and Kokumin (regional 2 bank) in 2000. 21
Shinwa was formed by the merger of Shinwa (regional bank) and Kyushu (regional 2 bank) in 2004. 22
Nishinippon City was formed by the merger of Nishinippon (regional bank) and Fukuoka City (regional
2 bank) in 2005. 23
Failed in 1997 24
Failed in 1997
65
Niigata Chuo25
Chubu26
Ishikawa27
Namihaya28
Hanwa29
25
Failed in 2001 26
Failed in 2002 27
Failed in 2002 28
Failed in 1999 29
Failed in 1997

66
Appendix C: Comprehensive List of Banks that Switched Charter during our sample period of 1993 to 2007- For our analysis, a bank that switches charter any time
during a fiscal year (t-1, t) is listed as having changed charter in March of year t. For example, Resona Bank that switched charter to domestic during the fiscal year 1999-2000
is stated as having switched to domestic in March 2000. This table extends to the next page.
Bank Type Bank Name International to
Domestic
Domestic to
International
Bank Type Bank Name Domestic to
International
International to
Domestic
(Year of
Switching)
(Year of
Switching)
City Banks Regional Banks -contd
Resona March 2000 Yamanashi Chuo March 1998
Long-Term Banks Hokuriku March 1998
Shinsei Bank March 2000 Hokkoku March 1999
Nippon Credit Bank March 1998 Fukui March 1998
Trust Banks Suruga March 1999
Chuo Trust March 2000 Shimizu March 1998
Yasuda Trust30
March 2000 March 2003 Ogaki Kyoritsu March 2002
Regional Bank Juroku March 2004
Minato March 1993 Mie March 1998
Hokkaido March 1996 Hyakugo March 1999
Aomori March 1998 Kyoto March 1999
Akita March 1998 Osaka March 1996
Yamagata March 1998 Senshu March 1997
Iwate March 1998 Ikeda March 1997
77 March 1999 Nanto March 1998
Toho March 1998 Kiyo March 1998
Ashikaga31
March 1998 Sanin Godo March 2002
Joyo March 2003 Regional 2 Banks
Musashino March 1998 Hokuyo March 1998
Chiba Kogyo March 1998 KitaNippon March 1998
Tokyo Tomin March 2000 Keiyo March 1998
Yokohama March 1999 Aichi March 1998
Daishi March 2000 Nagoya March 1999
30
Yasuda Trust is the only bank that switched back from domestic to international charter during our sample period (March 2003). However, we exclude Yasuda
Trust from our final sample as data for residential real estate loans, one of our primary dependant variables, is missing for the entire sample period. 31
Ashikaga Bank is dropped from our final sample since data is missing after 2003.
67
Hokuetsu March 1998 Chukyo March 1998
Awa March 1998 Daisan March 1998
Hyakujushi March 1999 Biwako March 1998
Shikoku March 1998 Ehime March 1998
Fukuoka March 2000
Saga March 1998
Juhachi March 2000
Shinwa March 1998
Higo March 1998
Oita March 1998
Hiroshima March 1999
Miyazaki March 1998
Kagoshima March 1998
Ryukyu March 1998
Okinawa March 1998
NishiNippon City March 2002

67
Appendix D: Map of Japan with the Prefecture details