Regulatory reform and risk- taking: replacing ratings ... · Regulatory reform and risk-taking:...
22
Regulatory reform and risk- taking: replacing ratings (work in progress) Bo Becker, Stockholm School of Economics (SSE) & CEPR Marcus Opp, UC Berkeley Farzad Saidi, SSE & CEPR
Transcript of Regulatory reform and risk- taking: replacing ratings ... · Regulatory reform and risk-taking:...

Regulatory reform and risk-taking: replacing ratings
(work in progress)
Bo Becker, Stockholm School of Economics (SSE) & CEPR Marcus Opp, UC Berkeley Farzad Saidi, SSE & CEPR
Regulatory change for financial sector
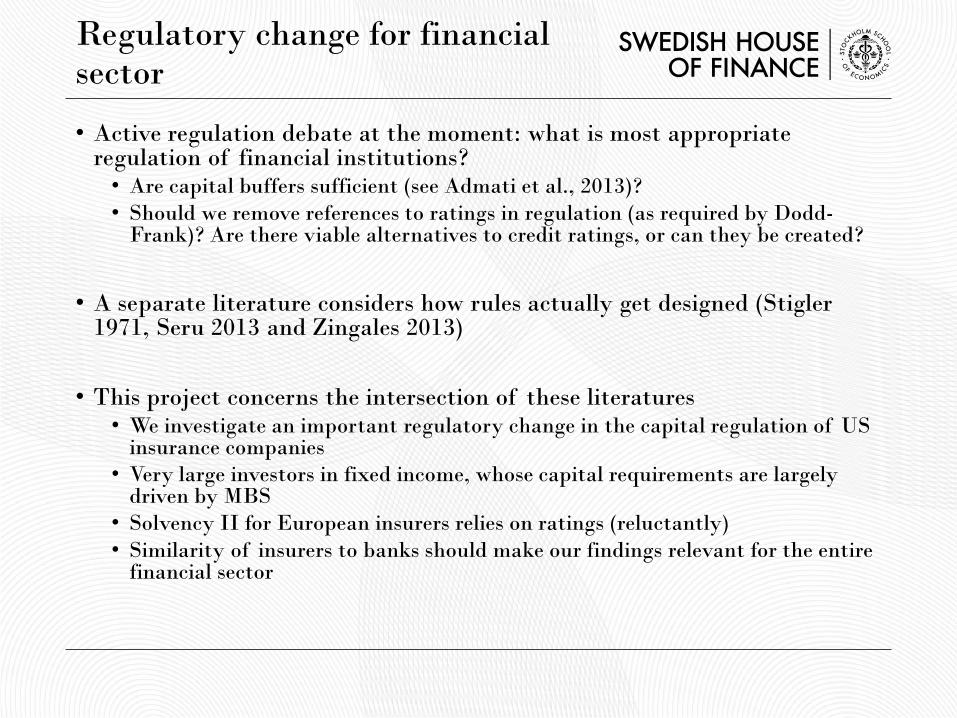
• Active regulation debate at the moment: what is most appropriate regulation of financial institutions? • Are capital buffers sufficient (see Admati et al., 2013)? • Should we remove references to ratings in regulation (as required by Dodd-
Frank)? Are there viable alternatives to credit ratings, or can they be created?
• A separate literature considers how rules actually get designed (Stigler
1971, Seru 2013 and Zingales 2013)
• This project concerns the intersection of these literatures • We investigate an important regulatory change in the capital regulation of US
insurance companies • Very large investors in fixed income, whose capital requirements are largely
driven by MBS • Solvency II for European insurers relies on ratings (reluctantly) • Similarity of insurers to banks should make our findings relevant for the entire
financial sector
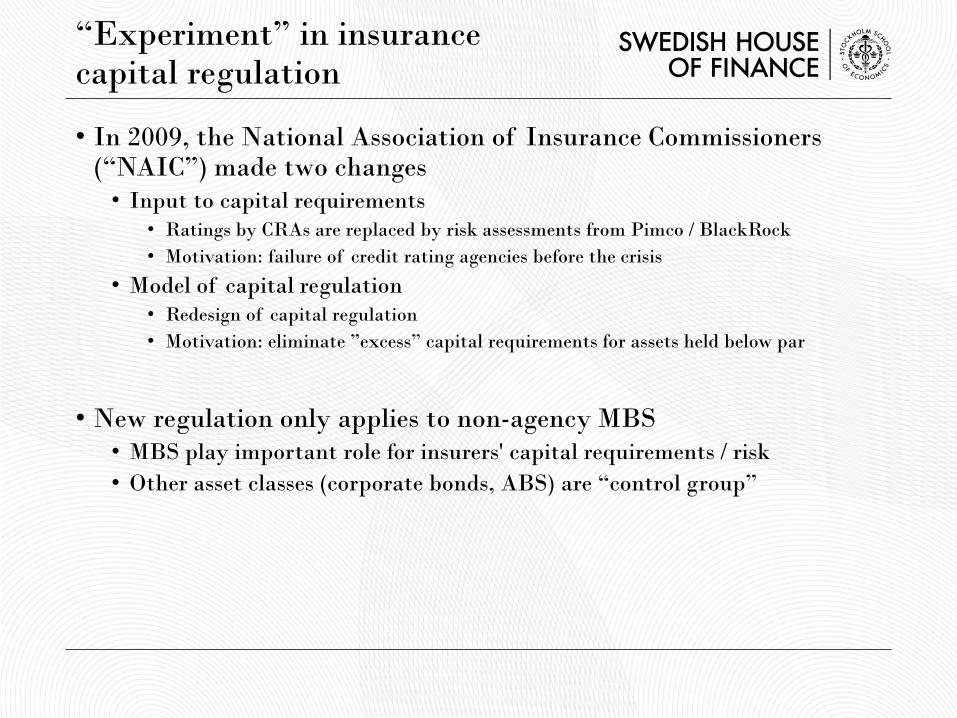
• In 2009, the National Association of Insurance Commissioners (“NAIC”) made two changes • Input to capital requirements
• Ratings by CRAs are replaced by risk assessments from Pimco / BlackRock • Motivation: failure of credit rating agencies before the crisis
• Model of capital regulation • Redesign of capital regulation • Motivation: eliminate ”excess” capital requirements for assets held below par
• New regulation only applies to non-agency MBS
• MBS play important role for insurers' capital requirements / risk • Other asset classes (corporate bonds, ABS) are “control group”
“Experiment” in insurance capital regulation
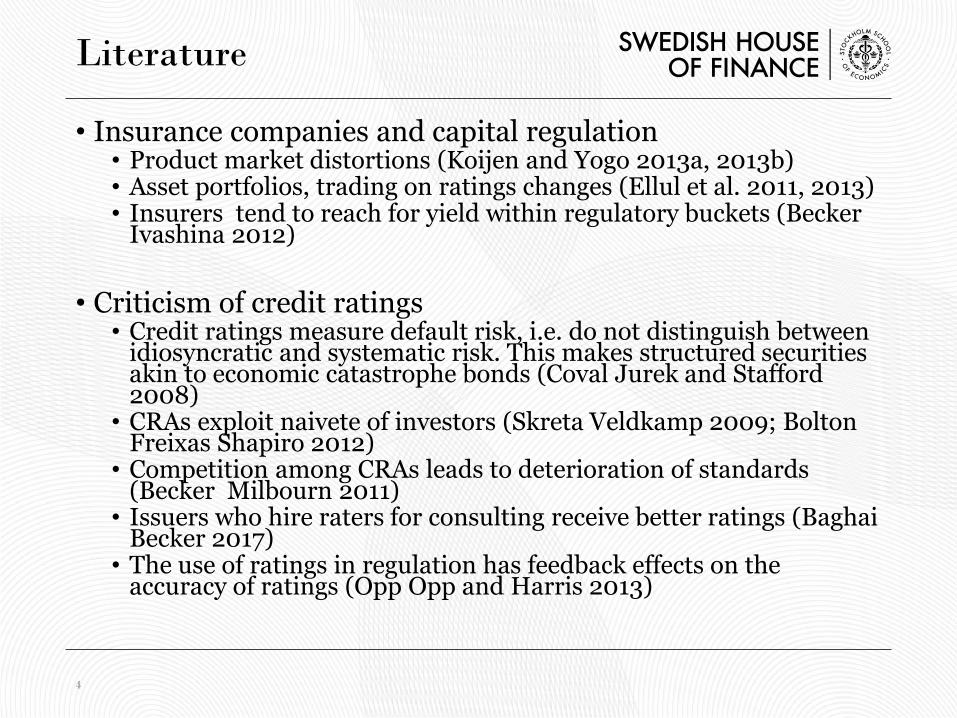
• Insurance companies and capital regulation • Product market distortions (Koijen and Yogo 2013a, 2013b) • Asset portfolios, trading on ratings changes (Ellul et al. 2011, 2013) • Insurers tend to reach for yield within regulatory buckets (Becker
Ivashina 2012)
• Criticism of credit ratings • Credit ratings measure default risk, i.e. do not distinguish between
idiosyncratic and systematic risk. This makes structured securities akin to economic catastrophe bonds (Coval Jurek and Stafford 2008)
• CRAs exploit naivete of investors (Skreta Veldkamp 2009; Bolton Freixas Shapiro 2012)
• Competition among CRAs leads to deterioration of standards (Becker Milbourn 2011)
• Issuers who hire raters for consulting receive better ratings (Baghai Becker 2017)
• The use of ratings in regulation has feedback effects on the accuracy of ratings (Opp Opp and Harris 2013)
4
Literature
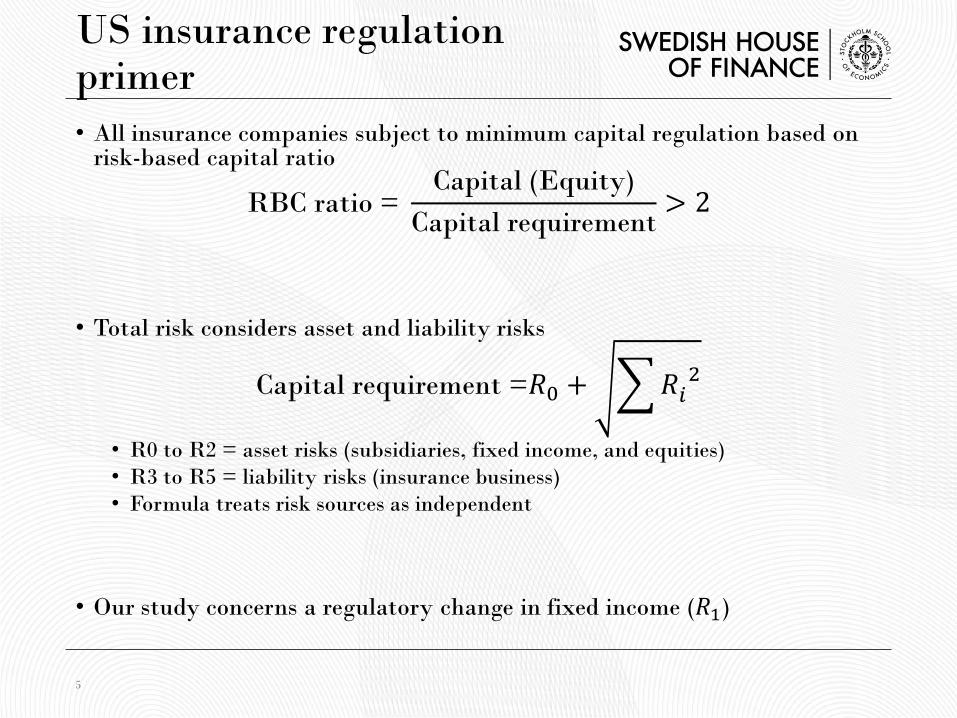
US insurance regulation primer • All insurance companies subject to minimum capital regulation based on
risk-based capital ratio
RBC ratio = Capital (Equity)
Capital requirement> 2
• Total risk considers asset and liability risks
Capital requirement =𝑅𝑅0 + �𝑅𝑅𝑖𝑖2
• R0 to R2 = asset risks (subsidiaries, fixed income, and equities) • R3 to R5 = liability risks (insurance business) • Formula treats risk sources as independent
• Our study concerns a regulatory change in fixed income (𝑅𝑅1) 5
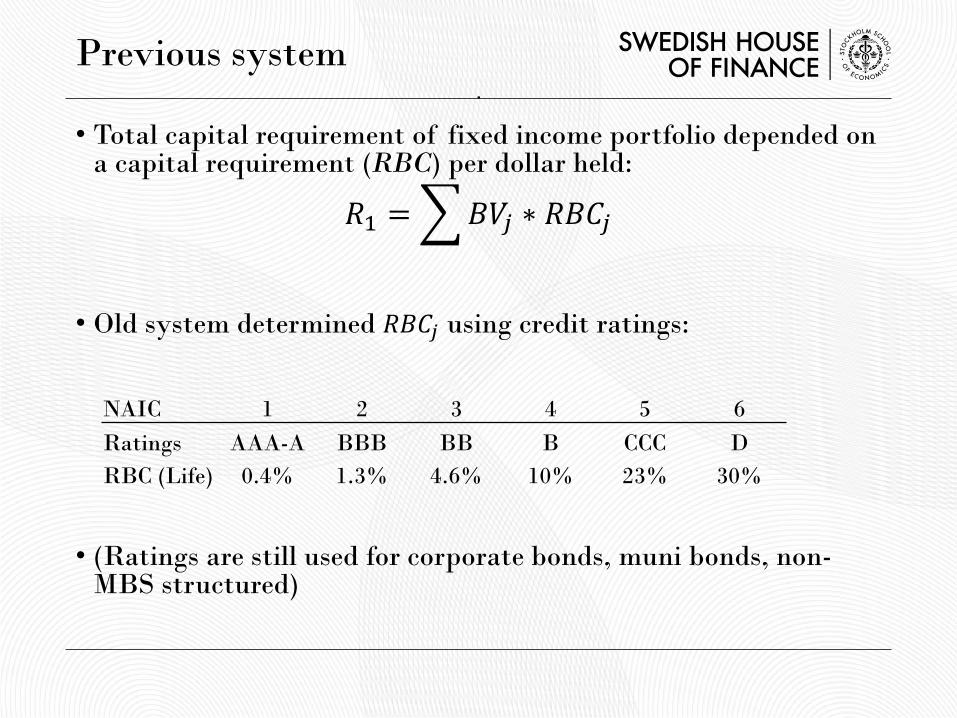
• Total capital requirement of fixed income portfolio depended on a capital requirement (RBC) per dollar held:
𝑅𝑅1 = �𝐵𝐵𝐵𝐵𝑗𝑗 ∗ 𝑅𝑅𝐵𝐵𝑅𝑅𝑗𝑗
• Old system determined 𝑅𝑅𝐵𝐵𝑅𝑅𝑗𝑗 using credit ratings:
• (Ratings are still used for corporate bonds, muni bonds, non-MBS structured)
.
NAIC 1 2 3 4 5 6 Ratings AAA-A BBB BB B CCC D RBC (Life) 0.4% 1.3% 4.6% 10% 23% 30%
Previous system
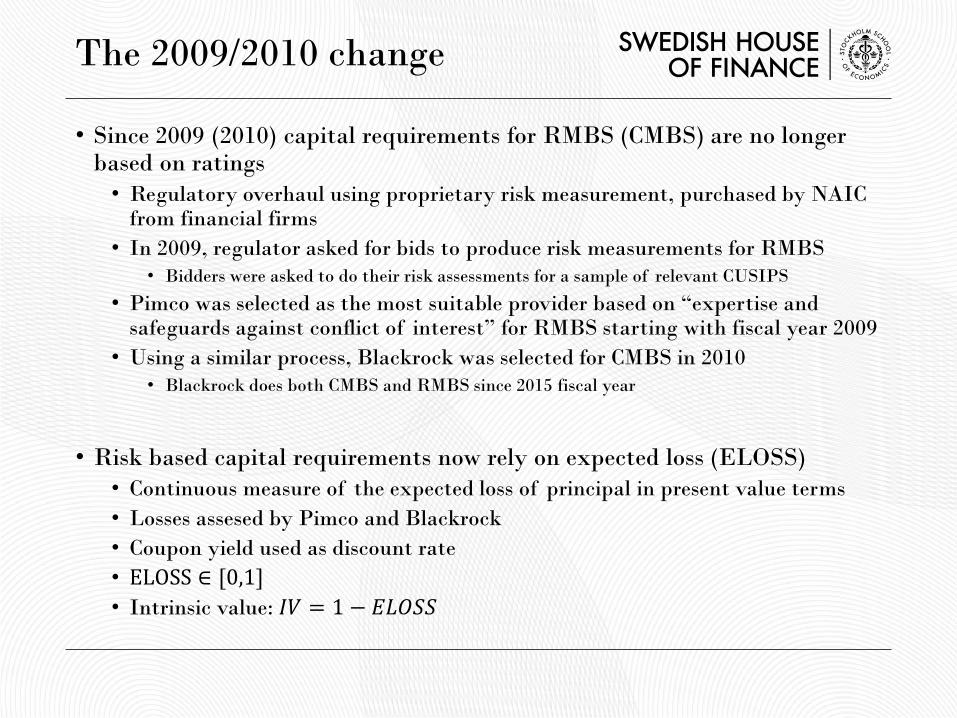
• Since 2009 (2010) capital requirements for RMBS (CMBS) are no longer based on ratings • Regulatory overhaul using proprietary risk measurement, purchased by NAIC
from financial firms • In 2009, regulator asked for bids to produce risk measurements for RMBS
• Bidders were asked to do their risk assessments for a sample of relevant CUSIPS
• Pimco was selected as the most suitable provider based on “expertise and safeguards against conflict of interest” for RMBS starting with fiscal year 2009
• Using a similar process, Blackrock was selected for CMBS in 2010 • Blackrock does both CMBS and RMBS since 2015 fiscal year
• Risk based capital requirements now rely on expected loss (ELOSS) • Continuous measure of the expected loss of principal in present value terms • Losses assesed by Pimco and Blackrock • Coupon yield used as discount rate • ELOSS ∈ [0,1] • Intrinsic value: 𝐼𝐼𝐵𝐵 = 1 − 𝐸𝐸𝐸𝐸𝐸𝐸𝐸𝐸𝐸𝐸
The 2009/2010 change
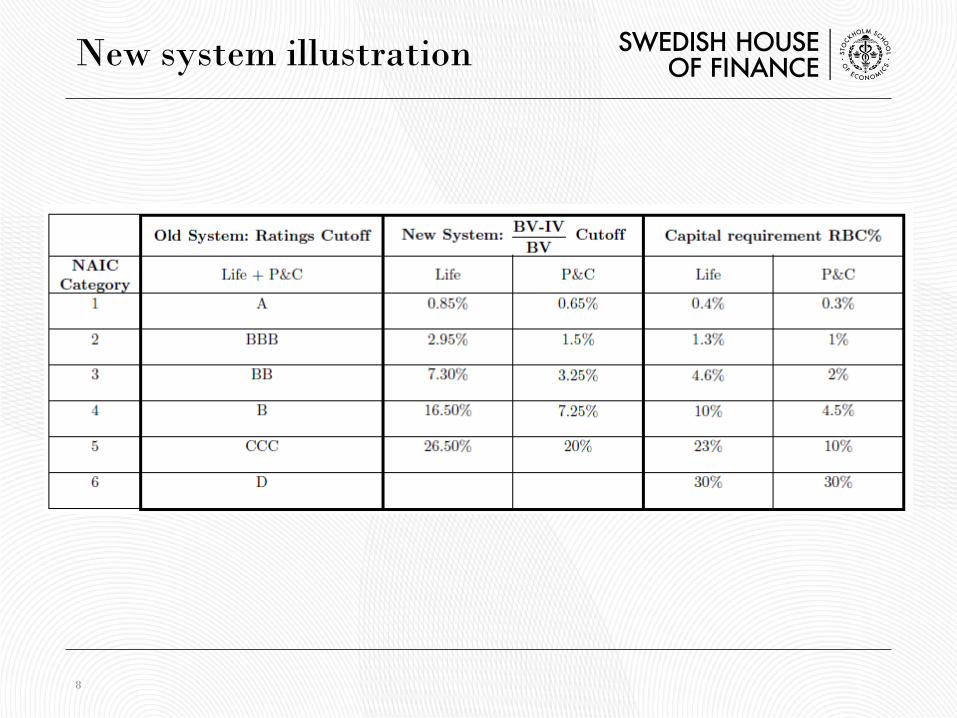
New system illustration
8
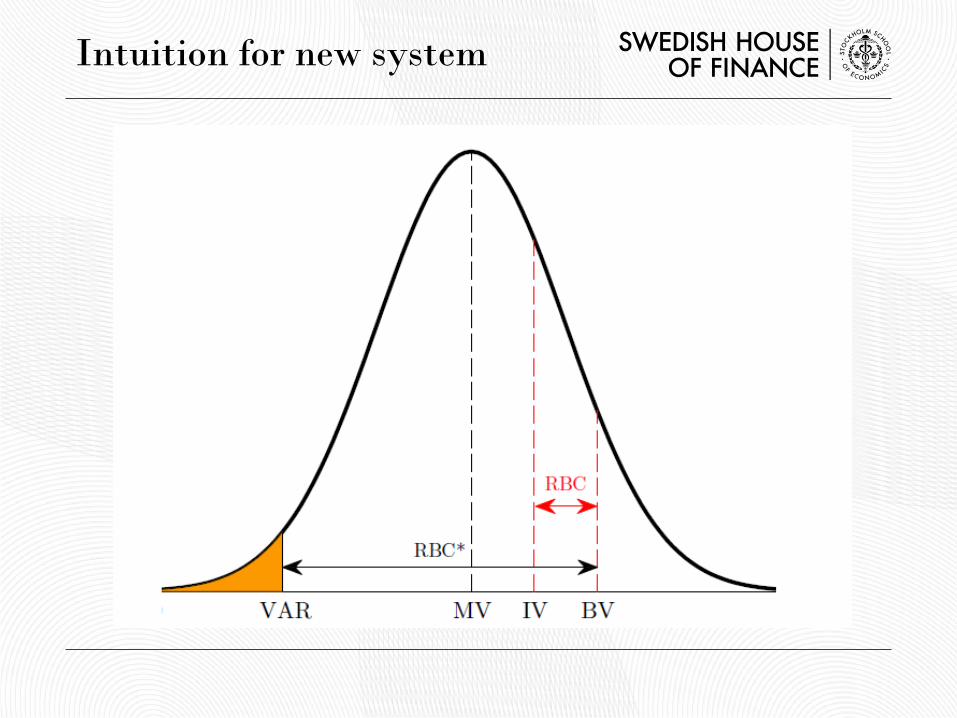
Intuition for new system
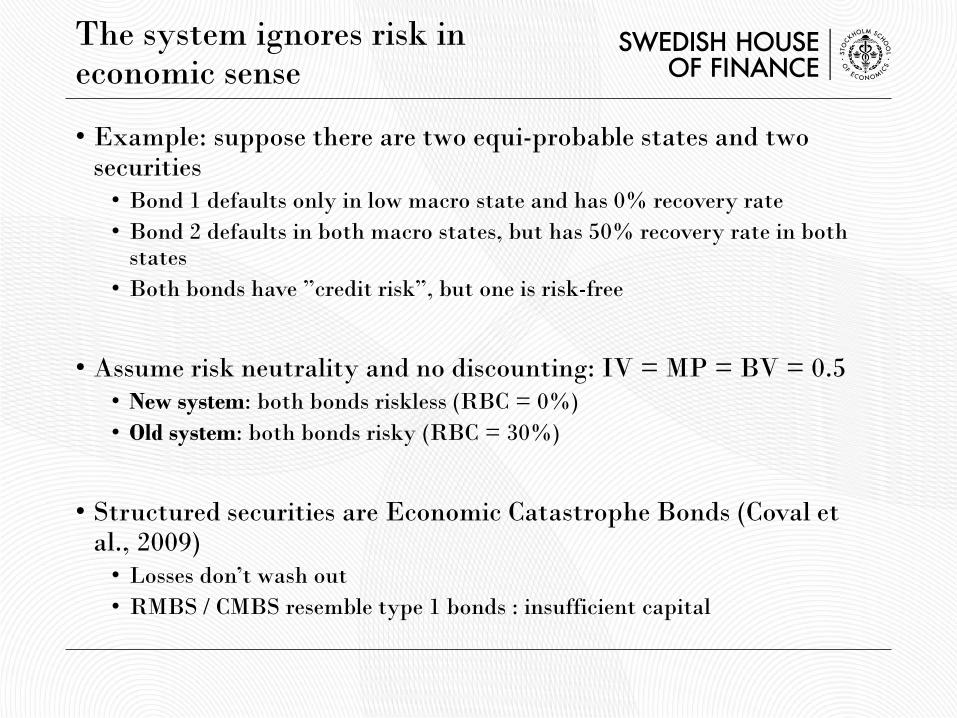
• Example: suppose there are two equi-probable states and two securities • Bond 1 defaults only in low macro state and has 0% recovery rate • Bond 2 defaults in both macro states, but has 50% recovery rate in both
states • Both bonds have ”credit risk”, but one is risk-free
• Assume risk neutrality and no discounting: IV = MP = BV = 0.5
• New system: both bonds riskless (RBC = 0%) • Old system: both bonds risky (RBC = 30%)
• Structured securities are Economic Catastrophe Bonds (Coval et
al., 2009) • Losses don’t wash out • RMBS / CMBS resemble type 1 bonds : insufficient capital
The system ignores risk in economic sense
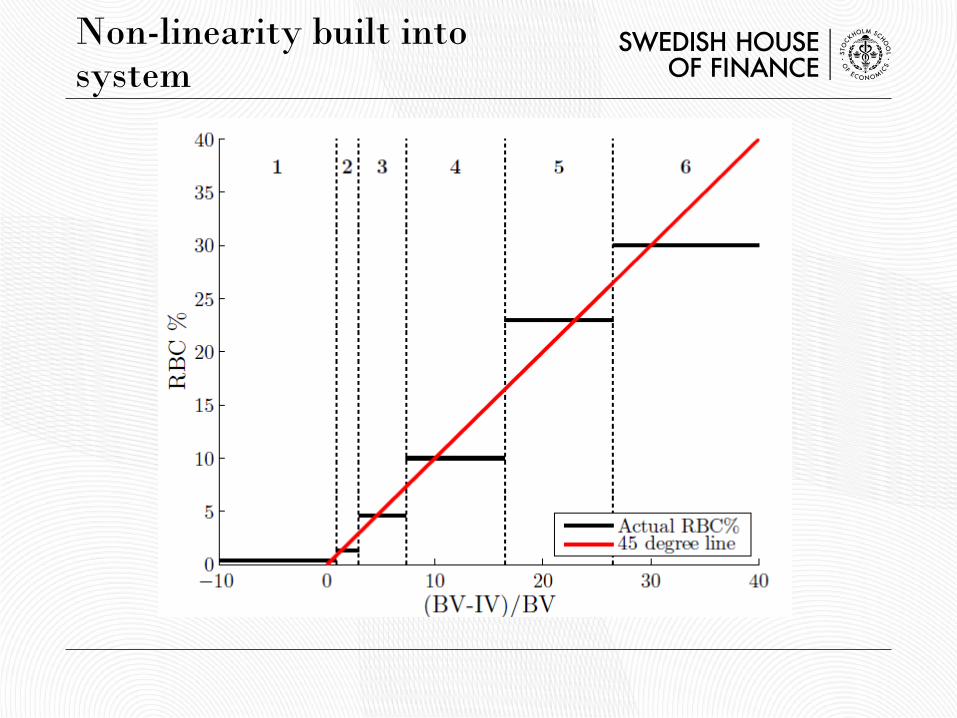
Non-linearity built into system
Detailed empirical tests
• (This is work in progress)
• We have data on all insurance company holdings of fixed income assets (RMBS; CMBS; other structured; Corporate; Muni; US Gov; Foreign)
• We are studying the following topics 1. Changes in capital requirements after reform 2. Impact of new rules on insurers’ behavior 3. Properties of ELOSS compared to ratings
12
Data
• ELOSS for all non-agency MBS securities for the first two years of new system • RMBS: (2009) 23,765 CUSIPs and (2010) 21,575 CUSIPs • CMBS: (2010) 5,293 CUSIPs and (2011) 5,974 CUSIPs
• Ratings and asset information (seniority, par value, etc.) from S&P, Moody’s, and eMAXX. Of RMBS 2009 universe • 6.8% of securities are unrated • 22.7% have one rating • 65.2% have two ratings • 5.4% have three ratings • S&P, Moody’s and Fitch covered 82%, 89% and 27% of securities by value • Also accumulated losses to end of 2012 from He, Qian, and Strahan (2013)
• Year-end holdings by CUSIP for all US insurers and other institutional investors (Pimco / BlackRock) from NAIC
$B FIXED
INCOME RMBS CMBS
BV MV RBC
FI Share BV MV
RBC new
RBC old
RBC save
RBC save FI
Share BV MV RBC new
RBC old
RBC disc.
RBC disc. FI
2010
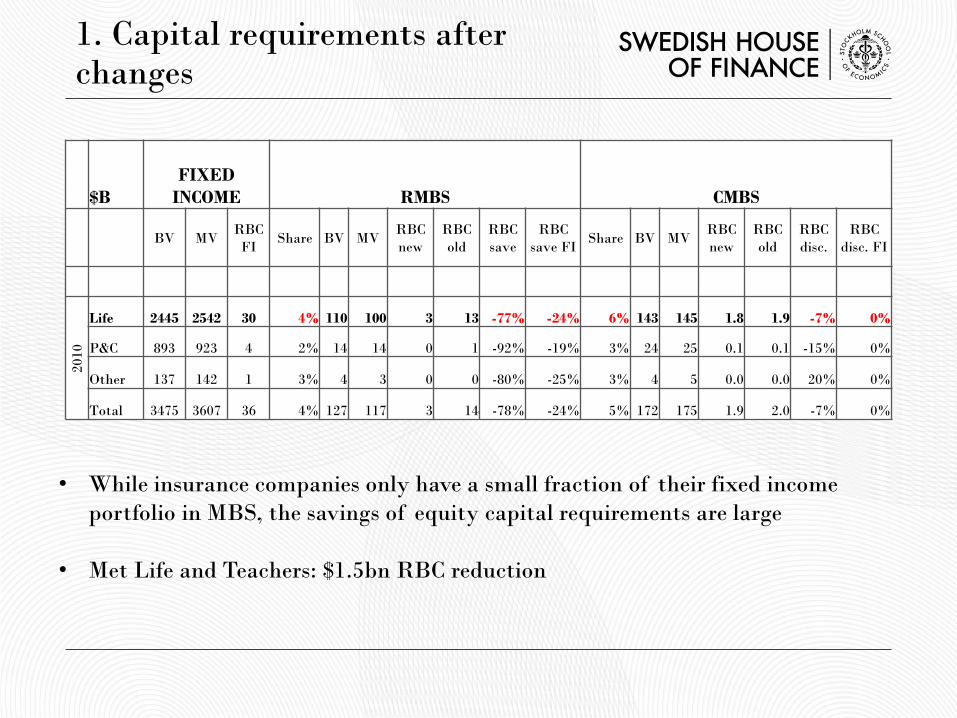
Life 2445 2542 30 4% 110 100 3 13 -77% -24% 6% 143 145 1.8 1.9 -7% 0%
P&C 893 923 4 2% 14 14 0 1 -92% -19% 3% 24 25 0.1 0.1 -15% 0%
Other 137 142 1 3% 4 3 0 0 -80% -25% 3% 4 5 0.0 0.0 20% 0%
Total 3475 3607 36 4% 127 117 3 14 -78% -24% 5% 172 175 1.9 2.0 -7% 0%
• While insurance companies only have a small fraction of their fixed income portfolio in MBS, the savings of equity capital requirements are large
• Met Life and Teachers: $1.5bn RBC reduction
1. Capital requirements after changes
2008 2009 2010 2011 20120%
2%
4%
6%
8%
10%
12%
14%
16%
RB
C%
R M BS
RBC newRBC old
2009 2010 2011 20120%
2%
4%
6%
8%
10%
12%
14%
16%
RB
C%
CM BS
RBC newRBC old
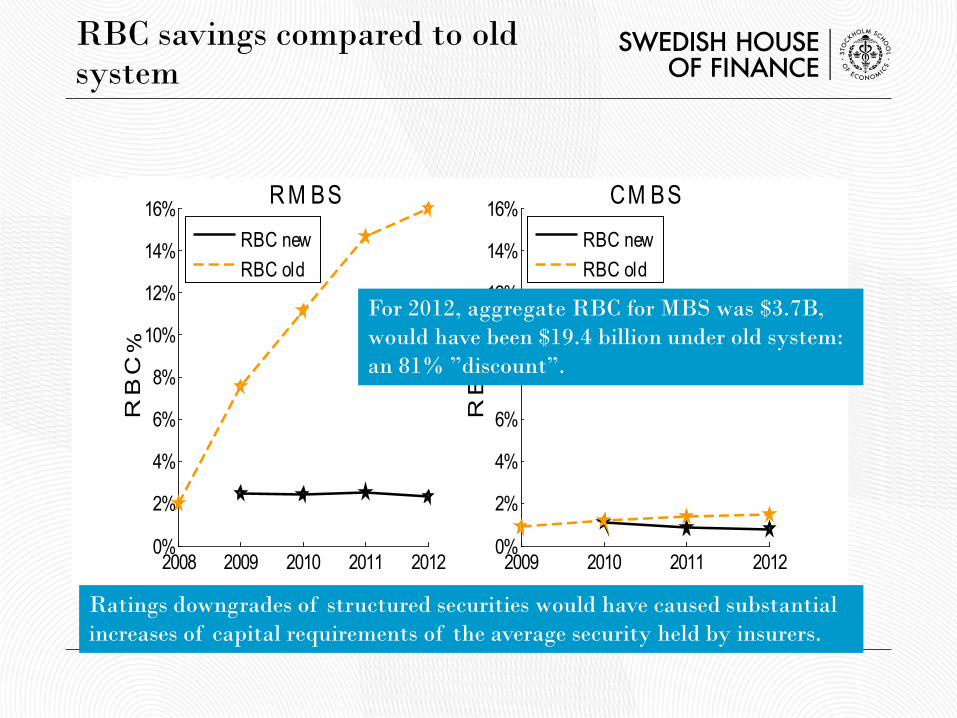
Ratings downgrades of structured securities would have caused substantial increases of capital requirements of the average security held by insurers.
RBC savings compared to old system
For 2012, aggregate RBC for MBS was $3.7B, would have been $19.4 billion under old system: an 81% ”discount”.
2. Behavioral responses
• Did new capital requirements impact insurers’ propensity to divest (distressed) RMBS after the crisis?
• Did insurers specifically favor those assets with low capital requirements? Did the new rules allow them to hold more of risky tranches? • We can exploit non-linearity of RBC categories and cross-insurer variation in
book values to identify effect of capital requirement on trading behavior
16
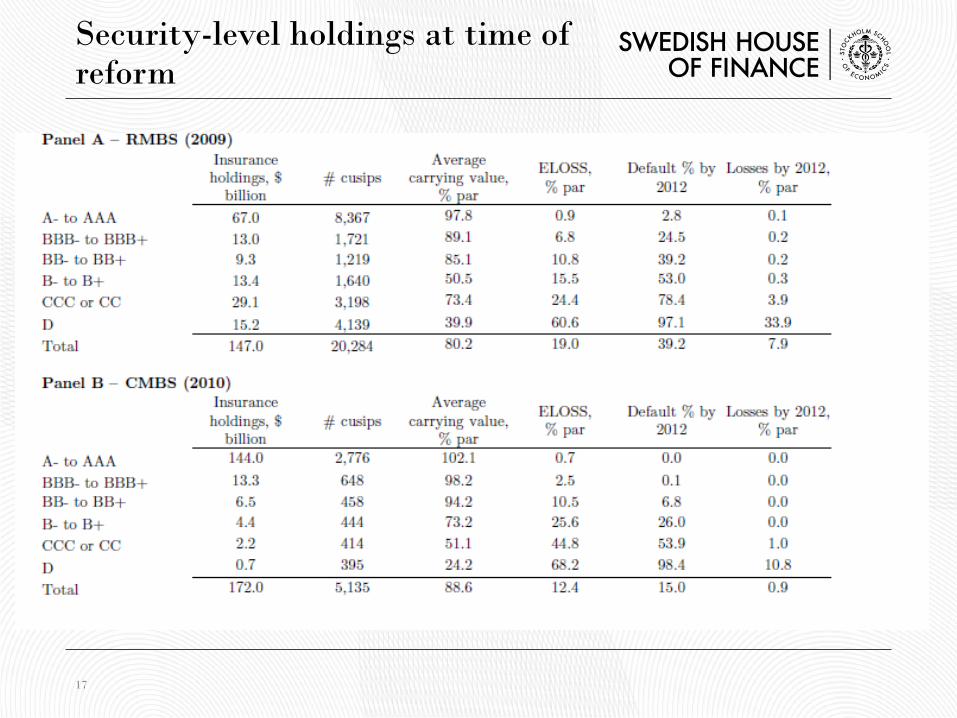
Security-level holdings at time of reform
17
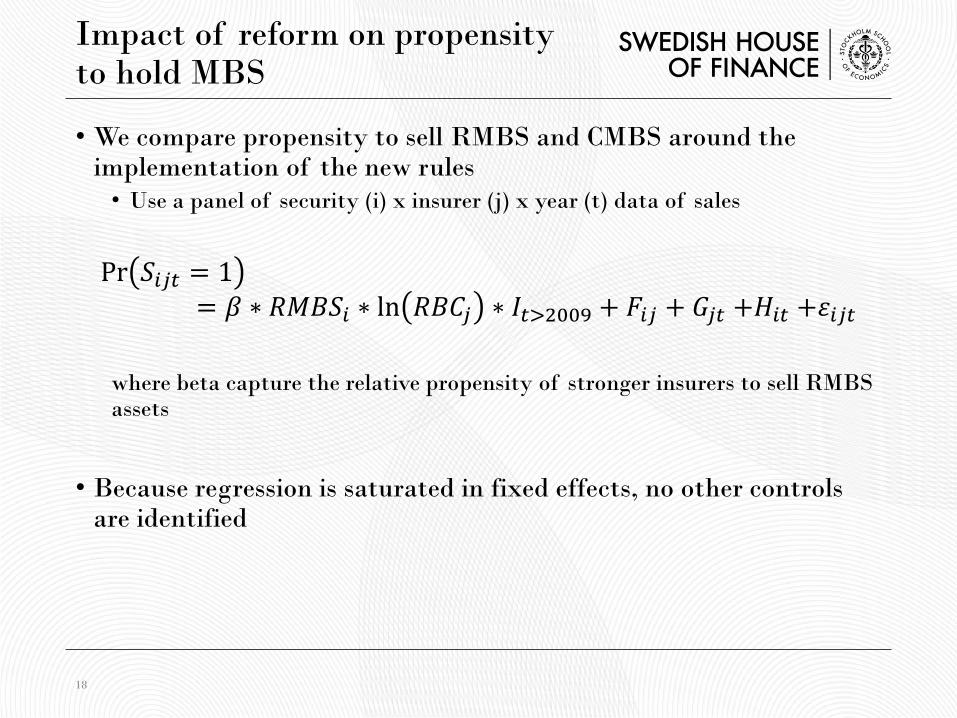
Impact of reform on propensity to hold MBS
• We compare propensity to sell RMBS and CMBS around the implementation of the new rules • Use a panel of security (i) x insurer (j) x year (t) data of sales
Pr 𝐸𝐸𝑖𝑖𝑗𝑗𝑖𝑖 = 1
= 𝛽𝛽 ∗ 𝑅𝑅𝑅𝑅𝐵𝐵𝐸𝐸𝑖𝑖 ∗ ln 𝑅𝑅𝐵𝐵𝑅𝑅𝑗𝑗 ∗ 𝐼𝐼𝑖𝑖>2009 + 𝐹𝐹𝑖𝑖𝑗𝑗 + 𝐺𝐺𝑗𝑗𝑖𝑖 +𝐻𝐻𝑖𝑖𝑖𝑖 +𝜀𝜀𝑖𝑖𝑗𝑗𝑖𝑖
where beta capture the relative propensity of stronger insurers to sell RMBS assets
• Because regression is saturated in fixed effects, no other controls
are identified
18
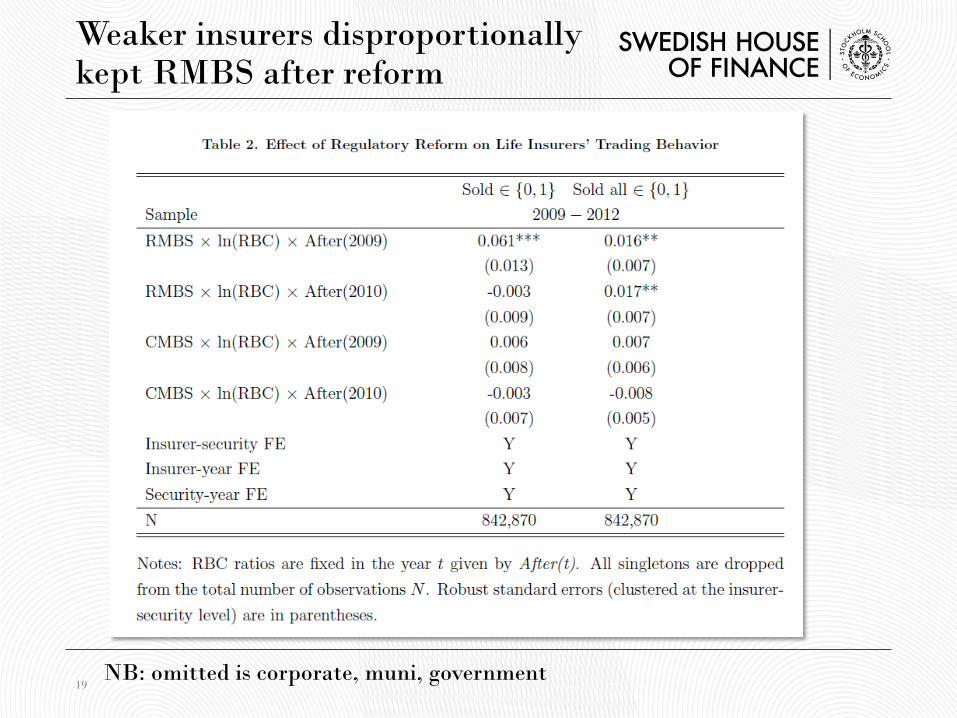
Weaker insurers disproportionally kept RMBS after reform
19 NB: omitted is corporate, muni, government

3. Comparing ELOSS and ratings
Includes future losses (S&P default)
Only realized losses to 2012
Why the lower capital requirements?
• NAIC: “Risk based capital requirements limit the amount of risk a company can take. It requires a company with a higher amount of risk to hold a higher amount of capital. Capital provides a cushion to a company against insolvency."
• Reform introduces: • Massive capital relief for insurers and eliminates cushion • Cross-category distortions to asset allocation
• What motivates these changes?
• Temporary capital relief for insurers • Industry interests = capture (Stiglitz 1970; Peltzman 1976) • ”Macroprudential policy on the fly” • Worries about fire sales and solvency
• Regulatory ”alpha spotting” • “Fundamental principle of insurance” applied to capital markets
(independent payoffs of assets in a large portfolio leads to zero risk)
• Regulatory change caused large reduction in capital requirements for insurance companies • new system: no protection against aggregate risks • $15.6 bn (81%) of capital savings for insurance companies
• New system applies to existing stock as well as to new acquisitions
• Strong incentive to take risk preferentially in MBS • Reflected in a historic shift in risk taking in MBS
• Initial responses to reform: industry retained more low quality
MBS • long run effects may be larger
22
Conclusions